The use of transvaginal elastography diagnosing and dating of adenomyosis...
57
The use of transvaginal elastography diagnosing and dating of adenomyosis and in guiding the choice of treatment modality Sun-Wei Guo Shanghai OB/GYN Hospital Fudan University [email protected]
Transcript of The use of transvaginal elastography diagnosing and dating of adenomyosis...

The use of transvaginal elastographydiagnosing and dating of adenomyosis and
in guiding the choice of treatment modality
Sun-Wei Guo
Shanghai OB/GYN Hospital
Fudan University

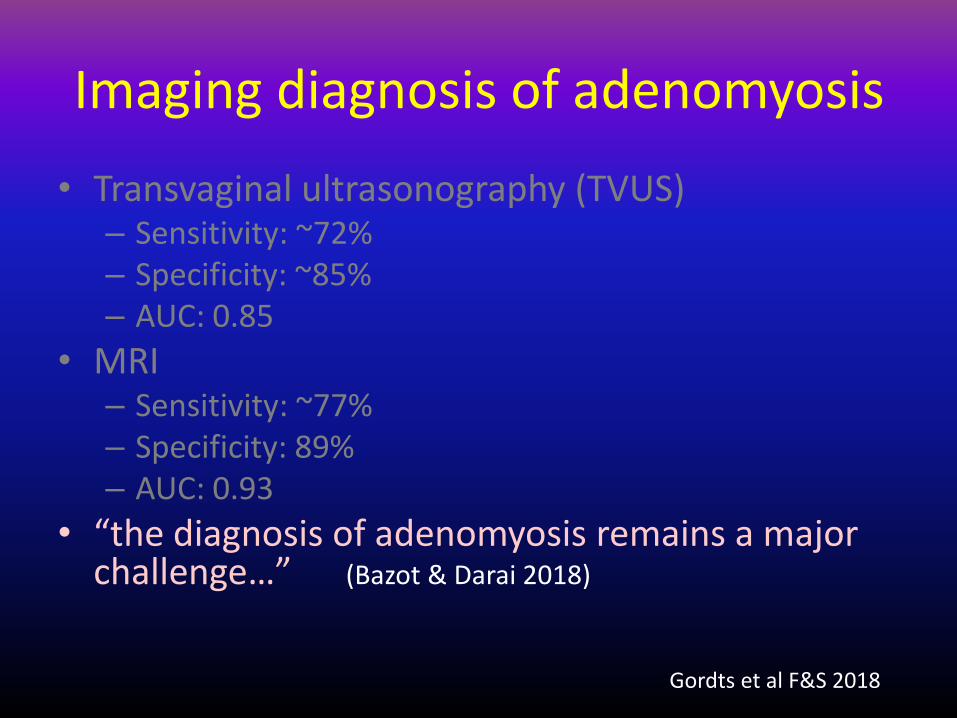
Imaging diagnosis of adenomyosis
• Transvaginal ultrasonography (TVUS)
– Sensitivity: ~72%
– Specificity: ~85%
– AUC: 0.85
• MRI
– Sensitivity: ~77%
– Specificity: 89%
– AUC: 0.93
Gordts et al F&S 2018
Imaging diagnosis of adenomyosis
• Transvaginal ultrasonography (TVUS)– Sensitivity: ~72%– Specificity: ~85%– AUC: 0.85
• MRI – Sensitivity: ~77%– Specificity: 89%– AUC: 0.93
• “the diagnosis of adenomyosis remains a major challenge…” (Bazot & Darai 2018)
Gordts et al F&S 2018

Improving the diagnostic accuracy by imaging techniques
• Standardization
– MUSA
• Further training
• …
Improving the diagnostic accuracy by imaging techniques
• Standardization (MUSA)
• Further training
• …
• Have we reached the physical limit for TVUS and MRI?

Question
• Can better understanding of the pathogenesis/pathophysiology and the use of new emerging imaging technique help?

Pathogenesis vs. pathophysiology
• Pathogenesis:– What causes the disease?
– Why is there a link between focal adenomyosis with DIE?
• Pathophysiology:– How does it cause pain/HUB?
– Why is there enlarged uterus?
– Why it seemingly defies medical treatment?
– Why is there hyperinnervation in symptomatic patients?
– Why is there hyper-/dys-peristalsis?
• From an interventional perspective, knowing pathophysiology is more important
• The most consequential: – Natural history
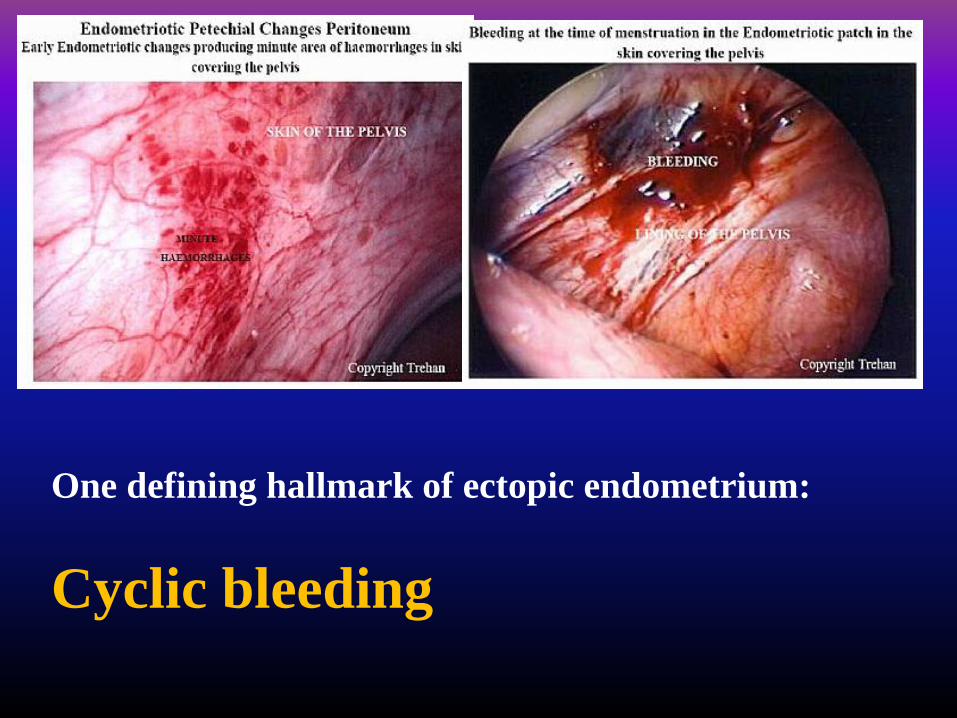
One defining hallmark of ectopic endometrium:
Cyclic bleeding

Bleeding/hemorrhage
• Indicative of vascular injury
• A quintessential hallmark of a wound or tissue
damage
• Tissue repair is of paramount importance to the
survival of an organism
• A defining feature shared by both
endometriosis and adenomyosis
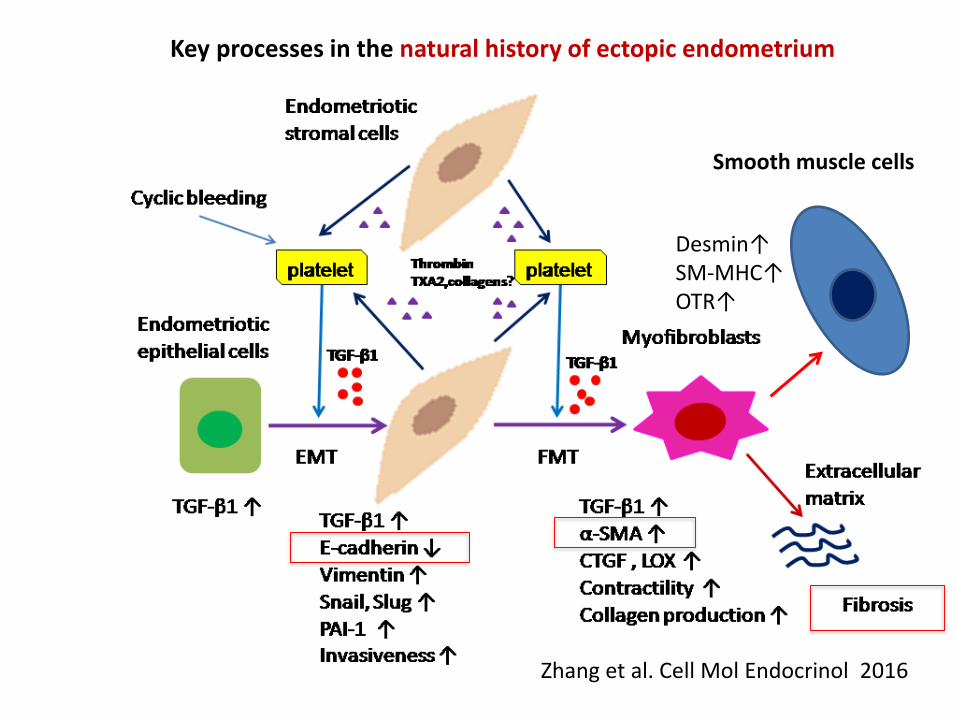
Zhang et al. Cell Mol Endocrinol 2016
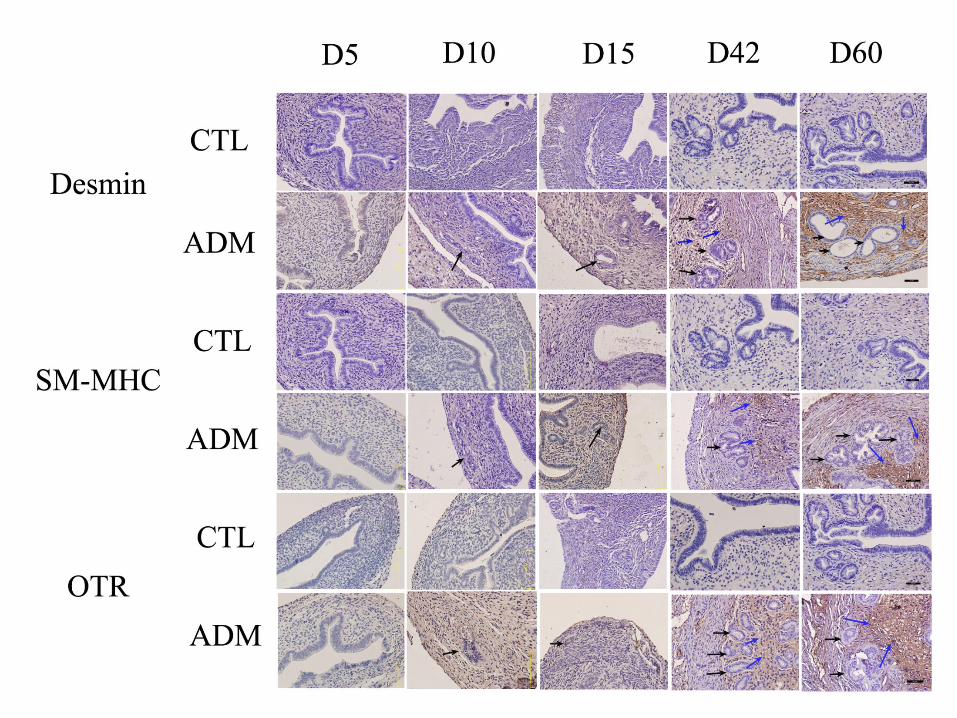
Key processes in the natural history of ectopic endometrium
Smooth muscle cells
Desmin↑SM-MHC↑OTR↑

How about adenomyosis?
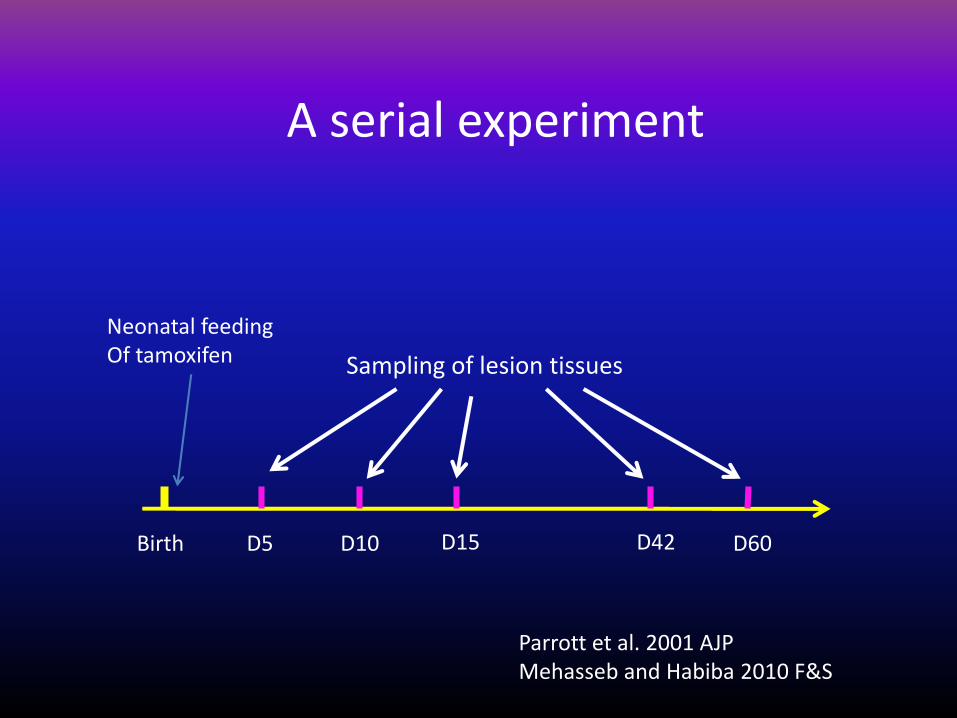
A serial experiment
Neonatal feedingOf tamoxifen
Birth D5 D10 D15 D42 D60
Sampling of lesion tissues
Parrott et al. 2001 AJPMehasseb and Habiba 2010 F&S

5 10 15 42 60
0.0
0.5
1.0
1.5
2.0
2.5
3.0
A: Depth of myometrial infiltration
Day of examination
De
pth
sco
re
p=1.1x10^(-5)
Shen et al. HR 2016

25 30 35 40 45 50 55 60
10
15
20
25
B: Kinetics of hotplate latency
Day at hotplate test (since birth)
La
ten
cy (
se
co
nd
s)
Control
Adenomyosis
***
*** ***
#
NS
### #

10 20 30 40 50 60
0.0
00
0.0
05
0.0
10
0.0
15
0.0
20
A: Kinetics of VEGF staining
Age (day)
Sta
inin
g le
ve
ls
NS
NS
**
***
***
10 20 30 40 50 60
01
02
03
04
0
B: Kinetics of MVD
Age (day)
De
nsity
NS
NS
**
****
Control
Adenomyosis
10 20 30 40 50 60
0.0
00
.02
0.0
40
.06
0.0
80
.10
0.1
20
.14
D: Kinetics of platelet aggregation
Age (day)
Exte
nt
*
**
**
***
***Control
Adenomyosis
10 20 30 40 50 60
0.0
00
.02
0.0
40
.06
0.0
80
.10
C: Kinetics of PCNA staining
Age (day)
Sta
inin
g le
ve
ls
NS
****
***
***
Control
Adenomyosis

10 20 30 40 50 60
0.0
00
.01
0.0
20
.03
0.0
40
.05
0.0
6E: Kinetics of TGF-beta1 staining
Age (day)
Sta
inin
g le
ve
ls
NS**
**
***
***ControlAdenomyosis
Shen et al. HR 2016
10 20 30 40 50 60
0.0
00
.02
0.0
40
.06
0.0
80
.10
0.1
20
.14
F: Kinetics of p-Smad3 staining
Age (day)
Sta
inin
g le
ve
ls
NS
**
**
**
***ControlAdenomyosis
10 20 30 40 50 60
0.0
00
.05
0.1
00
.15
0.2
0
G: Kinetics of E-cadherin staining
Age (day)
Sta
inin
g le
ve
ls
NS
*
**
******
Control
Adenomyosis
10 20 30 40 50 60
0.0
00
.05
0.1
00
.15
H: Kinetics of vimentin staining
Age (day)
Sta
inin
g le
ve
ls
NS
*
**
***
***ControlAdenomyosis
10 20 30 40 50 60
0.0
00
0.0
05
0.0
10
0.0
15
0.0
20
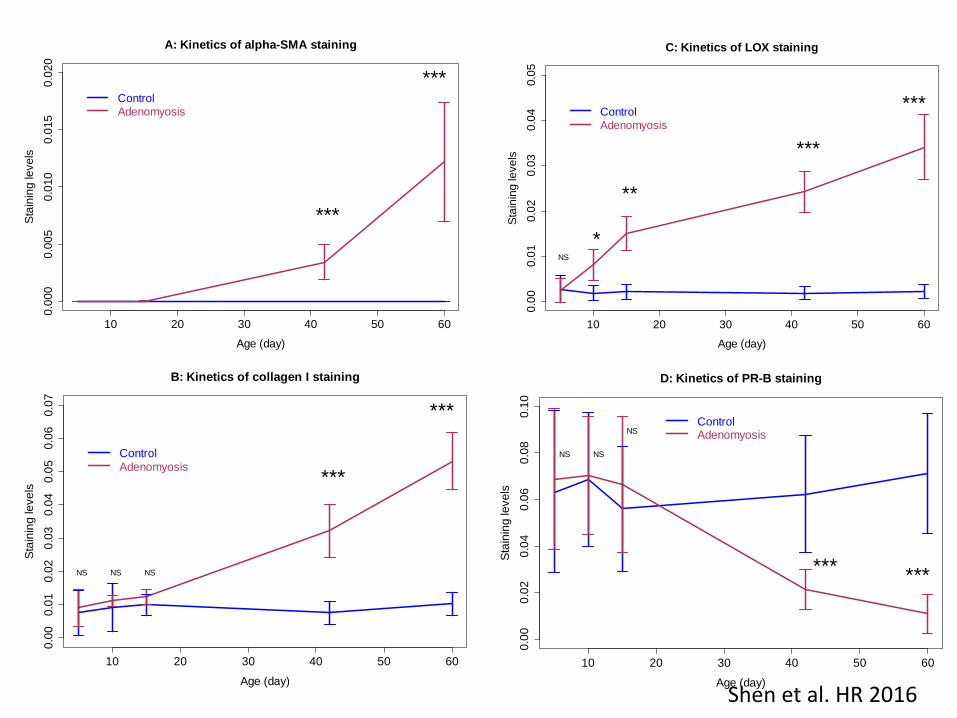
A: Kinetics of alpha-SMA staining
Age (day)
Sta
inin
g le
ve
ls
***
***Control
Adenomyosis
Shen et al. HR 2016
10 20 30 40 50 60
0.0
00
.01
0.0
20
.03
0.0
40
.05
C: Kinetics of LOX staining
Age (day)
Sta
inin
g le
ve
ls
NS
*
**
***
***Control
Adenomyosis
10 20 30 40 50 60
0.0
00
.01
0.0
20
.03
0.0
40
.05
0.0
60
.07
B: Kinetics of collagen I staining
Age (day)
Sta
inin
g le
ve
ls
NS NS NS
***
***
Control
Adenomyosis
10 20 30 40 50 60
0.0
00
.02
0.0
40
.06
0.0
80
.10
D: Kinetics of PR-B staining
Age (day)
Sta
inin
g le
ve
ls
NS NS
NS
*** ***
ControlAdenomyosis
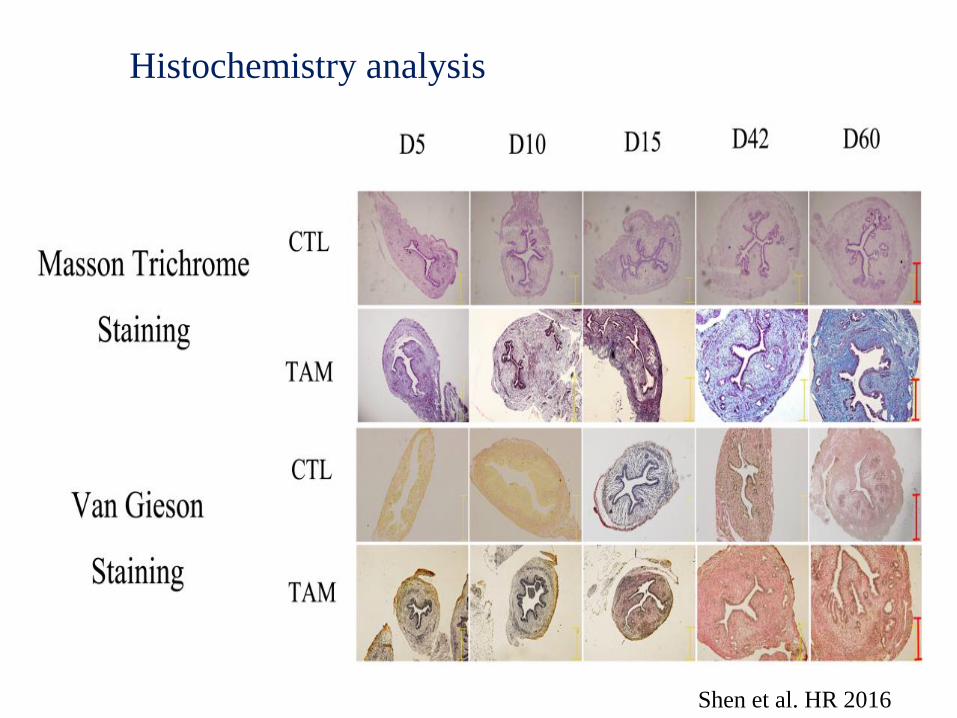
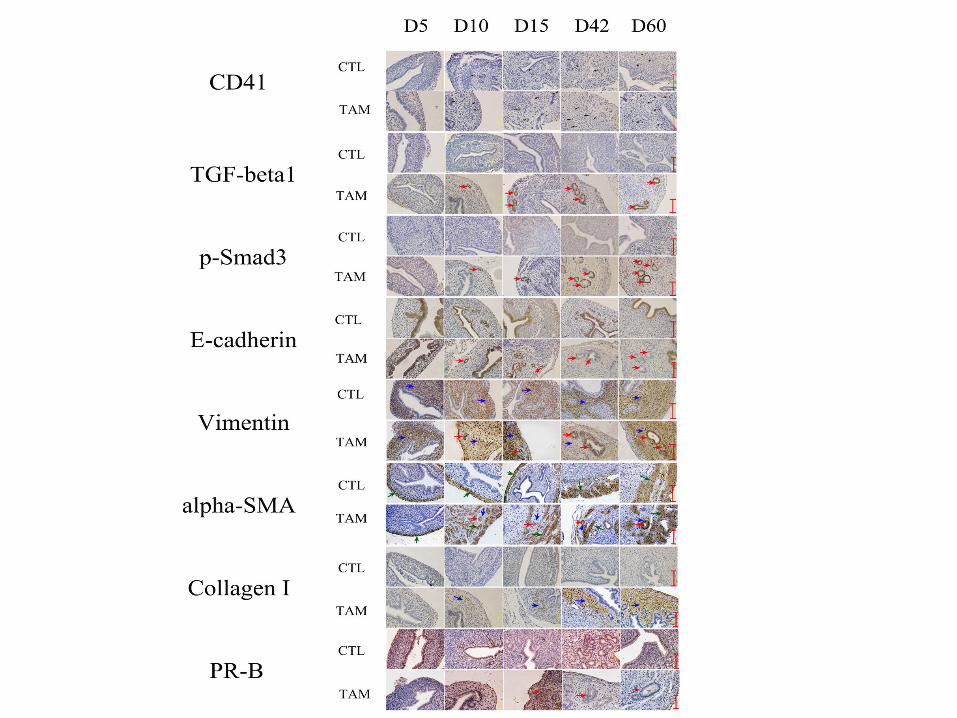
Histochemistry analysis
Shen et al. HR 2016
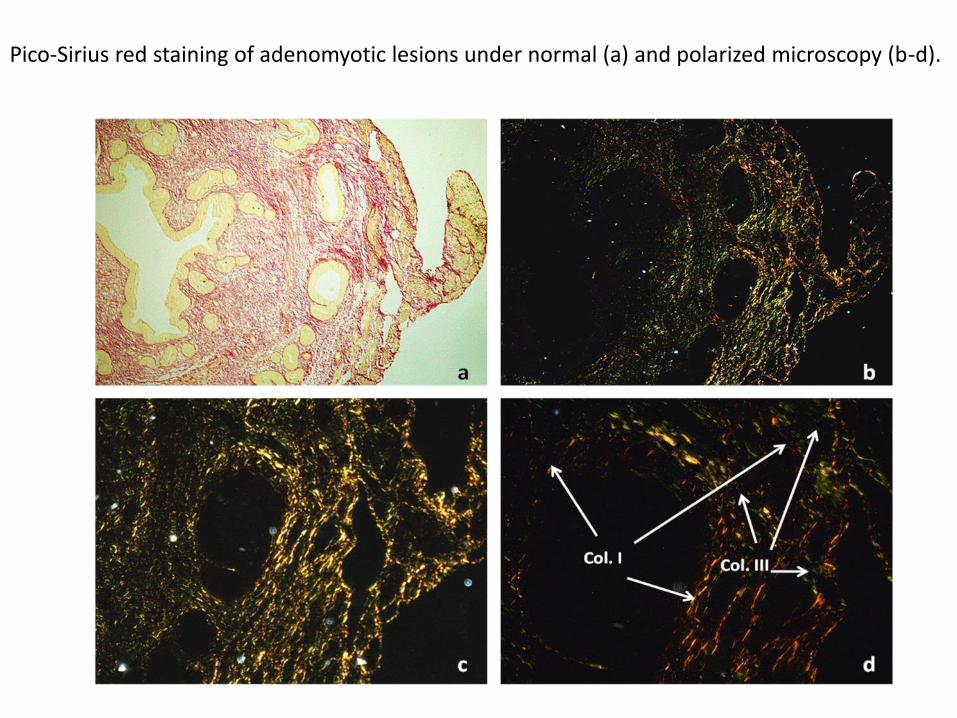
Pico-Sirius red staining of adenomyotic lesions under normal (a) and polarized microscopy (b-d).


Shen et al. HR 2016

Summary
• Our data are consistent with
– Increased platelet aggregation
– Increased activation of TGF-β/Smad3 signaling pathway
– Progressive EMT, FMT, and SMM
– Increased production of extracellular matrix
– Increased fibrosis
– Reduced hormonal receptor PR-B expression
• Responsible for increased progestin-resistance?
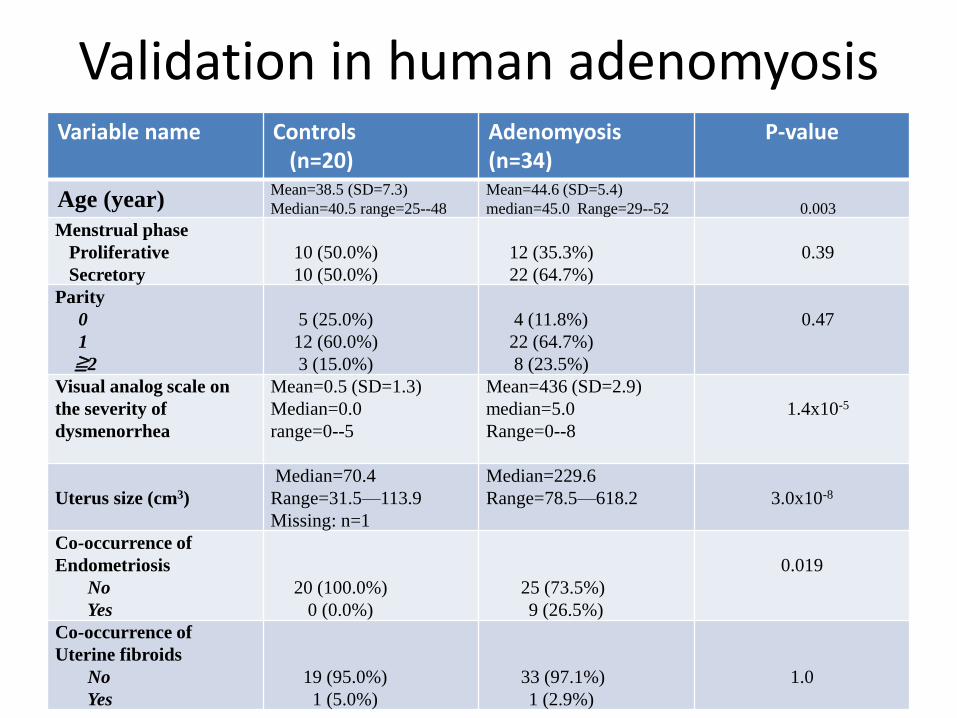
Validation in human adenomyosisVariable name Controls
(n=20)Adenomyosis(n=34)
P-value
Age (year)Mean=38.5 (SD=7.3)
Median=40.5 range=25--48
Mean=44.6 (SD=5.4)
median=45.0 Range=29--52 0.003
Menstrual phase
Proliferative
Secretory
10 (50.0%)
10 (50.0%)
12 (35.3%)
22 (64.7%)
0.39
Parity
0
1
≧2
5 (25.0%)
12 (60.0%)
3 (15.0%)
4 (11.8%)
22 (64.7%)
8 (23.5%)
0.47
Visual analog scale on
the severity of
dysmenorrhea
Mean=0.5 (SD=1.3)
Median=0.0
range=0--5
Mean=436 (SD=2.9)
median=5.0
Range=0--8
1.4x10⁻⁵
Uterus size (cm3)
Median=70.4
Range=31.5—113.9
Missing: n=1
Median=229.6
Range=78.5—618.2 3.0x10⁻⁸
Co-occurrence of
Endometriosis
No
Yes
20 (100.0%)
0 (0.0%)
25 (73.5%)
9 (26.5%)
0.019
Co-occurrence of
Uterine fibroids
No
Yes
19 (95.0%)
1 (5.0%)
33 (97.1%)
1 (2.9%)
1.0

CD42b: Marker for
platelets
Vimentin: stromal
cells
DAPI: neuclei
Liu et al. HR 2016

Control Adenomyosis0.0
00
00
0.0
00
04
0.0
00
08
0.0
00
12
Extent of platelet aggregation
Group
De
nsity
p=0.017
Density of CD42b+ platelets
Liu et al. HR 2016

A B
Liu et al. HR 2016
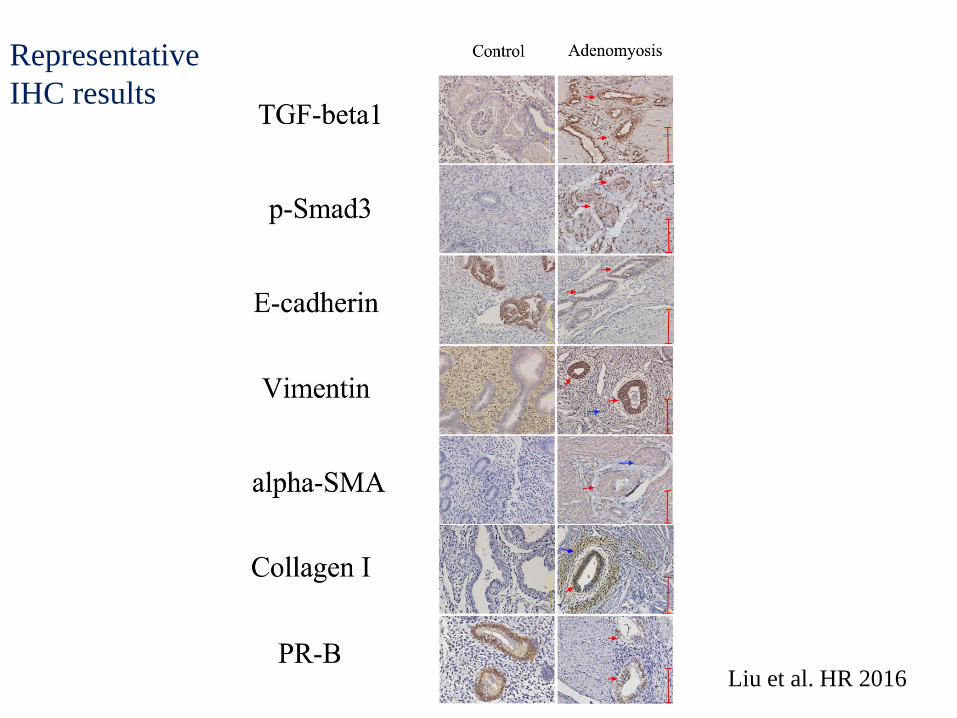
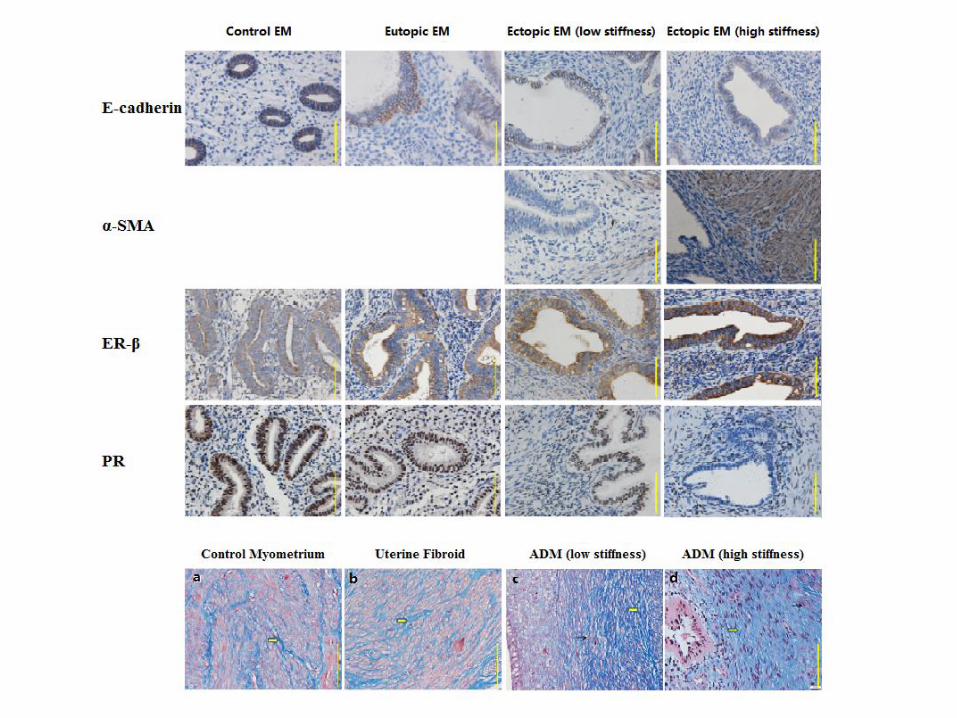
Representative
IHC results
Liu et al. HR 2016
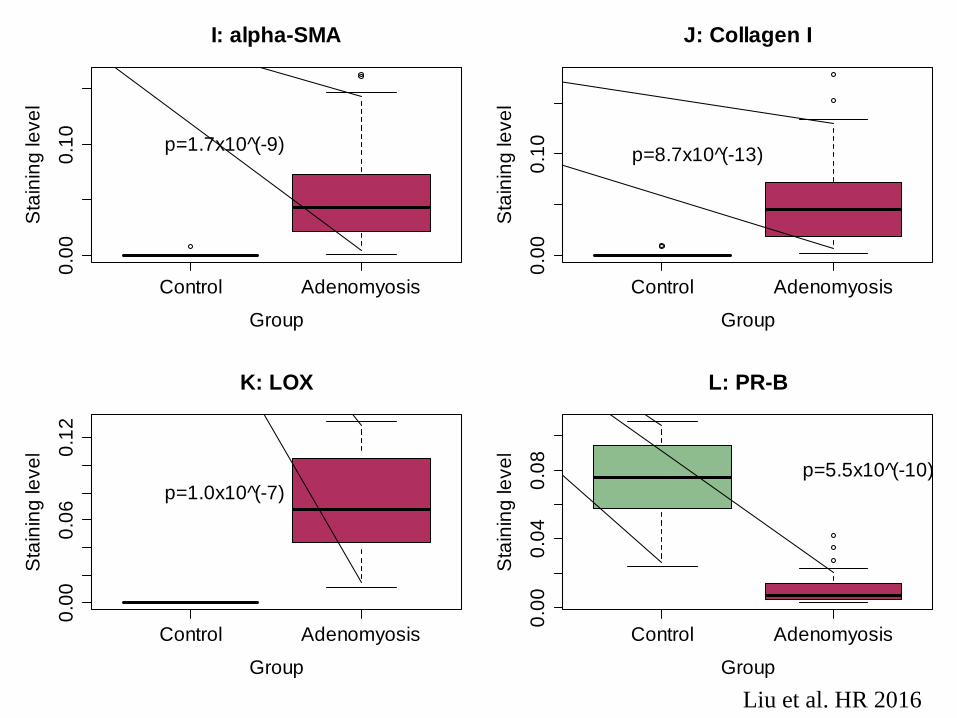
Control Adenomyosis
0.0
00
.10
I: alpha-SMA
Group
Sta
inin
g le
ve
l
p=1.7x10 (̂-9)
Control Adenomyosis
0.0
00
.10
J: Collagen I
Group
Sta
inin
g le
ve
l
p=8.7x10 (̂-13)
Control Adenomyosis
0.0
00
.06
0.1
2
K: LOX
Group
Sta
inin
g le
ve
l
p=1.0x10 (̂-7)
Control Adenomyosis
0.0
00
.04
0.0
8
L: PR-B
Group
Sta
inin
g le
ve
l
p=5.5x10 (̂-10)
Liu et al. HR 2016

Liu et al. HR 2016

Control Adenomyosis
01
02
03
04
05
06
0Extent of fibrosis
Group
Pe
rce
nta
ge
of fib
rosis
p=5.1x10^(-5)
Based on Masson trichrome staining Liu et al. HR 2016

Control Adenomyosis
0.0
00.0
20.0
40.0
60.0
80.1
00.1
20.1
4
M: Desmin
Group
Sta
inin
g level
***
Control Adenomyosis
0.0
00.0
20.0
40.0
60.0
80.1
0
N: SM-MHC
Group
Sta
inin
g level
***
Control Adenomyosis
0.0
00.0
20.0
40.0
60.0
8
O: OTR
GroupS
tain
ing level
***
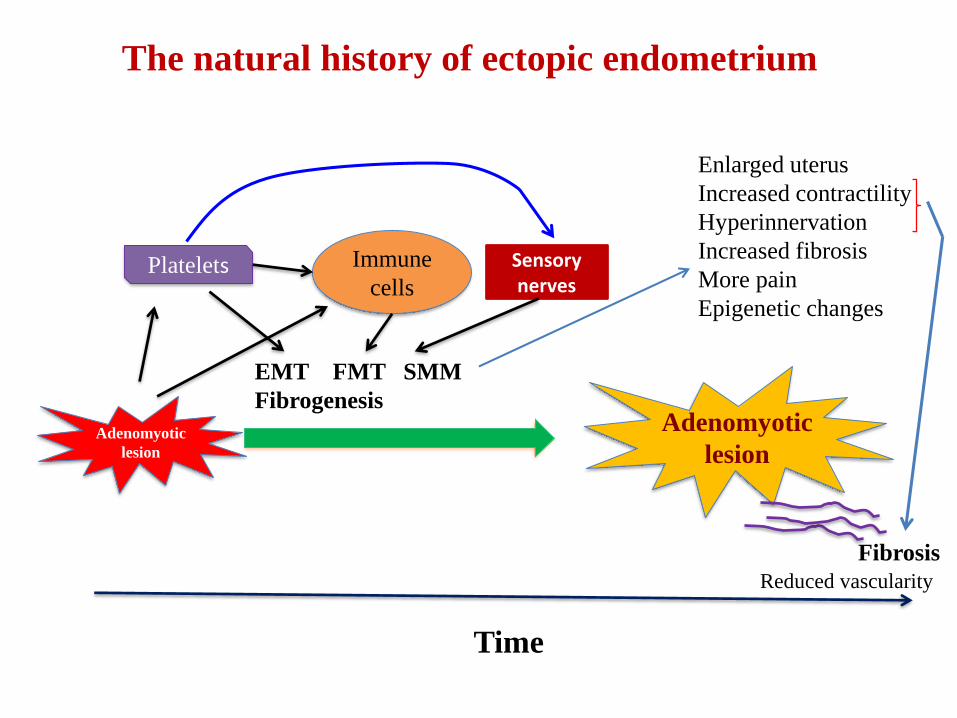
The natural history of ectopic endometrium
Adenomyotic
lesion
Adenomyotic
lesion
EMT FMT SMM
Fibrogenesis
Platelets Immune
cells
Time
Fibrosis
Enlarged uterus
Increased contractility
Hyperinnervation
Increased fibrosis
More pain
Epigenetic changes
Sensorynerves
Reduced vascularity

Endometriosis is 'A fibrotic condition in which endometrial stromaand epithelium can be identified'
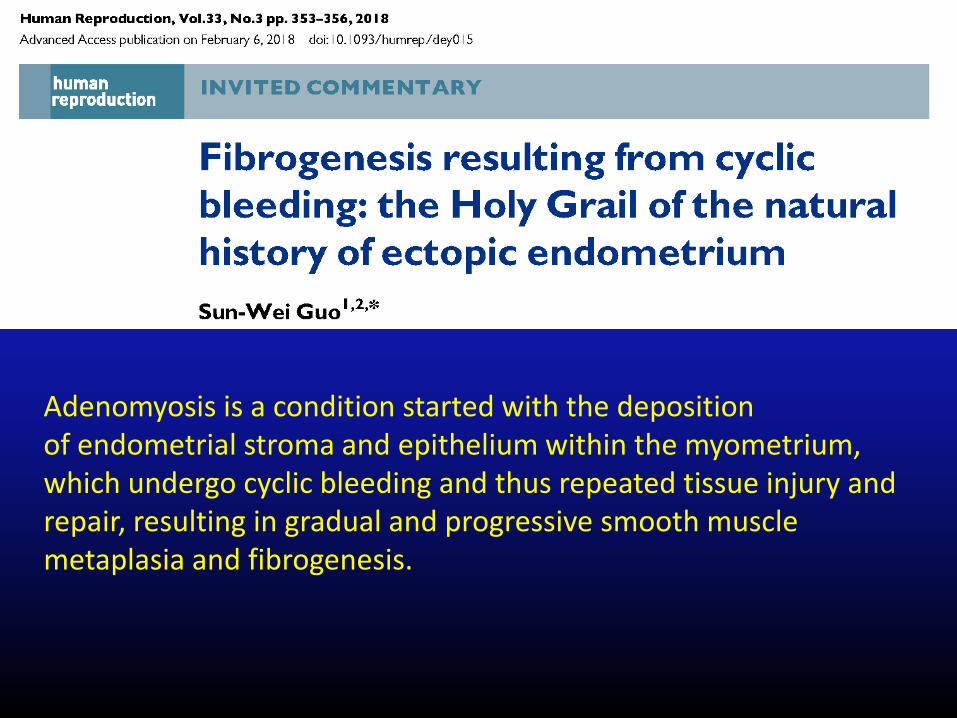
Adenomyosis is a condition started with the deposition of endometrial stroma and epithelium within the myometrium,which undergo cyclic bleeding and thus repeated tissue injury and repair, resulting in gradual and progressive smooth muscle metaplasia and fibrogenesis.

Fibrogenesis: An elephant in the room

The blind men and the elephant
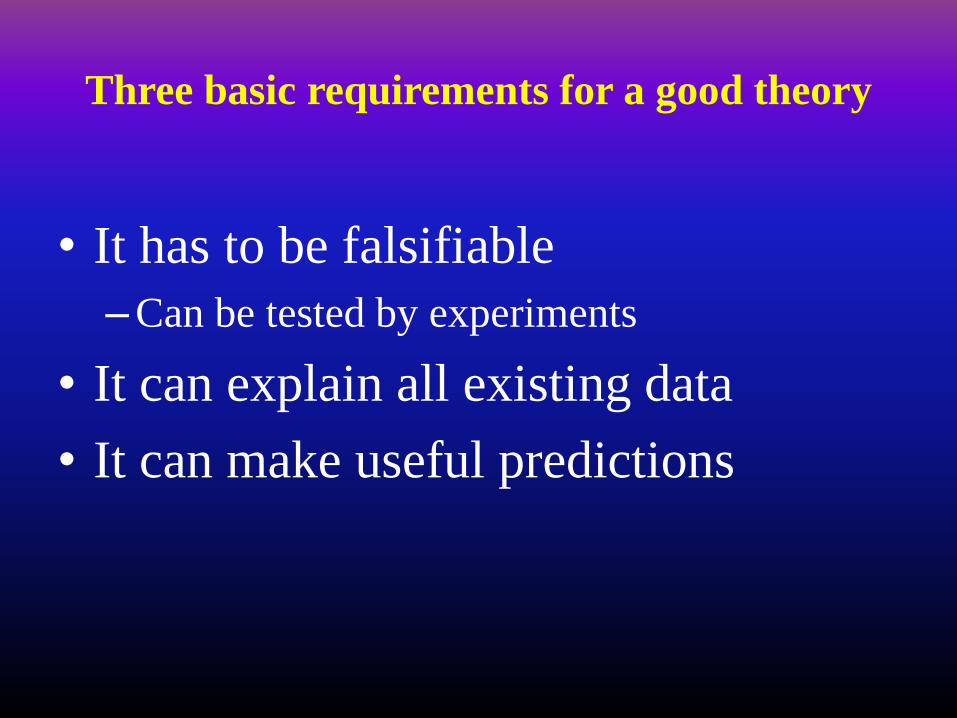
Three basic requirements for a good theory
• It has to be falsifiable
–Can be tested by experiments
• It can explain all existing data
• It can make useful predictions

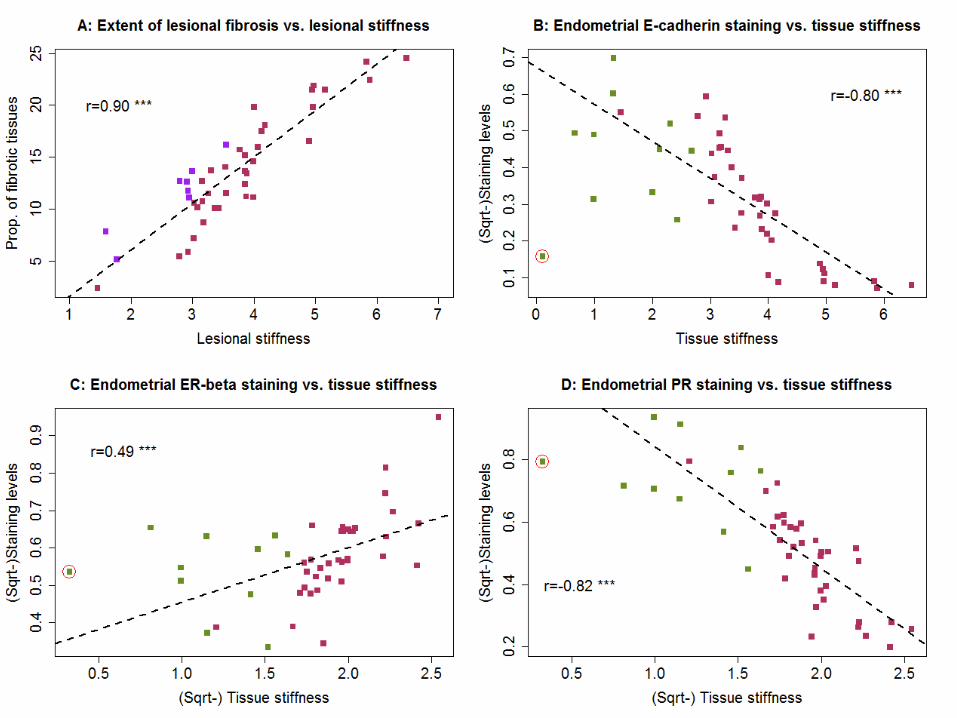
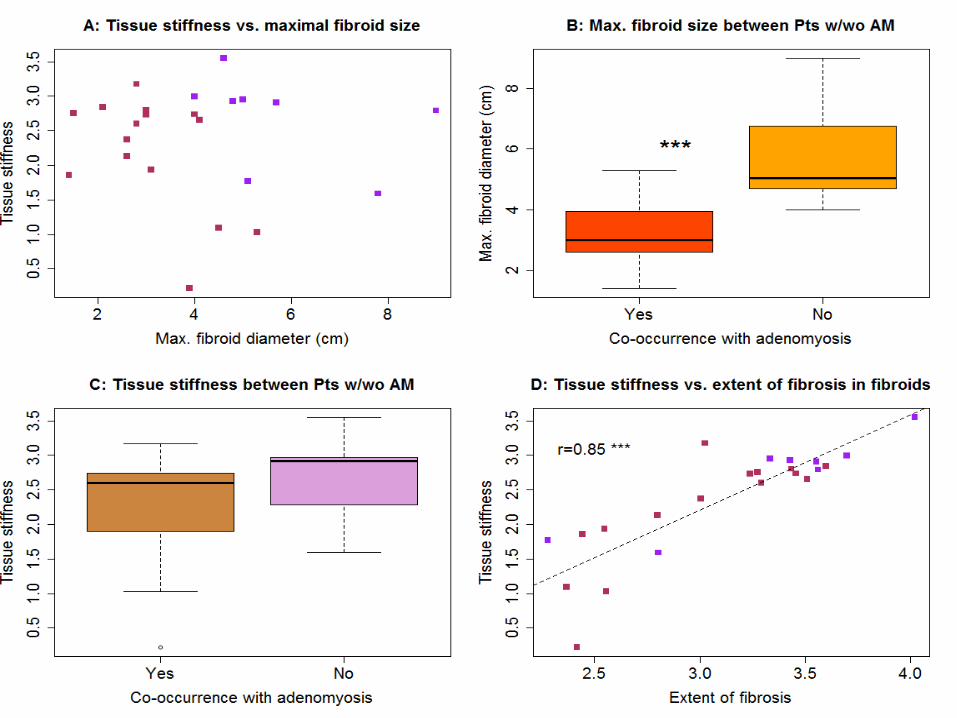
Predictions
• Higher lesional fibrotic content should
correlate with
– More thorough EMT, FMT, and SMM
– Higher tissue stiffness (by elastography)
– Uterine size
– More severe symptoms
– Less progesterone responsiveness
– Less vascularity

What is ultrasonic elastography?
• An ultrasound technique that measures the
stiffness of tissues.
Neil Roberts 2017
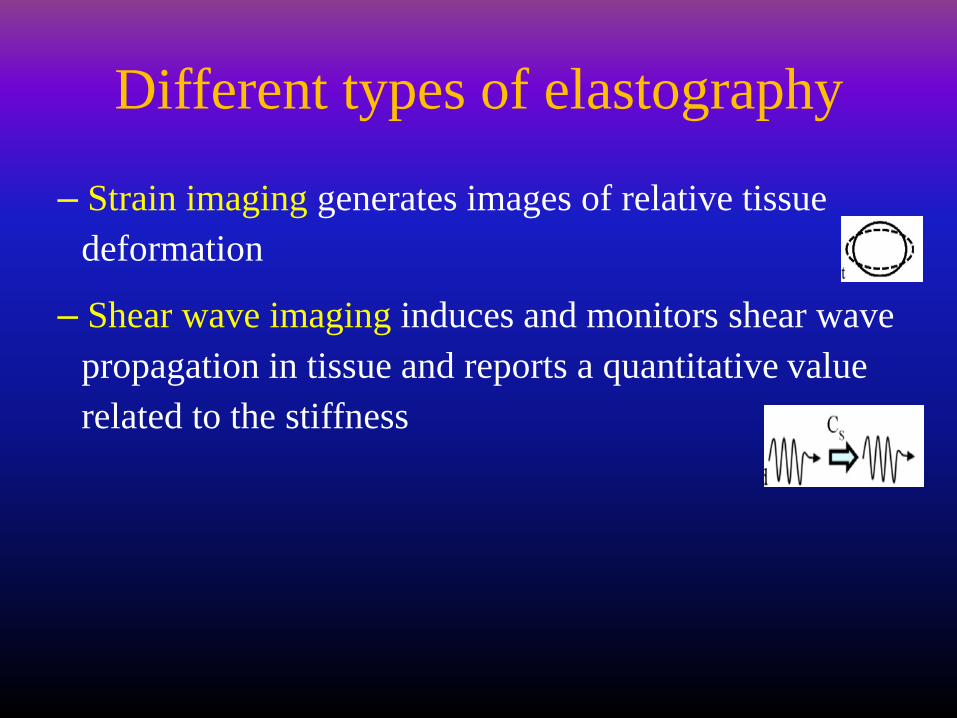
Different types of elastography
– Strain imaging generates images of relative tissue
deformation
– Shear wave imaging induces and monitors shear wave
propagation in tissue and reports a quantitative value
related to the stiffness

Real-time ultrasonic elastography
An imaging technique to detect tissue strain while compressing
surface with a transducer
Ultrasound
Surface
Transducer (probe)
(Compress)
Tumor, adenomyotic lesion
False color display of tissue strain
Soft tissue ->Large strain
Hard tissue->Small strain
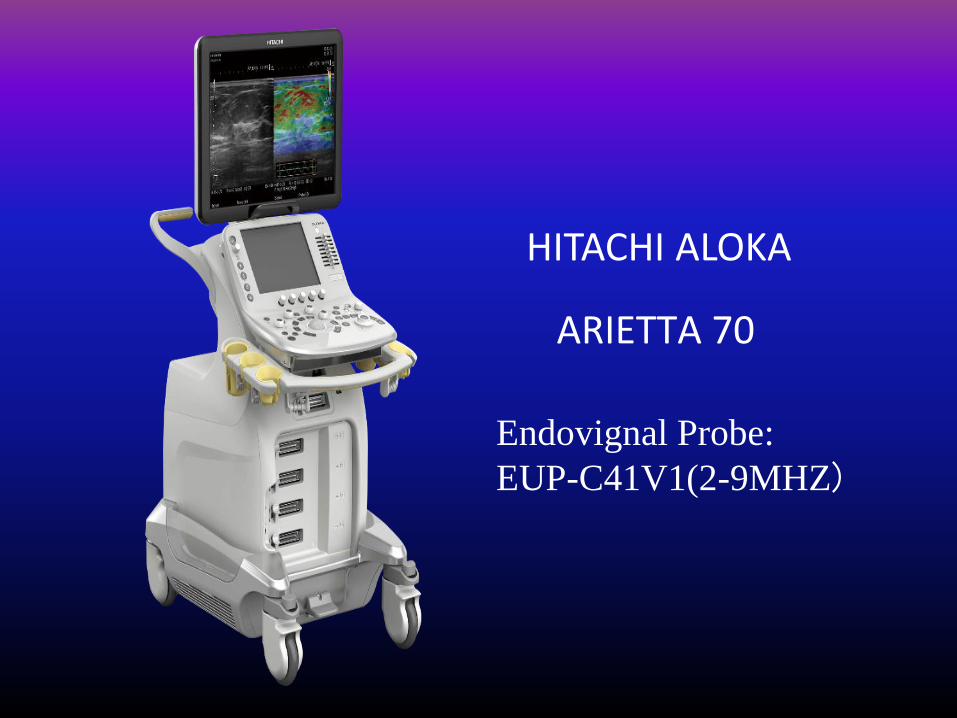
HITACHI ALOKA
ARIETTA 70
Endovignal Probe:
EUP-C41V1(2-9MHZ)

Transvaginal elastosonography for diagnosing adenomyosis
Normal uterus (myo) Uterine fibroids Adenomyosis Hardest
Softest
By ReTIAR theory,we can diagnose and even date adenomyotic lesions
Liu et al. Reprod Sci 2018

Normal
Diffuse AM
Fibroids
Focal AM
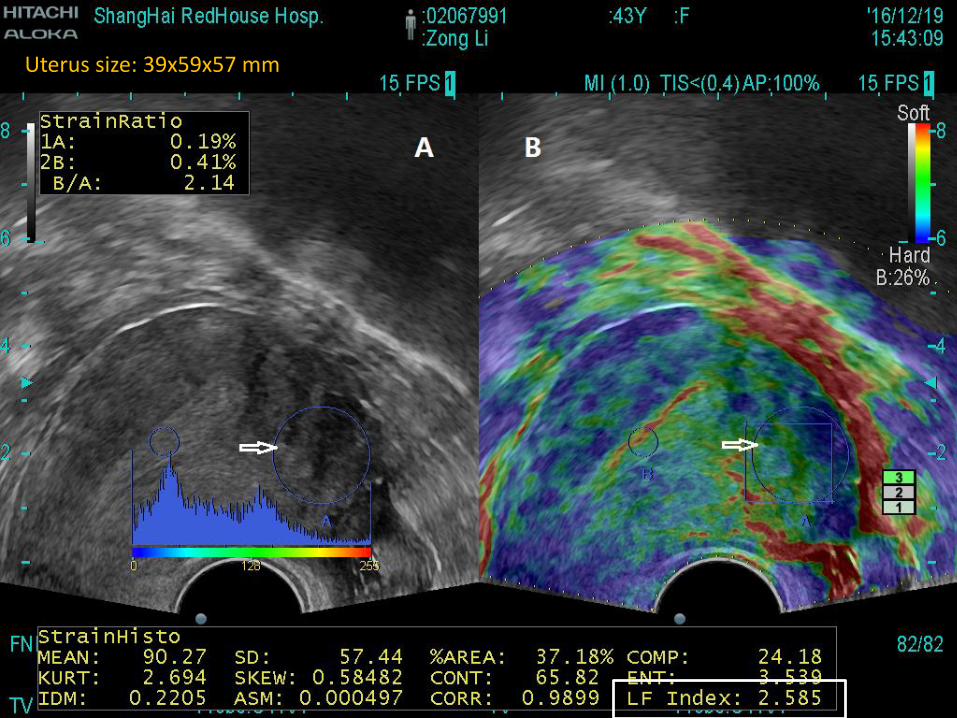
Uterus size: 39x59x57 mm

Elastography applied to patients with adenomyosis and uterine fibroids
• Two data sets– Set 1: Adenomyosis (n=35), uterine fibriods (n=8),
control uteri (CIN III, n=11)• Elastography
• Hysterectomy
• IHC analysis for markers of EMT, FMT, and fibrosis, ER and PR
– Set 2: AM (n=112), UF (n=67), Control (n=130)• Elastography
• Some went hysterectomy

Liu et al. Reprod Sci 2018
Transvaginal elastosonography for diagnosing adenomyosis


Conclusions
• In light of he natural history of adenomyosis, transvaginal
ultrasonic elatrography can be used to diagnose
adenomyosis
• Adenomyosis can be diagnosed and staged by elastography
• Elastography is superior to conventional ultrasound in
differential diagnosis
• Elastographic finding may also be used to guide the choice
of the best treatment modality

Acknowledgment
• Prof. Xishi Liu
• Dr. Minhong Shen
• Dr Qi Zhang
• Prof. Asgi Fazleabas
• Dr. Hongqi Zhang
• Dr Fang Wu, Hitachi (Shanghai)
• The National Natural Science of China
7th Asian Conference on Endometriosis
September 14-16, 2018Taipei, Taiwan
www.acetaiwan2018.org/