The Use of Business Intelligence Tools to Drive Asset ...
16
The Use of Business Intelligence Tools to Drive Asset Performance Management Improvements By Mark Brennan Engineering Manager Philippe Loustau Principal Engineer Alesio Lanzara Specialist Consulting Engineer Vibration, dynamics and noise (formerly BETA Machinery Analysis) Wood Group Presented at: Gas Machinery Conference 2017 Pittsburgh, PA
Transcript of The Use of Business Intelligence Tools to Drive Asset ...

The Use of Business Intelligence Tools to Drive Asset Performance Management Improvements
By
Mark Brennan Engineering Manager
Philippe Loustau Principal Engineer
Alesio Lanzara Specialist Consulting Engineer
Vibration, dynamics and noise (formerly BETA Machinery Analysis)
Wood Group
Presented at:
Gas Machinery Conference 2017
Pittsburgh, PA

Gas Machinery Conference 2017 Page 2
The Use of Business Intelligence Tools to Drive Asset Performance Management Improvements
1. Introduction
A wealth of data is held by organizations in disparate systems such as maintenance management, enterprise resource
planning (ERP), process control, process historians, condition monitoring, asset integrity management and a plethora of
spreadsheets. Typically these data sets are stored and analyzed independently, however, maintenance and reliability
practitioners frequently have to bring data together from multiple sources to support decision making or to identify
improvement opportunities. And these processes can often be challenging, inefficient and time-consuming, with the
effectiveness of the outcome influenced by the spreadsheet skills and determination of the individual.
The latest generation of business intelligence (BI) tools, often already available and being used within an organization, are
an efficient, repeatable way to draw information together and present a more complete and timely picture of asset
performance and asset health. Whereas these BI tools can open up endless possibilities for data analysis, data
visualization and the calculation of performance metrics that are potentially “interesting”, challenges lie in the
inconsistency of data across systems, gaps in data sets, inaccuracies in data and differing thoughts on how to use the
data to address organizational imperatives.
Using case studies from a variety of gas machinery and industrial applications, this paper explores the challenges and
benefits of the BI tools approach to analyzing asset performance and asset management programs.
2. The digital opportunity
The digital age, if nothing else, provides us with a dizzying array of big numbers. A few keyword searches and clicks and
you can find all kinds of numbers and statistics: Gas turbines generating 500+ gigabytes of data every day, more than 50
billion devices to be connected to the internet of things (IoT), 40,000 exabytes (trillion gigabytes) of stored data by 2020,
and new terms invented to cope with the exponential growth – the dinosaur-like Brontobytes tipping the scales at 1027
bytes caught this father’s attention (1) and (2).
Financial numbers are no less impressive, according to a recent McKinsey report (3), “the IoT brings with it a total
potential economic impact of up to $11.1 trillion by 2025”. Most relevantly for us, the resources sector is likely to be
affected significantly, where the economic effect of connected devices and analytics may reach $1T. Critically, the report
also paints a picture of winners and losers; the winners being those companies who find ways to extract insights and
value from their IoT data, and the stragglers who risk losing out to competitors.
So what are the leading companies doing and what is on their minds? The Accenture 2017 Digital Refinery Survey (4)
confirms that the current focus is clearly on cost reduction, and while “new digital technologies are not currently the top
investment priority”, digital spend will increase in coming years to support this. Of that digital spend, analytics has been
identified as having the greatest potential impact on operational performance.
3. Analytics, big data and business intelligence So while analytics is nothing new (UPS started an analytics group in 1954!), what has changed is the volume and variety
of data that can now potentially be analyzed. “Big data” essentially describes a new opportunity provided by the structured
rows and columns stored in today’s data warehouses, databases and spreadsheets, and the unstructured video, sound
and images being captured by new technologies (drones, thermal cameras, etc.) and stored in new “data lakes”.

Gas Machinery Conference 2017 Page 3
The Use of Business Intelligence Tools to Drive Asset Performance Management Improvements
As engineers, we intuitively understand the benefits these new data sets may deliver but are also acutely aware that
realizing tangible business wins is not a simple task. Our experience with customers suggests that there is no one “killer
app” waiting to be discovered and you will be better served by thinking about the “big data” challenge as a journey of
developing capability (see Figure 1) and realizing benefits from multiple smaller applications across many parts of the
business.
Figure 1. Capability maturity model for analytics (5)
While there is a wide variety of software applications under the business intelligence banner, this paper focuses on the
opportunities provided by current mainstream user-centric (rather than IT-centric) BI tools such as Spotfire, Tableau,
PowerBI, Qlik, and SAS. These tools have proven very effective in helping to develop analytical capability and delivering
quick wins, allowing users to conduct focused efforts to turn raw data into actionable information.
The key elements and advantages of today’s generation of these BI tools are:
1. The combination of disparate data sets to glean new insights
2. Visualization of data in ways that are easily absorbed by the human brain
3. The democratization of BI tools via self-service
Tracking KPI metrics separately is something most businesses can do regardless of the tools employed. The art of BI is
combining separate data sets and disparate results from metrics normally not associated with one another into
understandable and actionable information.
In the context of BI software, data visualization is a fast and effective method of transferring information from a machine to
a human brain. The idea is to place digital information into a visual context so that the analytic output can be quickly
ingested by humans, often at a glance. While it may be difficult to wean a hardened engineer off Excel, the ease with
which these tools can connect to data and allow to view, query and dive deeper into the data has made these BI tools
very attractive “spreadsheets on steroids.”

Gas Machinery Conference 2017 Page 4
The Use of Business Intelligence Tools to Drive Asset Performance Management Improvements
One challenge of exploring BI tools, though, is the multitude of choice. A cross section of BI tools from over 200 available
in the market is shown in Figure 2. Our experience suggests that companies will generally make a centralized decision on
the platform, and all of the major software offerings can deliver, although with different challenges. The reader is referred
to the Frontrunners and Gartner reports (Figure 2) for further information on the relative merits of various offerings.
Frontrunners for Business Intelligence, April 2017 (6) Gartner Report: Magic Quadrant for Business Intelligence and Analytics Platforms February 2017 (7)
Figure 2. Cross section of BI tools available in the market in 2017
4. Where to start? Big data or BI? In today’s economic climate, companies have an insatiable appetite for efficiency and competitive advantage and are
looking at digital opportunities to help them deliver.
GE, Siemens and Honeywell all have announced industrial cloud services – Platform as a Service (PaaS) offerings.
These platforms seek to build ecosystems that connect equipment and data to users, experts and managers.
In Will There Be a Dominant IIoT Cloud Platform? Oro finds the following three key platforms and features (8);
1. GE Predix. A PaaS specifically designed for industrial data and analytics. It can capture and analyze the unique
volume, velocity and variety of machine data within a highly secure, industrial-strength cloud environment. GE
Predix is designed to handle data types that exceed consumer cloud service capabilities.
2. Siemens MindSphere is an open platform, based on the SAP HANA (PaaS) cloud, which allows developers to
build, extend and operate cloud-based applications. OEMs and application developers can access the platform
via open interfaces and use it for services and analyses such as the online monitoring of globally distributed
machine tools, industrial robots or industrial equipment such as compressors and pumps. MindSphere also allows
customers to create digital models of their factories with real data from the production process.

Gas Machinery Conference 2017 Page 5
The Use of Business Intelligence Tools to Drive Asset Performance Management Improvements
3. Honeywell Sentience is the recently announced cloud infrastructure by Honeywell Process Solutions. It is a
secure, scalable and standards-based “One Honeywell” IoT platform, which will be able to accelerate time-to-
market of connected solutions, lower the cost-to-market, and enable new innovative PaaS business models. It will
have the ability to run global security standards embedded throughout the solution and create applications that
are plug-and-play and scalable.
Early adopters have already announced they are making big digital plays. Woodside Energy in Australia is complementing
their data warehouse with a data lake, recruitment of a team of data scientists, and projects involving bots and artificial
intelligence (like Dr. Watson from IBM).
Figure 3. Woodside's head of cognitive science and robotics Russell Potapinski (left) hugs a Robonaut. Julia Badger, Robonaut Project
Manager at NASA on the right
The challenge of a large scale implementation such as platforms, other than the obvious barrier of cost, is that this is both
a data and people game. Even if you have all the data, you still need to align business processes and educate and
change the way people work. We should not really be surprised by this, as we have in fact seen this before with the large
scale role out of ERP systems such as SAP. Osintsev, when reviewing ERP implementations, identified that besides the
selection problem, technical issues and data quality concerns, business philosophy changes and mind-shift issues with
people are also pivotal (9). This often extends from the organization’s capability maturity in the digital space, highlighted in
Figure 1.
Rather than committing all resources at the complex end of the continuum, trying to implement a platform approach, our
clients are mitigating their risk by leveraging the opportunity to also use BI tools. So rather than a question of Big Data or
BI – current experiences suggest we need both.

Gas Machinery Conference 2017 Page 6
The Use of Business Intelligence Tools to Drive Asset Performance Management Improvements
5. Implementing BI Whereas implementing BI solutions is far less complex, our experience finds that they are not without the typical
challenges of automation, namely:
1. Data “on islands” (example follows below), “dirty data” and ”incomplete data”
2. Data variety, connection and accessibility
3. Integration of insights, business processes and organizational silos
An IBM report considered the IoT data on a single oil rig, and the findings were revealing (10): As little as 1% of the data
generated was ever used for decision making. The rest seems to disappear into a sort of “data black hole.” So where is
the other 99% of data going?
Figure 4. Data flow and use on an oil platform
As shown in Figure 4, up to 40% of the data is just lost, never being stored. The data which is stored locally can be in
custom databases of specialty software. Essentially, the data is marooned on virtual islands from the wider organization.
For the data that is stored within specialty software, such as condition monitoring databases, we have found that it is
possible to extract the data from the source and make sense of it. In this example, this is beneficial, as it now makes the
condition monitoring data available to the organization for potentially useful analysis.
Data variety presents us with two opportunities. Firstly, even if data is incomplete or dirty, by combining it with other data
sources, it allows the user to potentially identify valuable parts and disregard the poor. The second opportunity is to enrich
the original data source. The challenge in implementation is that data scientists are often tasked with the data wrangling of
mapping the different data sources. Without subject matter expertise and context, this can be a confusing and difficult
process. Successful examples of this are featured on pages 11-12.

Gas Machinery Conference 2017 Page 7
The Use of Business Intelligence Tools to Drive Asset Performance Management Improvements
Even when these data challenges are overcome, if the information is not made available to the wider business by
standard processes and meeting rhythms, the value can be lost. In parallel with the purpose-built systems storing data in
separate databases, organizations are often siloed into distinct areas of business, for example, operations, engineering,
HR, commercial and legal, etc.. These silos act as additional barriers to flow of information and have (necessarily)
different business processes and stakeholders.
6. Organizational process opportunity
To identify relevant business processes and overcome organizational barriers, we have found that running a discovery
process can help. Often the first step may be mired in fear or skeptical of business return. Where do we begin? What
value will this generate? Or we have begun but are not getting the traction or results we expected.
An approach we found helpful is business process opportunity mapping that identifies:
1. The current situation in supporting stakeholders
2. Business intelligence opportunities (and prioritizes them)
3. Specific business processes and meetings that can be supported by data
4. Required business objectives
Further, we see is that there are actually two user cases; one where subject matter experts use BI tools to combine data
in new ways, grow out point solutions and develop business opportunities. For instance, a SME could develop analytics to
monitor valve wear or detect hydrate formation. Secondly, there is the business process or stakeholder opportunity, where
BI tools are used to enhance stakeholder experience.
General opportunities for both user cases:
Subject matter specialists Stakeholders
• Can contextualize subject matter data more easily
• Can correlate subject matter information more
easily
• Know how to drill down to answer questions
• Become more familiar with subject matter through
higher usage
• Can build business SME processes out from the
dashboard and data
• Have broader interests in the data and the many
pictures it paints
• Are provided more context to make information
actionable
• Can better understand and interpret KPIs, in their
language and measures
• Get quicker answers to anticipated questions
• Have dashboards available that are more intuitive
and accessible
• Receive information that can integrate into and
directly serve their business processes
• Generally have a better picture of where to focus
Both approaches can work in isolation, however, we see best success when a convergent process is used to combine
both elements so that it is part of the living processes of the business.

Gas Machinery Conference 2017 Page 8
The Use of Business Intelligence Tools to Drive Asset Performance Management Improvements
Figure 5. A convergent approach to business intelligence tools
When looking for opportunities to make a difference and show value, Accenture’s The 2016 Oil and Gas Digital Trends
Survey identifies the top three areas to drive improvement: more effective plant management, reduced operational risk
and more efficient and predictive maintenance. Similarly, McKinsey’s The internet of things: Mapping the value beyond
the hype highlights operating efficiencies and predictive maintenance (11, 12).
Figure 6. Top digital benefits in refining (11)
The core of our rotating equipment reliability business unit is centered in predictive maintenance and condition based
monitoring (CBM), so we have provided the following examples from this specialty which we hope will allow you to draw
parallels to your own discipline.

Gas Machinery Conference 2017 Page 9
The Use of Business Intelligence Tools to Drive Asset Performance Management Improvements
7. Examples
Case study 1: compliance A very common starting point is the foundation stone that is compliance. In this example, we are referring to the collection
of condition based monitoring data by hand, such as for vibration and lubricant sampling analysis. The basis of a good
program is to ensure that the data relevant to failures modes you are guarding your machines against, actually gets
collected and analyzed. Our experience has shown that even with the best of intentions, data collection rates can drift out
to 50% of the required population. This is not due to poor qualification, motivation or management; for example, a
specialist may be driven to focus on emergent work that is critical to the business, and a manager might simply not be
able to see data that is not truly visible outside the specialist software which houses the “real” information. The danger in
not being compliant with a condition monitoring schedule is in the potentially false sense of security. When assuming that
the program is providing the base level insurance, in reality, samples might not be taken in sufficient numbers and some
machines might get missed. It’s like paying your insurance premium for your house but forgetting to pay it for your car.
When the compliance piece was implemented by connecting the BI tool directly to the CBM specialist database and the
reporting tool database, the connection to the reporting tool was pivotal as the distinction was made between data
collection and storage in the database versus collection, storage and analysis. Data was collected every four to six weeks
at each site, and the dashboard was updated weekly across all sites. The basic connections are shown in Figure 7.
Figure 7. Compliance use case connections
The operator in this case was monitoring around 3000 machines across 8 different sites. The advantages of implementing
the compliance piece were:
1. Immediate and rapid improvement of CBM routines adherence to plan
2. An unexpected benefit in that it assisted with marine assets meeting class requirements and regulatory reporting
3. Improvement in the visibility of instrument issues affecting CBM data collection
4. Re-evaluation of effective maintenance strategies for equipment that could not be included in condition monitoring
due to access, infrequent operation, etc.
5. Accessibility and visibility of data to the wider organization

Gas Machinery Conference 2017 Page 10
The Use of Business Intelligence Tools to Drive Asset Performance Management Improvements
Figure 8a. Compliance use case example; showing collection percentage for each facility, and compliance over time
Figure 8b. Equipment condition use case example; showing condition percentage for each facility, and condition over time

Gas Machinery Conference 2017 Page 11
The Use of Business Intelligence Tools to Drive Asset Performance Management Improvements
Case study 2: reliability, availability, utilization
A common issue for operators is that they are aware of the plant overall availability and production but struggle to break
that down to a machine or component level. If the breakdown is achieved, it is developed by a reliability specialist either
working with a limited license, stand-alone database, degree of technical knowledge, a software tool or a spreadsheet. In
this instance, it was possible to use multiple data sources plus some SME knowledge and simple coding to produce
component level reliability, availability and utilization (RAU).
Figure 9. Data sources and simplified logic for RAU
As shown in Figure 9, the novel method employed in this instance uses data from the plant historian database to
determine if a machine is running or not running and combines it with data from the CMMS. The data could now be
broken down into more specific cases: unplanned downtime, planned downtime, available and unutilized, and utilized
time.
This process depends on the correctness of the CMMS data, however, even if it is not correct, the knowledge that the
machine was not running allows the operator to work towards improving the CMMS data input.
Gas Machinery Conference 2017 Page 12
The Use of Business Intelligence Tools to Drive Asset Performance Management Improvements
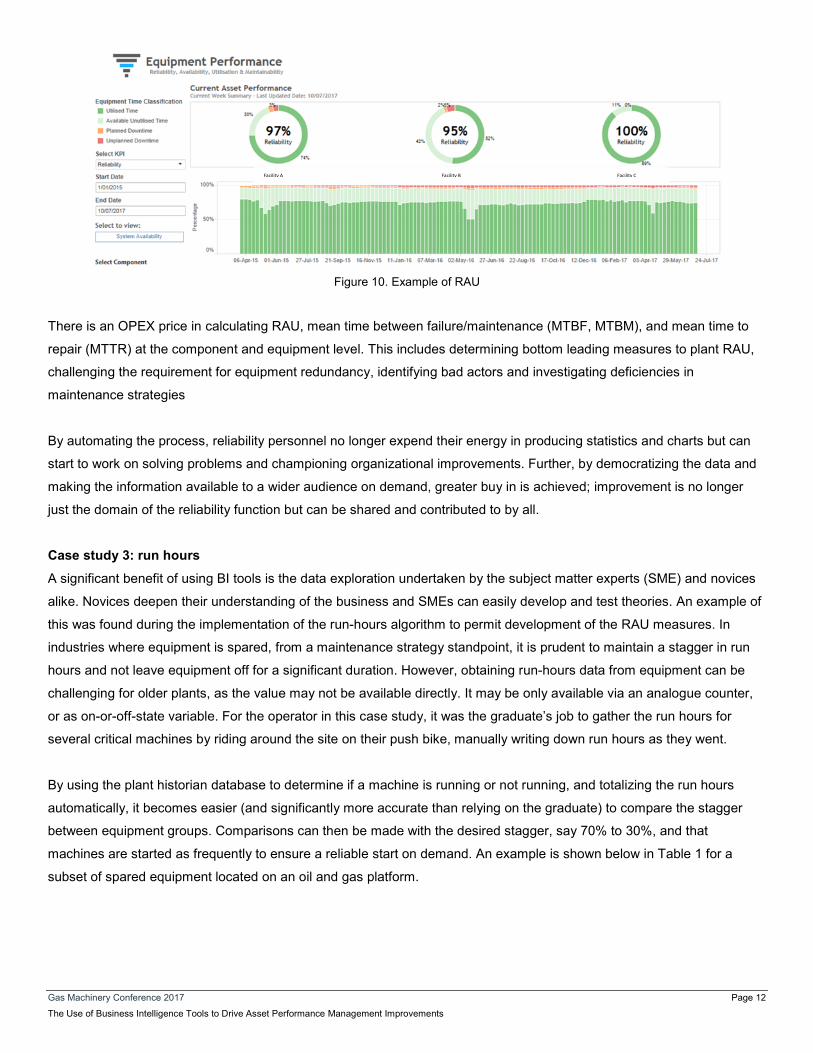
Figure 10. Example of RAU
There is an OPEX price in calculating RAU, mean time between failure/maintenance (MTBF, MTBM), and mean time to
repair (MTTR) at the component and equipment level. This includes determining bottom leading measures to plant RAU,
challenging the requirement for equipment redundancy, identifying bad actors and investigating deficiencies in
maintenance strategies
By automating the process, reliability personnel no longer expend their energy in producing statistics and charts but can
start to work on solving problems and championing organizational improvements. Further, by democratizing the data and
making the information available to a wider audience on demand, greater buy in is achieved; improvement is no longer
just the domain of the reliability function but can be shared and contributed to by all.
Case study 3: run hours
A significant benefit of using BI tools is the data exploration undertaken by the subject matter experts (SME) and novices
alike. Novices deepen their understanding of the business and SMEs can easily develop and test theories. An example of
this was found during the implementation of the run-hours algorithm to permit development of the RAU measures. In
industries where equipment is spared, from a maintenance strategy standpoint, it is prudent to maintain a stagger in run
hours and not leave equipment off for a significant duration. However, obtaining run-hours data from equipment can be
challenging for older plants, as the value may not be available directly. It may be only available via an analogue counter,
or as on-or-off-state variable. For the operator in this case study, it was the graduate’s job to gather the run hours for
several critical machines by riding around the site on their push bike, manually writing down run hours as they went.
By using the plant historian database to determine if a machine is running or not running, and totalizing the run hours
automatically, it becomes easier (and significantly more accurate than relying on the graduate) to compare the stagger
between equipment groups. Comparisons can then be made with the desired stagger, say 70% to 30%, and that
machines are started as frequently to ensure a reliable start on demand. An example is shown below in Table 1 for a
subset of spared equipment located on an oil and gas platform.
Facility A Facility B Facility C

Gas Machinery Conference 2017 Page 13
The Use of Business Intelligence Tools to Drive Asset Performance Management Improvements
Table 1 – Example of run hours distribution for spared equipment
Service Duty type Sparing
philosophy FLOCs
Run hrs distribution %
Ave run hrs p/mth
Longest period in between 1 hr
runs
T1 Glycol Regeneration Pumps Continuous 2x100% Pump A 97% 665.6 1
Pump B 3% 18.2 8
T3 Glycol Regeneration Pumps Continuous 2x100% Pump A 19% 130 4
Pump B 81% 538.1 1
Glycol Transfer Pumps Intermittent 2x100% Pump A 13% 0.6 14
Pump B 88% 3.9 1
Potable Water Dist. Pumps Continuous 2x100% Pump A 37% 274.6 1
Pump B 63% 463 1
HVAC Chiller Compressors Continuous 3x100%
Fan A 56% 437.5 1
Fan B 3% 21.3 12
Fan C 41% 323.8 1
HVAC Chilled Water Pumps Continuous 3x100%
Pump A 49% 449.1 1
Pump B 3% 24.7 6
Pump C 49% 451 1
Fuel Gas KO Drum Pumps Intermittent 2x100% Pump A 99% 89 1
Pump B 1% 1.1 14
GTG A Enclosure Vent Fans Continuous 2x100% Fan A 81% 514.1 1
Fan B 19% 118.4 9
GTG B Enclosure Vent Fans Continuous 2x100% Fan A 78% 318.8 1
Fan B 22% 87.8 14
GTG C Enclosure Vent Fans Continuous 2x100% Fan A 34% 170.8 7
Fan B 66% 327.8 1
GTG D Enclosure Vent Fans Continuous 2x100% Fan A 62% 409.5 1
Fan B 38% 247.4 9
T1 Enclosure Vent Fans Continuous 2x100% Fan A 29% 192 16
Fan B 71% 474.5 7
T2 Enclosure Vent Fans Continuous 2x100% Fan A 63% 391 3
Fan B 37% 231.6 12
T2 Comp Lube Oil Pumps Continuous 2x100% Pump A 49% 310.5 7
Pump B 51% 316.9 7
Hazardous Open Drains Pumps Intermittent 2x100% Pump A 53% 0.3 12
Pump B 47% 0.3 9
Tempered Water Pumps Continuous 4x33%
Pump A 12% 252.7 2
Pump B 27% 577.8 1
Pump C 28% 590 1
Pump D 33% 687 1
HVAC Tempered Water Pumps Continuous 2x100% Pump A 98% 711.9 1
Pump B 2% 11.7 7

Gas Machinery Conference 2017 Page 14
The Use of Business Intelligence Tools to Drive Asset Performance Management Improvements
In the run-hours distribution column, red shading indicates a potentially inadequate stagger. The longest period between a
one-hour run column indicates equipment, that, although the stagger is acceptable, may not have run for an extended
period, increasing the risk of a fail-to-start event, such as the for the T1 enclosure vent fans.
Figure 11 – Run-hours trend for T1 enclosure vent fans
Case study 4: oil and gas operator greasing example
A leading analytics advocate, Davenport, stated; “Employees hired for their expertise with numbers or trained to recognize
their importance are armed with the best evidence and the best quantitative tools. As a result, they make the best
decisions” (14, Harvard Business Review 2006).
The following example follows this “best evidence, best decisions” mantra. Figure 12 illustrates the number of CBM calls
made each quarter across several facilities. The number of calls varies but is relatively static overall, so to look at possible
factors, the calls were broken up by facility, shown in Figure 13.
Figure 12. Antifriction bearing defect (ABD) and lack of bearing lubrication (LBL) issues across all facilities
VENT FAN A
VENT FAN B

Gas Machinery Conference 2017 Page 15
The Use of Business Intelligence Tools to Drive Asset Performance Management Improvements
Figure 13. Antifriction bearing defect (ABD) and lack of bearing lubrication (LBL) issues by facilities
Figure 13 shows that facilities A and B contributed significantly to the count, even though they had fewer items of
equipment being surveyed. Greasing practices are known to be a leading reason for bearing defects called by the CBM
program. A review of the greasing period between facilities highlighted that facility A and B both had almost 100% of the
equipment at greasing durations longer than four months, much more than the other facilities.
Based on these results, the support personnel now had the evidence to actually drive the change to the lubrication
interval.
8. Summary In the resources sector, we are all experiencing the “lower (oil price) for longer” effect which requires us to have an
unrelenting focus on costs. Clearly, digital analytics and the IoT will provide some of the answers, but the challenge many
of us face is that you cannot go from zero to pervasive use of advanced software tools and artificial intelligence overnight.
Our experience has demonstrated that by using tools that are already available, we have been able to deliver relatively
simple applications that jumpstart the exploration and delivery of new analytics and decision-making opportunities.
This experience is based on working with several resource companies in the Australia-Pacific region developing bootstrap
programs which found novel yet simple initiatives that pay for themselves.
While not producing a “killer app”, this bottom-up approach has delivered quick wins and new insights, and most
importantly, has allowed our customers to see their businesses with the digital mindset that is required to not become a
straggler in the digital age.
Facility A
Facility B

Gas Machinery Conference 2017 Page 16
The Use of Business Intelligence Tools to Drive Asset Performance Management Improvements
9. References 1. Dr. Rhodri Davies, Andreas Wuchner, Andrzej Kawalec, and Lin Nease, Securing the Internet of Things 2015
http://h20195.www2.hpe.com/V3/getpdf.aspx/4aa6-3369enw
2. Julianne Twining, Behind The Numbers: Growth in the Internet of Things 2015 2017,
https://www.ncta.com/broadband-by-the-numbers and https://www.ncta.com/platform/broadband-internet/behind-the-
numbers-growth-in-the-internet-of-things/
3. James Manyika, Michael Chui, Peter Bisson, Jonathan Woetzel, Richard Dobbs, Jacques Bughin, and Dan Aharon
Unlocking the potential of the Internet of Things http://www.mckinsey.com/business-functions/digital-mckinsey/our-
insights/the-internet-of-things-the-value-of-digitizing-the-physical-world
4. Survey, The connected refinery https://www.accenture.com/us-en/_acnmedia/PDF-53/Accenture-Digital-Refining-
Survey-Infographic.pdf
5. Kunal Jain, What is Business Analytics and which tools are used for analysis? 2013
https://www.analyticsvidhya.com/blog/2013/06/business-analytics-spectrum/
6. Survey, FrontRunners for Business Intelligence, April 2017 (5) http://www.softwareadvice.com/au/bi/#top-products
7. Rita L Salam et. al., Gartner Report: Magic Quadrant for Business Intelligence and Analytics Platforms February 2017
8. David Oro, Will There Be a Dominant IIoT Cloud Platform? 2016, http://www.iotcentral.io/blog/will-there-be-a-
dominant-iiot-cloud-platform?context=featured
9. Aleksey Osintsev, The 5 biggest challenges when implementing an ERP for the first time 2016
https://www3.technologyevaluation.com/research/article/the-5-biggest-challenges-when-implementing-erp-for-the-first-
time.html
10. Oystein Haaland, IoT analytics at the edge: transforming the energy industry 2016,
https://www.ibm.com/blogs/internet-of-things/energy-industry/
11. Rich Holsman and Brian Richards, The 2016 Oil and Gas Digital Trends Survey https://www.accenture.com/au-
en/insight-2016-upstream-oil-gas-digital-trends-survey
12. Eric Lamarre and Brett May, Making sense of Internet of Things platforms 2017, http://www.mckinsey.com/business-
functions/digital-mckinsey/our-insights/making-sense-of-internet-of-things-platforms
13. David Strom and Pam Baker, The Best Self-Service Business Intelligence (BI) Tools of 2017
http://au.pcmag.com/cloud-services/41015/guide/the-best-self-service-business-intelligence-bi-tools-of-2017)
14. Thomas H. Davenport, Competing on Analytics 2006, https://hbr.org/2006/01/competing-on-analytics