The Use of Burst Frequency Offsets in the Search for … The Use of Burst Frequency Offsets in the...
10
1 MH370 Burst Frequency Offset Analysis and Implications on Descent Rate at End-of-Flight Ian D. Holland Defence Science and Technology Group, Edinburgh, Australia I. I NTRODUCTION O N 7 March 2014 at 16:41:43Z 1 , Malaysian Airlines flight MH370 departed Kuala Lumpur (KL) International Air- port bound for Beijing. Less than an hour later, following the last recorded radio transmission from MH370 at 17:19:30Z, the plane’s secondary radar transponder went offline. As evidenced by Malaysian military radar, the plane (registration number 9M-MRO) then veered off course unexpectedly, back- tracked across the Malaysian Peninsula, and was then tracked heading northwest from Penang through the Malacca Straits. After disappearing from radar at 18:22:12Z, it re-established a satellite communications (SATCOM) link with the Inmarsat satellite I-3F1 at 18:25:27Z. By analyzing a series of auto- mated messages exchanged via that satellite between the plane and an Inmarsat ground station in Perth, Australia, it was determined that the plane continued to fly for six hours, before finally ceasing message exchange with the ground station at 00:19:37Z on 8 March 2014. This article discusses specifically the analysis of burst frequency offset (BFO) metadata from the SATCOM messages. Importantly, it is shown that the BFOs corresponding to the last two SATCOM messages from the plane at 00:19:29Z and 00:19:37Z suggest that flight MH370 was rapidly descending and accelerating downwards when message exchange with the ground station ceased. An initial analysis by Inmarsat of the SATCOM metadata for MH370 in the last six hours of flight suggested that MH370 had flown into the Southern Indian Ocean before SATCOM was ultimately lost (see [1] for further details). As summarized in [2] an intensive aerial and surface search was undertaken in the Southern Indian Ocean by an international search team during March and April 2014, with no MH370 related debris found. On 28 April 2014, the aerial search concluded and the search transitioned to an underwater phase [2]. The Australian Transport Safety Bureau (ATSB) took responsibility for the definition of the underwater search zone. It convened an international flight path prediction working group bringing together experts in satellite communications, statistical data processing and aviation, in order to estimate the most likely final location of flight MH370. The group consisted of representatives from the Australian Defence Science and Technology (DST) Group and the other organizations listed in the Acknowledgment section of this article. New methods of analyzing the Inmarsat data were de- veloped by the group, resulting in the release of reports Copyright c 2018 Commonwealth of Australia. 1 All times given in this article are in UTC or “Zulu” time, denoted by “Z”. concerning the likely final location of flight MH370 from the ATSB in August 2014 [3], October 2014 [4], and December 2015 [5]. Inmarsat also published an article regarding their contribution to the flight path reconstruction effort [1]. The DST Group contribution that assisted in the definition of an extended priority search area in December 2015 [5] has been detailed in [2]. This demonstrated how Bayesian analysis was used to identify a high probability region of where the plane was believed to be at the time of last SATCOM transmission (00:19:37Z 8 March 2014). The DST Group Bayesian method used a prior probability distribution defined by the Malaysian military radar, a likelihood function describing the relationship between SATCOM measurements and the aircraft position and velocity during the flight, and a model of the aircraft dynamics. It should be noted that this article does not cover the Bayesian method used in defining the underwater search area. For details on that method, the reader is referred to [2]. Instead, this article focuses on: 1) A brief review of the statistical analysis of BFOs for several previous flights of 9M-MRO. 2) Examination of the effects of the plane’s vertical velocity on the BFO. 3) An analysis of the effect of the track angle of the plane on the BFO towards the end-of-flight. 4) The establishment of a BFO trend throughout the last 6 hours of flight so as to determine an expected BFO at end-of-flight. 5) An analysis of the behavior of the frequency oscillator in the plane’s satellite data unit (SDU) after power outage events such as those believed to have occurred twice during flight MH370, and how this affects the BFO. 6) An analysis that shows that the final two BFO’s are consistent with MH370 being in a rapid descent and accelerating downwards. The remainder of this article is structured as follows. Section II presents a brief timeline of key events during the MH370 accident flight. In Section III, a review of the SATCOM model is provided, along with a brief review of the BFO statistics. This serves as a summary of work previously presented in [2]. Section IV describes the effects of aircraft position and velocity on the BFO. The settling behavior of the SDU’s frequency oscillator for 9M-MRO after power-up is then detailed in Section V. This is important because the SDU is believed to have undergone a power outage between 00:11Z and 00:19Z on 8 Mar 2014, immediately preceding the last two SATCOM transmissions from MH370. The effect of oscillator arXiv:1702.02432v3 [stat.OT] 15 Jan 2018
-
Upload
nguyenkhue -
Category
Documents
-
view
217 -
download
2
Transcript of The Use of Burst Frequency Offsets in the Search for … The Use of Burst Frequency Offsets in the...

1
MH370 Burst Frequency Offset Analysis andImplications on Descent Rate at End-of-Flight
Ian D. HollandDefence Science and Technology Group, Edinburgh, Australia
I. INTRODUCTION
ON 7 March 2014 at 16:41:43Z1, Malaysian Airlines flightMH370 departed Kuala Lumpur (KL) International Air-
port bound for Beijing. Less than an hour later, following thelast recorded radio transmission from MH370 at 17:19:30Z,the plane’s secondary radar transponder went offline. Asevidenced by Malaysian military radar, the plane (registrationnumber 9M-MRO) then veered off course unexpectedly, back-tracked across the Malaysian Peninsula, and was then trackedheading northwest from Penang through the Malacca Straits.After disappearing from radar at 18:22:12Z, it re-establisheda satellite communications (SATCOM) link with the Inmarsatsatellite I-3F1 at 18:25:27Z. By analyzing a series of auto-mated messages exchanged via that satellite between the planeand an Inmarsat ground station in Perth, Australia, it wasdetermined that the plane continued to fly for six hours, beforefinally ceasing message exchange with the ground station at00:19:37Z on 8 March 2014. This article discusses specificallythe analysis of burst frequency offset (BFO) metadata from theSATCOM messages. Importantly, it is shown that the BFOscorresponding to the last two SATCOM messages from theplane at 00:19:29Z and 00:19:37Z suggest that flight MH370was rapidly descending and accelerating downwards whenmessage exchange with the ground station ceased.
An initial analysis by Inmarsat of the SATCOM metadatafor MH370 in the last six hours of flight suggested thatMH370 had flown into the Southern Indian Ocean beforeSATCOM was ultimately lost (see [1] for further details). Assummarized in [2] an intensive aerial and surface search wasundertaken in the Southern Indian Ocean by an internationalsearch team during March and April 2014, with no MH370related debris found. On 28 April 2014, the aerial searchconcluded and the search transitioned to an underwater phase[2]. The Australian Transport Safety Bureau (ATSB) tookresponsibility for the definition of the underwater search zone.It convened an international flight path prediction workinggroup bringing together experts in satellite communications,statistical data processing and aviation, in order to estimate themost likely final location of flight MH370. The group consistedof representatives from the Australian Defence Science andTechnology (DST) Group and the other organizations listed inthe Acknowledgment section of this article.
New methods of analyzing the Inmarsat data were de-veloped by the group, resulting in the release of reports
Copyright c© 2018 Commonwealth of Australia.1All times given in this article are in UTC or “Zulu” time, denoted by “Z”.
concerning the likely final location of flight MH370 from theATSB in August 2014 [3], October 2014 [4], and December2015 [5]. Inmarsat also published an article regarding theircontribution to the flight path reconstruction effort [1]. TheDST Group contribution that assisted in the definition of anextended priority search area in December 2015 [5] has beendetailed in [2]. This demonstrated how Bayesian analysis wasused to identify a high probability region of where the planewas believed to be at the time of last SATCOM transmission(00:19:37Z 8 March 2014). The DST Group Bayesian methodused a prior probability distribution defined by the Malaysianmilitary radar, a likelihood function describing the relationshipbetween SATCOM measurements and the aircraft position andvelocity during the flight, and a model of the aircraft dynamics.
It should be noted that this article does not cover theBayesian method used in defining the underwater search area.For details on that method, the reader is referred to [2]. Instead,this article focuses on:
1) A brief review of the statistical analysis of BFOs forseveral previous flights of 9M-MRO.
2) Examination of the effects of the plane’s vertical velocityon the BFO.
3) An analysis of the effect of the track angle of the planeon the BFO towards the end-of-flight.
4) The establishment of a BFO trend throughout the last 6hours of flight so as to determine an expected BFO atend-of-flight.
5) An analysis of the behavior of the frequency oscillator inthe plane’s satellite data unit (SDU) after power outageevents such as those believed to have occurred twiceduring flight MH370, and how this affects the BFO.
6) An analysis that shows that the final two BFO’s areconsistent with MH370 being in a rapid descent andaccelerating downwards.
The remainder of this article is structured as follows.Section II presents a brief timeline of key events duringthe MH370 accident flight. In Section III, a review of theSATCOM model is provided, along with a brief review of theBFO statistics. This serves as a summary of work previouslypresented in [2]. Section IV describes the effects of aircraftposition and velocity on the BFO. The settling behavior ofthe SDU’s frequency oscillator for 9M-MRO after power-up isthen detailed in Section V. This is important because the SDUis believed to have undergone a power outage between 00:11Zand 00:19Z on 8 Mar 2014, immediately preceding the last twoSATCOM transmissions from MH370. The effect of oscillator
arX
iv:1
702.
0243
2v3
[st
at.O
T]
15
Jan
2018

2
Fig. 1. System model of the satellite communication system [2].
warm-up on the BFO after power-up can be used in boundingthe descent rates for MH370 at 00:19:29Z and 00:19:37Z. InSection VI an analysis of the descent rate of MH370 basedon the last two BFO values is presented. This analysis deriveslower and upper bounds on the descent rate at 00:19:29Z and00:19:37Z. Conclusions are presented in Section VII.
II. TIMELINE OF EVENTS DURING THE ACCIDENT FLIGHT
A comprehensive description of the events occurring duringthe MH370 accident flight is provided in [6]. A summary ofsalient events to this article is provided in Table I.
III. REVIEW OF SATCOM MODEL
The accident aircraft was fitted with a SATCOM terminalthat used the Inmarsat Classic Aero system [1], which usesgeosynchronous satellites to relay messages between aircraftand ground stations. During the flight, messages were passedbetween the aircraft and a ground receiving station locatedin Perth, Australia, via the Inmarsat-3F1 satellite. Figure 1illustrates the SATCOM system in use during the flight. Theaircraft is referred to as the Aircraft Earth Station (AES) andthe ground receiving unit is referred to as the Ground EarthStation (GES). Inmarsat-3F1 is a satellite in geosynchronousorbit at 64.5◦ East longitude and it was used exclusively forthe duration of the flight.
An AES is equipped with an SDU comprising a satellitemodem with auxiliary hardware and software. Transmissionof data over the satellite is via bursts which are sched-uled to arrive at the GES at a specified time and a givenfrequency. As explained in [2], [1], communications frommultiple users are coordinated by the allocation of differenttime and frequency slots to each user. This is done withoutknowledge of individual AES locations or precise knowledgeof the satellite location. Therefore, messages from a given AESmight not arrive at the GES at exactly the expected time, andgenerally would arrive slightly later. The difference betweenthe expected time of arrival (based on a nominal assumedposition for the satellite and the AES) and the actual time ofarrival is referred to as the Burst Timing Offset (BTO). The
BTO is a measure of how far the aircraft is from the sub-satellite position2.
The relative velocity between the satellite and the AES, aswell as between the satellite and the GES, leads to a Dopplerfrequency offset on the signals received at the GES. Coupledwith small frequency offsets inherent in the reference fre-quency oscillators in the AES, satellite and GES, this results ina net difference between the expected and actual frequency ofthe signal presented to the modem in the GES for a given user.Frequency compensations applied onboard the aircraft (aircraftinduced Doppler pre-compensation) and at the ground station(Enhanced Automatic Frequency Correction, which utilizes thereference signal transmitted from a reference station in Burum,Netherlands), [2], [1] serve to reduce the possible differencebetween the expected and actual frequency of the messagesreceived from the aircraft. The residual difference betweenthe expected frequency of each communications burst and theactual received frequency is referred to as the BFO.
A. Review of BFO Statistics
Based on 20 previous flights of 9M-MRO in the weekleading up to the accident flight (see [2] for further details),a histogram was produced for the difference between thepredicted BFO (based on known details of the plane andthe satellite’s position and velocity) and the measured BFO(based on Inmarsat ground station logs). This difference (i.e.predicted minus measured) is referred to as the BFO error. Thehistogram of the BFO error is shown in Fig. 2, along with aGaussian distribution fit line. It can be seen that the distributionis somewhat Gaussian. The standard deviation of the BFOerror was found in [2] to be 4.3 Hz. Whilst it is reasonable toapply bounds on the possible BFO error based on ±3 standarddeviations as was done for the approximate analysis describedin [7], for the purpose of the descent analysis presented laterin Sec. VI, it is assumed the BFO error is strictly bounded onthe larger interval [−28,+18] Hz, which corresponds to thebounds of all 2501 observed valid3 in-flight BFO error valuesavailable from the preceding 20 flights of 9M-MRO.
IV. EFFECTS OF AIRCRAFT POSITION AND VELOCITY ONTHE BURST FREQUENCY OFFSET
A. Mathematical Description of the BFO
In [2], the BFO is defined mathematically at time step kas the sum of a noiseless component hBFOk and a scalar wBFO
k
that represents the BFO noise. The noiseless component of theBFO is defined in [2] as the sum:
hBFOk (xk, sk) = ∆F upk (xk, sk) + ∆F down
k (sk)
+δf compk (xk) + δf satk (sk)
+δfAFCk (sk) + δfbiask (xk, sk) , (1)
where• xk denotes the state vector of the aircraft;• sk denotes the state vector of the satellite;
2The sub-satellite position is the point on the earth directly below thesatellite.
3One outlier was removed as explained in Sec. V.

3
TABLE ITIMELINE OF EVENTS DURING MH370
Date and Timestamp(s) Description Comments
7 Mar. 2014 16:42Z MH370 departs Kuala Lumpa Airport Normal take-off
Last ACARS transmission 7 Mar. 2014 17:07Z Everything normal, on path to Beijing
Loss of secondary radar 7 Mar. 2014 17:21:13Z Onboard transponder goes inactive; last civilian radar
7 Mar. 2014 18:22:12Z Last Malaysian military radar contact MH370 shown tracking NW through Malacca Straits
7 Mar. 2014 18:25Z-18:28Z Satellite Data Unit (SDU) log-on sequence If flying level, MH370 still tracking NW
7 Mar. 2014 18:39-18:41Z Unanswered ground-to-air phone call If flying level, MH370 tracking southwards
7 Mar. 2014 19:41Z to 8 Mar. 2014 00:11Z SATCOM metadata approx. hourly from MH370 [1], [2] suggest flight into Southern Indian Ocean
8 Mar. 2014 00:19:29Z-00:19:37Z Partial SDU log-on sequence Implies rapid descent
Fig. 2. Histogram of BFO errors for 20 flights of 9M-MRO prior to MH370(reproduced from Fig. 5.5 of [2]). The mean and standard deviation for thedistribution are 0.18 Hz and 4.3 Hz, respectively [2].
• ∆F upk (xk, sk) is the uplink (aircraft to satellite) Doppler
shift;• ∆F down
k (sk) is the downlink (satellite to ground station)Doppler shift;
• δf compk (xk) is the frequency compensation applied by the
aircraft;• δf satk (sk) is the variation in satellite translation fre-
quency;• δfAFCk (sk) is the frequency compensation applied by the
ground station receive chain;• δfbiask (xk, sk) is a slowly varying bias due to errors in
the aircraft and satellite oscillators and processing in theSDU.
By treating the bias δfbiask (xk, sk) as a constant determinedat the source tarmac for any particular flight, as was done in[2] for MH370, any small time-varying component of the biasduring a particular flight can be considered as part of the BFOnoise (indeed this was done when compiling the results usedto obtain the BFO error histogram shown in Fig. 2). Detailsregarding the terms δf satk (sk) and δfAFCk (sk) are providedin [1]. Tabulated values of the sum of these two terms wereprovided by Inmarsat to the MH370 Flight Path ReconstructionGroup to use in estimating the likely trajectory flown. These
two terms depend on the satellite state sk only, and noton the aircraft state xk. Moreover, the downlink Doppler∆F down
k (sk) does not depend on the location or velocity ofthe aircraft, and can be calculated given the known frequencyof the downlink and the known satellite state at any giventime.
Equation (1) can be then be simplified to:
hBFOk (xk, sk) = ∆F upk (xk, sk) + δf comp
k (xk) + δfdetk (sk) ,(2)
where δfdetk (sk) is effectively a known deterministic value forany time step k. The other terms in (2) couple the aircraft statexk by way of the aircraft position and velocity to the BFO asper the following equations adapted from [2]4:
∆F upk (xk, sk) =
F up
c
(vs − vx)T
(px − ps)
|px − ps|, (3)
δf compk (xk) =
F up
c
(v̂x)T
(p̂x − p̂s)
|p̂x − p̂s|, (4)
where the dependence on the time step k on the right hand sideof the equations has been removed for simplicity of notation.In equations (3) and (4), |·| is the three dimensional Cartesiandistance, and:
• F up is the uplink carrier frequency;• c is the speed of light;• vs is the velocity vector of the satellite;• vx is the velocity vector of the plane;• ps is the position vector of the satellite;• px is the position vector of the plane;• v̂x is the SDU’s estimate of the plane’s velocity vector,
which is obtained using the plane’s track angle andground speed, whilst assuming the vertical speed is zero;
• p̂s is the SDU’s estimate of the position vector of thesatellite, which assumes the satellite is at its nominalorbital slot of 0 degrees North and 64.5 degrees East;
• p̂x is the SDU’s estimate of the position vector of theplane, which is obtained using the plane’s latitude andlongitude, whilst assuming the plane is at sea level.
B. Effect of uncompensated vertical velocity
The vertical speed of the plane is not used in the SDUDoppler compensation. As such, there is a direct contribution
4Note that the sign convention used in [2] is opposite to that used in (3)

4
of Doppler due to the proportion of the vertical velocity vectorprojected onto the radial direction from the aircraft to thesatellite. It is straightforward to understand that if the planewas directly below the satellite, the vertical velocity vectorwould be fully towards or away from the satellite if the planewas climbing or descending. The direct contribution of theDoppler to the BFO in that case would be governed by thefollowing standard Doppler equation.
∆F upk (xk, sk) =
vz · F up
c, (5)
where F up and c are as previously defined, and vz is thevertical speed of the plane. Substituting an uplink frequencyof 1646.6525 MHz (the uplink frequency stated in [1]) anda vertical velocity of 100 feet per minute (fpm), equivalentto 0.508 meters per second, equation (5) implies that thepredicted BFO would increase by 2.8 Hz per 100 fpm of climbrate or decrease by 2.8 Hz per 100 fpm of descent rate if theplane were directly below the satellite. This is the maximumpossible contribution of the plane’s climb or descent rate tothe BFO. In the more general case, equation (5) is moderatedby the sine of the elevation angle θ from the aircraft to thesatellite. This is expressed as
∆F upk (xk, sk) =
vz · F up sin(θ)
c. (6)
As such, at 00:19Z (the time at which the plane crosses the 7th
arc provided by Fig. 3)5, where the elevation to the satellite is38.8 degrees, the contribution to the BFO of climb or descentrate is reduced to approximately +1.7 Hz or −1.7 Hz per100 fpm respectively.
C. Effect of track angle on BFO towards end-of-flight
Another factor that needs to be considered in interpretingthe BFOs at 00:19Z is the track angle of the aircraft. In[2], Fig. 5.6, a set of curves were shown illustrating therelationship of the BFO error and the aircraft track angle at18:39Z. That was done to illustrate that under the assumptionof level flight during the unanswered telephone call periodof 18:39Z-18:41Z, MH370 would have been tracking in asoutherly direction. The same model can be used to examinethe relationship between the BFO error and the track angleat 00:11Z, when MH370 crossed the 6th arc, just 8 minutesprior to the last messages were received from MH370.6 Togenerate the curve of BFO error vs. track angle, it is assumedthat the aircraft crossed this arc at 38.67S, 85.11E. A previoussensitivity analysis has revealed the curve is relatively insen-sitive to the actual crossing point. Also, calculations revealedthat (as shown in Fig. 5.6 of [2] at 18:40Z) the track angleof the aircraft influences the BFO to a greater degree for afaster assumed ground speed. To assess the maximum possibleeffect of track angle on the BFO at 00:19Z, a ground speed of500 kts is assumed, and the BFO error vs. track angle is then
5The arcs referred to in this paper and other MH370 literature are segmentsof the rings in Fig. 3.
6Note that the 6th arc crossing is considered here to isolate effects of groundtrack angle variation as opposed to vertical velocity, since the measured BFOat the 6th arc is still consistent with level flight.
Fig. 3. BTO rings during the MH370 flight [3]. Note that the latitude of thearrows shown for each ring is arbitrary.
Fig. 4. BFO errors as a function of track angle at 00:11Z.
as shown in Fig. 4. Another curve assuming 450 kts groundspeed is shown for comparative purposes. It is noted that thepeak-to-peak variation of the BFO difference is similar forboth considered ground-speeds.
D. BFO Trend During the MH370 Flight
The measured BFOs from 19:41Z to 00:11Z are shown inFig. 5 together with a line-of-best-fit. This line is extendedforward to the time of the 00:19Z log-on resulting in anexpected BFO of roughly 254 Hz7. With reference to the trackangle curves presented in Fig. 4, the 00:11Z BFO error valuefor the southern-most track is roughly 6 Hz, meaning themeasured BFO of 252 Hz was 6 Hz lower than the lowestvalue it could have been (assuming roughly level flight at
7Note the BFOs observed at 00:19Z were much lower than the expectedvalue.
5
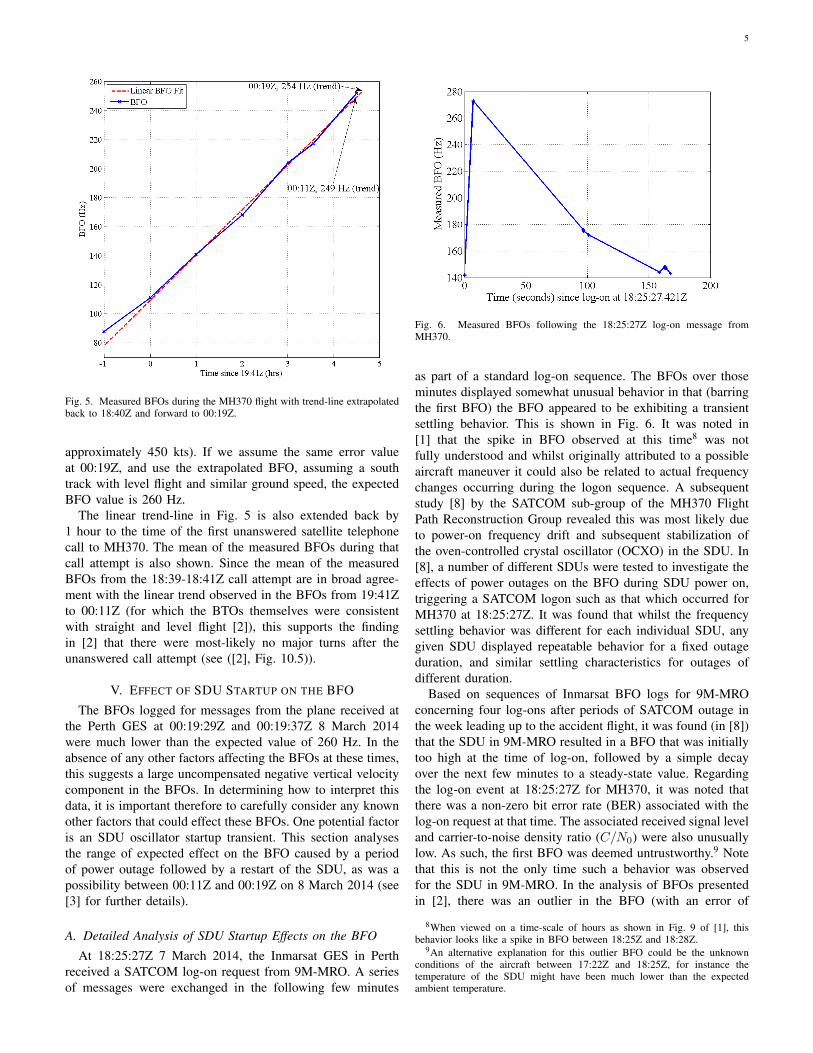
Fig. 5. Measured BFOs during the MH370 flight with trend-line extrapolatedback to 18:40Z and forward to 00:19Z.
approximately 450 kts). If we assume the same error valueat 00:19Z, and use the extrapolated BFO, assuming a southtrack with level flight and similar ground speed, the expectedBFO value is 260 Hz.
The linear trend-line in Fig. 5 is also extended back by1 hour to the time of the first unanswered satellite telephonecall to MH370. The mean of the measured BFOs during thatcall attempt is also shown. Since the mean of the measuredBFOs from the 18:39-18:41Z call attempt are in broad agree-ment with the linear trend observed in the BFOs from 19:41Zto 00:11Z (for which the BTOs themselves were consistentwith straight and level flight [2]), this supports the findingin [2] that there were most-likely no major turns after theunanswered call attempt (see ([2], Fig. 10.5)).
V. EFFECT OF SDU STARTUP ON THE BFOThe BFOs logged for messages from the plane received at
the Perth GES at 00:19:29Z and 00:19:37Z 8 March 2014were much lower than the expected value of 260 Hz. In theabsence of any other factors affecting the BFOs at these times,this suggests a large uncompensated negative vertical velocitycomponent in the BFOs. In determining how to interpret thisdata, it is important therefore to carefully consider any knownother factors that could effect these BFOs. One potential factoris an SDU oscillator startup transient. This section analysesthe range of expected effect on the BFO caused by a periodof power outage followed by a restart of the SDU, as was apossibility between 00:11Z and 00:19Z on 8 March 2014 (see[3] for further details).
A. Detailed Analysis of SDU Startup Effects on the BFO
At 18:25:27Z 7 March 2014, the Inmarsat GES in Perthreceived a SATCOM log-on request from 9M-MRO. A seriesof messages were exchanged in the following few minutes
Fig. 6. Measured BFOs following the 18:25:27Z log-on message fromMH370.
as part of a standard log-on sequence. The BFOs over thoseminutes displayed somewhat unusual behavior in that (barringthe first BFO) the BFO appeared to be exhibiting a transientsettling behavior. This is shown in Fig. 6. It was noted in[1] that the spike in BFO observed at this time8 was notfully understood and whilst originally attributed to a possibleaircraft maneuver it could also be related to actual frequencychanges occurring during the logon sequence. A subsequentstudy [8] by the SATCOM sub-group of the MH370 FlightPath Reconstruction Group revealed this was most likely dueto power-on frequency drift and subsequent stabilization ofthe oven-controlled crystal oscillator (OCXO) in the SDU. In[8], a number of different SDUs were tested to investigate theeffects of power outages on the BFO during SDU power on,triggering a SATCOM logon such as that which occurred forMH370 at 18:25:27Z. It was found that whilst the frequencysettling behavior was different for each individual SDU, anygiven SDU displayed repeatable behavior for a fixed outageduration, and similar settling characteristics for outages ofdifferent duration.
Based on sequences of Inmarsat BFO logs for 9M-MROconcerning four log-ons after periods of SATCOM outage inthe week leading up to the accident flight, it was found (in [8])that the SDU in 9M-MRO resulted in a BFO that was initiallytoo high at the time of log-on, followed by a simple decayover the next few minutes to a steady-state value. Regardingthe log-on event at 18:25:27Z for MH370, it was noted thatthere was a non-zero bit error rate (BER) associated with thelog-on request at that time. The associated received signal leveland carrier-to-noise density ratio (C/N0) were also unusuallylow. As such, the first BFO was deemed untrustworthy.9 Notethat this is not the only time such a behavior was observedfor the SDU in 9M-MRO. In the analysis of BFOs presentedin [2], there was an outlier in the BFO (with an error of
8When viewed on a time-scale of hours as shown in Fig. 9 of [1], thisbehavior looks like a spike in BFO between 18:25Z and 18:28Z.
9An alternative explanation for this outlier BFO could be the unknownconditions of the aircraft between 17:22Z and 18:25Z, for instance thetemperature of the SDU might have been much lower than the expectedambient temperature.

6
-170 Hz) found to have occurred for a SATCOM messageassociated with 9M-MRO in one of the 20 previous flights of9M-MRO. This was discarded as an outlier and not presentedin [2]. It too had a non-zero BER and a low C/N0 (37.6 dBHzcompared to surrounding values between 41.5 and 42 dBHz).With the removal of the untrustworthy BFO logged for the firstmessage in the sequence shown in Fig. 6, the 18:25Z log-onfrom MH370 was also determined to follow the simple decaytrend observed in other instances.
It was noted by DST Group that if the simple BFO decaytrend established after SDU power-up [8] also occurred duringthe MH370 SATCOM log-on event beginning at 00:19:29Z,then it would allow bounds to be established on the BFO thatwould have been expected for MH370 if the plane was flyinglevel at that time. This in turn would allow the determinationof bounds on the possible descent rates of MH370 duringthat final log-on event. In order to build confidence that thesimple BFO decay trend would hold for the 00:19Z log-onevent, DST Group reviewed additional Inmarsat logs for 9M-MRO, corresponding to the period 22 February to 28 February2014. Two additional cases were identified in which 9M-MRO logged back onto an Inmarsat satellite after a sustainedperiod of SATCOM outage. The sequence of BFOs observedin these two cases, along with the five already considered bythe SATCOM working group in [8], are shown in Fig. 7, anddetails about each of the log-ons are given in Table II.
The periods of SATCOM outages followed by log-on eventswere identified from Inmarsat-provided ground-station logs byidentifying sequences of three or more unsuccessful log-oninterrogations to 9M-MRO (suggesting the SDU was likelypowered off) followed by a log-on to the satellite systeminitiated from 9M-MRO at some later time. The exact durationof the power-off period for the SDU was unable to bedetermined from the logs, however the timestamps associatedwith the unsuccessful log-on interrogations and subsequent9M-MRO initiated log-ons were used to determine bounds onthe outage time as shown in the 3rd column of Table II.10
Additional comments about each log-on sequence are givenin the final column. Whilst some of the BERs for log-ons 1and 6 were non-zero, the BFOs did not appear to be outliers,and were therefore considered valid. The uncertainty windowin the length of the outage durations shown is roughly 60minutes; this relates to timers in the Inmarsat satellite groundstations that result in a log-on interrogation being sent to theplane after roughly 60 minutes of SATCOM inactivity. Indeed,it is this same timing responsible for the roughly 60 minuteseparation between the four BTO arcs from 19:41Z to 22:41Z(e.g. [3], [1]). It is also of note that based on other evidencerelated to MH370 (e.g. secondary radar transponder loss ofsignal at 17:22Z) that SDU power was probably first lost at17:22Z, in which case the SDU power outage duration forlog-on 7 would be approximately 63 minutes.
For log-ons 3 and 5, there were some points available abouthalf an hour after the log-on in each case (noting the plane was
10Note that the bounds shown are derived under the assumption that theSATCOM outage was exclusively due to a power outage. It is also possiblethat the first part of some outages was due to a blocked line of sight to theInmarsat satellites.
Fig. 7. Measured BFOs for 7 log-ons of 9M-MRO.
on the tarmac for the whole time) that demonstrate the BFOappears to have fully settled to a steady-state value. Log-ons 1to 5 only lasted for less than 1 minute after the log-on requestmessage. The results for log-ons 6 and 7, which had log-onsequences lasting a few minutes suggest a settling behaviorof approximately 3 minutes duration. For all observed log-onsequences, there seems to be a simple decay of BFO over afew minutes after SDU startup and log-on request (see alsoFig. 8). It is therefore possible a similar decay was occurringduring the SDU log-on sequence beginning at 00:19:29Z.
In order to establish what the likely range of steady-stateequivalent BFOs would have been at 00:19Z, it is useful tore-plot the curves from Fig. 7 translated vertically such thatthe log-on acknowledgment has 0 Hz offset. This is done inFig. 8, which has also been zoomed in the time-axis for clarity.
For log-ons 1 to 6, the aircraft was on the ground atan airport. It has been established that the most commonscenario for an on-ground-at-airport log-on after sustainedpower outage of the SDU is for the AES to use a different self-Doppler compensation method than was in use for log-on 7and the log-on at 00:19Z. This is due to a lack of navigationalinput data from the aircraft’s inertial navigation unit in the fewminutes after power-up, and is referred to as the closed-loopDoppler compensation approach.11
The standard AES Doppler compensation mode when nav-igational data is available to the SDU is the mode used forlog-on 7 and the log-on at 00:19Z. This approach was brieflydescribed in Sec. IV-A. It used the aircraft’s own estimates ofits position and horizontal velocity to predict and correct theAES contributed Doppler shift. This is referred to as open-loopDoppler compensation.
For log-ons 1 to 6, we work on the premise that closed-loopDoppler compensation was used.12 In that approach, the fre-quency of broadcast P-channel transmissions received by 9M-
11The use of closed-loop Doppler compensation in this circumstancewas established in consultation with members of the MH370 Flight PathReconstruction Group, including representatives from Thales and Inmarsat.
12Previous analysis had not considered the difference in Doppler compen-sation mode, yet still resulted in similar descent rates to those presented inthis paper.

7
TABLE IIDETAILS OF LOG-ON SEQUENCES USED FOR ANALYSIS
Identifier Date and Timestamp of Log-on Duration of Preceding Power Outage Any Other Comments
Log-on 1 23rd Feb. 23:57Z Between 381 and 442 minutes After scheduled A1 maintenance check, some non-zero BERs
Log-on 2 26th Feb. 14:11Z Between 295 and 354 minutes
Log-on 3 5th Mar. 03:06Z Between 35 and 95 minutes
Log-on 4 6th Mar. 13:29Z Between 43 and 103 minutes
Log-on 5 6th Mar. 15:02Z Between 35 and 92 minutes
Log-on 6 7th Mar. 12:50Z Between 228 and 288 minutes Some non-zero BERs
Log-on 7 7th Mar. 18:25Z Between 20 and 78 minutes First point untrustworthy
Fig. 8. Decay in measured BFOs for 7 log-ons of 9M-MRO. The decay ratesfor log-ons 1 to 6 have been adjusted to account for the different AES Dopplercompensation mode used during these log-ons.
MRO were used to determine the AES Doppler contribution.In this approach, all of the difference between the receivedand expected P-channel frequency is attributed by the SDU tobe caused by AES motion induced Doppler. As such, if theOCXO frequency is higher than its nominal settled value, dueto incomplete temperature stabilization, the received frequencywill appear lower than expected by the corresponding amount.When applying the AES Doppler compensation in this case,the transmit frequency is increased by the difference betweenthe stable and pre-stabilized oscillator frequency (scaled toaccount for the difference between P-channel frequency andthe R-channel transmit frequency). Moreover, the transmitfrequency itself (prior to AES Doppler compensation) willalready be too high by the same amount due to the incompletetemperature stabilization. The net combined effect to the BFOdecay observed due the OCXO settling will therefore be dou-bled compared to the case where open-loop AES Doppler pre-compensation is used. Hence, the BFO decay results for log-ons 1 to 6 shown in Fig. 8 have been halved for the analysiswhen compared to those inferred from the raw measured BFOspresented in Fig. 7.
Recall that the two messages at 00:19:29Z and 00:19:37Zare a log-on and log-on acknowledgment respectively. Fromthe data used to plot Fig. 8, it can be determined that thelog-on acknowledgment BFOs are in the range of [0,6] Hz
lower than the log-on BFOs. Also the maximum differencebetween the log-on BFO and the settled BFO value is in therange [17,136] Hz. The only log-on that doesn’t appear to beapproaching a settled value in this range is log-on 1, for whichit is anticipated that if more data points were available severalminutes later, as was the case for log-ons 3, 5, 6 and 7, thesettling behavior would be similar to that for log-ons 6 and 7,bearing in mind the outage duration for log-on 1 is probably atleast 381 minutes, and the BFO already dropped substantiallyin the first 30 seconds after log-on.
B. Summary of SDU Startup Effects on the BFO
It is likely that the SDU in 9M-MRO lost power sometimeafter 00:11Z, and then regained power (presumably due toAuxiliary Power Unit (APU) startup) prior to 00:19Z, leadingto the SDU making the log-on attempt at 00:19:29Z. Previoussuch events for 9M-MRO have shown that this results in aninitially too-high BFO for the log-on message, followed by asimple decay characteristic to reach a steady-state BFO afterseveral minutes. In order to establish the relevance of the BFOsat 00:19:29Z and 00:19:37Z to the motion (including descentrate) of MH370 at those times, this section has establishedbounds for the likely range of steady-state equivalent BFOsat those times. This was done by analyzing BFOs from sevenprevious SDU start-up events for a period of several minutes.The specific results obtained suggest that:
1) The recorded BFO for the 00:19:29Z log-on was be-tween 17 and 136 Hz higher than it would have beenif the OCXO in the SDU was in a steady state at thattime;
2) The recorded BFO for the 00:19:37Z log-on acknowl-edge message was between 17 and 130 Hz higher thanit would have been if the OCXO in the SDU was in asteady state at that time.
VI. BOUNDING THE DESCENT RATES OF MH370
The results from Sections IV and V can be combined toprovide bounds on the descent rate of MH370 implied by theBFOs from the two last SATCOM messages for the flight. Inthis section, it is shown how this is done for two differentpossibilities that could explain the attempted SATCOM log-on from 9M-MRO at 00:19Z. In [3] the most likely causeof this log-on was stated to be a power interruption resultingfrom insufficient fuel and subsequent engine flameout. It could

8
also have been due to a temporary software failure, a loss ofsystems providing critical input to the SDU, or a loss of theSATCOM link due to aircraft attitude being such that the line-of-sight to the satellite is blocked. If it was indeed a powerinterruption to the SDU caused by loss of fuel and subsequentreboot using the APU, the SDU would be without power forabout one minute. In this case, the results of Sec. V-B needto be considered when interpreting the last two BFOs.13 Ifon the other hand, the power loss was momentary (resultingin a reset of the SDU) or if the temporary SATCOM outageleading to the log-on request was due to one of the other listedreasons, there would be no “warm-up drift” to consider, so theresults of Sec. V would not need to be applied. Both cases areconsidered separately in the following two sub-sections, andthen combined overall bounds are presented.
A. Hypothesis 1: SATCOM outage due to insufficient fuelIn the event that the SDU log-on at 00:19:29Z was due
to engine flame-out, followed by a restart of the SDU usingpower from the APU, the SDU outage preceding the log-onwould have lasted about one minute. This would result in somecooling of the OCXO in the SDU. The likely effect of theSDU startup and consequent ‘warm-up drift’ of the OCXO issummarized in Sec. V-B. Table III presents the recorded BFOsand bounds on the adjusted BFOs to remove these effects ofwarm-up drift. In the last column of the table, the boundsare extended taking into account the BFO noise bounds of[−28,+18] Hz established in Sec. III-A.
As established in Sec. IV-B, the recorded BFO would beroughly 1.7 Hz lower for every 100 fpm of descent rate. Assuch, depending on whether the plane was tracking South orNorth (minimum or maximum expected BFOs, respectively,see Sec. IV-C), bounds on the descent rate of MH370 atthe times of transmission corresponding to the last 2 BFOscan be determined by subtracting the values given in therightmost column of Table III from the expected BFO valuesfor level flight tracking South or North, dividing the resultby 1.7 Hz and multiplying by 100 fpm. The expected BFOfor a south track is approximately 260 Hz, whilst for anorth track it is close to 280 Hz. Using these numbers, it isstraightforward to obtain the bounds shown in Table IV. Notethat the bounds have been rounded to the nearest 100 fpm.Looking at all values in the table, it can be concluded thatirrespective of ground track angle and for assumed groundspeeds less than approximately 500 kts, under Hypothesis 1,MH370 would have been descending at between 3,900 and14,800 fpm at 00:19:29Z, and just 8 seconds later at between14,800 and 25,300 fpm. These descent rates are consistentwith simulations of an uncontrolled phugoid descent reportedin [7].
B. Hypothesis 2: SATCOM outage due to some other reasonIt is still of interest to determine bounds on the descent
rates under the alternate hypothesis that something else not
13Given the relatively short duration of the power-loss under Hypothesis1, it is possible that the extent of BFO decay due to OCXO warm-up wouldbe less than shown for log-ons 1 to 7. This is essentially covered withinHypothesis 2, which considers a momentary SATCOM outage.
associated with a power outage led to the SDU-initiated log-on event at 00:19Z. In this case, the warm-up drift would notapply. Therefore, the recorded BFOs can be treated normally(though still subject to BFO noise). In this case, the BFObounds are as set out in Table V. Using these bounds, the lowerand upper descent rates can be calculated again, resulting inthe bounds presented in Table VI. It can be concluded fromthe table that the recorded BFOs indicate that at 00:19:29Z theplane was descending at between 2,900 fpm and 6,800 fpm. Atthe time of the last SATCOM message, it can be concludedunder Hypothesis 2 that the descent rate would have beenbetween 13,800 fpm and 17,600 fpm.
C. Summary of Descent Rate Bounds
Combining the descent rate bounds for Hypotheses 1 and 2,outer bounds can be established for the descent rate of MH370at 00:19:29Z and 00:19:37Z. Specifically, regardless of groundtrack angle and for ground speeds less than approximately500 kts, accounting for possible BFO noise, and regardlessof whether the SATCOM outage between 00:11Z and 00:19Zwas due to an SDU power outage or another reason, the outerbounds on the possible descent rates at the times of the lasttwo SATCOM messages from MH370 are given in Table VII.
D. Estimated Downwards Acceleration
When interpreting the bounds presented in Table VII, thedifferent conditions under which each bound was derived needto be considered. For instance the lowest rate at 00:19:29Z wasderived assuming no period of SDU outage and a southwardstrack, whereas the highest descent rate for 00:19:37Z wasderived assuming a one minute outage of the SDU with themaximum BFO decay observed in the previous 7 SDU outageevents for 9M-MRO. Hence, it would not be reasonable tosay that the plane could have been descending at 2,900 fpmat 00:19:29Z and 25,300 fpm 8 seconds later, which wouldimply a downwards acceleration on the order of 2,800 fpm persecond. Whilst it is not possible to determine a precise accel-eration value, a rough approximation of the average descentrate over those 8 seconds could for instance be taken using themid-points of the bounds at each time, which would result inan average downwards acceleration of 10,700 fpm in 8 secondsor around 1,300 fpm per second, which equates to around 6.7ms−2 or 0.68g, where g denotes Earth’s gravitational constant,which is approximately 9.8 ms−2. It is straightforward to seethat other reasonable methods of estimating the downwardacceleration (such as taking the difference between the twominimum descent rates or the two maximum descent ratesat 00:19:29Z and 00:19:37Z) would yield similar accelerationvalues.
VII. CONCLUSION
This article has discussed in detail all known factors thatcould have influenced the BFOs associated with the lasttwo SATCOM messages received from MH370 at 00:19Z.Lower and upper bounds on its descent rate at this time

9
TABLE IIITHE LAST TWO BFOS FOR MH370 UNDER HYPOTHESIS 1
Timestamp Recorded BFO (Hz) BFO Range if Start-Up Drift Removed (Hz) Extended Range Considering BFO Noise (Hz)
00:19:29Z 182 [46, 165] [28, 193]
00:19:37Z -2 [−132,−19] [−150, 9]
TABLE IVMH370 DESCENT RATES AT 00:19Z 8 MARCH 2014 UNDER HYPOTHESIS 1
Timestamp Min. Desc. Rate, South Track Min. Desc. Rate, North Track Max. Desc. Rate, South Track Max. Desc. Rate, North Track
00:19:29Z 3,900 fpm 5,100 fpm 13,600 fpm 14,800 fpm
00:19:37Z 14,800 fpm 15,900 fpm 24,100 fpm 25,300 fpm
TABLE VTHE LAST TWO BFOS FOR MH370 UNDER HYPOTHESIS 2
Timestamp Recorded BFO (Hz) BFO Bounds With Noise (Hz)
00:19:29Z 182 [164, 210]
00:19:37Z -2 [−20, 26]
were then derived.14 The downwards acceleration over the8 second interval between these two messages was found tobe approximately 0.68g. The derived bounds and approximatedownwards acceleration rate are consistent with simulationsof an uncontrolled descent near the 7th arc as reported in [7].This suggests that 9M-MRO should lie relatively close to the7th BTO arc.
At the time of submission of this paper, MH370 had notbeen located. The search was in indefinite suspension pending‘credible new evidence pointing to a specific location for theplane’. Further efforts in data analysis and in drift modeling oflocated MH370 debris have been conducted and reported (e.g.[9], [10], [7]). Note that the descent analysis from this paperwas used in [7] when considering the width of any potentialfuture search area. Some recent news reports have suggesteda US underwater exploration firm named Ocean Infinity maysoon be launching a renewed search effort for MH370. Thereader should refer to the Australian Transport Safety Bureauwebsite [11] and the general media for updates.
ACKNOWLEDGMENT
The author would like to thank his Defence Science andTechnology Group colleagues Dr. Neil Gordon, Dr. SamuelDavey, Dr. Jason Williams, and Dr. Mark Rutten who workedalongside him as part of the MH370 Flight Path Recon-struction Group, as well as Mr. Balachander Ramamurthyfor his support to the satellite data analysis. Special thanksgoes to Dr. Gerald Bolding, both for his support to thesatellite data analysis and his extensive efforts in reviewing andimproving this article. The author also thanks the many othermembers of the MH370 Flight Path Reconstruction Group,
14The conclusions regarding descent rate have been made taking intoaccount BFO noise bounds, all reasonably feasible ground tracks and speeds,and possible OCXO warm-up drift. It has been implicitly assumed that therewere no otherwise unknown factors that could have affected the last twoBFOs.
which comprised representatives from Inmarsat, Thales, Boe-ing, US National Transportation Safety Board (NTSB), UKAir Accidents Investigation Branch (AAIB), Honeywell, SED,Square Peg Communications Inc., and Panasonic. The grouphas been expertly led by the Australian Transport SafetyBureau (ATSB).
REFERENCES
[1] C. Ashton, A. Shuster Bruce, G. Colledge, and M. Dickinson, “Thesearch for MH370,” The Journal of Navigation, vol. 68, no. 1,pp. 1–22, Oct. 2014. [Online]. Available: http://dx.doi.org/10.1017/S037346331400068X
[2] S. Davey, N. Gordon, I. Holland, M. Rutten, and J. Williams, BayesianMethods in the Search for MH370. SpringerOpen, Aug. 2016.
[3] ATSB, “MH370 Definition of Underwater Search Areas,” AustralianTransport Safety Bureau, ATSB Transport Safety Report, ExternalAviation Investigation AE-2014-054, Aug. 2014.
[4] ——, “MH370 flight path analysis update,” Australian Transport SafetyBureau, ATSB Transport Safety Report, External Aviation InvestigationAE-2014-054, Oct. 2014.
[5] ——, “MH370 search area definition update,” Australian TransportSafety Bureau, ATSB Transport Safety Report, External Aviation In-vestigation AE-2014-054, Dec. 2015.
[6] Safety Investigation Team for MH370, “Factual Information : SafetyInvestigation for MH370,” Ministry of Transport, Malaysia, Tech.Rep. MH370/01/15, 2015. [Online]. Available: http://mh370.mot.gov.my/download/FactualInformation.pdf
[7] ATSB, “MH370 - Search and debris examination update,” AustralianTransport Safety Bureau, ATSB Transport Safety Report, ExternalAviation Investigation AE-2014-054, Nov. 2016.
[8] “Internal study regarding SATCOM ground-station logs,” MH370 FlightPath Reconstruction Group - SATCOM Subgroup.
[9] D. Griffin, P. Oke, and E. Jones, “The search for MH370 and oceansurface drift,” CSIRO, Tech. Rep. EP167888, Dec. 2016.
[10] ——, “The search for MH370 and ocean surface drift - Part II,” CSIRO,Tech. Rep. EP172633, Apr. 2017.
[11] “ATSB website.” [Online]. Available: http://www.atsb.gov.au
Ian D. Holland received the Bachelor of Elec-tronic and Communication Engineering in 2000 anda Ph.D. in wireless telecommunications in 2005,both from Curtin University of Technology, WesternAustralia. Since then he has held positions in theUniversity of Western Australia, the Institute forTelecommunications Research at the University ofSouth Australia, EMS Satcom Pacific and LockheedMartin Australia. Since January 2011, Ian has beenworking as a Research Scientist in Protected SatelliteCommunications at the Defence Science and Tech-
nology Group, Australia.

10
TABLE VIMH370 DESCENT RATES AT 00:19Z 8 MARCH 2014 UNDER HYPOTHESIS 2
Timestamp Min. Desc. Rate, South Track Min. Desc. Rate, North Track Max. Desc. Rate, South Track Max. Desc. Rate, North Track
00:19:29Z 2,900 fpm 4,100 fpm 5,600 fpm 6,800 fpm
00:19:37Z 13,800 fpm 14,900 fpm 16,500 fpm 17,600 fpm
TABLE VIIRANGE OF POSSIBLE MH370 DESCENT RATES AT 00:19Z 8 MARCH 2014
Timestamp Min. Desc. Rate Max. Desc. Rate
00:19:29Z 2,900 fpm 14,800 fpm
00:19:37Z 13,800 fpm 25,300 fpm