The Use of Affinity Propagation to Cluster Socio-economic ... · analysis of large data sets. •...
33
Ryan A. Meier Central Michigan University 2015 IMAGIN Student Paper Competition The Use of Affinity Propagation to Cluster Socio-economic Census Data
Transcript of The Use of Affinity Propagation to Cluster Socio-economic ... · analysis of large data sets. •...

Ryan A. Meier
Central Michigan University
2015 IMAGIN Student Paper Competition
The Use of Affinity Propagation to Cluster Socio-economic Census Data

• Socioeconomic characteristic
• Define the people of the community
• Population
• Age
• Gender
• Race Identity
• Education
• Family Size
• Household Size
• Employment Sector
• Income
• Marital status
• Nativity
• Language Spoken
WHAT COMMUNITIES BEST REPRESENT THE UNITED STATES?
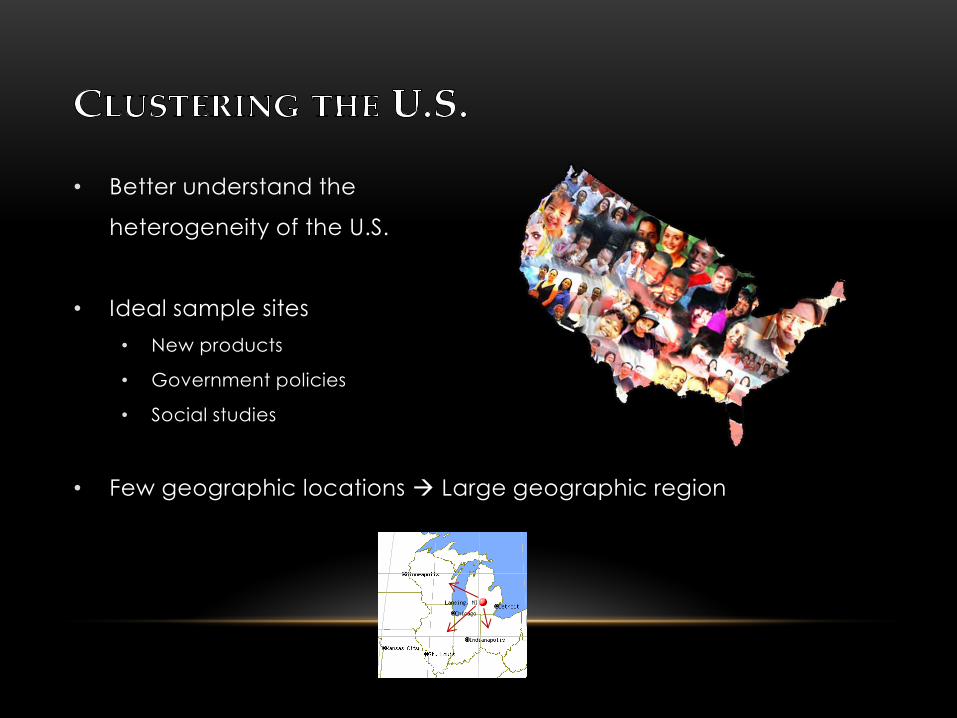
• Better understand the
heterogeneity of the U.S.
• Ideal sample sites
• New products
• Government policies
• Social studies
• Few geographic locations Large geographic region

PREVIOUS STUDIES
Lynd and Lynd (1929) conducted a study to explore the lifestyles within
a customary American community.
Selected Study Site Criteria for location
• U.S. Census Data
• Personal Observation
• Weather
• Population Growth
• Industry
• Artistic Life
• Data mining involves the analysis and extraction of
patterns previously unknown due to the size of the dataset (Kopanakis and Theodoulidis, 2003).
• Developments in data mining and statistical algorithms are
creating solutions to the problem of dealing with large data sets.
DATA MINING & LARGE DATA SETS
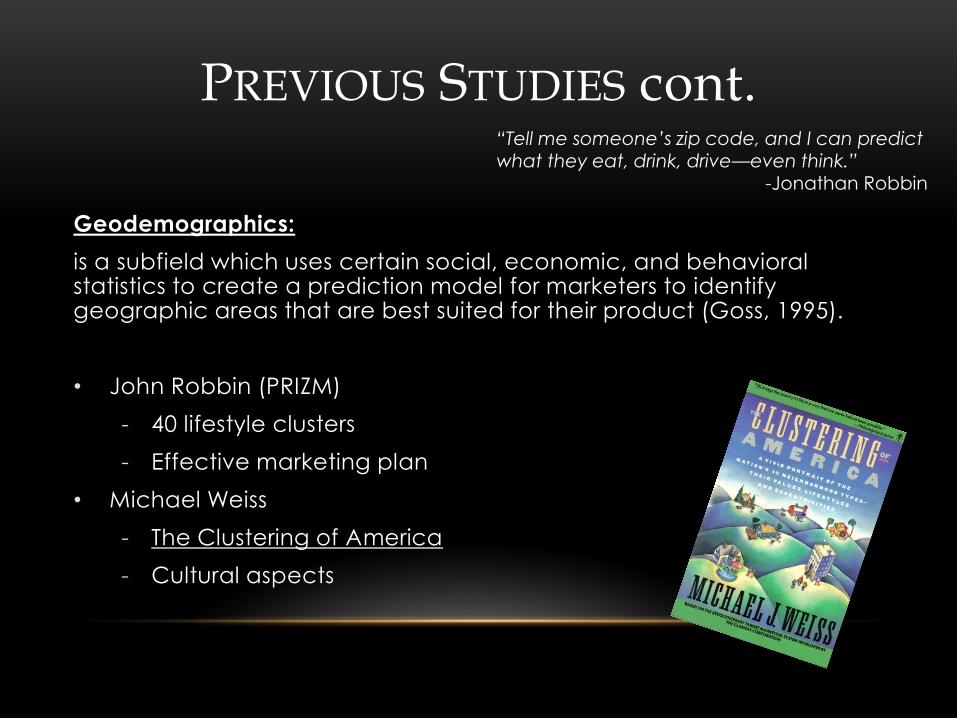
PREVIOUS STUDIES cont.
Geodemographics:
is a subfield which uses certain social, economic, and behavioral statistics to create a prediction model for marketers to identify geographic areas that are best suited for their product (Goss, 1995).
• John Robbin (PRIZM)
- 40 lifestyle clusters
- Effective marketing plan
• Michael Weiss
- The Clustering of America
- Cultural aspects
“Tell me someone’s zip code, and I can predict
what they eat, drink, drive—even think.” -Jonathan Robbin
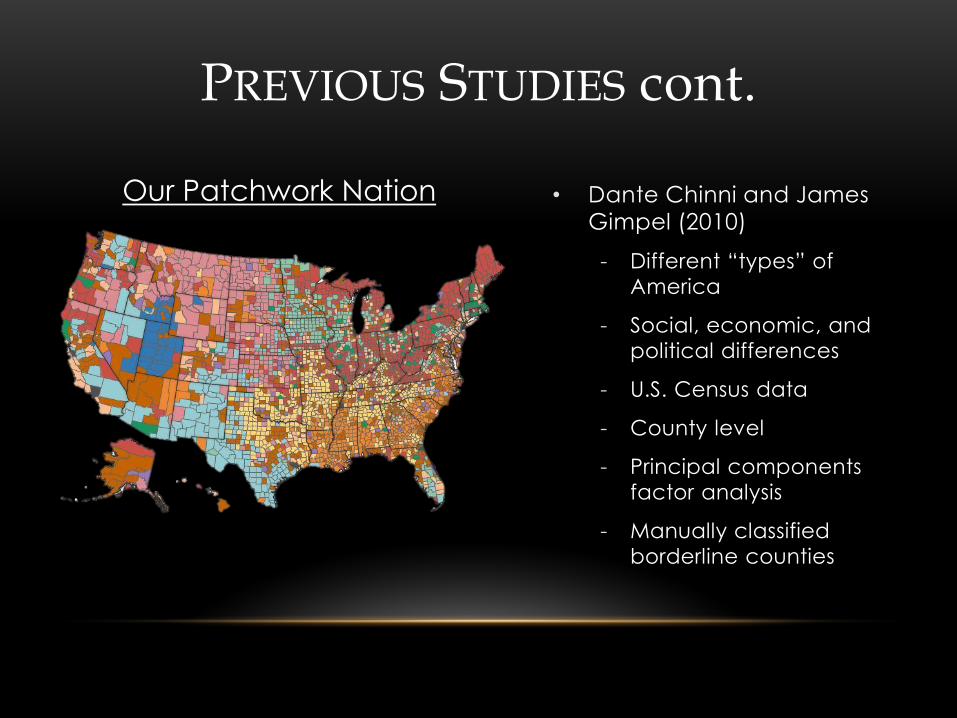
PREVIOUS STUDIES cont.
• Dante Chinni and James
Gimpel (2010)
- Different “types” of
America
- Social, economic, and
political differences
- U.S. Census data
- County level
- Principal components
factor analysis
- Manually classified
borderline counties
Our Patchwork Nation

OBJECTIVE
• Map U.S. census socio-demographic data using affinity propagation to group zip codes into meaningful clusters.
• Identify exemplar locations of the U.S. to be used as ideal sample sites in future research.
• Combine GIS techniques with a novel statistical analysis.
• Demonstrate an objective method for the generalization and analysis of large data sets.
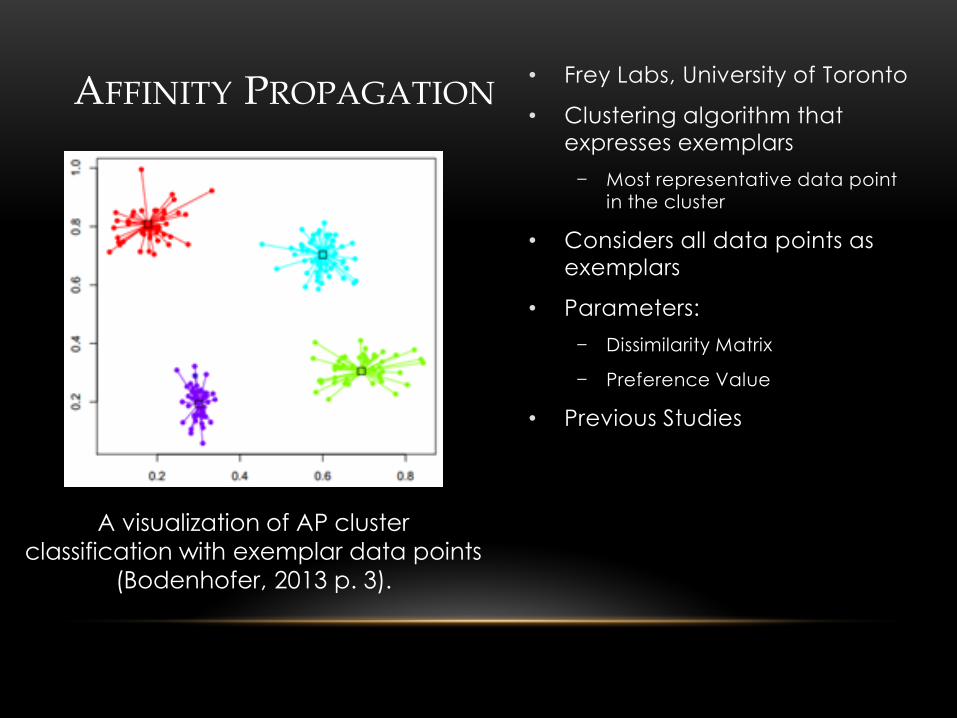
• Frey Labs, University of Toronto
• Clustering algorithm that expresses exemplars
− Most representative data point in the cluster
• Considers all data points as exemplars
• Parameters:
− Dissimilarity Matrix
− Preference Value
• Previous Studies
AFFINITY PROPAGATION
A visualization of AP cluster
classification with exemplar data points
(Bodenhofer, 2013 p. 3).

• Frey Labs, University of Toronto
• Clustering algorithm that expresses exemplars
− Most representative data point in the cluster
• Considers all data points as exemplars
• Parameters:
− Dissimilarity Matrix
− Preference Value
• Previous Studies
− Netflix movies
− Faces
− American Landscapes
AFFINITY PROPAGATION
A visualization of AP cluster
classification with exemplar data points
(Bodenhofer, 2013 p. 3).
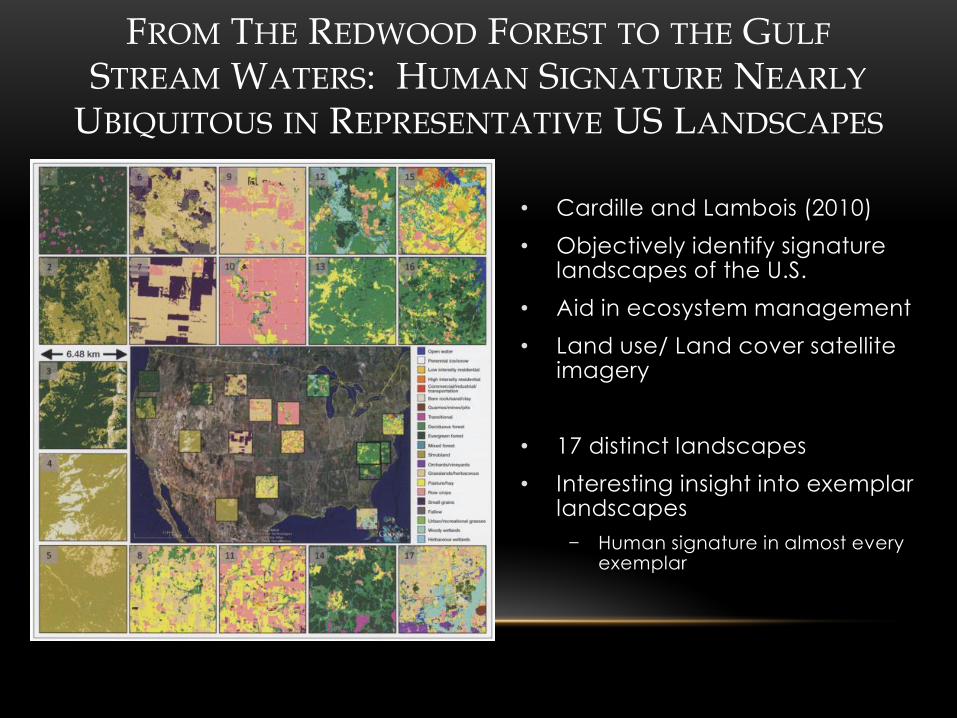
• Cardille and Lambois (2010)
• Objectively identify signature landscapes of the U.S.
• Aid in ecosystem management
• Land use/ Land cover satellite imagery
• 17 distinct landscapes
• Interesting insight into exemplar landscapes
− Human signature in almost every exemplar
FROM THE REDWOOD FOREST TO THE GULF STREAM WATERS: HUMAN SIGNATURE NEARLY
UBIQUITOUS IN REPRESENTATIVE US LANDSCAPES
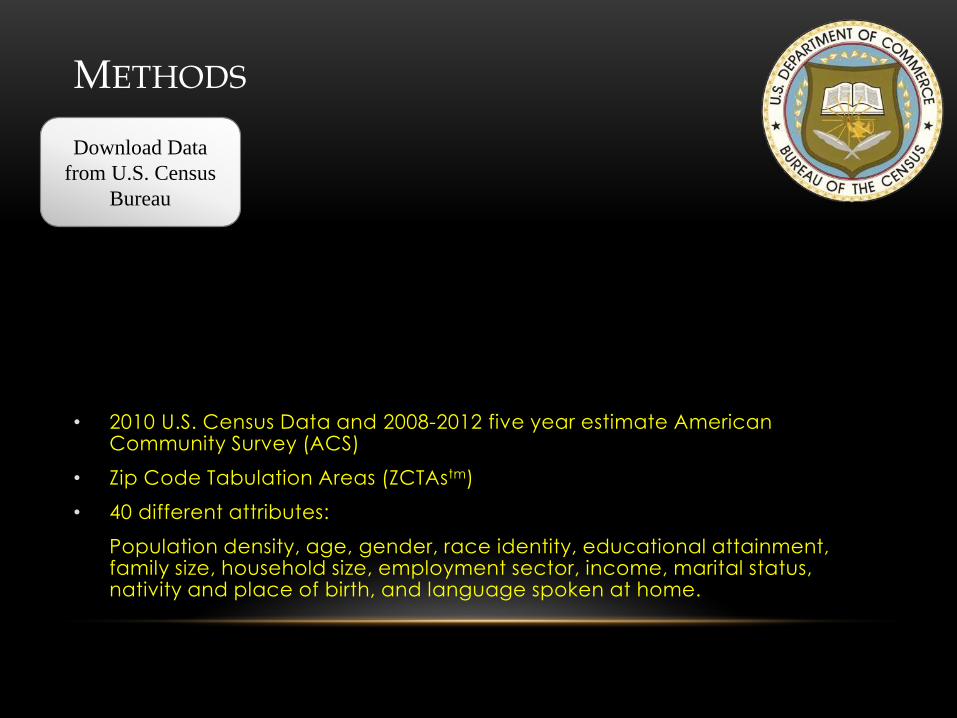
METHODS
• 2010 U.S. Census Data and 2008-2012 five year estimate American Community Survey (ACS)
• Zip Code Tabulation Areas (ZCTAstm)
• 40 different attributes:
Population density, age, gender, race identity, educational attainment, family size, household size, employment sector, income, marital status, nativity and place of birth, and language spoken at home.
Download Data
from U.S. Census
Bureau
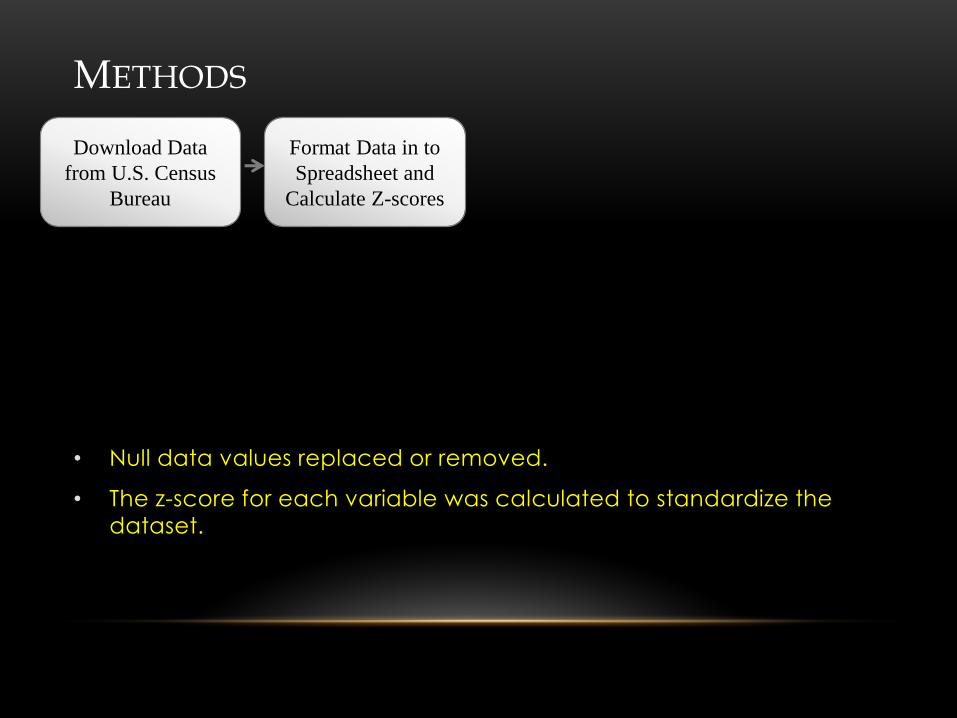
METHODS
• Null data values replaced or removed.
• The z-score for each variable was calculated to standardize the
dataset.
Download Data
from U.S. Census
Bureau
Format Data in to
Spreadsheet and
Calculate Z-scores

METHODS
• Reduced data size by 35% while maintaining 95% of information.
• Eliminated correlated data.
• Increased RAM efficiency.
• Decreased overall running time.
Download Data
from U.S. Census
Bureau
Format Data in to
Spreadsheet and
Calculate Z-scores
Run PCA on Entire
Dataset
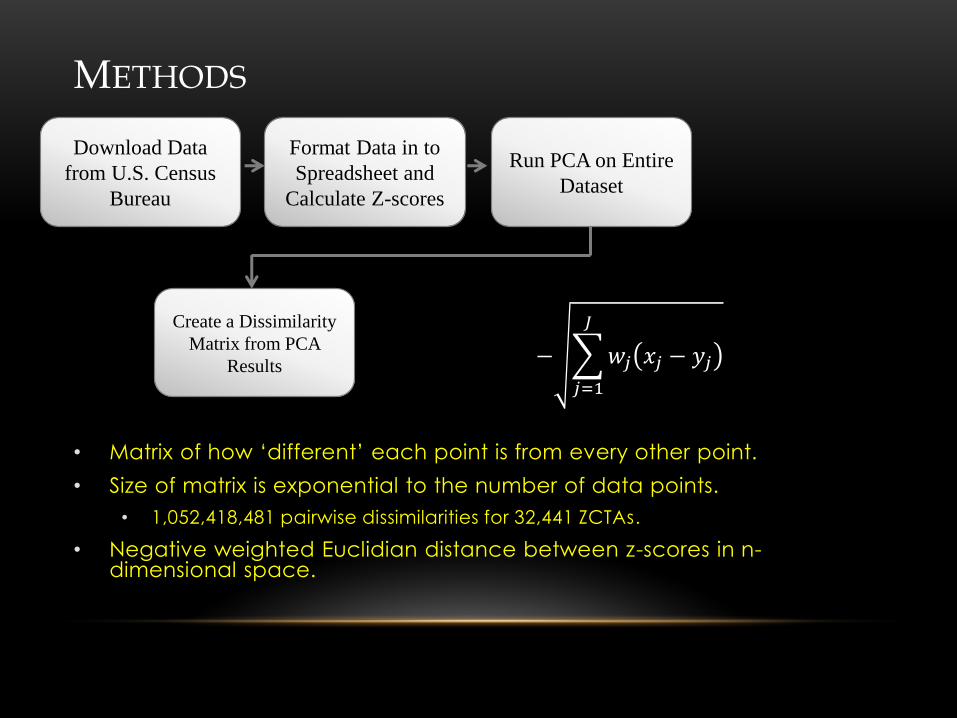
METHODS
• Matrix of how ‘different’ each point is from every other point.
• Size of matrix is exponential to the number of data points.
• 1,052,418,481 pairwise dissimilarities for 32,441 ZCTAs.
• Negative weighted Euclidian distance between z-scores in n-dimensional space.
Download Data
from U.S. Census
Bureau
Format Data in to
Spreadsheet and
Calculate Z-scores
Run PCA on Entire
Dataset
Create a Dissimilarity
Matrix from PCA
Results − 𝑤𝑗 𝑥𝑗 − 𝑦𝑗
𝐽
𝑗=1

METHODS
• R package APCluster (Bodenhofer et al., 2011).
• Approximate run time was 20 hours using 50GB RAM on a 3.5 GHz
current Xeon processor.
• AP runs only on one processor.
Download Data
from U.S. Census
Bureau
Format Data in to
Spreadsheet and
Calculate Z-scores
Run PCA on Entire
Dataset
Create a Dissimilarity
Matrix from PCA
Results
Run AP Using
Dissimilarity Matrix
and Preference Value
from Preliminary Run

METHODS
• Mapped using ArcMap 10.2.
Download Data
from U.S. Census
Bureau
Format Data in to
Spreadsheet and
Calculate Z-scores
Run PCA on Entire
Dataset
Create a Dissimilarity
Matrix from PCA
Results
Run AP Using
Dissimilarity Matrix
and Preference Value
from Preliminary Run
Map Results
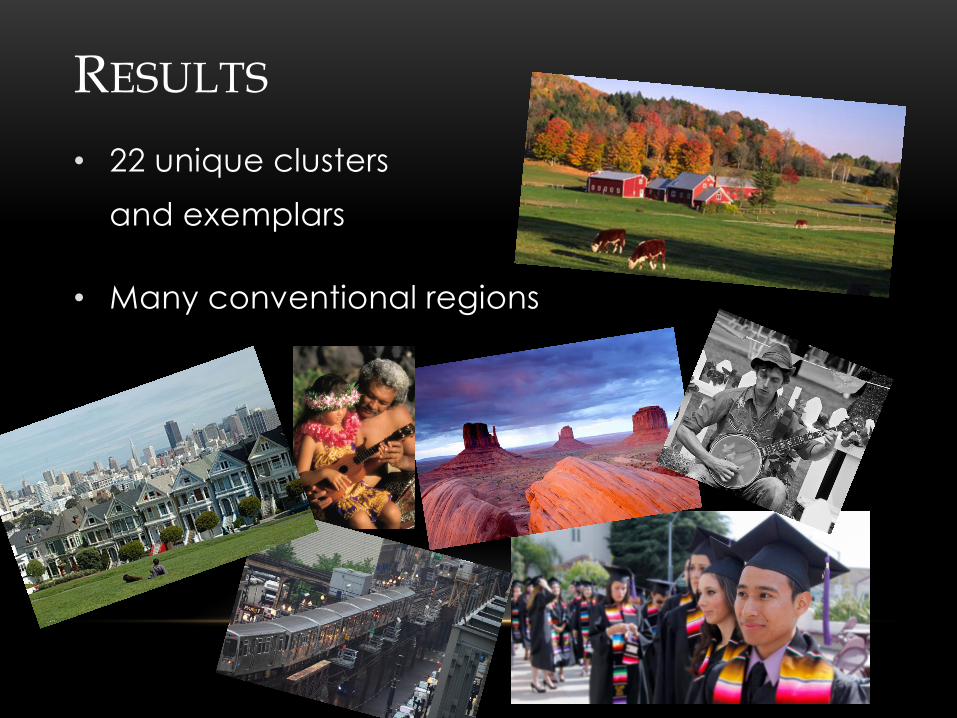
RESULTS
• 22 unique clusters
and exemplars
• Many conventional regions
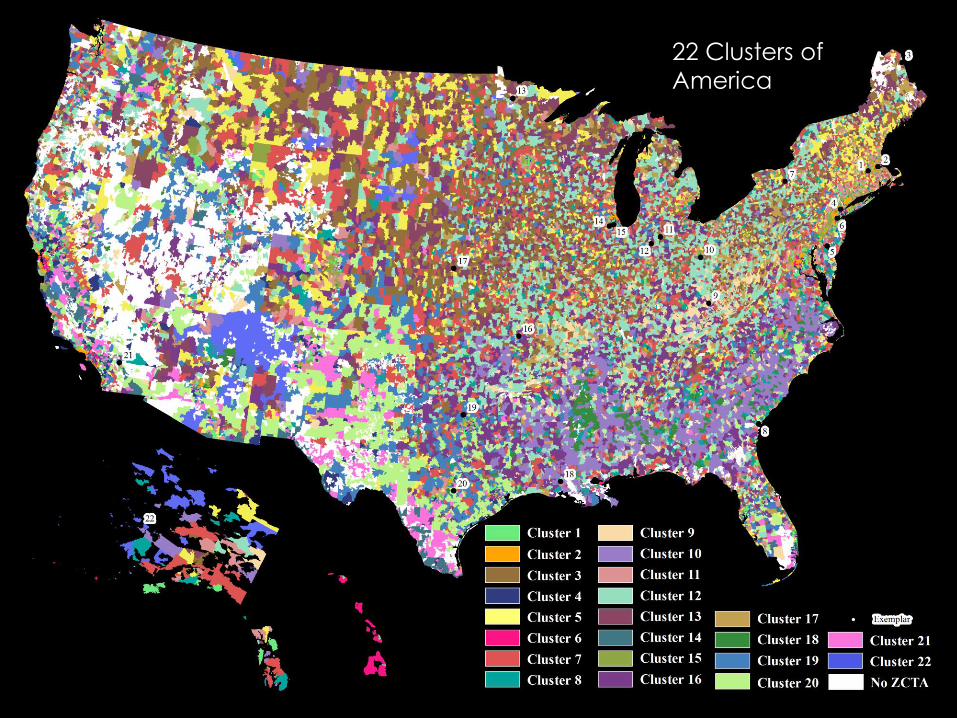
22 Clusters of
America

Cluster 10 & 18 - The South
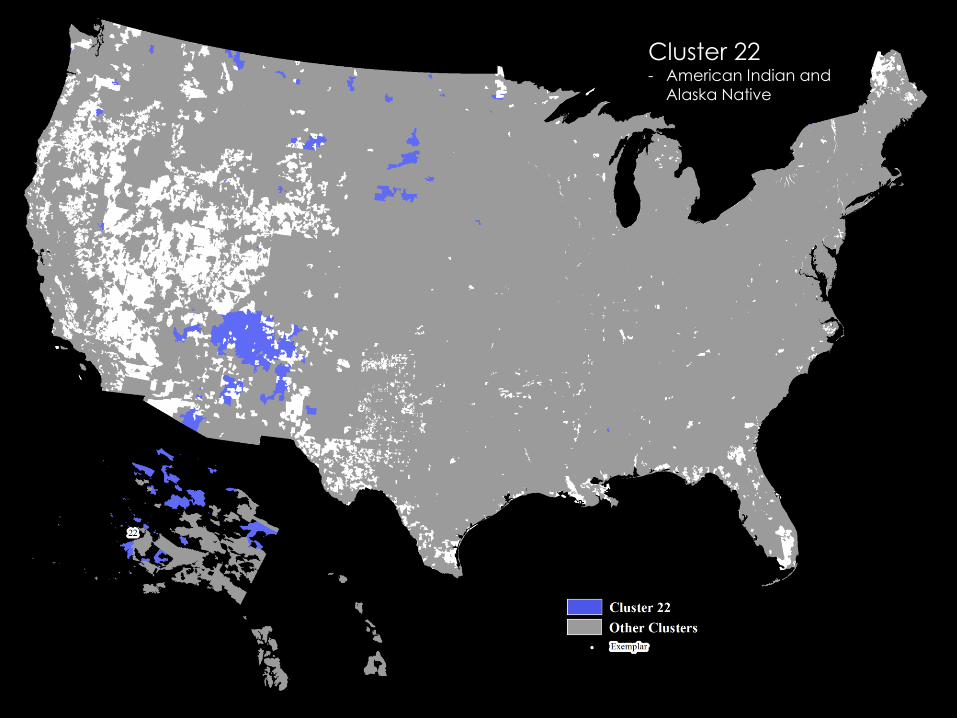
Cluster 22 - American Indian and
Alaska Native
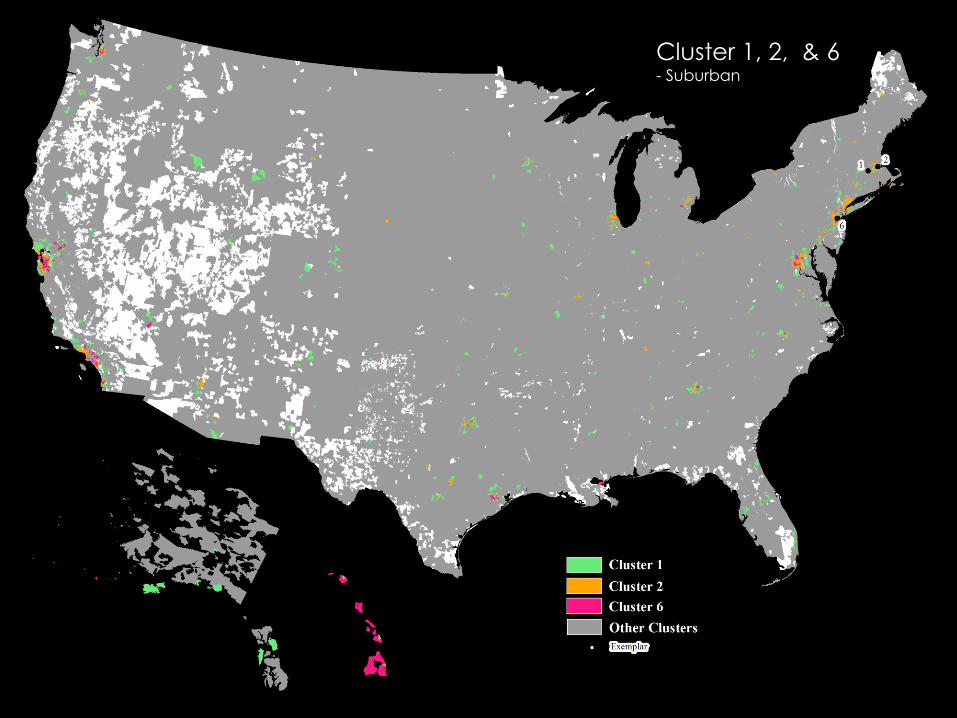
Cluster 1, 2, & 6 - Suburban

Cluster 5, 7, 12, & 13 - Rural Areas
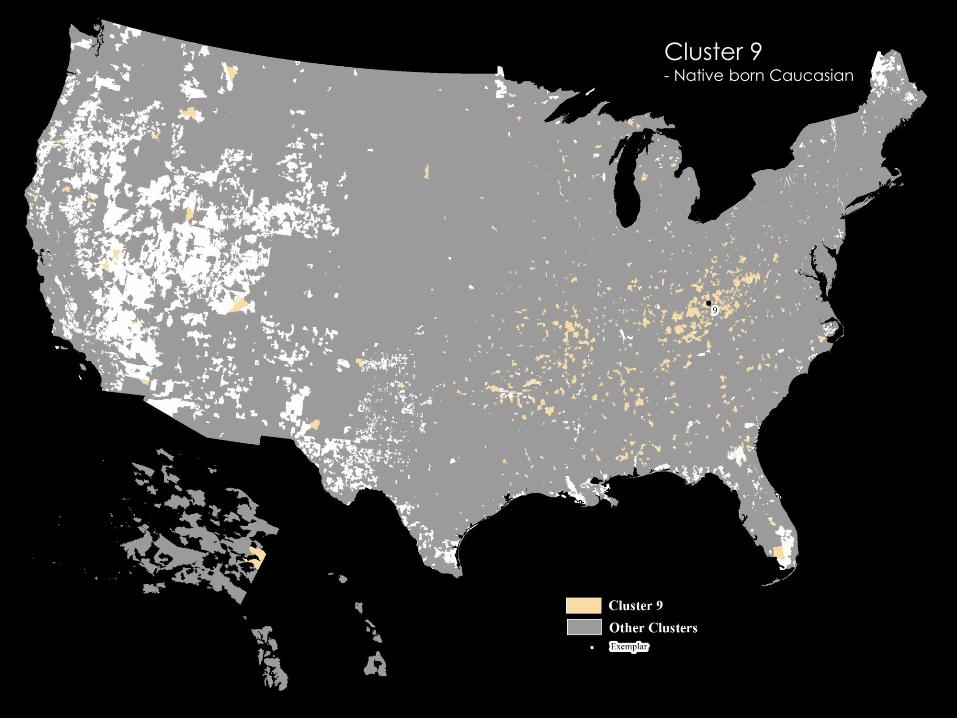
Cluster 9 - Native born Caucasian
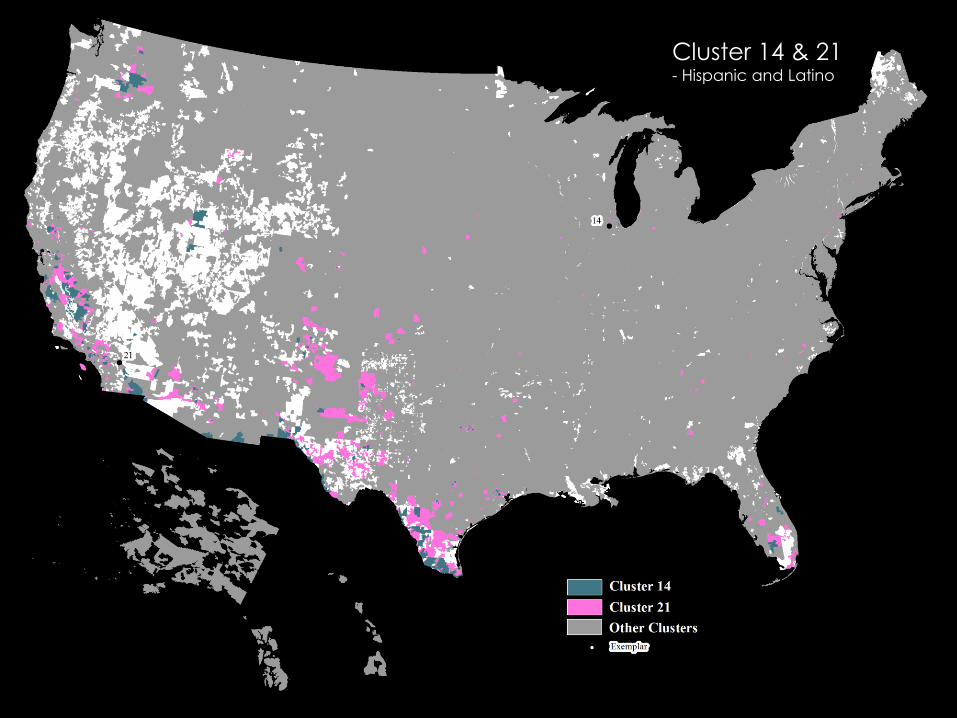
Cluster 14 & 21 - Hispanic and Latino

22 Clusters of
America
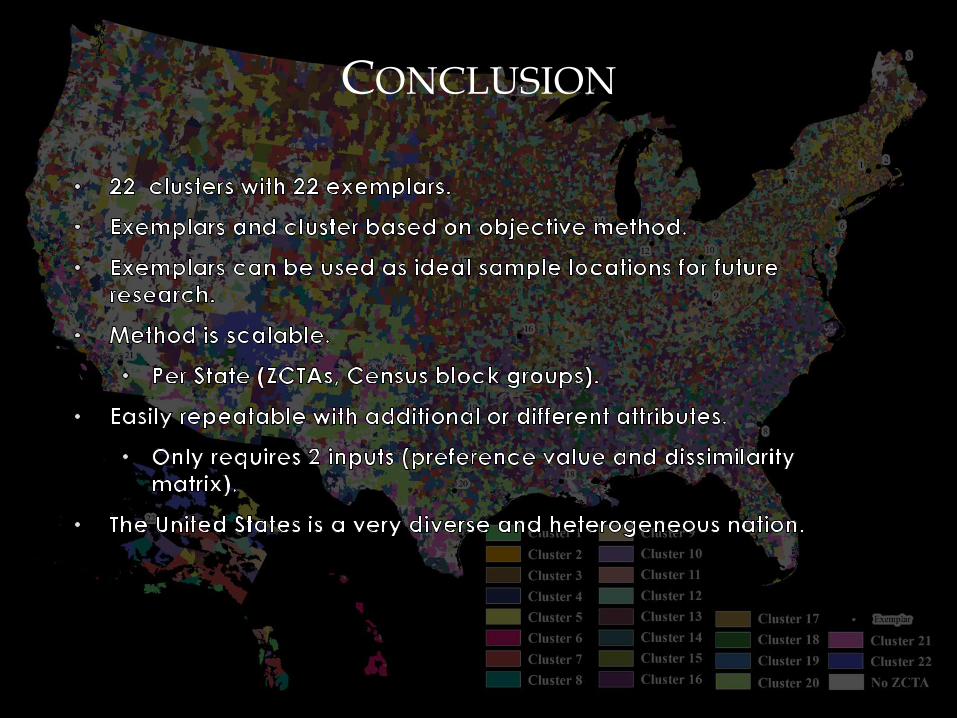
CONCLUSION
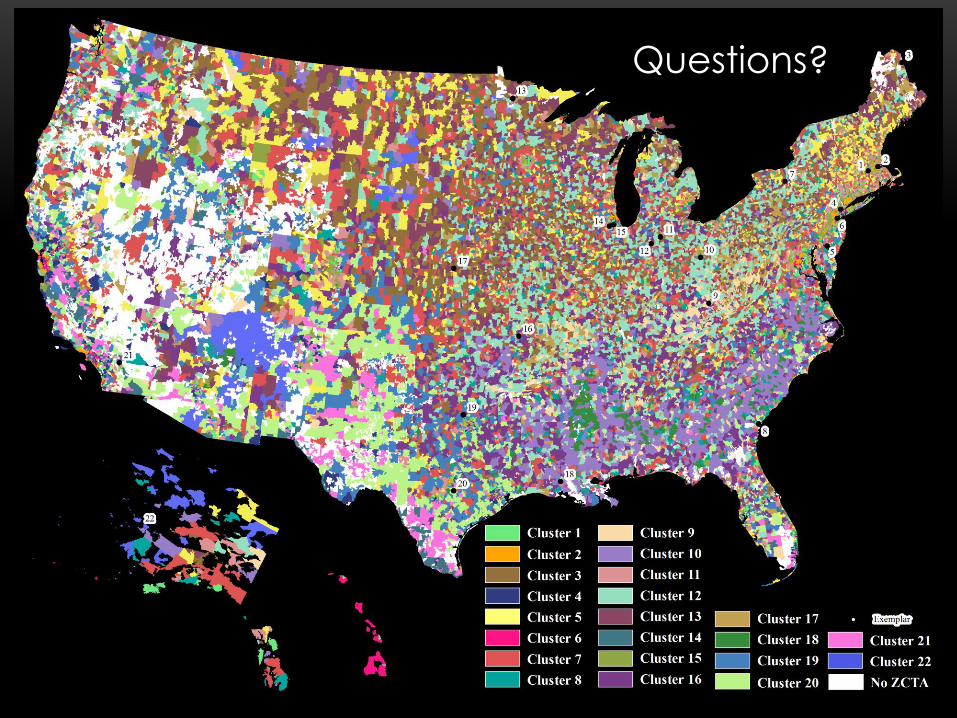
Questions?

REFERENCES
Anderson, M. J. 1988. The American Census: A Social History. New Haven, CT: Yale University Press.
pp. 17-31.
Cardille, J. A., and Lambois, M., 2010. From The Redwood Forest to the Gulf Stream Waters: Human
Signature Nearly Ubiquitous in Representative US Landscapes. In: Frontiers in Ecology
and the Environment, 8(3): pp. 130-134.
Chang, C-J., and Shyue, S-W., 2009. A Study on the Application of Data Mining to Disadvantaged
Social Classes in Taiwan’s Population Census. In: Ecpert Systems with Applications,
36(1): pp. 510-518.
Chinni, D., and Gimpel, J., 2010. Our Patchwork Nation. New York, USA: Penguin Group Inc.
Dueck, D., and Frey, B. J., Feb. 2007. Clustering by Passing Messages Between Data Points. In:
Science 315: pp. 972-76.
Dueck, D., and Frey, B. J., Oct. 2007. Non-Metric Affinity Propagation for Un-Supervised Image
Categorization. In: Proceedings, 11th IEEE International Conference, Rio de Janeiro,
Brazil, Computer Vision, pp. 1-8.
Fan, B., 2009. A Hybrid Spatial Data Clustering Method for Site Selection: The Data Driven Approach
of GIS Mining. In: Expert Systems with Applications, 36(2 part II): pp. 3923-3936.
Furse, D. H., Punj, G. N., and Stewart, D. W., 1984. A Typology of Individual Search Strategies Among
Purchasers of New Automobiles. In: Journal of Consumer Research, 10(4): pp. 417-431.

REFERENCES cont.
Goss, J., 1995. “We Know Who You Are and We Know Where You Live”: The Instrumental Rationality
of Geodemographic Systems. In: Economic Geography, 71(2): pp. 171-198.
Green, P. E., Frank, R. E., and Robinson, P. J., 1967. Cluster Analysis in Test Market Selection. In:
Management Science (pre-1986), 13(8): pp. B387 (14).
Hanson, Sandra L., 2004. Classic Book Reviews: The Past Revived. In: Journal of Marriage and
Family 62, 3: pp. 847-49.
Karimipour, F., Delavar, M. R., and Kinaie, M., 2005. Water Quality Management Using GIS Data
Mining. In: Journal of Environmental Informatics, 5(2): pp. 61-72.
Keim, D. A., Panse, C., and Sips, M., 2003. Visual Data Mining of Large Spatial Data Sets. In:
Databases in Networked Information Systems, 2822: pp. 201-215.
Keim, D. A., Panse, C., Sips, M., and North, S. C., 2004. Pixel Based Visual Data Mining of Geo-spatial
Data. In: Computers & Graphics, 28: pp. 327-344.
Kopanakis, I., and Theodoulidis, B., 2003. Visual Data Mining Modeling Techniques for the
Visualization of Mining Outcomes. In: Journal of Visual Languages & Computing, 14(6):
pp. 543-589.
Lynd, Robert S., and Lynd Helen M., 1929. Middletown. New York, USA: Harcourt, Brace & World, I
nc. pp. 3-9.

REFERENCES cont.
Mennis, J., and Guo, D., 2009. Spatial Data Mining and Geographic Knowledge Discovery—An
introduction. In: Computers, Environment and Urban Systems, 33(6): pp. 403-408.
Murray, C., Kulkarni, S., Michaud, C., Tomijima, N., Bulzacchelli, M., Iandiorio, T., and Ezzati, M., 2006.
Eight Americas: Investigating Mortality Disparities Across Counties, and Race-Counties in
the United States. In: PLoS Medicine, 3(9): pp. 1513-1524.
Slocum, T., McMaster, R., Kessler, F., and Howard, H., 2009. Data Classification. In: Thematic
Cartography and Geovisualization 3rd, Upper Saddle River, NJ: Pearson Education Inc.
pp. 57-75.
Spielman, S. E., and Thill, J-C., 2008. Social Area Analysis, Data Mining, and GIS. In: Computers,
Environment and Urban Systems, 32(2): pp. 110-122.
Weiss, M. J., 1988. The Clustering of America. New York, USA: Harper & Row, Pubishers.
Winkle, K., 1991. The U.S. Census as a Source in Political History. In: Social Science History, 15(4): pp.
565-57.