![Object-oriented Programming with PHP · Object-oriented Programming with PHP [2 ] Object-oriented programming Object-oriented programming is a popular programming paradigm where concepts](https://static.fdocuments.net/doc/165x107/5e1bb46bfe726d12f8517bf0/object-oriented-programming-with-php-object-oriented-programming-with-php-2-object-oriented.jpg)
THE USE OBJECT ORIENTED IMAGE ANALYSIS AUTOMATIC …
54
FACULTY OF SCIENCE AND TECHNOLOGY DEPARTMENT OF SURVEYING AND GEOMATICS THE USE OF OBJECT ORIENTED IMAGE ANALYSIS AUTOMATIC EXTRACTION OF UNPAVED ROADS IN UPDATING ROAD MAPS: A LESSON FOR THE DEPARTMENT OF THE SURVEYOR GENERAL Submitted By ZVATAPIWA MOYO (R131327H) Dissertation submitted in partial fulfilment of the Bachelor of Science Honours Degree in Surveying and Geomatics June 2018
Transcript of THE USE OBJECT ORIENTED IMAGE ANALYSIS AUTOMATIC …

FACULTY OF SCIENCE AND TECHNOLOGY
DEPARTMENT OF SURVEYING AND GEOMATICS
THE USE OF OBJECT ORIENTED IMAGE ANALYSIS AUTOMATIC EXTRACTION
OF UNPAVED ROADS IN UPDATING ROAD MAPS: A LESSON FOR THE
DEPARTMENT OF THE SURVEYOR GENERAL
Submitted By
ZVATAPIWA MOYO
(R131327H)
Dissertation submitted in partial fulfilment of the Bachelor of Science Honours Degree in
Surveying and Geomatics
June 2018

APPROVAL FORM
The undersigned certify that they have supervised the student Zvatapiwa Moyo in a dissertation
entitled, “The use of Object Oriented Image Analysis (OOIA) automatic extraction of unpaved
roads in updating road maps: A lesson for the Department of the Surveyor General”, submitted in
partial fulfillment of the requirements of the Bachelor of Science Honours Degree in Surveying
and Geomatics at the Midlands State University.
………………….……..………………………………………………
SUPERVISOR DATE
………………………………………………………………...
CHAIRPERSON DATE

RELEASE FORM
NAME OF STUDENT ZVATAPIWA MOYO
DISSERTATION TITLE: The use of Object Oriented Image Analysis
(OOIA) automatic extraction of unpaved
roads in updating road maps: A lesson for
the Department of the Surveyor General.
DEGREE TITLE: Bachelor of Science Honours Degree in
Surveying and Geomatics.
YEAR THIS DEGREE WAS GRANTED: 2018
Permission is hereby granted to the
Midlands State University Library to
produce single copies of this dissertation and
lend or sell copies for private, scholarly or
scientific research purpose only. The author
reserves other publication rights. Neither the
dissertation nor the extracts from it may be
printed or otherwise produced without the
author‟s written permission.
SIGNED: .…………………………………………..
PERMANENT ADDRESS: 465 Woodlands
Phase 1
Gweru

1
Acknowledgements
I am using this opportunity to express my gratitude to everyone who supported me throughout
the course of my degree.
I would like to thank Dr. M. Shoko my supervisor. Without your constant support, aspiring
guidance, and encouragement I would have not been able to accomplish this thesis.
I would like to express my heartfelt gratitude to my siblings for all the support they have given
me over the years. Your constant unwavering support was what has sustained me this far.
To all my friends and colleagues I salute you. We fought a good fight comrades.
Above all, I thank the Lord. For all what is impossible with man is possible with God. (Luke 18
verse 27)

2
Dedications
I want to dedicate this thesis to my late mother. You will always be missed, rest in power.

3
Abstract
This paper exhibits a method for extraction of unpaved roads from high resolution Pleiadis
satellite imagery using Object Oriented Image Analysis (OOIA). The study area is Woodlands in
Gweru Zimbabwe. Using ENVI EX, a rule based classification was performed. Classification
rules were made from unpaved roads properties, by utilizing combination between unique
multispectral bands, principal components and also utilizing combination of geometric attributes
like width, length, neighbor and asymmetry and contextual ones. The outcome demonstrates that
the OOIA algorithm effectively extracts unpaved roads from satellite images.

4
Contents
List of figures........................................................................................................................... 6
List of tables ............................................................................................................................ 7
List of Equations ...................................................................................................................... 8
CHAPTER ONE ...................................................................................................................... 9
1.0 Introduction ....................................................................................................................... 9
1.1 Background and Justification .......................................................................................... 10
1.2 Problem definition ........................................................................................................... 11
1.3 Research Questions.......................................................................................................... 12
1.4 Research Objectives ........................................................................................................ 12
1.4.1Main Objective .............................................................................................................. 12
1.4.2 Specific Objectives ....................................................................................................... 12
CHAPTER TWO ................................................................................................................... 13
Literature Review .................................................................................................................. 13
2.1 The basic theory of Remote Sensing ............................................................................... 13
2.2 Paradigm shift of feature extraction (manual-semi-automatic feature extraction) .......... 14
2.3 OOIA versus Pixel based classification ........................................................................... 16
2.4 Unpaved roads attributes ................................................................................................. 18
2.5 Methods for road extraction system ................................................................................ 20
2.7 OOIA feature extraction associated works ...................................................................... 25
CHAPTER THREE ............................................................................................................... 27
Methodology .......................................................................................................................... 27
3.0 Introduction ..................................................................................................................... 27
3.1 Research Design .............................................................................................................. 27
3.2.0 Finding Objects............................................................................................................. 29
3.2.1 Segment Image criteria ................................................................................................. 29
3.2.2 Merge Segments ........................................................................................................... 29
3.2.3 Refining Segments criteria ........................................................................................... 30
3.2.4 Computing Attributes ................................................................................................... 30
3.2.5 Extraction of features .................................................................................................... 31
3.2.6 Rule Based Classification ............................................................................................. 31

5
3.2.7 Export Classification Results........................................................................................ 32
3.2.8 Accuracy Assessment ................................................................................................... 32
Definition of conditions (Validation Matrics) ....................................................................... 34
3.2.9 Methods and material used ........................................................................................... 34
3.3.0 Chapter summary .......................................................................................................... 35
CHAPTER FOUR ................................................................................................................. 36
Results and Analysis .............................................................................................................. 36
4.0 Introduction ..................................................................................................................... 36
4.1 Pre-processing results ...................................................................................................... 36
4.1.1 Study area-region of interest (ROI) .............................................................................. 37
4.1.2 Results of segmentation effects .................................................................................... 38
4.1.3 Results of merging segments criteria ............................................................................ 39
4.1.4 Results of computed attributes and rule based classification. ...................................... 39
4.1.5 Results showing the extracted unpaved roads in various formats. ............................... 40
4.1.6 Accuracy Assessment results ........................................................................................ 43
CHAPTER FIVE ................................................................................................................... 44
5.0 Introduction ..................................................................................................................... 44
5.1 Evaluation ........................................................................................................................ 44
5.1.1 Objective I .................................................................................................................... 44
5.1.2 Objective II ................................................................................................................... 44
5.1.3 Objective III .................................................................................................................. 44
5.2 Conclusion and Recommendations ................................................................................. 44

6
List of figures
Figure 1.Scheme for object-oriented feature extraction.
Figure 2.Rule based classification attributes.
Figure 3.Structure and contents of a confusion matrix.
Figure 4.Stacked bands of the Plaedis Satellite Image.
Figure 5.Spatial subset extents of region of interest (ROI).
Figure 6.Comparison of different segmentation effects.
Figure 7.Comparison of different merging effects.
Figure 8.Output of the rule based classification and rule sets executed.
Figure 9.Extracted unpaved roads in vector line format.
Figure 10.Overlay of line vector format of unpaved roads and the multispectral subset image.
Figure 11. Polygon format of extracted unpaved roads.
Figure 12.Vector line format of extracted unpaved roads.
Figure 13.Overlay of line vector format of unpaved roads and the original subset image of a
panchromatic image.

7
List of tables
Table 1. Confusion matrix of actual and predicted classes by the OOIA algorithm.
Table 2. Corresponding table of confusion, for the unpaved roads class.

8
List of Equations
Equation 1.Merging Algorithm
Equation 2.Elongation formula
Equation 3.Compactness formula

9
CHAPTER ONE
1.0 Introduction Object-based image analysis (OBIA) is one of the most recent innovations in image
classification approaches (Blaschke, 2006). As opposed to the customary pixel-based
techniques situated in light of the thorough analysis of spectral data per-pixel, OBIA
commonly incorporates both spectral and spatial data amid the image segmentation stage.
The procedure includes subdividing the image into homogenous locales with
comprehensively comparative pixels or fragments in view of spectral and spatial qualities,
and after that arranging them progressively into image objects (Benz et al., 2004). When
image objects are made, any classification calculation can be utilized to characterize the
objects. Jensen (2009) investigated that OOIA has the benefits of coordinating more object
related features than pixel-based methodologies, to speed the handling time and diminish the
"salt and pepper" impact on classifications. OOIA also produces maps with higher
accuracies (Wang et al., 2016).
There is a growing interest in spatial information; and this has resulted in a parallel growth
in the use of aerial photogrammetry in topographic mapping. Ongoing advances in computer
vision and machine insight has prompted the improvement of new systems, for example,
OOIA for programmed content extraction of both man-made and natural geospatial objects
from remote detecting of images. The improvement of object- oriented classifications
techniques appropriate for medium to high resolution satellite imagery gives a legitimate
other option to 'conventional' pixel-based techniques.
OOIA, a platform for integration of different types of data (spectral, elevation and thematic),
has officially demonstrated its capacity for effective automatic grouping of landforms (Tapas
Ranjan, 2011). An article published by Badjana et al (2015) states that there is high rate of
changes in urban areas which requires the presence of coordinating geographic data with a
specific end goal to empower legitimate land monitoring and planning. At the point when
cartographic data exists, yet is out-dated, a change detection methodology utilizing advanced
geographic information can be applied for map up-dating. Thus the goal of this work is to
present an OOIA methodology that enables unpaved roads to be ascertained and further
mapped, using Very-High Resolution (VHR) imagery for the betterment of the Department

10
of the Surveyor General (DSG). The features of interest chosen for extraction are unpaved
roads.
1.1 Background and Justification According to an article, by Japan international cooperation agency (2012), the last
topographic maps of the 1:5000 scale for the Harare and its environs were produced in 1985
from aerial photography acquired in 1985. Detail metadata on spatial status particularly huge
scale topographic maps are the spine for sustainable development, for example,
infrastructure, transport systems, crisis administration, power supply, sanitation and
wellbeing. Road systems are essential highlights in geospatial databases. Despite the fact
that high-resolution optical satellite images have just been acquired for over 10 years,
apparatus for computerized extraction of road systems from these images are as yet
uncommon (Context et al., 2016). One consequence of this is the need for manual
interaction which, in turn, is time and cost effective. Likewise geospatial data advancements
have turned out to be basic devices to assist in national and global innovation, monetary
development, decision making and future planning. System of paved roads can be noticeably
depicted in high resolution satellite images, which makes paved roads extraction a simple
assignment. In any case, practically no accentuation has been laid on the extraction of
unpaved roads. Advancement of procedures for the extraction of unpaved roads can be
extremely useful and accommodating in security and reconnaissance (Technology, 2016).
United Nations (2013) brings up that proof is mounting that fast urbanization, particularly in
developing nations, calls for real changes in the manner by which urban advancement is
planned and overseen, and additionally considerable increments of open and private interests
in urban framework and administrations. Roads are a key part of transportation frameworks
and have a place with the foundation of modernization. They are noteworthy in both the
military field and normal everyday living. With the advancement of the remote sensing
innovation, programmed road extraction from remote sensing images has turned into an
essential subject in computerized digital photogrammetry (Wang et al., 2013).
The Department of the Surveyor General is solely responsible for the mapping production
and distribution. Since most of the produced maps are kept in paper format, this has led to

11
the stocks of the maps pilling up and taking much storage space at the stores section. Whilst
they are piling up in cabins, spatial data on the physical ground will be changing rapidly
which in turn renders the archived maps being out- dated. Adopting high technological
instruments such as Unmanned Aerial Vehicles (UAVs) to continuously update the maps at
the DSG is being hindered by financial crisis in the government. This has led the DSG to
resort to affordable methods such as digitizing of roads and road surveys (using confiscated
Computer Aided Drawing software such as SURPAC and AutoCAD) of updating maps.
However these methods being opted for are manual and solely depend on human interaction
with the software to correctly and precisely update maps. Using this background, it is
essentially necessary for the DSG to shift from manual methods to automatic or semi-
automatic methods to improve its cartographic products in terms of accuracy and reliability
at the same time incorporating affordability.
1.2 Problem definition According to Sori (2012), changes to the landscape are constantly occurring both naturally
and human induced. It is fundamental for these progressions to be consistently recognized
and updated for refreshed topographic data keeping in mind the end goal to mirror the
present status of the landscape. Most national maps in Africa are old, obsolete, and to a great
extent exist in manual form. Because of the high cost of aerial photography, these maps have
not been updated for a long time and accordingly are not valuable for planning and routing
purposes. Along these lines, there is an earnest need to create new maps or update existing
ones (Ottichilo, Khamala and Sensing, no date).
Zimbabwe is a developing country. In that same vein of development, roads are rapidly
under construction especially in the rural areas. However mapping of these unpaved roads
has been less considered and no full technological input has been injected into related
projects. The urgent need to update maps is the lack of coherence between the map and
reality hence resulting to bias. Most clients brought in complains that they have accessed
out-dated maps from the DSG posing threats of loss of resources in conducting proper
planning in case of physical land development. The cash stricken department is failing to
hire or train technical people to manually produce highly demanded updated maps. Human
intervention in updating old maps should be shunned as it is costly and susceptible to human

12
error and blunders. In doing so, automatic methods such as OOIA should be adopted
forthwith to precisely update old maps (particularly unpaved road maps) at the DSG in order
to meet the demands of the rapid developments in the country.
1.3 Research Questions
I. Can texture based OOIA technology provide optimum results in delineating unpaved
roads from satellite imagery.
II. Is it possible to differentiate mixed features with similar characteristics using OOA, if
so, to what extent?
1.4 Research Objectives
1.4.1Main Objective To develop a set of rules for application in Object Oriented Image Analysis (OOIA) in updating
the old maps, unpaved roads in particular at the Department of the Surveyor General in
Zimbabwe; Case Study: Woodlands, Gweru.
1.4.2 Specific Objectives I. Performing a rule based classification using ENVI X in extracting unpaved roads
from Pleiadis satellite images.
II. To test the segmenting of an image into regions of pixels based on computed region
attributes for each region.
III. To classify the objects with rule-based classification.
IV. To validate the OOIA algorithm performance.
13
CHAPTER TWO
Literature Review
2.1 The basic theory of Remote Sensing Remote sensing is the science and craft of getting data around an object, area, or phenomenon
through the examination of data procured by a device that is in not contact with the object, area,
or phenomenon under scrutiny. The device is a remote detecting sensor that is worked from
airborne and space borne platforms to help with reviewing, mapping and monitoring the earth's
features (Yan, 2003). Remote detecting sensor procures information of different earth surface
features that radiate and reflect electromagnetic energy, and the information is analyzed to give
data about the resources under scrutiny. All the more as of late, commercial remote detecting
innovations and techniques are presented in transportation practices. Components from satellite
images, for example, roads, railways, drainages, water bodies, vegetation and other curvilinear
structures have been extracted through different systems from satellite images (Wang J. and
Zhang, Q., 2000). Quackenbush (2004) reiterates that the availability of a high resolution satellite
images has offered ascend to extraction of road networks and this has earned much
consideration. Numerous applications ranging from transportation planning, activity
administration, routing services, geographical based services, and fleet management use
advanced digital road data. Remote sensing imagery, with its recently upgraded spatial, spectral
and temporal resolution, gives more subtle elements of the earth surface and takes into account
exact and reliable detection and characterization of the terrain and the sequences of earth with
higher accuracy along these lines additionally advantage the transportation applications (Zhang,
2010).
The automatic extraction of man-made structures, for example, structures and road from
advanced digital imagery has been a point of convergence of photogrammetric and image
preparing research for as long as 20 years (Barry, Rüther and Barry, 2004). Updating road maps
(or other types of maps) is a time-consuming operation when performed manually.
Unfortunately, no existing methods allow complete and reliable automation of this process
(Fortier et al., no date). Thus much effort is devoted to finding solutions to this problem.

14
Remotely sensed imagery, for example, aerial photographs, low altitude aerial photographs (e.g.,
from drones/unmanned aeronautical vehicles), satellite imagery, Light detection and Ranging
(LiDAR) data, has been used to map roads utilizing a few methodologies. These techniques
incorporate basic yet knowledge requesting manual image analysis, photogrammetry utilizing
stereo-photographs or stereo - images, and semi-automatic/programmed feature extraction
utilizing pixel, sub-pixel, or OOIA (Chalapathi, 2015).
According to Hofmann (2004), a standout amongst the most imperative parts of understanding
imagery is data about image context. There are two kinds of relevant data: global context, which
portrays the circumstance of the image, essentially time, sensor, location and local context,
which depicts the shared connections of image regions. In human discernment, handling of
context data is by and large intentionally or intuitively present and contributes basically to the
immense capacities of people in image analysis. Keeping in mind the end goal to get significant
contextual information, image regions of the correct scale must be brought into connection.
Human visual discernment techniques for OOIA make it conceivable to analyze an image in
view of: pixels gathered to meaningful objects, contextual data by considering neighborhood
connections and various scales by producing objects of various size (Gmbh and Munich, 2001).
To create helpful image objects, appropriate image segmentation is indispensable for the entire
investigation process. To benefit by contextual information the objects need to wind up mindful
of their neighborhood. Considering the diverse estimated objects ought to be composed
progressively.
2.2 Paradigm shift of feature extraction (manual-semi-automatic feature
extraction) One of the main objectives of Geoinformatics engineering is to collect data and analyze,
represent the products of these data with diverse means. Today, the reliable production of
information and its rapid serve to the user community is an important task. The rapid aspects of
data arrangement have quickened the advance of innovation. Because of this stormy advance
information securing from space has been an operational concern. Extracting both geometric and
semantic data from space images has been the principle concern since the early period of remote
sensing (Sahin et al., 2004).

15
Road feature extraction methods can be widely classified as semi-automatic method and fully
automatic method (Wijesingha et al., 2012). But there is no technique for complete automatic
road feature extraction from imagery, there might be in any event minimal human interaction in
all the present feature extraction techniques. Magnitude of data in the space images drives the
user to digitize the relevant objects at hand. The key issue in automatic object extraction is
reliable object identification. Hu, Zhang and Tao (2004) ascertained that in recent years the
human machine cooperation strategy for object extraction has been an active research area. In
this strategy, the object of interest is first identified by a human operator and some seed points
are often provided, the object is then delineated automatically and accurately by the computer
algorithm. This is also called semiautomatic extraction. The bottle-neck issue in recognizing the
object is in this way eliminated, and the given approximations fill in as solid imperatives to
control the extraction procedure, offering more reliable and more exact extraction result. The
semi-automatic technique endeavors to coordinate the knowledge of our human visual
framework with a capacity to perceive the object robustly and the computer system with a
capacity to perform quick feature extraction and precise shape representation. (Hu, Zhang and
Tao, 2004).
The use of OOIA on very high resolution data permits to acquire, by an automatic or semi-
automatic analysis with a negligible manual intervention- a much better classification in presence
of very high determination data of small areas, where there are higher chances of error. In OOIA
the semantic level is raised: relation rules join spaces are included, topological data and statistics,
thus the context is defined. (Barrile and Bilotta, 2008).

16
2.3 OOIA versus Pixel based classification Yan (2003) portrays OOIA as an approach that consolidates spectral data and spatial data. This
approach fragments the pixels into objects as per the tone of the image and groups the image by
regarding each object all in all. Using the texture and contexture data of the object
notwithstanding utilizing spectral information, OOIA has all the more effective image capability
Machala and Zejdová (2014) depict OOIA as an approach which can amass moderately
homogenous pixels into significant objects based on their radiometric properties and afterward
extract meaningful additional data, for example, size, shape, texture or contextual information.
OOIA takes into consideration utilization of extra factors such as shape, texture, context, and
other cognitive information gave by the image analyst to segment and classify image features,
and in this way, enhancing classifications. (Moskal, Styers and Halabisky, 2011).
The use of OOIA on high resolution data permits to acquire, by an automatic or semi-automatic
analysis – with a negligible manual intervention - a great order classification very high resolution
of little urban areas, where higher is mistake plausibility. In an OOIA the semantic level is raised
(Barrile and Bilotta, 2008). To completely exploit the data of high-resolution images, techniques
are required which go past conventional statistical analysis and the classification of pixels .In
particular, Blaschke and Strobl (2001) contend that great per-pixel classification approaches do
not unequivocally make utilization of the spatial qualities inherent inside the image. The
essential processing units of OOIA are segments, purported image objects, and single pixels.
Points of interest of OOIA are significant statistic and texture computation, an expanded
uncorrelated component space utilizing shape (e.g. length, number of edges, and so forth.) and
topological highlights and the nearby connection between true real world and image object (Benz
et al., 2004). This connection enhances the estimation of the ultimate classification and cannot be
satisfied by normal, pixel-based methodologies.
Methodologies based on objects as opposed to pixels, are more qualified for the high
heterogeneity found in complex scenes (Santos et al., 2011). Despite pixel based classifiers to
being an inconsequential and economical, they are not equipped for exploiting semantic data like
shape, pattern, texture, neighborhood context, especially where numerous features have
comparable spectral reflectance.

17
Furthermore, essential information for image understanding is not represented in single pixels
yet in significant image objects and their common relations (Blaschke, 2010). OOIA instead does
utilize spectral and contextual information in an integrative way.
Pixel based approach uses spectral data of the pixels to classify the image (Wang et al., 2016).
Typically the distinctive physical properties of earth objects have diverse spectral information
and can be indicated by this pixel based approach. The capacity of this approach is constrained
when objects have comparable spectral data thus the image cannot be characterized accurately.
Pixel based image classification is an effective to get ' thematic classes' from multi-band images
.However, it has certain limitations that should be taken into consideration. The most important
constraints of pixels- based .Nonetheless, it has certain restrictions that ought to be thought
about. The most critical limitations of pixels-based image classification are that it brings about
spectral classes, and that every pixel is assigned to one class only. Spectral classes will be classes
that are specifically connected to the spectral bands utilized as a part of the classification are that
it results in spectral classes, and that each pixel is assigned to one class only (Tempfli et
al.,2001). These are linked to surface characteristics. Pixel-based image classification is that each
pixel is only assigned to one class.
Ongoing improvements in remote sensing made it conceivable to get information of a high
spatial resolution which permits extraction, assessment, and checking of an expansive scope of
possible target features. In the meantime, the demand to automate image analysis in operational
conditions is always developing. In any case, the assortment and number of various features to
be extracted, include challenges particularly as far as displaying and auto adaptive procedures.
The upside of a spatial resolution with pixel sizes fundamentally littler than the normal size of
the object of interest comes with the disadvantage of an abundance of spatial detail and the
accordingly huge amount of data to be processed. To mitigate this disadvantage, the OOIA
approach has turned out to be a contrasting option to the pixel based image analysis (Baatz,
Hoffmann and Willhauck, no date).
Customarily remote sensing image analysis has been dependent wholly on pixel based
classification methods (Moskal, Styers and Halabisky, 2011). Pixel based classification includes
handling a whole scene pixel by pixel while object based classification includes preparing of a
scene by analyzing a groups of pixels as objects. While differentiating it to customary pixel-

18
based methodologies, remote sensing with object based classification methods is accounted for
to accomplish enhanced classification results about complex heterogeneous scenes. Sori (2012)
built up a classification method which made utilization of the fuzzy pixel-based classification as
contribution to object based classifier which utilizes shape, spectral, and neighborhood features
to decide the ultimate classification of segmented image. The method, the object based classifier
could recognize structures, impervious surface, and roads in thick urban areas with 76%, 81%,
and 99% classification accuracies, respectively. All this has been attested by Nobrega and Hara
(2012) that automated classification has demonstrated unsatisfactory results when traditional per-
pixel classifiers are used.
Mohamad et al. (2015) indicates that OOIA approach yields better results than Pixel based
approach and that a combined approach to classification using object based methods and
contextual information available about the image, seems promising and needs further
exploration. The OOIA workflow has proven in many applications to be useful to extract objects
of interest in an automated manner which is not supported by the pixel-based approach (Baatz,
Hoffmann and Willhauck, no date). Not only if objects of interest are to be extracted but also if
only a correct labeling of regions is requested a pure object-based approach is often limited. On
the other hand, OOIA has advantage of improving the quality of classification which cannot be
accomplished by traditional, pixel based approach (Benz et al., 2004). Due to these advantages
utilized in image analysis, Lang and Blaschke (2000) echoed out a fact that OOIA is commonly
considered as the bridging element between Remote Sensing and GIS.
2.4 Unpaved roads attributes In numerous low pay economies, for example, Zimbabwe, improvement of the rural roads is on-
going. Rapid and frequent surveys of the road network development are needed to keep maps up
to date and to monitor the potential impacts of road development on agricultural practices and
production and other economic development. Transport is crucial to monetary and social
improvement in any nation, in a nation like Zimbabwe. There are 88,100 km of classified roads
in Zimbabwe, 17,400 km of which are paved („Additional Zimbabwe Road Network‟, 1981).
About 5 percent of the network is classified as primary roads and has some of the most trafficked
arterials that link Zimbabwe with its neighbors. The tertiary access roads, together with the
unclassified roads (which happen to be overwhelming unmapped unpaved roads), regularly with

19
activity volumes under 50 vehicles for each day, accommodate the intra-provincial access
developments. They link rural communities to social economic amenities, such as schools, health
centers, and markets, and enable government services to reach rural areas.
Roads in an aerial image can be signified based on the following characteristics: radiometric,
geometric, topologic, functional, and contextual. Factors such as weather, intensity of light, and
orientation of the camera can affect the representation of the road features in an image. This
affects the road extraction process. Geometric and radiometric properties of a road are regularly
used as initial input characteristics in determining road edge features. Roads are elongated, and
in high-resolution aerial images they run through the image as long parallel edges with a constant
width and curvature (Ural et al., 2015). In high-resolution images, road region appears as
elongated regions with parallel borders. This property can be used to separate road regions from
any other spectrally similar objects, such as parking lots, buildings, and crop fields as these non-
road objects usually occupy a large and wide area. Constraints on detection based purely on such
characteristics comes from the fact that there are other features, like rivers that may be
misclassified as roads, if an automated procedure to identify road segments is implemented in an
extraction method. This leads to a requirement for the use of additional characteristics when
extracting roads. In addition, roads within an image may have different widths, based on their
functional classification. This characteristic unaided cannot be used as a parameter in the
automatic extraction of a road from an aerial image. Topologic characteristics of roads are based
on the capacity of roads to form road networks with intersections/junctions, and terminations
(Ziems, Gerke and Heipke, 2007). Roads generally tend to connect regions or centers of activity
in images; they may start at a building (e.g., house) and ends at another center of activity, or
continue to an end of an image. Roads tend to intersect and to connect to the other roads in an
image. Topological information can be used to detect and extract missing segments of roads
(Blaschke and Hay, 2001). Absent or blocked road sections could be connected to the extracted
fragments based on the topological data of the neighboring segments. Roads are worked to link
certain spots together and neighboring roads are associated with form networks. This property is
normally utilized as a part of the road network, especially while crossing over gaps. Social and
natural features can likewise be utilized as contextual data to extract roads, alongside outside
information separated from the data in the image (geometric and radiometric qualities). Relevant
data, and data from outside sources, can be utilized to create topologic, utilitarian, and contextual

20
characteristics. Automatic method of extraction, implemented by Baumgartner et al. (1999) use
these characteristics. Singh et al. (no date) points out that roads can also be classified based on
their function as being a local road or a highway. This functional information is applicable in
determining the width of the road and the characteristics of the pavement that would in turn be
used to set the radiometric properties, allowing the road to be identified based on its functional
classification. In supporting the extraction process by using this characteristic there is need to be
an external source of information characterizing the road, besides the information stored in the
image.
System of paved roads can be visibly seen in high resolution satellite images, which makes
paved road extraction a simple errand. However, practically no accentuation has been laid on the
extraction of unpaved roads (Technology, 2016). According to Gomes, Feitosa and Coutinho
(2004), locating unpaved roads in low-resolution satellite images is not a trivial task. Despite the
fact that they have the spectral response of uncovered bare soil, their spatial width is regularly far
underneath the pixel size. Therefore, the pixels crossed by unpaved roads have a different
spectral response over the scene depending on the surrounding pixels. In this manner, the pixels
crossed by unpaved roads have an alternate spectral response over the scene relying upon the
encompassing pixels The following are general assumptions regarding the characteristics of
unpaved roads that are supposedly taken by a human observer into account to locate narrow
unpaved roads on an image. Their shading is more like the exposed soil spectral appearance than
are the pixels on the two sides of the road, they have medium to large length, and direction
changes smoothly along it.
2.5 Methods for road extraction system The wide range of literature on road extraction involves consideration of many aspects.
Researchers focus on various problem definitions, use a variety of data sources, and apply
methods spanning a large collection of algorithms.
2.5.1 Mathematical Morphology (Dilation)
The systems of numerical morphology have demonstrated valuable in robotizing feature
extraction. In a particular track of calculations, mathematical morphology is utilized to decide

21
the roads (Soille and Pesaresi, 2002) .Formal morphological tasks are generally used in a
consecutive way to perform disentanglement, diminishing, gap filling or noise rectification for
extracting the road centerlines. Starting arrangement of the roads from the images might be done
utilizing pixel-based. In an object based approach, road portions are first decided at that point to
be additionally assessed. (Zhang, 2008).
Mathematical morphology is a hypothesis which gives various helpful instruments for image
synchronization, so it has been generally utilized as a part of advanced image handling and
spotlights on the territory that reviews the geometric properties of feature objects in the images.
This permits the extraction of image features that are valuable in the portrayal and depiction of
the shape of a region. (Gonzales and Woods, 2000). In mathematical morphology, images
undergo filtering utilizing a kernel. The yield of the filtering procedure relies upon the match
between the image and the kernel and the activity being performed (O‟Brien, 1989). The two
fundamental tasks of numerical morphology are dilation and erosion (Serra, 1986).
2.5.2 Sobel Operator
The Sobel operator is a discrete differential administrator. The administrator uses two 3x3
pieces: one gauges the inclination in the x-bearing, while the other one appraisals angle in the y-
course. The operator comprises of a couple of 3×3 convolution bits. The image is convolved with
the two parts to rough the subsidiaries in level and vertical change. At each given point,
greatness of the angle can be approximated. The kernels can be connected independently to the
information picture, to deliver isolate estimations of the angle part in every introduction (call
these Gx and Gy). These would then be able to be joined together to locate the supreme extent of
the inclination at each point and the introduction of that gradient.
2.5.3 Hough Transformation
The exemplary Hough Transform is a standard calculation for line and circle recognition. It can
be connected to numerous computer vision issues as most images contain include limits which
can be portrayed by standard bends. The fundamental preferred standpoint of the Hough
transformation method is that it is tolerant of holes in boundary portrayals and is generally
unaffected by image clamor, like edge detectors. The least complex instance of Hough change is
the direct change for distinguishing straight lines. In the image space, the straight line can be
portrayed as y = mx + b and can be graphically plotted for each combine of image focuses (x, y).

22
In the Hough transformation, a fundamental thought is to consider the attributes of the straight
line not as image focuses x or y, but rather as far as its parameters, here the slant parameter m
and the block parameter b. Hough transformation is a feature extraction method utilized as a part
of image investigation, computer vision, and digital image handling. (Shapiro ,2006). It is an
automatic analysis technique used for detection of linear features in a variety of applications
(Karnielli, et al., 1996).This strategy is robust and has demonstrated to be able to handle noise
and occlusion (Aguado, 2002).
2.5.4 Edge Detection
Edge identification is the name for an arrangement of scientific techniques which go for
distinguishing focuses in an advanced image at which the image brightness changes
exponentially or, all the more formally, has discontinuities. There are numerous techniques for
edge location, yet the greater part of them can be gathered into two classifications, seek based
and zero-intersection based. The search based techniques, for example (Sobel, Prewitt, Roberts,
Canny) distinguish edges by first processing a measure of edge quality, generally a first-arrange
subordinate articulation, for example, the inclination extent, and afterward hunting down
neighborhood directional maxima of the angle greatness utilizing a registered gauge of the
nearby introduction of the edge, for the most part the slope bearing. The zero-intersection based
strategies scan for zero intersections in a moment arrange subordinate articulation registered
from the image keeping in mind the end goal to discover edges.
Edge detection is a pivotal advancement in object delineation. It is a procedure of discovering
sharp discontinuities in an image. The discontinuities are unexpected changes in pixel density
which describe limits of features in a scene. To put it plainly, the objective of edge identification
is to create a line drawing of the subset image. The extracted features are then utilized by
computer vision calculations. An established technique for edge recognition includes the
utilization of tool operators, a two dimensional channel. An edge in an image happens when the
change in x and y is most distinct. The technique works by distinguishing these substantial
gradients to recognize the edges. There is a huge measure of operators intended to recognize
certain sorts of edges. The operator can be arranged to scan for vertical, level, or corner to corner
edges. One noteworthy issue with edge discovery is when commotion is available in images. It
isn't sufficient to just diminish the clamor, on the grounds that the picture will be either twisted

23
or obscured. Fortunately, the operator has sufficiently normal information to rebate confined
uproarious pixels. In any case, the adjustment in force is not generally a stage change. The power
change can likewise be slow where the operator at that point must be altered for reliable edge
detection. Therefore, there are issues of missing genuine edges, false edge location, and high
computational time. (Kim, 2013).
2.5.6 Gaussian Filter
Gaussian filter is utilized to obscure and get rid of undesirable detail and noise. By computing a
5 X 5 mask, the Gaussian smoothing can be performed utilizing standard convolution strategy. A
convolution veil is substantially littler than the real picture. Therefore, the mask is slid over the
image, ascertaining each square of pixels at once. Gaussian utilizes 2D appropriation to perform
convolution. The bigger the width of the Gaussian cover, the lower is the identifier's affectability
to noise. The heaviness of the framework is amassed at the inside, subsequently any noise
showing up in the outside segments and columns will be disposed of, as the weight diminishes
outward from the middle esteem. The restriction mistake in the identified edges additionally
increments marginally as the Gaussian width is expanded. The expanding of standard deviation
decreases hazy spots the power of the commotion. (Irfanullah, Azeezullah, no date).
2.5.7 Piecewise Parabola Extraction
The strategy depends on a brief road geometric portrayal alongside a deformable layout
coordinating technique (Hu, Zhang and Tao, 2004). All the more imperatively, the strategy can
be flawlessly incorporated into a commonsense digitizing process. The piecewise parabola
display is developed by seed focuses coarsely put by a human administrator. Road extraction
really turns into a physical issue of comprehending of each bit of parabola with just a few
obscure parameters by utilizing image requirements in this manner the method utilizes a
minimum square layout coordinating to understand the parabola parameters. The format is
deformable created in view of the programmed recognition of parallel edges. Broad testing
investigates different image sets exhibit that the technique can extricate road centerlines
dependably. It offers substantially higher effectiveness rather than manual digitizing process.
2.5.8 The Roberts Detection
The Roberts Cross operator plays out a basic, fast to process, 2-D spatial angle estimation on an
image. Pixel at each point it yields the assessed output of the spatial slope of the information on

24
the image by then. The technique is comprised of a 2×2 convolution part. These parts are
intended to act accordingly maximally to edges running at 45° to the pixel network, one portion
for every one of the two opposite orientations. The orientations can be connected freely to the
input image to create isolate estimations of the inclination segment in every orientation. (Singh et
al., 2013).
2.5.9 The Prewitt Detection
The Prewitt edge identifier is a proper method to assess the size and orientation of an edge. The
Prewitt operator is constrained to 8 conceivable angle arrangements, though most direct
orientation gauges are very less more exact. This angle based edge indicator is assessed in the
3x3 neighborhood for 8 bearings. All the eight convolution masks are figured. The convolution
cover with the biggest module is then chosen (Context et al., 2016).
2.6.0 Canny Edge Detector
The Canny edge identifier is broadly utilized as a part of computer vision to find sharp power
changes and to find object limits in an image. The Canny edge locator groups a pixel as an edge
if the slope size of the pixel is bigger than those of pixels at the two its sides toward greatest
intensity change. Characterizing edges in this way makes some conspicuous edges be missed.
There is have to amend the Canny edge locator to enhance its identification precision (Lijun
Ding, Ardeshir Goshtasby, 2000).
It is a technique to ascertain edges by segregating clamor from the image without influencing the
features of the edges in the image and afterward applying the propensity to recognize the edges
and the basic incentive for edge. The Canny edge locator smoothies the image to dispose of
unnecessary noise. At that point it finds the image slope to feature districts with high spatial
subordinates. After that it performs following along these regions and stifles any pixel that is not
at the most extreme. The inclination exhibit as of now can additionally be decreased by
hysteresis which is utilized to track along the rest of the pixels that have not been stifled.
Hysteresis utilizes two edges and if the extent is less than the main limit, it is set to be an edge.
In the event that the extent is over the high limit, it is made an edge (Saluja, Singh, Agrawal,
2013).

25
2.7 OOIA feature extraction associated works Hu, Zhang and Tao (2004) have displayed a programmed road centerline extraction from very
high resolution satellite imagery. They have proposed a progressive gathering technique to
automatically extricate fundamental road centerlines from high-determination satellite
symbolism. Progressive gathering here has implied that as opposed to gathering all portions
without a moment's delay, specific fragments are assembled bit by bit, and various signs are
firmly coordinated into the technique. Through the stepwise gathering, the recognized divided
line fragments have in the end shaped the long primary road lines. Gomes, Feitosa and Coutinho
(2004) proposed another technique to distinguish sub-pixel unpaved roads. The technique tries to
copy the human capacity to identify such road notwithstanding all designated viewpoints, via
scanning for long, thin and smooth line portions whose ghastly reaction are nearer to the
uncovered soil than the encompassing pixels. The technique execution is assessed on fragments
of Landsat scenes (groups 3, 4 and 5) of the Alcinópolis County, situated in the State of South
Mato Grosso in Brazil. There is much accentuation that finding unpaved roads in low-
determination satellite images is anything but a paltry undertaking. Tests on LANDSAT images
from the Midwest Brazil have demonstrated that the technique is a significant guide to enhance
the output of the image analysis assignment to the extent the detection of unpaved roads is
concerned.
Nobrega and Hara (2012) put forward a thesis which applied technology on road detection and
classification in informal settlements areas. An 11 bit Ikonos multi-spectral image was utilized.
Essential parts were pre-figured and utilized on features customization. Auxiliary information
were computed from spectral data and joined with geometric data of the portions. Arrangement
rules were made from objects data, by utilizing blend between unique multispectral bands,
important segments and additionally utilizing mixes of geometric attributes like width, length,
neighbor and asymmetry and logical ones. Considering the Ikonos second foremost part as a
brilliant marker of impenetrable areas, and considering the recognition of uncovered soil
territories, cleared and unpaved roads were segregated. Preparatory outcomes have shown that
this classification technique produces precise outcomes. Examinations between automatic
methodologies and manual ones authenticated the effectiveness of the technique. To assess the
precision achieved, an examination between these two classifications of road street polygons was
executed. The general precision was 65%. However, object based methodologies have achieved

26
more exact outcome, it has been kept in mind that that the roads in informal settlements are
unpredictable, thin and contain diverse asphalts and texture.
Technology (2016) presented a technique for extraction of unpaved roads from high resolution
satellite images. Sandy area candidates were acquired through thresh-holding of significant
shading space segments from HSV and YCbCr. Legitimate mix of these applicants was
performed to give the sandy locale. Morphological technique (Dilation) was utilized to refine the
sandy area, while Hough transformation was utilized to extricate road segment from the entire
sandy district. The created calculation was executed in MatLab and tried with tests of satellite
images procured from Google Earth Map. Subjective (visual quality assessment) and target
parameters (Gap Statistics) were utilized for execution assessment. The outcome demonstrates
that the new calculation effectively separates unpaved roads from satellite imagery the created
calculation performed brilliantly for straight unpaved roads (100%), while it performed
sufficiently well (91%) for an image with a interlinked of unpaved roads.
In a research done by Bacher and Mayer (2003) they connected a programmed approach for road
extraction from pan sharpened IKONOS images which makes utilization of the 1m view mode
and the multispectral data. The approach comprises of three principle steps and can be viewed as
an extra to the approach of Wiedemann (2001) .In the initial step, preparing zones for a
multispectral classification are extricated in all channels utilizing the Steger differential
geometric line administrator. Moreover, there must be parallel edges with a homogeneous
territory between them inside an area of the extricated lines. In the second step, the preparation
territories are utilized for a fluffy multispectral arrangement. With it, extra road pixels are
extricated. The quantity of misclassifications is limited by methods for a rank filtering. In the last
task, holes in the preparatory road network produced with the approach of Wiedemann (2001)
are shut by methods for zip-lock line utilizing that comes about.

27
CHAPTER THREE
Methodology
3.0 Introduction This chapter covers the overall procedure carried out in achieving the set out objectives of the
research. The research methodology will give an in depth overview of the data acquired, the
methods and approaches used to come up with the results. An analysis of the techniques
employed in the research indicating strengths and weaknesses of each will be shown in this
chapter.
3.1 Research Design
Feature extraction is the consolidated procedure of fragmenting an image into regions of pixels,
computing attributes for every region to make questions, and ordering the objects (with rule
based or supervised classification) based on characteristics, to delineate features. In this research,
rule based classification was utilized to extract unpaved roads. The overall workflow is
summarized in Figure 1.
.

28
Fig 1
Image Preprocessing
SEGMENT IMAGE
MERGE SEGMENTS
REFINE SEGMENTS
COMPUTE ATTRIBUTES
EXPORT OBJECTS TO SHAPEFILE
NO
DEFINE FEATURES
RULE BASED CLASSIFICATION
EXPORT FEATURES
VIEW REPORTS AND
STATISTICSFINISH
YESVIEW REPORTS
AND STATISTICS

29
3.2.0 Finding Objects The Find Objects undertaking is partitioned into four stages: Segment, Merge, Refine, and
Compute Attributes. When you finish this assignment, you will carry out the Extract Features
undertaking, which comprises of rule based classification and exporting results to shape files as
well as raster images.
3.2.1 Segment Image criteria Segmentation is the way toward dividing an image into objects by gathering neighboring pixels
with same qualities. The objects in the image ideally correspond to real-world features. Powerful
segmentation guarantees that segmentation comes about more precise. ENVI EX utilizes an
edge-based segmentation calculation that is quick and just requires one information parameter
(Scale Level). By stifling frail edges to various levels, the calculation can yield multi-scale
division comes about because of better to coarser division. The division calculation computes an
inclination delineate the picture; it ascertains a thickness work for the angle outline; figures an
altered slope outline the first slope outline, capacity, and Scale Level; at that point it portions the
adjusted inclination delineate.
3.2.2 Merge Segments Merging is a discretionary advance used to aggregate small sections inside bigger, finished
zones, for example, trees, mists, or fields, where over-segmentation might be an issue. Merging
consolidates contiguous segments with similar spectral qualities. The Merge Level parameter
represents the limit lambda, which ranges from 0.0 to 100.0.Through an expanding nonlinear
mapping, the parameter is more controllable and appropriate for see. ENVI EX utilizes the Full
Lambda-Schedule calculation. The calculation iteratively consolidates contiguous segments in
view of spectral and spatial data. Merging continues if the calculation finds a couple of
neighboring regions, I and j, with the end goal that the consolidating cost is not as much as a
characterized edge lambda value:
Equation 1

30
3.2.3 Refining Segments criteria
Another discretionary combining strategy called thresh-holding is utilized at this phase of finding
objects. It is helpful for extracting point features when over segmentation is an issue. Thresh-
holding is a raster task that works with one band of Region Means picture to gather nearby
fragments in on their brightness value (advanced number or DN). Thresh-holding functions
admirably with features that are in high contrast to their background.
3.2.4 Computing Attributes Feature Extraction utilizes an object based way to deal with classification, rather than pixel-
based order. The advantage of an object based approach is that items can be portrayed with an
assortment of spatial, spectral, and texture characteristics. In the Compute Attributes step,
ascribes were characterized to register the object to be extracted. For the proposed work, spatial,
spectral and texture attributes were all applied. ENVI EX comprises of 14 attributes (Area,
Length, Compactness, Elongation, Convexity, Solidity, Roundness, Formfactor, Rect_fit,
MainDir, Numholes, Holesolrat, Minaxislen and Maxaxislen) and spatial. The spatial attributes
that were defined and computed were Elongation, Compactness, Length and Area. Formulas for
calculating Compact, Convexity, Solidity, Roundness, and Formfactor are from Russ (2002).
ENVI EX calculates all of the spatial attributes based on a smoothed version of the geometry, not
the original geometry (Douglas and Peuker, 1973). Performing calculations on a smoothed
geometry ensures the shape measurements are less sensitive to object rotation.
Elongation: A shape measure that shows the proportion of the real hub of the polygon to the
minor pivot of the polygon. The major and minor tomahawks are gotten from an arranged
bounding box containing the polygon. The extension esteem for a square is 1.0, and the incentive
for a square shape is more noteworthy than 1.0.
ELONGATION = Maxaxislen / Minaxislen Equation 2
Compact: shows the conservativeness of the polygon. A circle is the most minimal shape with an
estimation of 1 / pi. The compactness value of a square is 1 / 2(sqrt(pi)).
COMPACT = Sqrt (4 * AREA / pi) / outer contour length Equation 3

31
Length: The combined length of all boundaries of the polygon, including the boundaries of the
holes. This is different than the maxaxislen attribute. Values are in map units.
Area: Total area of the polygon, minus the area of the holes. Values are in map units.
Spectral attributes available in ENVI EX are Minband_x, Maxband_x, Avgband_x, Stdband_x.
The four attributes are computed for each band x in the original image. The shape file attributes
have 4 * x entries comprising the spectral attributes. The spectral attribute that was defined and
computed is the Avgband_4 and this depended on the 4 bands of the original image.
Avgband_4: Average value of the pixels comprising the region in band x.
3.2.5 Extraction of features The Extraction Features task is divided into 3 steps: Rule Based classification, Export features
and viewing of reports and statistics.
3.2.6 Rule Based Classification Rule-based classification is grouping is a propelled method that gives you a chance to
characterize by building rules in view of object attributes. Rule based classification is an intense
tool for feature extraction, frequently performing superior to supervised classification. Rule-
building is primarily based on human knowledge and reasoning about specific feature types.
Building new rules involves various classes. Each class will contain at least one rule (which
contain a variety of different attributes) that best describe the class. For instance, when extracting
roads from an image, you could fabricate a rule set that will utilize a mix of Elongation, Length,
and Area spatial attributes:

32
Figure 2
To meet the conditions of the Roads class, either one of the two rules must apply (i.e., the OR
operation). The first rule has only one attribute definition. To satisfy the conditions of the second
rule, both the Length and Area attribute definitions must apply (i.e., the AND operator). Each
rule is equally weighted, which works well in most cases.
3.2.7 Export Classification Results
In this progression, there is determination of sorts of images, vectors, and statistical reports to
different configurations. As a matter of course in ENVI EX, documents are spared to the index
that is indicated in the Output Directory. At the point when the export is finished, the component
extraction work process ends.
3.2.8 Accuracy Assessment According to Bogoliubova (2014), image classification cannot be considered complete until we
obtain an estimate of its accuracy. The translator (decoder) needs to decide precisely how the
object classes in the image relate to these classes on the earth (landscape) surface. In the
investigation of image handling the expression "precision" implies a measure of consistency with
dependable data in a spatial point with information on the classified image (Jensen 1996).

33
The results of precision evaluation are typically abridged in a perplexity lattice, which portrays
the classification error for each class, as well as errors identified with incorrect classification.
This contingency table is regularly alluded to as a confusion matrix, misclassification matrix
(Bogoliubova, 2012), or error matrix. The error matrix is composed of an equal number of rows
and columns (a square matrix of n×n dimension), where n – the number of object classes on a
control map or ground referencing information.
A confusion framework, otherwise called an error matrix, is a particular table format that permits
representation of the execution of a calculation, ordinarily a supervised learning one (in
unsupervised learning it is normally called a matching grid). Each row of the framework
represents the cases in an anticipated class while every column represents the cases in an actual
class (or the other way around. In predictive analysis, a table of confusion (once in a while
additionally called a confusion matrix), is a table with two lines and two segments that reports
the quantity of false positives, false negatives, true positives, and true negatives. The figure
below shows the structure and contents of a confusion matrix.
Figure 3: Source David M W (2011).

34
Definition of conditions (Validation Matrix)
A genuine positive (TP) test result is one that distinguishes the condition when the condition is
available
A genuine negative (TN) test result is one that does not detect the condition when the condition
is not available.
A false positive (FP) test result is one that identifies the condition when the condition is missing.
A false negative (FN) test result is one that does not detect the condition when the condition is
available.
These metrics are then used to calculate Sensitivity, Specificity and Accuracy as:
Sensitivity measures the ability of a test to detect the condition when the condition is present.
Thus, Sensitivity = TP/ (TP+FN).
Specificity measures the capacity of a test to accurately reject the condition (not identify the
condition) when the condition is missing. Thus, Specificity = TN/ (TN+FP).
Predictive value positive is the extent of positives that compare to the nearness of the condition.
Thus, Predictive value positive = TP/ (TP+FP).
Predictive value negative is the proportion of negatives that correspond to the absence of the
condition. Thus, Predictive value negative = TN/ (TN+FN).
Accuracy: (TP+TN)/ (TP+FP+TN+FN)
3.2.9 Methods and material used In determining the validation metrics, 25 points were randomly selected on identified unpaved
roads and a comparison was undertaken using the original subset image. Actual classes and
classes that the OOIA algorithm extracted were enumerated both on the original image and
processed vector output thus ascertaining the number of true positives (TP), false positives (FP),
true negatives (TN) and false negatives (FN). The classes that were predicted or rather confused

35
by the algorithm were rooftops and pathways near houses. After a thorough rundown of the
validation metrics, Sensitivity, Specificity and Accuracy were deduced.
3.3.0 Chapter summary The overall procedure and methods employed in this study have been mentioned in this chapter.
Each of the methods employed produced a specific result meant at achieving the set out
objectives. The key to producing results was in the proper procedural execution and linking of
methods used.

36
CHAPTER FOUR
Results and Analysis
4.0 Introduction This chapter gives the results obtained from carrying out the procedures stated in the
methodology section (see Chapter 3).
4.1 Pre-processing results All the bands of Plaedis satellite imagery were loaded and stacked in ENVI 4.7. Stacking
involves loading a series of images of different bands into one composite file.
Figure 4 shows the stacking of all the bands of Plaedis image.

37
4.1.1 Study area-region of interest (ROI) The region of interest (ROI) was defined using the spatial subset tool in ENVI 4.7.
Figure 5 Shows the spatial subset extents of ROI.

38
4.1.2 Results of segmentation effects
Figure 6. Comparison of different segmentation effects under different scales (0, 20, 40, 60, 80
and 100 respectively).
Choosing a high Scale Level causes fewer segments to be defined, and choosing a low Scale
Level causes more segments to be defined. Highest Scale Level delineates the boundaries of
features as well as possible. Good segmentation ensures that classification results are more
accurate. Choosing too high of a Scale Level, the boundaries between segments will not be
properly delineated and feature of interest is lost. It was found out that scale level 60 was the
most suitable and optimum for unpaved roads.

39
4.1.3 Results of merging segments criteria
Figure 7 Comparison of different merging segments effects under different merging levels (20,
60 and 90 respectively). Merging level 90 was found to be the optimum merging level.
4.1.4 Results of computed attributes and rule based classification. At refinement stage, no thresh holding was applied.
Attributes Computed:
Spatial (elongation > 1.1166, compact < 0.2022, Length >112.000, Area<100.000)
Spectral (avgband_4 > 1363.5011)
Classification: Rule-Based
Rule Set:
#1 (1.000): If avgband_4 > 1363.5011 AND compact < 0.2022 AND elongation > 1.1166 AND
Length >112.000 AND Area >112.000, then object belongs to "Unpaved roads".

40
Figure 8 Output of the rule based classification and the rule sets executed.
4.1.5 Results showing the extracted unpaved roads in various formats.
Figure 9 Extracted Unpaved roads in vector line format.
41
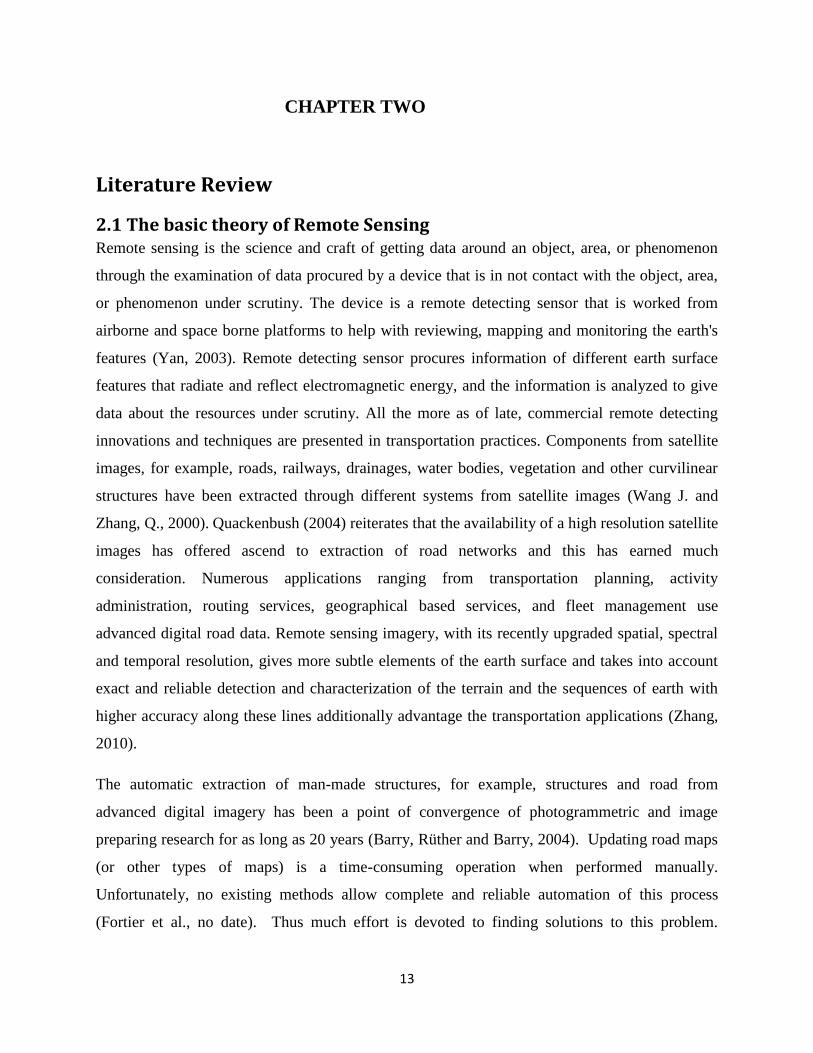
Figure 10.Overlay of line vector format of unpaved roads and the original multispectral subset
image.
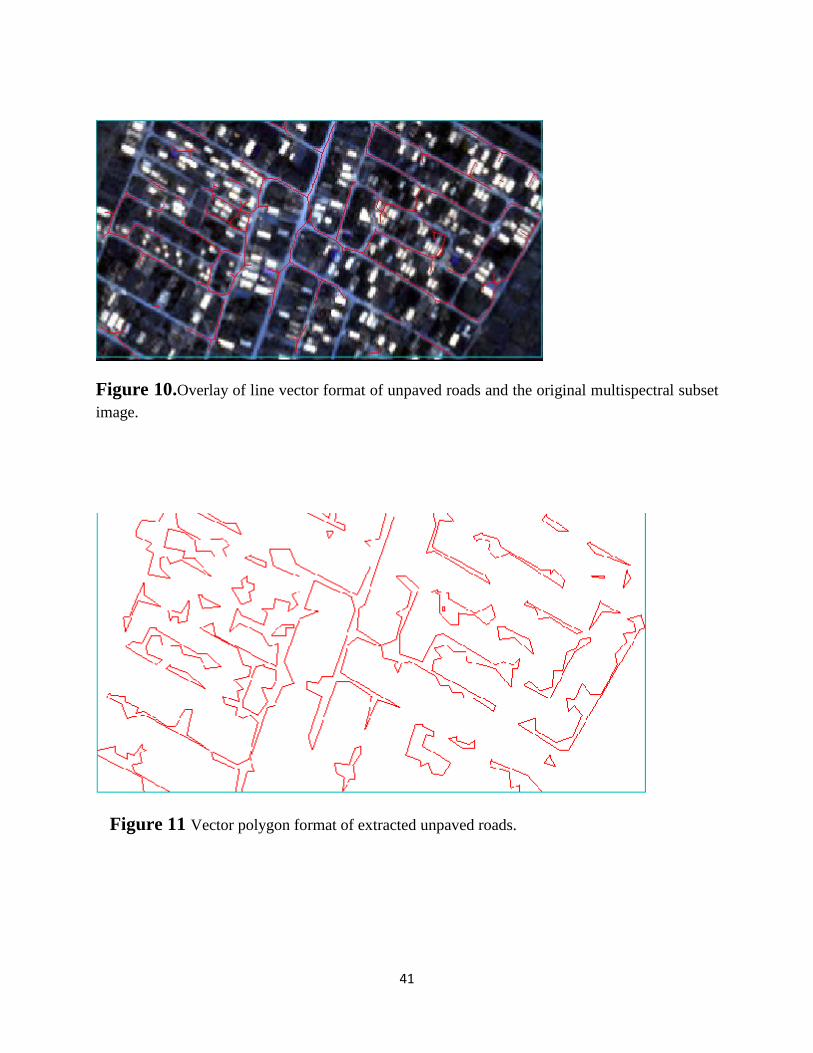
Figure 11 Vector polygon format of extracted unpaved roads.

42
Figure 12 Vector line format of extracted unpaved roads from a panchromatic image.
Figure 13 Overlay of line vector format of unpaved roads and the original subset image of a
panchromatic image.
43
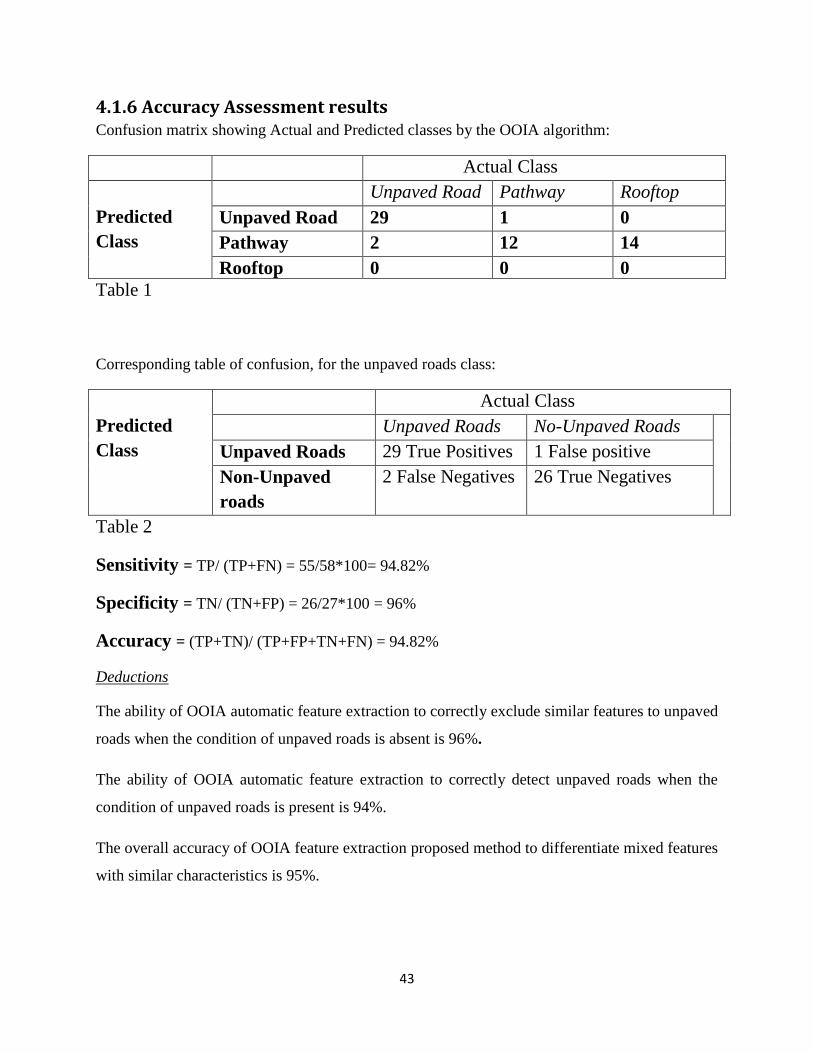
4.1.6 Accuracy Assessment results Confusion matrix showing Actual and Predicted classes by the OOIA algorithm:
Actual Class
Predicted
Class
Unpaved Road Pathway Rooftop
Unpaved Road 29 1 0
Pathway 2 12 14
Rooftop 0 0 0
Table 1
Corresponding table of confusion, for the unpaved roads class:
Predicted
Class
Actual Class
Unpaved Roads No-Unpaved Roads
Unpaved Roads 29 True Positives 1 False positive
Non-Unpaved
roads
2 False Negatives 26 True Negatives
Table 2
Sensitivity = TP/ (TP+FN) = 55/58*100= 94.82%
Specificity = TN/ (TN+FP) = 26/27*100 = 96%
Accuracy = (TP+TN)/ (TP+FP+TN+FN) = 94.82%
Deductions
The ability of OOIA automatic feature extraction to correctly exclude similar features to unpaved
roads when the condition of unpaved roads is absent is 96%.
The ability of OOIA automatic feature extraction to correctly detect unpaved roads when the
condition of unpaved roads is present is 94%.
The overall accuracy of OOIA feature extraction proposed method to differentiate mixed features
with similar characteristics is 95%.

44
CHAPTER FIVE
5.0 Introduction This chapter analyzes the results of the research, giving conclusion as to the findings of the
research, the limitations to the research and recommendations for improvement of this research.
5.1 Evaluation Results show that the sensitivity, specificity, and accuracy of the OOIA method used could reach
approximately 93%, 96% and 95% respectively, indicating that the proposed method is effective
for unpaved roads extraction.
5.1.1 Objective I A rule based classification was achieved using optimum threshold values for spatial, spectral and
textural attributes. A rule set involving area, length, elongation and average band of unpaved
roads was executed making it possible to delineate unpaved roads from the satellite image.
5.1.2 Objective II The segmentation process turned out to be a challenging task due to the similar spectral
characteristics of other features such as bare soil and clay roof tops with unpaved roads. Merging
made it possible to further refine the segmented objects.
5.1.3 Objective III The performance of the OOIA feature extraction was validated successfully using a confusion
matrix. It did not only describe the classification error for each class but also errors related to
incorrect classification. The ability of the algorithm proved to be effective when it comes to
extraction of unpaved roads. Specificity, sensitivity and accuracy of the OOIA algorithm
ascertained were very convincing.
5.2 Conclusion and Recommendations The results of this project indicate that high resolution data can be reliably and rapidly used to
update road maps at both national and regional levels particularly unpaved roads. However, it
should be noted that use of different types of imagery such as multispectral and panchromatic
varies remarkably. Multispectral imagery experienced rigorous rule sets due to the fact of several

45
bands whereas panchromatic imagery possesses lesser bands that require a few set of rule sets
algorithms. This suggests that object-oriented classification has great potential for extracting
unpaved roads from satellite imagery. To improve the accuracy of the object-oriented
classification, further work refining the process is continuing. The use of multi-sensor data and
ancillary data, such as DEM data sets and GIS layers, is being investigated. Also development of
a filtering technique that can successfully differentiate unwanted patches from extracted unpaved
roads in the results can also be included in the future works.

46
References
Baatz, M., Schäpe, A. (2000): Multiresolution Segmentation – an optimization approach for high quality
multi-scale image segmentation. In: Strobl/Blaschke/Griesebner (eds.): Angewandte Geographische
Informationsverarbeitung XII, Wichmann-Verlag, Heidelberg,12-23
Baatz, M., Hoffmann, C. and Willhauck, G. (no date) „Progressing from object-based to object-oriented
image analysis‟.
Bacher, U. and Mayer, H. (2003) „Fuzzy-classification and ziplock snakes for road extraction from
IKONOS images‟, … of Joint ISPRS/ERSel Workshop: High …. Available at: http://www.ipi.uni-
hannover.de/fileadmin/institut/pdf/bacher.pdf.
Badjana, H. M. et al. (2015) „Earth and Space Science‟, pp. 403–416. doi:
10.1002/2014EA000083.Received.
Barrile, V. and Bilotta, G. (2008) „An application of remote sensing: object-oriented analysis of satellite
data‟, The International Archives of the Photogrammetry, Remote Sensing and Spatial Information
Sciences, 27(B8), pp. 107–114.
Barry, M., Rüther, H. and Barry, U. J. (2004) „Data Collection Techniques for Informal Settlement
Upgrades in Cape Town , South Africa‟, (Weaver).
Benz, U. C. et al. (2004) „Multi-resolution, object-oriented fuzzy analysis of remote sensing data for GIS-
ready information‟, ISPRS Journal of Photogrammetry and Remote Sensing, 58(3–4), pp. 239–258. doi:
10.1016/j.isprsjprs.2003.10.002.
Benz, U. C., P. Hofmann, G. Willhauck, I. Lingenfelder, and M. Heynen (2004), Multi-resolution, object-
oriented fuzzy analysis of remote sensing data for GIS-ready information, ISPRS J. Photogrammetry.
Remote Sens., 58, 239–258.
Benz, U. C. et al. (2004) „Multi-resolution, object-oriented fuzzy analysis of remote sensing data for GIS-
ready information‟, ISPRS Journal of Photogrammetry and Remote Sensing, 58(3–4), pp. 239–258. doi:
10.1016/j.isprsjprs.2003.10.002.

47
Blaschke, T. (2006) „Automated classification of landform elements using object-based image analysis‟,
81, pp. 330–344. doi: 10.1016/j.geomorph.2006.04.013.
Blaschke, T. et al. (2000) „Object-Oriented Image Processing in an Integrated GIS / Remote Sensing
Environment and Perspectives for Environmental Applications‟, Environmental Information for Planning,
Politics and the Public, (1995), pp. 555–570.
Blaschke, T. (2006) „Automated classification of landform elements using object-based image analysis‟,
81, pp. 330–344. doi: 10.1016/j.geomorph.2006.04.013.
Blaschke, T. (2010) „Object based image analysis for remote sensing‟, Ijprs, pp. 2–16. doi:
10.1016/j.isprsjprs.2009.06.004.
Blaschke, T. and Hay, G. J. (2001) „Object-oriented image analysis and scale-space: theory and methods
for modeling and evaluating multiscale landscape structure‟, International Archives of Photogrammetry
and Remote Sensing, 34(4), pp. 22–29. Available at:
http://crs.itb.ac.id/media/jurnal/Refs/Draft/RemoteSensing/Object-Based/blaschke_hay_short_paper.pdf.
Bogoliubova, A. (2014) „accuracy assessment of automatic image processing for land cover classification
of st . petersburg protected area * 1‟, 13, pp. 5–22.
Chalapathi, S. B. V. (2015) Towards improving gully erosion assessment. doi:
10.3990/1.9789036538220.
Context, U. et al. (2016) „Road Network Extraction from VHR Satellite Images Using Context Aware
Object Feature Integration and Tensor Voting‟. doi: 10.3390/rs8080637.
Dimitrakopoulos, K., I. Z. Gitas, A. Polychronaki, T. Katagis, and C. Minakou (2010), Land cover/use
mapping using object based classification of SPOT imagery, in Remote Sensing for Science, Education,
and Natural and Cultural Heritage, Proc. EARSeL Symp., edited by R. Reuter, pp. 263–272, Univ. of
Oldenburg, Germany.
Fortier, M. A. et al. (no date) „Survey of Work on Road Extraction in Aerial and Satellite Images‟, (241).

48
Gmbh, D. I. and Munich, D.- (no date) „Detecting urban features from IKONOS data using an object-
oriented approach 1 . Object oriented image analysis – basic concepts of eCognition‟, pp. 79–91.
Gomes, O. F. M., Feitosa, R. Q. and Coutinho, H. L. C. (2004) „Sub-Pixel Unpaved Roads Detection in
Landsat Images‟, Proceedings of ISPRS Congress. Available at: http://www.lvc.ele.puc-
rio.br/users/raul_feitosa/publications/2004/SUB-PIXEL UNPAVED ROADS.pdf.
Hu, X., Zhang, Z. and Tao, C. V. (2004) „A Robust Method for Semi-Automatic Extraction of Road
Centerlines Using a Piecewise Parabolic Model and Least Square Template Matching‟, 70(12), pp. 1393–
1398.
Jensen, J. R., J. Im, P. Hardin, and R. R. Jensen (2009), Image classification, in The SAGE Handbook of
Remote Sending, edited by T. A. Warner et al., pp. 269–281, SAGE Publications, Los Angeles, London,
New Delhi.
Jensen, R. J. (2005), Introductory Digital Image Processing: A Remote Sensing Perspective, 3rd ed.,
Prentice hall, Upper Saddle River, N. J.
Kimio FUJITA (2000) „Digital topographic map revision and database operation manual for the study on
urgent establishment of topographic mapping in East Timor‟, (August), pp. 1–46.
Machala, M. and Zejdová, L. (2014) „Forest mapping through Object-based image analysis of
multispectral and LiDAR Aerial data‟, European Journal of Remote Sensing, 47(1), pp. 117–131. doi:
10.5721/EuJRS20144708.
Mather, P. M. (2004), Computer Processing of Remotely-Sensed Images: An Introduction, 3rd ed., Wiley,
England.
Mohamad, A. et al. (2015) „A Review on Feature Extraction and Feature Selection for Handwritten
Character Recognition‟, (IJACSA) International Journal of Advanced Computer Science.
Moskal, L. M., Styers, D. M. and Halabisky, M. (2011) „Monitoring urban tree cover using object-based
image analysis and public domain remotely sensed data‟, Remote Sensing, 3(10), pp. 2243–2262. doi:
10.3390/rs3102243.

49
Nobrega, R. A. A. and Hara, C. O. (2012) „Detecting roads in informal settlements surrounding sao paulo
city by using object-based‟.
Ottichilo, W., Khamala, E. and Sensing, R. (no date) „Map updating using high resolution satelite
imagery a case of the kingdom of Swaziland‟, pp. 89–92.
Sahin, H. et al. (2004) „Comparison of object oriented image analysis and manual digitizing for feature
extraction‟, XXth ISPRS Congress: Geo-Imagery Bridging Continents, YF, p. 114 ff. Available at:
www.isprs.org/proceedings/XXXV/congress/yf/papers/937.pdf.
Santos, T. et al. (2011) „Producing a building change map for urban management‟, pp. 56–65.
Singh, C. et al. (no date) „Evaluating , mapping , and managing unpaved road networks using high-
resolution remote sensing data‟, pp. 3–8.
Sori, N. D. (2012) „Identifying and Classifying Slum Development Stages from Spatial Data Identifying
and Classifying Slum Development Stages from Spatial Data‟, p. 69.
Tapas Ranjan, M. (2011) Detection of landslides by object-oriented image analysis. doi: 4 July 2011.
Technology, I. (2016) „Unpaved-road extraction from satellite images Ojo J. A, Akinlabi J. A, Adeyemo
I.A Department of Electronic and Electrical Engineering,Ladoke Akintola University of Technology, P.
M. B. 4000, Ogbomoso, Oyo State, Nigeria.‟, 4(5), pp. 1–8.
Tempfli, K. et al. (2001) „Principles of Remote Remote Sensing - An introductory text book‟, p. 591.
United Nations (2013) World Economic and Social Survey 2013, New York: Department for Economic
and Social Affairs. doi: 10.1016/j.compind.2010.10.001.
Ural, S. et al. (2015) „Road and Roadside Feature Extraction Using Imagery and Lidar Data for
Transportation Operation‟, ISPRS Annals of Photogrammetry, Remote Sensing and Spatial Information
Sciences, II-3/W4(March), pp. 239–246. doi: 10.5194/isprsannals-II-3-W4-239-2015.
Wang, J. et al. (2016) „A New Approach to Urban Road Extraction Using High-Resolution Aerial Image‟,

50
ISPRS International Journal of Geo-Information, 5(7), p. 114. doi: 10.3390/ijgi5070114.
Wang, Y. et al. (2013) „CrowdAtlas: Self-Updating Maps for Cloud and Personal Use‟, MobiSys 2013, p.
27. doi: 10.1145/2462456.2464441.
Weih, R. C., and N. D. Riggan (2010), Object-based classification vs. pixel-based classification:
Comparative importance of multi-resolution imagery, GEOBIA, 38 4/C7, 1–6.
Wijesingha, J. S. J. et al. (2012) „Automatic Road Feature Extraction from High Resolution Satellite
Images Using LVQ Neural Networks‟, Asian Conference of Remote Sensing, (May 2014).
Yan, G. (2003) „Pixel based and object oriented image analysis for coal fire research‟, p. 83.
Zhang, C. (2008) „An UAV-based photogrammetric mapping system for road condition assessment‟, The
International Archives of the Photogrammetry, Remote Sensing and Spatial Information Sciences., pp.
627–632. Available at:
http://citeseerx.ist.psu.edu/viewdoc/download?doi=10.1.1.150.8490&rep=rep1&type=pdf.
Zhang, C. (2010) „Monitoring the condition of unpaved roads with remote sensing and other technology‟,
Final Report US DOT DTPH56-06-BAA-0002, pp. 1–53. Available at:
http://ntl.bts.gov/lib/42000/42300/42378/FinalReport.pdf%5Cnpapers2://publication/uuid/1A0A7E56-
CEEE-4F52-86D3-9F4C226C7117.
Zhou, Q., B. Li, and A. Kurban (2008), Spatial pattern analysis of land cover change trajectories in Tarim
Basin, northwest China, Int. J. Remote Sens., 29(19), 5495–5509, doi:10.1080/01431160802060938.
Applications, 6(2), pp. 204–212. doi: 10.14569/IJACSA.2015.060230.
Ziems, M., Gerke, M. and Heipke, C. (2007) „Automatic Road Extraction From Remote Sensing Imagery
Incorporating Prior Information and Colour Segmentation‟, International Archives of Photogrammetry,
Remote Sensing and Spatial Information Sciences, 36(3/W49A), pp. 141–147.

51