The U.S. Foreign-Born Population: Trends and Selected Characteristics · · 2016-10-21beyond the...
38
CRS Report for Congress Prepared for Members and Committees of Congress The U.S. Foreign-Born Population: Trends and Selected Characteristics William A. Kandel Analyst in Immigration Policy January 18, 2011 Congressional Research Service 7-5700 www.crs.gov R41592
Transcript of The U.S. Foreign-Born Population: Trends and Selected Characteristics · · 2016-10-21beyond the...
CRS Report for CongressPrepared for Members and Committees of Congress
The U.S. Foreign-Born Population: Trends and Selected Characteristics
William A. Kandel Analyst in Immigration Policy
January 18, 2011
Congressional Research Service
7-5700 www.crs.gov
R41592

The U.S. Foreign-Born Population: Trends and Selected Characteristics
Congressional Research Service
Summary This report offers context for consideration of immigration policy options by presenting data on key geographic, demographic, social, and economic characteristics of the foreign-born population residing in the United States. Interest in the U.S. foreign-born population stems in part from the changing demographic profile of the United States as well as the rapidity of such change, and how both of these trends correspond to U.S. immigration policy. Although the foreign born are relatively small in absolute terms—38 million people representing 12.5% of the total U.S. population of 304.1 million in 2008—they are growing far more rapidly than the native-born population. Between 2000 and 2008, the foreign born contributed 30% of the total U.S. population increase and almost all of the prime 25-54 working age group increase. Close to 30% of the foreign born arrived in the United States since 2000, and roughly 29% were residing illegally in the United States in 2009.
Geographic origins of the foreign born have shifted from Europe (74% in 1960) to Latin America and Asia (80% in 2008). In recent years, many foreign born have settled in new urban and rural destinations, often in response to employment opportunities in construction, manufacturing, and low-skilled services. Yet, as in previous decades, at least two-thirds of the foreign born remain concentrated in just six states: California, New York, Florida, Texas, Illinois, and New Jersey.
Several measures of marital status and household structure show little difference between the native born and foreign born. The foreign born have lower average educational attainment, but the proportion with at least a bachelor’s degree matches that of the native born.
In 2008, the foreign born accounted for 15.7% of all workers, with higher labor force participation rates among men and lower rates among women compared to native-born workers. With exceptions, native- and foreign-born workers generally resemble each other in their distribution across broad industrial and occupational sectors. Among specific occupations, however, glaring differences occur, with native-born workers dominating occupations such as construction inspectors and librarians, and foreign-born workers dominating occupations such as agricultural laborers and tailors.
Lower education levels and differences in industrial sector and occupational distributions explain in part why foreign-born workers have lower median incomes and higher poverty rates than native-born workers. Earnings differences are minimal for those with a four-year college degree. Among the foreign born, median incomes of naturalized citizens are 60% higher than those of noncitizens, reflecting higher education levels, older ages, and greater U.S. labor market experience. Poverty status is linked to the lack of citizenship, a difference that is magnified after including the “near-poor,” who earn between 100% and 200% of the poverty threshold.
Although foreign-born population growth and transformation often occur because of factors beyond the control of Congress—including political turmoil and natural disasters in neighboring countries and social and economic processes of globalization—the way that Congress crafts immigration law does influence the size and character of resulting immigration flows to the United States.
The U.S. Foreign-Born Population: Trends and Selected Characteristics
Congressional Research Service
Contents Why Examine the Foreign Born? ................................................................................................1
Foreign-Born Population Growth in Historical Context .........................................................3 Foreign Origins and U.S. Destinations.........................................................................................3
Region of Birth .....................................................................................................................4 Country of Birth....................................................................................................................5 Geographic Distribution in the United States .........................................................................6 Period of Arrival ...................................................................................................................8
Legal Status of the Foreign Born .................................................................................................8 Unauthorized Foreign Born...................................................................................................9 Legal Residents................................................................................................................... 11 Naturalized Citizens ............................................................................................................ 11
Demographic Characteristics..................................................................................................... 13 Age Composition ................................................................................................................ 13 Household and Family Structure and Size ........................................................................... 16
Education and Skills.................................................................................................................. 17 Educational Attainment ....................................................................................................... 17 English Language Ability.................................................................................................... 20
Employment ............................................................................................................................. 21 Labor Force Participation.................................................................................................... 21 Employment by Industrial Sector ........................................................................................ 23 Occupational distribution .................................................................................................... 24
Economic Well-Being ............................................................................................................... 26 Median Income ................................................................................................................... 26 Poverty ............................................................................................................................... 27
Concluding Observations .......................................................................................................... 28
Figures Figure 1. Total U.S. and Total Foreign-Born Population Sizes, 1850-2008 ...................................2
Figure 2. Foreign-Born Population by Region of Birth, 1960 to 2008 ..........................................5
Figure 3. Foreign-Born Population Growth Between 1990 and 2008 ...........................................7
Figure 4. Foreign-Born Period of Arrival by Citizenship Status, 2008..........................................8
Figure 5. Immigration Status of the Foreign-Born Population, 2009.............................................9
Figure 6. Published Estimates of the Unauthorized Population, 1986-2009 ................................ 10
Figure 7. Foreign-Born Population by Citizenship Status, 1970-2008 ........................................ 12
Figure 8. Age Composition of Native-Born and Foreign-Born Populations, 2008....................... 14
Figure 9. Household Structure by Nativity, 2008 ....................................................................... 16
Figure 10. Household Size by Nativity and Citizenship, 2008.................................................... 17
Figure 11. Educational Attainment by Nativity, Citizenship Status, and Period of Arrival, 2008 ...................................................................................................................................... 18
The U.S. Foreign-Born Population: Trends and Selected Characteristics
Congressional Research Service
Figure 12. Educational Attainment of Foreign Born by Birth Region, 2008................................ 19
Figure 13. Poverty Status by Nativity and Citizenship, 2008...................................................... 27
Tables Table 1. Foreign-Born Population by Region of Birth, 1960 to 2008............................................4
Table 2. Ten Leading Countries of Birth for the Foreign-Born Population, 1960-2008 .................6
Table 3. Foreign-Born Citizenship Status by Selected Characteristics, 2008............................... 12
Table 4. Parental Nativity of Children Under Age 18, 2008........................................................ 14
Table 5. Contributions to U.S. Population Change, 2000-2008, by Nativity and Age.................. 15
Table 6. English Language Proficiency by Socio-demographic Characteristics, 2008................. 20
Table 7. Labor Force Participation Rate (LFPR) by Sex, Nativity, and Citizenship Status, 2008 ...................................................................................................................................... 22
Table 8. Industrial Sector Employment by Nativity and Citizenship, 2008 ................................. 23
Table 9. Occupational Distribution by Nativity and Citizenship, 2008........................................ 24
Table 10. Sex and Nativity Composition of Selected Occupations, 2008.................................... 25
Table 11. Median Income by Nativity, Education, and Citizenship, 2008 ................................... 26
Table 12. Foreign-Born Poverty Rates by Socio-demographic Characteristics, 2008 .................. 28
Table A-1. Selected State-Level Characteristics, 2008 ............................................................... 31
Table A-2. Labor Force Participation, Foreign Born, by Gender................................................. 33
Table A-3. Proportion of Naturalized Foreign-Born Population by Region of Origin and Decade of Arrival to the United States.................................................................................... 34
Appendixes Appendix. ................................................................................................................................. 30
Contacts Author Contact Information ...................................................................................................... 34

The U.S. Foreign-Born Population: Trends and Selected Characteristics
Congressional Research Service 1
Why Examine the Foreign Born? This report offers context for consideration of immigration policy options by presenting data on key geographic, demographic, social, and economic characteristics of the foreign-born population residing in the United States. Data on the native-born population are often shown for comparison. The report relies heavily on the 2008 American Community Survey (ACS) Public Use Micro Sample (PUMS), the largest most representative and recent dataset available on the U.S. population.1 In some instances, other data sources, such as Decennial Census and Current Population Survey data are introduced. At times, the report discusses possible reasons for patterns observed in the data.
The term “foreign-born” used in this report refers to people born outside the United States who do not automatically acquire citizenship at birth. The foreign born have a variety of immigration statuses and include immigrants,2 refugees, nonimmigrants,3 and persons illegally residing in the United States.4 This report often distinguishes between two groups of foreign-born individuals: noncitizens (a broad category that includes unauthorized aliens as well as legal permanent residents) and naturalized U.S. citizens.
Interest in the U.S. foreign born stems, in part, from the changing demographic profile of the U.S. population, the rapidity of such change, and how both trends correspond to the objectives of U.S. immigration policy.5 Although relatively small in absolute terms, the foreign born are growing faster than the native-born population generally and specifically among young people and the civilian labor force.6 Moreover, much policy attention is devoted to dealing with the estimated 11.1 million foreign born (as of 2009) residing illegally in the United States.7
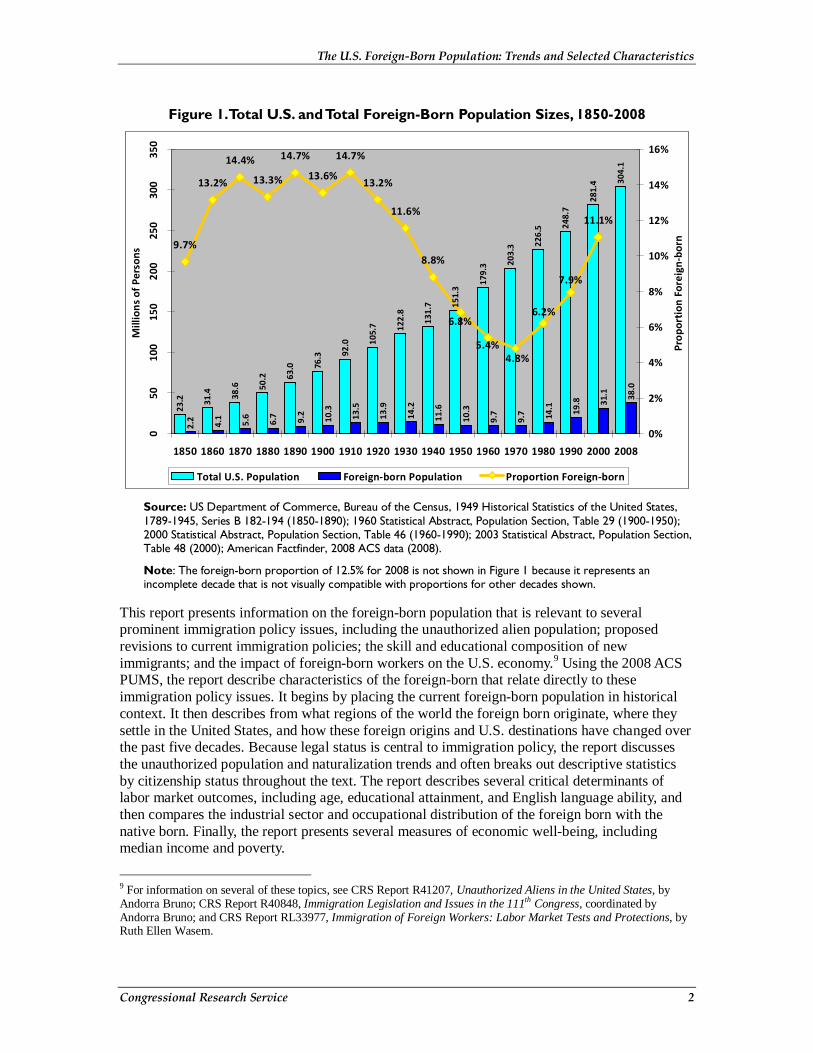
In 1970, the foreign born numbered 9.7 million people, or 4.8% of the total U.S. population, their lowest proportion since 1850.8 By 2008, the foreign-born population had increased to 38.0 million people representing 12.5% of the total U.S. population (see Figure 1). Although the absolute number of foreign born is higher than at any point in the nation’s history, the proportion of the foreign born to the total U.S. population is lower than peaks reached at the beginning of the 20th Century.
1 U.S. Census Bureau, American Community Survey Public Use Microdata Sample (PUMS) Technical Documentation, 2010, http://www.census.gov/acs/www/data_documentation/pums_documentation/. 2 The term immigrant refers to any foreign national admitted to the United States for lawful permanent residence. Those who obtain citizenship through naturalization are classified as naturalized citizens, and all others are classified as noncitizens. 3 Nonimmigrants refers to foreign nationals admitted on a temporary basis and include tourists, diplomats, foreign students, persons on work visas, temporary agricultural workers, and exchange visitors. 4 The foreign-born population is not the same as the “foreign stock” which includes both the foreign born as well as native-born children of foreign-born parents. 5 For more extensive discussion on U.S. demographic composition, see CRS Report RL32701, The Changing Demographic Profile of the United States, by Laura B. Shrestha and Elayne J. Heisler. 6 For more information, see CRS Report 95-408, Immigration: The Effects on Low-Skilled and High-Skilled Native-Born Workers, by Linda Levine. 7 For more information, see CRS Report R41207, Unauthorized Aliens in the United States, by Andorra Bruno. 8 U.S. census data on the foreign born prior to 1850 are not available.
The U.S. Foreign-Born Population: Trends and Selected Characteristics
Congressional Research Service 2
Figure 1. Total U.S. and Total Foreign-Born Population Sizes, 1850-2008
23.2 31
.4 38.6 50
.2 63.0 76
.3 92.0 10
5.7 12
2.8
131.
7 151.
3
179.
3 203.
3 226.
5 248.
7
281.
4 304.
1
2.2
4.1
5.6
6.7 9.2
10.3
13.5
13.9
14.2
11.6
10.3
9.7
9.7 14
.1 19.8 31
.1 38.0
9.7%
13.2%
14.4%
13.3%
14.7%
13.6%
14.7%
13.2%
11.6%
8.8%
11.1%
7.9%
6.2%
4.8%5.4%
6.8%
050
100
150
200
250
300
350
1850 1860 1870 1880 1890 1900 1910 1920 1930 1940 1950 1960 1970 1980 1990 2000 2008
Mill
ions
of P
erso
ns
0%
2%
4%
6%
8%
10%
12%
14%
16%
Prop
orti
on F
orei
gn-b
orn
Total U.S. Population Foreign-born Population Proportion Foreign-born
Source: US Department of Commerce, Bureau of the Census, 1949 Historical Statistics of the United States, 1789-1945, Series B 182-194 (1850-1890); 1960 Statistical Abstract, Population Section, Table 29 (1900-1950); 2000 Statistical Abstract, Population Section, Table 46 (1960-1990); 2003 Statistical Abstract, Population Section, Table 48 (2000); American Factfinder, 2008 ACS data (2008).
Note: The foreign-born proportion of 12.5% for 2008 is not shown in Figure 1 because it represents an incomplete decade that is not visually compatible with proportions for other decades shown.
This report presents information on the foreign-born population that is relevant to several prominent immigration policy issues, including the unauthorized alien population; proposed revisions to current immigration policies; the skill and educational composition of new immigrants; and the impact of foreign-born workers on the U.S. economy.9 Using the 2008 ACS PUMS, the report describe characteristics of the foreign-born that relate directly to these immigration policy issues. It begins by placing the current foreign-born population in historical context. It then describes from what regions of the world the foreign born originate, where they settle in the United States, and how these foreign origins and U.S. destinations have changed over the past five decades. Because legal status is central to immigration policy, the report discusses the unauthorized population and naturalization trends and often breaks out descriptive statistics by citizenship status throughout the text. The report describes several critical determinants of labor market outcomes, including age, educational attainment, and English language ability, and then compares the industrial sector and occupational distribution of the foreign born with the native born. Finally, the report presents several measures of economic well-being, including median income and poverty.
9 For information on several of these topics, see CRS Report R41207, Unauthorized Aliens in the United States, by Andorra Bruno; CRS Report R40848, Immigration Legislation and Issues in the 111th Congress, coordinated by Andorra Bruno; and CRS Report RL33977, Immigration of Foreign Workers: Labor Market Tests and Protections, by Ruth Ellen Wasem.

The U.S. Foreign-Born Population: Trends and Selected Characteristics
Congressional Research Service 3
Foreign-Born Population Growth in Historical Context In 2008, the nation’s 38.0 million foreign-born persons represented 12.5% of the total U.S. population (Figure 1). While this proportion remains lower than those reached during the turn of the last century, Figure 1 illustrates that the proportion of the foreign-born population has increased steadily since 1970. Moreover, the foreign-born contribution to total population growth in recent years—30.3% between 2000 and 2008—has been disproportionate compared to its size.
The relatively high foreign-born proportion between 1860 and 1920 resulted from several factors, including the U.S. industrial revolution, which generated substantial labor demand; political and economic turmoil throughout Europe during the latter 19th Century; and the expansion of affordable transatlantic travel.10 In response to these historically high immigration flows, Congress passed the Immigration Act of 1924, which limited, by country, the number of new immigrants to a proportion of those already living in the United States and reduced immigration levels overall.11 The Great Depression reduced the foreign-born population by curtailing U.S. labor demand and worldwide migration flows.12
Foreign Origins and U.S. Destinations The Immigration and Nationality Act (INA) of 1952 collected and codified existing immigration law provisions into one organized structure.13 Amended many times, it remains the foundation of U.S. immigration law. The 1952 Act introduced a system of preferences based on family reunification and skills that upheld and reinforced the national origins quota system established in 1924.14 In 1965, Congress amended the INA, removing widely perceived discriminatory provisions of previous immigration laws and loosening numerical restrictions on immigration. The 1965 revisions to the INA also had the effect of gradually shifting the ethnic composition of the immigrant flow away from Europe and toward Latin America and Asia.15 Subsequent legislation—such as the Refugee Act of 198016; the Immigration Reform and Control Act of 198617, which legalized the status of 2.7 million previously unauthorized residents; and the Immigration and Nationality Act Amendments of 199018—have all increased the number of the foreign born directly by expanding legal immigration to the United States. These laws have also increased the numbers of foreign born indirectly because naturalized immigrants and legal permanent residents can sponsor for citizenship their relatives living abroad.19
10 Aristide R. Zolberg, A Nation by Design: Immigration Policy in the Fashioning of America (Russell Sage Foundation and Harvard University Press, 2006), pp. 166-242. 11 Ibid, pp. 243-292. 12 Ibid. 13 P.L. 82-414, 182 Stat. 66, also known as the McCarran-Walter Act of 1952. 14 For more information, refer to the Office of the Historian, Bureau of Public Affairs, Milestones: 1945-1952: The Immigration and Nationality Act of 1952 (The McCarran-Walter Act), U.S. Department of State, Washington, DC, http://history.state.gov/milestones/1945-1952/ImmigrationAct. 15 Ibid, p. 337. 16 P.L. 96-212. For more information and an example, see CRS Report RS20154, Kosovo: Refugee Assistance and Temporary Resettlement, by Lois B. McHugh and Joyce C. Vialet. 17 P.L. 99-603, 100 Stat. 3359 (Nov. 6, 1986). 18 P.L. 101-649, 104 Stat. 4978 (Nov. 29, 1990). 19 Current U.S. immigration policy permits U.S. citizens and legal permanent residents to petition on behalf of relatives (continued...)

The U.S. Foreign-Born Population: Trends and Selected Characteristics
Congressional Research Service 4
Legislation aside, the U.S. foreign born also expanded from the aftermath of the Vietnam War, Central American political turmoil, greater numbers of U.S.-based foreign-born students and business people, and greater U.S. citizen contact with foreign nationals from international travel, study, and work assignments.
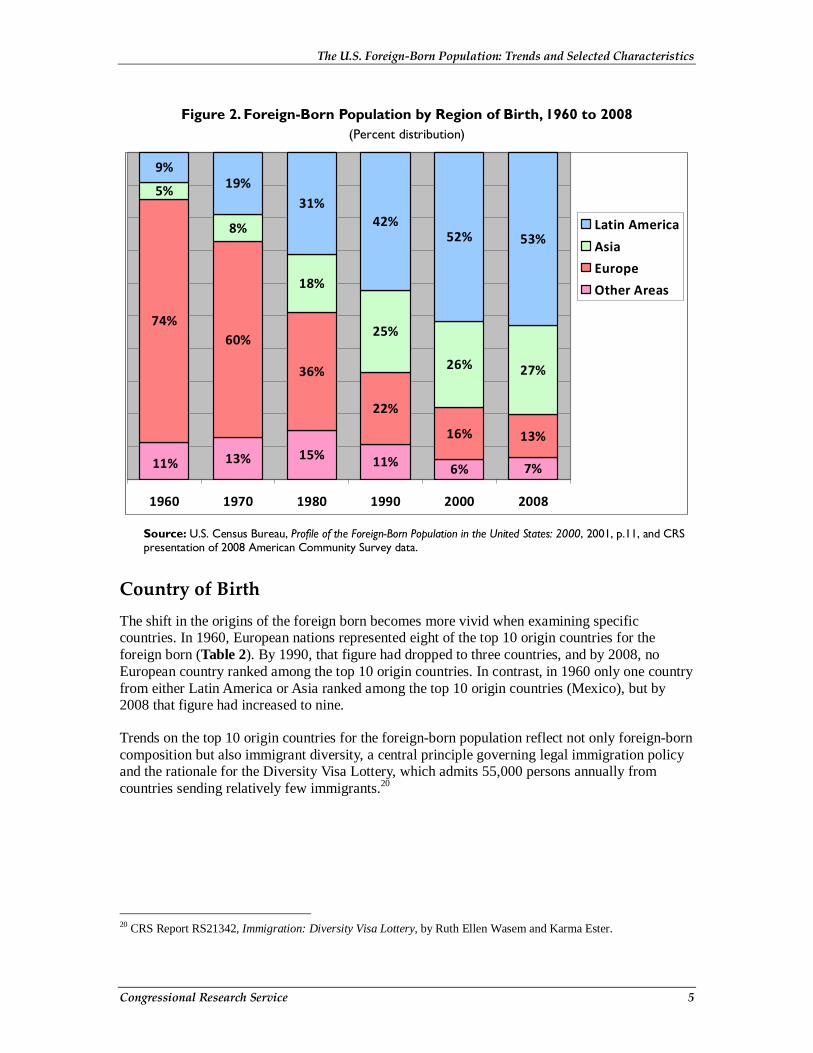
Region of Birth Origin countries of the foreign born have changed since 1960 in ways that have increased U.S. population diversity. The absolute number of foreign born by region of birth (Table 1) and the percent distribution of the total foreign-born population by region (Figure 2) illustrate these trends. The proportion of all foreign-born persons originating from Europe declined from 74% in 1960 to 13% by 2008. Over the same period, fivefold increases occurred in the proportion from Latin America (9% to 53%) and Asia (5% to 27%). Proportions from other areas, including Canada, increased and then dropped over this period, although absolute numbers from these areas have increased steadily.
Table 1. Foreign-Born Population by Region of Birth, 1960 to 2008 (Millions of persons)
1960 1970 1980 1990 2000 2008
Other Areas 1.1 1.2 2.1 2.1 1.8 2.5
Europe 7.3 5.7 5.1 4.4 4.9 5.0
Asia 0.5 0.8 2.5 5.0 8.2 10.3
Latin America 0.9 1.8 4.4 8.4 16.1 20.2
Total 9.8 9.5 14.1 19.9 31.1 38.0
Source: U.S. Census Bureau, Profile of the Foreign-Born Population in the United States: 2000, 2001, p.11; and CRS presentation of 2008 American Community Survey data.
Note: Differences between totals in Table 1 and Figure 1 are due to rounding.
(...continued)
living abroad according to a set of preferences. The largest number of beneficiaries consist of immediate family members of petitioners (spouses, minor children, and parents for petitioners ages 21 and older) who face no numerical restrictions. Relatives of petitioners who fall into other family-based preference categories face total annual numerical quotas. For instance, in 2009, of the 747,413 persons who obtained legal permanent residence within family-based provisions of U.S. immigration policy, 535,554 persons, or 72% did so as immediate family members of U.S. citizens and LPRs. For more information on family-based preference admissions, see CRS Report RL32235, U.S. Immigration Policy on Permanent Admissions, by Ruth Ellen Wasem.
The U.S. Foreign-Born Population: Trends and Selected Characteristics
Congressional Research Service 5
Figure 2. Foreign-Born Population by Region of Birth, 1960 to 2008 (Percent distribution)
13% 15% 11% 6% 7%
74%60%
36%
22%
16% 13%
5%
8%
18%
25%
26% 27%
9%19%
31%42%
52% 53%
11%
1960 1970 1980 1990 2000 2008
Latin America
Asia
Europe
Other Areas
Source: U.S. Census Bureau, Profile of the Foreign-Born Population in the United States: 2000, 2001, p.11, and CRS presentation of 2008 American Community Survey data.
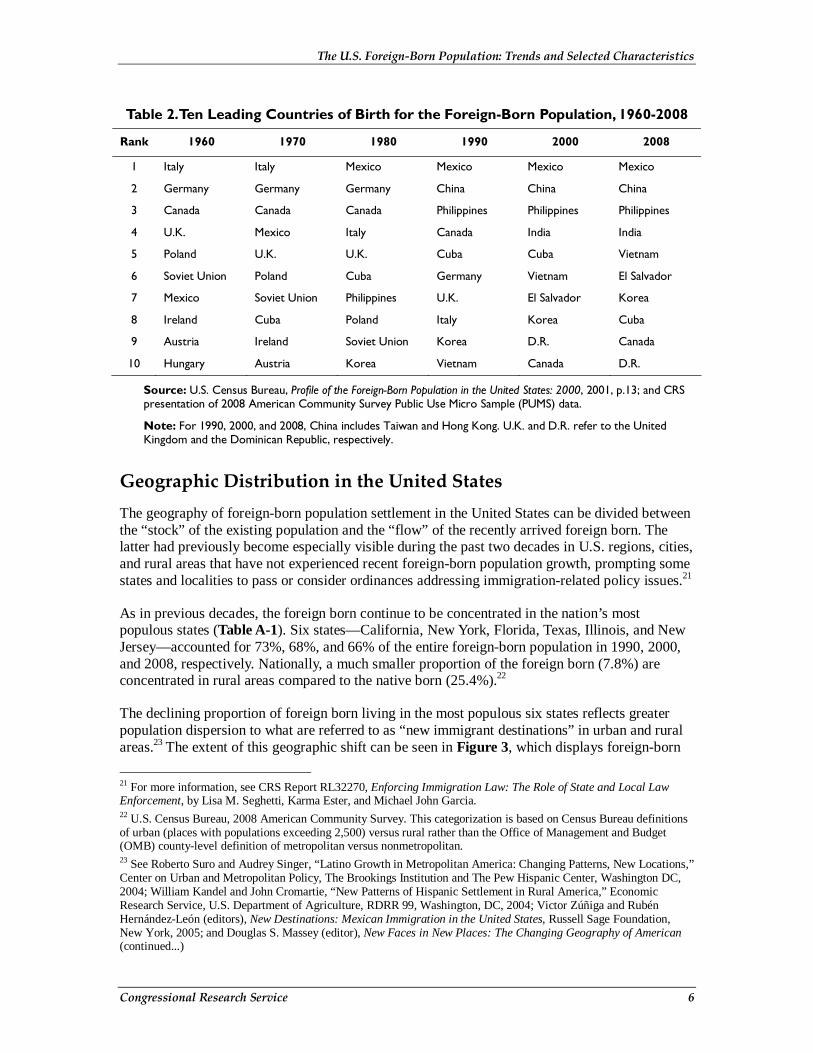
Country of Birth The shift in the origins of the foreign born becomes more vivid when examining specific countries. In 1960, European nations represented eight of the top 10 origin countries for the foreign born (Table 2). By 1990, that figure had dropped to three countries, and by 2008, no European country ranked among the top 10 origin countries. In contrast, in 1960 only one country from either Latin America or Asia ranked among the top 10 origin countries (Mexico), but by 2008 that figure had increased to nine.
Trends on the top 10 origin countries for the foreign-born population reflect not only foreign-born composition but also immigrant diversity, a central principle governing legal immigration policy and the rationale for the Diversity Visa Lottery, which admits 55,000 persons annually from countries sending relatively few immigrants.20
20 CRS Report RS21342, Immigration: Diversity Visa Lottery, by Ruth Ellen Wasem and Karma Ester.
The U.S. Foreign-Born Population: Trends and Selected Characteristics
Congressional Research Service 6
Table 2. Ten Leading Countries of Birth for the Foreign-Born Population, 1960-2008
Rank 1960 1970 1980 1990 2000 2008
1 Italy Italy Mexico Mexico Mexico Mexico
2 Germany Germany Germany China China China
3 Canada Canada Canada Philippines Philippines Philippines
4 U.K. Mexico Italy Canada India India
5 Poland U.K. U.K. Cuba Cuba Vietnam
6 Soviet Union Poland Cuba Germany Vietnam El Salvador
7 Mexico Soviet Union Philippines U.K. El Salvador Korea
8 Ireland Cuba Poland Italy Korea Cuba
9 Austria Ireland Soviet Union Korea D.R. Canada
10 Hungary Austria Korea Vietnam Canada D.R.
Source: U.S. Census Bureau, Profile of the Foreign-Born Population in the United States: 2000, 2001, p.13; and CRS presentation of 2008 American Community Survey Public Use Micro Sample (PUMS) data.
Note: For 1990, 2000, and 2008, China includes Taiwan and Hong Kong. U.K. and D.R. refer to the United Kingdom and the Dominican Republic, respectively.
Geographic Distribution in the United States The geography of foreign-born population settlement in the United States can be divided between the “stock” of the existing population and the “flow” of the recently arrived foreign born. The latter had previously become especially visible during the past two decades in U.S. regions, cities, and rural areas that have not experienced recent foreign-born population growth, prompting some states and localities to pass or consider ordinances addressing immigration-related policy issues.21
As in previous decades, the foreign born continue to be concentrated in the nation’s most populous states (Table A-1). Six states—California, New York, Florida, Texas, Illinois, and New Jersey—accounted for 73%, 68%, and 66% of the entire foreign-born population in 1990, 2000, and 2008, respectively. Nationally, a much smaller proportion of the foreign born (7.8%) are concentrated in rural areas compared to the native born (25.4%).22
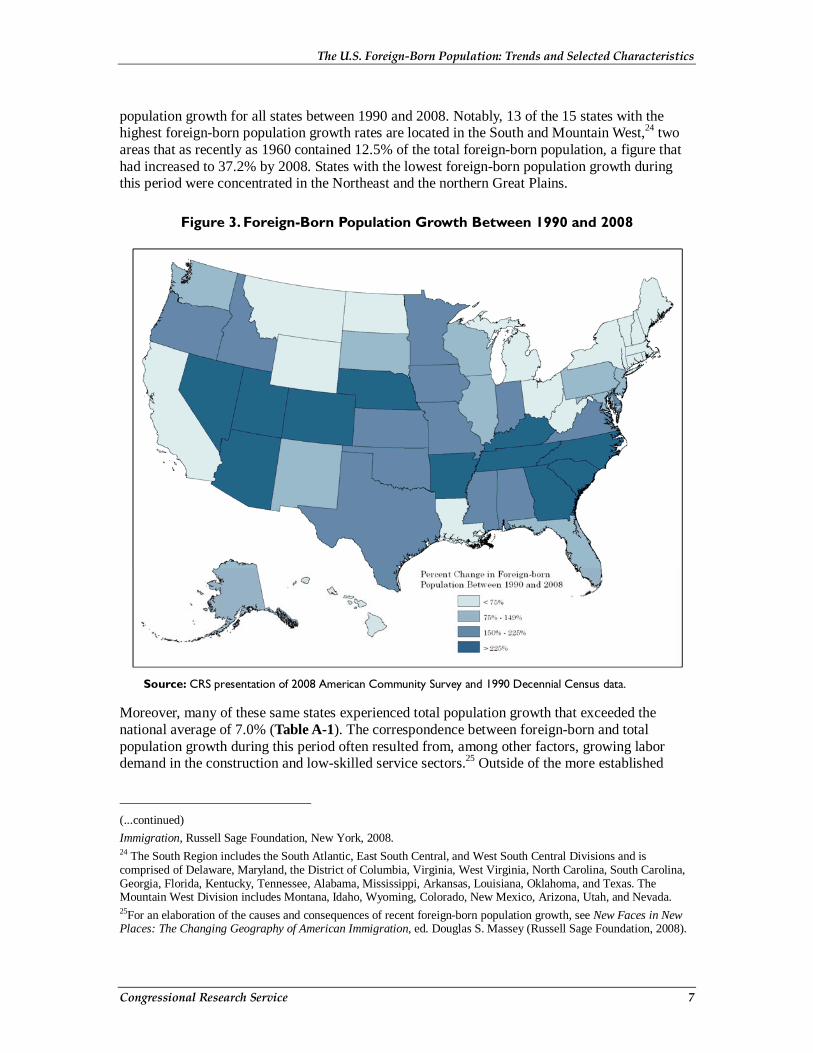
The declining proportion of foreign born living in the most populous six states reflects greater population dispersion to what are referred to as “new immigrant destinations” in urban and rural areas.23 The extent of this geographic shift can be seen in Figure 3, which displays foreign-born
21 For more information, see CRS Report RL32270, Enforcing Immigration Law: The Role of State and Local Law Enforcement, by Lisa M. Seghetti, Karma Ester, and Michael John Garcia. 22 U.S. Census Bureau, 2008 American Community Survey. This categorization is based on Census Bureau definitions of urban (places with populations exceeding 2,500) versus rural rather than the Office of Management and Budget (OMB) county-level definition of metropolitan versus nonmetropolitan. 23 See Roberto Suro and Audrey Singer, “Latino Growth in Metropolitan America: Changing Patterns, New Locations,” Center on Urban and Metropolitan Policy, The Brookings Institution and The Pew Hispanic Center, Washington DC, 2004; William Kandel and John Cromartie, “New Patterns of Hispanic Settlement in Rural America,” Economic Research Service, U.S. Department of Agriculture, RDRR 99, Washington, DC, 2004; Victor Zúñiga and Rubén Hernández-León (editors), New Destinations: Mexican Immigration in the United States, Russell Sage Foundation, New York, 2005; and Douglas S. Massey (editor), New Faces in New Places: The Changing Geography of American (continued...)
The U.S. Foreign-Born Population: Trends and Selected Characteristics
Congressional Research Service 7
population growth for all states between 1990 and 2008. Notably, 13 of the 15 states with the highest foreign-born population growth rates are located in the South and Mountain West,24 two areas that as recently as 1960 contained 12.5% of the total foreign-born population, a figure that had increased to 37.2% by 2008. States with the lowest foreign-born population growth during this period were concentrated in the Northeast and the northern Great Plains.
Figure 3. Foreign-Born Population Growth Between 1990 and 2008
Source: CRS presentation of 2008 American Community Survey and 1990 Decennial Census data.
Moreover, many of these same states experienced total population growth that exceeded the national average of 7.0% (Table A-1). The correspondence between foreign-born and total population growth during this period often resulted from, among other factors, growing labor demand in the construction and low-skilled service sectors.25 Outside of the more established
(...continued)
Immigration, Russell Sage Foundation, New York, 2008. 24 The South Region includes the South Atlantic, East South Central, and West South Central Divisions and is comprised of Delaware, Maryland, the District of Columbia, Virginia, West Virginia, North Carolina, South Carolina, Georgia, Florida, Kentucky, Tennessee, Alabama, Mississippi, Arkansas, Louisiana, Oklahoma, and Texas. The Mountain West Division includes Montana, Idaho, Wyoming, Colorado, New Mexico, Arizona, Utah, and Nevada. 25For an elaboration of the causes and consequences of recent foreign-born population growth, see New Faces in New Places: The Changing Geography of American Immigration, ed. Douglas S. Massey (Russell Sage Foundation, 2008).
The U.S. Foreign-Born Population: Trends and Selected Characteristics
Congressional Research Service 8
destination states of Texas and Florida, foreign-born population growth in the South and Mountain West represents a considerable demographic shift.
Figure 4. Foreign-Born Period of Arrival by Citizenship Status, 2008 1.
3% 2.8%
0.2%3.
0% 6.1%
0.7%
6.1%
11.4
%
2.1%
11.4
%
19.5
%
5.2%
20.0
%
27.7
%
14.2
%
28.7
%
25.5
%
31.1
%
29.5
%
7.0%
46.5
%
All Foreign-born Naturalized Citizen Foreign-born Noncitizen Foreign-born
Before 1950 1950-59 1960-69 1970-79 1980-89 1990-99 2000-08
Source: CRS Presentation of 2008 American Community Survey PUMS data.
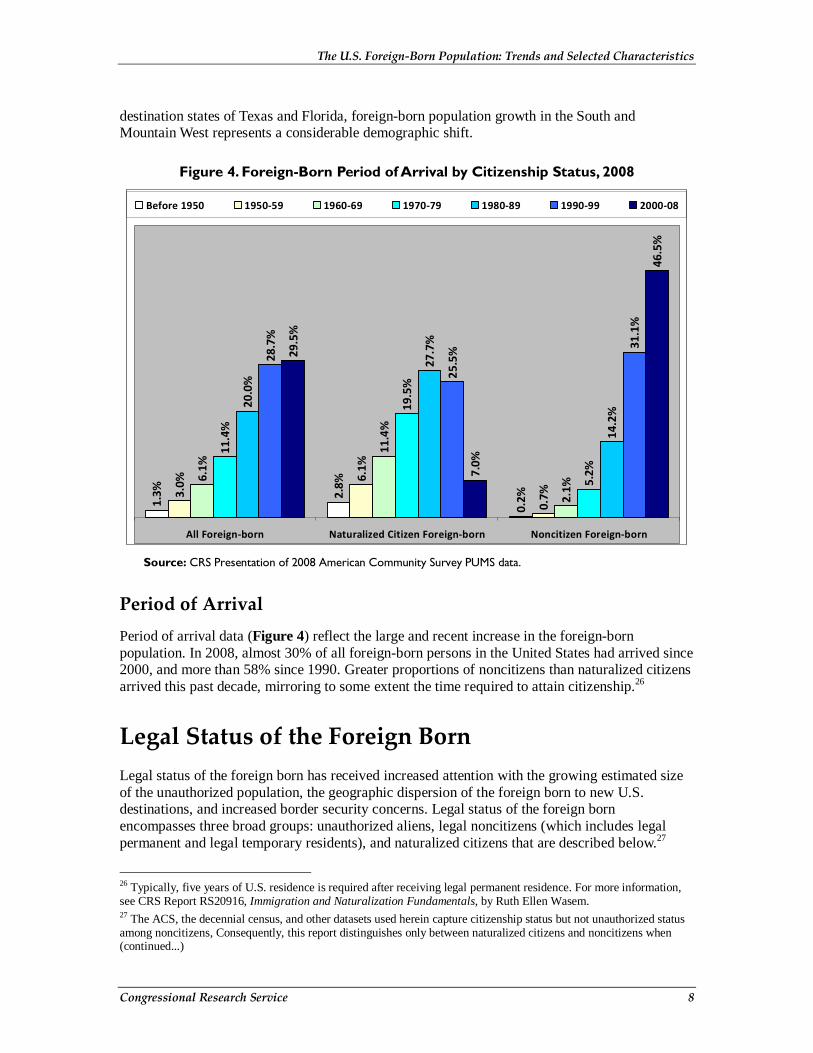
Period of Arrival Period of arrival data (Figure 4) reflect the large and recent increase in the foreign-born population. In 2008, almost 30% of all foreign-born persons in the United States had arrived since 2000, and more than 58% since 1990. Greater proportions of noncitizens than naturalized citizens arrived this past decade, mirroring to some extent the time required to attain citizenship.26
Legal Status of the Foreign Born Legal status of the foreign born has received increased attention with the growing estimated size of the unauthorized population, the geographic dispersion of the foreign born to new U.S. destinations, and increased border security concerns. Legal status of the foreign born encompasses three broad groups: unauthorized aliens, legal noncitizens (which includes legal permanent and legal temporary residents), and naturalized citizens that are described below.27
26 Typically, five years of U.S. residence is required after receiving legal permanent residence. For more information, see CRS Report RS20916, Immigration and Naturalization Fundamentals, by Ruth Ellen Wasem. 27 The ACS, the decennial census, and other datasets used herein capture citizenship status but not unauthorized status among noncitizens, Consequently, this report distinguishes only between naturalized citizens and noncitizens when (continued...)

The U.S. Foreign-Born Population: Trends and Selected Characteristics
Congressional Research Service 9
Figure 5. Immigration Status of the Foreign-Born Population, 2009
LegalPermanent Residents
31.4%
Legal Temporary Residents
3.5%
Unauthorized Residents
28.1%
Naturalized citizens37.0%
Source: Jeffrey S. Passel and D’Vera Cohn. “U.S. Unauthorized Immigration Flows Are Down Sharply Since Mid-Decade,” Pew Hispanic Center, Washington, DC, September 1, 2010.
Note: Figures are imputed by the Pew Hispanic Center, which estimates the unauthorized alien population using the “residual method,” a widely used demographic technique based on official government data, notably the March Supplements to the Current Population Survey (CPS).
According to the most recent estimates of foreign-born legal status (Figure 5), unauthorized aliens, legal residents (permanent and temporary) and naturalized citizens made up, respectively, 28.1%, 34.9% and 37.0% of the foreign-born population. Applied to the total estimated foreign-born population of 38.0 million persons in 2008, these percentages yield absolute population sizes of 10.7 million for unauthorized aliens, 13.3 million for legal residents, and 14.0 million for naturalized citizens.
Unauthorized Foreign Born28 Unauthorized aliens are part of the noncitizen foreign-born population captured by the American Community Survey. However, surveys of the population such as the ACS, the CPS and other nationally representative datasets are only permitted to record if respondents are citizens, but not if they are unauthorized aliens. Therefore, policymakers typically rely on estimates produced by
(...continued)
presenting descriptive statistics. 28 For an extended discussion of the unauthorized population, see CRS Report R41207, Unauthorized Aliens in the United States, by Andorra Bruno and Jeffrey S. Passel and Paul Taylor, Unauthorized Immigrants and Their U.S.-Born Children, Pew Hispanic Center, Washington, DC, August 11, 2010, http://pewhispanic.org/files/reports/125.pdf.

The U.S. Foreign-Born Population: Trends and Selected Characteristics
Congressional Research Service 10
government agencies and private organizations to have a sense of how many unauthorized noncitizens live in the United States. In 2009, the unauthorized population was estimated at roughly 11 million persons (Figure 6).
Figure 6. Published Estimates of the Unauthorized Population, 1986-2009 3.
2
1.9
3.5
3.4
5.8
8.4
9.4
9.3 9.
8 10.3
10.5
11.6
11.8
11.6
10.8
0
2
4
6
8
10
12
14
1986
1987
1988
1989
1990
1991
1992
1993
1994
1995
1996
1997
1998
1999
2000
2001
2002
2003
2004
2005
2006
2007
2008
2009
Millions
Source: CRS presentation of estimates produced by Woodrow and Passel (1990) for 1986 and 1988; Warren (2000) for 1992; Warren (2003) for 1990 and 1996; Passel, Capps, and Fix (2004) for 2002; Passel and Cohn (2008) for 2000, 2001, 2003, 2004; Hoefer, Rytina, and Campbell (2006, 2007), respectively, for 2005 and 2006; and Hoefer, Rytina, and Baker (2008, 2009, 2010), respectively, for 2007, 2008, and 2009.
Note: Estimates presented before 2003 are based on the Current Population Survey data, and those from 2003 forward are based on the American Community Survey data.
Estimates of the unauthorized population in Figure 6 are shown from 1986, the year Congress passed the Immigration Reform and Control Act (IRCA), which legalized 2.7 million unauthorized aliens, through the most recent year for which reliable estimates are available (2009).29 Some attribute declining incoming flows and estimated unauthorized population sizes
29 Karen Woodrow and Jeffrey Passel, “Post-IRCA Undocumented Immigration to the United States: An Analysis Based on the June 1988 CPS,” in Undocumented Migration to the United States, by Frank D. Bean, Barry Edmonston, and Jeffrey Passel, RAND Corporation, 1990; Robert Warren, Annual Estimates of the Unauthorized Immigrant Population Residing in the United States and Components of Change: 1987 to 1997, Office of Policy and Planning, U.S. Immigration and Naturalization Service, September 2000; Robert Warren, Estimates of the Unauthorized Immigrant Population Residing in the United States, 1990 to 2000, Office of Policy and Planning, U.S. Immigration and Naturalization Service, January 2003; Jeffrey Passel, Randy Capps, and Michael Fix, Undocumented Immigrants: Facts and Figures, The Urban Institute, January 2004; Jeffrey S. Passel and D'Vera Cohn, Trends in Unauthorized Immigration: Undocumented Inflow Now Trails Legal Inflow, Pew Hispanic Center, October 2008; Michael Hoefer, Nancy Rytina, and Christopher Campbell, Estimates of the Unauthorized Immigrant Population Residing in the United States: January 2005, Office of Immigration Statistics, Department of Homeland Security, February 2006; Michael Hoefer, Nancy Rytina, and Christopher Campbell, Estimates of the Unauthorized Immigrant Population Residing in the (continued...)

The U.S. Foreign-Born Population: Trends and Selected Characteristics
Congressional Research Service 11
after 2007 to the economic downturn and increased enforcement efforts.30 Some have suggested that greater enforcement of immigration laws likely reduced the overall flow from what it would have been during this period without such action.31
Legal Residents Legal residents include immigrants and nonimmigrants. Immigrants are synonymous with legal permanent residents (LPRs) and refer to foreign nationals who come to live lawfully and permanently in the United States.32 Nonimmigrants are admitted for a designated period of time and a specific purpose, and include foreign students, diplomats, temporary agricultural workers, persons on work assignments, and exchange visitors, among others. Conditions for immigrant admission to the United States are more stringent than those for nonimmigrants, yet once admitted, immigrants are subject to few restrictions regarding changes in employment and may apply for U.S. citizenship through the naturalization process, generally after five years.33
Naturalized Citizens The process of converting legal permanent resident status to U.S. citizenship is referred to as naturalization. In most cases, persons wishing to naturalize must first be permanent residents. Naturalization requires applicants to possess certain eligibility criteria, including a minimum age of 18; permanent residency status for five years (three years in some circumstances); good moral character; basic knowledge of U.S. government; continuous presence in the United States (generally fewer than 6 months abroad during the entire permanent residency status period requirement); and the ability to read, write, and speak basic English.34 Because citizenship confers the right to vote, naturalization trends may sometimes have political impacts. Over the longer term, however, naturalization trends have demographic implications because citizens are accorded higher preferences than legal permanent residents under U.S. immigration law to sponsor immediate and extended family members to live in the United States. As Figure 7
(...continued)
United States: January 2006, Office of Immigration Statistics, Department of Homeland Security, February 2007; Michael Hoefer, Nancy Rytina, and Bryan C. Baker, Estimates of the Unauthorized Immigrant Population Residing in the United States: January 2007, Office of Immigration Statistics, Department of Homeland Security, February 2008; Michael Hoefer, Nancy Rytina, and Bryan C. Baker, Estimates of the Unauthorized Immigrant Population Residing in the United States: January 2008, Office of Immigration Statistics, Department of Homeland Security, February 2009; and Michael Hoefer, Nancy Rytina, and Bryan C. Baker, Estimates of the Unauthorized Immigrant Population Residing in the United States: January 2009, Office of Immigration Statistics, Department of Homeland Security, January 2010. For more information on estimates of the unauthorized population, see CRS Report RL33874, Unauthorized Aliens Residing in the United States: Estimates Since 1986, by Ruth Ellen Wasem. 30 Jeffrey S. Passel and D'Vera Cohn, U.S. Unauthorized Immigration Flows Are Down Sharply Since Mid-Decade, Pew Hispanic Center, September 2010. 31 Ibid. 32 For more information on permanent legal residents, see CRS Report RL32235, U.S. Immigration Policy on Permanent Admissions, by Ruth Ellen Wasem. 33 For more information on nonimmigrants, see CRS Report RL31381, U.S. Immigration Policy on Temporary Admissions, by Ruth Ellen Wasem. 34 For more information, see CRS Report RS20916, Immigration and Naturalization Fundamentals, by Ruth Ellen Wasem.

The U.S. Foreign-Born Population: Trends and Selected Characteristics
Congressional Research Service 12
illustrates, in the past four decades, the total foreign-born population has increased while the proportion of the naturalized foreign born has declined from 63.6% in 1970 to 43.0% in 2008.
Figure 7. Foreign-Born Population by Citizenship Status, 1970-2008
3,541,5506,969,431
11,770,318
18,565,26321,631,026
6,198,173
7,110,475
7,996,998
12,542,626
16,329,909
43.0%
40.3%
40.5%
50.5%
63.6%
1970 1980 1990 2000 2008
% Naturalized
Naturalized
Noncitizen
Source: CRS presentation of data from Historical Statistics of the United States, Millennium Edition Online, Table Ad256-279, http://hsus.cambridge.org/HSUSWeb/toc/tableToc.do?id=Ad280-318 (1970-1990); Decennial Census (2000); and American Community Survey (2008).
Note: Noncitizens include legal permanent residents, other persons with legal status, and unauthorized aliens.
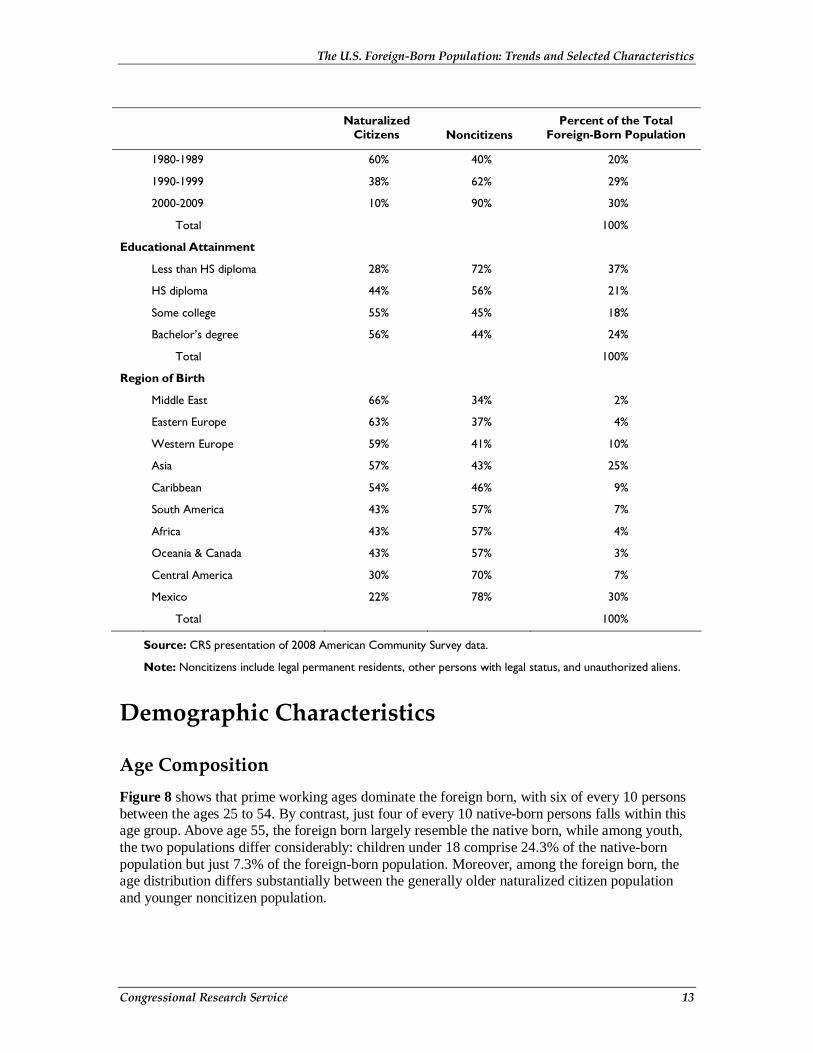
U.S. experience, or the number of years spent in the United States since arrival, and education are positively associated with citizenship status (Table 3). Foreign-born persons who arrived in the United States in earlier decades or who possess a bachelor’s degree show higher proportions who naturalized than those arriving more recently or who lack a high school diploma. According to 2008 data, most foreign born from the Middle East, Europe, Asia, and the Caribbean were naturalized, in contrast to their counterparts from Central America and Mexico who had larger proportions of recent U.S. arrivals.
Table 3. Foreign-Born Citizenship Status by Selected Characteristics, 2008
Naturalized
Citizens Noncitizens Percent of the Total
Foreign-Born Population
Period of U.S. Arrival
Before 1950 92% 8% 1%
1950-1959 87% 13% 3%
1960-1969 81% 19% 6%
1970-1979 74% 26% 11%
The U.S. Foreign-Born Population: Trends and Selected Characteristics
Congressional Research Service 13
Naturalized
Citizens Noncitizens Percent of the Total
Foreign-Born Population
1980-1989 60% 40% 20%
1990-1999 38% 62% 29%
2000-2009 10% 90% 30%
Total 100%
Educational Attainment
Less than HS diploma 28% 72% 37%
HS diploma 44% 56% 21%
Some college 55% 45% 18%
Bachelor’s degree 56% 44% 24%
Total 100%
Region of Birth
Middle East 66% 34% 2%
Eastern Europe 63% 37% 4%
Western Europe 59% 41% 10%
Asia 57% 43% 25%
Caribbean 54% 46% 9%
South America 43% 57% 7%
Africa 43% 57% 4%
Oceania & Canada 43% 57% 3%
Central America 30% 70% 7%
Mexico 22% 78% 30%
Total 100%
Source: CRS presentation of 2008 American Community Survey data.
Note: Noncitizens include legal permanent residents, other persons with legal status, and unauthorized aliens.
Demographic Characteristics
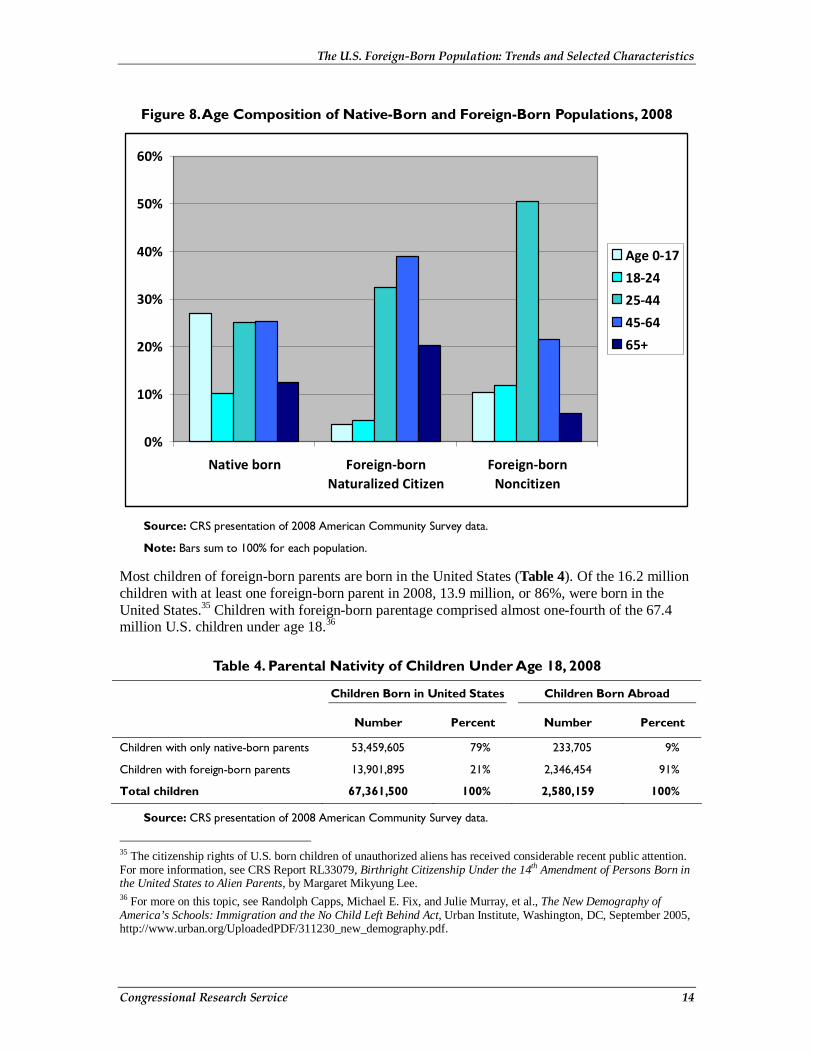
Age Composition Figure 8 shows that prime working ages dominate the foreign born, with six of every 10 persons between the ages 25 to 54. By contrast, just four of every 10 native-born persons falls within this age group. Above age 55, the foreign born largely resemble the native born, while among youth, the two populations differ considerably: children under 18 comprise 24.3% of the native-born population but just 7.3% of the foreign-born population. Moreover, among the foreign born, the age distribution differs substantially between the generally older naturalized citizen population and younger noncitizen population.
The U.S. Foreign-Born Population: Trends and Selected Characteristics
Congressional Research Service 14
Figure 8. Age Composition of Native-Born and Foreign-Born Populations, 2008
0%
10%
20%
30%
40%
50%
60%
Native born Foreign-bornNaturalized Citizen
Foreign-bornNoncitizen
Age 0-17
18-24
25-44
45-64
65+
Source: CRS presentation of 2008 American Community Survey data.
Note: Bars sum to 100% for each population.
Most children of foreign-born parents are born in the United States (Table 4). Of the 16.2 million children with at least one foreign-born parent in 2008, 13.9 million, or 86%, were born in the United States.35 Children with foreign-born parentage comprised almost one-fourth of the 67.4 million U.S. children under age 18.36
Table 4. Parental Nativity of Children Under Age 18, 2008
Children Born in United States Children Born Abroad
Number Percent Number Percent
Children with only native-born parents 53,459,605 79% 233,705 9%
Children with foreign-born parents 13,901,895 21% 2,346,454 91%
Total children 67,361,500 100% 2,580,159 100%
Source: CRS presentation of 2008 American Community Survey data.
35 The citizenship rights of U.S. born children of unauthorized aliens has received considerable recent public attention. For more information, see CRS Report RL33079, Birthright Citizenship Under the 14th Amendment of Persons Born in the United States to Alien Parents, by Margaret Mikyung Lee. 36 For more on this topic, see Randolph Capps, Michael E. Fix, and Julie Murray, et al., The New Demography of America’s Schools: Immigration and the No Child Left Behind Act, Urban Institute, Washington, DC, September 2005, http://www.urban.org/UploadedPDF/311230_new_demography.pdf.
The U.S. Foreign-Born Population: Trends and Selected Characteristics
Congressional Research Service 15
Notes: Data presented for one- and two-parent households. Children with foreign-born parents may either have parents who are both foreign born or have one parent who is foreign born and one who is native born.
Native-born children with foreign-born parents confound the computation of foreign-born median age.37 Traditionally among the foreign born, noncitizens with less U.S. experience are often young adults with the most to gain economically over their working careers by migrating to a new country.38 Most foreign born are in fact relatively young, but because their U.S.-born children are included in native-born population figures, the foreign born have a higher median age (40) than the native born (35). However, when median ages are recomputed by reclassifying native-born minor children of foreign-born parents among the 38 million foreign born, the foreign-born median age (32) becomes less than the native-born median age (37).
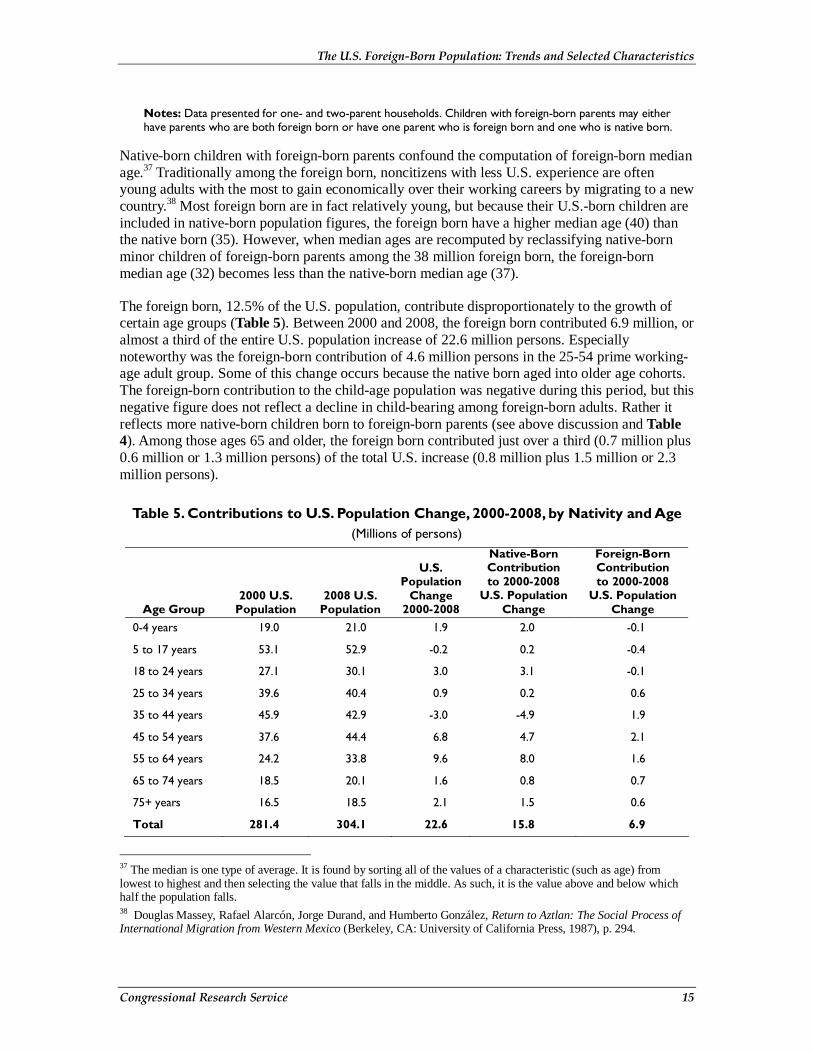
The foreign born, 12.5% of the U.S. population, contribute disproportionately to the growth of certain age groups (Table 5). Between 2000 and 2008, the foreign born contributed 6.9 million, or almost a third of the entire U.S. population increase of 22.6 million persons. Especially noteworthy was the foreign-born contribution of 4.6 million persons in the 25-54 prime working-age adult group. Some of this change occurs because the native born aged into older age cohorts. The foreign-born contribution to the child-age population was negative during this period, but this negative figure does not reflect a decline in child-bearing among foreign-born adults. Rather it reflects more native-born children born to foreign-born parents (see above discussion and Table 4). Among those ages 65 and older, the foreign born contributed just over a third (0.7 million plus 0.6 million or 1.3 million persons) of the total U.S. increase (0.8 million plus 1.5 million or 2.3 million persons).
Table 5. Contributions to U.S. Population Change, 2000-2008, by Nativity and Age (Millions of persons)
Age Group 2000 U.S.
Population 2008 U.S.
Population
U.S. Population
Change 2000-2008
Native-Born Contribution to 2000-2008
U.S. Population Change
Foreign-Born Contribution to 2000-2008
U.S. Population Change
0-4 years 19.0 21.0 1.9 2.0 -0.1
5 to 17 years 53.1 52.9 -0.2 0.2 -0.4
18 to 24 years 27.1 30.1 3.0 3.1 -0.1
25 to 34 years 39.6 40.4 0.9 0.2 0.6
35 to 44 years 45.9 42.9 -3.0 -4.9 1.9
45 to 54 years 37.6 44.4 6.8 4.7 2.1
55 to 64 years 24.2 33.8 9.6 8.0 1.6
65 to 74 years 18.5 20.1 1.6 0.8 0.7
75+ years 16.5 18.5 2.1 1.5 0.6
Total 281.4 304.1 22.6 15.8 6.9
37 The median is one type of average. It is found by sorting all of the values of a characteristic (such as age) from lowest to highest and then selecting the value that falls in the middle. As such, it is the value above and below which half the population falls. 38 Douglas Massey, Rafael Alarcón, Jorge Durand, and Humberto González, Return to Aztlan: The Social Process of International Migration from Western Mexico (Berkeley, CA: University of California Press, 1987), p. 294.

The U.S. Foreign-Born Population: Trends and Selected Characteristics
Congressional Research Service 16
Source: CRS presentation of 2000 Census SF3 and 2008 American Community Survey data; foreign-born age distribution data for 2000 from U.S. Census Bureau (2003).
Household and Family Structure and Size Across several measures of family and household structure, such as marital status (e.g., married, divorced, never married) and household structure (e.g., two-parent households, one-parent households), differences between the native born and foreign born are relatively modest (Figure 9).
Figure 9. Household Structure by Nativity, 2008
61%
17%
11%6%
12% 10%
61%
11%14%
8%6%6% 4%
67%
6%
Married-couplefamily household
Male householder(no wife present)
Female householder (no husband present)
Living alone (male or female)
Not living alone (male or female)
Native born
Foreign born: Naturalized Citizen
Foreign born: Noncitizen
Source: CRS presentation of 2008 American Community Survey data.
Note: Persons not living alone are those living with other unrelated persons.
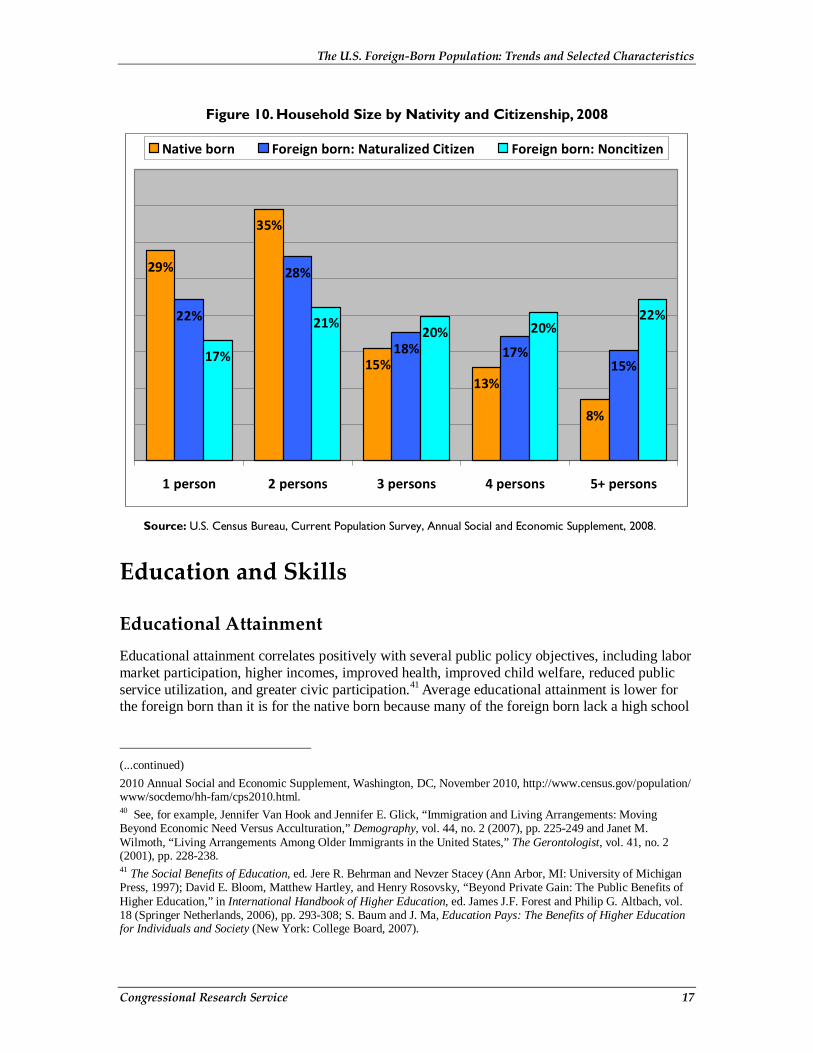
Figure 10 presents household size—a commonly used measure of household structure—by nativity and citizenship status. Higher proportions of the native-born live in one- or two-person households compared to either foreign born group. Foreign-born noncitizens, by contrast, are found in equal proportions across all five categories shown. Differences in household size by nativity and citizenship status reflect several characteristics. Native-born persons and naturalized citizens, who have higher incomes than noncitizens (see Table 11), are more able to afford living alone or in nuclear families, if so preferred, compared to noncitizens who have lower median incomes. Age structure plays a role, particularly among the native born, with young adults and the elderly more likely to live alone.39 Cultural preferences can also influence living arrangements, with multi-generational households more common among the foreign born.40
39 U.S. Census Bureau, America’s Families and Living Arrangements: 2010, Table AVG2, Current Population Survey, (continued...)
The U.S. Foreign-Born Population: Trends and Selected Characteristics
Congressional Research Service 17
Figure 10. Household Size by Nativity and Citizenship, 2008
29%
35%
15%13%
8%
22%
28%
18% 17%15%
17%
21%20% 20%
22%
1 person 2 persons 3 persons 4 persons 5+ persons
Native born Foreign born: Naturalized Citizen Foreign born: Noncitizen
Source: U.S. Census Bureau, Current Population Survey, Annual Social and Economic Supplement, 2008.
Education and Skills
Educational Attainment Educational attainment correlates positively with several public policy objectives, including labor market participation, higher incomes, improved health, improved child welfare, reduced public service utilization, and greater civic participation.41 Average educational attainment is lower for the foreign born than it is for the native born because many of the foreign born lack a high school
(...continued)
2010 Annual Social and Economic Supplement, Washington, DC, November 2010, http://www.census.gov/population/www/socdemo/hh-fam/cps2010.html. 40 See, for example, Jennifer Van Hook and Jennifer E. Glick, “Immigration and Living Arrangements: Moving Beyond Economic Need Versus Acculturation,” Demography, vol. 44, no. 2 (2007), pp. 225-249 and Janet M. Wilmoth, “Living Arrangements Among Older Immigrants in the United States,” The Gerontologist, vol. 41, no. 2 (2001), pp. 228-238. 41 The Social Benefits of Education, ed. Jere R. Behrman and Nevzer Stacey (Ann Arbor, MI: University of Michigan Press, 1997); David E. Bloom, Matthew Hartley, and Henry Rosovsky, “Beyond Private Gain: The Public Benefits of Higher Education,” in International Handbook of Higher Education, ed. James J.F. Forest and Philip G. Altbach, vol. 18 (Springer Netherlands, 2006), pp. 293-308; S. Baum and J. Ma, Education Pays: The Benefits of Higher Education for Individuals and Society (New York: College Board, 2007).

The U.S. Foreign-Born Population: Trends and Selected Characteristics
Congressional Research Service 18
diploma (Figure 11). However, at the other end of the education distribution, the proportion of the foreign born with at least a bachelor’s degree matches that of the native born.
Figure 11. Educational Attainment by Nativity, Citizenship Status, and Period of Arrival, 2008
(Persons ages 25 and older)
32%
34%
34%
32%
28%
28%
32%
42%
22%
33%
12%
22%
22%
22%
20%
23%
26%
27%
22%
22%
22%
30%
15%
17%
20%
21%
23%
24%
20%
14%
23%
18%
31%
32%
26%
25%
27%
26%
22%
21%
22%
33%
27%
28%
2000 - 2009
1990 - 1999
1980 - 1989
1970 - 1979
1960 - 1969
1950 - 1959
Before 1950
Period of Arrival
Noncitizen
Naturalized
Citizenship Status
FOREIGN-BORN
NATIVE-BORN
Less than HS graduate HS graduate Some college Bachelor's degree or more
Source: CRS presentation of 2008 American Community Survey data.
Foreign-born naturalized citizens have higher education levels than foreign-born noncitizens. Average education levels have been rising consistently throughout the world,42 and consequently, more recent immigrants, on average, arrive to the United States with more years of schooling than immigrants who arrived in earlier decades, as illustrated in the period of arrival data in Figure 11. The proportion of the foreign born with a bachelor’s degree has increased by roughly 50% since 1950, and from 21% to 32% for those arriving this past decade. Figure 11 shows that the educational attainment categories of the foreign born that have declined over the period examined include those who completed high school or some college. However, the figure also shows that the proportion of the foreign born without a high school diploma remained unchanged over this time. While the proportions of foreign born in each of the four broad education categories presented in Figure 11 suggest only modest changes in educational composition over time, they
42 R.J. Barro and J.W. Lee, “International Measures of Schooling Years and Schooling Quality,” American Economic Review, vol. 82, no. 2 (May 1996), pp. 218-223; R.J. Barro and J.W. Lee, “A New Data Set of Educational Attainment in the World, 1950-2010,” NBER Working Paper Series, vol. w15902 (2010).
The U.S. Foreign-Born Population: Trends and Selected Characteristics
Congressional Research Service 19
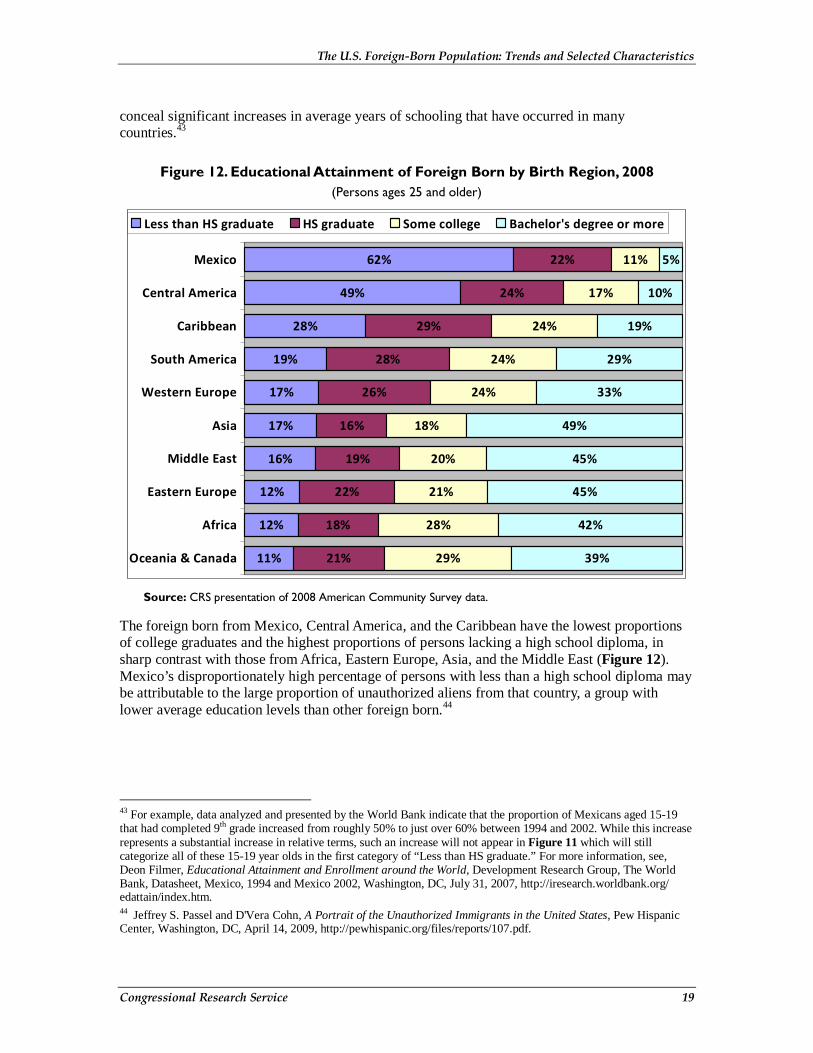
conceal significant increases in average years of schooling that have occurred in many countries.43
Figure 12. Educational Attainment of Foreign Born by Birth Region, 2008 (Persons ages 25 and older)
11%
12%
12%
16%
17%
17%
19%
28%
49%
62%
21%
18%
22%
19%
16%
26%
28%
29%
24%
22%
29%
28%
21%
20%
18%
24%
24%
24%
17%
11%
39%
42%
45%
45%
49%
33%
29%
19%
10%
5%
Oceania & Canada
Africa
Eastern Europe
Middle East
Asia
Western Europe
South America
Caribbean
Central America
Mexico
Less than HS graduate HS graduate Some college Bachelor's degree or more
Source: CRS presentation of 2008 American Community Survey data.
The foreign born from Mexico, Central America, and the Caribbean have the lowest proportions of college graduates and the highest proportions of persons lacking a high school diploma, in sharp contrast with those from Africa, Eastern Europe, Asia, and the Middle East (Figure 12). Mexico’s disproportionately high percentage of persons with less than a high school diploma may be attributable to the large proportion of unauthorized aliens from that country, a group with lower average education levels than other foreign born.44
43 For example, data analyzed and presented by the World Bank indicate that the proportion of Mexicans aged 15-19 that had completed 9th grade increased from roughly 50% to just over 60% between 1994 and 2002. While this increase represents a substantial increase in relative terms, such an increase will not appear in Figure 11 which will still categorize all of these 15-19 year olds in the first category of “Less than HS graduate.” For more information, see, Deon Filmer, Educational Attainment and Enrollment around the World, Development Research Group, The World Bank, Datasheet, Mexico, 1994 and Mexico 2002, Washington, DC, July 31, 2007, http://iresearch.worldbank.org/edattain/index.htm. 44 Jeffrey S. Passel and D'Vera Cohn, A Portrait of the Unauthorized Immigrants in the United States, Pew Hispanic Center, Washington, DC, April 14, 2009, http://pewhispanic.org/files/reports/107.pdf.

The U.S. Foreign-Born Population: Trends and Selected Characteristics
Congressional Research Service 20
English Language Ability Like education, English language ability positively influences labor market outcomes and social and cultural integration in the United States.45 Characteristics associated with higher education levels are also associated with English language ability, as shown in Table 6.
Table 6. English Language Proficiency by Socio-demographic Characteristics, 2008
Characteristic Category
Percent Speaking English “Well” or
“Very Well”
Citizenship Naturalized citizen 83%
Noncitizen 59%
Birth Region Mexico 48%
Central America 54%
Caribbean 74%
South America 76%
Asia 78%
Eastern Europe 78%
Middle East 81%
Africa 91%
Western Europe 91%
Oceania & Canada 97%
Education Less than HS 48%
HS diploma 68%
Some college 86%
Bachelor’s degree 91%
Age Group Ages 0-17 90%
Ages 18-24 73%
Ages 25-34 67%
Ages 35-44 69%
Ages 45-54 69%
Ages 55-64 67%
Ages 65-74 62%
Ages 75+ 59%
45 Sherrie A. Kossoudji, “English Language Ability and the Labor Market Opportunities of Hispanic and East Asian Immigrant Men,” Journal of Labor Economics, vol. 6, no. 2 (1988), pp. 205-228; Hoyt Bleakley and Aimee Chin, “Language Skills and Earnings: Evidence from Childhood Immigrants.” Review of Economics and Statistics, vol. 86, no. 2, (2004), pp:481–496; Alejandro Portes and Ruben Rumbaut, Immigrant America: A Portrait (Berkeley, CA: University of California Press, 2006); Hoyt Bleakley, “Age at Arrival, English Proficiency, and Social Assimilation Among U.S. Immigrants,” American Economic Journal: Applied, vol. 2, no. 1 (January 2010), pp. 165-192.

The U.S. Foreign-Born Population: Trends and Selected Characteristics
Congressional Research Service 21
Source: CRS presentation of 2008 American Community Survey data.
Research has shown that English language ability tends to improve substantially over time, and second- and third-generation immigrants often lose entirely the native languages of their parents.46 Such findings are borne out in Table 6. Youth, who are much more likely to be enrolled in U.S. schools and who acquire languages more easily than adults,47 have the highest English language facility of all age groups, with nine out of 10 minors reporting that they speak English “well” or “very well.” Two-thirds of all foreign-born working-age adults ages 25 to 64 also report similar English language proficiency. As expected, naturalized citizens exhibit stronger English language skills than noncitizens, reflecting U.S. experience. Among origin regions, foreign-born persons from Mexico and Central America report the lowest average English proficiency, while those from Africa, Western Europe, Canada, and Oceania, where English is typically spoken, report the highest.48
Employment
Labor Force Participation In 2008, the foreign-born population accounted for 24.6 million, or 15.7%, of the total U.S. civilian labor force of 156.2 million.49 This proportion represents a considerable increase since 2000, when 17.4 million foreign-born persons accounted for 12.4% of the labor force, 50 and mirrors higher foreign-born population growth generally within this age range. Labor force participation rates for foreign-born and native-born workers differ significantly for men and women (Table 7). Foreign-born male workers exhibit consistently higher labor force participation rates than native-born workers both in total and across all age and education categories. In contrast, foreign-born female workers exhibit lower rates than native-born women except at lower education levels. Among all groups, labor force participation increases with education and from ages 16 to 44.
46 Ruben G. Rumbaut, Douglas S. Massey, and Frank D. Bean, “Linguistic Life Expectancies: Immigrant Language Retention in Southern California,” Population and Development Review, vol. 32, no. 3 (September 2006), pp. 447-460. 47 David Birdsong, “Age and Second Language Acquisition and Processing: A Selective Overview,” Language Learning, vol. 56, no. s1 (July 2006), pp. 9-49. 48 Some of the difference between groups stems from the different periods when the foreign-born arrive to the United States. For instance, larger proportions of foreign born from Western Europe, Oceania, and Canada arrived to the United States prior to 1990 compared with foreign born from all other regions, giving those individuals greater opportunity to acquire English language skills. 49 Computed by CRS using 2008 American Community Survey PUMS data. This figure represents the size of the civilian labor force. See notes on Table 7 for how this is defined. 50 U.S. Census Bureau, Profile of the Foreign-Born Population in the United States: 2000, Current Population Reports, Special Studies P23-206, December 2001, http://www.census.gov/prod/2002pubs/p23-206.pdf.

The U.S. Foreign-Born Population: Trends and Selected Characteristics
Congressional Research Service 22
Table 7. Labor Force Participation Rate (LFPR) by Sex, Nativity, and Citizenship Status, 2008
(Employed civilians ages 16 and older)
Male Female
Native Born
Natural-ized
Citizens Non-
citizens Native Born
Natural-ized
Citizens Non-
citizens
Total LFPR 71.2% 76.0% 84.9% 61.3% 59.7% 55.2%
Age
16-19 43.3% 38.0% 44.9% 45.3% 41.6% 32.0%
20-24 77.3% 73.5% 81.2% 75.5% 71.7% 57.3%
25-44 89.9% 93.9% 93.8% 79.5% 79.3% 61.9%
45-54 87.3% 93.4% 91.1% 77.5% 78.8% 66.1%
55-64 70.2% 79.6% 77.3% 60.3% 60.9% 48.7%
65+ 21.0% 22.7% 23.1% 12.8% 12.0% 9.7%
Education
Less than HS 46.3% 62.3% 83.6% 33.7% 38.1% 44.9%
HS diploma 71.5% 75.9% 87.9% 55.0% 55.6% 57.6%
Some college 75.9% 79.2% 80.8% 68.7% 67.4% 63.8%
Bachelor's degree 81.1% 82.6% 87.5% 74.9% 72.9% 65.8%
Total Workers (millions) 68.5 5.5 8.8 63.2 5.1 5.1
Source: CRS presentation of 2008 American Community Survey PUMS data.
Notes: Following Census Bureau methodology, the labor force participation rate is computed as the proportion of the civilian population ages16 years and older that is in the labor force. The civilian labor force is defined as the civilian noninstitutional population ages 16 years and older who are employed (have a job) or who are unemployed (without a job, available for work, and actively seeking work or on layoff). Excluded from this measure of the labor force are students, retirees, persons who are recorded as having permanently left the labor force, institutionalized persons, and military personnel.
Other characteristics among the foreign born significantly affect their labor force participation. As shown in Table A-2, male naturalized citizens have lower labor force participation rates than male noncitizens. The reverse is true for women, which may reflect greater employment opportunity for those with citizenship, higher education levels, and more U.S. experience.51 Labor force participation increases during the first 30 years of U.S. experience only slightly for men but substantially for women, before declining significantly as both groups approach retirement. By region, participation is higher for foreign-born men and women from Latin America and Africa and lower for those from Europe, Oceania, and Canada (Table A-2).
51 Robert F. Schoeni, “Labor Market Outcomes of Immigrant Women in the United States: 1970 to 1990,” International Migration Review, vol. 32, no. 1 (Spring 1998), pp. 57-77; Jennan Ghazal Read and Philip N. Cohen, “One Size Fits All? Explaining U.S.-born and Immigrant Women’s Employment across 12 Ethnic Groups,” Social Forces, vol. 85, no. 4 (June 2007), pp. 1713-1734.
The U.S. Foreign-Born Population: Trends and Selected Characteristics
Congressional Research Service 23
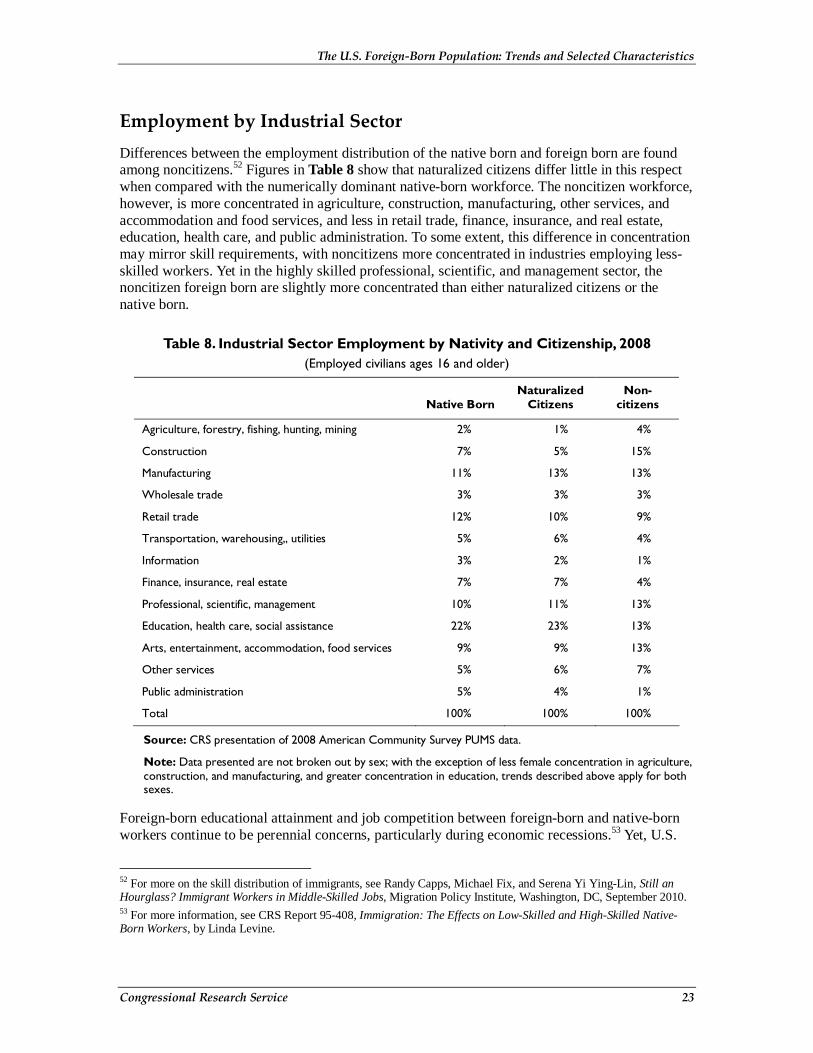
Employment by Industrial Sector Differences between the employment distribution of the native born and foreign born are found among noncitizens.52 Figures in Table 8 show that naturalized citizens differ little in this respect when compared with the numerically dominant native-born workforce. The noncitizen workforce, however, is more concentrated in agriculture, construction, manufacturing, other services, and accommodation and food services, and less in retail trade, finance, insurance, and real estate, education, health care, and public administration. To some extent, this difference in concentration may mirror skill requirements, with noncitizens more concentrated in industries employing less-skilled workers. Yet in the highly skilled professional, scientific, and management sector, the noncitizen foreign born are slightly more concentrated than either naturalized citizens or the native born.
Table 8. Industrial Sector Employment by Nativity and Citizenship, 2008 (Employed civilians ages 16 and older)
Native Born
Naturalized Citizens
Non-citizens
Agriculture, forestry, fishing, hunting, mining 2% 1% 4%
Construction 7% 5% 15%
Manufacturing 11% 13% 13%
Wholesale trade 3% 3% 3%
Retail trade 12% 10% 9%
Transportation, warehousing,, utilities 5% 6% 4%
Information 3% 2% 1%
Finance, insurance, real estate 7% 7% 4%
Professional, scientific, management 10% 11% 13%
Education, health care, social assistance 22% 23% 13%
Arts, entertainment, accommodation, food services 9% 9% 13%
Other services 5% 6% 7%
Public administration 5% 4% 1%
Total 100% 100% 100%
Source: CRS presentation of 2008 American Community Survey PUMS data.
Note: Data presented are not broken out by sex; with the exception of less female concentration in agriculture, construction, and manufacturing, and greater concentration in education, trends described above apply for both sexes.
Foreign-born educational attainment and job competition between foreign-born and native-born workers continue to be perennial concerns, particularly during economic recessions.53 Yet, U.S.
52 For more on the skill distribution of immigrants, see Randy Capps, Michael Fix, and Serena Yi Ying-Lin, Still an Hourglass? Immigrant Workers in Middle-Skilled Jobs, Migration Policy Institute, Washington, DC, September 2010. 53 For more information, see CRS Report 95-408, Immigration: The Effects on Low-Skilled and High-Skilled Native-Born Workers, by Linda Levine.
The U.S. Foreign-Born Population: Trends and Selected Characteristics
Congressional Research Service 24
dependence on foreign-born workers is widely acknowledged in highly skilled sectors such as science and engineering54 as well as less-skilled sectors such as labor-intensive agriculture.55
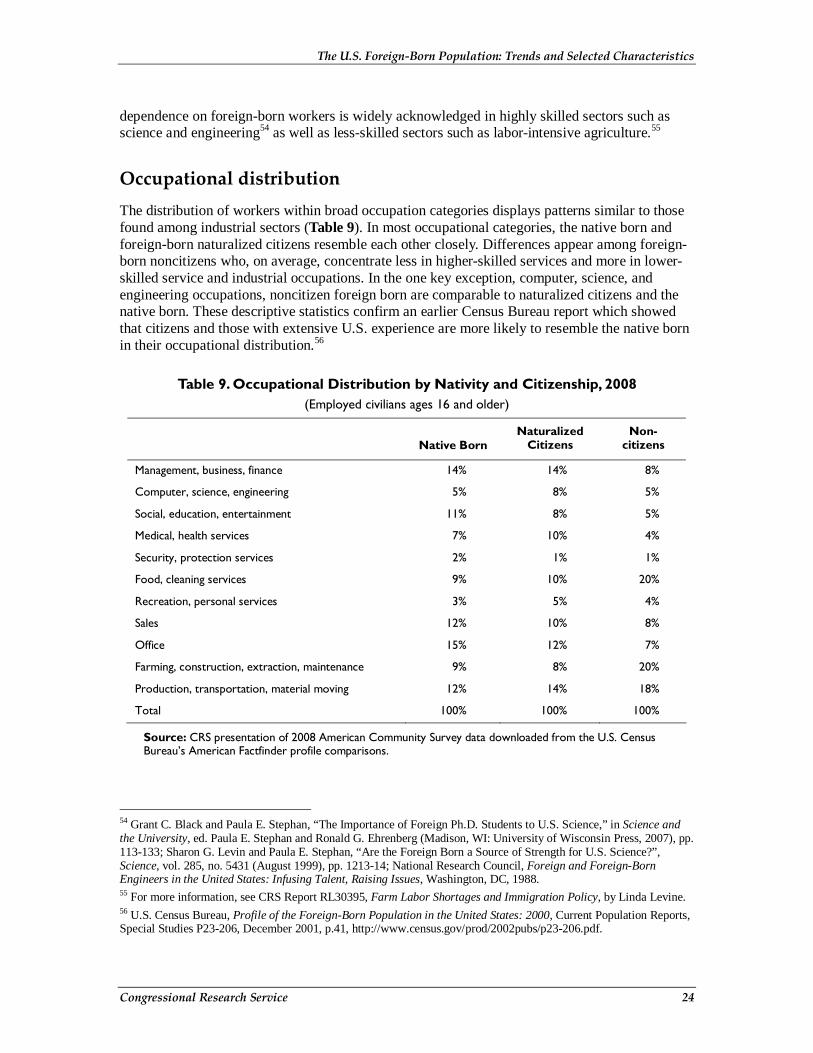
Occupational distribution The distribution of workers within broad occupation categories displays patterns similar to those found among industrial sectors (Table 9). In most occupational categories, the native born and foreign-born naturalized citizens resemble each other closely. Differences appear among foreign-born noncitizens who, on average, concentrate less in higher-skilled services and more in lower-skilled service and industrial occupations. In the one key exception, computer, science, and engineering occupations, noncitizen foreign born are comparable to naturalized citizens and the native born. These descriptive statistics confirm an earlier Census Bureau report which showed that citizens and those with extensive U.S. experience are more likely to resemble the native born in their occupational distribution.56
Table 9. Occupational Distribution by Nativity and Citizenship, 2008 (Employed civilians ages 16 and older)
Native Born Naturalized
Citizens Non-
citizens
Management, business, finance 14% 14% 8%
Computer, science, engineering 5% 8% 5%
Social, education, entertainment 11% 8% 5%
Medical, health services 7% 10% 4%
Security, protection services 2% 1% 1%
Food, cleaning services 9% 10% 20%
Recreation, personal services 3% 5% 4%
Sales 12% 10% 8%
Office 15% 12% 7%
Farming, construction, extraction, maintenance 9% 8% 20%
Production, transportation, material moving 12% 14% 18%
Total 100% 100% 100%
Source: CRS presentation of 2008 American Community Survey data downloaded from the U.S. Census Bureau’s American Factfinder profile comparisons.
54 Grant C. Black and Paula E. Stephan, “The Importance of Foreign Ph.D. Students to U.S. Science,” in Science and the University, ed. Paula E. Stephan and Ronald G. Ehrenberg (Madison, WI: University of Wisconsin Press, 2007), pp. 113-133; Sharon G. Levin and Paula E. Stephan, “Are the Foreign Born a Source of Strength for U.S. Science?”, Science, vol. 285, no. 5431 (August 1999), pp. 1213-14; National Research Council, Foreign and Foreign-Born Engineers in the United States: Infusing Talent, Raising Issues, Washington, DC, 1988. 55 For more information, see CRS Report RL30395, Farm Labor Shortages and Immigration Policy, by Linda Levine. 56 U.S. Census Bureau, Profile of the Foreign-Born Population in the United States: 2000, Current Population Reports, Special Studies P23-206, December 2001, p.41, http://www.census.gov/prod/2002pubs/p23-206.pdf.
The U.S. Foreign-Born Population: Trends and Selected Characteristics
Congressional Research Service 25
Note: Data presented are not broken out by sex; apart from less female concentration in farming and production and greater concentration in social and medical services and office occupations, trends described above apply for both sexes.
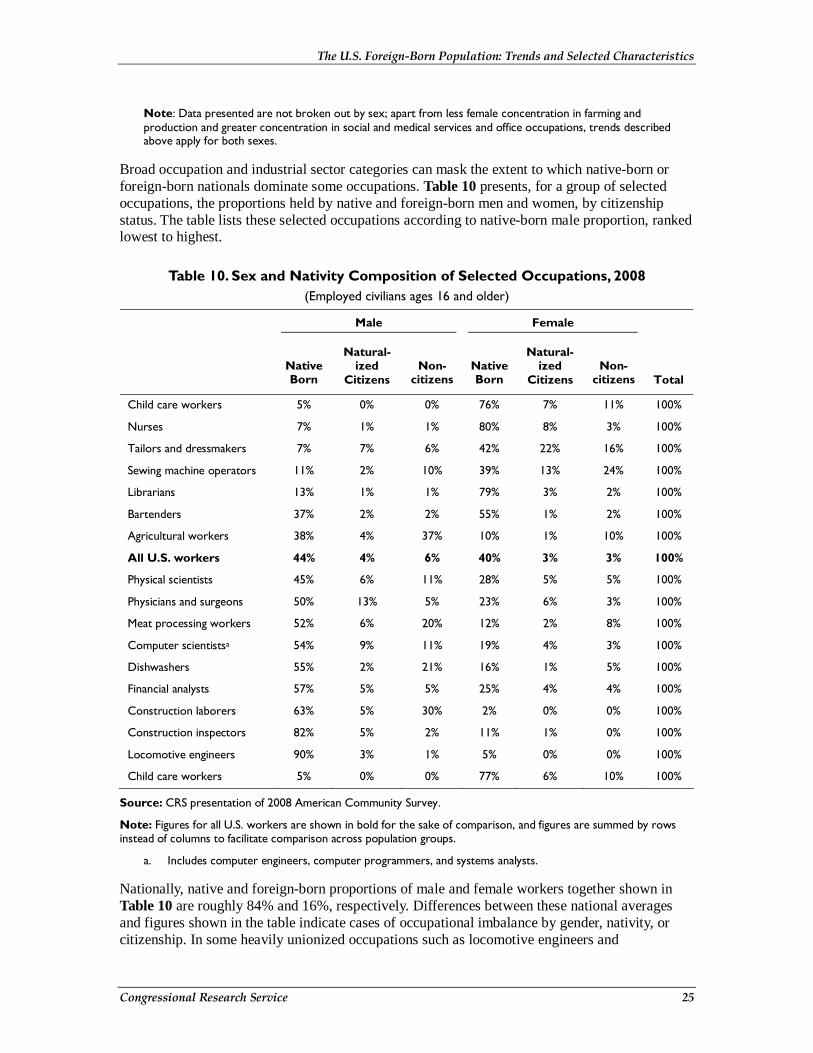
Broad occupation and industrial sector categories can mask the extent to which native-born or foreign-born nationals dominate some occupations. Table 10 presents, for a group of selected occupations, the proportions held by native and foreign-born men and women, by citizenship status. The table lists these selected occupations according to native-born male proportion, ranked lowest to highest.
Table 10. Sex and Nativity Composition of Selected Occupations, 2008 (Employed civilians ages 16 and older)
Male Female
Native Born
Natural-ized
Citizens Non-
citizens Native Born
Natural-ized
Citizens Non-
citizens Total
Child care workers 5% 0% 0% 76% 7% 11% 100%
Nurses 7% 1% 1% 80% 8% 3% 100%
Tailors and dressmakers 7% 7% 6% 42% 22% 16% 100%
Sewing machine operators 11% 2% 10% 39% 13% 24% 100%
Librarians 13% 1% 1% 79% 3% 2% 100%
Bartenders 37% 2% 2% 55% 1% 2% 100%
Agricultural workers 38% 4% 37% 10% 1% 10% 100%
All U.S. workers 44% 4% 6% 40% 3% 3% 100%
Physical scientists 45% 6% 11% 28% 5% 5% 100%
Physicians and surgeons 50% 13% 5% 23% 6% 3% 100%
Meat processing workers 52% 6% 20% 12% 2% 8% 100%
Computer scientistsa 54% 9% 11% 19% 4% 3% 100%
Dishwashers 55% 2% 21% 16% 1% 5% 100%
Financial analysts 57% 5% 5% 25% 4% 4% 100%
Construction laborers 63% 5% 30% 2% 0% 0% 100%
Construction inspectors 82% 5% 2% 11% 1% 0% 100%
Locomotive engineers 90% 3% 1% 5% 0% 0% 100%
Child care workers 5% 0% 0% 77% 6% 10% 100%
Source: CRS presentation of 2008 American Community Survey.
Note: Figures for all U.S. workers are shown in bold for the sake of comparison, and figures are summed by rows instead of columns to facilitate comparison across population groups.
a. Includes computer engineers, computer programmers, and systems analysts.
Nationally, native and foreign-born proportions of male and female workers together shown in Table 10 are roughly 84% and 16%, respectively. Differences between these national averages and figures shown in the table indicate cases of occupational imbalance by gender, nativity, or citizenship. In some heavily unionized occupations such as locomotive engineers and
The U.S. Foreign-Born Population: Trends and Selected Characteristics
Congressional Research Service 26
construction inspectors, native-born workers dominate. In other, less-skilled occupations with low barriers to entry, such as sewing machine operators, agricultural workers, and meat processing workers, the foreign-born noncitizen population is represented in numbers that far exceed their total averages. Yet the foreign born also exceed their national average proportion in certain specialty occupations that require substantial education, such as physical scientists, physicians and surgeons, and computer scientists reflecting the bifurcated education profile discussed earlier and presented in Figure 11.
Economic Well-Being
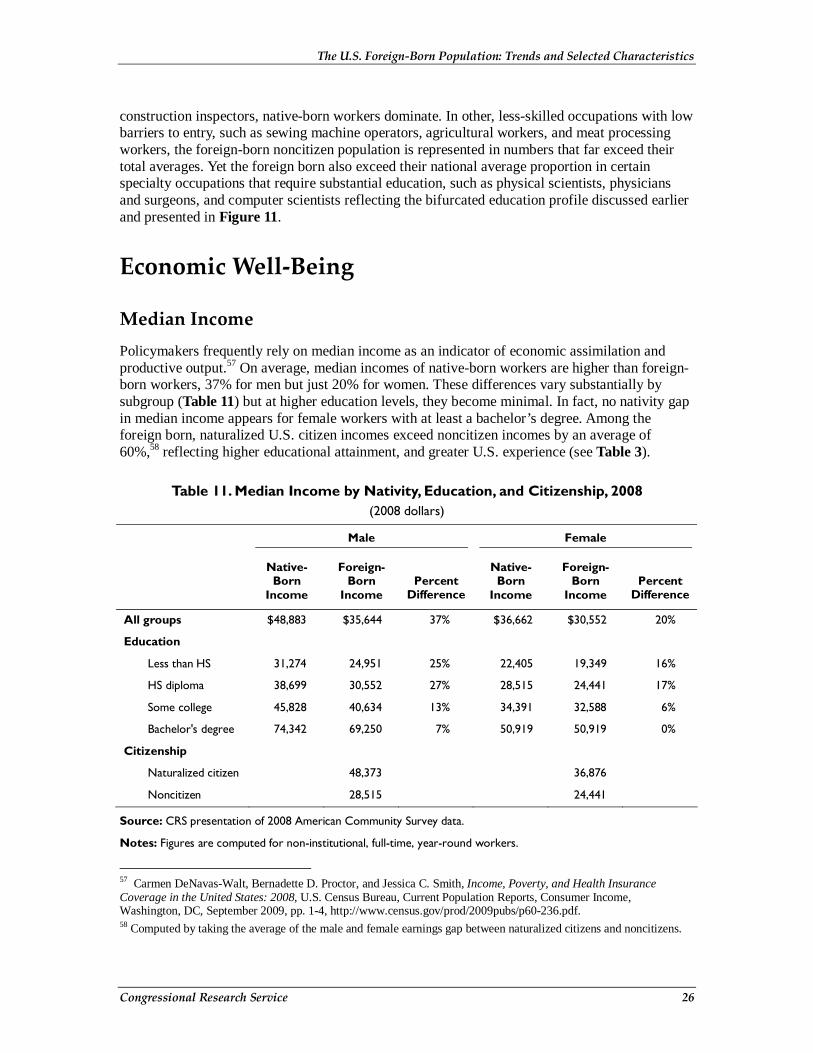
Median Income Policymakers frequently rely on median income as an indicator of economic assimilation and productive output.57 On average, median incomes of native-born workers are higher than foreign-born workers, 37% for men but just 20% for women. These differences vary substantially by subgroup (Table 11) but at higher education levels, they become minimal. In fact, no nativity gap in median income appears for female workers with at least a bachelor’s degree. Among the foreign born, naturalized U.S. citizen incomes exceed noncitizen incomes by an average of 60%,58 reflecting higher educational attainment, and greater U.S. experience (see Table 3).
Table 11. Median Income by Nativity, Education, and Citizenship, 2008 (2008 dollars)
Male Female
Native-Born
Income
Foreign-Born
Income Percent
Difference
Native-Born
Income
Foreign-Born
Income Percent
Difference
All groups $48,883 $35,644 37% $36,662 $30,552 20%
Education
Less than HS 31,274 24,951 25% 22,405 19,349 16%
HS diploma 38,699 30,552 27% 28,515 24,441 17%
Some college 45,828 40,634 13% 34,391 32,588 6%
Bachelor's degree 74,342 69,250 7% 50,919 50,919 0%
Citizenship
Naturalized citizen 48,373 36,876
Noncitizen 28,515 24,441
Source: CRS presentation of 2008 American Community Survey data.
Notes: Figures are computed for non-institutional, full-time, year-round workers.
57 Carmen DeNavas-Walt, Bernadette D. Proctor, and Jessica C. Smith, Income, Poverty, and Health Insurance Coverage in the United States: 2008, U.S. Census Bureau, Current Population Reports, Consumer Income, Washington, DC, September 2009, pp. 1-4, http://www.census.gov/prod/2009pubs/p60-236.pdf. 58 Computed by taking the average of the male and female earnings gap between naturalized citizens and noncitizens.

The U.S. Foreign-Born Population: Trends and Selected Characteristics
Congressional Research Service 27
Poverty The poverty threshold, another measure of economic well-being, is an income figure set annually by the Census Bureau, above or below which an individual or family is officially classified as poor.59 Poverty for the foreign born varies by citizenship status, with relatively smaller proportions of naturalized citizens and greater proportions of noncitizens falling below the poverty threshold (Figure 13). The difference in poverty level between the native born and foreign-born noncitizens is 8%. If those below poverty and those earning 100-200% of the poverty threshold are combined (the “poor” plus the “near-poor”), then the difference between the native born (31%) and foreign-born noncitizens (50%) expands to 19%.
Figure 13. Poverty Status by Nativity and Citizenship, 2008 (Based on where individual income falls in relation to the 2008 poverty threshold)
28%21%
31%
14%
42%
39%
42%
36%
17%23%
17%
28%
14% 17%10%
22%
Native-born Foreign-born Foreign-bornNaturalized
Citizen
Foreign-bornNoncitizen
Belowpovertythreshold
100-200%of povertythreshold
200-500%of povertythreshold
Above500% ofpovertythreshold
Source: CRS presentation of 2008 American Community Survey data.
Notes: Average poverty levels determined by the Census Bureau in 2008 were $10,400 for individuals (with variation according to whether persons were above or below age 65) and $21,200 for a family with two children under age 18. The federal poverty definition for statistical purposes varies by family size and composition and does not include noncash benefits or account for taxes. Poverty status (in poverty or not in poverty) of a family is assigned to each family member. The Census Bureau does not define poverty status for unrelated individuals under age 15 (e.g., foster children). For a discussion of alternative definitions of poverty, see U.S. Census Bureau, Current Population Reports, P60-227, prepared by Joe Dalaker, 2005.
59 For more information, see CRS Report RL33069, Poverty in the United States: 2009, by Thomas Gabe. For an example of how the Census Bureau determines family poverty status, see “How the Census Bureau Measures Poverty” on the Census Bureau’s website at http://www.census.gov/hhes/www/poverty/methods/measure.html.

The U.S. Foreign-Born Population: Trends and Selected Characteristics
Congressional Research Service 28
Among the foreign born, poverty rates vary by region of origin, with persons from Mexico exhibiting the highest rate and those from Western Europe the lowest (Table 12). The proportion of children falling below the poverty line is twice that of working-age adults. The same is true for foreign-born persons who arrived in the United States during this past decade compared to those who arrived prior to 1990.
Table 12. Foreign-Born Poverty Rates by Socio-demographic Characteristics, 2008
Characteristic Category Percent Below Poverty
Threshold
Region of Birth Western Europe 9%
Oceania & Canada 11%
South America 12%
Asia 12%
Eastern Europe 14%
Caribbean 17%
Central America 17%
Middle East 18%
Africa 19%
Mexico 24%
Sex Male 15%
Female 18%
Age Group Under 18 27%
18-24 30%
25-44 16%
45-64 11%
65+ 16%
Decade of Arrival Before 1950 12%
1950-1959 9%
1960-1969 10%
1970-1979 10%
1980-1989 13%
1990-1999 17%
2000-2009 24%
Source: CRS presentation of 2008 American Community Survey data.
Concluding Observations The 38.0 million foreign born (in 2008) make up roughly one-eighth of the U.S. population, but between 2000 and 2008, they accounted for nearly one-third of all U.S. population growth. They include not only an estimated 16.3 million naturalized citizens (43% of all foreign born) but also
The U.S. Foreign-Born Population: Trends and Selected Characteristics
Congressional Research Service 29
unauthorized aliens. Of the 16.2 million children with at least one foreign-born parent in 2008, 13.9 million, or 86%, were born in the United States. Recent estimates indicate that unauthorized aliens, legal residents (permanent and temporary) and naturalized citizens made up 28%, 35% and 37%, respectively, of the foreign-born population. Years of U.S. experience and educational attainment are positively associated with citizenship status. Origins of the foreign born have shifted from Europe (74% in 1960) to Latin America and Asia (80% in 2008). While many foreign-born persons have settled recently in new urban and rural destinations, two thirds of the foreign-born population lives in California, New York, Florida, Texas, Illinois, and New Jersey. Almost 60% of all foreign born arrived to the United States after 1990.
Between 2000 and 2008, foreign-born workers accounted for almost all the growth in the U.S. workforce between ages 25-54. As this CRS analysis illustrates, their labor force contributions to the U.S. economy range from low-skilled occupations in the agriculture, manufacturing, and service sectors to highly skilled occupations in science, engineering, medicine, nursing, defense, and other critical industrial sectors. The foreign born have lower average educational attainment and a higher proportion of persons without a high school diploma than the native born. However, the foreign-born and native-born populations possess the same proportion with at least a bachelor’s degree.
Lower education levels and differences in industrial sector and occupational distributions partly explain income and poverty differences between foreign-born and native-born workers; for those with at least a four-year college degree, earnings differences by nativity are minimal. Among the foreign born, median incomes of naturalized citizens are 60% higher than those of noncitizens, reflecting higher education levels, older ages, and greater U.S. labor market experience. Poverty status is linked to the lack of citizenship, a difference that is magnified after including the “near-poor,” who earn between 100% and 200% of the poverty threshold.
Changes in the age composition of the American population can have a considerable impact on the U.S. labor force, on public sector expenditures, and consequently on U.S. public policy. Political debates over immigration policy may sometimes originate because of different priorities for public spending, as younger foreign-born persons and their children tend to demand different public services (e.g., public education and affordable housing) than older native-born residents (e.g., affordable health care).

The U.S. Foreign-Born Population: Trends and Selected Characteristics
Congressional Research Service 30
Appendix.
Data Sources and Limitations Unless indicated otherwise, data for this report come primarily from the Public Use Micro Sample (PUMS) of the 2008 American Community Survey (ACS). This survey is sent to roughly 250,000 households every month (or 3 million households every year) and replaces the long form questionnaire of the decennial census. As with the decennial census long form, the ACS collects information on socio-demographic characteristics, disability, English and native language use, income, and housing characteristics. The ACS has the advantage of continuous measurement by producing new data every year rather than every 10 years for the decennial census. However, because it is sent to far fewer households (1 in 100) compared to the decennial census (1 in 6) ACS estimates of the population and population characteristics have a relatively greater margin of error, particularly for smaller geographic areas. This report avoids that obstacle because it presents computations at a sufficiently large geographic unit of analysis, often at the national level. For instance, the 2008 ACS PUMS contains about 2,677,000 observations representing the native born, and 323,000 observations representing the foreign born, before weighting. As such, descriptive statistics presented herein are based upon sufficiently large sample sizes that support statistical validity at the 95% probability level. The PUMS is a publically available dataset that contains no personal identifiers and permits analysis of micro-level data across characteristics of one’s choosing.
Key Definitions Nativity, which refers to whether someone is native born or foreign born, generally refers to place of birth, but not exclusively. The Census Bureau defines native-born persons as those who were U.S. citizens or U.S. nationals at birth.60 Hence, in addition to persons born in the United States, the term native-born also includes persons born in a U.S. Commonwealth or other territories (Puerto Rico, U.S. Virgin Islands, Guam, American Samoa, or the Northern Mariana Islands), or born abroad to a U.S. citizen parent or parents. Anyone not born a U.S. citizen or U.S. national is defined as foreign born, including those who have become U.S. citizens through naturalization.
Naturalized citizens are defined by the Immigration and Naturalization Act (INA) as persons admitted as legal residents who have lived in the United States continuously for at least five years; demonstrated good moral character as well as English reading, writing, and speaking ability; and passed an examination on U.S. history and government.61 If these legal permanent residents have their petitions for naturalization approved, they become U.S. citizens.
60 Elizabeth M. Grieco, Race and Hispanic Origin of the Foreign-Born Population in the United States: 2007, U.S. Census Bureau, January 2010. 61 These rules apply in most but not all cases. For example, the residency requirement is only three years in the case of spouses of U.S. citizens. Another example: the language requirement may be waived for permanent resident aliens age 50 and older who have lived in this country for at least 20 years, or who are age 55 and older and have lived in this country for at least 15 years. The civics requirement may be waived for permanent resident aliens over age 65 who have lived in the United States for at least 20 years.
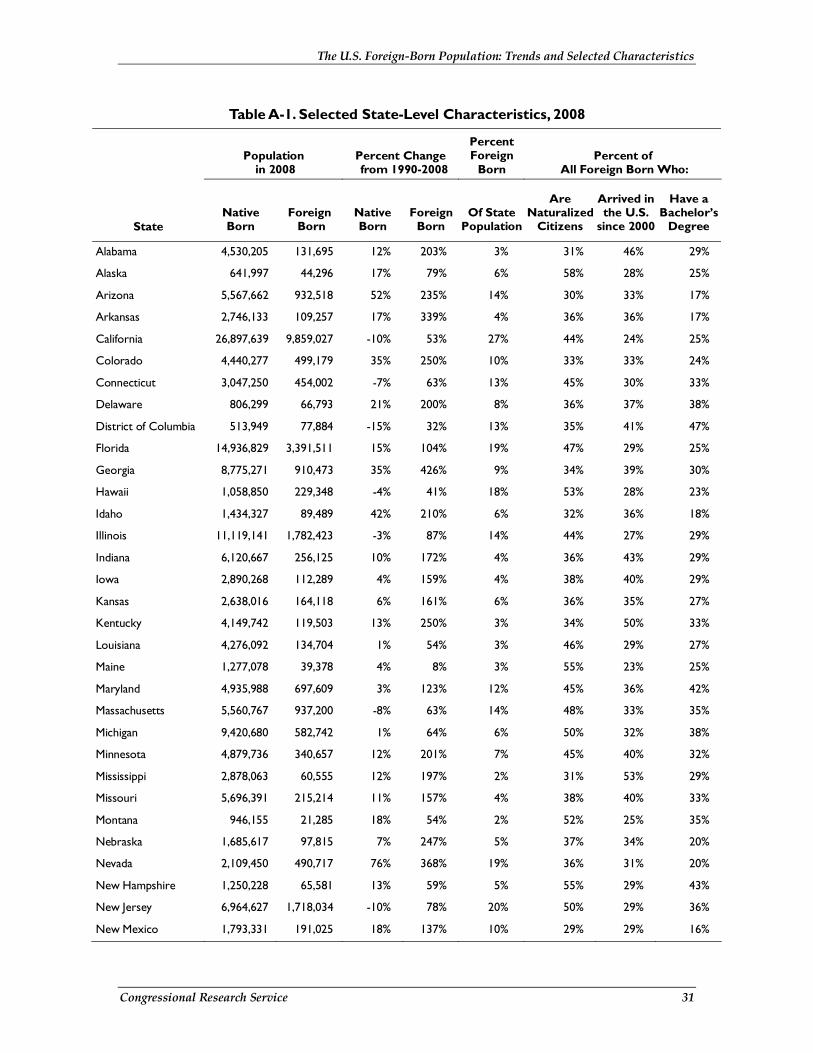
The U.S. Foreign-Born Population: Trends and Selected Characteristics
Congressional Research Service 31
Table A-1. Selected State-Level Characteristics, 2008
Population
in 2008 Percent Change from 1990-2008
Percent Foreign
Born Percent of
All Foreign Born Who:
State Native Born
Foreign Born
Native Born
Foreign Born
Of State Population
Are Naturalized
Citizens
Arrived in the U.S.
since 2000
Have a Bachelor’s
Degree
Alabama 4,530,205 131,695 12% 203% 3% 31% 46% 29%
Alaska 641,997 44,296 17% 79% 6% 58% 28% 25%
Arizona 5,567,662 932,518 52% 235% 14% 30% 33% 17%
Arkansas 2,746,133 109,257 17% 339% 4% 36% 36% 17%
California 26,897,639 9,859,027 -10% 53% 27% 44% 24% 25%
Colorado 4,440,277 499,179 35% 250% 10% 33% 33% 24%
Connecticut 3,047,250 454,002 -7% 63% 13% 45% 30% 33%
Delaware 806,299 66,793 21% 200% 8% 36% 37% 38%
District of Columbia 513,949 77,884 -15% 32% 13% 35% 41% 47%
Florida 14,936,829 3,391,511 15% 104% 19% 47% 29% 25%
Georgia 8,775,271 910,473 35% 426% 9% 34% 39% 30%
Hawaii 1,058,850 229,348 -4% 41% 18% 53% 28% 23%
Idaho 1,434,327 89,489 42% 210% 6% 32% 36% 18%
Illinois 11,119,141 1,782,423 -3% 87% 14% 44% 27% 29%
Indiana 6,120,667 256,125 10% 172% 4% 36% 43% 29%
Iowa 2,890,268 112,289 4% 159% 4% 38% 40% 29%
Kansas 2,638,016 164,118 6% 161% 6% 36% 35% 27%
Kentucky 4,149,742 119,503 13% 250% 3% 34% 50% 33%
Louisiana 4,276,092 134,704 1% 54% 3% 46% 29% 27%
Maine 1,277,078 39,378 4% 8% 3% 55% 23% 25%
Maryland 4,935,988 697,609 3% 123% 12% 45% 36% 42%
Massachusetts 5,560,767 937,200 -8% 63% 14% 48% 33% 35%
Michigan 9,420,680 582,742 1% 64% 6% 50% 32% 38%
Minnesota 4,879,736 340,657 12% 201% 7% 45% 40% 32%
Mississippi 2,878,063 60,555 12% 197% 2% 31% 53% 29%
Missouri 5,696,391 215,214 11% 157% 4% 38% 40% 33%
Montana 946,155 21,285 18% 54% 2% 52% 25% 35%
Nebraska 1,685,617 97,815 7% 247% 5% 37% 34% 20%
Nevada 2,109,450 490,717 76% 368% 19% 36% 31% 20%
New Hampshire 1,250,228 65,581 13% 59% 5% 55% 29% 43%
New Jersey 6,964,627 1,718,034 -10% 78% 20% 50% 29% 36%
New Mexico 1,793,331 191,025 18% 137% 10% 29% 29% 16%
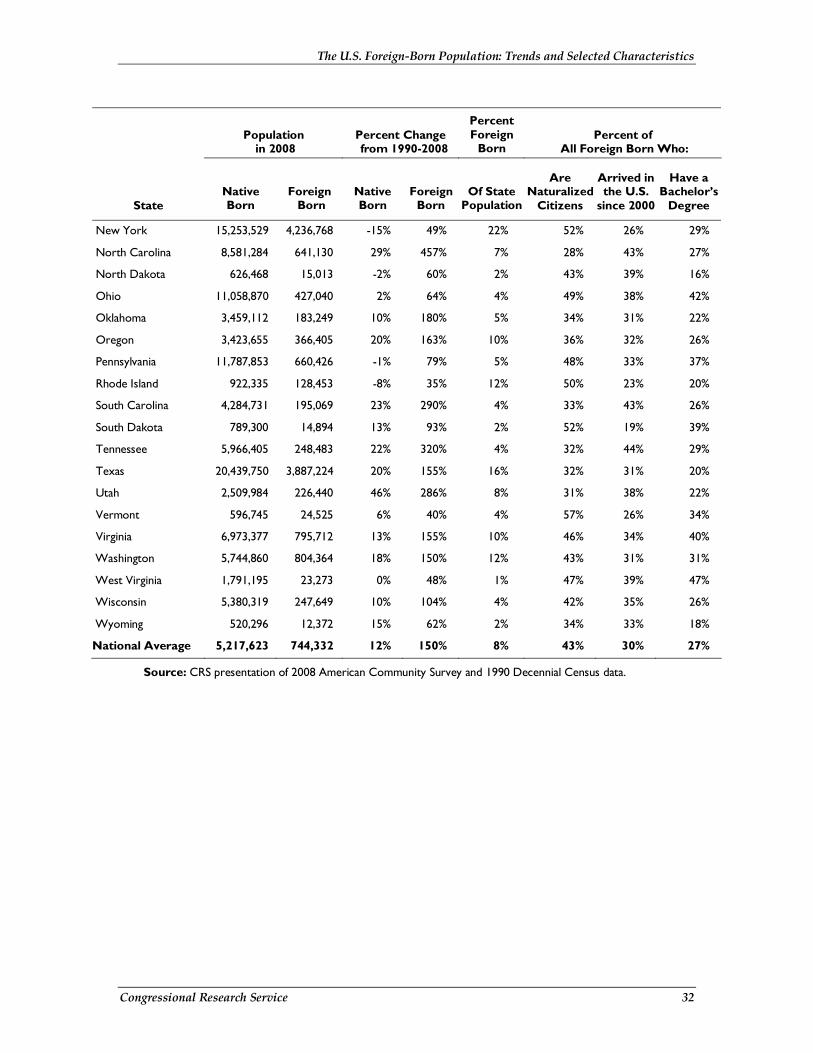
The U.S. Foreign-Born Population: Trends and Selected Characteristics
Congressional Research Service 32
Population
in 2008 Percent Change from 1990-2008
Percent Foreign
Born Percent of
All Foreign Born Who:
State Native Born
Foreign Born
Native Born
Foreign Born
Of State Population
Are Naturalized
Citizens
Arrived in the U.S.
since 2000
Have a Bachelor’s
Degree
New York 15,253,529 4,236,768 -15% 49% 22% 52% 26% 29%
North Carolina 8,581,284 641,130 29% 457% 7% 28% 43% 27%
North Dakota 626,468 15,013 -2% 60% 2% 43% 39% 16%
Ohio 11,058,870 427,040 2% 64% 4% 49% 38% 42%
Oklahoma 3,459,112 183,249 10% 180% 5% 34% 31% 22%
Oregon 3,423,655 366,405 20% 163% 10% 36% 32% 26%
Pennsylvania 11,787,853 660,426 -1% 79% 5% 48% 33% 37%
Rhode Island 922,335 128,453 -8% 35% 12% 50% 23% 20%
South Carolina 4,284,731 195,069 23% 290% 4% 33% 43% 26%
South Dakota 789,300 14,894 13% 93% 2% 52% 19% 39%
Tennessee 5,966,405 248,483 22% 320% 4% 32% 44% 29%
Texas 20,439,750 3,887,224 20% 155% 16% 32% 31% 20%
Utah 2,509,984 226,440 46% 286% 8% 31% 38% 22%
Vermont 596,745 24,525 6% 40% 4% 57% 26% 34%
Virginia 6,973,377 795,712 13% 155% 10% 46% 34% 40%
Washington 5,744,860 804,364 18% 150% 12% 43% 31% 31%
West Virginia 1,791,195 23,273 0% 48% 1% 47% 39% 47%
Wisconsin 5,380,319 247,649 10% 104% 4% 42% 35% 26%
Wyoming 520,296 12,372 15% 62% 2% 34% 33% 18%
National Average 5,217,623 744,332 12% 150% 8% 43% 30% 27%
Source: CRS presentation of 2008 American Community Survey and 1990 Decennial Census data.
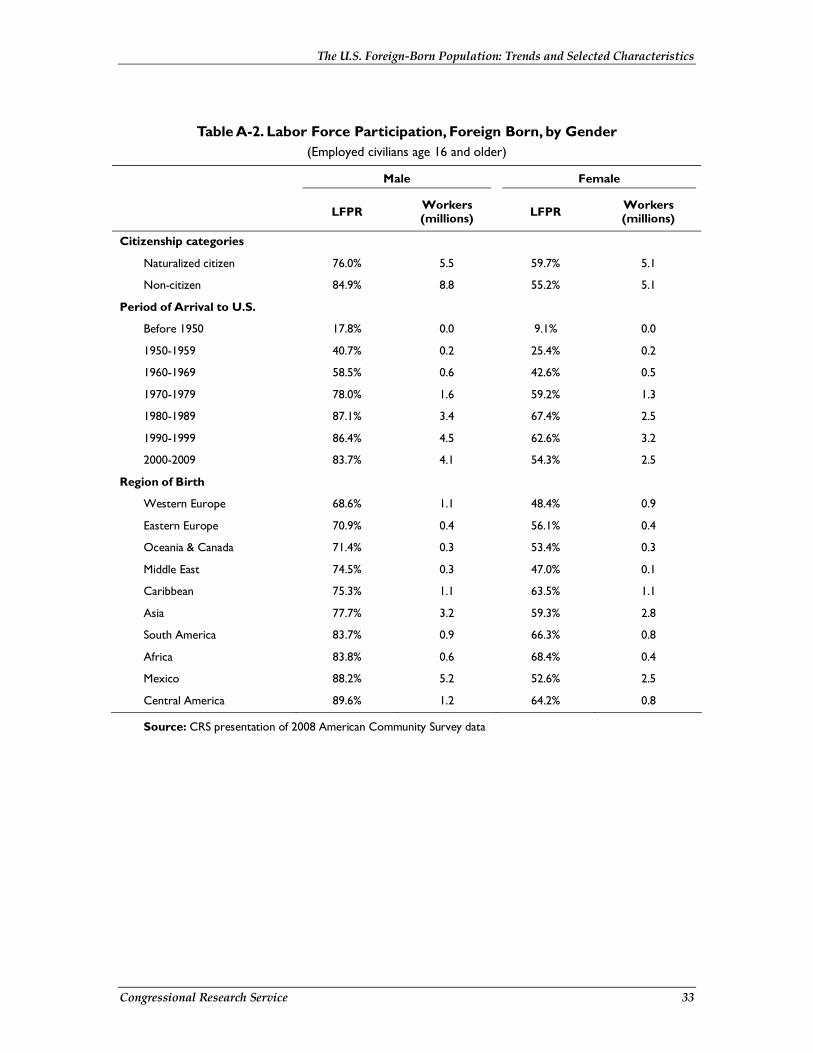
The U.S. Foreign-Born Population: Trends and Selected Characteristics
Congressional Research Service 33
Table A-2. Labor Force Participation, Foreign Born, by Gender (Employed civilians age 16 and older)
Male Female
LFPR Workers (millions) LFPR Workers
(millions)
Citizenship categories
Naturalized citizen 76.0% 5.5 59.7% 5.1
Non-citizen 84.9% 8.8 55.2% 5.1
Period of Arrival to U.S.
Before 1950 17.8% 0.0 9.1% 0.0
1950-1959 40.7% 0.2 25.4% 0.2
1960-1969 58.5% 0.6 42.6% 0.5
1970-1979 78.0% 1.6 59.2% 1.3
1980-1989 87.1% 3.4 67.4% 2.5
1990-1999 86.4% 4.5 62.6% 3.2
2000-2009 83.7% 4.1 54.3% 2.5
Region of Birth
Western Europe 68.6% 1.1 48.4% 0.9
Eastern Europe 70.9% 0.4 56.1% 0.4
Oceania & Canada 71.4% 0.3 53.4% 0.3
Middle East 74.5% 0.3 47.0% 0.1
Caribbean 75.3% 1.1 63.5% 1.1
Asia 77.7% 3.2 59.3% 2.8
South America 83.7% 0.9 66.3% 0.8
Africa 83.8% 0.6 68.4% 0.4
Mexico 88.2% 5.2 52.6% 2.5
Central America 89.6% 1.2 64.2% 0.8
Source: CRS presentation of 2008 American Community Survey data
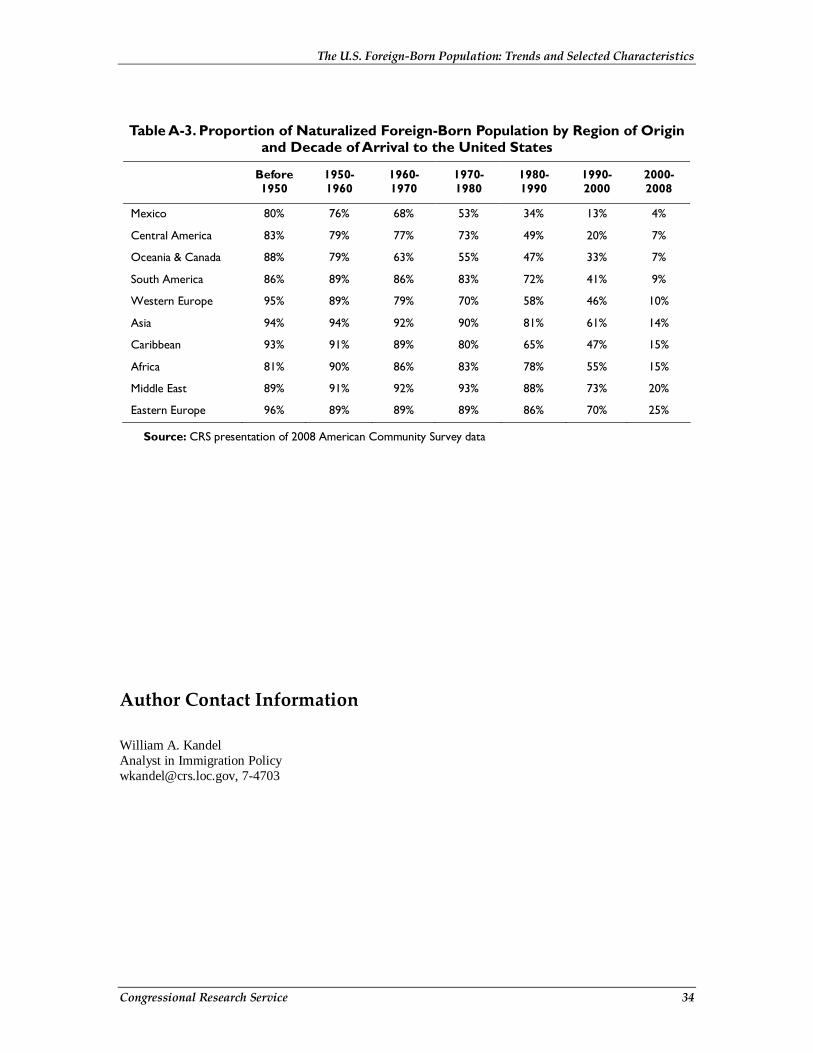
The U.S. Foreign-Born Population: Trends and Selected Characteristics
Congressional Research Service 34
Table A-3. Proportion of Naturalized Foreign-Born Population by Region of Origin and Decade of Arrival to the United States
Before 1950
1950-1960
1960-1970
1970-1980
1980-1990
1990-2000
2000-2008
Mexico 80% 76% 68% 53% 34% 13% 4%
Central America 83% 79% 77% 73% 49% 20% 7%
Oceania & Canada 88% 79% 63% 55% 47% 33% 7%
South America 86% 89% 86% 83% 72% 41% 9%
Western Europe 95% 89% 79% 70% 58% 46% 10%
Asia 94% 94% 92% 90% 81% 61% 14%
Caribbean 93% 91% 89% 80% 65% 47% 15%
Africa 81% 90% 86% 83% 78% 55% 15%
Middle East 89% 91% 92% 93% 88% 73% 20%
Eastern Europe 96% 89% 89% 89% 86% 70% 25%
Source: CRS presentation of 2008 American Community Survey data
Author Contact Information William A. Kandel Analyst in Immigration Policy [email protected], 7-4703