The U.S. Apple Industry: Econometric Model and...
13
The U.S. Apple Industry: Econometric Model and Projections Lois Schertz Willett A dynamic model of the U.S. apple industry, including relationships for bearing acres, production, utilization, and allocation to the fresh, canned, frozen, juice, dried and other markets, is specified. Demands for each of these markets are modeled. Model coefficients are obtained using Zellner’s seemingly unrelated regression procedure and data from 1971 through 1990. Elasticities and flexibilities are compared with other studies. Projections indicate that price fluctuations will continue in the industry when acreage is held at 1990 levels. A ten percent increase in fresh exports strengthens all apple prices. However, a ten percent decrease in the price of juice imports mitigates some of this effect. Apples are grown in thirty-five of the fifty states in the nation. Nearly five hundred thousand acres are in commercial production yielding nearly ten bil- lion pounds of fruit each year. This production is equivalent to over a billion dollars in revenue for the nation’s apple growers (USDA 2). Ten states account for nearly 90 percent of the U.S. apple crop, while Washington, New York and Michigan produce nearly 70 percent of the crop (Sparks et. el.) Once produced, these apples are allocated to alternative product markets. HistoricaIIy, the fresh market has claimed over fifty percent of the apple harvest. The processed market consists of those apples used for canning and freezing, juice, dried apples, and other products. The domestic apple industry has been faced with several economic issues over the past few years. Some of these include increased concern about chemicals used in the production process affecting the demand for the fruit. Some of the new fruit varieties are disease resistant and require less chemical application, yet they do not have clear marketing channels (Murphy and Willett). The in- dustry is faced with increasing juice imports and decreasing prices of these imports. Since 1980, per capita juice imports have increased over twenty- five percent per year, while per capita consump- tion of apple juice increased by less than six per- cent per year (USDA 2). The real price of juice imports declined from $1.28 in 1979 to $0.56 per gallon in 1990, an average of four percent per year (USDA 1). The objectives of the research reported here were to (1) identify the factors affecting the supply and demand for U.S. apples, (2) determine the degree of substitutability and complementarily of apple products, and (3) estimate changes in domes- tic apple consumption, production, and prices un- der various industry scenarios. To achieve these objectives annual data relating to acres, production, prices, utilization, imports, and exports were collected from secondary sources. A model of the industry was conceptual- ized and assumptions were made concerning the characteristics of the individual equations, the re- lationships between the equations within a sector, and the association between model sectors. Model coefficients, their t ratios, and equation statistics were evaluated, Finally, dynamic deterministic simulation techniques were used to assess the im- pacts of changes in acreage, fresh exports and juice import price on production, consumption and prices in the industry. L& Schertz Willettisanassistantprofessorofagricultural economicsat CornellUniversity. Thisresearchwassupported in part by a grant from the National Research and Education Program on Sustainable Agriccd- ture, Northeast Region. The author appreciates helpful comments on an earlier draft of this report from W.G. Tomek, G. B. Whke, and two anonymuus reviewers. The author is solely responsible for the views expressed here and for any remaining errors. ECONOMIC MODEL Studies dealing with the apple industry date from an analysis of the production outlook of apples in
Transcript of The U.S. Apple Industry: Econometric Model and...
The U.S. Apple Industry:Econometric Modeland Projections
Lois Schertz Willett
A dynamic model of the U.S. apple industry, including relationships for bearing acres,production, utilization, and allocation to the fresh, canned, frozen, juice, dried and othermarkets, is specified. Demands for each of these markets are modeled. Model coefficients areobtained using Zellner’s seemingly unrelated regression procedure and data from 1971 through1990. Elasticities and flexibilities are compared with other studies. Projections indicate thatprice fluctuations will continue in the industry when acreage is held at 1990 levels. A tenpercent increase in fresh exports strengthens all apple prices. However, a ten percent decreasein the price of juice imports mitigates some of this effect.
Apples are grown in thirty-five of the fifty states inthe nation. Nearly five hundred thousand acres arein commercial production yielding nearly ten bil-lion pounds of fruit each year. This production isequivalent to over a billion dollars in revenue forthe nation’s apple growers (USDA 2). Ten statesaccount for nearly 90 percent of the U.S. applecrop, while Washington, New York and Michiganproduce nearly 70 percent of the crop (Sparks et.el.) Once produced, these apples are allocated toalternative product markets. HistoricaIIy, the freshmarket has claimed over fifty percent of the appleharvest. The processed market consists of thoseapples used for canning and freezing, juice, driedapples, and other products.
The domestic apple industry has been faced withseveral economic issues over the past few years.Some of these include increased concern aboutchemicals used in the production process affectingthe demand for the fruit. Some of the new fruitvarieties are disease resistant and require lesschemical application, yet they do not have clearmarketing channels (Murphy and Willett). The in-dustry is faced with increasing juice imports anddecreasing prices of these imports. Since 1980, percapita juice imports have increased over twenty-
five percent per year, while per capita consump-tion of apple juice increased by less than six per-cent per year (USDA 2). The real price of juiceimports declined from $1.28 in 1979 to $0.56 pergallon in 1990, an average of four percent per year(USDA 1).
The objectives of the research reported herewere to (1) identify the factors affecting the supplyand demand for U.S. apples, (2) determine thedegree of substitutability and complementarily ofapple products, and (3) estimate changes in domes-tic apple consumption, production, and prices un-der various industry scenarios.
To achieve these objectives annual data relatingto acres, production, prices, utilization, imports,and exports were collected from secondarysources. A model of the industry was conceptual-ized and assumptions were made concerning thecharacteristics of the individual equations, the re-lationships between the equations within a sector,and the association between model sectors. Modelcoefficients, their t ratios, and equation statisticswere evaluated, Finally, dynamic deterministicsimulation techniques were used to assess the im-pacts of changes in acreage, fresh exports and juiceimport price on production, consumption andprices in the industry.
L& Schertz Willettis anassistantprofessorofagriculturaleconomicsatCornellUniversity.Thisresearchwassupportedin part by a grant fromthe National Research and Education Program on Sustainable Agriccd-ture, Northeast Region. The author appreciates helpful comments on anearlier draft of this report from W.G. Tomek, G. B. Whke, and twoanonymuus reviewers. The author is solely responsible for the viewsexpressed here and for any remaining errors.
ECONOMIC MODEL
Studies dealing with the apple industry date froman analysis of the production outlook of apples in
138 October 1993 Agricultural and Resource Economics Review
Michigan in the mid- 1950s’s (French) to the anal-ysis of the demand for fresh apples in four importmarkets in the 1990’s (Sparks et. al.). Tomek de-veloped a supply-demand model of the industryusing data from 1947 through 1966. The modelincluded supply and demand equations for freshapples, frozen and canned apples, and other appleproducts. He used the model to forecast 1975 pro-duction, demand, and prices, Hayward et. al. de-veloped a model of the apple industry in Maine andthe United States using data from 1960 through1981. Their econometric model incorporates therate of size-controlled tree adoption. Using datafrom 1952 through 1981, Baumes and Conway es-timated an econometric model including demand,domestic market allocation, and margin equationsfor the fresh and processed apple markets. Rae andCarman developed a detailed perennial crop supplymodel of the New Zealand apple industry usingdata from 1958 through 1972. In 1976, Piggottpublished an article comparing a perfectly compet-itive, monopolistic and quasi-monopolistic appleindustry. Recently, Chaudry developed and esti-mated an econometric model of the industry thatincorporates demand and allocation decision-making in various regions of the U.S, and during
different time periods within the market year. Heused data from 1959 through 1984 for his analysis.There have been other models of the apple industrythat focus on interregional competition. Miller,Dunn and Garafola, and Fuchs et al. are someexamples.
Development of this structural model of the ap-ple industry draws on the experience and results ofthese researchers. This model of the apple industryis composed of three sectors: 1) supply, 2) alloca-tion, and 3) demand. The supply sector includesrelationships describing the change in bearingacres, and yield per acre. Allocation of productionis made to the fresh and processed markets andsubsequently to the canning, freezing, dried, juice,and other product markets. Demand functions foreach of these products are specified in the demandsector. Net imports of apple products, with theexception of juice imports, are assumed to be ex-ogenous. Functions relating the price of each prod-uct to the processed price and the average appleprice are specified.
Hence, the model of the industry presented herecontributes to the research on the apple industry byproviding a more detailed analysis of the allocationto various marketing outlets and the demand forthese products. Furthermore, the model incorpo-rates production of apples and the demand for juiceimports in detail.
Data used for model estimation covers a more
recent period, 1971 through 1990, than previousstudies. Data are annual values and reflect the cropyear (August to July). All monetary values in themodel are deflated by the gross national productdeflator. All quantity variables in the demand sec-tor are expressed in per capita terms. Model equa-tions and variable definitions can be found in Ta-bles 1 and 2, respectively.
Supply Sector
Apples, a perennial crop, are produced by profitmaximizing producers who are assumed to maxi-mize the net revenue they receive from their out-puts subject to the technical constraints imposed bytheir production function. Following the develop-ment of the perennial crop model by French andMatthews, and French, King and Minami, thenumber of bearing acres in the current period issimply the number of bearing acres in the previousyear less net removals in the current year.
Net removals are from new plantings cominginto production less the acreage removed from theearlier season. Acreage planted with standard cul-tivars can take as long as nine to ten years to comeinto full production. However, dwarf and semi-dwarf trees come into full production as early asfour to five years following planting. New plant-ings are a function of the expected profitability ofthe industry. This profitability depends on theprice received for apples and the cost of producingthese apples. The profitability of alternative oppor-tunities for the acreage, such as other agriculturalproducts or housing developments, may affect thenumber of new acres planted. However, it isdifficult to isolate all of the alternative opportuni-ties that may be available to apple producers. Fur-thermore, these opportunities vary between regionand over time. A certain portion of bearing acreageis removed each year due to old age, lower thancapacity production or to make room for othercrops or new apple plantings.
Detailed data on removals, new plantings, andage class of apple acreage would allow for esti-mating relationships for new plantings, yields foreach age class and removals of acreage. However,such detailed data are not often available. Hence, itis difficult to estimate all these relationshipseconometrically. For this model, bearing acreagewas specified as a function of lagged acreage andmeasures of profitabilityy. To reflect the delay be-tween producers’ planting decisions and acreageproduction, lagged three year moving averages ofaverage grower price and the index of the pricespaid by growers were used to capture producers’profitability.

Willett Apple Industry Econometric Model 139
The augmented Dickey-Fuller test indicated theexistence of a unit root in the variable bearing acre-age. Following Maddala (pages 258–64 and 582–92) the model was respecified in first differences.The change in bearing acres is specified as a func-tion of the changes in lagged three year movingaverages of grower prices and the index of produc-tion costs. A linear time trend is included in themodel to capture the increase in the change in bear-ing acres over the time period of study.
Bearing acres are equal to last year’s acreageplus the change identified above. Yields, seen byequation (3), are a function of apple profitabilityand technological advances over time. The totalquantity of apples produced is expressed by equa-tion (4). Utilized production, defined by equation(5), is a fraction of total production since all applesmay not be harvested or may be discarded for eco-nomic or other reasons.
Allocation Sector
Once apples are produced, they are allocated to thefresh and processed markets. This model specifiesthe actual quantity of a product allocated to a par-ticular market as a function of the total supply andexpected relative prices in each market. The mostprevalent expectation theories used in economicsare rational expectations (Muth) and adaptive ex-pectations (Nerlove). The rational expectationsmodel was considered inappropriate for the appleindustry since the assumption that the completeeconomic structure of an industry is used by deci-sion makers to form expectations was consideredtoo encompassing. A modification of the adaptiveexpectations theory is used in the empirical modelspecification. The price from a previous period issubstituted for each expected price, Current priceswere deemed inappropriate in the model specifica-tion since most apple producers use contractedprices to determine allocation to alternative markets.
The allocation of apples to the fresh market,expressed as equation (6) in Table 1, is a functionof total utilization, fresh price and a relative mea-sure of the size of the current harvest. If the totalutilization of apples were to increase, one wouldexpect the fresh allocation to increase. An increasein the fresh price expected by producers wouldincrease the quantity allocated to the fresh market,all else equal. If the year’s utilized production rel-ative to previous years’ utilized production islarge, a smaller quantity will be allocated to thefresh market and more would go to processed apples.
The allocation of apples to the processed marketis expressed algebraically by equation (7). Pro-cessed apples can be diverted to five markets:
canned, juice, dried, frozen and other. The pre-dominant use of apples in the canning market isfor apple sauce. However, apples are also used forpie fillings, apple butter and other canned prod-ucts. Processed apples diverted to the juice marketare used for apple juice, juice blends, cider, andvinegar. The dried market consists of those applesused for dried fruit. Frozen pies and other frozenproducts comprise the frozen market. The applesused in the other market are for products such asapple chips, apple breads, etc. The allocation ofapples to each processed market is a function of thetotal apples allocated to the processed market andthe expected price of the product relative to theexpected price of all processed products where theprevious apple price is substituted for the expectedprice. If the total supply of apples to the processedmarket increased, more apples would be divertedto each processed outlet. If the expected price of aparticular processed product increased relative tothe average of all processed products, one wouldanticipate a larger quantity allocated to that partic-ular market.
In the apple industry, juice is often the residualclaimant of processed apples. However, nearlyfifty percent of all processed apples are utilized forjuice. Hence, for this model the quantity of pro-cessed apples utilized for juice is modeled explic-itly. Frozen apples are assumed to be the residualsince they claim a relatively small portion of theprocessed apple market. The allocation of applesto the canned, juice, dried, and other markets isexpressed by equations (8), (9), (10), and (11) re-spectively. Analysis of the data revealed a signif-icant decrease over time in the quantity of applesallocated to the other market sector. To capturethis effect, a trend variable was included in equa-tion (11). The allocation to the frozen market isseen by equation (12),
Demand Sector
The final sector of the model identifies the demandfor all apples in the United States. FollowingWaugh, inverse demand functions are specified asprice dependent functions of the quantity utilized,quantities of other apple products, income andother variables that might shift the demand func-tion. Economic theory suggests an inverse rela-tionship between the price and own quantity ofeach apple product. The coefficients on other appleproduct quantities depend on whether the goodsare substitutes or complements. If apple productsare normal goods the coefficients on the incomemeasure, PCED, should be positive, Fresh or-anges, processed pears, and orange juice were in-

140 October 1993 Agricultural and Resource Economics Review
Willett
-. +
i-
+
Apple Industry Econometric Model 141
142 October 1993 Agricultural and Resource Economics Review
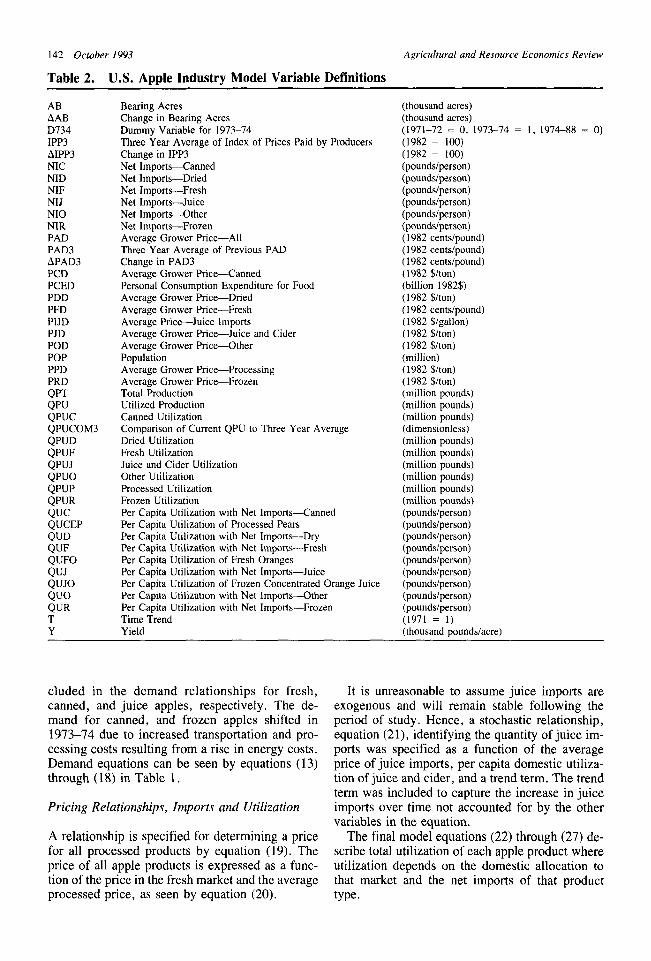
Table 2. U.S. Apple Industry Model Variable Definitions
ABAABD734IPP3AIPP3NICNIDNIFNIJNIONIRPADPAD3APAD3PCDPCEDPDDPFDPIJDPJDPODPOPPPDPRDQPTQPUQPUCQPUCOM3QPUDQPUFQPUJQPUOQPUPQPURQUCQUCEPQUDQUFQUFOQUJQUJOQUOQURTY
Bearing AcresChange in Bearing AcresDummy Variable for 1973-74Three Year Average of Index of Prices Paid by ProducersChange in IPP3Net Import<annedNet Imports-DriedNet Imports-FreshNet Imports-JuiceNet Imports-OtherNet Imports-FrozenAverage Grower Price—AllThree Year Average of Previous PADChange in PAD3Average Grower Price—CannedPersonal Consumption Expenditure for FoodAverage Grower Price-DriedAverage Grower Price-FreshAverage Price-Juice ImportsAverage Grower Price—Juice and CiderAverage Grower Price-OtherPopulationAverage Grower Price—ProcessingAverage Grower Price—FrozenTotal ProductionUtilized ProductionCanned UtilizationComparison of Current QPU to Three Year AverageDried UtilizationFresh UtilizationJuice and Cider UtilizationOther UtilizationProcessed UtilizationFrozen UtilizationPer Capita Utilization with Net Imports-CannedPer Capita Utilization of Processed PearsPer Capita Utilization with Net Imports-DryPer Capita Unitizationwith Net Imports-FreshPer Capita Utilization of Fresh OrangesPer Capita Utilization with Net Imports-JuicePer Capita Utilization of Frozen Concentrated Orange JuicePer Capita Utilization with Net Imports-otherPer Capita Utilization with Net Imports-FrozenTtme TrendYield
(thousand acres)(thousand acres)(1971-72 = O, 1973-74 = 1, 1974-88 = O)(1982 = 100)(1982 = 100)(pounds/person)(pounds/person)(pounds/person)(pounds/person)(pounds/person)(pounds/person)(1982 cents/pound)(1982 cents/pound)(1982 cents/pound)(1982 $/ton)(billion 1982$)(1982 $/ton)(1982 cents/pound)(1982 $/gallon)(1982 $/ton)(1982 $/ton)(million)(1982 $/ton)(1982 $/ton)(million pounds)(million pounds)(million pounds)(dimensionless)(million pounds)(million pounds)(million pounds)(million pounds)(million pounds)(miilion pounds)(pounds/person)(pounds/person)(pounds/person)(pounds/person)(pounds/person)(pounds/person)(pounds/person)(pounds/person)(pounds/person)(1971 = 1)(thousand pounds/acre)
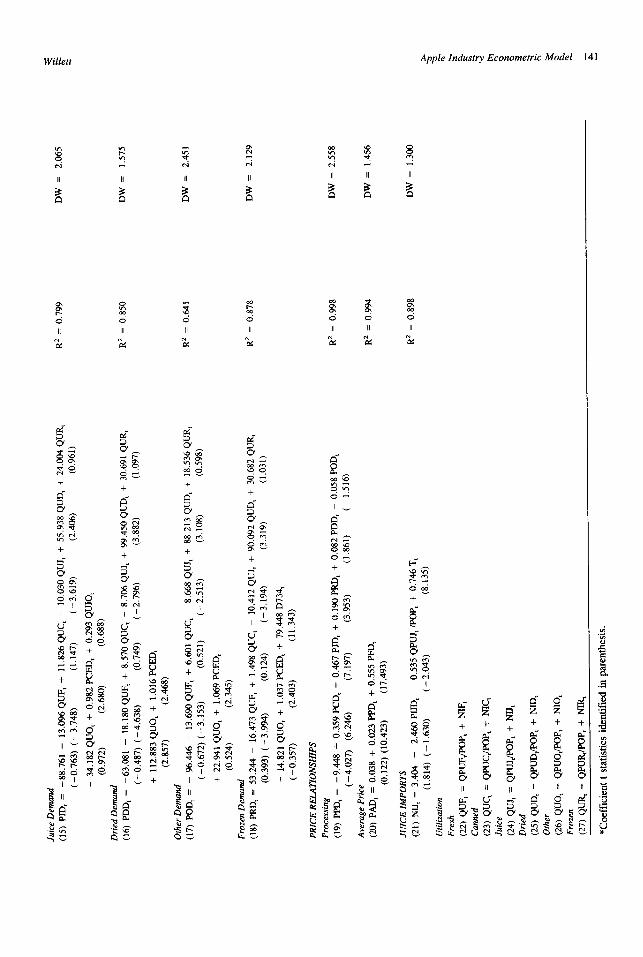
eluded in the demand relationships for fresh,canned, and juice apples, respectively. The de-mand for canned, and frozen apples shifted in1973–74 due to increased transportation and pro-cessing costs resulting from a rise in energy costs.Demand equations can be seen by equations (13)through (18) in Table 1.
Pricing Relationships, Imports and Utilization
A relationship is specified for determining a pricefor all processed products by equation (19). Theprice of all apple products is expressed as a func-tion of the price in the fresh market and the averageprocessed price, as seen by equation (20).
It is unreasonable to assume juice imports areexogenous and will remain stable following theperiod of study. Hence, a stochastic relationship,equation (21), identifying the quantity of juice im-ports was specified as a function of the averageprice of juice imports, per capita domestic utiliza-tion of juice and cider, and a trend term. The trendterm was included to capture the increase in juiceimports over time not accounted for by the othervariables in the equation.
The final model equations (22) through (27) de-scribe total utilization of each apple product whereutilization depends on the domestic allocation tothat market and the net imports of that producttype.

Apple Industry Econometric Model 143Willett
MODEL ESTIMATION
All equations in the model are assumed to be linearin the parameters. The supply sector, identifyingthe change and level of bearing acres, yield, totalproduction and utilized production, are usuallyknown at the beginning of the crop year and areindependent of the allocation of the product to al-ternative outlets. Furthermore, it is assumed theallocation of the products is independent of thedemands for each product, the pricing relation-ships, and the demand for juice imports. Conse-quently, each model sector was considered inde-pendent of the other model sectors in the estima-tion process. Hence, the model was estimated as ablock recursive system. Zellner’s seemingly unre-lated regression method (Kmenta) was chosen toestimate each model sector since the random errorterms within each block are related.
Due to the independence of the pricing relation-ships, equations (19) and (20), they were estimatedby ordinary least squares. The juice import func-tion, equation (21), was also estimated by ordinaryleast squares. The demand for imports is assumedto be determined after the allocation of the pro-cessed product to the juice market occurs.
All model equations have coefficients consistentwith the hypothesized signs and of reasonablemagnitudes with a few exceptions. The demandequations for dried, other and frozen apple prod-ucts suggest a positive own price relationship, con-trary to economic theory. Equation R*’s are rea-sonable and Durbin-Watson statistics indicateeither no first order autocorrelation or are incon-clusive, LM tests for autocorrelated disturbancesindicated no autocorrelation at the first, second,third and fourth order for any of the model equa-tions (Maddala), Ex post forecasting indicated the1991 observed values of all endogenous variableslie within the 95 percent confidence intervals de-termined by the models’ forecasts with four excep-tions: change in bearing acres, fresh price, juiceprice and dried price. The 1991 change in bearingacres was actually a decrease while the model pre-dicted an increase in acreage. The decrease in acre-age was only the second reduction in bearing acre-age since 1975. The 1991 apple crop yielded rec-ord high prices and the value of apple productionwas up 22 percent from the previous year. The1991 fresh price was 16 percent greater than the1990 price, while the 1991 juice and dried fruitprices were 40 percent and 63 percent greater thanthe 1990 prices respectively (USDA 2). It is tooearly to tell if 1991 was an unusual year or if astructural change occurred in the industry that isnot accounted for in the model specification.
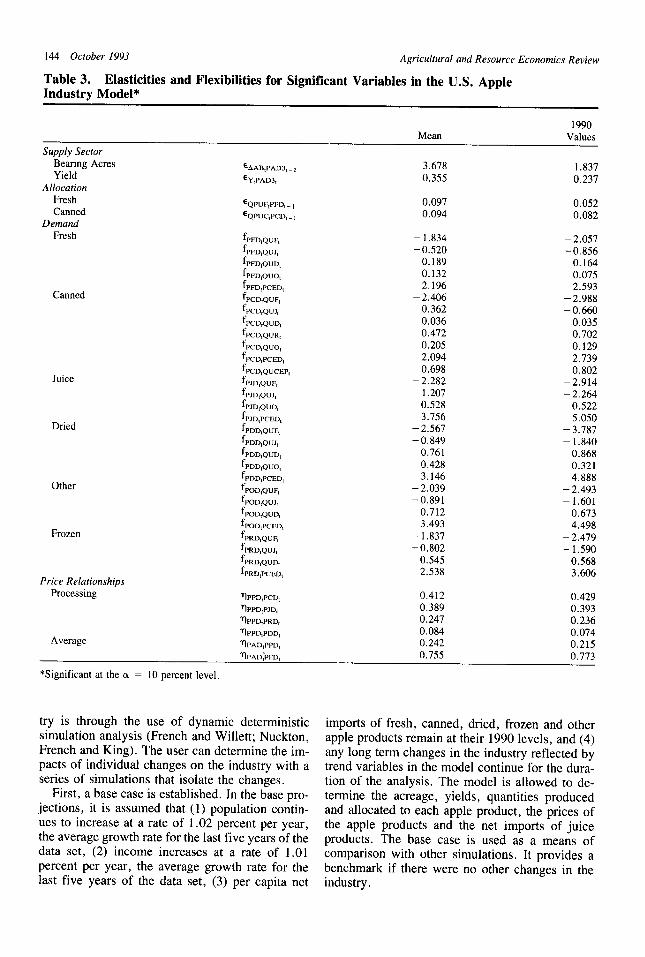
Demand and supply elasticities of variables sig-
nificant at the ten percent level are evaluated at themean of the data set and at 1990, the last period inthe data set. As seen in Table 3, the acreage elas-ticity (EAAEi PADs,.,) indicates that the response ofthe change ;n apple acreage to a lagged three yearmoving average of apple prices is elastic. Freshand canned allocation elasticities are inelastic. Thefresh allocation elasticity (EQPu~tPFD,_,)is nearlyzero, supporting the notion that fresh supplies arelargely pre-determined. All supply elasticities areconsistent with those found by Tomek.
Demand flexibilities suggest the demands forfresh appk (fpF~tQuF~and apple juice (fPJDtQUJ)are inelastic, French found the elasticity for ahapples to be – 1.19. Tomek estimated the ownprice elasticities for fresh, canned and other applesto be –0.81, – 1.21 and – 0.76 respectively.Huang estimated fresh apple demand to be inelas-tic with a measure of – 0.20. Baumes and Conwayfound flexibilities for fresh and processed apples tobe – 0.36 and – 0.69, respectively. Hayward etal,’s estimate of the flexibility for all apples was– 1.59. Miller’s price elasticity for national appledemand was – 0,59. While there is some variationamong the elasticity and flexibility measures,those estimated in this study are within the range ofother studies.
All apple products are normal goods as indicatedby their expenditure flexibilities. These resultscontradict Huang’s estimate of the expenditureelasticity of apples to be – 0.35, implying an in-ferior good.
Cross-price flexibilities estimated with thisstudy suggest that fresh apples and apple juice(fPFDtQUJ,and ‘PJD,QUF,) are substitutes. Yet, freshapples and dried apples (fp~D,Q~~~.,fresh applesand other apple products (fp~D,Qu~~~uiceand driedapples (fPJQQIJQ),and juice and dried apple prod-ucts (fPJDtQLJD~.me complements. Fresh apples andjuice are substitutes for canned apples (fpcDtQUF,fpcD,QuJ~,while dried apples, other apple prod-ucts, and frozen products are complements forcanned apples (fpcQQuDt, ‘PCD,QUO,~PCD,QURj!fFresh apples and juice are substitutes for dried,other, and frozen apple products (fp~D.ouF.,f
.-,PDD,QUJ,~ ‘POD,QUFL! ‘POD,QUJ,? ‘PRD,QUF,>
fpm,QuJJ. Dried apple products are complementsfor other products and frozen apples (fpoD,QLJD,,fpRD,QuD~.Tomek found other processed applesto be substitutes for fresh apples and for canningapples.
MODEL FORECASTS
A common means of analyzing the impacts of ex-ogenous changes on the performance of an indus-
144 October 1993 Agriculmral and Resource Economics Review
Table 3. Elasticities and Flexibilities for Significant Variables in the U.S. AppleIndustrv Model*
1990Mean Values
Supply SeclorBearing Acres ‘AAB,PAD3, _~
Yield3.678 1.837
~YtPAD3, 0.355 0.237Allocation
Fresh ‘QPUF,PFD, _ ,Canned
0,097 0.052‘QpUC,PCDt _ ~
Demarrd0.094 0.082
Fresh fPFD,QuF, – 1.834 –2.057fPFD,QUJ, – 0.520f
–0.856PFD,QUD, 0.189
f0.164
pFD,QUO, 0.132f
0.075PFD,PcED, 2.196
f2.593
pCDtQUF, – 2,406f
– 2.988PCD,QUJ, –0.362
f–0,660
PC DtQUD, 0.036f
0.035PCD,QURL 0.472
f0.702
PCD,QUO, 0.205f
0.129PCD,PCED, 2.094
f2.739
PCD,QUCEP,Juice
0.698f
0.802pJD,QuF, –2.282 –2.914
fPJD,QuJ, – 1.207 –2.264fPJD,QUD, 0.528 0.522
Canned
Dried
Other
f“”pJD,PcED,fPDD,QUF,f~PDD,QUJtlPDD,QUD,
f.PDD,Quo,~pDD,pcED,
fPOD,QUF,fPODLQUJ,fpOD,QUDttpoDtpcEDt
Frozen f.PRD,QUF,~PRD,QUJ,
fpRD,QUD,fPRD,PcED,
Price RelationshipsProcessing TPPD,PCD,
~PPD,PJD,
TppD,PRD,
7ppDtPDD,Average TpAD,ppD,
3.756–2.567–0.849
0,7610,4283.146
–2.039–0.891
0,7123.493
– 1.837–0.802
0.5452.538
0,4120.3890.2470.0840.242
5.050– 3.787– 1.840
0.8680.3214,888
– 2.493– 1.601
0.6734,498
– 2,479– 1.590
0.5683.606
0.4290.3930.2360.0740.215
llpAD~pFD, 0.755 0.773
*Significant at the a = 10 percent level.
try is through the use of dynamic deterministicsimulation analysis (French and Willett; Nuckton,French and King). The user can determine the im-pacts of individual changes on the industry with aseries of simulations that isolate the changes.
First, a base case is established. In the base pro-jections, it is assumed that (1) population contin-ues to increase at a rate of 1.02 percent per year,the average growth rate for the last five years of thedata set, (2) income increases at a rate of 1.01percent per year, the average growth rate for thelast five years of the data set, (3) per capita net
imports of fresh, canned, dried, frozen and otherapple products remain at their 1990 levels, and (4)any long term changes in the industry reflected bytrend variables in the model continue for the dura-tion of the analysis. The model is allowed to de-termine the acreage, yields, quantities producedand allocated to each apple product, the prices ofthe apple products and the net imports of juiceproducts. The base case is used as a means ofcomparison with other simulations. It provides abenchmark if there were no other changes in theindustry.

Willett Apple Industry Econometric Model 145
The base projections of selected model vari-abIes, seen in Table 4, indicate an increase in bear-ing acres (AB) from a 1990 value of 485.5 thou-sand acres to 540.4 thousand acres in the fifth yearof the simulation, Yield (Y) varies between 20.4and 21.5 thousand pounds per acre. Total appleproduction (QPT) appears to be cyclical with in-creases in the first, third and fifth year of the sim-ulation. The fluctuation in yields and total appleproduction is generated by the lags inherent in thesystem. When prices are high, there is economicincentive to plant more acres and increase yield onexisting acreage. Furthermore, after a time lag,more apples are allocated to each product market.An increase in allocation puts downward pressureon product prices which decreases the change inbearing acreage, yields, and production. Thesedrops place upward pressure on market prices. Thefluctuations can be seen in recent industry data andare captured by the estimated relationships of themodel.
With the increase in apple production in the firstyear, more apples are allocated to the fresh(QPUF) and processed markets (QPUP). The per-cent of processed apples used for juice (QPUJ)varies from 55.7 percent to 56.9 percent. Some ofthe variation in juice apples comes from the cannedmarket (QPUC), as that share of total processedproducts varies from 29.9 percent to 32.0 percent.Processed apple prices (PPD) and fresh appIeprices (PFD) are cyclical during the simulation.The ratio of fresh prices (PFD) to processed prices(PPD) averages 0.21. The quantity of juice imports(NIJ) varies between between 11.5 and 11.8pounds per person in response to population in-creases, acreage increases, production fluctua-tions, and price changes.
The first scenario maintains the assumptions ofthe base case. However, the acreage devoted toapples is held at 1990 levels. Historically, applebearing acreage decreased until 1975 when itreached a low of 395.6 thousand acres. Since thattime acreage increased an average of 1.5 percentper year. It is questionable if bearing acreage willor can continue to increase at that rate in the future.Results for this no growth in bearing acreage sce-nario suggest that production is curtailed leading tostronger fresh and processed apple prices. Lessproduct is allocated for juice causing higher juiceimports.
The second scenario combines the assumptionsof the base case with acreage held constant and theper capita quantity of fresh exports increasing 10percent in 1991, The increase in fresh apple ex-ports, from 2.270 pounds per person to 2.497pounds per person in the first and subsequent years
of the simulation, yields an increase in total pro-duction and the allocations to the fresh and pro-cessed markets. Prices of fresh and processed ap-ple products are stronger.
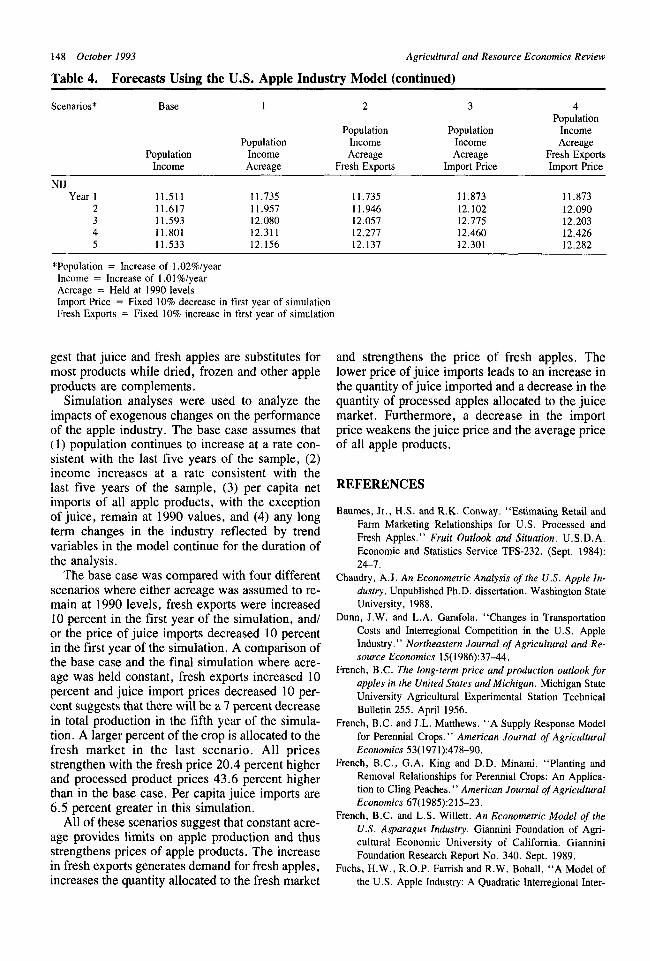
In the third scenario acreage is held at 485.5thousand acres, the price of juice imports de-creases 10 percent in the first year of the simula-tion, the deflated import price of juice decreasesfrom $0.559 per gallon to $0.503 per gallon. Thisdecrease in juice price follows the general trend ofthe per unit value of juice imports since 1979. In1979 juice imports reached a peak price of $1.28per gallon. Since that time the price has decreasedan average of 5.1 percent per year. This scenariogenerates a decrease of more than 11 millionpounds in total apples produced. Fewer apples areallocated to the fresh and processed markets andper capita juice imports increase.
In the final scenario the base case assumptionsare coupled with acreage held at 1990 levels, a 10percent increase in per capita fresh exports, and a10 percent decrease in juice import prices in thefirst year of the simulation. As expected, the con-stant acreage provides some limits on apple pro-duction and the increase in fresh exports generatesdemand for fresh apples, increases the quantity al-located to the fresh market, and strengthens theprice of fresh apples. The lower price of juice im-ports leads to an increase in the quantity of juiceimported and a decrease in the quantity of pro-cessed apples allocated to the juice market, Fur-thermore, a decrease in the juice import priceweakens the price received for juice and the aver-age price for all apple products.
SUMMARY AND CONCLUSIONS
The dynamic national apple industry model pre-sented here includes relationships for the change inbearing acres, production, utilization and alloca-tion to the fresh, canned, frozen, juice, dried andother markets. Demands for each of the marketsare modeled. Data from 1970 through 1990 areused in the estimation of the model. Zellner’sseemingly unrelated regression procedure is usedsince each model sector was considered indepen-dent of the other model sectors.
Demand and supply elasticities evaluated at themean of the data set indicate that changes in acre-age are elastic with respect to lagged prices. Freshand canned products supply elasticities are inelas-tic. Demand flexibilities suggest the demand forfresh apples and apple juice are inelastic. All appleproducts are normal goods as indicated by theirincome flexibilities. Cross-price flexibilities sug-

146 Occober 1993 Agricultural and Resource Economics Review
Table 4. Forecasts Using the U.S. Apple Industry Model
Scenarios* Base 1 2 3 4Population
Population Population IncomePopulation Income Income Acreage
Population Income Acreage Acreage Fresh ExportsIncome Acreage Fresh Exports Import Price Import Price
AABYear 1
2345
ABYear 1
2345
YYear 1
2345
QP’TYear 1
2345
QPUFYear 1
2345
QPUPYear 1
2345
QPUCYear 1
2345
QPUJYear 1
2345
QPUDYear 1
2345
QPUOYear 1
23
11.99.8
12.89.5
11,0
497.3507.1520.0529.4540,4
21.520.720.619.920.3
10694.010506,610729.710537.210981.9
6026.95813.66031.95926.76174,4
4566.24593.74596,44511,04703.8
1366.71471.71411.41409.01419.5
2581.22556.62594.72519,02677.4
285.7275.5292.9285.9296.7
68.793.991.5
0.00.00.00.00.0
485.5485.5485.5485.5485.5
21.520.820.920.421.0
10438,810106.010139.89897.9
10175.1
5908.25628.95740,45607,15760.4
4432.04381.64303,64197.34318.6
1347.21424.41363.71351.01357.7
2474.92393.72358,82269.82369.3
278.4264.4272.3263.6270,3
63.980.372.8
0.00.00.00.00.0
485,5485.5485.5485.5485.5
21.520.921.020.521.0
10438.810132.210183.69956.2
10218.3
5908.25650.95768.35643.85791.3
4432.04385.54319.14218.34330,5
1347.21417.91365.61353.01359.0
2474.92399.12369.82286.42378.6
278.4266.2272.8264.8271.2
63,978.271.9
0.00.00.00.00.0
485.5485.5485.5485.5485.5
21.520.820.920.420.9
10438.810099.110128.19882.3
10163.5
5908.25623.35733.25597.55752.3
4432.04380,44299.24191.44315.2
1347.21429.21364.71352.11358.6
2474.92390.12354.72264.12365.7
278.4263.9272.2263.3270.1
63.980.773.0
0.00.00.00.00.0
485.5485.5485.5485.5485.5
21.520.921.020,521,0
10438.810125.310171.99940.7
10206.7
5908.25645.35761.15634.35783.2
4432,04384,34314.84212.54327.1
1347.21422.21366,51354,11359.9
2474.92395.72365,72280.72375.0
278.4265.7272.7264.5271.0
63.978.572.0

Willett Apple Industry Econometric Model 147
Table 4. Forecasts Using the U.S. Apple Industry Model (continued)
Scenarios* Base 1 2 3 4Population
Population Population IncomePopulation Income Income Acreage
Population Income Acreage Acreage Fresh ExportsIncome Acreage Fresh Exports Import Price Import Price
45
QPURYear 1
2345
PFDYear 1
2345
PCDYear 1
2345
PJDYear 1
2345
PDDYear 1
2345
PODYear 1
2345
PRDYear 1
2345
PPDYear 1
2345
PADYear 1
2345
91.091.2
263.8195.9205.9206.1219.0
9.3411.7611.1012.5111.74
72,5875,3575.9588.5483.36
23.5741.0937.4949.0844.57
27.3552.6348.6961.5055.25
58.2373,5973.3984.7381.38
72.3781.8682.2195.8790.72
40.2652.4350.7263.6458.38
6.167.787.388.457.90
67,967.9
267.5218.8236.0245.0253.5
10.0312.7612.6914.1913.98
80.1390.9497,20
112.83112.07
28.8342.2150.1562.6562,26
32.3459.1758.7371.7570.56
63.1181.4284.7197.0097,54
80.1196.15
102.33118.42118.09
47.0264.6268.2683.1382.48
6.708.628,669.849.71
67.767.9
267.5224.2239,1246,4253.9
10.4112.9812,8914.3414.17
84.4795.46
100,19115.10114.51
31.8151.2851.8963.9663.83
36.4761.8460.9773.7072.85
66.2283.9286.5598,5099.27
83.8699.75
104.72120.17120.11
50.8467.9770.6884.9684.56
6.998,828,839.979.86
67.967,8
267.5216,5234,5244,1253.0
9.9412.7112.6514.1613.94
72.5689,9296.77
112.60111.85
27.4548.1349.1361,7561.29
31.1458.2858.0371.1169.82
61.9280,4083.8796.2696.73
78.6894.69
101,22117,50117.10
45.8763.4667.4182.4481.75
6.628,568.629.819.67
67.667.8
267.5222.3237.8245.6253.5
10.3212.9312.8414.3114.13
83,9094.5599.79
114.89114.29
30.4350.2050.8763.0662.86
35.2860.9660.2573.0572.11
65,0382.9285.7197.7698.46
82,4398.35
103.62119.25119.12
49.6966.8669.8484.2883.83
6.928.768.789.939.82
148 October 1993 Agricultural and Resource Economics Review
Table 4. Forecasts Using the U.S. Apple Industry Model (continued)
Scenarios* Base 1 2 3 4Population
Population Population IncomePopulation Income Income Acreage
Population Income Acreage Acreage Fresh ExportsIncome Acreage Fresh Exports Import Price Import Price
NIJYear 1 11.511 11.735 11.735 11.873 11.873
2 11.617 11.957 11.946 12.102 12.0903 11.593 12.080 12.057 12,775 12,2034 11,801 12.311 12.277 12.460 12.4265 11.533 12.156 12.137 12.301 12.282
*Population = Increase of 1,02Wyearhrcome = Increase of 1.01%/yearAcreage = Held at 1990 levelsImport Price = Fixed 10% decrease in first year of simulationFresh Exports = Fixed 10% increase in first year of simulation
gest that juice and fresh apples are substitutes formost products while dried, frozen and other appleproducts are complements.
Simulation analyses were used to analyze theimpacts ofexogenous changes on the performanceof the apple industry. The base case assumes that(1) population continues to increase at a rate con-sistent with the last five years of the sample, (2)income increases at a rate consistent with thelast five years of the sample, (3) per capita netimports of all apple products, with the exceptionof juice, remain at 1990 values, and (4) any longterm changes in the industry reflected by trendvariables in the model continue for the duration ofthe analysis.
The base case was compared with four differentscenarios where either acreage was assumed to re-main at 1990 levels, fresh exports were increased10 percent in the first year of the simulation, and/or the price of juice imports decreased 10 percentin the first year of the simulation. A comparison ofthe base case and the final simulation where acre-age was held constant, fresh exports increased 10percent and juice import prices decreased 10 per-cent suggests that there will be a 7 percent decreasein total production in the fifth year of the simula-tion. A larger percent of the crop is allocated to thefresh market in the last scenario. All pricesstrengthen with the fresh price 20.4 percent higherand processed product prices 43.6 percent higherthan in the base case. Per capita juice imports are6.5 percent greater in this simulation.
All of these scenarios suggest that constant acre-age provides limits on apple production and thusstrengthens prices of apple products. The increasein fresh exports generates demand for fresh apples,increases the quantity allocated to the fresh market
and strengthens the price of fresh apples. Thelower price of juice imports leads to an increase inthe quantity of juice imported and a decrease in thequantity of processed apples allocated to the juicemarket. Furthermore, a decrease in the importprice weakens the juice price and the average priceof all apple products.
REFERENCES
Baumes, Jr., H.S. and R.K. Conway. “Estimating Retail andFarm Marketing Relationships for U.S. Processed andFresh Apples, ” Fruit Outlook and Situation. U.S .D.A,Economic and Statistics Service TFS-232, (Sept, 1984):267.
Chaudry, A.J. An Econometric Analysis of the U.S. Apple In-
dusrry. Unpublished Ph.D. dissertation. Washington StateUniversity, 1988.
Dunn, J.W. and L.A. Garafola. “Changes in TransportationCosts and Interregional Competition in the U.S. AppleIndustry.” Northeastern Journal of Agricultural and Re-
source Economics 15(1986):37-44,
French, B.C. The long-term price and production outlook for
apples in the United State$ and Michigan. Michigan StateUniversity Agricultural Experimental Station TechnicalBulletin 255. April 1956.
French, B.C. and J.L. Matthews. “A Supply Response Modelfor Perennial Crops. ” American Journal of Agricultural
Economics 53(197 1):478-90.
French, B.C., G.A, King and D.D. Minami. “Planting andRemoval Relationships for Perennial Crops: An Applica-tion to Cling Peaches.” American Journal of Agricultural
Economics 67(1985):215-23.French, B.C. and L.S. Willett. An Econometric Model of the
U.S. Asparagus Industv. Giaonini Foundation of Agr-icultural Economic University of California. GianniniFoundation Research Report No. 340. Sept. 1989.
Fuchs, H.W., R.O.P. Farrish and R.W. BohalL “A Model ofthe U.S. Apple Industry: A Quadratic Interregional Inter-

Willett Apple Industry Econometric Model 149
temporal Activity Analysis Formulation. ”American Jour-
nal of Agricultural Economics 56( 1974):739–50.
Hayward, R.A., G.K. Criner and S.P. Skinner. “Apple Priceand Production Forecasts for Maine and the UnitedStates. ” Northeastern Journal of Agricultural and Re-
source Economics 13(1984):268–76.Huang, K.S. U.S. Demand for Food: A Complete System of
Price and Income .Eflects. National Economics Division,Economic Research Service, U.S .D.A., Technical Bulle-tin No. 1714. Dec. 1985.
Kmenta, J. Element$ of Econometrics. New York: MacmillanPublishing Company, Inc. 1971.
Maddala, G.S. Introduction to Econometrics. 2nd ed. NewYork: Macmillan Publishing Company, Inc, 1992.
Miller, J.R. “Seemingly Unrelated Regression and RegionalPrice Response Functions: A Study of U.S. Apple Produc-tion, ” Southern Economics Journal 43(1 976):804- 17.
Murphy, C. and L.S. Willett. [ssues in the Development and
Marketing of Reduced Chemical Agricultural Products: A
Look at Disease-Resistant Apple Cultivars. A. E. Ext.91-34. Department of Agricultural Economics, CornellUniversity December 1991.
Muth, J.F. “Rational Expectations and the Theory of PriceMovements. ” Econometrics 29( 196 1):315-35.
Nerlove, M. The Dynamics of Supply: Estimation of Farmer’s
Response to Price. Baltimore: Johns Hopkins Press, 1958.Nuckton, C.F., B.C. French, and G.A. King. An Econometric
Analysis of the California Raisin Industry. Giannini Foun-dation of Agricultural Economic University of California.Giannini Foundation Research Report No. 339. Dec.1988.
Piggott R.R. “Potential Gains from Controlling Distribution ofthe United States Apple Crop. ” Search Agriculture. Ag-riculture Economics 8. Vol. 6 No. 21976.
Rae A,N. and HF. Carman. “A Model of New Zealand AppleSupply Response to Technological Change. ” Australian
Journal of Agricultural Economics 19(1975):39-51.
Sparks, AL., J,L. Scale, Jr. and B.M. Buxton. Apple Import
Demand Four Markets for U.S. Fresh Apples. CommodityEconomics Division, Economic Research Service,U.S D.A., Agricultural Economic Report No. 641. Dec.1990.
Tomek, W.G. Apples in the United States: Farm Prices and
Uses, 1947-1975. Cornell University Agricultural Exper-iment Station. Bulletin 1022. July 1968.
USDA 1. Foreign Agricultural Trade of the United States Cal-
endar Year Supplement. Economic Research Service. Se-lected Issues.
USDA 2. Fruit and Tree Nuts Situalion and Outlook Reporr.
Economic Research Service. Selected Issues.
Waugh, F.V. Demand and Price Analysis. Economic and Sta-tistical Analysis Division, Economic Research Service,U.S.D.A., Technical Bulletin No. 1316. Nov. 1964.