
The U.S. Airways Group: A Post-Merger Analysis
38
Publications 2016 The U.S. Airways Group: A Post-Merger Analysis The U.S. Airways Group: A Post-Merger Analysis Wilfred S. Manuela Jr. Ateneo de Manila University Dawna L. Rhoades Embry-Riddle Aeronautical University, [email protected] Tamilla Curtis Embry-Riddle Aeronautical University, [email protected] Follow this and additional works at: https://commons.erau.edu/publication Part of the Business Commons Scholarly Commons Citation Scholarly Commons Citation Manuela, W. S., Rhoades, D. L., & Curtis, T. (2016). The U.S. Airways Group: A Post-Merger Analysis. Journal of Air Transport Management, 56(B). Retrieved from https://commons.erau.edu/publication/411 This Article is brought to you for free and open access by Scholarly Commons. It has been accepted for inclusion in Publications by an authorized administrator of Scholarly Commons. For more information, please contact [email protected].
Transcript of The U.S. Airways Group: A Post-Merger Analysis

Publications
2016
The U.S. Airways Group: A Post-Merger Analysis The U.S. Airways Group: A Post-Merger Analysis
Wilfred S. Manuela Jr. Ateneo de Manila University
Dawna L. Rhoades Embry-Riddle Aeronautical University, [email protected]
Tamilla Curtis Embry-Riddle Aeronautical University, [email protected]
Follow this and additional works at: https://commons.erau.edu/publication
Part of the Business Commons
Scholarly Commons Citation Scholarly Commons Citation Manuela, W. S., Rhoades, D. L., & Curtis, T. (2016). The U.S. Airways Group: A Post-Merger Analysis. Journal of Air Transport Management, 56(B). Retrieved from https://commons.erau.edu/publication/411
This Article is brought to you for free and open access by Scholarly Commons. It has been accepted for inclusion in Publications by an authorized administrator of Scholarly Commons. For more information, please contact [email protected].
1
THE U.S. AIRWAYS GROUP: A POST-MERGER ANALYSIS
Wilfred S. Manuela Jr.
Ateneo de Manila University
Dawna L. Rhoades
Embry-Riddle Aeronautical
University
Tamilla Curtis
Embry-Riddle Aeronautical
University
Corresponding Author
Wilfred S. Manuela Jr.
Department of Leadership and Strategy
5th Floor, John Gokongwei School of Management
Ateneo de Manila University, Katipunan Avenue, Loyola Heights
1108 Quezon City, Philippines
Mobile: +63 926 629 1667
Fax: + 63 2 426 6076
Research Highlights
• The financial and operating performance of the US Airways Group from Q4 2005 to Q4
2013, the post-merger period, has improved.
• The stock returns of the US Airways Group substantially outperformed the S&P 500 and
XAL in 2006 and 2007, the two-year period immediately following the merger, and for at
least four years between 2008 and 2013.
• The stock returns of the US Airways Group outperformed the stock returns of Delta Air
Lines and Southwest Airlines from 2010 to 2013 and United Airlines’ stock returns from
2012 to 2013.

2
THE U.S. AIRWAYS GROUP: A POST-MERGER ANALYSIS
Abstract
America West Airlines acquired the bankrupt US Airways on September 27, 2005
to form the US Airways Group. Our paper analyzes the post-merger performance
of the US Airways Group using airline operating metrics and financial ratios for
the period 2005 to 2013. While the airline has still a long way to go to improve its
leverage and liquidity ratios, its capital structure and ability to pay its obligations
have improved since 2005. Moreover, although the airline is still inefficient in
utilizing its assets, the efficiency improvements achieved since the merger have
resulted in profits and positive returns to investors. Its share prices have also
largely outperformed the S&P 500 and XAL since the merger, an indication that
investors are pleased with how the merger is developing over time. In view of the
US Airways Group’s improving financial and operating performance, the merger
is, essentially, a success.
KEYWORDS: Airline Financial Analysis, Airline Merger, Post-Merger Performance
1 Introduction
The number of airlines designated as major carriers in the United States (US) has always been
relatively small and virtually no carrier has achieved this status without acquiring or merging
with another carrier at some point in its history. While most airlines acquired assets and
expanded operations through organic growth, US Airways (USAir) is an exception. Although
USAir can trace its origin as part of All American Aviation, its growth can almost entirely be
attributed to a series of mergers and acquisitions (M&As) including a merger with Lake Central
Airlines in 1968 and the acquisition of Mohawk Airlines in 1972, making USAir one of the
world’s largest carriers at that time (US Airways Group, 2005). Still more M&As followed with
Pennsylvania Commuter Airlines in 1985, Reading Aviation Service in 1986, Pacific Southwest
Airlines in 1987, and Piedmont Airlines in 1989, and at the time of its approval, the USAir
merger with Piedmont was the largest airline merger in US history (US Airways Group, 2005).
The Piedmont deal is considered one of the most expensive and unsuccessful deals in US airline
history and USAir’s share prices began to drop as the airline amassed huge operating losses, in
part trying to equalize salaries between USAir and Piedmont (Jones and Jones, 1999). The airline
hovered on the brink of bankruptcy until British Airways acquired 24.6% of its stock in 1994.i
Unfortunately, the first decade of the 21st century proved even more tumultuous for USAir,
which filed for bankruptcy twice. In August 2002, USAir filed for Chapter 11 bankruptcy
protection and reorganization, and in September 2004 the airline filed for another Chapter 11. At
the time of the second filing, many expected the carrier to eventually sink into Chapter 7
liquidation because only one US airline, Continental Airlines, has ever survived two bankruptcy
filings (De Lollis, 2004). Despite dire predictions, however, USAir managed to beat the odds to
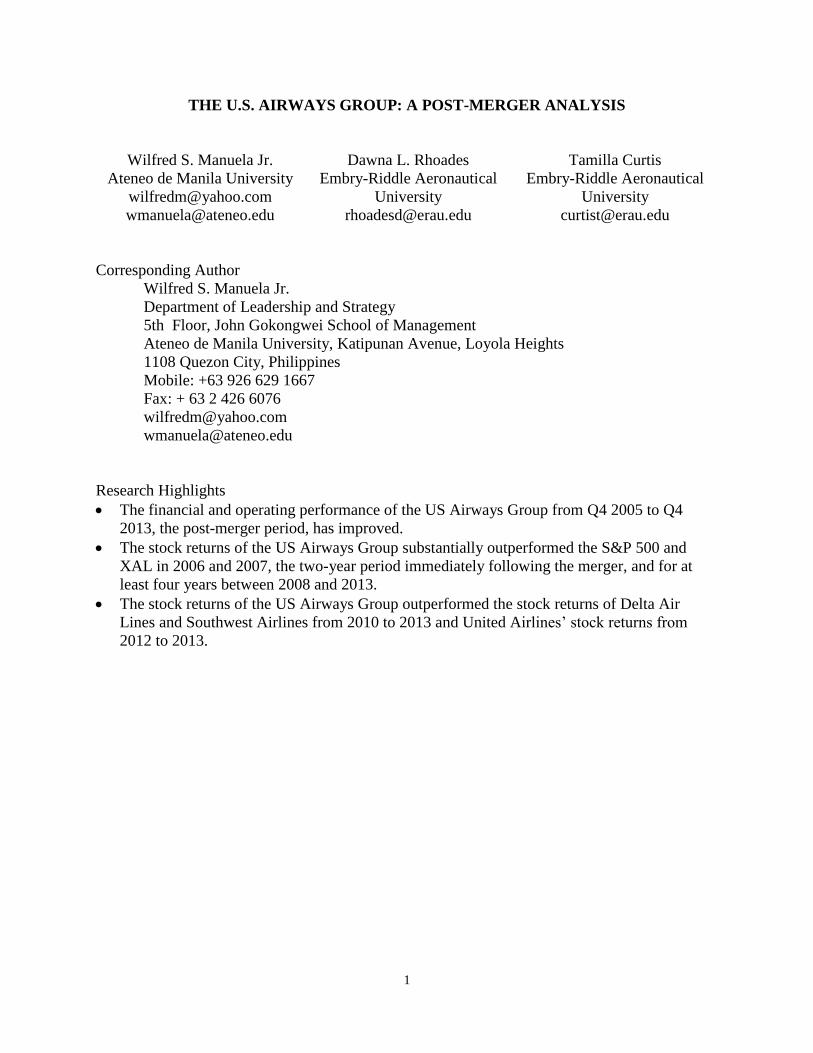
become the target of a 2005 acquisition by America West (Jones and Jones, 1999). Figure 1
shows the financial performance of USAir from the first quarter (Q1) of 2000 to the third quarter

3
(Q3) of 2007, which includes the two four-quarter periods immediately following USAir’s 2002
and 2004 Chapter 11 filing. Figure 1 indicates that USAir’s financial performance improved in
2003 and 2005, with net income rising substantially in Q1 2003 and Q3 2005. From the fourth
quarter (Q4) of 2005, which coincides with USAir’s merger with America West Airlines
(AWA), its financial performance improved—operating revenues have outpaced operating
expenses while operating profit and net income have been non-negative (see Figure 1).
Figure 1 USAir’s Operating Revenues and Net Income, Q1 2000–Q3 2007
Data source: masFlight
America West, a low-cost airline that acquired USAir in September 2005, has performed better
compared with USAir in the same period (see Figure 2). While America West’s net income
decreased in Q4 2005 and Q3 and Q4 2006, these declines are attributed to its acquisition of
USAir while the two airlines merged their operations and financial systems, completing the
process in Q4 2007.
Figure 2 AWA’s Operating Revenues and Net Income, Q1 2000–Q3 2007
-1.5
-1.0
-0.5
0.0
0.5
1.0
1.5
2.0
2.5
3.0
3.5
4.0
4.5
Q1
Q2
Q3
Q4
Q1
Q2
Q3
Q4
Q1
Q2
Q3
Q4
Q1
Q2
Q3
Q4
Q1
Q2
Q3
Q4
Q1
Q2
Q3
Q4
Q1
Q2
Q3
Q4
Q1
Q2
Q3
2000 2001 2002 2003 2004 2005 2006 2007
USAir Operating Revenues (USD Billion)
USAir Operating Expenses (USD Billion)
USAir Operating Profit (USD Billion)
USAir Net Income (USD Billion)

4
Data source: masFlight
The Airline Deregulation Act of 1978 played a significant role in the restructuring of the US civil
aviation industry. While the majority of passengers benefited from the reduction in fares and
expansion of services following deregulation, most US airlines struggled to survive under intense
competition (Graham et al., 1983). By the time America West acquired USAir, there had already
been 20 major airline M&As since 1978 and only one of these has been judged truly successful
in terms of improving financial and operating performance (Maruna and Morrell, 2010; Steffy,
2007). The airline industry has also been plagued by bankruptcy—the 2013 US Government
Accountability Office (GAO) report on airline mergers states that 194 airline bankruptcies
occurred between 1979 and 2012 including airlines such as Delta Air Lines (DAL), Northwest
Airlines, United Airlines (UAL), and USAir. While deregulation is a success based on expanded
networks with more frequent departures, increased carrier efficiency, and consistently high
safety records, financial turbulence in the aviation industry has resulted in increased instability in
the industry structure, loss of employment, and deterioration of service quality (Goetz and
Vowles, 2009). Smaller cities and shorter-haul routes have also experienced higher fares and less
frequent airline service (US GAO, 2010 and 2013). Currently, there are only three major
network airlines remaining in the US: American Airlines (AAL), Delta, and United.
This research analyzes the US Airways Group’s post-merger financial and operating
performance to identify evidence of a merger effect for America West and USAir. The analysis
will include the following.
• Share price performance against the Standard and Poor’s (S&P) 500 and the NYSE ARCA
AIRLINE INDEX Airline Index (XAL),
• Financial performance using financial ratios, and
• Airline operations metrics.
We argue that the US Airways Group’s financial and operational performance improves over
time, all other things held constant, since most airline consolidations are presumed to result in
-0.4
-0.2
0.0
0.2
0.4
0.6
0.8
1.0
1.2
1.4
1.6
Q1
Q2
Q3
Q4
Q1
Q2
Q3
Q4
Q1
Q2
Q3
Q4
Q1
Q2
Q3
Q4
Q1
Q2
Q3
Q4
Q1
Q2
Q3
Q4
Q1
Q2
Q3
Q4
Q1
Q2
Q3
2000 2001 2002 2003 2004 2005 2006 2007
AWA Operating Revenues (USD Billion)
AWA Operating Expenses (USD Billion)
AWA Operating Profit (USD Billion)
AWA Net Income (USD Billion)
5
increased revenues, due in part to improved access at more airports, and reduced costs, due
mainly to shared facilities and optimized labor arrangements.
2 Mergers and Acquisitions
Merger and acquisition is an external integration strategy, where legally and financially
independent companies combine to form a larger entity with hierarchical decision making
(Delfmann et al., 2005). Following this strategy, one of the entities gives up its financial and
legal independence. The motives for integration can include increasing revenues, improving
management efficiency and capital investment performance, and eliminating a competitor from
the market (Delfmann et al., 2005). The literature on M&As suggests that mergers involving
publicly traded companies occur in waves, which are preceded by unexpected or exogenous
industry shocks (Lipton, 2006; Ovtchinnikov, 2013).
A new wave of merger activity in the airline industry occurred in 2005, beginning with the
acquisition of USAir by America West in September 2005, followed by the merger of Delta and
Northwest in October 2008, and United and Continental in October 2010 (Manuela Jr. and
Rhoades, 2014), as well as Southwest’s acquisition of AirTran in May 2011 (Manuela Jr. and
Rhoades, 2013), and the US Airways Group and American Airlines in December 2013 (US
District Court for the District of Columbia, 2013). Two main views exist in the literature to
address what drives airline M&As—efficiency gains for merging airlines or market power gains
(Clougherty, 2002). While the first view emphasizes the ability to reduce costs by enhancing
hub-and-spoke networks, the other view notes the enhanced ability to raise fares. Airline mergers
are driven by financial and competitive pressures, and are seen as strategies to increase
profitability and financial stability (US GAO, 2010), while Park (2013) argues that airline M&As
are necessary to minimize asset devaluation to prevent a domino effect, as most major US
airlines are “too big to fail.” Table 1 presents the M&A history of the “too big to fail” major
carriers in the US.
Table 1 M&As in the US Airline Industry
US Airways 1939 All American Aviation
1972 Acquired Mohawk Airlines
1986 Acquired Empire Airlines
1987 Purchased Pacific Southwest Airlines
1988 Merged into USAir
1989 Piedmont and USAir merger
1998 Purchased Shuttle Inc.
2005 Merged with America West
2013 Merged with American Airlines
American Airlines
1929 The Aviation Corporation
1934 American Airways became American
Airlines Inc.
1970 Merged with Trans Caribbean Airways
1986 Acquired Air California
1990 Acquired Eastern Airlines Latin routes
1999 Acquired Reno Air
2001 Acquired TWA
2013 Merged with US Airways
Delta Air Lines
1929 Founded
1953 Merged with Chicago and Southern
Airlines
1972 Merged with Northeast Airlines
1987 Merged with Western Airlines
1991 Purchased Pan Am transatlantic routes
and shuttle
2000 ASA and Comair
2008 Acquired Northwest Airlines
United Airlines
1934 Founded Southwest Airlines
1971 Founded

6
1961 Merged with Capital Airlines
1963 Merged with Capital Airlines
1986 Purchased Pan Am Pacific routes
1990 Purchased Pan Am London routes
1991 Purchased Pan Am Latin American routes
2010 Merged with Continental Airlines
1985 Acquired Muse Air
1994 Acquired Morris Air
2008 Acquired certain assets of ATA Airlines
2011 Acquired AirTran
Source: US GAO (2013), p. 4
Maruna and Morrell (2010) investigate 18 major US airline mergers between 1978 and July 2005
and conclude that the integration of Delta Air Lines and Western Airlines in 1987 was the only
successful merger during this period while the literature suggests that 50% to 80% of all mergers
fail to meet the goals they set out to achieve. Their analysis of post-merger integration between
America West and USAir demonstrates that unit costs rose substantially in the year following the
merger, although this increase is compensated for by higher yields as a result of declining
capacity. Overall Maruna and Morrell (2010) conclude that the merger of America West and
USAir should be able to achieve profitability by improving efficiency and fleet restructuring. If
the performance record of airline M&As is so poor, however, then what are the benefits and what
accounts for the ‘failures’?
2.1 Benefits and Challenges of M&As
One of the primary goals of M&As is to increase shareholder value. The literature suggests that
this is often not the case, however, since size alone is not a good indicator of improved
performance (Agrawal et al., 1992). Firms looking at changes in ownerships should analyze
whether the consolidation will increase shareholder value (Langetieg, 1978) and whether private
equity funds investing in airlines will be able to generate target returns (Tarry, 2007). In a 2007
survey of Aircraft Finance Forum delegates, Tarry (2007) reports that 62% of respondents
consider that consolidation results in higher shareholder value while 72% considers that M&As
would miss their targets within the required period.
A meta-analysis of 93 empirical studies of M&A performance suggests that “M&A activity does
not create superior post-acquisition performance for acquiring firms and is consistent with the
non-value-maximizing arguments often advanced to explain M&A activity” (King et al., 2004:
192–193). Nevertheless, target and acquiring firms realize positive abnormal returns on the
merger announcement date (Franks and Harris, 1989; Houston and Ryngaert, 1994), indicating
an initial expectation that M&A activity will create longer-term synergy. The returns for
acquired firms are extremely high, however, while the returns for acquiring firms are much lower
(King et al., 2004). Despite anticipated gains at the time of the announcement, market returns to
the acquiring firm after the acquisition including return on assets (ROA), return on equity (ROE),
and return on sales, are generally a zero-sum game and the expected synergies from the merger
announcement date are not realized by acquiring firms, indicating that acquisitions have no
significant effect or even a slightly negative effect on an acquiring firm's financial performance
in the post-announcement period (King et al., 2004; Malatesta, 1983).
Proponents of airline mergers cite a number of benefits, however. Merkert and Morrell (2012)
state that domestic markets experience slower growth and air service agreements limit the
growth outside the home country. M&As can lead to an increase in revenues by extending the
7
airlines’ network, increasing market share, charging higher fares on some routes, improving
network connectivity, increasing frequent flyer loyalty, better aircraft utilization, and other
measures (US GAO, 2013).
One of the primary benefits of M&As is cost reduction, which comes from combining
complementary assets, eliminating duplication in services and labor, or eliminating unprofitable
routes (Merkert and Morrell, 2012). Benefits can also result from operating similar fleet, facility
consolidation, balance sheet restructuring including renegotiation of aircraft leases, and more
effective management of capacity (Mercado, 2011). Additionally, airlines can gain
complementary routes, giving them the competitive advantage over their rivals (Liang, 2013).
Thus, the benefits of M&As usually include the following (Liang, 2013; Mercado, 2011; Merkert
and Morrell, 2012).
• Efficiency increase and cost reduction
• Market share increase
• Increased demand from an expanded network, which serves more city-pair markets. M&As
provide airlines with complementary routes, which result in a stronger platform.
• Revenue increase, e.g., capacity reduction in some markets after the merger provides an
opportunity to generate additional revenue from increased fares.
• Elimination of competition
• Access to airport slots and facilities
• Access to aircraft
• Better customer service
The chief benefit of M&As, in general, is the perceived improvement in the overall performance
of the merged firm due to the removal of underperforming activities and the development of
more efficient financial and operational structures (Packalen and Sen, 2013). Airline mergers
may result in consolidation of route networks and hub operations, as well as in 0.5% fare
increase and 1% increase in passenger traffic by improving product quality and offering more
direct flights (Ryerson and Kim, 2013; Martin, 2011), while routes can be served with larger
aircraft at lower frequencies resulting in fuel savings of up to 28% (Ryerson and Kim, 2013).
Airlines may become too large to produce at optimal efficiency and operate at their full potential
in terms of technical efficiency, however, resulting in diseconomies of scale, which suggests that
the optimal size, in terms of the number of available seat kilometers (ASKs), is between 32
billion and 54 billion ASKs and airline mergers that result in size of at least 100 billion ASKs do
not benefit in terms of scale efficiency, and in such cases other strong motives for M&As exist to
justify the merger (Merkert and Morell, 2012).
While some stakeholders may support the merger initially, they can also change their mind due
to a number of factors (Mercado, 2011). M&A failure can be attributed to many factors including
clashing company cultures, union resistance, and other operating factors (Merkert and Morell,
2012) since shareholders, customers, employees, and communities often possess competing
interests.
Fleming (2011) lists three main challenges airline M&As have:
1. Workforce integration including pilots, flight attendants, and mechanics. The labor groups
often oppose mergers fearing the loss of employment and seniority or salary reduction.
8
2. Fleet integration could be costly. Combining two fleets may increase costs due to pilot
training, maintenance, and additional spare parts.
3. Information technology integration.
Given the poor results of most M&As the success of the America West and USAir merger is not
a certainty and answering questions about its performance requires careful consideration of a
number of factors.
3 Data and Method
We collected the quarterly financial and operations data of America West and USAir from 2000
to 2007, and the US Airways Group (stock ticker symbol LCC) from 2005 to 2013, as well as the
daily closing indices of the S&P 500, XAL, and the daily closing prices of America West,
USAir, and the US Airways Group for the same period. We divided the stock performance data
into three periods: the transition period of the newly merged airline, including six months leading
to the merger, from March 2005 to December 2007, the first three years of the merger from
January 2008 to December 2010, and the succeeding years until the US Airways Group’s merger
with American Airlines on December 9, 2013. While America West acquired the bankrupt
USAir on September 27, 2005, the two airlines did not consolidate their operations and financial
reports until Q4 2007. Consequently, we added the operations and financial data of America
West to the operations and financial data of USAir from Q4 2005 to Q3 2007 and included this
merger transition period in the operations and financial performance analysis of each airline.
Four groups of financial ratios—leverage ratios, liquidity ratios, efficiency ratios, and
profitability ratios—for USAir, America West, and the US Airways Group, using the formulas in
Brealey, Myers, and Allen (2011), were computed to examine the financial performance of
USAir and America West before the merger as well as the financial performance of the US
Airways Group after the merger. Please refer to the Appendix for the financial ratio formulas.
The graphs of the financial ratios show the financial performance of the three airlines across time
to facilitate the interpretation and comparison of the financial ratios.
The graphs of the operations metrics data of USAir and America West before the merger as well
as the US Airways Group’s operations metrics after the merger show the operating performance
of each airline in the observation period and facilitate the interpretation and comparison of
operations metrics data.
While daily abnormal returns (DARs) and cumulative abnormal returns (CARs) are the usual
metrics in examining short-run stock performance, we computed the end-of-the-month trading
day abnormal returns for America West-US Airways Group because our intention is not to
compute and analyze the daily performance of the airline’s stock price against the S&P 500 and
XAL, but to show the trend of its share price performance from March 2005 to December 2013.
This means that we are not just interested in the abnormal returns of the airline’s share prices per
se, but more on its share price performance in the long term. We also computed the end-of-the-
month trading day cumulative abnormal returns for Delta, United, and Southwest for
comparison. We did not include the share price performance of American Airlines because its
share price collapsed after filing for Chapter 11 in November 2011 (Milford et al., 2011).

9
4 US Airways and America West Airlines
The history of USAir goes back to 1939, as All American Aviation brought the first airmail
service to small western Pennsylvania and Ohio Valley communities and in 1949 made the
transition from airmail to passenger service with the new DC-3, while on the other side of the
continental US 44 years later, America West began its operation in Phoenix, Arizona in August
1983 with three 737s (US Airways Group, 2013).
4.1 USAir’s Operating Performance
Figure 3 USAir’s Seats, Passengers, ASMs, RPMs, and Departure Frequency, Q1 2000–Q3 2007
Data source: masFlight
Figures 3 to 5 show the operating performance of USAir from Q1 2000 to Q3 2007, which
includes the transition period from the time America West acquired USAir in September 2005 up
to the consolidation of the operations and financial systems of the two airlines as the US Airways
Group in Q3 2007. The decline in the number of passengers between Q2 2001 and Q1 2004
compelled USAir to reduce its departure frequency in the same period, resulting in declining
available seat miles (ASMs) and revenue passenger miles (RPMs), although its ASMs and RPMs
increased between Q2 2004 and Q3 2005 from their Q1 2003 levels (see Figure 3). While
USAir’s departure frequency continued to decline from Q3 2005 to Q3 2007, its ASMs and
RPMs show an increasing trend in the same period, indicating USAir’s shift to larger aircraft, a
move that improves cost efficiency.
Figure 4 USAir’s Yield, Revenue per ASM, CASM, and Departure Frequency, Q1 2000–Q3 2007
5
10
15
20
25
30
Q1
Q2
Q3
Q4
Q1
Q2
Q3
Q4
Q1
Q2
Q3
Q4
Q1
Q2
Q3
Q4
Q1
Q2
Q3
Q4
Q1
Q2
Q3
Q4
Q1
Q2
Q3
Q4
Q1
Q2
Q3
2000 2001 2002 2003 2004 2005 2006 2007
USAir Million Seats
USAir Million Passengers
USAir Billion ASMs
USAir Billion RPMs
USAir Ten Thousand Departures

10
Data source: masFlight and Diio Mi
USAir’s yield (passenger revenue per RPM), revenue per ASM, and cost per ASM (CASM)
show a somewhat stable trend between Q1 2000 and Q3 2005, except for a spike in CASM in Q4
2001 due to a 14% increase in USAir’s operating cost while its ASMs declined 18% in the same
period (see Figure 4). The spike in USAir’s CASM from Q4 2005 to Q1 2007 is attributed to
operational difficulties during the transition period of its merger with America West. USAir’s
CASM is higher than its yield and revenue per ASM for the period Q1 2000 to Q1 2007,
underscoring USAir’s operational inefficiency and dire financial situation, although its yield and
revenue per ASM improved since its acquisition by America West in September 2005.
Figure 5 Load Factors of USAir and the US Airline Industry, Q1 2000–Q3 2007
0.00
0.05
0.10
0.15
0.20
0.25
0.30
0.35
Q1
Q2
Q3
Q4
Q1
Q2
Q3
Q4
Q1
Q2
Q3
Q4
Q1
Q2
Q3
Q4
Q1
Q2
Q3
Q4
Q1
Q2
Q3
Q4
Q1
Q2
Q3
Q4
Q1
Q2
Q3
2000 2001 2002 2003 2004 2005 2006 2007
USAir Yield USAir Revenue per ASM USAir Cost per ASM

11
Data source: masFlight, Diio Mi, and the US Bureau of Transportation Statistics. The breakeven load factors of
AAL, DAL, and UAL were used in the calculation of the “major airlines breakeven load factor.”
Although USAir reduced its ASMs and departure frequency to match passenger demand (see
Figure 3), resulting in higher load factors in Q3 and Q4 2003 when USAir achieved a load factor
of 75%, matching or slightly exceeding the load factor of the US airline industry in the same
period (see Figure 5), its load factor, on average, trails the US airline industry’s by at least seven
percentage points for the period Q1 2000 to Q3 2007. USAir’s breakeven load factors are higher
than the weighted average breakeven load factors of major airlines—American, Delta, and
United—indicating that USAir has a higher cost structure than these airlines.
In general, USAir’s operating performance indicates that the airline is doing poorly both at
generating revenues and reducing costs, resulting in losses or minimal profit, except for Q1
2003, for the period Q1 2000 to Q3 2007 (see Figure 1).
4.2 USAir’s Financial Performance
The deteriorating operating performance of USAir from Q1 2000 to Q3 2007 resulted in its poor
financial performance in the same period. The continuous decline in USAir’s number of
passengers and RPMs, as well as its inability to achieve load factors that match the US airline
industry’s, resulted in the deterioration of its leverage, liquidity, efficiency, and profitability
ratios.
Figure 6 USAir’s Leverage Ratios, Q1 2000–Q3 2007
50%
60%
70%
80%
90%
100%
110%
120%
Q1
Q2
Q3
Q4
Q1
Q2
Q3
Q4
Q1
Q2
Q3
Q4
Q1
Q2
Q3
Q4
Q1
Q2
Q3
Q4
Q1
Q2
Q3
Q4
Q1
Q2
Q3
Q4
Q1
Q2
Q3
2000 2001 2002 2003 2004 2005 2006 2007
USAir Load Factor
US Airline Industry Load Factor
USAir Breakeven Load Factor
Major Airlines Breakeven Load Factor

12
Data source: masFlight.
USAir’s debt ratio and debt ratio with short-term debt average 0.97 and 0.98, respectively, from
Q1 2000 to Q3 2007, indicating that the airline relies heavily on debt to finance its operations,
while its negative times-interest earned ratio (see Figure 6), except for Q4 2006, indicates that
the airline has difficulty making interest payments on its debt, implying that the airline may
default on its financial obligations. The spike in USAir’s times-interest earned ratio in Q1 2003
is due to its lower interest payments as a result of its Chapter 11 filing in 2002 while the spike in
Q4 2006 is due to its higher earnings before taxes and lower interest payments. The highly
negative debt-equity ratios for Q2 2004 and Q3 2005 are due to USAir’s shrinking negative net
shareholder equity. Overall USAir’s leverage ratios indicate a heavy reliance on debt to finance
its assets, suggesting that USAir’s financial risk is high and may result in a higher cost of capital,
exacerbating its already dire financial situation.
Figure 7 USAir’s Liquidity Ratios, Q1 2000–Q3 2007
-500
-400
-300
-200
-100
0
100
-12
-8
-4
0
4
8
12
16
20
24
28
32
36
40
Q1
Q2
Q3
Q4
Q1
Q2
Q3
Q4
Q1
Q2
Q3
Q4
Q1
Q2
Q3
Q4
Q1
Q2
Q3
Q4
Q1
Q2
Q3
Q4
Q1
Q2
Q3
Q4
Q1
Q2
Q3
2000 2001 2002 2003 2004 2005 2006 2007
USAir Debt Ratio
USAir Debt Ratio with Short-Term Debt
USAir Times-Interest Earned
USAir Debt-Equity Ratio
13
Data source: masFlight
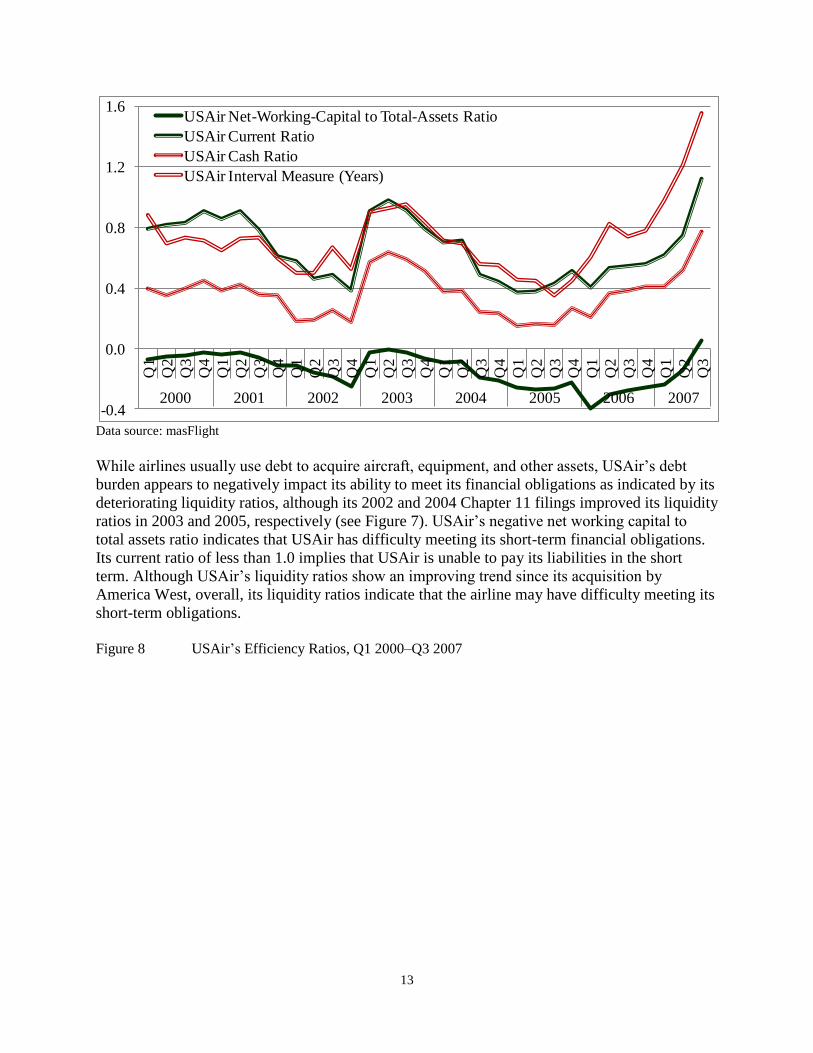
While airlines usually use debt to acquire aircraft, equipment, and other assets, USAir’s debt
burden appears to negatively impact its ability to meet its financial obligations as indicated by its
deteriorating liquidity ratios, although its 2002 and 2004 Chapter 11 filings improved its liquidity
ratios in 2003 and 2005, respectively (see Figure 7). USAir’s negative net working capital to
total assets ratio indicates that USAir has difficulty meeting its short-term financial obligations.
Its current ratio of less than 1.0 implies that USAir is unable to pay its liabilities in the short
term. Although USAir’s liquidity ratios show an improving trend since its acquisition by
America West, overall, its liquidity ratios indicate that the airline may have difficulty meeting its
short-term obligations.
Figure 8 USAir’s Efficiency Ratios, Q1 2000–Q3 2007
-0.4
0.0
0.4
0.8
1.2
1.6
Q1
Q2
Q3
Q4
Q1
Q2
Q3
Q4
Q1
Q2
Q3
Q4
Q1
Q2
Q3
Q4
Q1
Q2
Q3
Q4
Q1
Q2
Q3
Q4
Q1
Q2
Q3
Q4
Q1
Q2
Q3
2000 2001 2002 2003 2004 2005 2006 2007
USAir Net-Working-Capital to Total-Assets Ratio
USAir Current Ratio
USAir Cash Ratio
USAir Interval Measure (Years)

14
Data source: masFlight
The negative impact of USAir’s lower revenue per ASM compared to its CASM from Q1 2000
to Q3 2007 and its declining or stable but low yield from Q1 2000 to Q3 2005 (see Figure 4) on
its revenues indicates that the airline is not efficient in using its assets—USAir generates
revenues of USD 0.25 for every dollar of assets (refer to total asset turnover in Figure 8).
USAir’s efficiency ratios indicate that the airline is grossly mismanaged, making USAir a good
candidate for acquisition or takeover by a rival airline that can employ its resources and
capabilities (Barney, 1991; Grant, 1991) more effectively and efficiently. USAir’s efficiency
ratios improved since its acquisition by America West, specifically between Q4 2005 and Q4
2006, while the deterioration of its receivables turnover and longer collection period in 2007 (see
Figure 8) may be attributed to the difficulties in merging USAir’s and America West’s financial
systems.
Figure 9 USAir’s Profitability Ratios, Q1 2000–Q3 2007
0
1
2
3
4
5
6
7
8
9
10
0.0
0.2
0.4
0.6
0.8
1.0
1.2
1.4
Q1
Q2
Q3
Q4
Q1
Q2
Q3
Q4
Q1
Q2
Q3
Q4
Q1
Q2
Q3
Q4
Q1
Q2
Q3
Q4
Q1
Q2
Q3
Q4
Q1
Q2
Q3
Q4
Q1
Q2
Q3
2000 2001 2002 2003 2004 2005 2006 2007
USAir Total Asset Turnover
USAir Fixed Asset Turnover
USAir Average Collection Period (Years)
USAir Receivables Turnover

15
Data source: masFlight
USAir’s inefficient use of its assets results in decreasing profitability, except in Q1 2003 and Q3
2005 as a result of its 2002 and 2004 Chapter 11 filing (see Figure 9). Although USAir’s gross
margins and net income improved since America West acquired USAir, its inability to generate
sufficient revenues and its reliance on debt to finance its assets negatively impact profitability—
ROA and ROE have been close to zero or negative and its highly negative ROE in Q1 2004 and
Q2 2006 may be due to the USD 181 million loss and negative equity, respectively. Overall
USAir’s profitability ratios indicate that the airline is not a good investment.
The foregoing operating and financial performance of USAir suggests that its management has
not been effective and efficient in operating USAir’s resources and capabilities. This may be the
reason behind America West’s decision to acquire the airline, especially when investors have
driven USAir’s share prices lower, making the airline cheaper. One of the reasons for M&As is
that acquiring firms consider their target firms grossly mismanaged and expect to manage the
target firms more efficiently once they gain control of these firms. While the merger between a
legacy carrier (USAir) and a low-cost airline (America West) may seem strange, as a low-cost
carrier that understands how to run an airline more efficiently, America West’s management has
the capability of turning the merger with USAir into a financially rewarding venture for its
shareholders and USAir’s.
4.3 America West Airlines’ Operating Performance
America West’s operating performance is much better than USAir’s (compare Figures 10 to 12
with Figures 3 to 5). The airline’s number of passengers and RPMs show an increasing trend
between Q1 2002 and Q3 2005 while its departure frequency is generally stable in the same
period (see Figure 10). America West’s seat capacity and ASMs tend to follow passenger
demand resulting in increasing yield since Q4 2004 and revenue per ASM since Q1 2002 (see
Figure 11). The airline’s attempts at capacity discipline resulted in load factors averaging almost
-28
-24
-20
-16
-12
-8
-4
0
4
-0.8
-0.6
-0.4
-0.2
0.0
0.2
0.4
0.6
0.8
1.0
1.2
1.4
1.6
Q1 Q3 Q1 Q3 Q1 Q3 Q1 Q3 Q1 Q3 Q1 Q3 Q1 Q3 Q1 Q3
2000 2001 2002 2003 2004 2005 2006 2007
USAir Gross Margin
USAir Net Profit Margin
USAir Return on Assets
USAir Return on Equity

16
73% from Q1 2000 to Q3 2007, which generally matched the US airline industry’s load factors
(see Figure 12). These results indicate that America West is able to adjust its capacity to
passenger demand reasonably well as indicated by its increasing RPMs and load factors since Q4
2001 and Q1 2003, respectively (see Figures 10 and 12). The airline’s improving operating
performance suggests that its management is capable of improving the operating performance of
USAir and its acquisition of USAir may further improve America West’s competitive position in
the US airline industry.
Figure 10 AWA’s Seats, Passengers, ASM, RPM, and Departure Frequency, Q1 2000–Q3 2007
Data source: masFlight
Figure 11 AWA’s Yield, Revenue per ASM, CASM, and Departure Frequency, Q1 2000–Q3 2007
2.0
2.5
3.0
3.5
4.0
4.5
5.0
5.5
6.0
6.5
7.0
7.5
8.0
Q1
Q2
Q3
Q4
Q1
Q2
Q3
Q4
Q1
Q2
Q3
Q4
Q1
Q2
Q3
Q4
Q1
Q2
Q3
Q4
Q1
Q2
Q3
Q4
Q1
Q2
Q3
Q4
Q1
Q2
Q3
2000 2001 2002 2003 2004 2005 2006 2007
AWA Million Seats
AWA Million Passengers
AWA Billion ASMs
AWA Billion RPMs
AWA Ten Thousand Departures

17
Data source: masFlight Figure 12 Load Factors of AWA and the US Airline Industry, Q1 2000–Q3 2007
Data source: masFlight and the US Bureau of Transportation Statistics
0.05
0.06
0.07
0.08
0.09
0.10
0.11
0.12
0.13
0.14
0.15
Q1
Q2
Q3
Q4
Q1
Q2
Q3
Q4
Q1
Q2
Q3
Q4
Q1
Q2
Q3
Q4
Q1
Q2
Q3
Q4
Q1
Q2
Q3
Q4
Q1
Q2
Q3
Q4
Q1
Q2
Q3
2000 2001 2002 2003 2004 2005 2006 2007
AWA Yield
AWA Revenue per ASM
AWA Cost per ASM
60%
64%
68%
72%
76%
80%
84%
Q1
Q2
Q3
Q4
Q1
Q2
Q3
Q4
Q1
Q2
Q3
Q4
Q1
Q2
Q3
Q4
Q1
Q2
Q3
Q4
Q1
Q2
Q3
Q4
Q1
Q2
Q3
Q4
Q1
Q2
Q3
2000 2001 2002 2003 2004 2005 2006 2007
AWA Load Factor
US Airline Industry Load Factor
18
4.4 America West Airlines’ Financial Performance
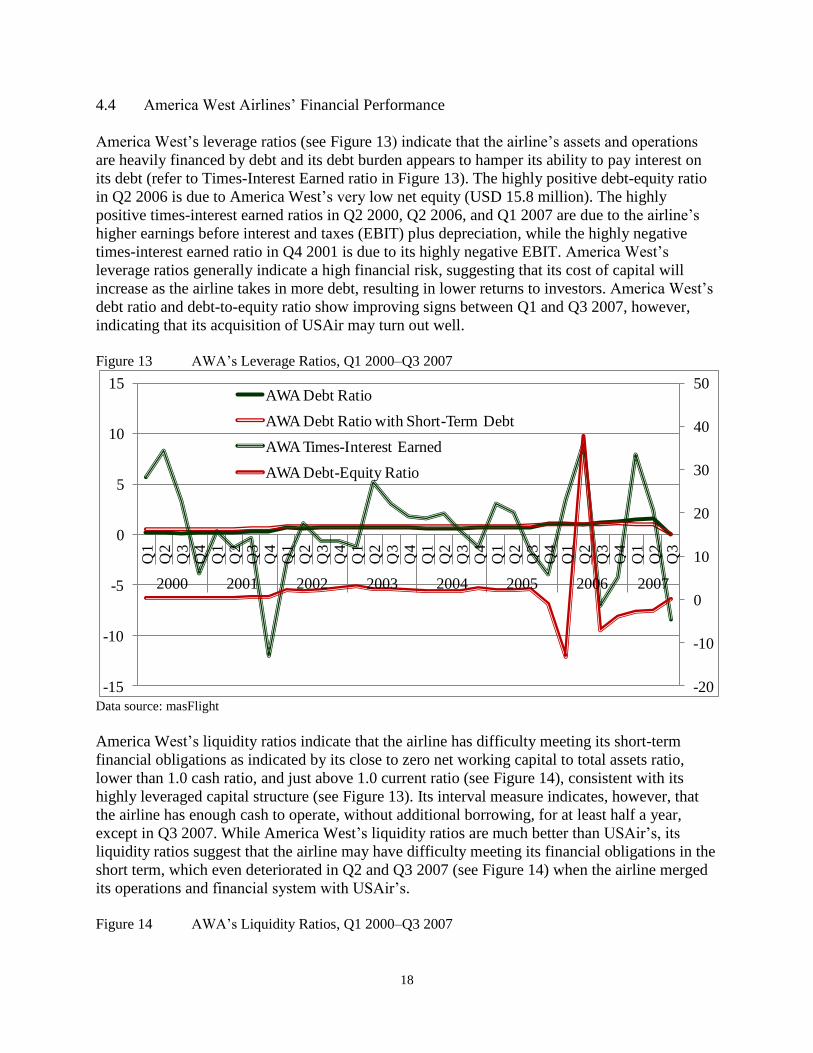
America West’s leverage ratios (see Figure 13) indicate that the airline’s assets and operations
are heavily financed by debt and its debt burden appears to hamper its ability to pay interest on
its debt (refer to Times-Interest Earned ratio in Figure 13). The highly positive debt-equity ratio
in Q2 2006 is due to America West’s very low net equity (USD 15.8 million). The highly
positive times-interest earned ratios in Q2 2000, Q2 2006, and Q1 2007 are due to the airline’s
higher earnings before interest and taxes (EBIT) plus depreciation, while the highly negative
times-interest earned ratio in Q4 2001 is due to its highly negative EBIT. America West’s
leverage ratios generally indicate a high financial risk, suggesting that its cost of capital will
increase as the airline takes in more debt, resulting in lower returns to investors. America West’s
debt ratio and debt-to-equity ratio show improving signs between Q1 and Q3 2007, however,
indicating that its acquisition of USAir may turn out well.
Figure 13 AWA’s Leverage Ratios, Q1 2000–Q3 2007
Data source: masFlight
America West’s liquidity ratios indicate that the airline has difficulty meeting its short-term
financial obligations as indicated by its close to zero net working capital to total assets ratio,
lower than 1.0 cash ratio, and just above 1.0 current ratio (see Figure 14), consistent with its
highly leveraged capital structure (see Figure 13). Its interval measure indicates, however, that
the airline has enough cash to operate, without additional borrowing, for at least half a year,
except in Q3 2007. While America West’s liquidity ratios are much better than USAir’s, its
liquidity ratios suggest that the airline may have difficulty meeting its financial obligations in the
short term, which even deteriorated in Q2 and Q3 2007 (see Figure 14) when the airline merged
its operations and financial system with USAir’s.
Figure 14 AWA’s Liquidity Ratios, Q1 2000–Q3 2007
-20
-10
0
10
20
30
40
50
-15
-10
-5
0
5
10
15
Q1
Q2
Q3
Q4
Q1
Q2
Q3
Q4
Q1
Q2
Q3
Q4
Q1
Q2
Q3
Q4
Q1
Q2
Q3
Q4
Q1
Q2
Q3
Q4
Q1
Q2
Q3
Q4
Q1
Q2
Q3
2000 2001 2002 2003 2004 2005 2006 2007
AWA Debt Ratio
AWA Debt Ratio with Short-Term Debt
AWA Times-Interest Earned
AWA Debt-Equity Ratio

19
Data source: masFlight
America West’s efficiency ratios have improved since Q1 2002 (see Figure 15), indicating that,
as a low-cost carrier, the airline has efficiently managed its assets to stay competitive. America
West generates revenues of USD 0.35 per dollar of assets, on average, from Q1 2000 to Q3
2007, USD 0.10 more than USAir’s, while its average collection period decreased from 267 days
to just 11 days between Q1 2000 and Q3 2007, indicating a much improved collection efficiency.
Figure 15 AWA’s Efficiency Ratios, Q1 2000–Q3 2007
Data source: masFlight
-0.25
0.00
0.25
0.50
0.75
1.00
1.25
1.50
1.75
Q1
Q2
Q3
Q4
Q1
Q2
Q3
Q4
Q1
Q2
Q3
Q4
Q1
Q2
Q3
Q4
Q1
Q2
Q3
Q4
Q1
Q2
Q3
Q4
Q1
Q2
Q3
Q4
Q1
Q2
Q3
2000 2001 2002 2003 2004 2005 2006 2007
AWA Net-Working-Capital to Total-Assets Ratio
AWA Current Ratio
AWA Cash Ratio
AWA Interval Measure (Years)
0
5
10
15
20
25
30
35
0
1
2
3
4
5
6
7
Q1
Q2
Q3
Q4
Q1
Q2
Q3
Q4
Q1
Q2
Q3
Q4
Q1
Q2
Q3
Q4
Q1
Q2
Q3
Q4
Q1
Q2
Q3
Q4
Q1
Q2
Q3
Q4
Q1
Q2
Q3
2000 2001 2002 2003 2004 2005 2006 2007
AWA Total Asset Turnover
AWA Fixed Asset Turnover
AWA Average Collection Period (Years)
AWA Receivables Turnover

20
Although America West’s efficiency ratios improved since Q1 2002, its profitability ratios have
remained low or negative, indicating that the airline has not been a good investment (see Figure
14). America West’s ROA has averaged -0.3% per quarter from Q1 2000 to Q3 2007 while its
ROE has averaged -24.6% per quarter in the same period due to a very high negative ROE from
Q4 2005 to Q2 2006 caused either by its negative shareholders’ equity or huge losses. Its highly
negative net profit margin results from losses of USD 155 million and USD 375 million in Q4
2001 and Q4 2005, respectively.
Figure 16 AWA’s Profitability Ratios, Q1 2000–Q3 2007
Data source: masFlight
In 2004, a year before the merger, America West lost USD 85.26 million while USAir lost USD
577.86 million. In order to survive in a more competitive environment, a new strategy is needed
and the merger seems like a feasible opportunity. The anticipated cost per passenger mile for the
merged airline is expected to be 9.5 to 10 cents while in 2004 American had a cost per passenger
mile of 9.8 cents, Delta 11.6 cents, Northwest 11 cents, Continental 10.6 cents, and United 10.1
cents (Airline Business Report, 2005), indicating that the merger of America West and USAir
will result in one of the lowest costs among US full-service airlines. The merged airline, though
expected to do better than major airlines, would still have costs above low-cost carriers such as
Southwest, which had costs of 7.7 cents, and JetBlue with 6.7 cents in 2004 (Airline Business
Report, 2005). Some 58 aircraft were planned for removal from the merger of America West and
USAir, resulting in improved utilization of the remaining aircraft, while the combination of their
route networks would allow the two airlines to provide more efficient and seamless east-to-west
flying experience for passengers (Airline Business Report, 2005).
On September 27, 2005 the America West Holdings Corporation, the parent company of America
West, acquired the bankrupt USAir to form the US Airways Group, which includes US Airways
and its subsidiaries PSA Airlines Inc. and Piedmont Airlines Inc. that operate under the US
Airways Express brand, becoming the fifth largest US domestic airline at that time (US Airways
-6
-5
-4
-3
-2
-1
0
1
2
3
4
-0.7
-0.6
-0.5
-0.4
-0.3
-0.2
-0.1
0.0
0.1
0.2
Q1
Q2
Q3
Q4
Q1
Q2
Q3
Q4
Q1
Q2
Q3
Q4
Q1
Q2
Q3
Q4
Q1
Q2
Q3
Q4
Q1
Q2
Q3
Q4
Q1
Q2
Q3
Q4
Q1
Q2
Q3
2000 2001 2002 2003 2004 2005 2006 2007
AWA Gross Margin
AWA Net Profit Margin
AWA Return on Assets
AWA Return on Equity
21
Group, 2005). The two airlines’ operating certificates were merged in late 2007 (US Airways
Group, 2013). The US Airways Group head office remained at America West’s head office in
Tempe, Arizona and America West executive management team and board members are in control
of the merged company (US Airways Group, 2005 and 2013). The acquisition by America West,
which has a strong presence in the western part of the US, complemented USAir’s routes in the
Northeast, the Caribbean, and Europe (US Airways Group, 2013). The shares of America West
and USAir closed at USD 8.70 and USD 0.16, respectively, on September 26, 2005 and the
following trading day, September 27, the official merger date, the newly formed US Airways
Group closed at USD 19.30 using a new ticker symbol LCC (Manuela Jr. and Rhoades, 2014).
Under the newly formed airline, the US Airways Group, US Airways Shuttle, and US Airways
Express operated approximately 3,800 flights per day and served more than 230 destinations in
the US, Canada, Europe, the Caribbean, and Latin America (US Airways Group, 2005).
Other benefits of the America West and USAir merger include but not limited to the following
(PR Newswire, 2005):
• Single-branded product offering a large network of worldwide destinations,
• Financial stability with more than USD 2.5 billion in restricted and unrestricted cash,
• The Star Alliance membership comprising of 16 airlines offering more than 15,000 daily
flights to 795 destinations in 139 countries at the time of the merger,
• Dividend Miles frequent flyer program,
• First class cabins on both domestic and international flights with advance seating
assignments and in-flight amenities, and
• Seventeen US Airways Clubs providing a quiet and comfortable place to work or relax.
The America West and USAir merger potentially reduces costs by USD 600 million due to
synergies—the merger closed with new equity of USD 867 million from investors and another
USD 830 million in partner and other financial support that by the end of October 2005, the US
Airways Group had over USD 2.5 billion in total cash (US Airways Group, 2005). In 2011 the
US Airways Group stated that the industry had too many competitors prior to 2005, which
caused an “irrational business model” and “fewer airlines is a good thing” (US District Court for
the District of Columbia, 2013). The grand restructuring plan was far from over, however, and in
2006, the newly formed US Airways Group proposed to purchase Delta Air Lines. The proposed
deal was rejected by Delta’s board of directors (US Airways Group, 2013).
Any merger is not without challenges, however, and the issue of seniority and job security in the
employee ranks are a cause for concern. The integration of employee groups was one of the most
challenging tasks for America West and USAir (Ferrick-Roman, 2005; Fitzpatrick, 2005)
because younger employees at America West were worried that without seniority, the older
workers from USAir would get the top jobs, while less-experienced workers would lose their
positions or would have to accept lower pay (Fitzpatrick, 2005). Moreover, mechanics and
customer service agents were not represented by the same national union, and despite the
seniority of USAir pilots, America West pilots were given priority since America West was
acquiring USAir, not the other way around, and given that USAir was in Chapter 11 bankruptcy
protection and its fleet was contracting at the time of the merger, USAir’s management was not
in the best position to negotiate for a better deal for its pilots (Airline Business Report, 2005).

22
5 Results and Analysis: The US Airways Group
The US Airways Group seems to have benefited from the merger. Figure 17 shows the airline’s
financial performance from Q4 2005 to Q4 2013, indicating that operating revenues have been
higher than operating expenses since Q2 2010, resulting in net income since Q2 2011. Overall
the financial performance of the US Airways Group improved since Q1 2006, except from Q4
2007 to Q1 2009 when the US economy faltered.
Figure 17 US Airways Group (LCC) Operating Revenues and Net Income, Q4 2005–Q4 2013
Data source: masFlight and Diio Mi
5.1 US Airways Group’s Operating Performance
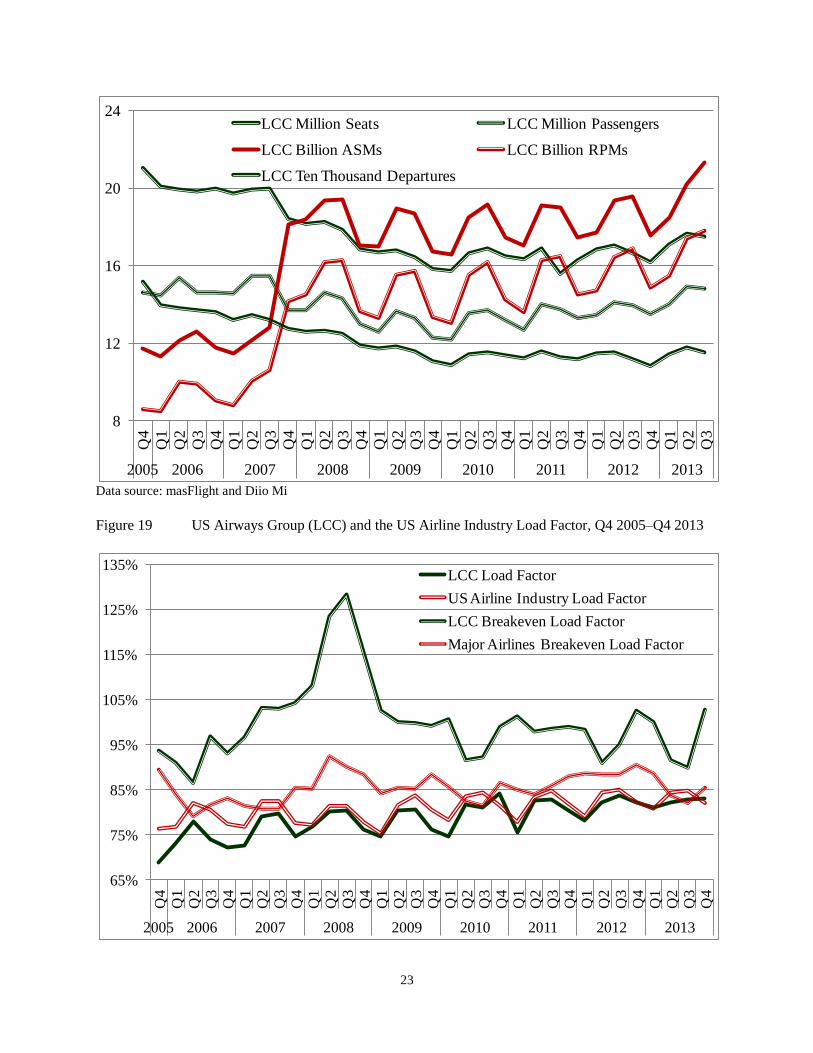
While the US Airways Group’s number of passengers decreased between Q4 2007 and Q1 2010
because of the US recession, passenger demand has increased since Q2 2010 (see Figure 18).
The airline’s departure frequency declined between Q4 2005 and Q4 2009 but has been stable
since Q1 2010 while RPMs and ASMs have increased, indicating the US Airways Group’s shift
to relatively larger aircraft or relatively longer-haul destinations. Moreover, attempts to reduce
the number of seats since Q4 2007 have resulted in increasing load factors that are not much
different from those of the US airline industry (see Figure 19). The US Airways Group’s
breakeven load factors, however, are much higher than those of the major airlines, indicating that
the US Airways Group still lags behind its major competitors on operational efficiency and cost
management. The spike in the breakeven load factor of the US Airways Group in 2008 is due to
the US recession.
Figure 18 US Airways Group (LCC) USAir Seats, Passengers, ASM, RPM, and
Departure Frequency, Q1 2000–Q3 2007, Q4 2005–Q3 2013
-1
0
1
2
3
4
5
Q4Q1Q2Q3Q4Q1Q2Q3Q4Q1Q2Q3Q4Q1Q2Q3Q4Q1Q2Q3Q4Q1Q2Q3Q4Q1Q2Q3Q4Q1Q2Q3Q4
2005 2006 2007 2008 2009 2010 2011 2012 2013
LCC Operating Revenues (USD Billion) LCC Operating Expenses (USD Billion)
LCC Operating Profit (USD Billion) LCC Net Income (USD Billion)
23
Data source: masFlight and Diio Mi
Figure 19 US Airways Group (LCC) and the US Airline Industry Load Factor, Q4 2005–Q4 2013
8
12
16
20
24
Q4
Q1
Q2
Q3
Q4
Q1
Q2
Q3
Q4
Q1
Q2
Q3
Q4
Q1
Q2
Q3
Q4
Q1
Q2
Q3
Q4
Q1
Q2
Q3
Q4
Q1
Q2
Q3
Q4
Q1
Q2
Q3
2005 2006 2007 2008 2009 2010 2011 2012 2013
LCC Million Seats LCC Million Passengers
LCC Billion ASMs LCC Billion RPMs
LCC Ten Thousand Departures
65%
75%
85%
95%
105%
115%
125%
135%
Q4
Q1
Q2
Q3
Q4
Q1
Q2
Q3
Q4
Q1
Q2
Q3
Q4
Q1
Q2
Q3
Q4
Q1
Q2
Q3
Q4
Q1
Q2
Q3
Q4
Q1
Q2
Q3
Q4
Q1
Q2
Q3
Q4
2005 2006 2007 2008 2009 2010 2011 2012 2013
LCC Load Factor
US Airline Industry Load Factor
LCC Breakeven Load Factor
Major Airlines Breakeven Load Factor
24
Data source: masFlight, Diio Mi, and the US Bureau of Transportation Statistics. The breakeven load factors of
AAL, DAL, and UAL were used in the calculation of the “major airlines breakeven load factor.”
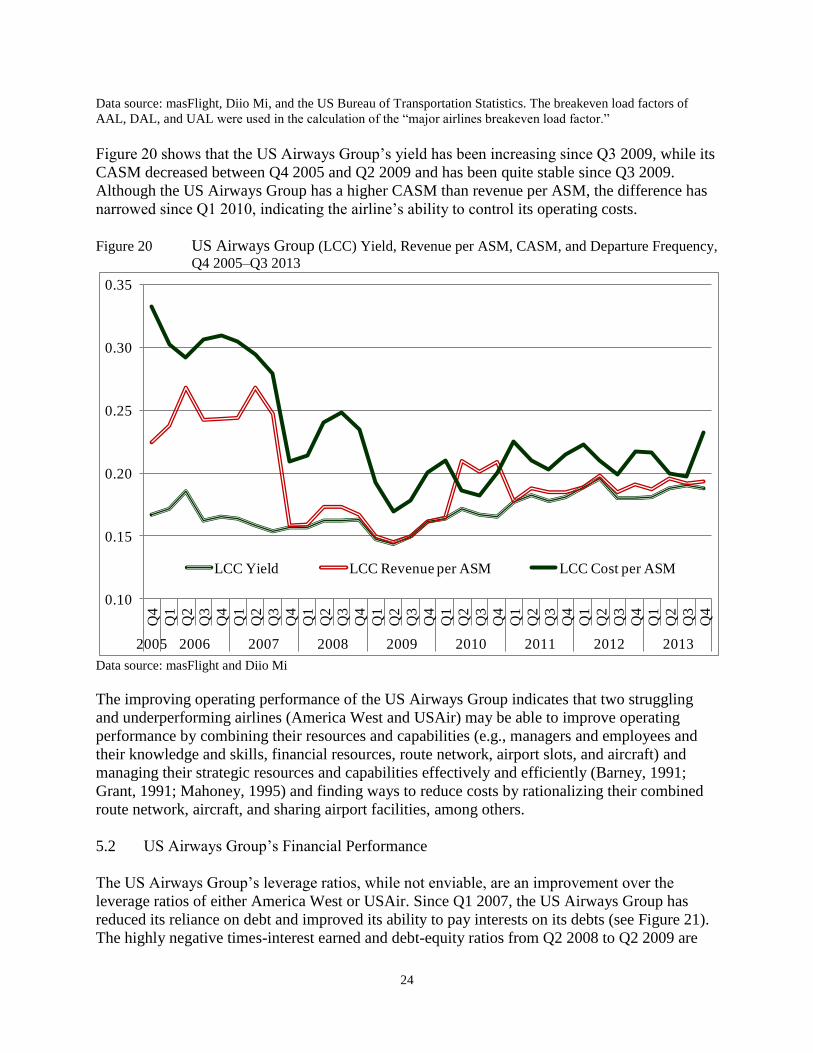
Figure 20 shows that the US Airways Group’s yield has been increasing since Q3 2009, while its
CASM decreased between Q4 2005 and Q2 2009 and has been quite stable since Q3 2009.
Although the US Airways Group has a higher CASM than revenue per ASM, the difference has
narrowed since Q1 2010, indicating the airline’s ability to control its operating costs.
Figure 20 US Airways Group (LCC) Yield, Revenue per ASM, CASM, and Departure Frequency,
Q4 2005–Q3 2013
Data source: masFlight and Diio Mi
The improving operating performance of the US Airways Group indicates that two struggling
and underperforming airlines (America West and USAir) may be able to improve operating
performance by combining their resources and capabilities (e.g., managers and employees and
their knowledge and skills, financial resources, route network, airport slots, and aircraft) and
managing their strategic resources and capabilities effectively and efficiently (Barney, 1991;
Grant, 1991; Mahoney, 1995) and finding ways to reduce costs by rationalizing their combined
route network, aircraft, and sharing airport facilities, among others.
5.2 US Airways Group’s Financial Performance
The US Airways Group’s leverage ratios, while not enviable, are an improvement over the
leverage ratios of either America West or USAir. Since Q1 2007, the US Airways Group has
reduced its reliance on debt and improved its ability to pay interests on its debts (see Figure 21).
The highly negative times-interest earned and debt-equity ratios from Q2 2008 to Q2 2009 are
0.10
0.15
0.20
0.25
0.30
0.35
Q4
Q1
Q2
Q3
Q4
Q1
Q2
Q3
Q4
Q1
Q2
Q3
Q4
Q1
Q2
Q3
Q4
Q1
Q2
Q3
Q4
Q1
Q2
Q3
Q4
Q1
Q2
Q3
Q4
Q1
Q2
Q3
Q4
2005 2006 2007 2008 2009 2010 2011 2012 2013
LCC Yield LCC Revenue per ASM LCC Cost per ASM

25
due to its negative net shareholders’ equity, exacerbated by the US recession in the same period.
The airline’s debt ratio since Q3 2009, even when short-term debt is included, is below 1.0,
indicating that the US Airways Group has been reducing its reliance on debt, resulting in lower
financial risk. This is a positive development for the airline since lower financial risk may
translate into lower cost of capital. Overall the US Airways Group has achieved better leverage
ratios than its component airlines and appears to be heading in the right direction.
5.2 US Airways Group’s Financial Performance
Figure 21 US Airways Group (LCC) Leverage Ratios, Q4 2005–Q4 2013
Data source: masFlight and Diio Mi
The US Airways Group’s liquidity ratios appear to be improving (see Figure 22), although the
weakening US gross domestic product (GDP) from 2008–2009 (see Figure 23) seems to
complicate the airline’s financial performance in the same period. All four measures of liquidity
have improved since 2009 and while the airline has not achieved enviable liquidity ratios by Q4
2013, the increasing trend indicates an improving ability to meet short-term financial obligations.
-20
-10
0
10
20
30
40
-20
-15
-10
-5
0
5
10
15
20
Q4Q1Q2Q3Q4Q1Q2Q3Q4Q1Q2Q3Q4Q1Q2Q3Q4Q1Q2Q3Q4Q1Q2Q3Q4Q1Q2Q3Q4Q1Q2Q3Q4
2005 2006 2007 2008 2009 2010 2011 2012 2013
LCC Debt Ratio
LCC Debt Ratio with Short-Term Debt
LCC Times-Interest Earned
LCC Debt-Equity Ratio

26
Figure 22 US Airways Group (LCC) Liquidity Ratios, Q4 2005–Q4 2013
Data source: masFlight and Diio Mi
Figure 23 US GDP and PCE Growth Rates, Q1 2005–Q4 2013
Data source: OECD.StatExtracts and the US Bureau of Economic Analysis
The US Airways Group generates revenues an average of USD 0.39 for every dollar of assets
(refer to total asset turnover in Figure 24), higher than America West’s USD 0.35 or USAir’s
USD 0.20. Moreover, the airline’s receivables turnover has been increasing from Q3 2008 to Q4
2012. While the US Airways Group is still relatively inefficient in using its assets, the airline is
performing better than either America West or USAir before the merger. Overall the US Airways
-0.4
0.0
0.4
0.8
1.2
1.6
Q4Q1Q2Q3Q4Q1Q2Q3Q4Q1Q2Q3Q4Q1Q2Q3Q4Q1Q2Q3Q4Q1Q2Q3Q4Q1Q2Q3Q4Q1Q2Q3Q4
2005 2006 2007 2008 2009 2010 2011 2012 2013
LCC Net-Working-Capital to Total-Assets Ratio
LCC Current Ratio
LCC Cash Ratio
LCC Interval Measure (Years)
-4%
-2%
0%
2%
4%
6%
8%
Q1
Q2
Q3
Q4
Q1
Q2
Q3
Q4
Q1
Q2
Q3
Q4
Q1
Q2
Q3
Q4
Q1
Q2
Q3
Q4
Q1
Q2
Q3
Q4
Q1
Q2
Q3
Q4
Q1
Q2
Q3
Q4
Q1
Q2
Q3
Q4
2005 2006 2007 2008 2009 2010 2011 2012 2013
US Gross Domestic Product
US Personal Consumption Expenditures: Transportation Services

27
Group’s efficiency ratios indicate that the airline is on its way to becoming a better managed
airline, which may result in higher net income (see Table 2) and better returns to its shareholders
(see Figure 25).
Figure 24 US Airways Group (LCC) Efficiency Ratios, Q4 2005–Q4 2013
Data source: masFligh and Diio Mi
The US Airways Group’s improving efficiency ratios resulted in higher returns to investors.
While the airline’s profitability ratios were highly negative or almost zero during the financial
crisis in the US, its net profit margin, ROA, and ROE have been positive since Q2 2011 (see
Figure 25). The highly negative profitability ratios in 2008 are due to the US recession. While
not necessarily a stellar performance, the airline’s 2013 gross margin is 21.0%, net profit margin
6.3%, ROA 2.1%, and ROE 8.1%.
The airline’s improving profitability ratios indicate that the merger appears to be a success and
that the US Airways Group’s improving operating and financial performance will benefit not
only its investors but also its customers, who should eventually experience an improved service
quality from a better managed airline, which is on its way to financial sustainability.
Figure 25 US Airways Group (LCC) Profitability Ratios, Q4 2005–Q4 2013
0.0
0.2
0.4
0.6
0.8
1.0
1.2
1.4
1.6
1.8
0
1
2
3
4
5
6
7
8
9
10
Q4Q1Q2Q3Q4Q1Q2Q3Q4Q1Q2Q3Q4Q1Q2Q3Q4Q1Q2Q3Q4Q1Q2Q3Q4Q1Q2Q3Q4Q1Q2Q3Q4
2005 2006 2007 2008 2009 2010 2011 2012 2013
LCC Total Asset Turnover LCC Receivables Turnover
LCC Average Collection Period (Years) LCC Fixed Asset Turnover

28
Data source: masFlight and Diio Mi
Figure 26 AWA/US Airways Group (LCC) End-of-Month Abnormal Returns
March 2005–December 2007
Data source: Yahoo Finance Charts
-30
-25
-20
-15
-10
-5
0
5
-0.30
-0.20
-0.10
0.00
0.10
0.20
0.30
Q4Q1Q2Q3Q4Q1Q2Q3Q4Q1Q2Q3Q4Q1Q2Q3Q4Q1Q2Q3Q4Q1Q2Q3Q4Q1Q2Q3Q4Q1Q2Q3Q4
2005 2006 2007 2008 2009 2010 2011 2012 2013
LCC Gross Margin
LCC Net Profit Margin
LCC Return on Assets
LCC Return on Equity
-100%
-50%
0%
50%
100%
150%
200%
250%
300%
350%
Mar
ch
Ap
ril
May
Jun
e
July
Au
gu
st
Sep
tem
ber
Oct
ober
Nov
ember
Dec
ember
Jan
uar
y
Feb
ruar
y
Mar
ch
Ap
ril
May
Jun
e
July
Aug
ust
Sep
tem
ber
Oct
ob
er
No
vem
ber
Dec
emb
er
Jan
uar
y
Feb
ruar
y
Mar
ch
Apri
l
May
Jun
e
July
Au
gu
st
Sep
tem
ber
Oct
ob
er
Nov
ember
Dec
ember
2005 2006 2007
AWA/LCC-S&P500 DARs
AWA/LCC-S&P500 CARs
AWA/LCC-XAL DARs
AWA/LCC-XAL CARs

29
With regard to the US Airways Group’s share price performance against the S&P 500 and its
industry, the airline has consistently outperformed the S&P 500 and XAL from the time of the
merger announcement up to the last trading day in 2007 (see Figure 26).
Figure 27 AWA/US Airways Group (LCC) End-of-Month Abnormal Returns
January 2008–December 2010
Data source: Yahoo Finance Charts
The weakening US economy from Q4 2007 to Q2 2009 (see Figure 23) has complicated the
impact of the merger on the US Airways Group’s stock price from 2008 to 2010, although its
stock returns still managed to outperform the S&P500 and XAL since early 2009 (see Figure 27),
indicating investor confidence on the merger five years later. This suggests that the airline’s
improving operating and financial performance in the same period has been well-received by
investors, resulting in positive end-of-the-month abnormal returns.
Although the US economy started to improve between 2011 and 2013, personal consumption
expenditures (PCE) on transportation services have been erratic and decreasing (see Figure 23),
driving the US Airways Group’s share price lower, underperforming the S&P500 and XAL in
the same period. The airline’s share price started to recover by mid-2012, however, and have
since outperformed the S&P500 and XAL. This indicates an unwavering investor confidence on
the airline’s ability to compete favorably against its rivals, perhaps due to its improving
operating and financial performance since 2010.
Figure 28 US Airways Group (LCC) End-of-Month Abnormal Returns
January 2011–December 2013
-150%
-100%
-50%
0%
50%
100%
150%
200%
Jan
uar
y
Feb
ruar
y
Mar
ch
Ap
ril
May
Jun
e
July
Au
gust
Sep
tem
ber
Oct
ob
er
No
vem
ber
Dec
emb
er
Jan
uar
y
Feb
ruar
y
Mar
ch
Ap
ril
May
Jun
e
July
Au
gust
Sep
tem
ber
Oct
ob
er
No
vem
ber
Dec
emb
er
Jan
uar
y
Feb
ruar
y
Mar
ch
Ap
ril
May
Jun
e
July
Au
gu
st
Sep
tem
ber
Oct
ob
er
No
vem
ber
Dec
emb
er
2008 2009 2010
LCC-S&P500 DARs LCC-S&P500 CARs
LCC-XAL DARs LCC-XAL CARs

30
Data source: Yahoo Finance Charts. The time series ends on December 9, 2013 when the US Airways Group
merged with American Airlines.
The US Airways Group completed the consolidation of its operations and financial systems in
Q3 2007, two years after America West and USAir officially merged as the US Airways Group.
Table 2 shows the airline’s operating revenues, operating expenses, and net income from 2008–
2013.
Table 2 Operating Revenues and Net Income of the US Airways Group, 2008–2013
Year
Operating Revenues Operating Expenses Net Income
USD ‘000 Annual
Change
USD ‘000 Annual
Change
USD ‘000 Annual
Change
2008 12,459,197 3.35% 14,232,649 -0.39% -2,148,445 -714.19%
2009 10,780,838 -13.47% 10,659,854 -25.10% -140,459 93.46%
2010 12,195,807 13.12% 11,415,098 7.08% 598,641 526.20%
2011 13,340,511 9.39% 12,906,813 13.07% 180,376 -69.87%
2012 14,121,027 5.85% 13,299,050 3.04% 702,493 289.46%
2013 14,935,551 5.77% 13,933,010 4.77% 654,168 -6.88% Data source: masFlight and Diio Mi. The annual change between 2007 and 2008 is based on the combined operating
revenues and net income of AWA and USAir in 2007 since the US Airways Group’s financial results for a full year
starts in 2008.
The US Airways Group returned to profitability in 2010, mostly due to its increasing operating
revenues (see Figure 17 and Table 2), posting a net income of USD 654.17 million in 2013, with
operating revenues of USD 14.94 billion, representing a decrease of 6.88% in net income and a
5.77% increase in operating revenues from 2012. The decrease in net income is due its USD
335.38 million income taxes in 2013 while the airline has a small tax credit in 2012. Operating
-80%
-60%
-40%
-20%
0%
20%
40%
60%
80%
100%
Januar
y
Feb
ruar
y
Mar
ch
Apri
l
May
Jun
e
July
Augu
st
Sep
tem
ber
Oct
ober
Novem
ber
Dec
emb
er
Januar
y
Feb
ruar
y
Mar
ch
Ap
ril
May
Jun
e
July
Augu
st
Sep
tem
ber
Oct
ob
er
Novem
ber
Dec
ember
Jan
uar
y
Feb
ruar
y
Mar
ch
Ap
ril
May
June
July
Augu
st
Sep
tem
ber
Oct
ob
er
Novem
ber
Dec
ember
2011 2012 2013
LCC-S&P500 DARs
LCC-S&P500 CARs
LCC-XAL DARs
LCC-XAL CARs

31
expenses have increased less than operating revenues since 2012 and in five of the last six years,
indicating that the US Airways Group’s ability to control costs has improved.
The US Airways Group’s CARs have substantially outperformed the CARs of Delta Air Lines
and Southwest Airlines from 2010 to 2013 and United Airlines’ from 2012 to 2013 using the
S&P 500 as benchmark (see Figure 29). American Airlines was delisted from the New York
Stock Exchange on December 29, 2011, a month after filing for Chapter 11 (Mehta, 2011), so its
share price performance is not included in Figures 29 and 30. The stock performance of the US
Airways Group against the three major airlines using the XAL as index is similar—
outperforming the CARs of Delta and Southwest from 2010 to 2013 as well as United’s from
2012 to 2013. The share price performance of the US Airways Group from 2012 to 2013 is
largely due to its announcement to acquire the bankrupt American Airlines in January 2012
(Joyce, 2012) while the stock performance of United is attributed to its return to profitability in
2013, its first annual net income since its merger with Continental Airlines in October 2010.
Figure 29 Stock Performance of the US Airways Group (LCC), DAL, UAL, and LUV
Using the S&P 500 as Benchmark, September 2007–December 2013
Data source: Yahoo Finance Charts. The time series ends on December 9, 2013 when the US Airways Group
merged with American Airlines.
Figure 30 Stock Performance of US Airways Group (LCC), DAL, UAL, and LUV Using
the XAL as Benchmark, September 2007–December 2013
-200%
-150%
-100%
-50%
0%
50%
100%
150%
200%
250%
Sep
tem
ber
Nov
ember
Januar
y
Mar
ch
May
July
Sep
tem
ber
Novem
ber
Januar
yM
arch
May
July
Sep
tem
ber
Novem
ber
Januar
y
Mar
ch
May
July
Sep
tem
ber
Novem
ber
Januar
yM
arch
May
July
Sep
tem
ber
Novem
ber
Januar
yM
arch
May
July
Sep
tem
ber
Nov
ember
Januar
y
Mar
ch
May
July
Sep
tem
ber
Novem
ber
2007 2008 2009 2010 2011 2012 2013
LCC-S&P500 CARs
DAL-S&P500 CARs
UAL-S&P500 CARs
LUV-S&P500 CARs

32
Data source: Yahoo Finance Charts. The time series ends on December 9, 2013 when the US Airways Group
merged with American Airlines.
Overall the acquisition of USAir by America West, which formed the US Airways Group,
appears to have benefited the shareholders of both airlines since the US Airways Group’s
operating and financial performance has improved since Q4 2005. The US Airways Group’s
improving operating and financial performance may have emboldened its board, management,
and various employee groups to approve its merger with American Airlines on December 9,
2013 (American Airlines, 2013).
6. Conclusion
This article has analyzed the post-merger performance, using airline operations metrics and
financial ratios from Q1 2000–Q4 2013, of US Airways, America West Airlines, and the US
Airways Group. While the weakening US economy from Q4 2007 to Q2 2009 has complicated
the impact of the merger on the US Airways Group’s operating and financial performance,
overall the airline has managed to turnaround the faltering performance of its predecessors.
In view of the improving operating and financial performance of the US Airways Group since
America West acquired the bankrupt USAir in September 2005, the merger is largely considered
a success, even if the airline still needs to reduce its reliance on debt and utilize its assets more
efficiently to improve its profitability and financial sustainability. Even investors agree that the
merger is a success, rewarding the US Airways Group with share prices that have outperformed
the S&P 500 and XAL since the merger, except when the US economy faltered. Moreover, the
-150%
-100%
-50%
0%
50%
100%
150%
200%
Sep
tem
ber
No
vem
ber
Januar
yM
arch
May
July
Sep
tem
ber
Novem
ber
Januar
yM
arch
May
July
Sep
tem
ber
Novem
ber
Jan
uar
yM
arch
May
July
Sep
tem
ber
No
vem
ber
Jan
uar
y
Mar
chM
ayJu
lyS
epte
mb
erN
ov
emb
er
Januar
yM
arch
May
July
Sep
tem
ber
Novem
ber
Januar
yM
arch
May
July
Sep
tem
ber
Novem
ber
2007 2008 2009 2010 2011 2012 2013
LCC-XAL CARs DAL-XAL CARs
UAL-XAL CARs LUV-XAL CARs
33
US Airways Group’s share prices have outperformed its major competitors for at least two years
between 2010 and 2013.
Perhaps the improving operating and financial performance of the US Airways Group
emboldened its management and board of directors to merge with American Airlines, which has
just emerged from Chapter 11 bankruptcy protection and reorganization. On December 9, 2013,
the US Airways Group, some eight years following the merger of America West and USAir,
merged with AMR Corporation and started operations under the American Airlines Group,
forming the largest airline in the world with its base in Fort Worth, Texas (American Airlines,
2013).
References
Agrawal, A., Jaffe, J.F., Mandelker, G.N., 1992. The post-merger performance of acquiring
firms: A reexamination of an anomaly. Journal of Finance 48, 1605–1621.
Airline Business Report, 2005. US Airways-America West merger could help or hurt other
carriers, Airline Business Report 23(12). Retrieved from
http://search.proquest.com.ezproxy.libproxy.db.erau.edu/docview/231447961?accountid=
27203, June 2, 2014.
American Airlines, 2013. AMR Corporation emergence from Chapter 11 and merger close
expected on Dec. 9, November 27, 2013. Retrieved from
http://hub.aa.com/en/nr/pressrelease/amr-corporation-emergence-from-chapter-11-and-
merger-close-expected-on-dec-9, February 26, 2016.
Barney, J.B., 1991. Firm resources and sustained competitive advantage. Journal of Management
17(1), 99–120.
Brealey, R.A., Myers, S.C., Allen, F., 2011. Principles of Corporate Finance. McGraw-Hill, New
York.
Clougherty, J.A., 2002. US domestic airline mergers: The neglected international determinants.
International Journal of Industrial Organization 20(4), 557-576. Retrieved from
http://search.proquest.com.ezproxy.libproxy.db.erau.edu/docview/197342305?accountid=
27203, June 2, 2014.
De Lollis, B., 2004. Second bankruptcy tough to overcome, USA Today, September 13.
Retrieved from http://usatoday30.usatoday.com/money/biztravel/2004-09-13-usairways-
cover_x.htm, September 28, 2015.
Delfmann, W., Baum, H., Auebach, S., and Albers, S., 2005. Strategic Management in the
Aviation Industry. Ashgate Publishing Ltd., USA.
Ferrick-Roman, K., 2005. America west employees worry about job security if US airways
merger happens. Knight Ridder Tribune Business News, May 18. Retrieved from
http://search.proquest.com.ezproxy.libproxy.db.erau.edu/docview/463589013?accountid=
27203, June 2, 2014.
Fitzpatrick, D., 2005. Biggest task for America West-US Airways merger may be melding the
people. Knight Ridder Tribune Business News, May 20. Retrieved from
http://search.proquest.com.ezproxy.libproxy.db.erau.edu/docview/460311091?accountid=
27203, June 2, 2014.
34
Fleming, S., 2011. Airline Mergers: Issues raised by the proposed merger of United and
Continental, in Mercado, F.J. (Ed.), Airline Industry Mergers, Background and Issues.
Nova Science Publishers, Inc., New York.
Franks, J.R., Harris, R.S., 1989. Shareholder wealth effects of corporate takeovers: The UK
experience 1955–1985. Journal of Financial Economics 23 (2): 225–49.
Goetz, A.R., Vowles, T.M., 2009. The good, the bad, and the ugly: 30 years of US airline
deregulation. Journal of Transport Geography 17(4), 251–263.
Graham, D.R., Kaplan, D.P., Sibley D.S., 1983. Efficiency and competition in the airline
industry. Bell Journal of Economics and Management Science 14 (Spring), 118–138.
Grant, R.M., 1991. The resource-based theory of competitive advantage: Implications for
strategy formulation. California Management Review 13(8), 585–608.
Houston, J. F., Ryngaert, M.D., 1994. The overall gains from large bank mergers. Journal of
Banking and Finance 18 (6): 1155–76.
Jones, G., Jones, G.P., 1999. US Airways. Ian Allan, Shepperton, England.
Joyce, M. 2012. US Airways CEO confirms interest in American Airlines, January 26, 2012.
Retrieved from http://www.bizjournals.com/charlotte/news/2012/01/26/us-airways-ceo-
confirms-interest-in.html, February 26, 2016.
Langetieg, T. C., 1978. An application of a three-factor performance index to measure
stockholder gains from merger. Journal of Financial Economics 6(4), 365–383.
Liang, J., 2013. What are the effects of mergers in the US airline industry? An econometric
analysis on Delta-Northwest merger. The Macalester Review 3(1), Article 2, 1–21.
Retrieved from http://digitalcommons.macalester.edu/macreview/vol3/iss1/2, June 2,
2014.
Lipton, M., 2006. Merger waves in the 19th, 20th and 21st centuries. The Davis Lecture, York
University, September 14.
King, D. R., Dalton, D. R., Daily, C. M., Covin, J. G., 2004. Meta‐analyses of post‐acquisition
performance: Indications of unidentified moderators. Strategic Management Journal
25(2), 187–200.
Mahoney, J.T., 1995. The management of resources and the resource of management. Journal of
Business Research 33(2), 91–101.
Malatesta, P.H., 1983. The wealth effect of merger activity and the objective function of merging
firms. Journal of Financial Economics 11 (1–4): 155–81.
Manuela Jr., W.S., Rhoades, D.L., 2013. Southwest’s acquisition of AirTran: An analysis of
short-term stock performance. World Review of Intermodal Transportation Research
4(4): 227–246.
Manuela Jr., W.S., Rhoades, D.L., 2014. Merger activity and short-run financial performance in
the US Airline Industry. Transportation Journal 53(3), 345–375.
Martin, S.L., 2011. Analysis of prospective airline mergers using a simulated annealing model.
Journal of Air Transport Management 17(2), 80–87.
Maruna, M., Morrell, P. 2010. After the honeymoon. Airline Business 26(8), 74–76. Retrieved
from
http://search.proquest.com.ezproxy.libproxy.db.erau.edu/docview/744051417?accountid=
27203, June 2, 2014.
Mehta, N. 2011. AMR delisted from NYSE a month after bankruptcy filing, December 30, 2011.
Retrieved from http://www.bloomberg.com/news/articles/2011-12-29/amr-delisted-from-
nyse-a-month-after-bankruptcy-filing-1-, February 26, 2016.

35
Mercado, F.J., 2011. Airline Industry Mergers, Background and Issues. Nova Science Publishers,
Inc., New York.
Milford, P., Schlangenstein, M., and McLaughlin, D., 2011. American Airlines parent AMR files
bankruptcy; Horton is CEO, November 30, 201. Retrieved from
http://www.bloomberg.com/news/articles/2011-11-29/amr-files-for-bankruptcy-
protection-in-new-york-as-talks-with-pilots-end, February 26, 2016.
Ovtchinnikov, A.V., 2013. Merger waves following industry deregulation. Journal of Corporate
Finance 21, 51–76.
Packalen, M., Sen, A., 2013. Static and dynamic merger effects: A market share based empirical
analysis. International Review of Law and Economics 36, 12–24.
Park, S., 2014. A merger effect on different airline groups: empirical study on the Delta-
Northwest merger in 2008. Journal of Transport Literature 8(2), 73–99. Retrieved from
http://www.transport-literature.org/editions/jtl-v8n2p03.pdf, June 2, 2014.
PR Newswire, 2005. Reorganized US Airways Group Inc. completes merger with America West
Airlines, September 27. Retrieved from
http://search.proquest.com.ezproxy.libproxy.db.erau.edu/docview/451360327?accountid=
27203, June 2, 2014.
Ryerson, M.S., Kim, H., 2013. The impact of airline mergers and hub reorganization on aviation
fuel consumption. Journal of Cleaner Production,
http://dx.doi.org/10.1016/j.jclepro.2013.12.032.
Steffy, L., 2007. Airline mergers usually don’t fly. Houston Chronicle online edition. Retrieved
from http://chron.com/disp/story.mpl/business/steffy/5309876.html, September 28, 2015.
Tarry, C., 2007. Airline merger and acquisition (M&A) activity: A new “super-cycle” or “over-
exuberance”? IATA Analyst Viewpoint, April 2007. Retrieved from
https://www.iata.org/whatwedo/Documents/economics/Tarry_MandA.pdf, June 2, 2014.
United States District Court for the District of Columbia, 2013. Case 1:13-cv-01236: The US
Attorney General, and the States of Arizona, Florida, Tennessee, Texas, the
Commonwealths of Pennsylvania and Virginia, and the District of Columbia versus the
US Airways Group, Inc. and AMR Corporation. Retrieved from
http://online.wsj.com/public/resources/documents/airlinescomplaint0813.pdf, June 2,
2014, June 2, 2014.
United States Government Accountability Office, 2010. Airline Mergers. Issues Raised by the
Proposed Merger of United and Continental Airline. GAO-10-778T. Testimony before
the Committee on Commerce, Science, and Transportation, U.S. Senate, Statement for
the Record by Susan Fleming, Director, Physical Infrastructure Issues, May 27, 2010.
Retrieved from http://www.gao.gov/new.items/d10778t.pdf, June 2, 2014.
United States Government Accountability Office, 2013. Airline Mergers. Issues Raised by the
Proposed Merger of American Airlines and US Airways. GAO-13-403T. Testimony
before the Subcommittee on Aviation Operations, Safety, and Security, Committee on
Commerce, Science and Transportation, U.S. Senate, Statement of Gerald L. Dillingham,
Ph.D., June 19, 2013. Retrieved from http://www.gao.gov/assets/660/655314.pdf, June 2,
2014.
US Airways Group, 2005. Annual Report 2005, US Airways Group, Inc. Retrieved from
http://library.corporateir.net/library/19/196/196799/items/192379/Annual%20Report%20
2005.pdf, April 20, 2014.

36
US Airways Group, 2013. Chronology. Retrieved from https://www.usairways.com/en-
US/aboutus/pressroom/history/chronology.html, April 13, 2014.
Acknowledgments
We would like to thank the anonymous reviewers and guest editors for helping us improve our
paper. We would also like to thank our research assistants, Brian Sherman, Siddhartha Bharani,
Robert F. Moss Jr., and Anastassia Vilderson for helping us with the data collection and other
information related to our research.
Appendix
Source: Brealey, R.A., Myers, S.C., and Allen, F. (2011). Principles of Corporate Finance. New
York: McGraw-Hill, pp. 789–797.
Leverage ratios measure the airlines’ reliance on debt to finance their operations (Brealey et al.,
2011). We used the following leverage ratios.
Eq. 1 Debt ratio = (Long-term debt + Leases) ÷ (Long-term debt + Leases + Equity)
Eq. 2 Debt ratio with short-term debt = (Long-term debt + Short-term debt + Leases) ÷
(Long-term debt + Short-term debt + Leases + Equity)
Eq. 3 Debt-equity ratio = (Long-term debt + Leases) ÷ (Equity)
Eq. 4 Times-interest earned = (Earnings before interests and taxes or EBIT + Depreciation) ÷
(Interest)
Liquidity ratios measure the airlines’ ability to meet their financial obligations in the short term
or within one year (Brealey et al., 2011). We used the following liquidity ratios.
Eq. 5 Net working capital to Total assets ratio = (Current assets – Current liabilities) ÷ (Total
assets)
Eq. 6 Current ratio = (Current assets) ÷ (Current liabilities)
Eq. 7 Cash ratio = (Cash + Short-term securities) ÷ (Current liabilities)
Eq. 8 Interval measure (years) = (Cash + Short-term securities + Receivables) ÷
(Costs from operations)
Efficiency ratios measure the airlines’ ability to use their assets (e.g., current assets, fixed assets,
or total assets) and liabilities (e.g., current liabilities, long-term debt, or equity) to generate sales
(Brealey et al., 2011). We used the following efficiency ratios.
Eq. 9 Total asset turnover = (Net sales) ÷ (Average total assets)
Eq. 10 Fixed asset turnover = (Net sales) ÷ (Average fixed assets)

37
Eq. 11 Accounts receivable turnover = (Net sales) ÷ (Average accounts receivables)
Eq. 12 Average collection period (years) = ((Average receivables) ÷ (Sales ÷ 365)) ÷ 365
Profitability ratios measure the airlines’ ability to generate profits (Brealey et al., 2011). We
used the following profitability ratios.
Eq. 13 Gross margin = (Revenues – Cost of goods sold) ÷ (Revenues)
Eq. 14 Net profit margin = (EBIT – tax) ÷ (Sales)
Eq. 15 Return on assets (ROA) = (EBIT – tax) ÷ (Average total assets)
Eq. 16 Return on equity (ROE) = (Earnings available for common shareholders) ÷ (Average
equity)
i http://www.encyclopedia.com/topic/US_Airways_Group_Inc.aspx, accessed October 17, 2015.


![[Transformation des organisations] post merger integration](https://static.fdocuments.net/doc/165x107/54878d87b4af9faf0d8b5489/transformation-des-organisations-post-merger-integration.jpg)


