The Urbanization of Global Poverty Martin Ravallion, Shaohua Chen and Prem Sangraula Development...
43
The Urbanization of Global Poverty Martin Ravallion, Shaohua Chen and Prem Sangraula Development Research Group, World Bank Slow ^
-
Upload
cameron-chambliss -
Category
Documents
-
view
225 -
download
2
Transcript of The Urbanization of Global Poverty Martin Ravallion, Shaohua Chen and Prem Sangraula Development...

The Urbanization of Global Poverty
Martin Ravallion, Shaohua Chen
and Prem Sangraula Development Research Group, World Bank
Slow
^

Differing views on the urbanization of poverty + contentious data
“The world’s poor once huddled largely in rural areas. In the modern world they have gravitated to the cities.” (Gerard Piel, 1997)
• Is that right?• Is it good or bad news for poverty reduction?
– A positive force in poverty reduction as rural workers take up more remunerative urban jobs?
– Or the unwelcome forbearer of new poverty problems as economic disadvantages become more dense?
=> Five claims, four of which we test

Claim1: Most people live in rural areas, but this will soon change with urbanization
• Data from the UN’s World Urbanization Prospects• Differences in how “urban” is defined; technical
differences + administrative/political influences• “Urban-rural” distinction is becoming blurred.
• However, for this study we have little choice but to take the demographic data underlying Claim 1 as given.

Claim 2: The incidence of absolute poverty is lower in urban areas
• Based on country-specific studies; esp., WB Poverty Assessments
• However, numerous data problems:– Different countries naturally have different definitions of what
“poverty” means.– For example, higher real poverty lines tend to prevail in richer
countries, which tend also to be more urbanized. – And the urban composition of the poor probably varies with the
level of economic development and urbanization.

What does Claim 1 imply for the future validity of Claim 2?
• Does urbanization of the population as a whole come with lower overall poverty?
• What about within sectors? • Does population urbanization mean that the urban
poverty problem has overtaken the rural problem in scale? Or will it overtake some time soon?

Claim 3: The urban share of the poor is rising over time
Claim 4: The poor are urbanizing faster than the population as a whole
• Urban share of the poor: Pu=SuHu/H• Claim 3: Pu rises over time• Claim 4: Hu/H rises over time • => growth rate of Pu > growth rate of Su
• Support from Ravallion (2002), based on x-country comparisons
• Comparability problems need not be time invariant• Claims about dynamics based on x-sectional
comparisons (“ecological fallacy”)
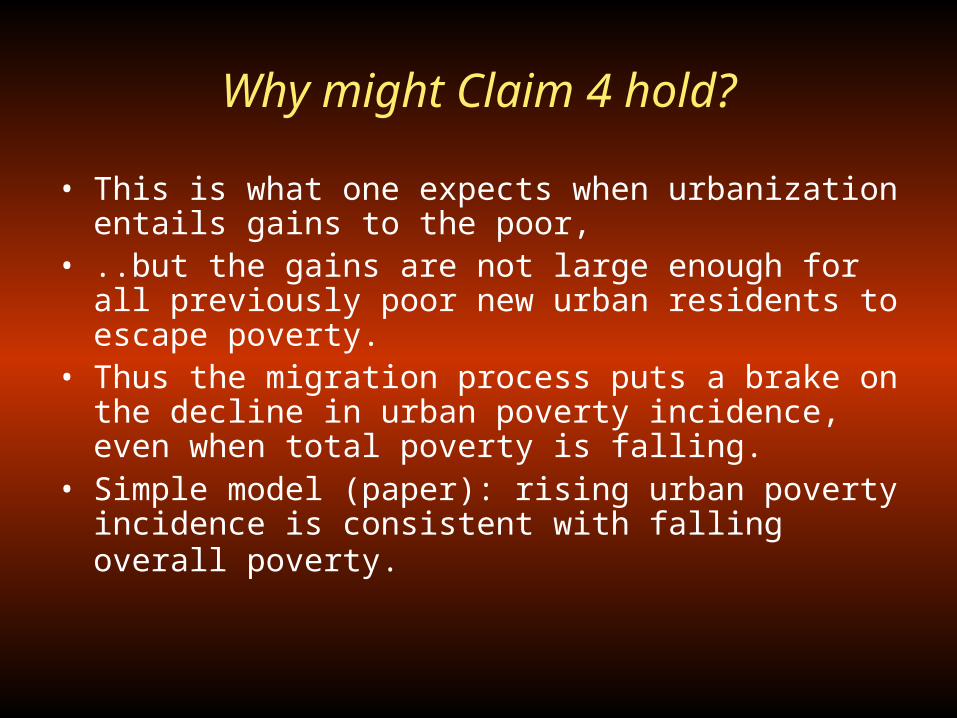
Why might Claim 4 hold?
• This is what one expects when urbanization entails gains to the poor,
• ..but the gains are not large enough for all previously poor new urban residents to escape poverty.
• Thus the migration process puts a brake on the decline in urban poverty incidence, even when total poverty is falling.
• Simple model (paper): rising urban poverty incidence is consistent with falling overall poverty.

Claim 5: Urbanization is a positive force in overall poverty reduction
• Direct gains to migrants• Indirect gains to rural poor
– Remittances– Tighter rural labor markets
• And Claim 5 can be valid even when urban poverty is rising.

Data and methods

Key assumptions
• Poverty is defined in terms of household consumption per capita.
• Additively separable poverty measures – for which the aggregate measure is the (population-weighted)
sum of individual measures. • Relocation test: Simply moving individuals between
urban and rural areas (or countries), with no absolute loss in their real consumption, cannot increase the aggregate measure of poverty.
=> Absolute poverty measures Poverty lines aim to have constant real value both between urban and rural areas and across countries

Cost-of-living (COL) differences
• Relatively weak internal market integration and the existence of geographically non-traded goods
=>substantial cost-of-living differences between urban and rural areas in developing countries.
• Any assessment of the urbanization of poverty that ignored these COL differences would not be credible.
• Yet existing Purchasing Power Parity (PPP) exchange rates used to convert the international line into local currencies do not distinguish rural from urban areas.
How can we construct an international urban-rural poverty profile?

The idea of this paper
• We use country-specific urban and rural poverty lines from the Bank’s Poverty Assessments in setting the urban-rural differential in the international poverty lines. – The fact that PA’s have now been completed for most
developing countries makes this feasible.
• Otherwise, our methods closely follow Chen and Ravallion (2004), which provides the latest available update of the World Bank’s global poverty measures for
$1 and $2 a day.

(Background)
Setting an international poverty line
• No single bundle of goods would be acceptable internationally (hard enough within countries).
• Expenditure in each country that achieves nutritional requirements at prevailing tastes?– Is this an absolute poverty line or relative poverty line?– Example for Indonesia: This method gives poverty lines that
have an elasticity of about unity to the mean i.e., they do not reflect absolute levels.

(Background) National poverty lines are the data for setting
an international line
• International line should not fall outside the range of national lines.
• Richer people – and richer countries – tend to have higher poverty lines. – Amongst poor countries, there is very little income gradient
across countries in their poverty lines — absolute consumption needs dominate.
– But the gradient rises as incomes rise. • But there are also idiosyncratic effects, so we take
averages =>
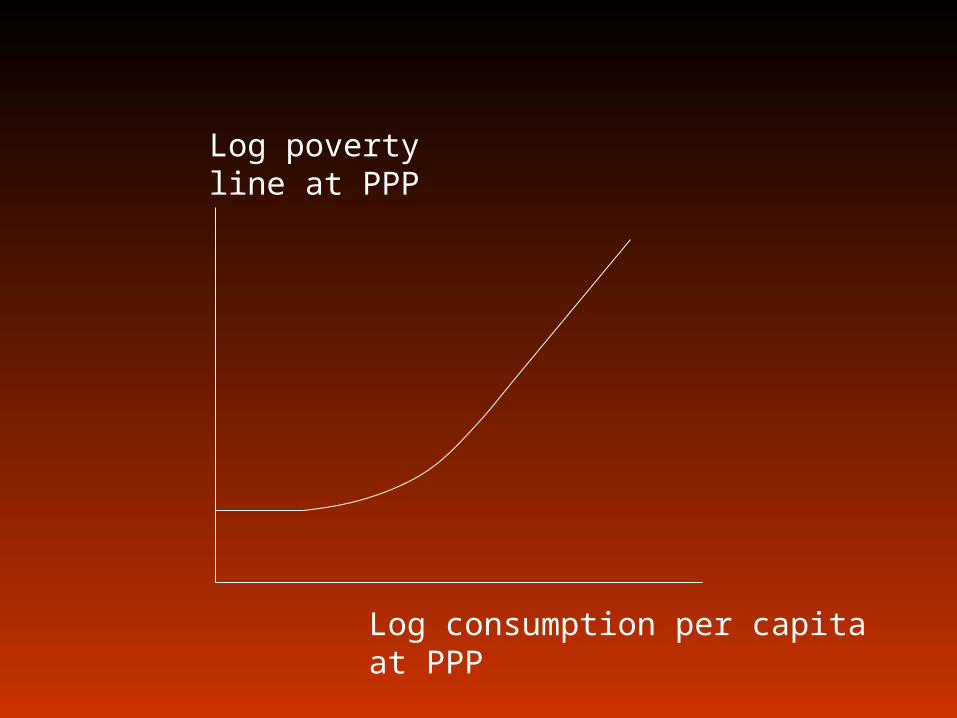
Log poverty line at PPP
Log consumption per capita at PPP

(Background) “$1 a day”
• For global poverty monitoring, the Bank has taken the position that to measure absolute consumption poverty on a consistent basis across countries one must use a common poverty line.
• But whose poverty line should it be? • In the 1990 WDR, the Bank chose to measure global
poverty by the standards of what poverty means in the poorest countries.
• Using rural lines when available• => the “$1/day” line.

Log poverty line at PPP
Log consumption per capita at PPP
$1 a day

(Background) Purchasing Power Parities
• International poverty line is converted back to local currency at the base date (1985 originally; 1993 now) using PPP rates for consumption.
• Penn World Tables have been the main source of the PPP rates, though the latest estimates used the 1993 PPPs estimated by the Bank.
• One revision so far, in 2000 (1985 =>1993)• Continuing concerns about quality of PPP’s
– Incomplete ICP participation– Differences in quality of goods – Relevance to poverty
• Major new PPP efforts underway in DECDG

(Background) Latest “$1 a day” poverty lines
• Impossible to compare different sets of PPPs. – For example, adjusting “$1” at 1985 PPP only for inflation in
the US yields a poverty line in 1993 that is well above that found in low-income countries
• We chose the median poverty line of the lowest 10 lines from original WDR 1990.
• This gives $1.08 at 1993 PPP for consumption.– Regression based method gives $1.05 (95% CI:
$0.88,$1.24) for poorest country.
• All numbers revised back in time to assure consistency.

Taking “$1 a day” to the surveys
• Poverty line in 1993 local currency is updated using local CPI (urban/rural for major countries)
• All estimates are our own, from primary data (unit record/specially designed tabulations).– we do not rely on any secondary sources for the poverty and
inequality measures
• Consistent methods across countries and time.– Obvious comparability problems are eliminated– However, there are comparability problems galore that can’t
be readily fixed– Income vs. consumption; recall periods; valuation
• This study: 208 surveys, 87 countries (95% of pop.)

Some remaining problems
• Urban-rural poverty line differential may vary by level of consumption/income– National differential in middle-income countries is not then valid
for the international $1 a day line • Different countries have used different methods of
setting their urban-rural poverty lines– Cost-of-basic needs method is very common– But differences in implementation

Results

New urban poverty lines
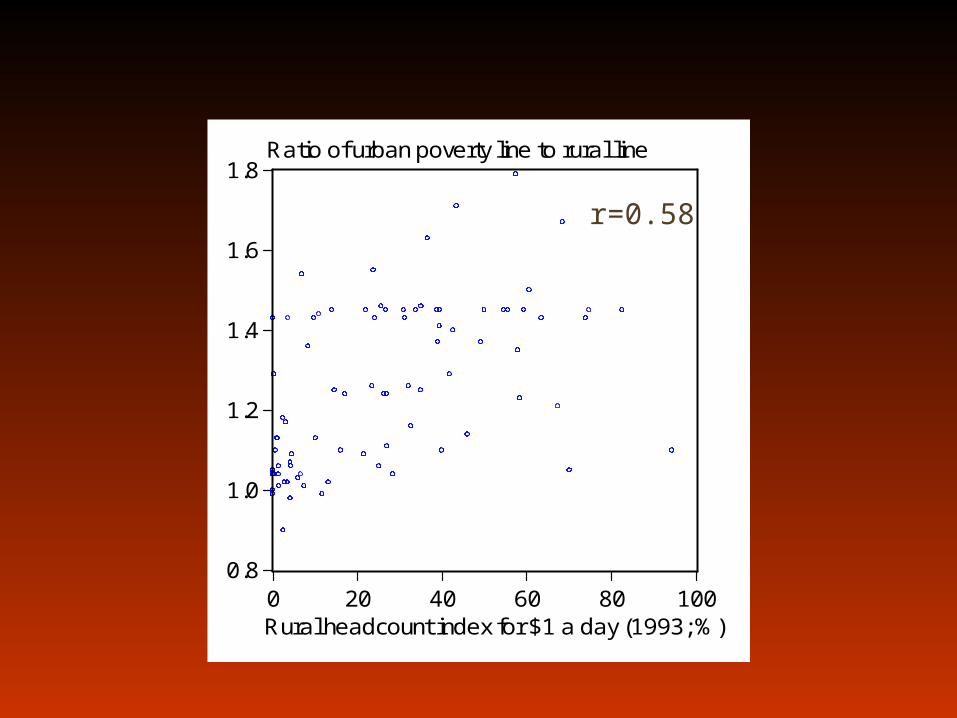
• Urban poverty line is about 30% higher than rural line, on average
• Regional differences– Highest for LAC – Lowest for EECA
• Poorer countries tend to have higher ratios of urban to rural poverty lines => Fig.
• Suggests weaker internal market integration in poorer countries.
Population-weighted urban poverty lines in 1993 PPP
Urban poverty line ($/day; 1993 PPP) corresponding to a rural line of:
$1.08 $2.15 East-Asia and Pacific 1.40 2.79 Eastern-Europe + Central Asia 1.13 2.27 Latin America and Caribbean 1.55 3.10 Middle East and North Africa 1.19 2.37 South Asia 1.40 2.79 Sub-Saharan Africa 1.39 2.77 Total 1.39 2.79
0.8
1.0
1.2
1.4
1.6
1.8
0 20 40 60 80 100
Ratio of urban poverty line to rural line
Rural headcount index for $1 a day (1993; %)
r=0.58

Number of poor in
millions Headcount index
(%)
Urban Rural Total Urban Rural Total
Urban share of the poor
(%)
Urban share of
population (%)
1993 Total 241.53 1038.10 1279.63 13.84 36.64 27.95 18.88 38.12 1996 Total 263.84 934.31 1198.15 13.92 32.15 24.96 22.02 39.47 1999 Total 282.30 949.03 1231.32 13.76 32.18 24.65 22.83 40.89 2002 Total 291.44 889.99 1181.43 13.18 29.74 22.73 24.55 42.34
Global poverty measures for $1 a day

Rural poverty incidence is more than double that in urban areas
• The “$1 a day” rural poverty rate in 2002 of 30% is more than double the urban rate.
• Similarly, while we find that 70% of the rural population lives below $2 a day, the proportion in urban areas is less than half that figure.

Number of poor in
millions Headcount index
(%)
Urban Rural Total Urban Rural Total
Urban share of the poor
(%)
Urban share of
population (%)
1993 Total 241.53 1038.10 1279.63 13.84 36.64 27.95 18.88 38.12 1996 Total 263.84 934.31 1198.15 13.92 32.15 24.96 22.02 39.47 1999 Total 282.30 949.03 1231.32 13.76 32.18 24.65 22.83 40.89 2002 Total 291.44 889.99 1181.43 13.18 29.74 22.73 24.55 42.34
Global poverty measures for $1 a day
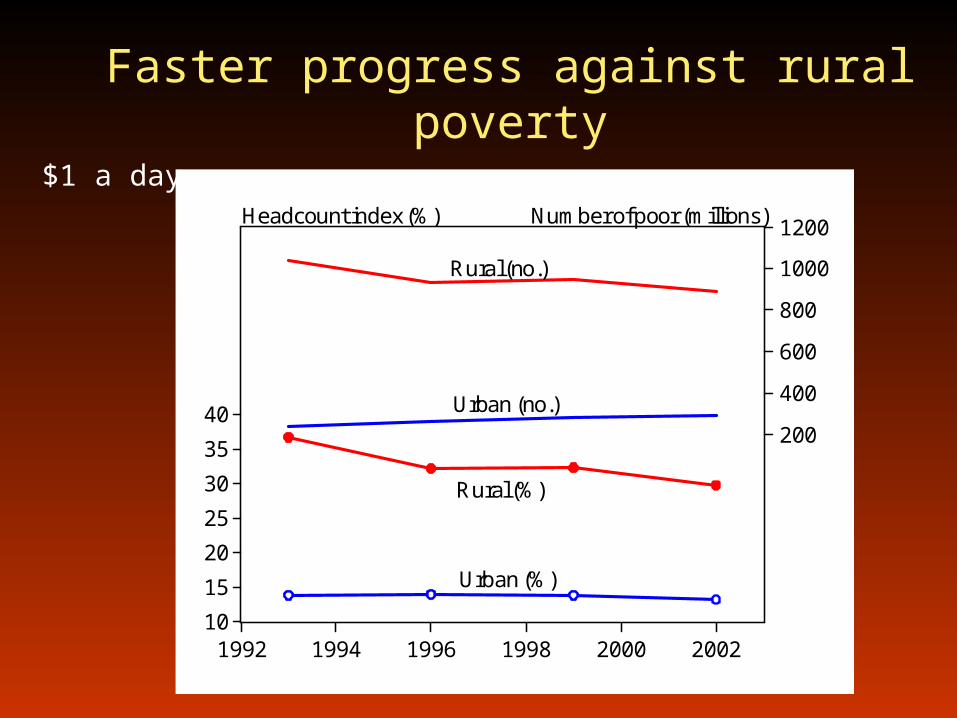
Faster progress against rural poverty
$1 a day
10
15
20
25
30
35
40200
400
600
800
1000
1200
1992 1994 1996 1998 2000 2002
Number of poor (millions)Headcount index (%)
Rural (no.)
Rural (%)
Urban (no.)
Urban (%)

Rising number of urban poor; falling number of rural poor
0.0
200.0
400.0
600.0
800.0
1000.0
1200.0
1993 1996 1999 2002
Po
pu
lati
on
liv
ing
un
de
r $
1/d
ay
(m
illio
ns
)
Rural poor
Urban poor
Distribution of world population by urban and rural poor during 1993 to 2002
100 million fewer “$1 a day” poor =+ 150 million fewer rural poor - 50 million more urban poor.

Lower urbanization of poverty than suggested by past work
• Rural share of poverty is 75%.• This is higher than the estimate of 68% obtained by
Ravallion (2002) using national poverty measures. – Non-negligible difference: representing the reclassification of
over 80 million poor people from urban to rural.
15
20
25
30
35
40
45
1993 1994 1995 1996 1997 1998 1999 2000 2001 2002
% in urban areas
Total population
"$2 a day" poor
"$1 a day" poor

China is an unusual case
• China has unusually large rural-urban poverty gap – H($1)=22% in rural, 1% in urban– Well-known urban-rural disparities in living standards– But data problems (sample frame; “floating population”)
• Excluding China:
urban share of
the poor rises
to 29%.
15
20
25
30
35
40
45
1993 1994 1995 1996 1997 1998 1999 2000 2001 2002
% in urban areas
Total population
"$2 a day" poor
"$1 a day" poor

Decomposition
• 5.2% point decline in aggregate $1 a day poverty rate, 1993-2002
• Of which 4.0% points is attributed to rural poverty reduction
• 1% point directly attributed to urbanization – Also indirect effect in urban areas, which we return to
• Only 0.3% points to urban poverty reduction.
))(()()( 930293939302029302029302uuruuuurrr SSHHHHSHHSHH
rural povertyreduction
urban povertyreduction
populationurbanization

Are the poor urbanizing faster?
• “Yes,” for $1 a day but “no” for $2.– For $1 a day, the share of the poor in urban areas rose by 0.3%
points per year– However, if we drop China from the calculation then Claim 4 is
supported for both poverty lines.
• Country level estimates also support Claim 4. • Let be the urban share of the poor
= 0.18 (s.e.=0.08)
t
S
S
HH
t
SP u
u
uuu
ln
ln
/ln1
)(ln
)( uu SP )( uu SP
)( uu SP

Why are the poor urbanizing faster?
• The (proximate) reason why the poor are urbanizing faster is the initial urban-rural poverty gap.
= 0 (t=0.9)
• Though the absolute gap in poverty rates falls with a rising urban population share.
u
ruruuru
u
u
S
HH
H
HS
H
HHS
S
HH
ln
/ln)1()(
ln
/ln
u
ruruuru
u
u
S
HH
H
HS
H
HHS
S
HH
ln
/ln)1()(
ln
/ln

Is urbanization a positive force in poverty reduction?
• Both the regional aggregates and the underlying country-level estimates support Claim 5. – Polled data; Figures=>– However, confounding latent regional/country effects
• Regression of poverty measures on urban population share with regional/country fixed effects:
• However, causality/channels are unclear! Future work.
$1 a day poverty line Urban Rural Regions by year (n=24)
-0.206 (0.161;0.218)
-1.116 (0.462;0.027)
Countries by year (n=348)
-0.254 (0.103;0.014)
-0.366 (0.134;0.007)

0
20
40
60
80
100
0 20 40 60 80 100
Urban areasRural areas
Headcount index for $1 a day (%)
Urban share of the population (%)
0
20
40
60
80
100
0 20 40 60 80 100
Urban areasRural areas
Headcount index for $2 a day (%)
Urban share of the population (%)
$1 a day
$2 a day
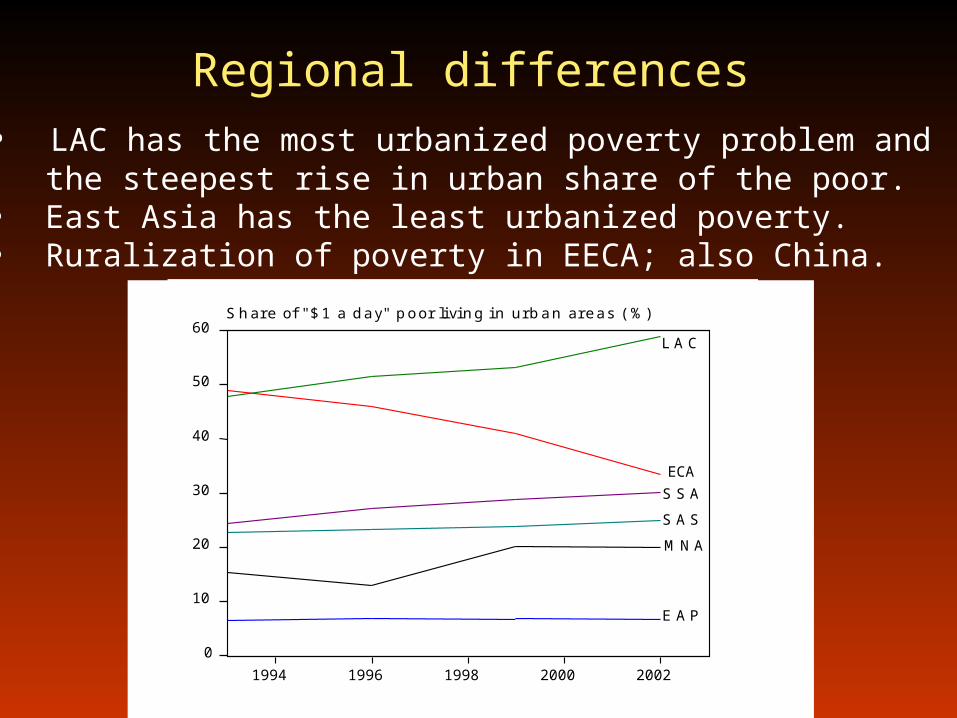
Regional differences• LAC has the most urbanized poverty problem and the steepest rise in urban share of the poor.• East Asia has the least urbanized poverty.• Ruralization of poverty in EECA; also China.
0
10
20
30
40
50
60
1994 1996 1998 2000 2002
L A C
ECA
S S A
S A S
M N A
E A P
S h a re o f " $ 1 a d a y " p o o r liv in g in u rb a n a re a s (% )

Regional differences cont.,
• South Asia: Rural H=1.16 x Urban H• East Asia: Rural H = 9 x Urban H (!)
– Due to China– Urban poverty rate in China in 2002 that is barely 4% of the rural
rate, while it is 90% for India.
• LAC and SSA: rising urban poverty + falling rural
• SSA: population urbanization (including the poor) has
come with little reduction in aggregate poverty.

Some implications

• For many countries, rising or stagnant urban poverty is the “other side of the coin” to what is in large part a poverty-reducing process of urbanization.– by providing new opportunities to rural out-migrants– some, but not all, of whom escape poverty in the process – and through the second-round impacts of urbanization on the
living standards of those who remain in rural areas (remittances + tighter rural labor markets)
• Africa stands out as an exception; further research needed on why.
Rising urban poverty is consistent with pro-poor economic development

• Compared to Chen-Ravallion (2004):– $1 a day poverty rate 2% points higher– And falling at a slightly slower rate
• Chen-Ravallion underestimated poverty in a segment of the economy with below average rate of poverty reduction.
Slightly slower pace of poverty reduction than has been thought

On the future urbanization of poverty
• The latest WUP predicts that the urban share of the population of the developing world will reach 60% by 2030.
• If the urban share of the poor evolves consistently with our data then the share of the $1 a day poor in urban areas will reach 39% by 2030.
• Using Bocquier’s forecasts for urbanization, the urban share of the poor will reach 31% by 2030.
uuuuu SSSSP ])1()1(1[)( 2

Take aways
• There is more poverty than we thought and it is falling less quickly.
• Poverty is less urban than we thought.• Urban poverty is falling more slowly than rural poverty,
but…
• …that is not a bad thing, in general.