
The urban forest - planning.wa.gov.au · The urban forest mapping 6 Tree canopy by suburb 6 Tree...
21
of Perth and Peel of Perth and Peel The urban forest statistical report CSIRO 2009 Urban Monitor the
Transcript of The urban forest - planning.wa.gov.au · The urban forest mapping 6 Tree canopy by suburb 6 Tree...

of Perth and Peel
of Perth and PeelThe urban foreststatistical report
CSIRO 2009 Urban Monitor
the

IIJuly 2014
of Perth and Peelthe
© Western Australian Planning Commission
Published by theWestern Australian Planning CommissionGordon Stephenson House140 William StreetPerth WA 6000
Locked Bag 2506Perth WA 6001
Published July 2014
website: www.planning.wa.gov.auemail: [email protected]
tel: 08 6551 9000 fax: 08 6551 9001National Relay Service: 13 36 77infoline: 1800 626 477
The Department of Planning owns all photography in this document unless otherwise stated.
This document is available in alternative formats on application to Communication Services.
Disclaimer
This document has been published by the Western Australian Planning Commission. Any representation, statement, opinion or advice expressed or implied in this publication is made in good faith and on the basis that the Government, its employees and agents are not liable for any damage or loss whatsoever which may occur as a result of action taken or not taken, as the case may be, in respect of any representation, statement, opinion or advice referred to herein. Professional advice should be obtained before applying the information contained in this document to particular circumstances.

IIIJuly 2014
of Perth and Peelthe
ContentsIntroduction 1
Whatistheurbanforest? 1 Wheredoesurbanforestdatacomefrom? 2 Howistheurbanforestbeingmeasured? 3 Howcouldtheurbanforestinformationbeused? 5
Theurbanforestmapping 6
Treecanopybysuburb 6 Treecanopybylanduse 9 Lowrisk–parkland 9 Mediumrisk–roadreserves 9 Highrisk–commercial,residentialandindustrialstreetblocks 10
Suburbriskprofiles 13
Metropolitancentralsubregioncasestudies 13 Leederville 13 Crawley 13 Applecross 14 Murdoch 14
Metropolitanoutersubregioncasestudies 15 Hillarys 15 Joondalup 15 Guildford 16 Midland 16 Medina 17 Kwinanatowncentre 17
References 18
Maps
Suburbs 19 Landuse Northwestsubregion 26 Northeastsubregion 32 Centralsubregion 38 Southwestsubregion 46 Southeastsubregion 52 Peelsubregion 58

1July 2014
of Perth and Peelthe
IntroductionThe Department of Planning has responded to the need for information on tree canopy cover across the Perth and Peel regions.
This report includes a series of maps showing the density and location of tree canopy cover over the metropolitan area. The tree canopy data is intended to provide a baseline for assessing the urban forest and is derived from the processing of high resolution digital photography.
The information is available through the CSIRO’s Urban Monitor which has processed high resolution photography for this project.
It is hoped that this report will raise the profile of tree retention, protection and enhancement measures among the community, local government and research institutions.
Trees and their canopy cover provide multiple environmental, social, psychological and recreational benefits and comprise what is known as the urban forest. Urban forest strategies in Sydney and Melbourne and local examples from the cities of Armadale and Vincent demonstrate a need to monitor and protect our significant trees and connected canopies in urbanised areas.
What is the urban forest?The urban forest of Perth and Peel is native and exotic tree species, above three metres tall, and growing in the urban environment. Individual trees located on private lots, public streets and in parks and gardens all contribute to an urban tree canopy. While trees in gardens, parks and on streets have always been valued for their aesthetic contribution to neighbourhoods and town centres, the environmental benefits they provide is not always well understood.
The City of Melbourne released an Urban Forest Strategy in 2012, which recognised the cumulative benefits of entire tree populations across a town or city. The Melbourne strategy states that “the urban forest and its associated ecosystem services allows for consideration of the broader issues of climate change, urban heat island effects and population growth”.1
1 City of Melbourne (2012) Urban Forest Strategy. Page 9
2July 2014
of Perth and Peelthe
Tools such as i-Tree Eco (i-tree Eco Australia www.arboriculture.org.au/i-Tree-Australia) model air pollution reduction, greenhouse gas and carbon storage, and energy savings benefits. The value of the services being provided can be calculated in dollar terms.2
Recent local media coverage (2014) on the heat island effect linked heatwaves to climate and health impacts.
The major benefits of trees in urban areas are:
• Reduction of air pollution
• Reduction in volume of stormwater
• Mitigation of wind and noise
• Provision of habitat and support for biodiversity
• Reduction in UV exposure
• Air cooling through evapotranspiration
• Enhanced sense of place and identity
• Improved mental wellbeing
• Encouragement of outdoor activity
• Reduced demand for energy (lower GHG emissions)
• Increased property values3
Where does urban forest data come from?Data on the 2009 urban tree canopy has been made available by high resolution digital photography modelling by the CSIRO. This is called the Urban Monitor. The Urban Monitor project was initiated in 2006 by CSIRO Digital Productivity Flagship team and partners to develop a time-series of urban and environmental indicators and systems. The CSIRO’s Urban Monitor project offers unparalleled monitoring capability to identify changes in land condition and elevation at a fine scale (for example, 0.1 to 0.3 metres).
2 City of Melbourne (2012) Urban Forest Strategy. Page 223 Brown, Katscherian, Carter, Spickett. Cool communities: Urban trees,
climate and health. Curtin University 2013. http://ehia.curtin.edu.au/projects/climatechange.cfm

3July 2014
of Perth and Peelthe
Though still under development, Urban Monitor has the potential to monitor changes in estuarine, river, wetland, foreshores, non-irrigated native bush areas, urban canopy cover, irrigation uniformity and efficiency in public and private open space, areas undergoing urbanisation and groundwater dependent vegetation. The products generated from the Urban Monitor project have been used to assess changes in urban land use impacts on hydrology, and identify changes in vegetation presence and condition for land managers.
“The advent of high quality digital photography provides for traditional ‘ortho-photographic’ and ‘remote sensing’ uses such as environmental monitors. A well devised monitoring system, based on consistent data and methods can track and communicate changes in features of interest in a way that has not been previously possible. The greater Perth area is being used as a case study, and research is being conducted by the CSIRO, State Government and other partners on a range of natural resource and other management issues associated with rapid resource use and climate change.
A detailed account of the CSIRO’s Urban Monitor technology can be found in Urban Monitor: Enabling effective monitoring and management of urban and coastal environments using digital aerial photography Final Report – Transformation of aerial photography into digital raster information products. (CSIRO 2012)
The CSIRO’s Computational Informatics team have generously contributed their time and support with the Urban Monitor digital imagery, to help produce the urban tree canopy statistics displayed in this report.
How is the urban forest being measured?The urban forest is reporting on the percentage of tree canopy cover within an area, not the number of individual trees.
The Department of Planning provided CSIRO with geographic information to measure the area of tree canopy cover to better understand its distribution throughout the metropolitan area. The spatial geographies reflect individual suburbs through to finer grained spatial units such as individual street blocks, road reserve segments and public open space.

4July 2014
of Perth and Peelthe
The tree canopy coverage for suburbs calculates the area of tree canopy as a percentage of the total land area of the suburb and allows comparisons between suburbs.
An important aspect of measuring the extent of the tree canopy across the metropolitan area was to also understand the degree of risk to the health and longevity of the canopy depending on its location and likelihood of future development impacts. Three very broad land use categories were selected to reflect a low, medium and high level of risk to the ongoing health and longevity of the tree canopy.
The low risk category reflected tree canopy in public parks, open space, educational campuses and private recreation grounds such as golf courses.
The medium risk category reflected tree canopy in road reserves which is Crown land vested with local authorities for management and maintenance. However, State statutory agencies have the authority to use the road reserve for infrastructure upgrades. The road network was broken up into segments at each intersection to more accurately reflect the variation in tree canopy cover along a roadway.
The high risk category reflects tree canopy on private lots that are grouped together as street blocks supporting residential, commercial and industrial uses. Australian Bureau of Statistics (ABS) mesh block land use categories of residential, industrial, commercial, hospital/medical, agricultural and transport were used to identify high risk areas for tree canopy loss. The mesh blocks had the cadastral road areas removed to create a GIS shape file that defined street blocks.
Using 2011 ABS mesh blocks provides two primary benefits to presenting tree canopy data. Firstly, it avoids the complexity of varied classifications and zoning types within local planning schemes covering the metropolitan area. Secondly, mesh blocks are the smallest structures within the Australian Statistical Geography Standard (ASGS), and provides a common framework of statistical geography and enables the production of statistics which are comparable and can be spatially integrated.4
4 ABS Meshblocks_WA_2011 metadata statement http:// www.abs.gov.au/geography

5July 2014
of Perth and Peelthe
How can the urban forest information be used?The analysis and mapping provided in The Urban Forest: Perth and Peel is concerned with the spatial distribution of trees across three broad land use categories and aims to generate discussion around the management of the urban tree canopy and the effects of land use and infrastructure.
This paper documents where our trees are located in the urban environment, providing a 2009 baseline to monitor future improvements or areas of concern regarding tree canopy loss. It will provide a detailed data set for further research and analysis by the Department of Planning and external parties. This research could take the form of investigating the correlations between high levels of canopy coverage and household energy and water use, property values, health and lifestyle choices, and housing types, as well as comparison between suburbs, street blocks, activity centres and corridors.
The information will be valuable for local governments who are researching or implementing urban forest strategies and could provide the foundations for an overarching urban forest strategy for Perth and Peel by the Department of Planning.
6July 2014
of Perth and Peelthe
The urban forest mappingTree canopy by suburb Suburb maps have been presented at the regional and subregional scale to display the results for all suburbs across the Perth and Peel region. Analysis of the tree canopy by suburb allows for easier comparisons.
Results by suburb can be aggregated to reflect the canopy cover by local government area and are adaptable to any future local government amalgamations. This ensures the relevance of tree canopy cover measures over time for ongoing monitoring. In addition, measures by suburb are useful for engaging and communicating with the general public in relation to the retention of the urban tree canopy.
The amount of tree canopy cover in suburbs is a product of several factors, such as:
• physical environment (landform, drainage, soils);
• the age of the suburb;
• the road structure;
• the subdivision pattern;
• lot sizes;
• land uses;
• the built form; and
• the town planning scheme zoning
The following aerial photographs help to associate the tree canopy cover percentages with examples of the suburban built and natural environment.

7July 2014
of Perth and Peelthe
Tree canopy cover examples by suburb (built form examples reflect a 1.5 km x 2 km spatial area)
0-5% Welshpool Clarkson
5%-10% Balcatta Warnbro
10%-15% Booragoon Gosnells
15%-20% Wembley Downs Medina

8July 2014
of Perth and Peelthe
20-25% Maida Vale Crawley
25%-30% Roleystone Kalamunda
30%-40% Bickley
40%+ Nanga Brook

9July 2014
of Perth and Peelthe
Tree canopy by land useIn order to make the tree canopy data more accessible and relevant for planning and community purposes we have plotted tree canopy cover results for individual street blocks, road reserves and parkland. The 2009 tree canopy cover results have been displayed by local government area in the outer subregions and by quadrants in the central subregion.
The tree canopy results for street blocks and parkland are displayed together on one map with road reserves and parkland displayed together on an additional map for improved legibility.
The following three broad land use categories have been selected to reflect different planning policy environments, likely development and infrastructure impacts and highlight roles and responsibilities of State agencies, local governments and land owners.
Low risk – parklandsTrees within a parkland setting are considered to be low risk because these areas are designated as spaces for biodiversity, recreation, and relaxation with few development pressures. Education spaces do not provide the same level of protection for trees as zoned parks and reserves and often have active building programs.
Medium risk – road reserves The road verge creates the opportunity for regular tree planting and maintenance by local authorities to provide continuous and converging tree canopies for shade and aesthetics. Road reserves are shared spaces with multiple functions; the road reserve is Crown land vested with the local government authority for general management and State authorities have authority to use the road reserve. Road reserves are commonly contained underground and above ground infrastructure.
Tree canopy in road reserves is considered medium risk due to infrastructure maintenance and upgrades which can damage or remove trees. Road widening can also have a significant impact on established trees and often results in the complete removal of existing trees.

10July 2014
of Perth and Peelthe
The benefit of road reserve management that underpins the medium risk status is that infrastructure and maintenance activities are well managed and subject to policy. The road reserve boundaries have been defined by Landgate cadastre using GIS polygons with a usage type that includes the term ‘Road’.
High risk – commercial, residential and industrial street blocksTrees on private lots are at the greatest risk of development pressures because there is very limited protection for established trees under statutory policies. While residential extensions and redevelopments are a common cause of canopy loss, trees can be removed on private land at any time. It is likely that planning policies, schemes and structure plans that increase densities and allow for further subdivision will trigger increased development activity and subsequent tree canopy loss.
The following tree canopy statistics are intended to help State and local governments understand the magnitude of the risk to the tree canopy and to provide information for the maintenance and management of the urban tree canopy.

11July 2014
of Perth and Peelthe
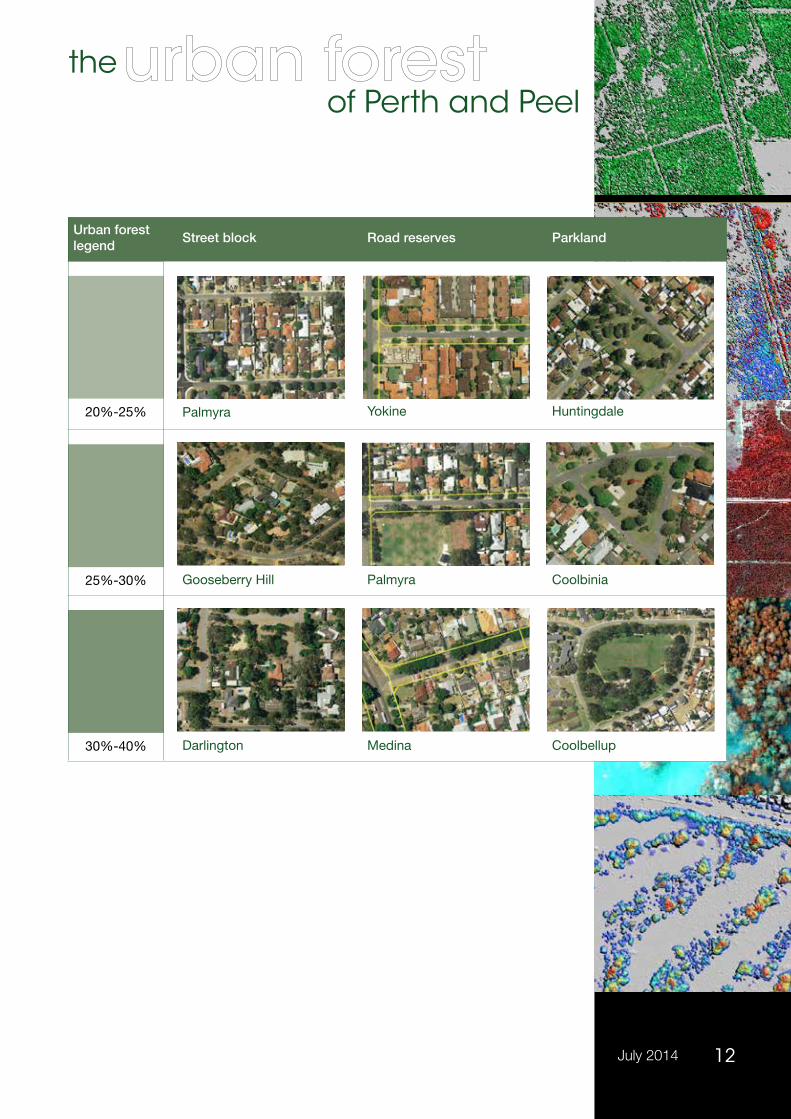
Tree canopy cover examples by street block, roads and parkland
Urban forest legend
Street block Road reserves Parkland
0-5% Joondanna Mount Pleasant Winthrop
5%-10% North Perth Willagee Darch
10%-15% Dalkeith Sorrento Nollamara
15%-20% Melville Joondanna Wembley Downs
12July 2014
of Perth and Peelthe
Urban forest legend
Street block Road reserves Parkland
20%-25% Palmyra Yokine Huntingdale
25%-30% Gooseberry Hill Palmyra Coolbinia
30%-40% Darlington Medina Coolbellup

13July 2014
of Perth and Peelthe
Suburb risk profilesThe graphs below show the percentage of land in each suburb that is dedicated to the three broad land uses topped with the percentage of area that has tree canopy coverage. The graphs can help determine the level of risk to a suburb’s tree population depending on where the majority of trees are located and whether the suburb will be targeted as an infill location.
Metropolitan central subregion case studies
50%
45%
40%
35%
30%
25%
20%
15%
10%
5%
0%
Canopy cover
No canopy coverage
Privateproperty Roads Parks
3.4% 3.7%
4.5%
22.7% 22.6%
43.2%
Leederville
70%
60%
50%
40%
30%
20%
10%
0%
Canopy cover
No canopy coverage
Privateproperty Roads Parks
15.6%
13.7%
46.5%
18%
2.7%3.6%
Crawley

14July 2014
of Perth and Peelthe
70%
60%
50%
40%
30%
20%
10%
0%
Canopy cover
No canopy coverage
Privateproperty Roads Parks
5.34%
8.9%
19.3%8.3%
57%
1.1%
Applecross
70%
60%
50%
40%
30%
20%
10%
0%
Canopy cover
No canopy coverage
Privateproperty Roads Parks
11.4%
12.4%
58.6%
15.9%
0.7%1%
Murdoch

15July 2014
of Perth and Peelthe
60%
50%
40%
30%
20%
10%
0%
Canopy cover
No canopy coverage
Privateproperty Roads Parks
22.5% 21.8%
48.8% 1%
3.1%
2.8%
Hillarys
45%
40%
35%
30%
25%
20%
15%
10%
5%
0%
Canopy cover
No canopy coverage
Privateproperty Roads
25.1%
39.3%
1.5%
26.8%
2.2%
5.1%
Parks
Joondalup
Metropolitan outer subregion case studies

16July 2014
of Perth and Peelthe
50%
45%
40%
35%
30%
25%
20%
15%
10%
5%
0%
Canopy cover
No canopy coverage
Privateproperty Roads Parks
11.4%
6.8%
12.1%
37.9%28.6%
3.1%
Guildford
80%
70%
60%
50%
40%
30%
20%
10%
0%
Canopy cover
No canopy coverage
Privateproperty Roads Parks
18.6%5.2%
67.3%
1.5%
4.9%
2.5%
Midland

17July 2014
of Perth and Peelthe
60%
50%
40%
30%
20%
10%
0%
Canopy cover
No canopy coverage
Privateproperty Roads Parks
8.9%
13.4%
49.2%
21.1%
3.2%
4.1%
Medina
90%
80%
70%
60%
50%
40%
30%
20%
10%
0%
Canopy cover
No canopy coverage
Privateproperty Roads Grand
total
14.3%
59.9%
1.3%
0%
24.5%
Kwinana town centre

18July 2014
of Perth and Peelthe
References(2013 EPA) Environmental Protection Bulletin No.20
(2013 City of Sydney) Urban Forest Strategy
(2013 Brown, H) Cool communities: Urban trees, climate and health
(2013 WAPC) Capital City Planning Framework: a vision for Central Perth
(2013 WAPC) Capital City Planning Framework support document: central Perth regional parklands concept.
(2012 City of Melbourne) Urban Forest Strategy: Making a great city greener
(2012 CSIRO) Urban Monitor: Enabling effective monitoring and management of urban and coastal environments using digital aerial photography
(2009 Schwab) Planning the Urban Forest
(2007 WAPC) Liveable Neighbourhoods: a Western Australian Government sustainable cities initiative


![Mapping forest canopy height globally with spaceborne lidarjosh.yosh.org/publications/Simard et al 2011 - Mapping forest canopy... · canopy height product [Lefsky, 2010], and differences](https://static.fdocuments.net/doc/165x107/5f5e82f94a05bb798848773c/mapping-forest-canopy-height-globally-with-spaceborne-et-al-2011-mapping-forest.jpg)


![Forest litter crickets prefer higher substrate moisture for ......the tree canopy, being particularly abundant in forest litter [40]. Crickets are oviparous, hemimetabolous insects](https://static.fdocuments.net/doc/165x107/60e627b10ee34f2dea08b7e8/forest-litter-crickets-prefer-higher-substrate-moisture-for-the-tree-canopy.jpg)


