The Upper Mantle Seismic Velocity Structure of South...
16
The Upper Mantle Seismic Velocity Structure of South-Central Africa and the Seismic Architecture of Precambrian Lithosphere Beneath the Congo Basin 1 Andriamiranto Raveloson, Andrew Nyblade, Stewart Fishwick, Azangi Mangongolo, and Sharad Master 1.1 Introduction The Congo Basin, covering approximately 10 % of the African continent, is one of the largest intracratonic basins on any continent, and its origin remains poorly understood (e.g. Daly et al. 1992; Downey and Gurnis 2009; Crosby et al. 2010; Kadima et al. 2011a,b). It contains up to 9 km of sedimentary rocks, which may date back to the Neoprotero- zoic, and its tectonic history is punctuated with major periods of compression during the late Neoproterozoic for- mation of Gondwana and Late Paleozoic subduction along the southern margin of Pangea. Stratigraphic information from drill holes and outcrops, seismic reflection profiles, and gravity and magnetic observations have led to a number of models for the formation of the basin, many of which begin with Neoproterozoic rifting (e.g. Daly et al. 1992; Kadima et al. 2011b) and call upon anomalous density either within or below the lithospheric mantle to sustain the long- lived (e.g. ca. 700 Ma), basin-wide subsidence (e.g. Crosby et al. 2010; Downey and Gurnis 2009). Seismic images of mantle structure beneath the basin from continental-scale tomography place first order constraints on explanations for how the basin may have formed (e.g. Fishwick 2010; Pasyanos 2010; Priestley et al. 2008; Pasyanos and Nyblade 2007; Ritsema and van Heijst 2000), and all but one show fast, thick (i.e. > 200 km) lithosphere beneath the interior of the basin. The thick shield lithosphere imaged by most of the tomography studies underpins many of the geodynamic models explaining how the basin formed. At lithospheric mantle depths (i.e. >~40 km) the model by Pasyanos and Nyblade (2007) shows slower velocities beneath the central and eastern portions of the basin, which they suggested could indicate the presence of thinner (mobile belt) lithosphere that may have formed during the Proterozoic amalgamation of the three major cratonic blocks of the greater Congo Shield that surround the basin, the Kasai Craton to the south, the Ntem Craton to the west and the Bomu Craton to the north- east (Fig. 1.1). The suggestion that Proterozoic mobile belt lithosphere lies beneath the northern part of the basin has also been made by Master (2004), De Wit et al. (2008), and Gubanov and Mooney (2009) using geological evidence. Daly et al. (1992) and De Wit et al. (2008) showed a NW–SE trending Neoproterozoic belt running through the centre of the Congo Basin. To the NW of the basin, this belt extends into in a region with poorly dated metasedimentary rocks of Paleoproterozoic (>2080 Ma) and Mesoproterozoic (1167 Ma –ca. 1.0 Ga) age (Vicat et al. 1997), which in turn are overthrust by the south-verging nappes of the Oubanguide Belt, dated at c. 571–620 Ma (Moloto-A- Kanguemba et al. 2008; Toteu et al. 1994; De Wit et al. 2008; see also de Wit and Linol, Chap. 2, this Book). Here we briefly review the basin’s geological setting and some of the geophysical studies relevant to understanding how the basin formed, and then present a new model of upper mantle structure for central and southern Africa A. Raveloson Department of Geosciences, Pennsylvania State University, University Park, PA 16802, USA e-mail: [email protected] A. Nyblade (*) Department of Geosciences, Pennsylvania State University, University Park, PA 16802, USA School of Geosciences, University of the Witwatersrand, Johannesburg, South Africa e-mail: [email protected] S. Fishwick Department of Geology, University of Leicester, Leicester, LE1 7RH, UK e-mail: [email protected] A. Mangongolo Council for Geosciences, Private Bag x112, Pretoria, 0001, South Africa e-mail: [email protected] S. Master School of Geosciences, University of the Witwatersrand, Johannesburg, South Africa e-mail: [email protected] M.J. de Wit et al. (eds.), Geology and Resource Potential of the Congo Basin, Regional Geology Reviews, DOI 10.1007/978-3-642-29482-2_1, # Springer-Verlag Berlin Heidelberg 2015 3
Transcript of The Upper Mantle Seismic Velocity Structure of South...

The Upper Mantle Seismic Velocity Structureof South-Central Africa and the Seismic Architectureof Precambrian Lithosphere Beneath the Congo Basin
1
Andriamiranto Raveloson, Andrew Nyblade, Stewart Fishwick,Azangi Mangongolo, and Sharad Master
1.1 Introduction
The Congo Basin, covering approximately 10 % of the
African continent, is one of the largest intracratonic basins
on any continent, and its origin remains poorly understood
(e.g. Daly et al. 1992; Downey and Gurnis 2009; Crosby
et al. 2010; Kadima et al. 2011a,b). It contains up to 9 km of
sedimentary rocks, which may date back to the Neoprotero-
zoic, and its tectonic history is punctuated with major
periods of compression during the late Neoproterozoic for-
mation of Gondwana and Late Paleozoic subduction along
the southern margin of Pangea. Stratigraphic information
from drill holes and outcrops, seismic reflection profiles,
and gravity and magnetic observations have led to a number
of models for the formation of the basin, many of which
begin with Neoproterozoic rifting (e.g. Daly et al. 1992;
Kadima et al. 2011b) and call upon anomalous density either
within or below the lithospheric mantle to sustain the long-
lived (e.g. ca. 700 Ma), basin-wide subsidence (e.g. Crosby
et al. 2010; Downey and Gurnis 2009).
Seismic images of mantle structure beneath the basin
from continental-scale tomography place first order
constraints on explanations for how the basin may have
formed (e.g. Fishwick 2010; Pasyanos 2010; Priestley et al.
2008; Pasyanos and Nyblade 2007; Ritsema and van Heijst
2000), and all but one show fast, thick (i.e. > 200 km)
lithosphere beneath the interior of the basin. The thick shield
lithosphere imaged by most of the tomography studies
underpins many of the geodynamic models explaining how
the basin formed. At lithospheric mantle depths (i.e.
>~40 km) the model by Pasyanos and Nyblade (2007)
shows slower velocities beneath the central and eastern
portions of the basin, which they suggested could indicate
the presence of thinner (mobile belt) lithosphere that may
have formed during the Proterozoic amalgamation of the
three major cratonic blocks of the greater Congo Shield
that surround the basin, the Kasai Craton to the south, the
Ntem Craton to the west and the Bomu Craton to the north-
east (Fig. 1.1). The suggestion that Proterozoic mobile belt
lithosphere lies beneath the northern part of the basin has
also been made by Master (2004), De Wit et al. (2008), and
Gubanov and Mooney (2009) using geological evidence.
Daly et al. (1992) and De Wit et al. (2008) showed a
NW–SE trending Neoproterozoic belt running through the
centre of the Congo Basin. To the NW of the basin, this belt
extends into in a region with poorly dated metasedimentary
rocks of Paleoproterozoic (>2080 Ma) and Mesoproterozoic
(1167 Ma –ca. 1.0 Ga) age (Vicat et al. 1997), which in turn
are overthrust by the south-verging nappes of the
Oubanguide Belt, dated at c. 571–620 Ma (Moloto-A-
Kanguemba et al. 2008; Toteu et al. 1994; De Wit et al.
2008; see also de Wit and Linol, Chap. 2, this Book).
Here we briefly review the basin’s geological setting and
some of the geophysical studies relevant to understanding
how the basin formed, and then present a new model of
upper mantle structure for central and southern Africa
A. Raveloson
Department of Geosciences, Pennsylvania State University, University
Park, PA 16802, USA
e-mail: [email protected]
A. Nyblade (*)
Department of Geosciences, Pennsylvania State University, University
Park, PA 16802, USA
School of Geosciences, University of the Witwatersrand,
Johannesburg, South Africa
e-mail: [email protected]
S. Fishwick
Department of Geology, University of Leicester, Leicester, LE1 7RH,
UK
e-mail: [email protected]
A. Mangongolo
Council for Geosciences, Private Bag x112, Pretoria, 0001, South
Africa
e-mail: [email protected]
S. Master
School of Geosciences, University of the Witwatersrand,
Johannesburg, South Africa
e-mail: [email protected]
M.J. de Wit et al. (eds.), Geology and Resource Potential of the Congo Basin, Regional Geology Reviews,
DOI 10.1007/978-3-642-29482-2_1, # Springer-Verlag Berlin Heidelberg 2015
3

based on Rayleigh wave group velocities. By comparing
similarities and differences between this model and previ-
ously published models, we gain additional insights into the
architecture of lithospheric structure under the basin, which
in turn we use to evaluate the proposal of a northwest-
southeast trending mobile belt beneath the northern portion
of the basin. Whether or not a mobile belt extends under the
basin has implications not only for geodynamic models of
basin formation invoking uniformly thick lithosphere
beneath the basin, but also for understanding Neoproterozoic
tectonism that may have initiated basin subsidence.
1.2 Geological Setting
The Congo Basin has a mean elevation of ~300–400 m
above sea level and is surrounded by uplifted regions on all
sides (Fig. 1.1; and see Chap. 8 for greater detail). Details of
the basin fill come from four, 2–4 km deep wells (Samba,
Dekese, Mbandaka, Gilson), field studies, and a number of
seismic reflection profiles. Data from the wells (cores and
drill logs) and the reflection profiles have been used in a
number of studies (e.g. Lawrence and Makazu 1988; Daly
et al. 1992; Kadima et al. 2011a,b; see Chaps. 2–4 for more
details) to show that the basin contains 4 to 9 km of
sediments ranging in age from Neoproterozoic to Neogene.
The pre-Cretaceous sediments are thought to have been
deposited during a post-rift subsidence phase (Lawrence
and Makazu 1988; Daly et al. 1992; Crosby et al. 2010;
Kadima et al. 2011a,b). Neoproterozoic, Late Cambrian
and Permian-Triassic unconformities have been identified
in seismic profiles, and the latter two have been linked to
NE–SW compression that resulted in reverse faulting and
the development of basement highs near the center of the
basin (Daly et al. 1992). However, the validity of the ages of
these unconformities has been questioned elsewhere (e.g.
Linol 2013; and see Chap. 6).
A detailed description of the basin stratigraphy can be
found in Kadima et al. (2011a). The four wells penetrated
mostly formations of sandstones and clays and none of them
reached crystalline basement. At the top of the basin is 1 km
of undeformed Lower Cretaceous to Quaternary sediments
deposited in fluvial, lacustrine and aeolian environments.
Paleozoic and Neoproterozoic sediments outcrop along the
margin of the basin, and tectonic subsidence curves from
back-stripping the four wells show very slow subsidence
10˚0˚
0˚ 10˚
20˚
20˚
30˚
30˚
40˚
40˚
50˚
50˚
-30˚ -30˚
-20˚ -20˚
-10˚ -10˚
0˚ 0˚
10˚ 10˚
DG
SM
t
0
1
2
3
4(km) Damara Belt
Irumid
e
Irumide
Bangw-euluBlock
Kiba
ran
Belt
K-ABelt
Zimbabwe Craton
KaapvaalCraton
Tanzania Craton
KasaiCraton
Belt
S.
Belt
NtemCraton
Bomu Craton
Fig. 1.1 Topographic map of
central and southern Africa
showing the major Archean
cratons (Kaapvaal, Zimbabwe,
Tanzania, Kasai, Bomu, Ntem;
solid black lines), the greaterCongo Shield (dashed black line),the zero thickness contour for the
Mesozoic and Cenozoic
sediments of the Congo Basin
(blue line), the inferred location
of Neoproterozoic rifts within the
Congo Basin (red dashed lines),and the outline of the Bouguer
gravity map in Kadima et al.
(2011a) (rectangle outlined with
red dashed lines). K-A Belt is the
Karagwe-Ankole Belt. The
location of the Samba (S), Dekese
(D), Mbandaka (M), and Gilson
(G) wells are shown with blackcircles
4 A. Raveloson et al.

since the Early Paleozoic compressional event (Kadima
et al. 2011b), as expected for post-rift thermal relaxation of
the lithosphere.
1.3 Previous Geophysical Studies
A number of geophysical techniques have been applied to
the Congo Basin and surrounding regions in order to
improve knowledge of the subsurface structure. Petroleum
exploration of the basin led to the acquisition of the seismic
reflection profiles mentioned previously, as well as a number
of gravity and aeromagnetic surveys. More recently, satellite
gravity missions such as the Gravity Recovery and Climate
Experiment (GRACE), have provided global knowledge of
the gravity and geoid fields. Interpretation of the seismic
reflection data identified a series of sub-basins separated by
basement highs (e.g. Lawrence andMakazu 1988; Daly et al.
1992), however a re-interpretation of the seismic profiles by
Kadima et al. (2011a) suggests that salt structures may be
present in the central basin and therefore the basement highs
might not be as pronounced as originally thought. These
various interpretations remain to be tested.
Complementing the seismic reflection data, Kadima et al.
(2011a) presented results from an aeromagnetic survey over
the central and northern parts of the basin and a Bouguer
anomaly map for the entire basin (Fig. 1.1). The aeromag-
netic survey was carried out in 1984, and shows low mag-
netic gradients in the central part of the basin corresponding
to deep basement, and higher magnetic gradients to the
northeast and southwest, where the basement is interpreted
to be less deep (Kadima et al. 2011a). The gravity database
used by Kadima et al. (2011a) comes from the Bureau
Gravimetrique International (BGI) in Toulouse, France,
and incorporates data from a variety of sources. The
Bouguer anomaly map is dominated by NW-SE trending
anomalies.
At a subcontinental scale the most striking feature in the
gravity data is a long wavelength negative free air gravity
anomaly (~ -40mGal) that coincides with the basin. Hartley
and Allen (1994) proposed that this anomaly was unlikely to
be supported by variations in crustal structure, and Hartley
et al. (1996) suggested that the correlations between gravity
anomalies and topography are indicative of convective pro-
cesses in the underlying mantle. A number of recent studies
have discussed the cause of the long wavelength gravity
anomaly and the potential relationship to basin formation.
Downey and Gurnis (2009) suggested that there must be an
anomalously dense body, possibly made of eclogite, within
the mantle beneath the basin. A similar interpretation involv-
ing a dense body in the lower crust or upper mantle was
proposed by Braitenberg and Ebbing (2009) to explain the
relationship between gravity and geoid fields for a number of
intra-cratonic basins worldwide. Crosby et al. (2010)
modeled the subsidence and gravity signature of the basin
using a lithospheric thickness of 220 km interpreted from
seismic tomography images, and argued that the long wave-
length gravity signature is likely the result of recent convec-
tive drawdown beneath the basin in response to the
surrounding upwellings, consistent with the mantle convec-
tion model of Forte et al. (2010). However, based on a
variety of seismic models (see below), Buiter et al. (2012)
conclude that the seismological results do not provide
supporting evidence for a first-order role of the sub-
lithospheric mantle in the recent subsidence of the Congo
Basin. In contrast to these models, Kadima et al. (2011b)
argue that if the effects of the low-density sediments are
removed from the gravity field, then the residual gravity
anomaly can be attributed to 8–10 km of relative crustal
thinning beneath the deepest portions of the basin.
A review of both continental and global-scale seismic
tomography models that inculcate the Congo Basin has
been recently published by Buiter et al.(2012). Using simple
averaging, the authors assessed uncertainties in lithospheric
thickness estimates from a range of geophysical models, and
also computed mean velocities, along with the associated
standard deviations, to investigate the role of the
sublithospheric mantle in the subsidence of the basin. The
review showed generally thick (~200 km) lithosphere
beneath much of the basin, but suggested that the uncertain-
ties between the different tomographic models provide little
evidence of upwelling on the flanks of the basin (Buiter et al.
2012). We briefly summarize the key features from several
of the continental-scale models of Africa.
All continental-scale seismic tomography models show
fast, craton-like upper mantle structures beneath some parts
or else most of the Congo Basin (e.g. Fishwick 2010;
Priestley et al. 2008; Ritsema and van Heijst 2000; Pasyanos
and Nyblade 2007; Sebai et al. 2006). The models by
Fishwick (2010) and Priestley et al. (2008) use the same
basic technique, comprising waveform inversion
measurements for fundamental and first four higher mode
Rayleigh waves. Sebai et al. (2006) also measured and
inverted phase velocities for fundamental and higher mode
Rayleigh waves, in addition to Love waves. Ritsema and van
Heijst (2000) modeled phase velocity measurements from
fundamental mode Rayleigh waves only. In contrast, the
model by Pasyanos and Nyblade (2007) is based on group
velocity measurements from fundamental mode Rayleigh
waves.
At the shallowest depths (100–200 km depth) displayed
in the models constructed using phase velocities or wave-
form inversion techniques, the velocity structure is
reasonably similar, with fast velocities found beneath much
1 The Upper Mantle Seismic Velocity Structure of South-Central Africa and the. . . 5

of the basin, but with the fastest velocities found beneath the
southern portion of the basin and Kasai Craton (Fig. 1.2). In
the Fishwick (2010) model (Fig. 1.2), the Ntem Craton
appears as a relatively fast region compared to the Priestley
et al. (2008) model. The isotropic shear wave velocity model
of Sebai et al. (2006) shows similar structures to the
Fishwick (2010) and Priestley et al. (2008) models across
the basin, while the model of Ritsema and van Heijst (2000)
shows uniformly fast upper mantle everywhere beneath the
Congo Basin.
The fast velocities observed in the majority of models,
are, however, not seen in the results of Pasyanos and
Nyblade (2007). At upper mantle depths of 100–200 km,
their model shows a region of relatively slower velocities
extending from the eastern side of the basin into the interior
of the basin, which is illustrated in Fig. 1.2. Faster velocities
in this model are found to the south in the vicinity of the
Kasai Craton, to the north beneath the Bomu Craton, and to
the west beneath the Ntem Craton. As mentioned in the
introduction, this is the only model that shows slower
velocities beneath a substantial portion of the Congo Basin,
and it is based on this result that Pasyanos and Nyblade
(2007) suggested that beneath the basin there might be
mobile belt lithosphere which is thinner than the lithosphere
beneath the cratons.
Crustal thickness beneath the basin remains poorly
known, with the majority of studies using either the global
model 3SMAC (Nataf and Ricard 1996) or Crust 2.1 (Bassin
et al. 2000). Pasyanos and Nyblade (2007) used surface
wave tomography to estimate crustal thickness across the
whole continent. For a comparison of these three crustal
models, we refer the reader to Fig. 3 in Fishwick and Bastow
(2011).
As discussed by Buiter et al. (2012), lithospheric thick-
ness beneath the basin has been estimated in a number of
studies. Pasyanos (2010) estimated ~130–160 km thick litho-
sphere compared to 160–180 km beneath parts of the Bomu
Craton, 160–200 km beneath the Kasai Craton, and over
200 km thick beneath the Ntem Craton. Fishwick (2010)
reported lithospheric thicknesses of >200 km beneath the
southwestern and central parts of the basin, with lithosphere
thinning to around 160–200 km adjacent to the margins of
the basin and beneath the Bomu, Ntem and Kasai cratons.
Priestley et al. (2008) reported considerably different litho-
spheric thicknesses from Fishwick (2010) in spite of using
very similar modeling methodologies. In a more recent
update, Priestley and McKenzie (2013) estimate the thickest
lithosphere (>210 km) beneath the central part of the basin
and thinner lithosphere (170–200 km) beneath the Ntem and
Kasai Cratons. In their model, lithospheric thickness drops
sharply on the northeastern margin of the basin and to the
southwest of the basin.
It is very difficult to accurately assess the uncertainty on
these thickness estimates. The tomographic models them-
selves have vertical resolution of ~25–50 km for depths
shallower than ~200 km, although this is dependent on the
exact periods and techniques used. Different approaches for
converting velocity to thickness further challenge compari-
sons between the various models. It is, therefore, difficult to
have confidence in variations of less than ~50 km in litho-
spheric thickness.
1.4 Shear Wave Tomography
To advance our understanding of upper mantle structure
beneath and surrounding the Congo Basin, we have devel-
oped a new shear wave velocity model using all available
Long
itude
(deg
)
Latitude (deg)
Fig. 1.2 High resolution shear velocity model at 100 km depth from
Fishwick (2010). Velocities are plotted as perturbations from the refer-
ence model ak135, green/blue shades showing faster velocities and red/brown slower velocities. The outline of major Archean cratons (see
Fig. 1.1 for more details) are shown with solid white lines, the greaterCongo Shield with the dashed white line, the inferred location of
Neoproterozoic rifts with grey lines, and the area of slow velocities at
100 km depth in the Pasyanos and Nyblade (2007) model with a dashedblack line
6 A. Raveloson et al.

open data from permanent and temporary networks, as well
as from many new temporary and permanent seismic
stations in eastern and southern Africa that are part of
AfricaArray (http://www.africaarray.org) (Fig. 1.3). Tempo-
rary stations were deployed in Uganda, Tanzania and
Zambia between 2007 and 2011 as part of the AfricaArray
East African Seismic Experiment (AAEASE) and the
AfricaArray Tanzania Basin Seismic Experiment
(AATBSE) (Tugume et al. 2012; Mulibo and Nyblade
2013), and several permanent stations have been established
since 2005 to form the AfricaArray observatory network.
Data from the AfricaArray stations greatly improves ray
path coverage across the Congo Basin. In our modeling
approach, maps of Rayleigh wave group velocities are first
constructed using event-station measurements of group
velocities from fundamental mode surface waves, dispersion
curves are extracted over a grid of nodes and inverted for 1D
shear velocity models, and then the 1D models are combined
to create a quasi-3D upper mantle shear wave velocity model
of the region.
1.4.1 Rayleigh Wave Group Velocity Maps
To develop the group velocity maps, we used seismic events
with magnitude greater than 4.5 and depth shallower than
100 km recorded between 1990 and 2013. Only events along
the margin or within the African plate have been used to
minimize the influence of structure outside the plate on our
tomographic images.
Group velocity measurements for 40,337 event-station
pairs were made for fundamental mode Rayleigh waves
using vertical component seismograms. An example is
shown in Fig. 1.4 for a magnitude 5.5 event recorded on station
KMBO. The ray path coverage is illustrated in Fig. 1.5. After
visual inspection for waveform quality, the instrument-
corrected data were windowed to isolate the Rayleigh wave,
and group velocity measurements were made using the multi-
ple filter method (Dziewonski et al. 1969; Herrmann 1973)
implemented in the program PGSWMFA (PGplot Surface
Wave Multiple Filter Analysis; Ammon 1998). An example
measurement is shown in Fig. 1.6 for the same data as in
Fig. 1.4.
Fig. 1.3 Locations of seismic stations used for this study. Color-coded FDSN network codes are provided at the bottom of the figure
1 The Upper Mantle Seismic Velocity Structure of South-Central Africa and the. . . 7
The ensemble of group velocity measurements at each
period was inverted using a linear 2-D tomographic inver-
sion to obtain maps of Rayleigh wave group velocities. The
inversion was performed over a grid of 1� � 1� cells and theslowness for each cell was calculated using a conjugate
gradient method (Paige and Saunders 1982). Damping and
smoothing were used to stabilize the inversion. Changing the
damping parameter did not significantly affect the results,
and therefore a low damping of 0.1 was used. A smoothing
value of 3,000 was used for all periods based on tradeoff
curves between smoothing and travel time misfit (Fig. 1.7).
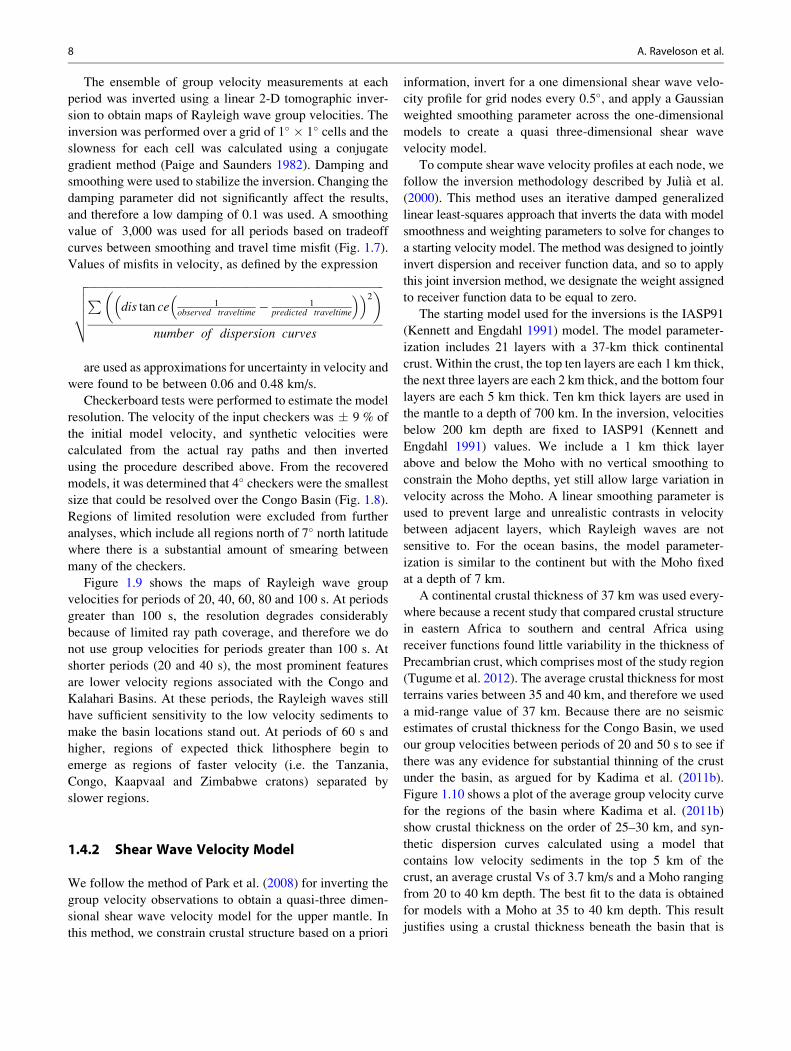
Values of misfits in velocity, as defined by the expression
ffiffiffiffiffiffiffiffiffiffiffiffiffiffiffiffiffiffiffiffiffiffiffiffiffiffiffiffiffiffiffiffiffiffiffiffiffiffiffiffiffiffiffiffiffiffiffiffiffiffiffiffiffiffiffiffiffiffiffiffiffiffiffiffiffiffiffiffiffiffiffiffiffiffiffiffiffiffiffiffiffiffiffiffiffiffiffiffiffiffiffiffiffiffiffiffiffiffiffiffiffiffiffiffiffiffiffi
P
dis tan ce 1observed traveltime � 1
predicted traveltime
� �� �2� �
number of dispersion curves
v
u
u
u
t
are used as approximations for uncertainty in velocity and
were found to be between 0.06 and 0.48 km/s.
Checkerboard tests were performed to estimate the model
resolution. The velocity of the input checkers was � 9 % of
the initial model velocity, and synthetic velocities were
calculated from the actual ray paths and then inverted
using the procedure described above. From the recovered
models, it was determined that 4� checkers were the smallest
size that could be resolved over the Congo Basin (Fig. 1.8).
Regions of limited resolution were excluded from further
analyses, which include all regions north of 7� north latitudewhere there is a substantial amount of smearing between
many of the checkers.
Figure 1.9 shows the maps of Rayleigh wave group
velocities for periods of 20, 40, 60, 80 and 100 s. At periods
greater than 100 s, the resolution degrades considerably
because of limited ray path coverage, and therefore we do
not use group velocities for periods greater than 100 s. At
shorter periods (20 and 40 s), the most prominent features
are lower velocity regions associated with the Congo and
Kalahari Basins. At these periods, the Rayleigh waves still
have sufficient sensitivity to the low velocity sediments to
make the basin locations stand out. At periods of 60 s and
higher, regions of expected thick lithosphere begin to
emerge as regions of faster velocity (i.e. the Tanzania,
Congo, Kaapvaal and Zimbabwe cratons) separated by
slower regions.
1.4.2 Shear Wave Velocity Model
We follow the method of Park et al. (2008) for inverting the
group velocity observations to obtain a quasi-three dimen-
sional shear wave velocity model for the upper mantle. In
this method, we constrain crustal structure based on a priori
information, invert for a one dimensional shear wave velo-
city profile for grid nodes every 0.5�, and apply a Gaussian
weighted smoothing parameter across the one-dimensional
models to create a quasi three-dimensional shear wave
velocity model.
To compute shear wave velocity profiles at each node, we
follow the inversion methodology described by Julia et al.
(2000). This method uses an iterative damped generalized
linear least-squares approach that inverts the data with model
smoothness and weighting parameters to solve for changes to
a starting velocity model. The method was designed to jointly
invert dispersion and receiver function data, and so to apply
this joint inversion method, we designate the weight assigned
to receiver function data to be equal to zero.
The starting model used for the inversions is the IASP91
(Kennett and Engdahl 1991) model. The model parameter-
ization includes 21 layers with a 37-km thick continental
crust. Within the crust, the top ten layers are each 1 km thick,
the next three layers are each 2 km thick, and the bottom four
layers are each 5 km thick. Ten km thick layers are used in
the mantle to a depth of 700 km. In the inversion, velocities
below 200 km depth are fixed to IASP91 (Kennett and
Engdahl 1991) values. We include a 1 km thick layer
above and below the Moho with no vertical smoothing to
constrain the Moho depths, yet still allow large variation in
velocity across the Moho. A linear smoothing parameter is
used to prevent large and unrealistic contrasts in velocity
between adjacent layers, which Rayleigh waves are not
sensitive to. For the ocean basins, the model parameter-
ization is similar to the continent but with the Moho fixed
at a depth of 7 km.
A continental crustal thickness of 37 km was used every-
where because a recent study that compared crustal structure
in eastern Africa to southern and central Africa using
receiver functions found little variability in the thickness of
Precambrian crust, which comprises most of the study region
(Tugume et al. 2012). The average crustal thickness for most
terrains varies between 35 and 40 km, and therefore we used
a mid-range value of 37 km. Because there are no seismic
estimates of crustal thickness for the Congo Basin, we used
our group velocities between periods of 20 and 50 s to see if
there was any evidence for substantial thinning of the crust
under the basin, as argued for by Kadima et al. (2011b).
Figure 1.10 shows a plot of the average group velocity curve
for the regions of the basin where Kadima et al. (2011b)
show crustal thickness on the order of 25–30 km, and syn-
thetic dispersion curves calculated using a model that
contains low velocity sediments in the top 5 km of the
crust, an average crustal Vs of 3.7 km/s and a Moho ranging
from 20 to 40 km depth. The best fit to the data is obtained
for models with a Moho at 35 to 40 km depth. This result
justifies using a crustal thickness beneath the basin that is
8 A. Raveloson et al.

similar to the surrounding Precambrian terranes. It also does
not support the crustal thinningmodel of Kadima et al. (2011b).
To estimate the uncertainties in our velocity model, we
follow the approach developed by Julia et al. (2005) for their
inversion method, which involves repeatedly performing the
inversions using a range of inversion parameters. This may
be viewed as an overly simplistic approach, but it is effective
in developing a sense of the range of variation in the inverted
parameters given the observations and apriori constraints.
As explained by Julia et al. (2000), more sophisticated and
statistically rigorous approaches generally require that the
observations meet desirable properties, such as being nor-
mally distributed, which in general are not satisfied by the
data. By following the approach of Julia et al. (2005), we
obtain an uncertainty of approximately 0.1–0.2 km/s for the
velocity in each model layer.
The results for upper mantle depths of 50 to 90 km are
shown in Fig. 1.11. Shear wave velocity structure is less well
resolved at deeper depths. The shear wave velocity pattern is
similar to the group velocity pattern at periods of 60 s and
higher. There are several areas with faster velocities that
correspond to the Archean cratons (Bomu, Kaapvaal,
Kasai, Ntem, Tanzania, Zimbabwe) with slower velocities
marking Proterozoic mobile belts in between. The mobile
belts that exhibit slower upper mantle velocities include the
Mesoproterozoic Kibaran, Karagwe-Ankole, Irumide and
Southern Irumide Belts and the Neoproterozoic Damara
Belt (Figs. 1.1 and 1.11). The Paleoproterozoic Bangweulu
Block in northern Zambia also has lower upper mantle
velocities than the Archean cratons. Within the Congo
Shield (Fig. 1.1), the fastest velocities are found beneath
the southern and central portions of the Congo Basin. The
regions of fast velocity extending from coastal regions off-
shore Angola, Namibia and South Africa probably result
from smearing of upper mantle structure across the conti-
nent-ocean boundary. In the resolution tests (Fig. 1.10),
checkers in these regions are less well resolved than within
the interior of the continent. Similarly, the region of fast
upper mantle velocities in South Sudan probably results
from structure in that part of the model being less well
resolved than to the south.
1.5 Comparison of Models
We briefly compare the new model of uppermost mantle
structure at 90 km depth (Fig. 1.11) with the model from
Fishwick (2010) at 100 km illustrated in Fig. 1.2. To first
order, the figures show similar structures. In both models the
upper mantle beneath the Congo Shield has faster velocities,
Fig. 1.4 Sample vertical component displacement seismogram for a magnitude 5.5 earthquake recorded on station KMBO shown with several
bandpass filters illustrating the dispersion of the Rayleigh wave. The instrument response has been removed from the seismogram
1 The Upper Mantle Seismic Velocity Structure of South-Central Africa and the. . . 9

Fig. 1.5 Event-station ray paths for 20 s Rayleigh waves. Blue dots show event locations. Station locations are given in Fig. 1.3
Fig. 1.6 Sample group velocity measurement for the Rayleigh wave shown in Fig. 1.4
10 A. Raveloson et al.

and regions of slower velocities are found beneath the Pro-
terozoic mobile belts to the east and south of the Congo
Shield. In both models, the Ntem Craton has slightly slower
upper mantle velocities compared to the Kasai Craton. Both
models also show a region of slightly faster velocities
beneath the northwestern portion of the Congo Basin to the
east and northeast of the Ntem Craton, and a region of slower
mantle velocities beneath the northeastern portion of the
Congo Basin to the south and southwest of the Bomu Craton.
The major differences between the models is that in our
model the southern and central parts of the Congo Basin
have the fastest upper mantle structure, whereas in the
Fishwick (2010) model, the velocities in those regions are
about the same or else slightly slower than beneath the Kasai
Craton and the northwestern part of the basin. These
differences could arise from the different data sets used or
from the different inversion methodologies—the model of
Fishwick (2010) shows the fastest velocities beneath the
central part of the basin at slightly greater depths
(125–200 km). Nevertheless, overall similar structure is
obtained using two different sets of surface wave obser-
vations and modeling approaches, with both models showing
velocities diminishing beneath the northeastern part of the
basin. The significance of this velocity pattern for under-
standing the Precambrian lithospheric structure beneath the
basin is discussed in the next section. We also note that the
region of slower mantle velocities beneath the northeastern
side of the Congo Basin is included within the region of
slower mantle velocities in the Pasyanos and Nyblade (2007)
model (Fig. 1.2), but the region of slower mantle velocities
in that model is significantly larger than in our model or the
Fishwick (2010) model.
1.6 Discussion
The seismic tomography models in Figs. 1.2 and 1.11
showing variations in shear wave velocities beneath the
Congo Basin, as described in the previous section, indicate
that the sub-basin lithospheric mantle may not be uniform,
with the thickest lithosphere under the central and southern
portions of the basin. The models can be used to evaluate
whether or not a Proterozoic mobile belt extends to the NW
beneath the northern portion of the Congo Basin, possibly
representing a collisional zone between an Archean block to
the NE and E, referred to by Master (2004) as the North-East
Congo Craton (labeled the North-East Congo Shield or
NECS in Fig. 1.11f) and an Archean block to the W and
SW, referred to by Master (2004) as the South-West Congo
Craton (labeled the South-West Congo Shield or SWCS in
Fig. 1.11f). The SWCS consists of the Ntem and Angola-
Kasai cratons, and the NECS consists of the Bomu Craton,
the West Nile Complex in South Sudan, the northwestern
Uganda Archean Complex, the Tanzania Craton and the
Paleoproterozoic Bangweulu Block. The Mesoproterozoic
mobile belt that Master (2004) and Gubanov and Mooney
(2009) infer to occur beneath the northern part of the basin is
a continuation of the Mesoproterozoic Kibaran Belt to the
east (recent dating and reinterpretation of the Mesoprotero-
zoic terrains along the eastern boundary of the Congo Basin
defines the northern part of the Kibaran Belt as the Karagwe-
Ankole Belt; e.g.Tack et al. 2010; Fernandez-Alonso et al.
2012).
Regardless of the name or age of the mobile belt, the
mobile belt underlying the northern part of the Congo Basin
in the Master (2004) interpretation formed as a result of the
collision between the SWCS and the NECS. The Karagwe-
Ankole Belt is in contact in the north with the Archaean
granite-greenstone terrains of the Bomu Craton, but the
contact between them is so poorly mapped that it appears
as a blank on the 1: 2 million geological map of Lepersonne
(1974). Structural features visible on satellite imagery and
on radar-based topographic images (e.g. Fernandez-Alonso
et al. 2012) indicate that the northern end of the Karagwe-
Ankole Belt is marked by an east–west trending sinistral
shear zone that disappears under the Congo Basin
(Lepersonne 1978). The structural trends of the mobile belt
curve and change from SW–NE to NW–SE as the shear zone
is approached. In the model of Fernandez-Alonso et al.
(2012), this contact would have resulted from far-field
stresses associated with distant collisions in the East African
Orogen. Master (2004) and Gubanov and Mooney (2009)
suggested that the mobile belt continues to the WNW under
the northeastern part of the Congo Basin. De Wit et al.
(2008) considered this to be a Neoproterozoic mobile belt
separating two Archean blocks, whereas Master (2004) con-
sidered it to be of Mesoproterozoic age, overlain by
Neoproterozoic rocks. Evidence for the possible re-
emergence of the mobile belt to the northwest of the
Congo Basin comes from the “Serie de Liki-Bembe”(Cahen 1954; Lepersonne 1974) rocks (Master 2004).
These rocks disappear to the NW in the poorly exposed
0100020003000400050006000700080009000
10000Sm
ooth
ing
18 20 22 24 26 28 30 32
Traveltime Misfit (s)
060s 090s 100s
Fig. 1.7 Trade-off curves showing smoothing versus travel time misfit
for 60, 90 and 100 s group velocities
1 The Upper Mantle Seismic Velocity Structure of South-Central Africa and the. . . 11

jungles of SE Cameroon and SW Central African Republic.
In southern Cameroon, the ca. 0.6 Ga Yaounde gneisses,
which represent a possible deformed passive margin of the
northern Ntem Craton, have TDM Sm-Nd ages of 1.6–1.0 Ga,
indicating a derivation from Kibaran-aged rocks (Toteu et al.
1994). The Liki-Bembian rocks are overlain by Neoprotero-
zoic Lindian rocks, in the same way that rocks of the classic
Kibaran Belt of eastern Democratic Republic of Congo are
overlain by Neoproterozoic Katangan rocks (Cahen 1954).
10˚ 20˚ 30˚ 40˚ 10˚ 20˚ 30˚ 40˚
10˚ 20˚ 30˚ 40˚ 10˚ 20˚ 30˚ 40˚
10˚ 20˚ 30˚ 40˚ 10˚ 20˚ 30˚ 40˚
−30˚
−20˚
−10˚
0˚
−30˚
−20˚
−10˚
0˚
−30˚
−20˚
−10˚
0˚
−30˚
−20˚
−10˚
0˚
−30˚
−20˚
−10˚
0˚
−30˚
−20˚
−10˚
0˚
20s 40s
60s 80s
100s 4x4
Fig. 1.8 Checkerboard
resolution test results for periods
of 20 to 100 s. Green line showsthe zero thickness contour for the
Mesozoic and Cenozoic
sediments of the Congo Basin.
Lower right panel shows inputchecker model
12 A. Raveloson et al.

−35
−30
−25
−20
−15
−10
−5
0
5
0
20 s 2.5
2.6
2.7
2.8
2.9
3.0
3.1
3.2
3.3
3.4
3.5
3.6
3.7
0
40 s3.0
3.1
3.2
3.3
3.4
3.5
3.6
3.7
3.8
3.9
4.0
4.1
4.2
−35
−30
−25
−20
−15
−10
−5
0
5
0
60 s3.6
3.7
3.8
3.9
4.0
4.1
4.25 10 15 20 25 30 35 40 45 5 10 15 20 25 30 35 40 45
5 10 15 20 25 30 35 40 45 5 10 15 20 25 30 35 40 45
0
80 s3.6
3.7
3.8
3.9
4.0
4.1
4.2
−35
−30
−25
−20
−15
−10
−5
0
5
5 10 15 20 25 30 35 40 45
0
100 s3.6
3.7
3.8
3.9
4.0
4.1
4.2
km/s
Fig. 1.9 Group velocities for fundamental mode Rayleigh waves at
periods of 20–100 s. The solid red lines show Archean cratons, the
dashed red line shows the outline of the greater Congo Shield, the blue
line shows the zero thickness contour for the Mesozoic and Cenozoic
sediments of the Congo Basin, and the white lines show rift faults as
described in Fig. 1.1
1 The Upper Mantle Seismic Velocity Structure of South-Central Africa and the. . . 13

The proposal that a mobile belt may extend beneath the
northern part of the Congo Basin has important implications
for the origin of the basin, as discussed below. Many
geodynamic models invoking density contrasts within or
below the mantle lithosphere (e.g. Hartley and Allen 1994;
Downey and Gurnis 2009; Crosby et al. 2010; Forte et al.
2010) assume a uniformly thick cratonic lithosphere beneath
the basin. If the northern portion of the Congo Basin is
underlain by Proterozoic lithosphere and is surrounded by
Archean lithosphere to the east, south and north, then there
could exist substantial heterogeneity in lithospheric thick-
ness across the region. Continental-scale tomographic
models typically have lateral resolution of no better than
300–500 km at upper mantle depths > 100 km, and there-
fore variations in lithospheric thickness associated with a
Proterozoic mobile belt under the northern part of the Congo
Basin may not be resolved in those models.
A second geodynamic implication of the proposal that
Proterozoic lithosphere lies beneath the northern part of the
Congo Basin concerns the Neoproterozoic rifting event that
may have initiated basin subsidence. The location of the rifts
are shown in Fig. 1.11 and are found in the region of our
velocity model where the velocities begin to change from
faster to slower values going from the center of the basin
towards the northeast. The rifts may have formed along the
northern border of the SWCS, as opposed to within the
middle of a single large Archean craton, alleviating the
need to explain why a Neoproterozoic rift would form in
the interior of an Archean craton (Fig. 1.11f). Within both
the Cenozoic East African rift system and the NE Karoo rift
system there are good examples of rift basins forming along
the margins of thick Archean lithosphere. For example, in
northern and western Tanzania, the margin of the Tanzania
Craton is fractured by many Cenozoic rift faults, and a
number of half-graben basins have formed (i.e. Lake
Manyara, Lake Eyasi basins). From the Carboniferous-
Triassic Karoo system, a good example is the Zambezi rift
that formed along the northern margin of the Zimbabwe
Craton. These rifts provide plausible analogs for understand-
ing the development of a Neoproterozoic rift under the
Congo Basin within a region of cratonic lithosphere.
The tomographic models in Figs. 1.2 and 1.11 are consis-
tent with the existence of Proterozoic lithosphere beneath the
northeastern side of the Congo Basin, where lower velocities
can be seen in the 50–100 km depth interval. However, the
models do not support the proposal that Proterozoic litho-
sphere extends beneath the entire northern portion of the
basin. In Figs. 1.2 and 1.11, there is a region of faster
velocities beneath the northwestern side of the basin,
suggesting that the lithosphere there may be cratonic.
Hence, while Proterozoic lithosphere likely extends to the
NW under the northeastern side of the basin, it probably does
not extend all the way across the basin to southern
Cameroon.
2.0
2.2
2.4
2.6
2.8
3.0
3.2
3.4
3.6
3.8
4.0
4.2
4.4
4.6
4.8
5.0
Gro
up V
eloc
ity(k
m/s
)
10 20 30 40 50 60 70
Period(s)
Syn: 20 kmSyn: 22 kmSyn: 25 kmSyn: 27 kmSyn: 30 kmSyn: 32 kmSyn: 35 kmSyn: 37 kmSyn: 40 kmdata
Fig. 1.10 Group velocity curves
for crustal structure for the
portions of the Congo Basin
where crustal thinning may exist
(Kadima et al. 2011b). The blackline shows the average groupvelocities from our model for the
region of thin crust according to
Kadima et al. (2011b). The
colored lines show synthetic
curves for crustal models with the
Moho at the depths noted on each
curve
14 A. Raveloson et al.

−35
−30
−25
−20
−15
−10
−5
0
5
5 10 15 20 25 30 35 40 45
0
−50 km −35
−30
−25
−20
−15
−10
−5
0
5
5 10 15 20 25 30 35 40 45
0−60 km
−35
−30
−25
−20
−15
−10
−5
0
5
5 10 15 20 25 30 35 40 450
−70 km −35
−30
−25
−20
−15
−10
−5
0
5
5 10 15 20 25 30 35 40 45
0
−80 km
−35
−30
−25
−20
−15
−10
−5
0
5
5 10 15 20 25 30 35 40 45
0
−90 km4.2
4.3
4.4
4.5
4.6
4.7
4.8
5 10 15 20 25 30 35 40 45
−35
−30
−25
−20
−15
−10
−5
0
5NECS
SWCS
a b
c
e
d
f
Vs (k
m/s
)
Fig. 1.11 (a–e) Shear wave velocities at depths of 50, 60, 70, 80 and
90 km. Solid red lines show Archean cratons, dashed red line shows theoutline of the greater Congo Shield, the solid white line shows the zerothickness contour for the Mesozoic and Cenozoic sediments of the
Congo Basin and dashed white lines show rift faults as described in
Fig. 1.1. (f) Red and white lines are the same as in figures a–e, and the
bold, black lines show the SWCS and NECS proposed by Master
(2004)
1 The Upper Mantle Seismic Velocity Structure of South-Central Africa and the. . . 15

The difference in shear wave velocity in the uppermost
parts of the mantle between Archean and Proterozoic litho-
sphere upon which this interpretation is based is not neces-
sarily well understood. It is also noted that at the depths of
interest (i.e. 50–100 km) the Proterozoic mobile belts to the
south of the Congo Shield are characterized by slower
velocities than beneath the Archean cratons (Figs. 1.2 and
1.11). This pattern of slower shear wave velocities in the
uppermost part of the mantle beneath Proterozoic terrains is
a common feature of many tomographic images from Pre-
cambrian shields, although not all (Darbyshire and Eaton
2010).
Lastly, it is of interest to compare the Precambrian litho-
spheric architecture for the Congo Basin with the
Neoproterozoic Central super-basin of Australia (e.g. Walter
et al. 1995), which also formed in a region where several
Archean cratons amalgamated in the Proterozoic (e.g. Betts
and Giles 2006; Cawood and Korsch 2008) and where there
has since been a prolonged history of deformation. Similar
upper mantle structure is found beneath and surrounding this
basin; at 75 km depth slow velocities are observed beneath
the Proterozoic central region, while faster velocities are
observed beneath the Archean cratons themselves. By
125 km depth, fast velocities are observed beneath most of
the Precambrian Shield (e.g. Kaiho and Kennett 2000;
Fishwick and Reading 2008). The similarity in lithospheric
structure beneath the Congo Basin and central Australia
suggests that the slower uppermost mantle wave speeds
may reflect similar processes involved in the amalgamation
and subsequent deformation of these regions.
Summary and Conclusions
A new shear wave velocity model of the upper mantle for
central and southern Africa developed using an inversion
of group velocity measurements from fundamental mode
Rayleigh waves has been presented. The model shows
several areas with faster velocities that correspond to
Archean cratons (Bomu, Kaapvaal, Kasai, Ntem,
Tanzanian, Zimbabwean), and areas of slower velocities
marking Proterozoic mobile belts in between. The mobile
belts that exhibit slower upper mantle velocities include
the Mesoproterozoic Kibaran, Karagwe-Ankole, Irumide
and Southern Irumide Belts, and the Neoproterozoic
Damara Belt. The Paleoproterozoic Bangweulu Block in
northern Zambia also has slower upper mantle velocities
than the Archean cratons. Within the Congo Shield, the
fastest velocities are found beneath the southern and
central portions of the Congo Basin. The depth resolution
of the models precludes estimating the thickness of the
lithosphere.
Our model compares favorably with the tomographic
model from Fishwick (2010), which is representative of a
range of tomographic models using Rayleigh wave phase
velocities. In both models a region of slower mantle
velocities is found beneath the northeastern portion of
the Congo Basin to the south and southwest of the
Bomu Craton. This region of slower mantle velocities
does not continue beneath the northwestern part of the
Congo Basin.
This finding suggests that the lithospheric mantle
beneath the Congo Basin may not be uniform, and that
Proterozoic lithosphere may lie beneath the northeastern
side of the basin. However, it does not support the exten-
sion of Proterozoic lithosphere beneath the entire north-
ern portion of the basin. Many geodynamic models
invoking density contrasts within or below the mantle
lithosphere assume a uniformly thick cratonic lithosphere
beneath the basin. If the northeastern portion of the
Congo Basin is underlain by Proterozoic lithosphere,
then there could exist heterogeneity in lithospheric thick-
ness across the region. A second geodynamic implication
concerns the Neoproterozoic rifting event that may have
initiated basin subsidence. The proposed location of the
rifts are in the region of our velocity model where the
velocities begin to change from faster to slower values
going from the center of the basin toward the northeast.
We suggest that the rifts may have formed along the
northeastern border of a southwestern Congo shield
(SWCS), as defined by Master (2004), as opposed to
within the middle of a greater Congo Craton, alleviating
the need to explain why a Neoproterozoic rift might form
in the interior of a large Archean Craton.
Acknowledgement We thank Maarten J. de Wit and an anonymous
reviewer for helpful comments. This study has been funded by the
National Science Foundation (Grants OISE-0530062, EAR-0440032,
EAR-0824781).
References
Ammon CJ (1998) Note on seismic surface wave processing. Part I.
Group velocity estimation, http://eqseis.geosc.psu.edu/~cammon/
Bassin C, Laske G, Masters G, Eos T (2000) The current limits of
resolution for surface wave tomography in North America.
Am Geophys Union 81:F897
Betts PG, Giles D (2006) The 1800–1100 Ma tectonic evolution of
Australia. Precambrian Res 144:92–125
Braitenberg C, Ebbing J (2009) The GRACE-satellite gravity and geoid
fields in analyzing large-scale cratonic or intracratonic basins.
Geophys Prospect 57:559–571. doi:10.1111/j.1365-2478.2009.
00793.x
Buiter SJH, Steinberger B, Medvedev S, Tetreault J (2012) Could the
mantle have caused subsidence of the Congo Basin?Tectonophysics
514-517, 62-80.. doi:10.1016/j.tecto.2011.09.024
Cahen L (1954) Geologie du Congo belge. Vaillant-Caramanne, Liege,
p 577
Cawood PA, Korsch RJ (2008) Assembling Australia: Proterozoic
building of a continent. Precambrian Res 166:1–38
16 A. Raveloson et al.

Crosby AG, Fishwick S, White N (2010) Structure and evolution of the
intracratonic Congo Basin. Geochem Geophys Geosyst. 11:
Q06010. doi: 10.1029/2009GC003014
Daly MC, Lawrence SR, Diemu-Tshiband K, Matouana B (1992)
Tectonic evolution of the Cuvette Centrale, Zaire. J Geol Soc
London 149:539–546
Darbyshire F, Eaton D (2010) The lithospheric root beneath Hudson
Bay, Canada from Rayleigh wave dispersion: no clear seismo-
logical distinction between Archean and Proterozoic mantle. Lithos
120:144–159. doi:10.1016/j.lithos.2010.04.010
De Wit M, Stankiewicz J, Reeves C (2008) Restoring Pan-African-
Brasiliano connections: more Gondwana control, less Trans-
Atlantic corruption. In: Pankhurst RJ, Trouw R AJ, Brito neves
BB, de wit MJ (eds) West Gondwana: pre-cenozoic correlations
across the South Atlantic Region, vol 294. Geological Society,
London, Special Publications, pp 399–412. doi: 10.1144/SP294.20
Downey NJ, Gurnis M (2009) Instantaneous dynamics of the cratonic
Congo basin. J Geophys Res 114, B06401. doi:10.1029/
2008JB006066
Dziewonski AM, Bloch S, Landisman M (1969) A technique for the
analysis of transient seismic signals. B Seismol Soc Am 59:
427–444
Fernandez-Alonso M, Cutten H, DeWaele B, Tack L, Tahon A, Baudet
D, Barritt SD (2012) The Mesoproterozoic Karagwe-Ankole Belt
(formerly the NE Kibara Belt): The result of prolonged extensional
intracratonic basin development punctuated by two short-lived far-
field compressional events. Precambrian Res 216–219:63–86
Fishwick S (2010) Surface wave tomography: imaging of the litho-
sphere asthenosphere boundary beneath central and southern
Africa. Lithos 120:63–73
Fishwick S, Bastow ID (2011) Towards a better understanding of
African topography: a review of passive-source seismic studies of
the African crust and upper mantle. In: Van Hinsbergen DJJ, Buiter
SJH, Torsvik TH, Gaina C, Webb SJ (eds) The formation and
evolution of Africa: a synopsis of 3.8 Ga of Earth history. Geologi-
cal Society, London, pp 343–371. doi:10.1144/SP357.19, Special
Publications
Fishwick S, Reading AM (2008) Anomalous lithosphere beneath the
Proterozoic of western and central Australia: a record of continental
collision and intraplate deformation? Precambrian Res 166:
111–121
Forte AM, Quere S, Moucha R, Simmons NA, Grand SP, Mitrovica JX,
Rowley DB (2010) Joint seismic-geodynamic-mineral physical
modelling of African geodynamics: a reconciliation of deep-mantle
convection with surface geophysical constraints. Earth Planet Sci
Lett. doi:10.1016/j.epsl.2010.03.017
Gubanov AP, Mooney WD (2009) New global geological maps of
crustal basement age. Eos transactions, AGU, 90, Fall Meet.Suppl.
Abstract T53B-1583
Hartley R, Allen PA (1994) Interior cratonic basins of Africa: Relation
to continental break-up and role of mantle convection. Basin Res
6:95–113
Hartley R, Watts AB, Fairhead JD (1996) Isostacy of Africa.
Earth Planet Sci Lett 137:1–18
Herrmann RB (1973) Some aspects of band-pass filtering of surface
waves. B Seismol Soc Am 63:663–671
Julia J, Ammon CJ, Herrmann RB, Correig AM (2000) Joint inversion
of receiver functions and surface-wave dispersion observations.
Geophys J Int 143:99–112
Julia J, Ammon CJ, Nyblade AA (2005) Evidence for mafic lower crust
in Tanzania, East Africa, from joint inversion of receiver functions
and Rayleigh wave dispersion velocities. Geophys J Int 162:
555–569
Kadima E, Delvaux D, Sebagenzi SN, Tackw L, Kabeyaz SM (2011a)
Structure and geological history of the Congo Basin: an integrated
interpretation of gravity, magnetic and reflection seismic data.
Basin Res 23:499–527. doi:10.1111/j.1365-2117.2011.00500
Kadima EK, Sebagenzi SMN, Lucazeau F (2011b) A Proterozoic-rift
origin for the structure and the evolution of the cratonic Congo
basin. Earth Planet Sci Lett. doi: 10.1016/j.epsl.2011.01.037
Kaiho Y, Kennett BLN (2000) Three-dimensional seismic structure
beneath the Australian region from refracted wave observations.
Geophys J Int 142:651–668
Kennett BLN, Engdahl ER (1991) Traveltimes for global earthquake
location and phase identification. Geophys J Int 122:429–465
Lawrence SR, Makazu MM (1988) Zaire’s Central Basin: Prospectivityoutlook. Oil Gas J 86:105–108
Lepersonne J (1974) Map and Notice explicative de la carte geologique
du Zaıre au 1/2 000 000.Direction de la Geologie, Dept. des Mines,
Rep.du Zaıre, 67 pp
Lepersonne J (1978) Stucturegeologique du basin interieur du Zaire,
Academie Royale des Sciences d’Outre-Mer, Bruxelles, Classe des
Sciences Naturelles et Medicales, N.N. XX(2), 1–27
Linol B (2013) Sedimentology and sequence stratigraphy of the Congo
and Kalahari Basins of south-central Africa and their evolution
during the formation and break-up of West Gondwana. PhD thesis,
Nelson Mandela Metropolitan University, 375p
Master S (2004) Archean to Neoproterozoic assembly and growth of
the Greater Congo Craton. In: Geoscience Africa 2004 Conference,
Abstract Volume 2, University of the Witwatersrand, Johannesburg,
12–16 July, 2004, 425–426
Moloto-A-Kanguemba GR, Trindade RIF, Monie P, Nedelec A,
Siqueira R (2008) A late Neoproterozoic paleomagnetic pole for
the Congo craton: Tectonic setting, paleomagnetism and geochrono-
logy of the Nola dike swarm (Central African Republic). Pre-
cambrian Res 164:214–226
Mulibo G, Nyblade A (2013) The P and S wave velocity structure of the
mantle beneatheastern Africa and theAfrican superplume anomaly.
Geochem Geophys Geosyst. doi:10.1002/ggge.20150
Nataf HC, Ricard Y (1996) 3SMAC: an a priori tomographic model of
the upper mantle based on geophysical modeling. Phys Earth Planet
Int 95:101–122
Paige C, Saunders M (1982) LSQR: an algorithm for sparse linear
equations and sparse least squares. ACMTrans Math Softw 8:43–71
Park Y, Nyblade AA, Rodgers AJ, Al-Amri A (2008) S wave velocity
structure of the Arabian Shield upper mantle from Rayleigh wave
tomography. Geochem Geophys Geosyst 9, Q07020. doi:10.1029/
2007GC001895
Pasyanos ME (2010) Lithospheric thickness modeled from long-period
surface wave dispersion. Tectonophysics 481:38–50. doi:10.1016/j.
tecto.2009.02.023
Pasyanos ME, Nyblade A (2007) A top to bottom lithospheric study of
Africa and Arabia. Tectonophysics. 444: 27–44.
Priestley K, McKenzie D (2013) The relationship between shear wave
velocity, temperature, attenuation and viscosity in the shallow part
of the mantle. Earth Planet Sci Lett 831:78–91. doi:10.1016/j.epsl.
2013.08.022
Priestley K, McKenzie D, Debayle E, Pilidou S (2008) The African
upper mantle and its relationship to tectonics and surface geology.
Geophys J Int 175:1108–1126
Ritsema J, van Heijst H (2000) New seismic model of the upper mantle
beneath Africa. Geology 28:63–66
Sebai A, Stutzmann E, Montagner J-P, Sicilia D, Beucler E (2006)
Anisotropic structure of the African upper mantle from Rayleigh
and Love wave tomography. Phys Earth Planet Int 155:48–62
Tack L, Wingate MTD, De Waele B, Meert J, Belousova E, Griffin B,
Tahon A, Fernandez-Alonso M (2010) The 1375Ma “Kibaranevent” in Central Africa: Prominent emplacement of bimodal
magmatism under extensional regime. Precambrian Res 180:
63–84. doi:10.1016/j.precamres.2010.02.022
1 The Upper Mantle Seismic Velocity Structure of South-Central Africa and the. . . 17

Toteu SF, van Schmus WR, Penaye J, Nyobe JB (1994) U-Pb and Sm-
Nd evidence for Eburnian and Pan-African high-grade meta-
morphism in cratonic rocks of southern Cameroon. Precambrian
Res 67:321–347
Tugume F, Nyblade A, Julia J (2012) Moho depths and Poisson’s ratiosof Precambrian crust in East Africa: Evidence for similarities in
Archean and Proterozoic crustal structure. Earth Planet Sci Lett
355–356:73–81. doi:10.1016/j.epsl.2012.08.041
Vicat J-P, Pouclet A, Nkoumbou C, Mounague AS (1997) Le volcanis-
mefissuralneoproterozoıque des series du Djainferieur, de
Yokadouma (Cameroun) et de Nola (RCA)- Signification
geotectonique. CR Acad Sci, Paris, Sci de la terreet des planetes
325:671–677
Walter MR, Veevers JJ, Calver CR, Grey K (1995) Neoproterozoic
stratigraphy of the CentralianSuperbasin, Australia. Precambrian
Res 73:173–195
18 A. Raveloson et al.