THE UNIVERSITY OF THE WITWATERSRAND DIVISION OF ...
53
THE UNIVERSITY OF THE WITWATERSRAND SCHOOL OF ORAL HEALTH SCIENCES DEPARTMENT OF ORTHODONTICS AND PAEDIATRIC DENTISTRY DIVISION OF ORTHODONTICS LONGITUDINAL ASSESSMENT OF THE Z-ANGLE A RESEARCH PROJECT SUBMITTED TO THE POSTGRADUATE COMMITTEE in partial fulfilment of the requirements for the degree of MASTER OF DENTISTRY in the branch of ORTHODONTICS BY MUHAMMED KAKA, BDS Johannesburg, South Africa
Transcript of THE UNIVERSITY OF THE WITWATERSRAND DIVISION OF ...

THE UNIVERSITY OF THE WITWATERSRAND
SCHOOL OF ORAL HEALTH SCIENCES
DEPARTMENT OF ORTHODONTICS AND PAEDIATRIC DENTISTRY
DIVISION OF ORTHODONTICS
LONGITUDINAL ASSESSMENT OF THE Z-ANGLE
A RESEARCH PROJECT SUBMITTED TO THE POSTGRADUATE COMMITTEE
in partial fulfilment of the requirements for the degree of
MASTER OF DENTISTRY
in the branch of
ORTHODONTICS
BY MUHAMMED KAKA, BDS
Johannesburg, South Africa

COPYRIGHT
by
Muhammed Kaka, BDS
December 8, 2016

i
Declaration I, Muhammed Kaka, declare that this research report is my own work. It is being submitted
in partial fulfilment of the requirements for the degree of Master of Dentistry at the
University of the Witwatersrand, Johannesburg. It has not been submitted before for any
degree or examination at this or any other University.

ii
DEDICATION
This Research Report is dedicated to my family: my parents, Goolam and Fazela who
have supported me throughout my entire life and career and whose sacrifices have
brought me to where I am today. My loving and supportive wife Tasneem, who has
patiently stood by me and encouraged me to achieve this great milestone in my career. My
children, Khalid and Nooh who are the coolness of my eyes and a source of great joy and
happiness.

iii
ACKNOWLEDGEMENTS
I am deeply indebted to all those who contributed to this project in any form, allowing me
to accomplish a task that I could not have completed without their help.
Professor T.C. Dandajena – my supervisor, teacher, mentor and counsellor. I am most
appreciative to him for all the patience and effort he has put into my training. He has
created a teaching environment where ideas are shared, thinking is encouraged and
opinions are respected. He is a gifted teacher who inspires and encourages students
without offence or harshness, and nurtures a student like a parent would a growing child.
He is a man of integrity and great value and I am forever grateful that he joined our
programme and gave us a residency second to none. I am forever and deeply indebted to
him for all he has done for me.
Professor W.G. Evans – my co-supervisor, instructor, teacher and well-wisher. His
enthusiasm and love for orthodontics have been a great source of inspiration. He is a
wealth of knowledge, in both orthodontics and beyond, and has taught me so graciously
from my days as an undergraduate student, through my days as a supervisor in his clinic
and now through these last four years as a post-graduate. He is a man of immeasurably
good character and has taught me the value and importance of life and virtue beyond
orthodontics.
Professor P. Hlongwa – my co-supervisor, teacher and preceptor. Her continuous help,
advice and interest shown in the progress of my studies, both in the clinic and didactically
is acknowledged and highly appreciated.
Prof James McNamarra Jr and Prof Sunil Kapila and their team at the Dept of
Orthodontics, School of Dentistry, University of Michigan, Ann Arbor , USA for kindly
hosting me and facilitating the use of the University’s collection of growth data. Their
unselfish attitude in allowing me access to their material and the lengths to which they
went to make my stay there easier was most kind. Their assistance with the data itself, the
equipment and resources was invaluable and is sincerely acknowledged.

iv
University of the Witwatersrand Health Science Research Office; and the South African
Society of Orthodontists’ Gerald Gavron Fund for financial assistance. Their generous
sponsorship allowed me to travel to the USA in order to undertake this study and to
complete my research.
The American Association of Orthodontics Fund’s (AAOF) Craniofacial Growth Legacy
Collection for making available and easily accessible longitudinal craniofacial growth
records. These electronic records have been painstakingly put together into an amazing
database, which made my study so much easier and convenient. This project is of great
benefit to orthodontic science and their openness and willingness to share this information
is much appreciated.
Etienne Pitout and Lerato Moshaoa: I have been so fortunate to be part of a wonderful
group of co-registrars and to share these experiences with colleagues who have become
life-long friends. I sincerely believe that I could not have done this alone and their
company was invaluable. I wish them all the best in their futures.
My parents Goolam and Fazela Kaka: they have done everything for me that I could ever
wish for. Their sacrifices to ensure that their children would have a better life and an
excellent education was most selfless and I am forever indebted to them. They have
supported me throughout my life and gone far beyond the call of duty to ensure my
success. Their hands and their encouragement have been most vital to my success.
Without them, none of this would have been remotely possible.
My darling wife Tasneem: for all her encouragement and support over my entire career
with overwhelming love and total devotion. She has assisted me and stood by me through
the most difficult and challenging times, aided me through the long days and nights of
registrarship, and supported me every step of the way. She has been the greatest source
of comfort I could wish for. I thank her for her patience and understanding throughout my

v
studies, and for raising our two sons into the wonderful little boys that they are today. I am
extremely lucky to have her in my life and would not have reached where I am today
without having her by my side.
vi
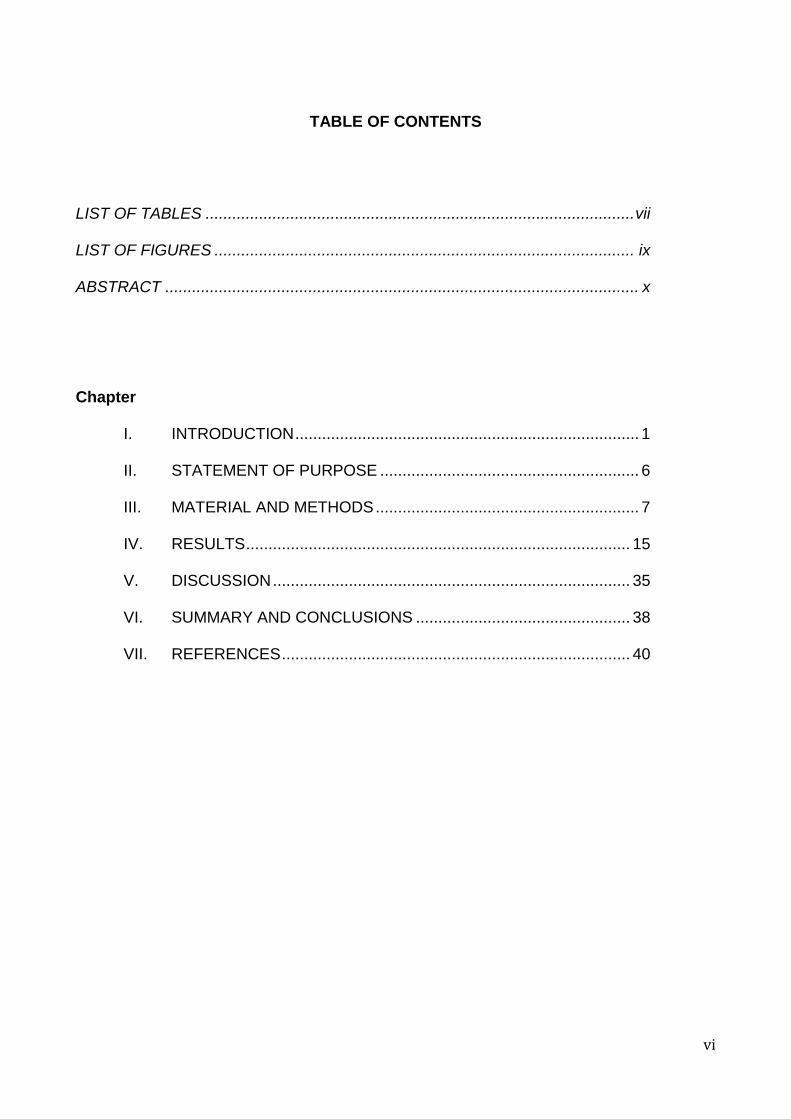
TABLE OF CONTENTS
LIST OF TABLES ................................................................................................ vii
LIST OF FIGURES .............................................................................................. ix
ABSTRACT .......................................................................................................... x
Chapter
I. INTRODUCTION ............................................................................. 1
II. STATEMENT OF PURPOSE .......................................................... 6
III. MATERIAL AND METHODS ........................................................... 7
IV. RESULTS ...................................................................................... 15
V. DISCUSSION ................................................................................ 35
VI. SUMMARY AND CONCLUSIONS ................................................ 38
VII. REFERENCES .............................................................................. 40
vii
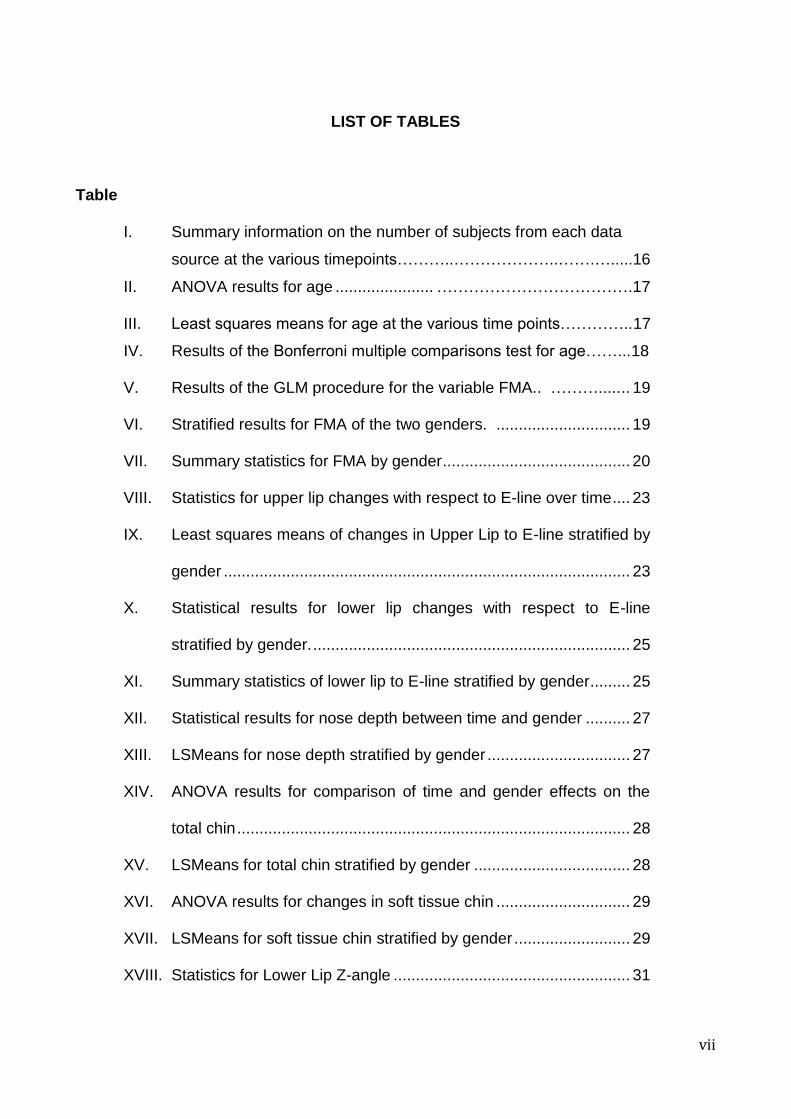
LIST OF TABLES
Table
I. Summary information on the number of subjects from each data
source at the various timepoints………..………………..…….….....16
II. ANOVA results for age ...................... ……………………………….17
III. Least squares means for age at the various time points…………..17
IV. Results of the Bonferroni multiple comparisons test for age……...18
V. Results of the GLM procedure for the variable FMA.. ………..... .. 19
VI. Stratified results for FMA of the two genders. .............................. 19
VII. Summary statistics for FMA by gender .......................................... 20
VIII. Statistics for upper lip changes with respect to E-line over time .... 23
IX. Least squares means of changes in Upper Lip to E-line stratified by
gender ........................................................................................... 23
X. Statistical results for lower lip changes with respect to E-line
stratified by gender. ....................................................................... 25
XI. Summary statistics of lower lip to E-line stratified by gender ......... 25
XII. Statistical results for nose depth between time and gender .......... 27
XIII. LSMeans for nose depth stratified by gender ................................ 27
XIV. ANOVA results for comparison of time and gender effects on the
total chin ........................................................................................ 28
XV. LSMeans for total chin stratified by gender ................................... 28
XVI. ANOVA results for changes in soft tissue chin .............................. 29
XVII. LSMeans for soft tissue chin stratified by gender .......................... 29
XVIII. Statistics for Lower Lip Z-angle ..................................................... 31

viii
XIX. LSMeans of the LLZ from T1 to T5 ................................................ 31
XX. ANOVA results for upper lip z-angle (ULZ) ................................... 32
XXI. Summary statistics of the upper lip Z-angle (ULZ) from T1 to T5 .. 32
XXII. Summary statistics for diffZ .......................................................... 33
XXIII. LSMeans for diffz from T1 to T5 for both genders combined ....... 33
XXIV. Summary of changes in the Z-angle. ............................................. 34
ix
LIST OF FIGURES
FIGURE
1. The Z-angle as described by Merrifield ………................................ 3
2. Cephalometric landmarks utilised in this study ................................ 9
3. Cephalometric planes utilised in this study .................................... 11
4. Upper and Lower Z-Angle ............................................................ 13
5. Changes in FMA over time for males and females………………...21
6. Changes in upper lip to E-line from T1 to T5 for males and females
………………………… ............................................................... ...24
7. Changes in lower lip to E-line from T1 to T5 for males and
females…………………………………………………………..…. ….26
8. Changes in nose depth for males and females from T1 to T5… . ..27
9. Plot of changes in total chin over time for males and females… …28
10. Changes in soft tissue chin from T1 to T5 ................................... ..29
11. Changes in the lower lip Z-angle for males and females……… …31
12. Changes in the upper lip Z-angle (ULZ) over time for males and
females… .................................................................................. …32
13. Changes in the diffz for males and females…………………… . ….33
x
ABSTRACT
Background: Several analytical soft-tissue reference lines have been derived to aid in
orthodontic treatment planning. One of these is the Z-angle (Merrifield), which is a
measure of the most protrusive lip to Frankfort horizontal. While there is multitude of
information on the changes in the soft tissue of the lips, nose and chin, little is available on
the longitudinal changes associated with the Z-angle.
Objective: To assess the longitudinal changes in the Z-angle from six to 18 years of age.
Methods: Records of 50 subjects were selected from the Denver and Michigan growth
data based on Class I occlusion and good radiographs. Due to poor quality radiographs,
the final sample was narrowed down to 34 subjects (17 male and 17 female). Five time
points were evaluated: six, nine, 12, 15 and 18 years of age. Primary variables: Upper lip
Z-angle (ULZ) and Lower lip Z-angle (LLZ). A 3rd variable was created from the first two,
diffz as the difference between ULZ and LLZ. Other measurements included Total Chin
thickness (TotChin) and upper (ULE) and lower (LLE) lip positions with respect to the E-
line. General linear models (GLM) in SAS were used to assess interaction between time
and gender and determine differences over time (α=0.05).
Results: GLM revealed no interaction between gender and time (p>0.05) for all variables
except for TotChin. Diffz changed non-significantly from six to 18 years of age. However,
both Z-angles increased over time and so did TotChin. ULE and LLE became more
negative.
Conclusion: The Z-angle became more positive from childhood to adolescence. This was
partly due to an increase in TotChin and a decrease in lip protrusion (ULE, LLE). diffz
increased but non-significantly, which meant the upper lip became more retrusive
compared to the lower lip.

1
CHAPTER I
INTRODUCTION AND LITERATURE REVIEW
Facial harmony and balance among the anatomical structures of the face such as
the lips, nose, chin and the supporting skeletal components, are recognised as important
contributors to the goals of orthodontic treatment. In order for orthodontists to analyse
these features and to accomplish the desired treatment goals, a comprehensive
understanding of the normal growth process is crucial (Meng et al., 1998). There are
differences in the growth patterns of the hard and soft tissues of the face. Orthodontic
treatment can alter both.
Considerable cephalometric research has been conducted to determine desired
and appropriate soft tissue profiles as well as establish normative values for different
groups of people (Ricketts, 1957, Steiner, 1960, Merrifield, 1966, Burstone,
1976,Holdaway, 1983). However, there does not appear to be particular agreement on the
best method (Bishara, 1985). It is well accepted that the proportions of the soft tissues are
constantly transforming in the growing child. These must be taken into account when
determining the norms, especially for growing children.
Steiner defined what he called the ‘S-line’ as a plane that connected soft tissue
pogonion to the centre of the lower border of the nose, a point half-way between
subnasale and pronasale. He declared that in aesthetically pleasing and finely
proportioned faces both the upper and lower lips would contact this plane (Steiner, 1960).
However, we are unsure of the validity of this claim, since Steiner’s sample size was
poorly documented. It may therefore not be a good reflection of the Caucasian population
from which it was obtained.
Ricketts (Ricketts, 1957) identified the E-line as a plane that connected the soft
tissue chin (soft tissue pogonion) with pronasale. According to Ricketts, the lips should lie
behind the E-line with the upper placed 4mm and the lower 2mm behind the E-line.

2
However, this does not take into account the natural growth-related changes of the soft
tissue profile.
Burstone (1976) illustrated the B-line as a plane that connected soft tissue
pogonion to subnasale. He concluded that in ideal conditions the upper lip should lie
ahead of this “B-Line” by 3.5mm and the lower by 2.2 mm. Burstone’s norm values were
derived from a sample of 40 adult subjects who were selected by three artists at the
Herron Institute of Art in Indianapolis, and were designed for surgical purposes. The mean
age of the subjects used to derive the normative values was 23.8 years (Burstone, 1976).
Therefore, this analysis cannot be applied to the growing child, but is perhaps more
suitable for adults and especially when planning orthognathic surgery.
Holdaway (1983) proposed the Harmony line i.e. H-line, as a plane that ran tangent
to soft tissue pogonion and the upper lip. He described an H-angle as the angle formed
between the H-Line and the plane from soft tissue pogonion to soft tissue nasion.
Holdaway (1983) stated that an H- angle of 10° was ideal.
Merrifield (1966) further defined the Profile Line as a plane connecting the soft
tissue chin at Pog’ to the most protrusive lip. The inside inferior angle formed between this
‘Profile Line’ and the Frankfort horizontal plane is described as the Z-angle (Merrifield,
1966) and is a soft tissue angular measurement designed to evaluate facial aesthetics
(Figure 1). The average Z-angle in adults is 82° (± 5°), and in children the normal Z-angle
would be 78°. These values were derived from the examination of 40 untreated subjects,
40 completed cases treated by Dr. Charles Tweed and 40 patients treated to completion
by Merrifield himself (Merrifield, 1966).
Of all the measurements previously described, the Z-angle probably provides the
most accurate description of the soft tissue profile as it is not dependant upon the nose but
that of the chin and the lip itself. The chin is a major determinant of the profile and has
been utilized in growth prediction and placement of the teeth (Aki, 1994).

3
Figure 1. The Z-angle as described by Merrifield (1966)
4
Subtelny (1959) reported from his longitudinal studies on facial features and profiles
that the lips increase in both length and thickness until around the age of 15 years, after
which time a constant vertical relationship is maintained. Forsberg and Odenrick (1979)
evaluated the age- related changes of 120 Swedish children with normal occlusion at 8, 12
and 25 years of age. This study revealed significant changes with increasing age, as well
as gender-related differences within the age groups. At the age of 12 the boys’ lower lip
was on the E-line whereas in girls the lower lip was approximately (-)2mm behind the E-
line. At the final time-point (age 25) this value had decreased in males by (-)4mm and
females by only (-)1,5mm. The study, however, was cross-sectional and may not generally
be applicable as it does not account for individual variation.
Bishara, Hession and Peterson (1985) used cephalometric radiographs to evaluate
longitudinal soft tissue profile changes by way of some commonly used soft tissue facial
analyses, including the E-line, Holdaway’s soft-tissue angle, and the Z-angle. They
concluded that male and female growth-related changes were significantly different when
assessed by the various analyses. They also reported that the Z-angle, angles of facial
convexity and the Holdaway soft-tissue angles do not perform in a similar manner over
time. Their recorded Z-angles were generally lower than those reported by Merrifield.
These findings suggest that because most of these analyses reflect differing patterns over
time, the established adult standards may not be applicable across all ages and could also
be gender-specific.
Nanda et al. (1989) concluded that there was significant soft tissue facial change in
males and females between the ages of seven and 18 years, expressed differentially
between the two genders. Specifically, the upper lip, lower lip, nose and chin all increased
over time. While the growth in females was only 2.65 mm for both lips combined, in men it
was found to be as much as 6.9 mm (in a horizontal direction). Similarly Nanda et al.
(1990) concluded that the vertical growth of the upper lip was completed by age 15 for
both males and females, whereas the lower lip showed continued vertical growth and an
increase in thickness past the ages of 15 for girls and 18 for boys. Formby, Nanda and
Currier (1994) reported that the lip thickness at labrale superius and labrale inferius

5
decreased, and these growth changes had the resultant effect of causing the lips to
retrude with advancing age.
The longitudinal study by Blanchette et al. (1996) involving subjects with long and
short faces from the Denver Growth Data, showed significant differences between men
and women. Overall, boys exhibited continuous growth over the age of 17 as opposed to
girls who achieved their adult soft tissue size at around the age of 14. Vahdettin and Altug
(2012) arrived at similar conclusions, reporting in their study that the males showed more
soft tissue changes than the females post-pubertal, whereas in the females most growth
occurred between the pre-pubertal and pubertal growth periods.
Iwasawa, Moro and Nakamura (1997) used the Z-angle to assess facial aesthetics
in Japanese subjects between the ages of 19 and 24 years. The researchers found that
the normal Z-angle for men was 69.70° and 71.75° for the women, implying no significant
sexual differences. However, this was a cross-sectional study in the Japanese and may
not be applicable to all groups.
Erdinc, Nanda and Dandajena (2007) compared profile changes in patients treated
with and without premolar extractions, and reported that the Z-angle was a good predictor
of treatment outcome. None of the other parameters utilized in the study were as good as
the Z-angle. While the study evaluated only patients out of treatment for a five year period,
it forms a basis for recognising the importance of the Z-angle in longitudinal assessments
of profile changes, with or without treatment.
The literature also points to a large degree of variation which exists in the growth
patterns and growth velocity of the cranio-facial structures, be they hard or soft tissue. This
implies that standards or normative values should be specific to the gender, the age and
the racial profile of every patient. Whilst the current study only focussed on changes seen
in Caucasian subjects of North-European ancestry, the results seen should assist the
orthodontist to arrive at a suitable diagnosis for the individual patient.

6
CHAPTER II
STATEMENT OF PURPOSE
The Z-angle is one of many ways of assessing the soft tissue profile. Normative
values have been derived for adults but not necessarily for children. A review of the
literature revealed that there is no longitudinal data to substantiate the use of the Z-angle
across a spectrum of different ages. The primary objective of this project, then, was to
assess longitudinal changes in the Z-angle from six years of age to late adolescence or
early adulthood of 18 years of age. We hypothesized that the Z–angle does not remain
constant over time and that the values are age specific.
Secondary Objectives:
The secondary objectives of this project were:
1. To assess for gender differences, if any, in the Z-angle.
2. To evaluate whether the profile improved or deteriorated with age via use of the Z-
angle.
3. To derive normative values of the Z-angle for different age groups from six to 18
years of age.

7
CHAPTER III
MATERIAL AND METHODS
This was a non-concurrent prospective study using lateral cephalometric
radiographs from the records of the Child Research Council Study (Denver Growth Study,
Waldo, 1935) and the University of Michigan Growth Study (UMGS). Both data sets
comprised the serial records of subjects from age three to 42 years of age. While only
serial radiographs were used in this study, other information available from the Denver
Data includes study models, lateral oblique films and full body scans. The UMGS contains
annual records of students who were enrolled at the University School from 1953 to 1970.
The UMGS data are housed at the University of Michigan, School of Dentistry in Ann
Arbor, Michigan, USA with some Denver data also available at the University of Michigan.
Both data are available online through the American Association of Orthodontists
Foundation Legacy Collection (http://www.aaoflegacycollection.org).
The subjects had to fulfil the following criteria in order to be included in the study:
1. No history of orthodontic treatment.
2. No craniofacial anomalies.
3. No orthognathic surgery.
4. Class I molar relationship with normal overbite and overjet at the terminal stage of
the project (assessed on the study models).
5. Good cephalograms with good depiction of the soft and hard tissues.
6. Cephalograms available at six (T1), nine (T2), 12 (T3), 15 (T4) and 18 (T5) years of
age or closest to these ages.
Investigative Technique
All the cephalometric radiographs were hand traced using a 0.5 mm mechanical 4H lead
pencil on 0.003 inch matte acetate tracing paper on a viewing box for illumination. The
traced cephalograms were digitized using Dentofacial Planner (Dentofacial Planner,
Toronto, Ontario, Canada).

8
Landmarks, Planes and Variables
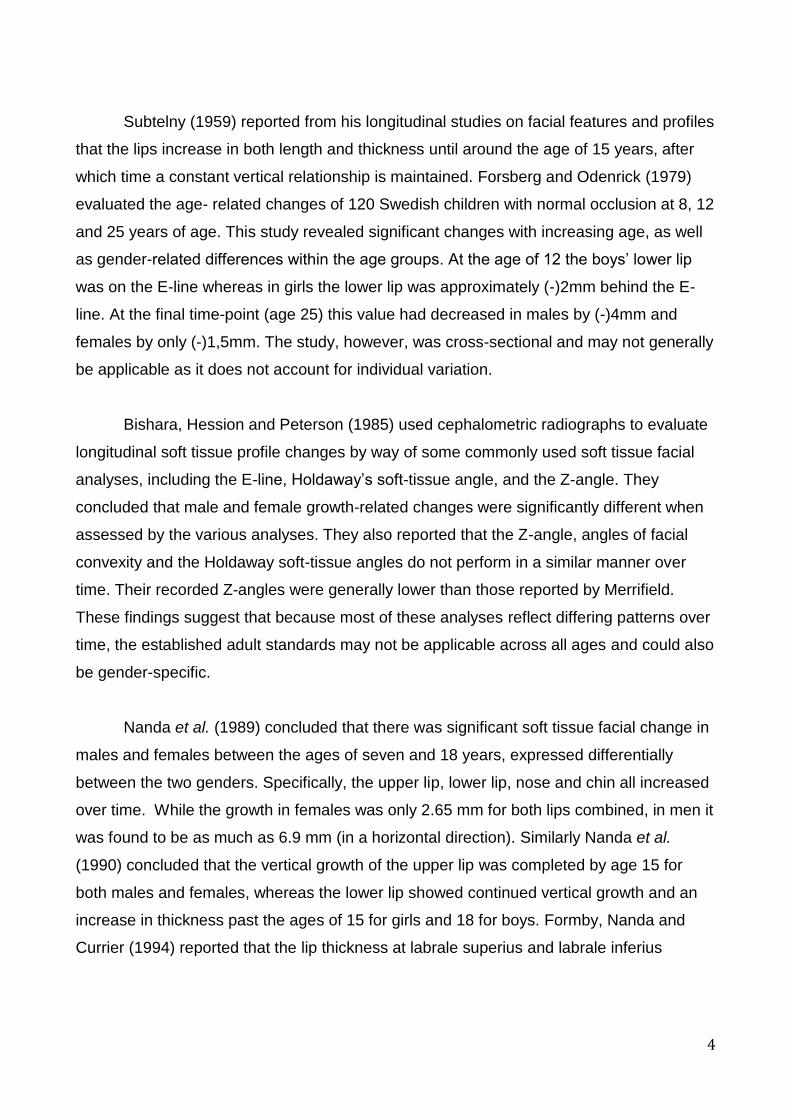
The following landmarks were used and are shown in Figure 2:
1. Nasion (N): The most anterior point on the frontonasal suture in the midsagittal
plane.
2. Pronasale (Prn): The most protruded point on the tip of the nose.
3. Labrale superius (Ls): The most anterior point on the vermillion border of the
upper lip.
4. Labrale inferius (Li): The most inferior point on the vermillion border of the lower
lip.
5. B-Point (B): A midline point on the anterior curvature of the mandible, and is the
deepest point located between infradentale and pogonion.
6. Pogonion (Pog): The most anterior point on the bony chin.
7. Soft-tissue Pogonion (Pog’): The most prominent point of the soft tissue chin in
the mid-sagittal plane; located anterior to the equivalent bony landmark of
pogonion.
8. Gnathion (Gn): The bony landmark on the curvature of the chin located by
bisecting the angle formed between the mandibular plane and the facial plane (from
nasion to pogonion).
9. Menton (Me): The inferior-most point on the lower border of the bony chin.
10. Gonion (G): A point on the posterior curvature of the mandible located by bisecting
the angle formed by lines tangent to the posterior border of the ramus and the
inferior border of the mandible.
11. Porion (Po): The most superior point on the external auditory meatus.
12. Orbitale (Or): The lowest point on the inferior rim of the orbit.
9
Figure 2. Cephalometric Landmarks

10
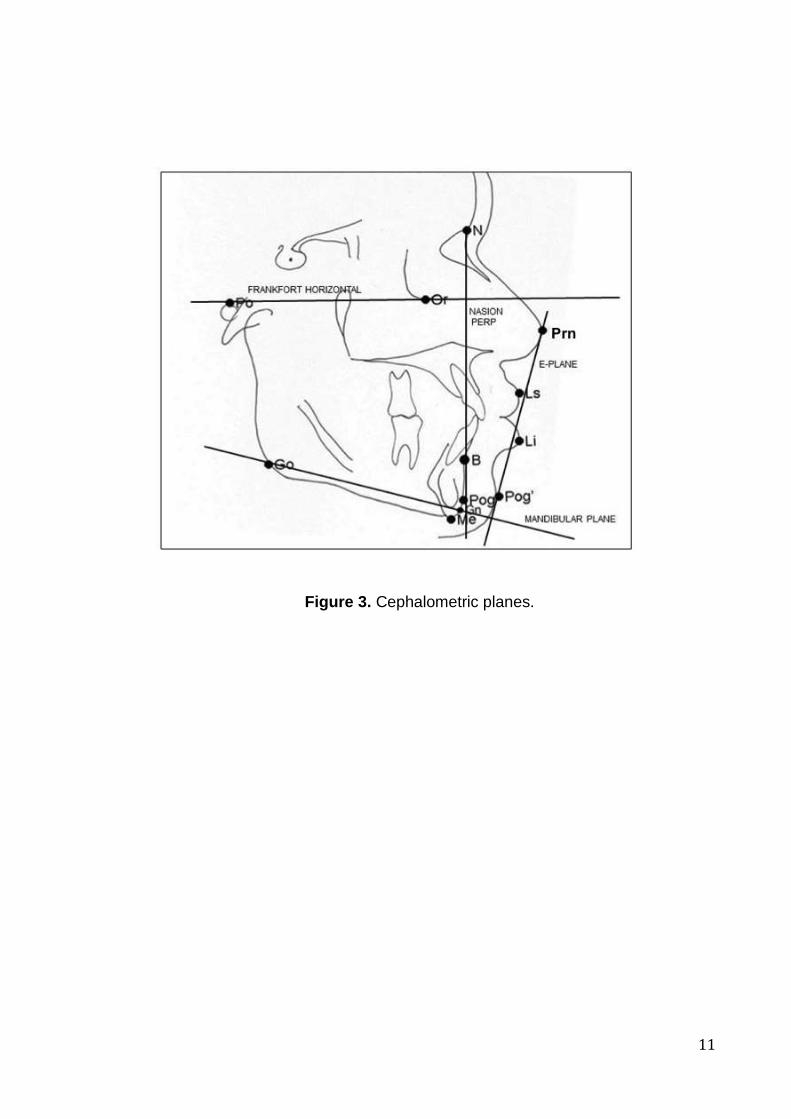
Reference Planes
The hard and soft tissue planes used for reference are defined below and shown in
Figure 3.
1. Frankfort Horizontal Plane (FH): A horizontal plane passing through Orbitale (Or)
and Porion (Po). This plane served two key purposes:
a. Construction of the Frankfort Mandibular Plane Angle (FMA).
b. Unless otherwise stated, all linear measurements were made either parallel
to or perpendicular to this plane.
2. Mandibular Plane (MP): A line representing the inferior border of the mandible that
connects Go and Gn. It is one of two planes required for the construction of FMA,
the other being FH.
3. Esthetic Plane (E-Line): The tangential plane connecting Prn and Pog’. The
purpose of the plane is to relate the positions of the upper and lower lips.
4. Nasion-Perpendicular (N-Perp): A vertical plane extending inferiorly from N
perpendicular to FH.
5. NB Line: A vertical line which extends from Nasion (N) through B-point (B).
Measurements
Angular and linear measurements were utilized in this study. The angular measurements
are shown in Figure 1 while the linear measurements are displayed in Figure 4.
Angular Measurements:
1. Z-angle: The traditional Z-angle is the angle formed between the profile line from
Pog’ to the most protrusive lip and the FH plane (Merrifield, 1966). See Figure 3.
However, in this study, two Z-angles were utilized as described by Erdinc, Nanda
and Dandajena (2007) and are as follows:
a. Upper lip-Z (ULZ): The angle formed between FH and the profile line
constructed between Pog’ and Ls (Figure 4).
b. Lower lip-Z (LLZ): The angle formed between FH and the profile line
constructed between Pog’ and Li (Figure 4).
11
Figure 3. Cephalometric planes.
12
c. diffZ: Is practically the angle formed between Ls and Li with its vertex at
Pog’. It is calculated as the difference between ULZ and LLZ. The lip with the
smaller Z-angle is the most protrusive lip and a positive diff-Z-angle value is
indicative of a more protrusive lower lip (Figure 4).
2. Frankfort Mandibular Plane Angle (FMA): The angle formed between the FH and
the mandibular plane. FMA was used to assess for homogeneity with the sample as
relates to the direction of growth.
Linear Measurements:
All measurements from a landmark to a line were made perpendicular to that line from the
respective landmark.
1. Total Chin (TotChin): The horizontal distance between soft tissue Pogonion (Pog’) to
the NB line.
2. Soft-Tissue Chin (STChin): The horizontal distance from soft tissue Pogonion (Pog’) to
hard tissue Pogonion (Pog), calculated as the difference between TotChin and Pog-NB.
3. Upper Lip to E-Plane (ULE): The distance from the upper lip to the E-plane.
4. Lower to E-Plane (LLE): The distance from the lower lip to the E-plane.
5. Nose Depth (NoseDpt): The distance from N to Prn, measured parallel to FH.
Error of Method
There were two possible sources of error: tracing error and error of digitisation. To
determine the error of tracing, 10 cephalograms were randomly selected, retraced and
digitized. The values obtained from the digitisations of the second tracing were compared
against those of the first by way of the t-test. For the error of digitisation, 10 cephalometric
radiographs were digitised twice within a week of each other for a total of three
digitisations i.e., initial plus the last two. The three sets of measurements were compared
using one-way ANOVA.

13
Figure 4: Upper and Lower Z-Angles

14
Data analysis
The data were analysed using SAS© (SAS Institute, Carry, NC). The results of the
digitisations were first exported into Microsoft Excel © where primary manipulations were
conducted, then into SAS© where the comprehensive analysis was done. The data were
compared using the generalized linear mode (GLM) in SAS©. We assessed for interaction
among three factors: time, gender and data source. There were five time points: T1 = six
years; T2 = nine years; T3 = 12 years; T4 = 15 years; T5 = 18 years. There were two data
sources: Denver and Michigan. Due to the small sample size of subjects from the
Michigan group, “exact” methods of comparison were employed in SAS.

15
CHAPTER IV
RESULTS
The final data comprised 34 subjects, 27 of whom were from Denver and the
remaining seven were from the Michigan data. No data were available for the Michigan
group at T5. One radiograph (female) from the Michigan group was excluded at T1
because the subject was in open posture. A descriptive summary of the study sample is
provided in Table I.
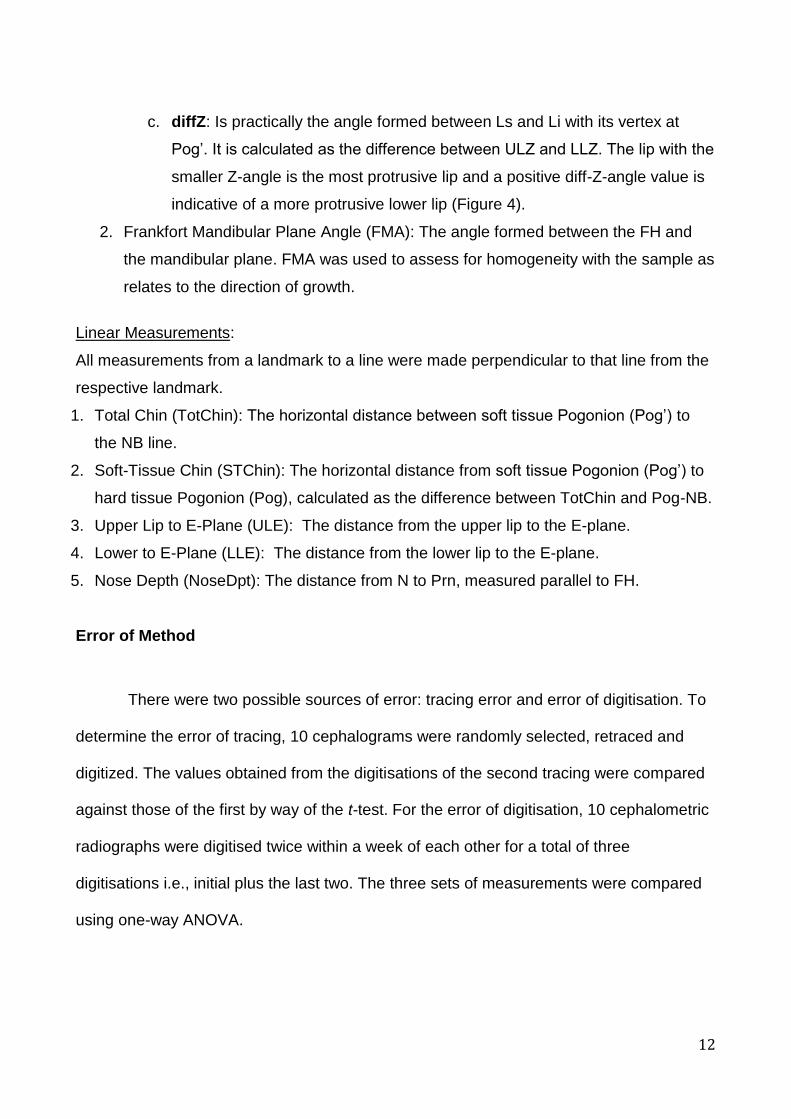
The GLM procedure revealed no interaction among Gender, Time and Data Source
in the variable age and neither were there significant findings for the main effects of
Gender and Data Source (Table II). However, the main effect Time was significant
(p<0.0001). The least squares means (LSMean) of the age at the various time points are
shown in Table III. The Bonferroni multiple comparisons showed significant differences
among all five time points as related to age (Table IV).
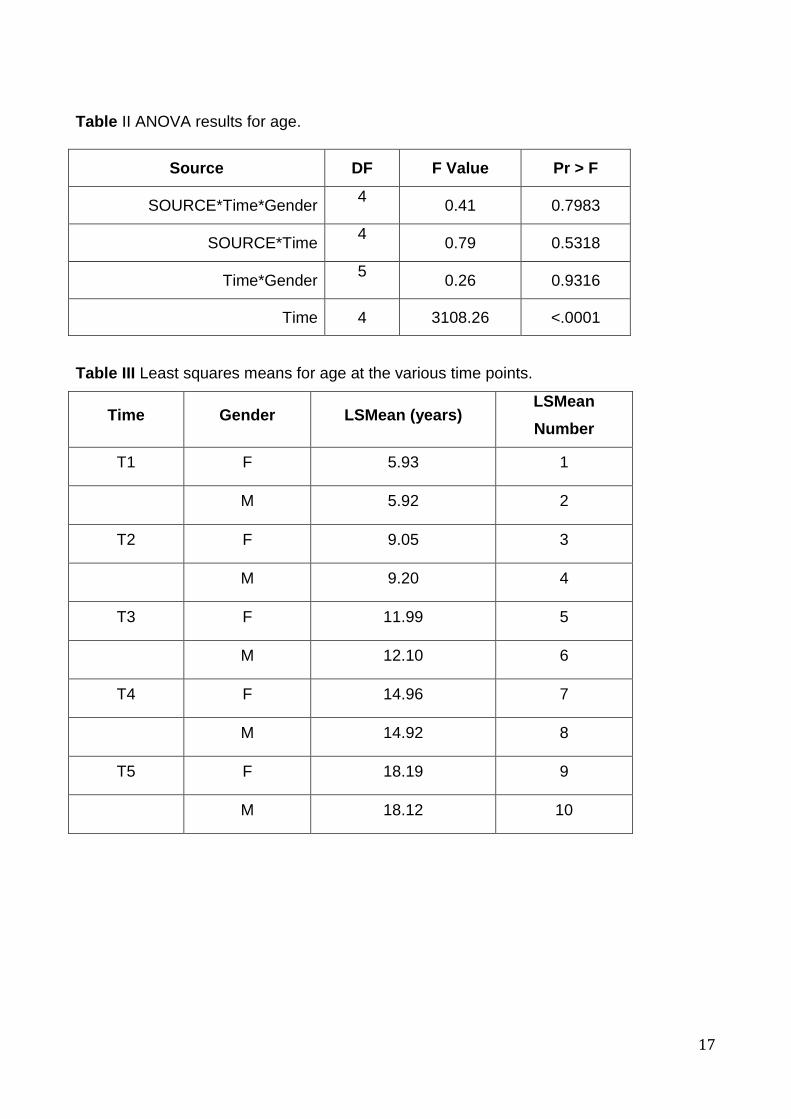
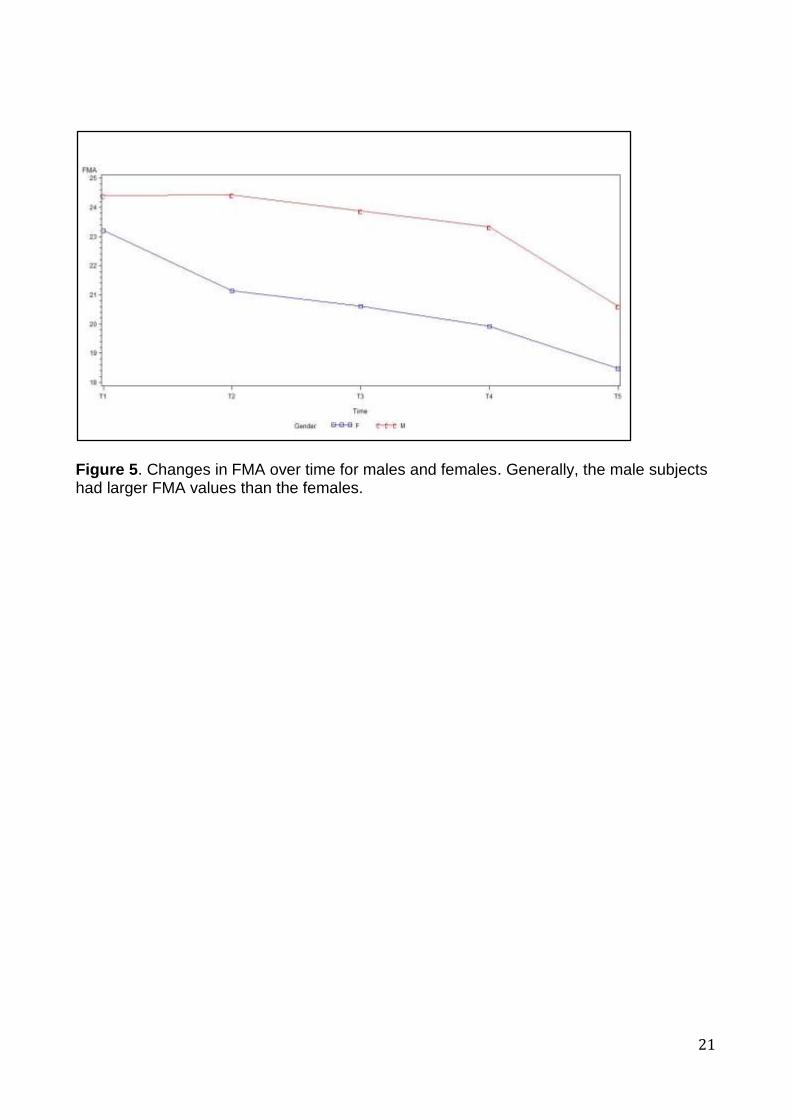
FMA showed significant interaction between gender and time (Table V)
necessitating stratification by gender for the variable FMA. Upon stratification, however,
there was no significant change in FMA over time within each gender (Table VI). The male
subjects generally had larger FMA compared with the females (Figure 5 and Table VII).
Also, FMA gradually decreased, although non-significantly, from T1 to T5 (Figure 5).

16
Table I. Summary information on the number of subjects from each data source at the
various time points.
Time
Gender Data Source T1 T2 T3 T4 T5
Female Denver 15 15 15 15 15
Michigan 1 2 2 2 0
Male Denver 12 12 12 12 12
Michigan 5 5 5 5 0
Total 33 34 34 34 27
17
Table II ANOVA results for age.
Source DF F Value Pr > F
SOURCE*Time*Gender 4
0.41 0.7983
SOURCE*Time 4
0.79 0.5318
Time*Gender 5
0.26 0.9316
Time 4 3108.26 <.0001
Table III Least squares means for age at the various time points.
Time Gender LSMean (years) LSMean
Number
T1 F 5.93 1
M 5.92 2
T2 F 9.05 3
M 9.20 4
T3 F 11.99 5
M 12.10 6
T4 F 14.96 7
M 14.92 8
T5 F 18.19 9
M 18.12 10

18
Table IV Results of the Bonferroni multiple comparisons test for age.
i/j 1 2 3 4 5 6 7 8 9 10
1 1 <.0001 <.0001 <.0001 <.0001 <.0001 <.0001 <.0001 <.0001
2 1 <.0001 <.0001 <.0001 <.0001 <.0001 <.0001 <.0001 <.0001
3 <.0001 <.0001 1 <.0001 <.0001 <.0001 <.0001 <.0001 <.0001
4 <.0001 <.0001 1 <.0001 <.0001 <.0001 <.0001 <.0001 <.0001
5 <.0001 <.0001 <.0001 <.0001 1 <.0001 <.0001 <.0001 <.0001
6 <.0001 <.0001 <.0001 <.0001 1 <.0001 <.0001 <.0001 <.0001
7 <.0001 <.0001 <.0001 <.0001 <.0001 <.0001 1 <.0001 <.0001
8 <.0001 <.0001 <.0001 <.0001 <.0001 <.0001 1 <.0001 <.0001
9 <.0001 <.0001 <.0001 <.0001 <.0001 <.0001 <.0001 <.0001 1
10 <.0001 <.0001 <.0001 <.0001 <.0001 <.0001 <.0001 <.0001 1
19
Table V. Results of the GLM procedure for the variable FMA.
Source
DF
Type III SS
Mean
Square
F Value
Pr > F
Time
4
263.71
65.93
19.38
<.0001
Gender 1 253.62 253.62 74.54 <.0001
Time*Gender 4 46.20 11.55 3.39 0.0114
TABLE VI. Stratified results for FMA of the two genders. Table (a) = male and Table (b) =
female.
(a) Male.
Source
DF
Type III SS
Mean square
F Value
Pr > F
Time 4 131.20 32.7994786 1.42 0.2361
(b) Female.
Source
DF
Type III SS
Mean square
F Value
Pr > F
Time 4 187.54 46.8853002 2.11 0.0879

20
Table VII. Summary statistics for FMA by gender. LCL = 95% lower confidence level of the mean, UCL = 95% upper confidence level of the mean.
GENDER TIME N LSMEAN LCL UCL
F T1 16 23.2 20.85 25.55
T2 17 21.14 18.86 23.41
T3 17 20.61 18.33 22.88
T4 17 19.92 17.66 22.2
T5 15 18.48 16.06 20.9
M T1 17 24.4 22.07 26.72
T2 17 24.43 22.11 26.75
T3 17 23.88 21.56 26.21
T4 17 23.33 21.01 25.65
T5 12 20.62 17.85 23.38
21
Figure 5. Changes in FMA over time for males and females. Generally, the male subjects had larger FMA values than the females.
22
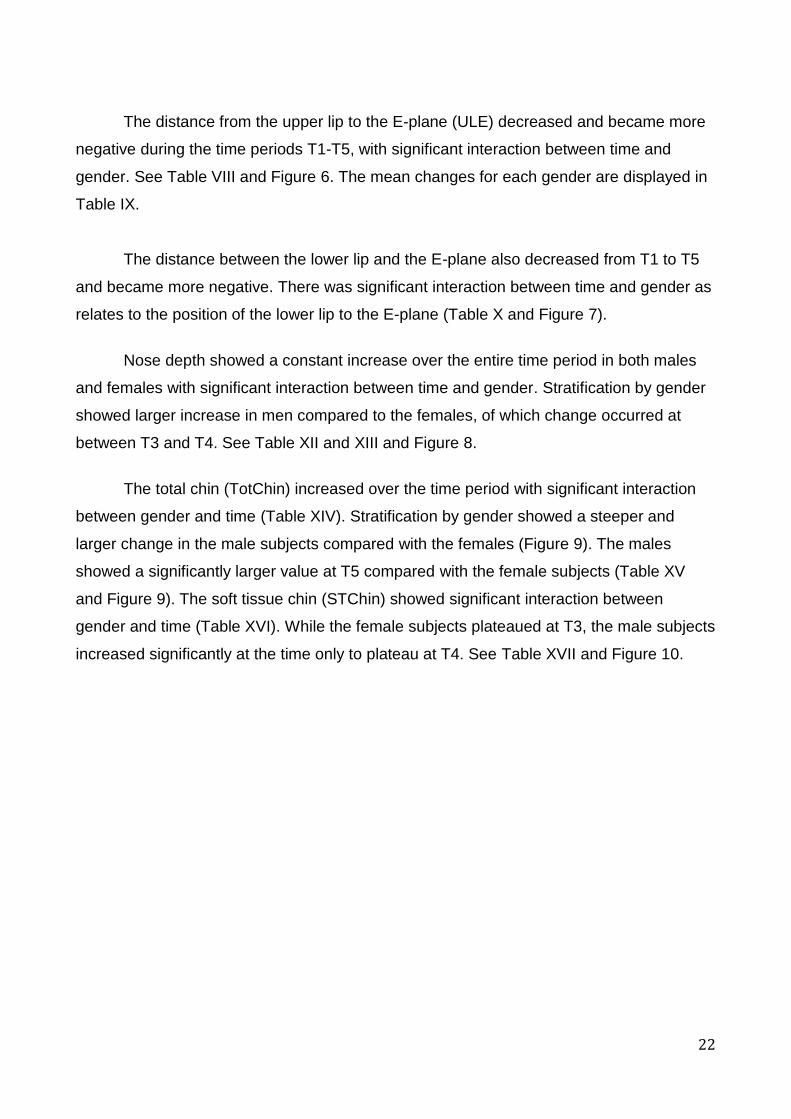
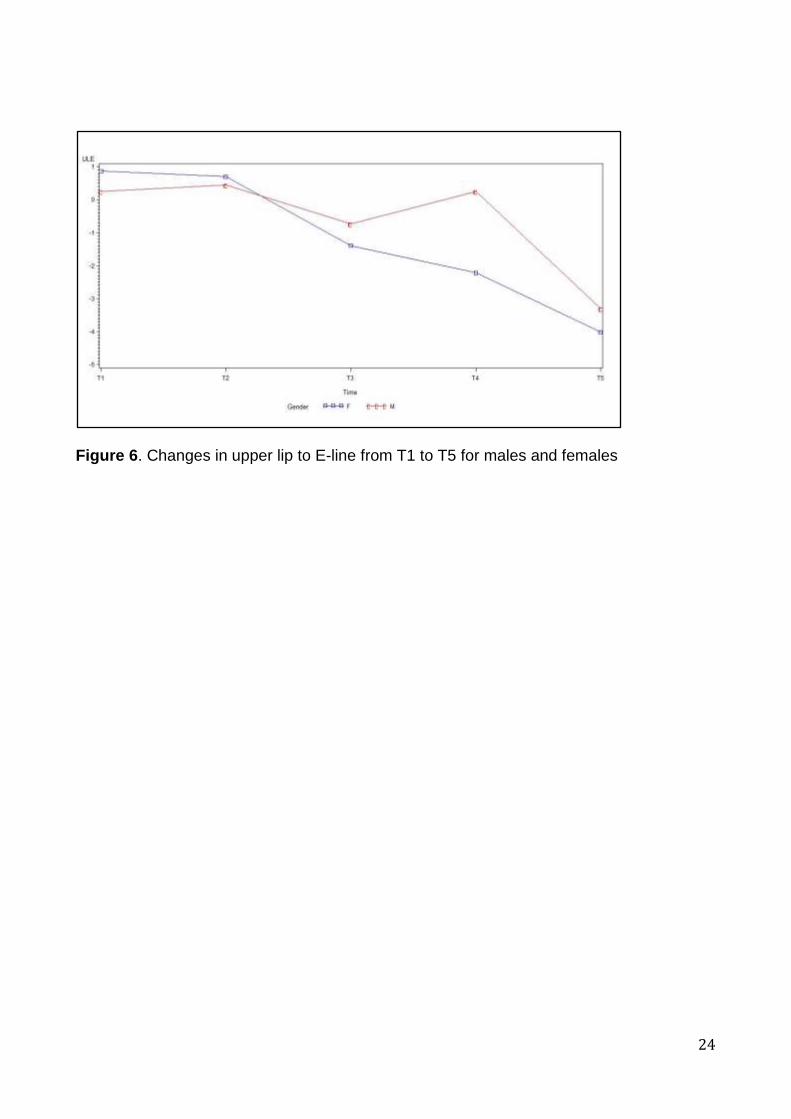
The distance from the upper lip to the E-plane (ULE) decreased and became more
negative during the time periods T1-T5, with significant interaction between time and
gender. See Table VIII and Figure 6. The mean changes for each gender are displayed in
Table IX.
The distance between the lower lip and the E-plane also decreased from T1 to T5
and became more negative. There was significant interaction between time and gender as
relates to the position of the lower lip to the E-plane (Table X and Figure 7).
Nose depth showed a constant increase over the entire time period in both males
and females with significant interaction between time and gender. Stratification by gender
showed larger increase in men compared to the females, of which change occurred at
between T3 and T4. See Table XII and XIII and Figure 8.
The total chin (TotChin) increased over the time period with significant interaction
between gender and time (Table XIV). Stratification by gender showed a steeper and
larger change in the male subjects compared with the females (Figure 9). The males
showed a significantly larger value at T5 compared with the female subjects (Table XV
and Figure 9). The soft tissue chin (STChin) showed significant interaction between
gender and time (Table XVI). While the female subjects plateaued at T3, the male subjects
increased significantly at the time only to plateau at T4. See Table XVII and Figure 10.
23
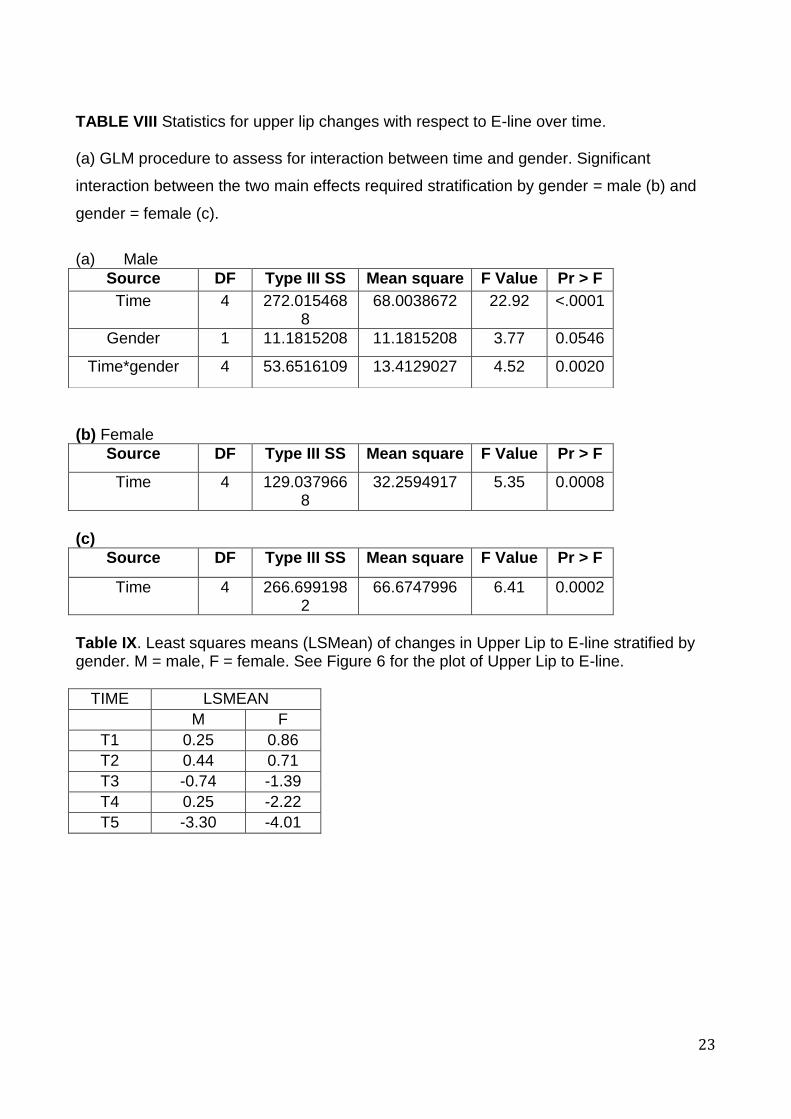
TABLE VIII Statistics for upper lip changes with respect to E-line over time. (a) GLM procedure to assess for interaction between time and gender. Significant
interaction between the two main effects required stratification by gender = male (b) and
gender = female (c).
(a) Male
(b) Female
Source DF Type III SS Mean square F Value Pr > F
Time 4 129.0379668
32.2594917 5.35 0.0008
(c)
Source DF Type III SS Mean square F Value Pr > F
Time 4 266.6991982
66.6747996 6.41 0.0002
Table IX. Least squares means (LSMean) of changes in Upper Lip to E-line stratified by gender. M = male, F = female. See Figure 6 for the plot of Upper Lip to E-line.
TIME LSMEAN
M F
T1 0.25 0.86
T2 0.44 0.71
T3 -0.74 -1.39
T4 0.25 -2.22
T5 -3.30 -4.01
Source DF Type III SS Mean square F Value Pr > F
Time 4 272.0154688
68.0038672 22.92 <.0001
Gender 1 11.1815208 11.1815208 3.77 0.0546
Time*gender 4 53.6516109 13.4129027 4.52 0.0020
24
Figure 6. Changes in upper lip to E-line from T1 to T5 for males and females

25
Table X. Statistical results for lower lip changes with respect to E-line stratified by gender. (a)Table of main effects. (b) Male (c) Female. (a)
Source DF Type III SS Mean square
F Value Pr > F
Time 4 103.18674 25.7966869 9.16 <.0001
Gender 1 1.7492420 1.7492420 0.62 0.4322
Time*gender 4 32.758559 8.1896397 2.91 0.0245
(b)
Source DF Type III SS Mean square
F Value Pr > F
Time 4 44.254267 11.0635667 1.75 0.1486
(c)
Source DF Type III SS Mean square
F Value Pr > F
Time 4 79.763441 19.9408603 1.52 0.2036
TABLE XI. Summary statistics of lower lip to E-line (LLE) stratified by gender. See Figure 7 for the plot of lower lip to E-line.
TIME LSMEAN
M F
T1 0.88 0.90
T2 0.68 1.15
T3 0.07 -0.14
T4 1.05 -0.81
T5 -1.18 -1.49

26
Figure 7. Changes in lower lip to E-line (LLE) over time for males and females.

27
Table XII. Statistical results for nose depth (NoseDPT) showing significant interaction between time and gender.
Variable Source F-value P>F
NOSEDPT Time 201.78 <0.0001
Gender 0.89 0.3479
Time*gender 8.69 <0.0001
Table XIII. LSMeans for nose depth stratified by gender.
NOSEDEPTH
TIME M F
T1 22.56 22.09
T2 24.80 25.45
T3 26.72 28.85
T4 31.73 30.29
T5 33.79 31.23
Figure 8. Changes in nose depth for males and females from T1 to T5.

28
Table XIV. ANOVA results for comparison of time and gender effects on the total chin (TotChin).
Variable Source F-value P>F
TotChin Time*Gender 10.23 <0.0001
Table XV. LSMeans for total chin (TotChin) stratified by gender.
TOTAL CHIN
TIME M F
T1 10.04 10.19
T2 11.92 12.12
T3 13.26 13.34
T4 16.23 13.68
T5 16.16 13.61
Figure 9. Plot of changes in total chin over time for males and females.

29
Table XVI. ANOVA results for changes in soft tissue chin. (STChin = soft tissue chin.)
Variable Source F-value P>F
STChin Time 24.56 <0.0001
Gender 13.57 0.0003
Time*Gender 8.32 <0.0001
Table XVII. LSMeans for soft tissue chin stratified by gender. STChin = soft tissue chin.
STChin Gender
TIME M F
T1 9.87 9.88
T2 10.24 10.48
T3 10.93 11.18
T4 13.15 11.06
T5 12.96 10.93
Figure 10. Changes in soft tissue chin for males and females from T1 to T5
30
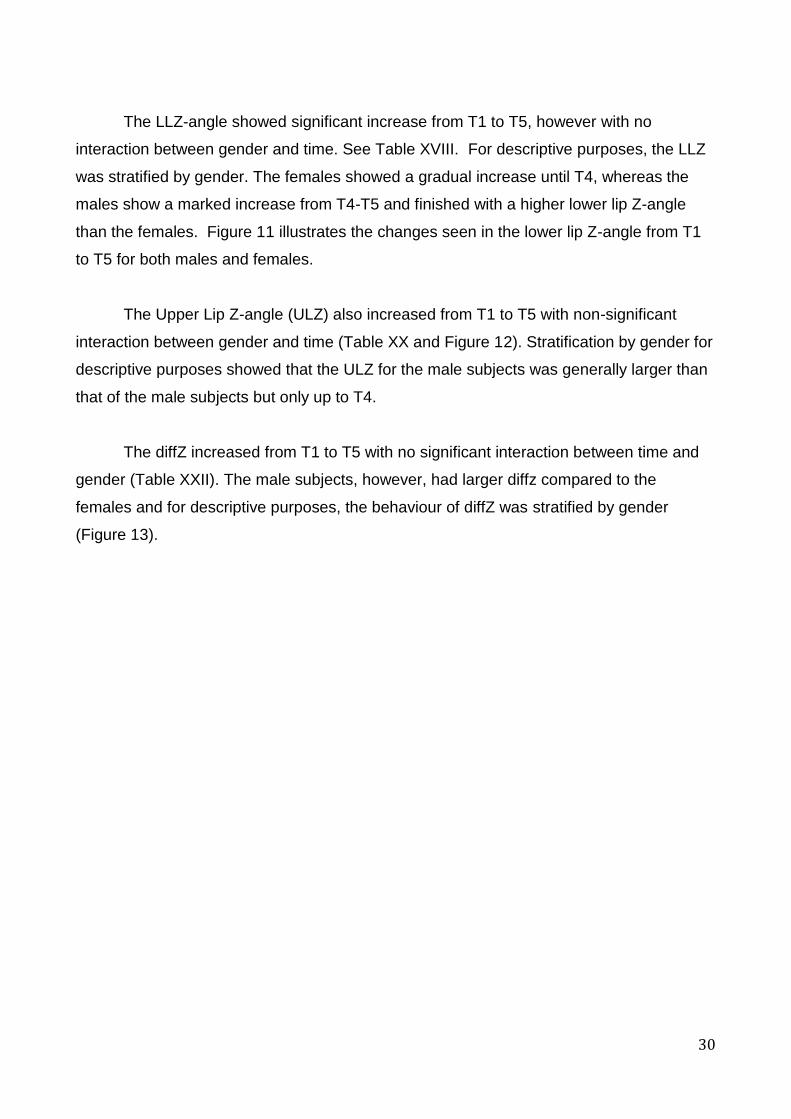
The LLZ-angle showed significant increase from T1 to T5, however with no
interaction between gender and time. See Table XVIII. For descriptive purposes, the LLZ
was stratified by gender. The females showed a gradual increase until T4, whereas the
males show a marked increase from T4-T5 and finished with a higher lower lip Z-angle
than the females. Figure 11 illustrates the changes seen in the lower lip Z-angle from T1
to T5 for both males and females.
The Upper Lip Z-angle (ULZ) also increased from T1 to T5 with non-significant
interaction between gender and time (Table XX and Figure 12). Stratification by gender for
descriptive purposes showed that the ULZ for the male subjects was generally larger than
that of the male subjects but only up to T4.
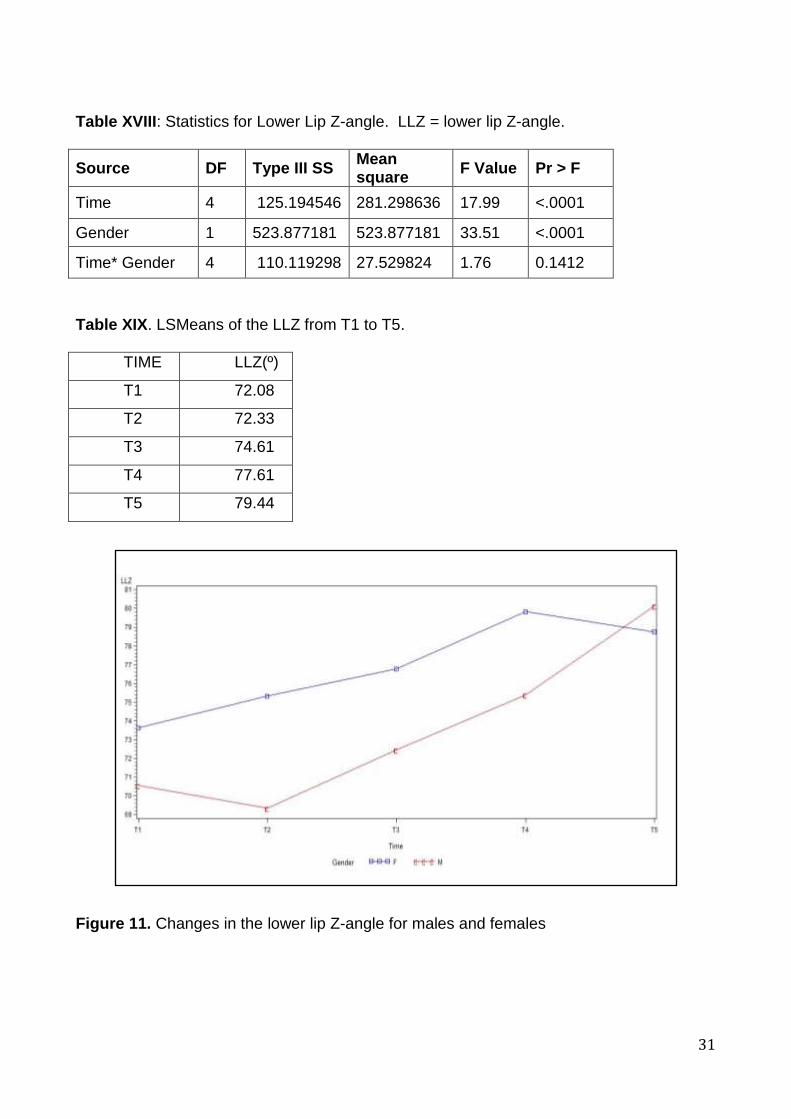
The diffZ increased from T1 to T5 with no significant interaction between time and
gender (Table XXII). The male subjects, however, had larger diffz compared to the
females and for descriptive purposes, the behaviour of diffZ was stratified by gender
(Figure 13).
31
Table XVIII: Statistics for Lower Lip Z-angle. LLZ = lower lip Z-angle.
Source DF Type III SS Mean square
F Value Pr > F
Time 4 125.194546 281.298636 17.99 <.0001
Gender 1 523.877181 523.877181 33.51 <.0001
Time* Gender 4 110.119298 27.529824 1.76 0.1412
Table XIX. LSMeans of the LLZ from T1 to T5.
TIME LLZ(º)
T1 72.08
T2 72.33
T3 74.61
T4 77.61
T5 79.44
Figure 11. Changes in the lower lip Z-angle for males and females

32
Table XX: ANOVA results for upper lip z-angle (ULZ)
Source DF Type III SS Mean square
F Value Pr > F
Time 4 1329.53247 332.383118 43.84 <.0001
Gender 1 88.289841 88.289841 11.64 0.0009
Time* Gender 1 26.463863 6.615966 0.87 0.4826
Table XXI. Summary statistics of the upper lip Z-angle (ULZ) from T1 to T5.
TIME ULZ
T1 71.78
T2 73.53
T3 75.70
T4 78.27
T5 80.07
Figure 12. Changes in the upper lip Z-angle (ULZ) over time for males and females
33
Table XXII. Summary statistics for diffZ.
Source DF Type III SS Mean square
F Value Pr > F
Time 4 46.8790999 11.7197750 1.92 0.1123
Gender 1 182.0366560
182.0366560
29.75 <.0001
Time* Gender 4 58.1759740 14.5439935 2.38 0.0557
Table XIII. LSMeans for diffz from T1 to T5 for both genders combined.
TIME diffZ
T1 -0.30
T2 1.20
T3 1.09
T4 0.66
T5 0.63
Figure 13. Changes in the diffz for males and females.

34
Table XIV. Summary of changes in the Z-angle between adjacent time points.
Time N Variable Mean Std Min Max LCL UCL P-value
T1T2 33 diffLLZ -0.18 6.87 -12.9 10.8 -2.62 2.25
diffULZ -1.62 4.13 -9.9 10.7 -3.084 -0.15
diffZ2 -1.43 4.61 -9.1 9 -3.07 0.20 0.0836
T2T3 34 diffLLZ -2.28 4.54 -9.4 12 -3.87 -0.69
diffULZ -2.17 3.69 -9.3 8 -3.46 -0.88
diffZ2 0.11 2.9 -6.1 6 -0.90 1.12 0.8325
T3T4 34 diffLLZ -2.99 5.09 -12.5 10.7 -4.77 -1.22
diffULZ -2.56 3.87 -10.5 6.5 -3.91 -1.22
diffZ2 0.43 2.98 -6 6.3 -0.61 1.47 0.4076
T4T5 27 diffLLZ -1.16 4.08 -9.1 7.2 -2.77 0.46
diffULZ -1.43 2.64 -6.4 4.1 -2.48 -0.38
diffZ2 -0.27 2.39 -5.6 4.7 -1.22 0.67 0.5556

35
CHAPTER V
DISCUSSION
In order for orthodontists to adequately achieve their predetermined treatment
objectives and a predictable change in facial aesthetics, the nature and quantity of the
expected growth must be well anticipated. Since growth is so closely linked to orthodontic
treatment and to a large extent contributes to determining the final result in growing
patients, it is imperative that the treating orthodontist has a thorough knowledge and
understanding of the growth patterns of the facial structures. The emphasis in orthodontic
treatment today is the face with particular reference to the soft tissue and this too goes
through some significant changes. The purpose of this research was to assess longitudinal
soft tissue changes of the facial profile using the Z-angle. A number of other parameters
that assess the soft tissue were also included to appreciate the changes associated with
the Z-angle.
The Z-angle has traditionally been described as the angle which is formed between
Frankfort horizontal and the line from the chin to the most protrusive lip. Erdinc, Nanda
and Dandajena (2007) further described two Z-angles in a similar manner but with
reference to the upper and lower lips as upper Z-angle and lower Z-angle. This is the
format that was followed in this study and will be discussed accordingly.
The LLZ increased from T1 (72.08º) to T5 (79.44º), with a more gradual change in
the females compared to the males. The females showed a steady and uniform increase
in the LLZ from T1 up until T4, after which there was a sharp decrease from T4 – T5. The
males on the other hand showed an initial decrease from T1-T2, followed by a steady and
uniform increase from T2 – T4 which ran almost parallel to that of the females. Thereafter
the males showed a sharper increase from T4 –T5 and finished with a higher LLZ than the
females.
The Z-angle is not influenced by changes in the nose depth. While the nose depth
increased with resultant decrease in the E-lines, the Z-angle gradually increased for both

36
the upper and lower lips. There are two possible reasons for this change: increase in chin
thickness and retrusion of the lips.
TotChin increased for both males and females with the females plateauing at T3
and the male subjects continuing to increase. Similar behaviour was noted for the STChin.
Thus a major contributor to the change in the Z-angle could be the position of the chin with
much of the change emanating from increases in STChin. Other investigators have
reported increases in the bony chin up till early adulthood (Formby et. al.1994). Similar
observations are noted in this study but only up till T3 in the females and T4 in the males.
The total chin is a composite of the STChin and hard tissue as measured from Pog-
NB. The hard tissue chin can be used for prediction of mandibular growth, together with
FMA. According to Aki et. al. (1994), individuals with prominent chins and low FMA tend to
be horizontal growers. The subjects in this study had average FMA at T1 (23.2º and 24.4º
for the females and males, respectively) which decreased non-significantly to 18.4º for the
females and 20.6º for the males at T2 thus indicating a horizontal growth pattern for the
subjects. Just as much, there was significant increase in the total chin which was coupled
with improvement in the Z-angles, particularly the LLZ. Interesting enough, however, the
diffZ did not change.
While not directly assessed in this study, lip thickness at both labrale inferius and
labrale superius decreases with advancing age (Formby et al, 1994). Unlike the Z-angles
which experienced uniform change as measured by the diffZ, the lip positions with respect
to the E-line continued to decrease to negative values due to changes in the nose as
measured by the nose depth as well as the chin position (Nanda et. al, 1995). This makes
the Z-angle more reliable than the E-lines in predicting the integumentary profile.
The Z-angles changed at a uniform pace in this study. The findings of this study
indicate that one cannot use the same Z-angle across different age groups as reported by
Merrifield (1966), who recorded a mean Z-angle of 78 degrees. While the eventual value
of 77.4º reported in this study is similar to that advocated by Merrifield, care should be
taken to not treat to adult values at all times as the Z-angle normalizes with advancing
37
age. While Zylinski et al. reported similar findings of improvement in the Z-angle with
advancing age, the sample they utilized was cross-sectional. However, as is the case in
this study, it showed differences among age groups in the Z-angle.
As was the case with Zylinski et. al., differences in the samples need to be noted
between this study and that of Merrifield. Whereas we studied untreated normal growing
subjects with Class I occlusion with a horizontal growth pattern, Merrifield sampled
patients post treatment with the most ideal measurements for their FMA, FMIA, IMPA and
ANB angles (Merrifield, 1966).
While Merrifield assessed only the most protrusive lip, our reference was to both
lips as described by Erdinc, Nanda and Dandajena (2007). In our study, the upper lip was
consistently protrusive and this was maintained from T1 to T5. The value of the most
protrusive lip was different from that reported by Merrifield. However, the relationship
between the upper and lower lips were maintained throughout the period under
investigation as evidenced by the diffZ, which remained constant from T1 to T5. Important
however is the fact that the Z-angles increased without intervention thereby showing that
the Z-angle is not a constant measure, and it varies by age. This needs to be taken into
consideration during treatment planning and growth forecasting. The subjects in this study
had a mean FMA of 23º, indicating horizontal growth of the subjects. High angle patients
may not behave in the same manner as their mandibles tend to show an opening growth
rotation. Such growth patterns can be determined as early as age six (Nanda, 1988).
The results of this study show that the Z-angle does not remain constant over time.
When the patient has a normal growth pattern as evidenced by the FMA, the Z-angle is
expected to improve. Care should be taken in treatment planning to consider the future
changes.

38
CHAPTER VI
SUMMARY AND CONCLUSION
Lateral cephalometric radiographs of 17 boys and 17 girls with Class I occlusion
and no history of orthodontic treatment were evaluated over the ages of six to 18 years to
assess the age related changes to the Z-Angle. All the subjects were Caucasians of North
European ancestry. The Z-angle increased from childhood to adolescence for both upper
and lower lips. This illustrated that the profile becomes flatter with time in both genders. As
such, we failed to reject the hypothesis that the Z-angle changes with advancing age.
Changes in the Z-angle were associated with increases in the total chin and the soft
tissue chin. Concomitantly, both upper and lower lips receded with an advancing chin and
nose as evidenced by increases in total chin and deepening of the nose depth. These
findings can be relied upon since the growth pattern of the subjects was consistent as
confirmed by the FMA. While there was some sexual dimorphism, the male subjects were
generally larger than the females. However, the growth pattern was identical for both.
The findings of this study can be summarized as follows:
1. Lateral cephalometric radiographs of 17 boys and 17 girls with Class I occlusion
and no history of orthodontic treatment were evaluated over the ages of 6 years to
18 years to assess the age related changes to the Z-Angle. All the subjects were
Caucasians of North European ancestry.
2. The findings of this study showed that the Z-Angle did change with age as it
increased from T1 to T5 time periods. One cannot rely on the adult values when
treatment planning the growing child, but should instead consider the possible
changes which occur to the Z-angle naturally. This study has shown that the
currently established normative values of the Z-Angle are not applicable at all ages,
due to the constant change in the Z-Angle.
39
3. The changes in the Z-angle could be linked to forward growth of the chin and
retrusion of the lips.
4. There was some sexual dimorphism in the behaviour of the Z-angle, with the
females plateauing earlier than the male subjects. Effectively however, the values
were similar.
Limitations
The study analysed only those subjects with an average FMA. We do not know how high
angle patients would behave. Furthermore, the study was only based on cephalometric
evaluation without regard to the clinical patient profile.

40
REFERENCES Aki T, Nanda RS, Currier GF. Assessment of symphysis morphology as a predictor of the direction of mandibular growth. Am J Orthod Dentofacial Orthop 1994; 106: 60-69 Bishara S, Hession T, Peterson L. Longitudinal soft-tissue profile changes: a study of three analyses. Am J Orthod 1995; 88: 209-23. Blanchette M, Nanda R, Currier G, Ghosh J & Nanda S. A longitudinal cephalometric study of the soft tissue profile of short- and long-face syndromes from 7 to 17 years. Am J of Orthod Dentofacial Orthop 1996; 109: 116-31 Burstone CJ. The integumental profile. Am J Orthod 1958; 44: 1-24 Burstone CJ. Lip posture and its significance in treatment planning. Am J Orthod 1976; 53: 262–84 Erdinc AE, Nanda RS, & Dandajena TC. Profile changes of patients treated with and without premolar extractions. Am J of Orthod Dentofacial Orthop 2007; 132(3): 324-31 Formby W, Nanda R, & Currier G. Longitudinal changes in the adult facial profile. Am J of Orthod Dentofacial Orthop 1994; 105(5): 464-76 Forsberg C & Odenrick L. Changes in the relationship between the lips and the aesthetic line from eight years of age to adulthood. Eur J Orthod 1979; 1(4): 265-70 Holdaway R. A soft-tissue cephalometric analysis and its use in orthodontic treatment planning: Part II Am J Orthod 1984; 85(4): 279-93 Iwasawa T, Moro T, & Nakamura K. Tweed triangle and soft-tissue consideration of Japanese with normal occlusion and good facial profile. Am J Orthod 1977; 72(2):119-27 Kapila S. Lip profile growth changes: a longitudinal cephalometric study from 7 to 18 years. [Thesis] Oklahoma City: University of Oklahoma, 1986. Meng H, Goorhuis J, Kapila S & Nanda R. Growth changes in the nasal profile from 7 to 18 years of age.Am J of Orthod Dentofacial Orthop 1988; 94(4): 317-26 Merrifield, L. The profile line as an aid in critically evaluating facial esthetics. Am J Orthod 1966; 52(11): 804-22 Nanda R , Meng H, Kapila S, & Goorhuis J. Growth changes in the soft tissue facial profile. Angle Orthod 1990; 60(3): 177-90 Nanda S (1988). Patterns of vertical growth in the face. Am J of Orthod Dentofacial Orthop 1988; 93(2): 103-16

41
Ricketts RM. Planning treatment on the basis of the facial pattern and an estimate of its growth. Angle Orthod 1957; 27: 14–37 Steiner CC. The use of cephalometrics as an aid to planning and assessing orthodontic treatment. Am J Orthod 1960; 46: 721–35 Subtelny JD. A longitudinal study of soft tissue facial structures and their profile characteristics, defined in relation to underlying skeletal structures. Am J of Orthod Dentofacial Orthop 1959; 45: 481-507 Vahdettin L, & Altuğ Z. Longitudinal soft-tissue profile changes in adolescent Class I subjects. J Orofac Orthop 2012; 73(6): 440-53 Waldo CM. Orthodontic research as a component part of a balanced longitudinal study of 100 children. Int J Orthodontia 1936; 22: 659-73 Zylinski CG, Nanda RS and Kapila S. Analysis of soft tissue facial profile in white males. Am J of Orthod Dentofacial Orthop 1992; 101: 514-8 AAOFLegacycollection (2012) www.aaoflegacycollection.org American Association of Orthodontists Foundation DOI: http://www.aaoflegacycollection.org/aaof_collection.html?id=UOKDenver AAOFLegacycollection (2012) www.aaoflegacycollection.org American Association of Orthodontists Foundation DOI: http://www.aaoflegacycollection.org/aaof_collection.html?id=UMICHGrowth


![(WITWATERSRAND LOCAL DIVISION) Date delivered: …abahlali.org/files/Grobler_WLD_2008[1].pdf · (WITWATERSRAND LOCAL DIVISION) Date delivered: ... application for condonation for](https://static.fdocuments.net/doc/165x107/5aa814f17f8b9acf258b692c/witwatersrand-local-division-date-delivered-1pdfwitwatersrand-local-division.jpg)