
The University of Connecticut Climate Action Plan · The University of Connecticut Climate Action...
160
The University of Connecticut Climate Action Plan: Guiding the Path toward Carbon Neutrality AUGUST 2009
Transcript of The University of Connecticut Climate Action Plan · The University of Connecticut Climate Action...

The University of Connecticut Climate Action Plan:
Guiding the Path toward Carbon NeutralityAUGUST 2009

i
Acknowledgements The University of Connecticut’s Climate Action Plan and greenhouse gas inventory are the result of months of dedicated work and volunteerism by more than 100 students, faculty, staff and community members. Collectively, these individuals provided the enthusiasm, creativity and persistence required to complete the otherwise daunting task of planning for carbon neutrality. The following individuals contributed to the planning, writing and reviewing of the UConn Climate Action Plan.
In the spring of 2008, students from the EcoHusky student group and the UConn chapter of the Public Interest Research Group (P.I.R.G.) with support from former UConn Sustainability Coordinator Dan Britton, petitioned University of Connecticut President Michael Hogan to sign the American College and University Presidents Climate Commitment (ACUPCC). The resolve of these students directly contributed to the establishment of carbon neutrality as a long-term campus goal.
If the students planted the seed, President Hogan ensured the security of its growth. Due to President Hogan’s leadership and vision, UConn now stands alongside more than 600 universities and colleges nationwide committed to reducing greenhouse gas emissions. As President Hogan noted, “UConn already has a proven track record in environmental sustainability, owing to the energies and expertise of our dedicated faculty, staff, and students. Signing the ACUPCC and agreeing to do our part in curbing carbon emissions formalizes our ongoing commitment to playing a leadership role in environmental stewardship.” Thank you, President Hogan, for setting the bar. In addition, thank you to Stephen Rhodes, Executive Assistant to the President, for his diligent participation in climate action planning activities on the President’s behalf.
During the summer of 2008, an eight-member Climate Action Task Force (CATF) was appointed. The task force was co-chaired by Tom Callahan, Associate Vice President of Administration and Operations, and Rich Miller, Director of Environmental Policy. Additional members included Dr. Nancy Bull, Vice Provost for Academic Administration; Dr. Julie Bell-Elkins, Assistant to the Vice President of Student Affairs; Nick Frechette, undergraduate Chemical Engineering student; Matt Hart, Mansfield Town Manager; Chuck Morrell, Student Union Associate Director; Lysa Teal, Budget Office Director; and Dr. Michael Willig, Professor of Ecology and Evolutionary Biology and Director for the Center for Environmental Science & Engineering. The CATF’s diligent oversight efforts throughout the year ensured a comprehensive analysis of proposed strategies and the development of a creative, yet feasible final plan.
The core of the work related to the development of the Climate Action Plan occurred within the five CATF Workgroups. Two pre-existing workgroups of the University’s Environmental Policy Advisory Council (EPAC) were called upon to assist with this task: the Recycling Workgroup, led by Jennifer Sayers, UConn’s Sustainability Coordinator, and the Environmental Literacy Workgroup, co-chaired by Dr. Kathy Segerson, Professor of Economics, and Dr. David Wagner, Professor of Ecology and Evolutionary Biology. In addition, three new workgroups were formed: the Sustainable Development Workgroup, co-chaired by Alex Roe, Architectural and Engineering Services Director of Planning and Program Management, and Dr. John Volin, Natural Resources & the Environment Department Head; the Energy Workgroup, co-chaired by Dr. Mehdi Anwar, Professor of Electrical and Computer Engineering, and Ron Gaudet, Energy Utility Services Manager in Facilities Operations; and the Transportation Workgroup co-chaired by Dr. Norman Garrick, Associate Professor of Civil & Environmental Engineering,
ii
and Wayne Landry, Motor Pool and Central Stores Manager. The leadership of the workgroup co-chairs was critical to the development of the plan. The co-chairs spent numerous hours with workgroup members brainstorming emissions reduction solutions and finalizing draft versions of the plan. Thank you for your dedication.
Thank you also to the 100+ staff, faculty, and student members of the five workgroups. (A full list of workgroup participants is provided in Appendix B.) Collectively, you have made a significant and lasting contribution to the University. Your role in the successful development of this plan cannot be overstated. Thank you also to the numerous supervisors who supported this effort by encouraging their staff to participate. Similarly, thank you to the administrative and support staff who wrestled with challenging schedules to help organize the necessary climate action planning meetings, specifically Kathy Allard, Sara-Ann Chainé, Catherine Dunnack, Deborah Horton, Tonya Lemire, Debra Merrit, Melanie Savino, Beth Sheldon, Cherie Taylor, Noreen Wall, Tia Willour and Deborah Zambo. Thank you also to Meghan Ruta, the University’s Climate Action Plan Project Manager, who helped coordinate the CATF workgroup meetings and the development of the draft climate action plan.
Lastly, the 2007 greenhouse gas inventory discussed in Section 2 of this plan was compiled by Zbigniew Grabowski and Nathaniel Wallshein, interns in the University’s Office of Environmental Policy. Thank you to Z and Nate for their hard work compiling the University’s most thorough inventory to-date. In addition, the following individuals helped locate, process and analyze the data, without which the inventory would not have been possible: Gerry Bailey, Motor Pool Automotive Maintenance Supervisor; Ann Denny, Manager of Parking Services Manager (retired); Martin Dzenis, Accounts Payable Claims Examiner; Janet Freniere, Transportation Services Administrator; Martha Funderbunk, Parking Services Acting Manager; Ron Gaudet, Energy Utility Services Manager; Mary Keglar, Farm Services Manager; Wayne Landry, Motor Pool and Central Stores Manager; Dave Lotreck, Maintenance and Renovation Services Manager; Stephanie Marks, Environmental Compliance Analyst; Stanley Nolan, Energy Service Engineer; Steve Olsen, Farm Services Research and Education Facilities Manager; Jeffrey Pasiuk, Parking Services Technical Record Coordinator; Alex Roe, Director of Planning and Program Management; Pamela Roelfs, Director of the Office of Institutional Research; Kelly Wihbey, Budget Office Analyst; and Jessica Williamson, Study Abroad Program Coordinator.
Thank you again to everyone who contributed to the development of the University of Connecticut’s Storrs Campus Climate Action Plan. Any omissions from this list are completely accidental and regrettable.
In Memoriam:
It was with great sadness that we learned of the unexpected passing of our friend and colleague, Benjamin Maycock, on May 6, 2009. As an electrical engineer in the Facilities Operations department, Ben was an active contributor to the Energy Workgroup of the Climate Action Task Force. In addition, Ben had previously served as an important member of the University’s EcoMadness team, helping to organize annual energy and water conservation contests among the residence halls. He will be missed.

iii
The University of Connecticut Climate Action Plan:
Guiding the Path toward Carbon Neutrality
Table of Contents
Section 1: The UConn Climate Action Planning Process ............................................. 1-14
The University of Connecticut ..................................................................................................... 3
The American College and University Presidents Climate Commitment ..................... 3
Why Did We Sign the PCC? ............................................................................................................................. 3
A Proven Track Record in Environmental Sustainability .................................................................. 3
Looking Towards the Future .......................................................................................................................... 6
Organizational Structure ............................................................................................................... 6
Environmental Policy Advisory Council .................................................................................................... 6
Environmental Policy Statement .................................................................................................................. 6
Climate Action Task Force ............................................................................................................................... 7
CATF Workgroups ............................................................................................................................................... 8
Climate Action Plan Project Manager.......................................................................................................... 9
Developing the Climate Action Plan .......................................................................................... 9
UConn Climate Action Plan ....................................................................................................... 10
CAP Overview ..................................................................................................................................................... 10
Emissions Reduction Goal & Interim Milestones ................................................................................ 10
CAP Implementation & Timeline ............................................................................................................... 11
One Final Note ............................................................................................................................... 13
References ...................................................................................................................................... 14
Section 2: Greenhouse Gas Inventory ............................................................................. 15-47
Executive Summary ...................................................................................................................... 18
2007 Inventory Results .................................................................................................................................. 18
Future Inventories ............................................................................................................................................ 18
Inventory Boundaries .................................................................................................................. 21
Temporal Boundaries ..................................................................................................................................... 21
Organizational Boundaries ........................................................................................................................... 21

iv
Operational Boundaries ................................................................................................................................. 22
Institutional Data .......................................................................................................................... 24
Projected Campus Growth ......................................................................................................... 25
Building Growth ................................................................................................................................................ 26
Student Enrollment .......................................................................................................................................... 26
Scope 1 Emissions ......................................................................................................................... 28
Cogeneration Facility ...................................................................................................................................... 28
Other Stationary Sources ............................................................................................................................... 29
On-Campus Vehicle Fleet ............................................................................................................................... 30 Hybrid-Electric & Electric Vehicles ................................................................................................................ 30
Campus Bus & Shuttle System .......................................................................................................................... 31
Biodiesel Production & Use ................................................................................................................................ 31
Bicycling & Walking.............................................................................................................................................. 31
Refrigerants & Chemicals .............................................................................................................................. 32 Refrigerants .............................................................................................................................................................. 32
Green Cleaning ........................................................................................................................................................ 33
Agricultural Emissions: Fertilizer Applications & Animal Husbandry...................................... 33
Scope 2 Emissions ......................................................................................................................... 34
Purchased Electricity ...................................................................................................................................... 35
Scope 3 Emissions ......................................................................................................................... 36
Solid Waste Disposal ....................................................................................................................................... 36
Wastewater Treatment .................................................................................................................................. 37
Student, Faculty & Staff Commuting ......................................................................................................... 38
Off-Campus Travel ............................................................................................................................................ 39 Study Abroad ........................................................................................................................................................... 39
Directly-Financed Off-Campus Travel ........................................................................................................... 39
Offsets & Sequestration Activities ........................................................................................... 40
Forest Management ......................................................................................................................................... 40
Composting .......................................................................................................................................................... 42 Floriculture Greenhouse ..................................................................................................................................... 42
Plant Science Farm................................................................................................................................................ 42
EcoGarden Club & Dining Services ................................................................................................................. 43
Proposed Agricultural Waste Composting Facility ................................................................................. 43
Conclusion ........................................................................................................................................ 43
Understanding Increases in Emissions ................................................................................................... 43
Limitations to the Current Inventory ....................................................................................................... 44
Recommendations for Future Improvement ........................................................................................ 45
References ...................................................................................................................................... 47
Section 3: Emissions Reduction Strategies................................................................. 48-104
Executive Summary ...................................................................................................................... 53
Emissions Reduction Strategy Evaluation & Selection .................................................................... 53

v
Overview of Proposed Greenhouse Gas Emissions Reduction Strategies ............................... 53 Energy-Related Strategies ............................................................................................................................... 53
Sustainable Development-Related Strategies ......................................................................................... 54
Transportation-Related Strategies.............................................................................................................. 55
Conclusion ............................................................................................................................................................ 55
Energy ................................................................................................................................................ 56
Strategy E.1: Plan for the Future ................................................................................................................ 58 E.1.1. Develop a campus Utilities Master Plan ........................................................................................ 58
E.1.2. Ensure energy efficiency through the building design process ........................................... 58
E.1.3. Commit to renewable energy goals for campus energy supply ........................................... 58
Strategy E.2: Reduce Demand ..................................................................................................................... 59 E.2.1. Establish a program to continuously commission buildings ................................................ 59
E.2.2. Adjust building temperature set points and occupancy schedules .................................... 59
E.2.3. Establish a lighting update program (interior and exterior) .............................................. 60
E.2.4. Reduce fume hood energy consumption ........................................................................................ 60
E.2.5. Establish an energy-efficient computing policy ......................................................................... 60
E.2.6. Implement a residence hall appliance policy .............................................................................. 61
E.2.7. Minimize energy use associated with equipment and appliances ..................................... 61
E.2.8. Identify and improve energy efficiencies associated with campus food service equipment and appliances .................................................................................................. 61
Strategy E.3: Maximize Efficiency .............................................................................................................. 62 E.3.1. Correct inefficiencies in campus utility distribution systems ............................................... 62
E.3.2. Expand and better integrate current energy monitoring efforts ....................................... 62
E.3.3. Promote continuous improvement of operational strategies at the cogeneration facility .......................................................................................................................................................... 63
E.3.4. Centralize utility systems as much as possible and examine opportunities to integrate building projects to maximize utility system efficiency ................................ 63
E.3.5. Improve the efficiency of building HVAC systems through heat zoning and high-efficiency filters .................................................................................................................... 63
E.3.6. Develop and initiate a boiler efficiency and emissions reductions program ................. 63
E.3.7. Develop and implement an equipment energy efficiency purchasing policy ................ 63
Strategy E.4: Substitute Green Technologies for Existing Technologies .................................. 64 E.4.1. Seek to incorporate alternative energy sources into new constructions and
retrofit existing buildings were appropriate and feasible .................................................... 64
E.4.2. Maximize efficiency of laboratory airflow through new technologies............................. 64
E.4.3. Identify and evaluate applications for variable-frequency drives (VFDs)...................... 64
E.4.4. Evaluate the feasibility and appropriateness of developing a carbon neutral power plant ............................................................................................................................... 64
Strategy E.5: Demonstrate Alternative Technologies ....................................................................... 65 E.5.1. Develop a renewable energy master plan and implement demonstration projects .. 65
Sustainable Development .......................................................................................................... 66
Strategy SD.1: Green the campus building and renovation process. ......................................... 68 SD.1.1. Revise the Sustainable Design and Construction Policy ...................................................... 68
SD.1.2. Update the Sustainable Design Guidelines and mandate their use for projects not required to meet LEED standards................................................................... 69
SD.1.3. Develop a construction materials selection, recycling and reuse guide ....................... 70
SD.1.4. Seek to achieve zero-carbon buildings ........................................................................................ 70
Strategy SD.2: Manage the campus forest to maximize carbon sequestration. ..................... 70 SD.2.1. Establish a permanent position to oversee the management of
University’s forest holdings ................................................................................................................. 71
SD.2.2.Inventory the University’s forest holdings and establish a plan to maximize carbon sequestration. ................................................................................................. 72

vi
SD.2.3. Develop and implement a management plan to improve and expand the campus urban forest ...................................................................................................................... 72
SD.2.4. Establish general forest acquisition goals and a ‘no net loss’ policy .............................. 72
Strategy SD.3: Refine campus agricultural practices to minimize fuel and chemical inputs, while maximizing sequestration ............................................................... 73
SD.3.1. Develop an agricultural and landscaping waste composting system............................ 73
SD.3.2. Identify additional opportunities to use agricultural wastes to generate new products ........................................................................................................................................... 75
SD.3.3. Maximize the use of organic, conservation-till agriculture on campus ........................ 75
SD.3.4. Manage herds to minimize associated emissions ................................................................... 75
Strategy SD.4: Minimize the carbon footprint of campus landscaping ..................................... 75 S.D.4.1. Develop a campus landscaping master plan designed to minimize chemical,
energy, and water use associated with campus landscaping .............................................. 76
S.D. 4.2. Improve turf quality on campus .................................................................................................. 76
S.D.4.3. Maximize recycling of landscaping organic waste ............................................................... 77
Strategy SD.5: Embody and implement low impact development (LID) principles ........... 77 S.D.5.1. Require the use of the LEED for Neighborhood Development Rating System
to guide future development decisions .......................................................................................... 78
S.D.5.2. Establish a cap on impervious surface ....................................................................................... 78
S.D.5.3 Select surface materials that are characterized by a high albedo, high emissivity, and low heat capacity .................................................................................................... 79
S.D.5.4. Require integration of green roofs into all new building designs; retrofit existing buildings where possible ................................................................................................... 79
Strategy SD.6: Maximize water conservation and reuse ................................................................. 79 S.D.6.1. Correct inefficiencies in campus steam utility systems ....................................................... 80
S.D.6.2. Upgrade water fixtures in campus buildings to maximize efficiency ........................... 80
S.D.6.3. Construct a water reclamation facility ...................................................................................... 81
Strategy SD.7: Increase campus recycling and waste reduction rates ...................................... 81 S.D.7.1. Increase campus food waste recycling ....................................................................................... 82
S.D.7.2. Establish a green purchasing policy to minimize packaging and other waste associated with campus purchases .................................................................................... 83
Transportation ............................................................................................................................... 84
Strategy T.1: Better integrate transportation into campus planning and design decisions ................................................................................................................................... 87
T.1.1. Develop a modal transportation advisory committee. ........................................................... 87
T.1.2. Develop a campus transportation master plan for travel to and from Storrs.............. 87
T.1.3. Establish a campus policy that transit be considered when planning new campus buildings ..................................................................................................................................................... 87
Strategy T.2: Decrease the campus vehicle fleet annual fuel use ................................................ 87 T.2.1. Establish fleet efficiency purchasing requirements .................................................................. 88
T.2.2. Phase out older, inefficient vehicles; replace with higher efficiency vehicles appropriate for the intended use ..................................................................................................... 88
T.2.3. Develop and implement a mandatory vehicle efficiency improvement program ....... 88
T.2.4. Enforce the state anti-idling policy ................................................................................................. 88
T.2.5. Increase the efficiency of on-campus delivery systems ........................................................... 89
T.2.6. Discourage unnecessary on-campus driving ............................................................................... 89
Strategy T.3: Increase the proportion of renewable fuels used annually ............................... 89 T.3.1. Increase the production and use of biodiesel in university vehicles .................................. 89
T.3.2. Increase the use of vehicles that run on carbon-neutral or low-carbon fuel sources ................................................................................................................................................ 90

vii
Strategy T.4: Decrease annual commuter single occupancy vehicle trip frequency and per capita commuter vehicle miles travelled .................................................... 91
T.4.1. Work with campus unions to encourage flexibility in employee workday definition .................................................................................................................................................... 91
T.4.2. Increase access and provide incentives for telecommuting and online courses .......... 91
T.4.3. Develop a campus rideshare incentive program ....................................................................... 91
T.4.4. Establish an on-campus carshare program ................................................................................ 92
T.4.5. Provide a weekday shuttle service to nearby off-campus park-and-ride lots ............... 93
T.4.6. Increase local housing options and availability ........................................................................ 93
T.4.7. Improve bicycle and pedestrian safety and access from off-campus housing .............. 93
T.4.8. Increase bus and shuttle availability to and from off-campus destinations .................. 94
T.4.9 Advocate for the development of a regional light rail commuting option ...................... 96
Strategy T.5: Redesign campus parking to minimize commuter emissions ........................... 96 T.5.1. Establish a campus parking cap ....................................................................................................... 96
T.5.2. Develop an incentive program to discourage parking pass purchases ........................... 97
T.5.3. Implement a campus-wide parking fee increase; use the revenue to fund improvements and expansions to campus mass transit options ........................................ 97
T.5.4. Price parking according to vehicle fuel efficiency and EPA emissions rating............... 97
T.5.5. Offer a reduced-cost parking pass, priority parking and related emergency support services for rideshare participants ................................................................................ 97
T.5.6. Develop a reduced-cost parking pass for motorcycles and scooter when registered as the sole vehicle ............................................................................................................. 98
Strategy T.6: Increase walking and biking ............................................................................................. 98 T.6.1. Hire a pedestrian and bicycle coordinator to ensure implementation of
Master Plan recommendations ......................................................................................................... 99
T.6.2. Improve campus bicycle amenities and paths ............................................................................ 99
T.6.3. Develop a bicycle commuter-incentive program .................................................................... 101
T.6.4. Create an affordable on-campus bicycle shop ......................................................................... 101
T.6.5. Establish a campus-wide bicycle loaner program ................................................................. 101
Strategy T.7: Reduce the carbon footprint of off-campus travel............................................... 101 T.7.1. Require vehicle rental programs to provide efficient and alternative fuel
vehicle options ....................................................................................................................................... 102
T.7.2. Negotiate discounted bus and train ticket rates for UConn faculty, staff and students ........................................................................................................................................... 102
T.7.3. Discourage air travel to locations within reasonable driving or train distance ...... 102
References ..................................................................................................................................... 103
Section 4: Funding ............................................................................................................. 105-128
Executive Summary .................................................................................................................... 108
Introduction .................................................................................................................................. 111
Balancing Long-Term Gains with Short-Term Investments ....................................................... 111
Don’t Forget to Measure Carbon Savings! ........................................................................................... 111
Ensuring Success: Administrative Costs ............................................................................. 112
Existing & Allocated Funds ...................................................................................................... 113
UConn Green Campus Fund ....................................................................................................................... 113
UConn 2000 & UConn 21st Century ........................................................................................................ 113
Potential On-Campus Funding Mechanisms ...................................................................... 114
Sale of Renewable Energy Credits .......................................................................................................... 114
Revolving Loan Fund .................................................................................................................................... 115

viii
Sale of Excess Power Generation ............................................................................................................ 116
Campus Energy Efficiency Incentive Program .................................................................................. 117
Campus Parking Surcharges ..................................................................................................................... 118
Self-Sustaining Forestry Program .......................................................................................................... 118
Student Utility/ Sustainability Fee ......................................................................................................... 119
Student Project & Activity Funding Sources ...................................................................................... 120
Alumni Funding Opportunities ................................................................................................................ 121
Voluntary Donation Program ................................................................................................................... 122
External Funding Opportunities ............................................................................................ 122
State & Federal Opportunities .................................................................................................................. 123
Private Funding Opportunities ................................................................................................................ 123 Direct Grant Opportunities ............................................................................................................................. 123
Performance Contracts & Energy Service Companies (ESCOs) ....................................................... 123
Third Party Financing Options...................................................................................................................... 124
Other On-Campus Partnerships .................................................................................................................... 124
Municipal Partnerships ............................................................................................................................... 125 White Tag Programs ......................................................................................................................................... 125
Related Resources ....................................................................................................................... 126
References ..................................................................................................................................... 128
Section 5: Education, Research & Outreach ............................................................. 129-140
Introduction ................................................................................................................................. 131
Undergraduate Education ....................................................................................................... 131
Research ........................................................................................................................................ 135
Green Depot Campus Initiative ............................................................................................................. 136
Outreach ........................................................................................................................................ 136
Conclusion .............................................................................................................................. ......139 UConn Case Study: Annual ‘EcoMadness’ Residence Hall Competition...............................................140
ix
Appendices
The American College and University Presidents Climate Commitment (ACUPCC) ........... A
2008-2009 UConn CATF Workgroups & Members .......................................................................... B
Environmental Sustainability Strategies Recommended for Further Consideration .................................................................................................................................... C
UConn Sustainable Design & Construction Policy .............................................................................D

x
Figures
Figure 1.1: Climate Action Planning and Implementation at the University of Connecticut .............................................................................................................................................. 9
Figure 2.1: 2007 Greenhouse gas emissions by scope ............................................................................. 19
Figure 2.2: 2007 Greenhouse gas inventory by source of emissions .................................................. 19
Figure 2.3: The UConn Storrs campus .............................................................................................................. 21
Figure 2.4: Campus Building Trends Pre-1900 to 2007 ........................................................................... 25
Figure 2.5: University of Connecticut Forest Tracts ................................................................................... 41
Figure 3.1: The UConn cogeneration facility went online in mid-2006. ............................................ 58
Figure 3.2: UConn fume hood reminder sticker ........................................................................................... 60
Figure 3.3: The UConn Burton Family Football Complex and Shenkman Training Center ................................................................................................................................... 68
Figure 3.4: The University’s 2004 Campus Sustainable Design Guidelines ...................................... 69
Figure 3.5: The University’s forest lands offer a multitude of primary and secondary benefits .................................................................................................................... 71
Figure 3.6: The University’s ‘Stop the Drop’ campaign educates about the importance of water conservation ............................................................................................. 80
Figure 3.7: The State of Connecticut has aggressive anti-idling laws in place to prevent unnecessary vehicle fuel use and to protect air quality ................................... 88
Figure 3.8: A biodiesel powered tractor displayed during the University’s 2009 Earth Day Spring Fling ..................................................................................................................... 90
Figure 3.9. New England's first zero-emission fuel cell-powered hybrid bus made its debut in Connecticut on April 10, 2007 .............................................................................. 90
Figure 3.10: Map of the UConn Storrs campus and nearby urban regions .......................................... 95
Figure 3.11: 2006 Proposed bicycle plan network ..................................................................................... 100

xi
Tables
Table 1.1: CAP Implementation Timeline .................................................................................................... 12
Table 2.1: 2007 UConn Storrs Greenhouse Gas Inventory ................................................................... 20
Table 2.2: 2007 Summary Data Normalized by Demographic Data................................................... 20
Table 2.3: Inventory Data Sources ................................................................................................................... 23
Table 2.4: Institutional Data ............................................................................................................................... 24
Table 2.5: UConn Storrs Campus: Physical Size.......................................................................................... 25
Table 2.6: Projected Storrs Campus Growth ............................................................................................... 27
Table 2.7: Scope 1 Emissions Summary......................................................................................................... 28
Table 2.8: On-Campus Cogeneration Plant Emissions Summary ........................................................ 29
Table 2.9: Other On-Campus Stationary Sources Fuel Use Summary ............................................... 30
Table 2.10: On-Campus Vehicle Fleet Fuel Inputs ........................................................................................ 30
Table 2.11: 2007 Refrigerant Purchases .......................................................................................................... 32
Table 2.12: Refrigerant Conversion ................................................................................................................... 32
Table 2.13: 2007 Greenhouse Gas Emissions Associated with Refrigerants .................................... 33
Table 2.14: Campus Agricultural Emissions ................................................................................................... 34
Table 2.15: Scope 2 Emissions Summary......................................................................................................... 35
Table 2.16: Purchased Electricity........................................................................................................................ 35
Table 2.17: NPCC New England (NEWE) Emissions Factors ................................................................... 35
Table 2.18: Scope 3 Emissions Summary......................................................................................................... 36
Table 2.19: Solid Waste Disposal Data .............................................................................................................. 37
Table 2.20: Wastewater Treatment Emissions Factors ............................................................................ 37
Table 2.21: Student Parking Permits Issued: 2007 & 2008 ..................................................................... 38
Table 2.22: 2007 Commuter Mileage and Fuel Use ..................................................................................... 39
Table 3.1: Summary of Reduction Strategy Evaluation Criteria .......................................................... 53
Table 3.2: Energy-Related Emissions Reduction Strategies .................................................................. 56
Table 3.3: Sustainable Development-Related Emissions Reduction Strategies ............................ 66
Table 3.4: Proposed Compost Facility Annual Waste Processing and Compost Production ......................................................................................................................... 73
Table 3.5: Maximum Methane (CH4) Generation Capacity of Feedstocks Suitable for Stabilization by Composting .................................................................................................. 74
Table 3.6: Transportation-Related Greenhouse Gas Emissions Reduction Strategies ............... 84
Table 3.7: Available Off-Campus Transportation-Services .................................................................... 95

The University of Connecticut Climate Action Plan:
Guiding the Path toward Carbon Neutrality
Storrs Campus August 2009
Section 1: The UConn Climate Action Planning Process

2
Section 1:
The UConn Climate Action Planning Process
Table of Contents
The University of Connecticut .................................................................................................... 3
The American College and University Presidents Climate Commitment (ACUPCC) 3
Why Did We Sign the ACUPCC? .................................................................................................................. 3
A Proven Track Record in Environmental Sustainability ................................................................ 3
Looking Toward the Future .......................................................................................................................... 6
Organizational Structure .............................................................................................................. 6
Environmental Policy Advisory Council .................................................................................................. 6
Environmental Policy Statement ................................................................................................................ 6
Climate Action Task Force (CATF)............................................................................................................. 7
CATF Workgroups ............................................................................................................................................ 8
Climate Action Plan (CAP) Project Manager .......................................................................................... 9
Developing the Climate Action Plan ......................................................................................... 9
UConn Climate Action Plan .......................................................................................................10
CAP Overview .................................................................................................................................................. 10
Emission Reduction Goal & Interim Milestones................................................................................ 10
CAP Implementation & Timeline ............................................................................................................. 11
A Final Note…. .................................................................................................................................13
References .......................................................................................................................................14
Cover Photo: University of Connecticut President, Michael Hogan, signed the American College and University Presidents Climate Commitment on March 25, 2008. From left to right: Kristin Sullivan, UConn Public Interest Research Group; Rich Miller, Director of Environmental Policy; President Hogan; Jonathon the Husky; Gregory Anderson, Then Vice Provost; and Gina McCarthy, then-Commissioner, Connecticut Department of Environmental Protection. (Present but not pictured: Bianca Lopez, Co-President of the EcoHusky student group.)

3
The University of Connecticut
The University of Connecticut (UConn) is the State of Connecticut’s premiere institution of higher learning. Located in rural Storrs-Mansfield, Connecticut, UConn began in 1881 as the Storrs Agricultural School with three faculty members and a student body of 12. Today, UConn is a top-ranked public research university with international impact. To learn more about the University please visit www.uconn.edu.
The American College & University Presidents Climate Commitment
With the support of many students, faculty, and staff members, President Michael Hogan signed the American College and University Presidents Climate Commitment (ACUPCC) on March 25, 2008 (Appendix A). The ACUPCC recognizes that institutions of higher education have a unique responsibility to not only educate the next generation of individuals responsible for developing the social, economic and technological solutions to reverse global warming, but also to serve as role models by embracing sustainability initiatives on campus. By signing the Commitment, President Hogan pledged that the University of Connecticut will eliminate the Storrs campus’ greenhouse gas (GHG) emissions over time.
Why Did We Sign the ACUPCC?
UConn was well-positioned to become a signatory to the American College & University President’s Climate Commitment (ACUPCC). Prior to signing, the University had already taken several of the steps that are otherwise required within two years after signing the commitment. UConn’s Office of Environmental Policy (OEP) had completed GHG inventories for the Storrs Campus for 2005 and 2006, and the 2007 inventory was already underway. Existing GHG emissions reduction activities included a Sustainable Design & Construction Policy setting LEED silver certification as a minimum performance standard, energy-efficient lighting retrofits, converting waste cooking oil into biodiesel fuel for the highly-utilized campus bus system, the construction and operation of an on-campus natural gas fired cogeneration facility, an energy efficient purchasing policy, green cleaning policy, participation in the national RecycleMania contest, and other campus sustainability efforts.
The University strives to continually improve campus environmental sustainability. Becoming an ACUPCC signatory is one of many ways that the University continues to challenge itself to perform better and in a more environmentally responsible manner. The following section details milestones in the University’s commitment to environmental sustainability and climate change awareness over the past six years.
A Proven Track Record in Environmental Sustainability
In 2003, the University of Connecticut established an Office of Environmental Policy to address campus environmental sustainability and compliance issues. Since that time, environmental awareness and campus sustainability has increased greatly. The following list is a sample of the many environmental sustainability and climate change awareness activities occurring at the University.
2002-2003

4
The University hires a new senior-level position, Director of the Office of Environmental Policy, to focus on improving environmental performance.
2003-2004
The University forms and convenes a 25-30 member Environmental Policy Advisory Council (EPAC). The EPAC is charged with advising the president and provost on campus environmental issues.
The University adopts its first overall Environmental Policy Statement, committing to environmental leadership through performance, responsible management and growth, conservation, academics, outreach, and teamwork.
Former UConn President, Philip Austin, signs the New England Governors’/Eastern Canadian Premiers’ and New England Board of Higher Education’s Climate Change Action Plan and Pledge, marking the first long-term commitment to quantify and reduce campus GHG emissions.
The EcoHusky Student Group forms to focus on campus sustainability projects and environmental outreach. The EcoHusky Student Group will eventually grow to become one of the largest, most active student organizations on campus.
2004-2005
UConn commits to green building by adopting its own Campus Sustainable Design Guidelines (SDGs). These SDGs apply to all construction and renovation projects, including $1.3 billion worth of capital improvement projects scheduled to occur by 2015.
The UConn Biofuels Consortium, a faculty team from multiple academic disciplines, forms to research and develop techniques associated with the optimization of biofuel production. The group begins converting Dining Services’ waste cooking oil into biodiesel fuel for campus buses.
A Master Plan is developed for the University’s agricultural campus (East Campus). It is the first UConn Master Plan to focus on conservation goals as well as development opportunities.
2005-2006
UConn’s state-of-the-art natural gas fired cogeneration facility begins operation, replacing several oil-fired utility boilers. The facility reduces the University’s reliance on off-site power plants for electricity while avoiding approximately 30,000 tons of GHGs annually1.
The University partners with Connecticut Light & Power (CL&P) to establish an annual compact fluorescent light bulb (CFL) giveaway program for incoming students. Thousands of free CFLs are distributed to incoming freshmen, reducing lighting-related campus energy demand.
2006-2007
Seeking to promote energy efficient and environmentally sensitive practices on campus, the UConn Foundation establishes a Green Campus Fund to support sustainability initiatives and green building enhancements for new construction and renovation projects.
The Office of Environmental Policy and Residential Life sponsor “EcoMadness,” UConn’s first residential hall water and energy conservation contest. The event raises student environmental awareness by providing real-time data from building sub-meters, allowing them to accurately track their progress.
1Emissions reduction estimates are based upon a 2006 comparison to fossil-fuel powered power plants on the regional grid generating a similar quantity of electricity.

5
UConn completes construction of the 165,000 square foot, $48 million Burton Family Football Complex and Mark R. Shenkman Training Center, the first LEED Silver-certified athletic facilities in the NCAA. Energy conservation features include infrared radiant heating, heat recovery units, energy efficient lighting, occupancy sensors, window glazing, and use of locally-manufactured, recycled and renewable building materials.
Fleet fuel efficiency is examined and a Preferred Vehicle Purchasing List is issued to assist departments in purchasing vehicles with competitive fuel efficiency.
A “No-idling” statement is endorsed and issued university-wide to reduce emissions from idling vehicles.
2007-2008
The University adopts its first Sustainable Design & Construction Policy, establishing the LEED Silver rating as a minimum performance requirement for all new construction projects exceeding $5 million in costs, and major renovations.
Major improvements are made to the University’s recycling program, including the investment of $100,000 towards new containers, postering and campus-wide outreach and education efforts.
The School of Engineering, College of Liberal Arts & Sciences, College of Agriculture and Natural Resources, and the UConn Biofuel Consortium host a two day sustainable energy symposium, bringing state and federal policy makers, businesses, and research groups together to discuss alternative energy.
The Office of Environmental Policy and the Vice-Provost's office work together to participate in the national Focus the Nation event. More than 3,000 UConn students as well as staff, faculty and community members participate. The event includes a two-day global warming teach-in with classes from a variety of academic disciplines devoted to discussing climate change. Other events include a free showing of the movie, The 11th Hour, a webcast of The 2% Solution, and a faculty panel discussion.
UConn students take their concerns to Congress. Students from the EcoHusky student group and ConnPIRG join over 5,000 other youth in Washington D.C. for Power Shift, a conference which empowers youth to take action against climate change. Students attend three days of conferences and events which culminate with a trip to the United States Capitol Building to speak directly with legislators and rally in the front mall.
The Office of Environmental Policy and the Town of Mansfield partner to host a conference on climate change. The conference features faculty experts, as well as state and town officials, who discussed the science and policy of climate change.
On March 25, 2008, President Michael Hogan signs the American College & University Presidents Climate Commitment committing the university to establishing an action plan to achieve carbon neutrality by 2050. An eight-member Climate Action Task Force is appointed to oversee the development of a campus Climate Action Plan.
UConn Dining Services initiates campus-wide “trayless” dining and begins producing local honey from a campus apiary.
The Office of Environmental Policy and EcoHusky partner with the Dining Services Local Routes Program for the first combined “Spring Fling,” the University’s annual Earth Day celebration. The event draws thousands throughout the day to Fairfield Way in the campus center.
2008-2009
6
UConn hires a Climate Action Plan Project Manager to assist in its climate planning efforts. The Climate Action Task Force and associated workgroups meet regularly to develop a campus Climate Action Plan.
Student interns in the Office of Environmental Policy develop a set of Sustainable Office Guidelines to encourage students, faculty and staff to incorporate principles of sustainability into all aspects of their daily work environments. To complement this effort the OEP begins offering an in-person training program for interested offices and departments.
EcoMadness, the University’s annual inter-residence hall energy and water conservation contest, occurs during September and October. First launched in 2006, the contest now includes all freshman-dominated residence halls. As part of the competition, student volunteers hand out free CFL light bulbs and go door-to-door to talk with their peers about their carbon footprint.
The EcoHusky Student Group organizes a "GreenWeek" during November to raise campus environmental awareness. To complement the Climate Action Plan drafting process, each day is themed to match a particular CATF workgroup's initiatives.
A Student Climate Action Summit is held to educate students about the University's ACUPCC efforts and to solicit their input. This peer-to-peer event included student-led brainstorming activities and discussions.
UConn hosts a campus wide Climate Change Teach-In as part of the nationwide climate change awareness event (formerly known as “Focus the Nation”). During the first week of February, faculty members commit to setting aside a class period for a lesson or discussion of climate change within the context of their discipline.
UConn further integrates sustainability into the curriculum and educational experience through the development and release of the University’s 2009-2014 academic plan, Our World, Our People, Our Future, which identifies the environment as one of three focus areas of excellence.
Looking Towards the Future
As described, UConn was well positioned to become an ACUPCC signatory. Nevertheless, there were still many opportunities to further increase the University’s environmental sustainability and reduce the campus carbon footprint. It was with this understanding in mind that the University signed the American College and University Presidents Climate Commitment and embarked on a climate action planning process.
Organizational Structure
Environmental Policy Advisory Council
In 2003, the President and Board of Trustees appointed a 25-30 member Environmental Policy Advisory Council (EPAC), which is chaired by the Director of Environmental Policy. Members are selected from across the University, including the student body, and serve 1-2 year appointments. This senior advisory group has become a vehicle to engage UConn students, faculty members, administrators, alumni, and staff members in a dialogue about environmental stewardship, sustainability, and leadership.
Environmental Policy Statement

7
The primary purpose of the EPAC is to facilitate the implementation of the University’s Environmental Policy Statement, which was drafted by the EPAC and adopted by the University in 2004.
The Statement outlines the University’s commitment to environmental sustainability, specifically to the following environmental leadership principles:
Performance. The University will institutionalize best practices, comply with environmental laws, regulations and standards, and continually monitor, report on, and improve its environmental performance.
Responsible management and growth. The University will endeavor to design, construct and maintain its buildings, infrastructure and grounds in a manner that ensures environmental sustainability and protects public health and safety.
Outreach. The University will promote environmental stewardship in Connecticut and embrace environmental initiatives in partnership with its surrounding communities.
Academics. The University will advance understanding of the environment through its curriculum, research and other academic programs, and will employ an ethic of environmental stewardship in all intellectual pursuits.
Conservation. The University will conserve natural resources, increase its use of environmentally sustainable products, materials and services, including renewable resources, and prevent pollution and minimize wastes through reduction, reuse and recycling.
Teamwork. The University will encourage teamwork and provide groups and individuals with support, guidance and recognition for achieving shared environmental goals.
It was with these principles in mind that President Hogan signed the ACUPCC on behalf of the University of Connecticut:
Climate Action Task Force
Given the specific focus of the ACUPCC on carbon neutrality through GHG emission reduction, President Hogan appointed a Climate Action Task Force (CATF) to oversee the development of a campus Climate Action Plan. As listed below, the eight-member task force includes representation from University Administration and Operations, the Budget Office, Student Affairs, the Environmental Policy Office, the Provost for Academic Administration’s Office, and the UConn Center for Environmental Science and Engineering. In addition, there is a student body representative and a representative from the Town of Mansfield.
CATF Co-Chairs:
Tom Callahan, Associate Vice President, Administration & Operations
Rich Miller, Director, Office of Environmental Policy
“Public universities have a unique opportunity to take leadership in efforts to reduce our society’s ecological footprint...UConn already has a proven track record in environmental sustainability, owing to the energies and
expertise of our dedicated faculty, staff, and students. Signing the PCC and agreeing to do our part in curbing carbon emissions formalizes our ongoing commitment to playing a leadership role in environmental stewardship.”
~ Michael Hogan, UConn President

8
Additional CATF Members:
Dr. Nancy Bull, Vice Provost, Academic Administration
Dr. Julie Bell-Elkins, Assistant to the VP of Student Affairs , Student Affairs
Nick Frechette, Undergraduate Student, Chemical Engineering
Matt Hart, Town Manager, Town of Mansfield
Chuck Morrell, Student Union Associate Director, Student Affairs
Lysa Teal, Director, Budget Office
Dr. Michael Willig, Professor , Ecology & Evolutionary Biology; Director, Center for Environmental Science & Engineering
CATF Workgroups
The CATF was selected to represent the major interests of the University and the community, and to serve as an oversight committee for the broader climate action planning process. To carry out the day-to-day aspects of developing a Climate Action Plan, three workgroups were established:
The Energy Workgroup was charged with identifying strategies to reduce emissions associated with campus energy production, distribution and use. Topics of discussion included energy efficiency retrofits and installations, utility infrastructure improvements, renewable energy use, and conservation.
The Transportation Workgroup focused on neutralizing transportation-related emissions. Proposed strategies dealt with encouraging the use of alternative modes of transportation (e.g., bicycling, walking), improving the campus fleet fuel efficiency through vehicle and fuel selection, and reducing single occupancy vehicle trips to, from and around campus.
The Sustainable Development Workgroup was asked to address GHG emission reduction strategies related to responsible growth and management (e.g., forest and open space preservation, sustainable landscaping, and low impact design) and green building.
The purpose of each CATF workgroup is to outline components of a University Climate Action Plan (for the UConn Storrs campus) related to the workgroup's scope, and to identify specific projects or initiatives that will result in measurable GHG emissions reductions as required by the Presidents Climate Commitment, while continually reflecting the principles of the University's Environmental Policy Statement. Workgroup efforts were expected to not only result in emissions reductions, but to continue to improve overall campus sustainability. For each workgroup, a faculty member and a member of the university staff were identified to serve as co-chairs. By identifying a staff-faculty team for each workgroup, the CATF hoped to encourage the identification of strategies that combined practical implementation (e.g., experience-based) with novel approaches (e.g., research based).
In addition to the three newly formed CATF Workgroups, two existing workgroups of the EPAC were called on to assist with the climate action planning effort:
The Recycling and Waste Reduction Workgroup, led by UConn’s Sustainability Coordinator, focused on identifying strategies to reduce campus waste and increase recycling rates.
The Environmental Literacy Workgroup, led by faculty co-chairs in environmental disciplines, assisted with the identification of environmental sustainability and climate change related academic, research, and outreach opportunities for inclusion in the Climate Action Plan.
Once the workgroups were established, campus experts (e.g., faculty, staff and students) in the associated topic areas (e.g., energy, transportation, sustainable development) were identified and

9
invited to participate. The workgroups, however, were open to anyone who wanted to be involved, including residents of the surrounding towns. In all cases, participation in workgroups was voluntary and workgroups operated by consensus. The University’s gratitude extends to more than 100 volunteers from across the University, and to the managers and administrators who enabled their participation. A list of the three CATF workgroup co-chairs and participating members is provided in Appendix B.
Climate Action Plan Project Manager
During the 2008-2009 academic year, the University hired a Climate Action Plan Project Manager (CAP-PM) to assist the CATF with organizing the activities of the CATF workgroups. Initially hired through a graduate assistantship, the CAP-PM was later employed as a full-time, temporary employee in the University’s Office of Environmental Policy. The CAP-PM reported directly to the CATF Co-Chairs.
The CAP-PM coordinated all meetings and planning activities of the CATF and related workgroups in developing the UConn Climate Action Plan. Serving as the lead staff person in the CAP planning process, the CAP-PM was responsible for preparing for and facilitating discussions at the CATF and workgroup meetings and coalescing all information gathered into a deliverable CAP that met the requirements of the ACUPCC. The CAP-PM worked closely with all parties involved, periodically providing draft components of the CAP to the respective workgroups and CATF for review.
Developing the Climate Action Plan
The complete climate action planning “cycle” at the University of Connecticut is depicted in the figure below:
Figure 1.1. Climate Action Planning and Implementation at the University of Connecticut.

10
Once the CATF was appointed and workgroups were formed, the climate action planning process began. CATF workgroups met bi-monthly between October 2008 and May 2009. Early meetings focused on brainstorming possible solutions to reducing the University’s emissions. Later meetings focused on prioritizing efforts and tying proposed strategies into existing University projects and operations. Final meetings focused on evaluating the feasibility and impact of the proposed strategies and combining them into a coherent plan. The following four metrics were used to select strategies for inclusion in the final Climate Action Plan:
1. GHG Reduction Benefit 2. Return on Investment (ROI) 3. First Cost 4. Implementation Timeframe
During the summer of 2009, the CAP-PM organized meetings of specific workgroup volunteers (i.e., experts on a given topic) to refine final drafts. The final draft was presented to the CATF for approval in August 2009. Upon adopting the plan, the EPAC will be charged with implementation, identification of cost savings and funding opportunities, and tracking progress over time.
UConn Climate Action Plan
CAP Overview
The following sections of this document provide an overview of the University’s baseline 2007 greenhouse gas emissions and the University’s emission reduction strategies. In general, this CAP is intended to be used as a tool to identify ways to achieve those strategies, set timelines, quantify the costs and benefits of proposed projects, and prioritize actions. Specifically, the plan was developed to assist the University in its efforts to:
Reduce GHG emissions, in particular those emissions associated with the use of fossil fuels for energy and transportation;
Increase the efficiency of campus operations including energy supply and distribution systems and campus transportation systems;
Use green technology and practices where possible;
Increase the proportion of campus energy supplied from renewable sources, including, but not limited to wind, geothermal, solar, and hydroelectric;
Seek to be an innovator and leader in the environmental sustainability movement by using the Storrs Campus as a demonstration platform for alternative technologies and strategies;
Plan responsibly for the future, when making campus development and land use management decisions to ensure the conservation of natural resources and the preservation of a vibrant, thriving and biologically diverse campus community.
Emission Reduction Goal & Interim Milestones
As a signatory of the ACUPCC, it is the goal of the University to achieve carbon neutrality over time. However, even with a rigorous greenhouse gas emission reduction plan, large research universities are unlikely to achieve this goal without the purchase of carbon offsets (AASHE 2009). Unfortunately, the economic climate has changed significantly since the University first signed the ACUPCC in 2008. The University remains committed to minimizing greenhouse gas emissions nonetheless, but cannot in good

11
faith suggest the investment of public funds in carbon offsets during a time of fiscal stress. Any funding acquired to support this effort will instead be focused on maximizing the efficiency of campus infrastructure, minimizing overall energy demand, and ensuring the graduation of environmentally conscious students. After the next review of the Climate Action Plan in 5 to 7 years, the plan will be revised to consider the possibility of investing in carbon offsets or other alternatives, with an ultimate goal of carbon neutrality by 2050.
Initial milestones suggested by the CATF included those set forth by the State of Connecticut Public Act 08-98, An Act Concerning Connecticut Global Warming Solutions, which has set a GHG emissions reduction goal for the state of 1990 levels by Jan 2010 and 10% below 1990 levels by Jan 2020. In addition, P.A. 08-98 sets an ultimate regional target of 75-85% below 2001 levels by 2050. However, due to data availability issues, the University has not been unable to establish a reliable estimate of 1990 GHG emissions.
The University instead will strive to achieve a ‘2% solution,’ or an average annual target of an additional 2% below 2007 levels (scope 1 and 2 emissions). It is anticipated that during certain years the University will exceed a 2% reduction, while in other years such a reduction will be difficult. Therefore the University will strive for an average annual reduction rate of 2% below 2007 levels, or the following interim milestones:
2020 – 26% below 2007 levels
2032 – 50% below 2007 levels
2050 – 86% below 2007 levels
These milestones are goals to help guide implementation and assess progress. The University will, however, periodically assess these goals and changes in University circumstances to determine their feasibility. These milestones therefore may be adjusted as implementation of the CAP progresses.
The 2% solution approach will not result in complete carbon neutrality, but rather an 86% reduction below 2007 levels by 2050. It is recommended that the remaining 14% be offset through a ‘white tag’ program, whereby the University invests in emissions reduction projects at the regional campuses or the surrounding community but retains the resulting emission reduction credits.
CAP Implementation & Timeline
The Environmental Policy Advisory Council (EPAC) will serve as the Steering Committee to oversee CAP implementation. EPAC will be therefore be responsible for ensuring submission of annual greenhouse gas inventories and biannual progress reports to the Association for Advancement of Sustainability in Higher Education (AASHE) in compliance with ACUPCC requirements. Similarly, EPAC will be expected to provide annual progress reports to the President.
Finally, the CAP is meant to be a “working document” that proposes solutions based on existing data, knowledge and circumstances. Therefore, to remain current and practical, the plan will need to be reviewed by the EPAC on an ongoing basis, with anticipated revisions compiled into an updated Plan at 5-7 year intervals, similar to campus master plans.
Table 1.1 outlines the proposed timeline for the initial 5-7 years of CAP implementation.

12
Table 1.1. CAP Implementation Timeline
Timeframe Action Responsibility
Immediate (within 1 year):
Establish an EPAC CAP Workgroup to begin implementation of the CAP and to track progress.
EPAC
Convene a campus greenhouse gas inventory metadata workgroup.
EPAC CAP Workgroup, Office of Environmental Policy
Assign a staff member to serve as a temporary, part-time CAP support staff (e.g., assist with selection of strategies for initial implementation, identification of funding, and tracking progress).
University Administration
Compile the 2008 and 2009 greenhouse gas inventories.
Office of Environmental Policy (student intern)
Short-term (within 2-3 years):
Work with relevant departments to establish a MOA regarding annual data submission requirements and reporting protocol.
Inventory Metadata Workgroup, EPAC CAP Workgroup
Establish a permanent position to assist the EPAC with oversight of CAP implementation, identification and acquisition of funding sources, and tracking progress.
University Administration
Long-term (within 5-7 years):
Review the CAP and recommend revisions and updates, as appropriate.
EPAC CAP Workgroup
Establish a web-based data reporting process for the University’s inventory.
Inventory metadata workgroup, EPAC CAP Workgroup
Ongoing Actions:
Identify and pursue funding sources, including external sources.
EPAC CAP Workgroup
Compile annual greenhouse gas inventories. Office of Environmental Policy, Inventory Metadata Workgroup
Provide annual summary reports of the University’s greenhouse gas inventory and CAP implementation progress to the President.
EPAC
Submit annual inventory reports and biannual progress reports to AASHE.
EPAC, Office of Environmental Policy

13
A Final Note…
Addressing campus waste, energy, transportation, and sustainable development issues can have many environmental, economic and social benefits beyond the reduction of greenhouse gas emissions. In fact, many of the unique strategies initially considered by the CATF workgroups may have little impact on the University’s overall emissions profile. Nevertheless, the scope of this report and the CATF’s charge was to focus on strategies that directly contributed to a reduction in the campus greenhouse gas emissions. A list of strategies considered by workgroups, which are believed to have potential to improve campus sustainability, but were determined to result in negligible greenhouse gas emissions reductions, are included in Appendix C. It is recommended that these strategies be evaluated for further consideration by the University’s Environmental Policy Advisory Council.

14
References
Association for the Advancement of Sustainability in Higher Education (AASHE). 2009. “Carbon Offsets.” Climate Action Planning Wiki. Accessed from http://www.aashe.org/wiki/climate-planning-guide/carbon-offsets.php on 24 July 2009.

The University of Connecticut Climate Action Plan:
Guiding the Path toward Carbon Neutrality
Storrs Campus August 2009
Section 2: Greenhouse Gas Inventory

16
Section 2:
Greenhouse Gas Inventory
Table of Contents
Executive Summary ......................................................................................................................18
2007 Inventory Results ............................................................................................................................... 18
Future Inventories......................................................................................................................................... 18
Inventory Boundaries ..................................................................................................................21
Temporal Boundaries .................................................................................................................................. 21
Organizational Boundaries ........................................................................................................................ 21
Operational Boundaries .............................................................................................................................. 22
Institutional Data ..........................................................................................................................24
Projected Campus Growth .........................................................................................................25
Building Growth ............................................................................................................................................. 26
Student Enrollment ....................................................................................................................................... 26
Scope 1 Emissions .........................................................................................................................28
Cogeneration Facility ................................................................................................................................... 28
Other Stationary Sources ............................................................................................................................ 29
On-Campus Vehicle Fleet ............................................................................................................................ 30 Hybrid-Electric and Electric Vehicles ......................................................................................................... 30
Campus Bus & Shuttle System ....................................................................................................................... 31
Biodiesel Production & Use ............................................................................................................................ 31
Bicycling & Walking .......................................................................................................................................... 31
Refrigerants & Chemicals ........................................................................................................................... 32
Refrigerants ................................................................................................................................................. 32
Green Cleaning ............................................................................................................................................ 33
Agricultural Emissions: Fertilizer Applications & Animal Husbandry .................................... 33
Scope 2 Emissions .........................................................................................................................34
Purchased Electricity ................................................................................................................................... 35
Scope 3 Emissions .........................................................................................................................36
Solid Waste Disposal .................................................................................................................................... 36
Wastewater Treatment ............................................................................................................................... 37
Student, Faculty & Staff Commuting ...................................................................................................... 38

17
Off-Campus Travel ......................................................................................................................................... 39 Study Abroad ....................................................................................................................................................... 39
Directly Financed Off-Campus Travel ........................................................................................................ 39
Offsets & Sequestration Activities ...........................................................................................40
Forest Management ...................................................................................................................................... 40
Composting....................................................................................................................................................... 42 Floriculture Greenhouse .................................................................................................................................. 42
Plant Science Farm ............................................................................................................................................ 42
EcoGarden Club & Dining Services .............................................................................................................. 43
Proposed Agricultural Waste Composting Facility .............................................................................. 43
Conclusion .......................................................................................................................................43
Understanding Increases in Emissions ................................................................................................. 43
Limitations of the Current Inventory .................................................................................................... 44
Recommendations for Future Improvement ..................................................................................... 45
References .......................................................................................................................................47

18
Executive Summary
This inventory represents the University’s first comprehensive attempt to document our greenhouse gas emissions in relation to campus sustainability efforts. While it is not without limitations, it is a reliable tool to guide future action. Emission values noted throughout this document are meant to provide a baseline for comparison between emission sources, but are assumed to be estimates. The following pages provide a detailed estimate of the University’s 2007 greenhouse gas emissions, as compiled by student interns in the UConn Office of Environmental Policy using Version 6.1 of the Clean Air Cool Planet (CACP) Campus Carbon Calculator.
The UConn greenhouse gas inventory is conducted according to the calendar year, and addresses activities at the main campus in Storrs, Connecticut (including the nearby Depot Campus and several parcels in Mansfield, Connecticut). All scope 1 and 2 emissions are well-documented and form the basis for the University’s carbon neutrality commitment. Scope 3 emissions are included to the extent that data was available.
2007 Inventory Results
The University scope 1 and 2 emissions during the 2007 calendar year totaled approximately 179,000 MTeCO2. The vast bulk of the University’s emissions come from energy-related activities, specifically the on-campus generation and use of electricity and steam production (i.e., operation of the university cogeneration facility) and the use of purchased electricity. Additional scope 1 emissions sources documented include on-campus stationary sources (e.g., boilers, chillers and generators), the campus fleet, refrigerants, animal husbandry, and fertilizer applications. Scope 3 emission sources (e.g., solid waste disposal, wastewater treatment, commuter emissions, off-campus travel) are also discussed, but analysis was limited by data availability and emissions values are, therefore, likely underestimated. Figures 2.1 and 2.2 provide an overview of the 2007 inventory. Detailed values are provided in Table 2.1.
Future Inventories
As the inventory process becomes more institutionalized, the quality and accuracy of the campus greenhouse gas inventory are likely to improve. However, as emissions sources are better ‘captured’ through data collection and analysis improvements, an apparent increase in campus emissions is likely to be observed, even in the absence of true increases in emissions. Caution should therefore be exerted when comparing data and inventories.
Goals for future campus greenhouse gas inventorying efforts include increasing awareness and understanding of the process, maximizing efficiency and continuity of the data collection, and improving the inventory to identify data gaps, provide greater reporting flexibility, and better capture overall campus emissions and credits (i.e., carbon sequestration opportunities). In order to achieve these improvements, it is recommended that the University form a campus greenhouse gas inventory meta-data workgroup and continue to allocate funding for a student intern dedicated to compiling the inventory. The workgroup and intern will be responsible for working with relevant departments to establish an understanding of data requirements and develop associated annual reporting protocols. Finally, it is recommended that the University establish a web-based automated data reporting process and seek periodic third party verification.

19
Figure 2.1. 2007 Greenhouse gas emissions by scope.
Figure 2.2. 2007 Greenhouse gas inventory by source of emissions.

20
Table 2.1. 2007 UConn Storrs Greenhouse Gas Inventory
Emission Source:
Energy Consumption
(MMBtu) CO2 (kg)
CH4 (kg)
N2O (kg)
eCO2 (Metric Tons)
%Total Emissions (eCO2 )
1
Scope 1
Co-gen Electricity 1,077,043.2 56,947,522.6 5,715.6 117.1 57,113.6 27.4
Co-gen Steam 678,671.5 35,884,038.3 3,601.6 73.8 35,988.7 17.2
Other On-Campus Stationary 1,232,864.5 68,291,157.1 7,379.2 217.6 68,525.3 32.9
Campus Fleet 37,010.5 2,619,527.6 347.4 127.4 2,665.2 1.3
Refrigerants & Chemicals 0.0 0.0 0.0 0.0 3,317.3 1.6
Agriculture 0.0 0.0 37,944.5 528.1 1,029.0 0.5
Scope 2 Purchased Electricity 174,933.5 10,272,158.1 196.7 135.6 10,316.8 4.9
Scope 2 T&D Losses 17,301.1 1,015,927.7 19.4 13.4 1,020.3 --
Scope 3
Solid Waste 0.0 -271,040.0 30,115.6 0.0 421.6 0.2
Wastewater 0.0 0.0 0.0 614.4 181.9 0.1
Student Commuting 160,852.4 11,279,052.7 2,256.1 776.6 5,408.4 2.6
Faculty & Staff Commuting 75,249.7 5,276,549.9 1,055.5 363.3 11,560.8 5.5
Off-Campus Travel 81,588.6 16,014,591.4 157.8 181.2 16,071.9 7.7
Totals
Scope 1 3,025,589.7 163,742,245.6 54,988.3 1,064.0 168,639.2 80.8
Scope 2 192,234.6 11,288,085.8 216.1 149.0 10,316.8 4.9
Scope 3 317,690.7 32,299,154.0 33,585.0 1,935.5 33,644.6 16.1
Scope 1+2 3,217,824.3 175,030,331.4 55,204.4 1,213.0 178,956.0 85.7
Scope 1+2+3 3,535,515.0 207,329,485.4 88,789.4 3,148.5 212,600.6 100.0
Table 2.2. 2007 Summary Data Normalized by Demographic Data
Operating Budget g e CO2 / $ 276.8
Research Budget kg e CO2 / $ 3.8
Energy Budget kg e CO2 / $ 7.2
Students MT e CO2 / Person 10.9
Community Members MT e CO2 / Person 9.1
Building Space kg e CO2 / ft2 19.9
Research Building Space kg e CO2 / ft2 294.8
Heating Degree Days MT e CO2 / HDD 37.0
Cooling Degree Days MT e CO2 / CDD 316.8
1 Values do not total to 100 due to rounding.
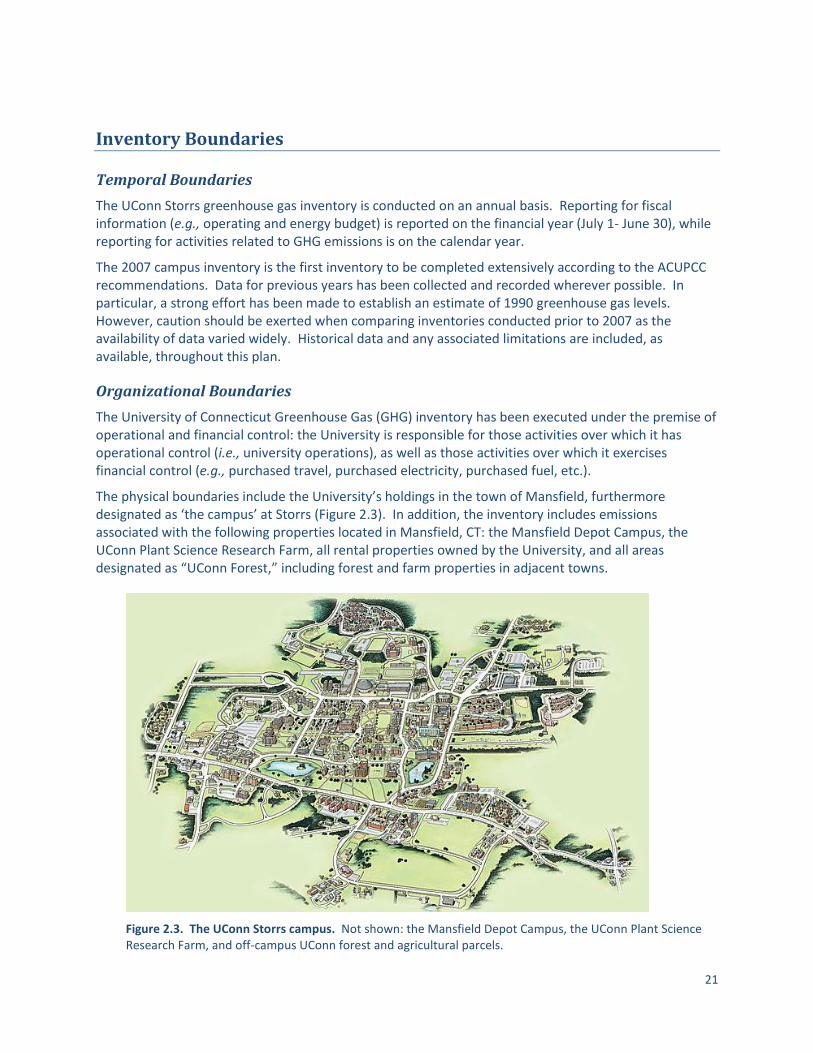
21
Inventory Boundaries
Temporal Boundaries
The UConn Storrs greenhouse gas inventory is conducted on an annual basis. Reporting for fiscal information (e.g., operating and energy budget) is reported on the financial year (July 1- June 30), while reporting for activities related to GHG emissions is on the calendar year.
The 2007 campus inventory is the first inventory to be completed extensively according to the ACUPCC recommendations. Data for previous years has been collected and recorded wherever possible. In particular, a strong effort has been made to establish an estimate of 1990 greenhouse gas levels. However, caution should be exerted when comparing inventories conducted prior to 2007 as the availability of data varied widely. Historical data and any associated limitations are included, as available, throughout this plan.
Organizational Boundaries
The University of Connecticut Greenhouse Gas (GHG) inventory has been executed under the premise of operational and financial control: the University is responsible for those activities over which it has operational control (i.e., university operations), as well as those activities over which it exercises financial control (e.g., purchased travel, purchased electricity, purchased fuel, etc.).
The physical boundaries include the University’s holdings in the town of Mansfield, furthermore designated as ‘the campus’ at Storrs (Figure 2.3). In addition, the inventory includes emissions associated with the following properties located in Mansfield, CT: the Mansfield Depot Campus, the UConn Plant Science Research Farm, all rental properties owned by the University, and all areas designated as “UConn Forest,” including forest and farm properties in adjacent towns.
Figure 2.3. The UConn Storrs campus. Not shown: the Mansfield Depot Campus, the UConn Plant Science Research Farm, and off-campus UConn forest and agricultural parcels.

22
The ACUPCC was signed by President Hogan in March 2008, specifically on behalf of the UConn Storrs (e.g. main) campus. Therefore, the inventory does not include the University’s regional campuses located elsewhere throughout the state (e.g., Avery Point, Greater Hartford, Stamford, Torrington, and Waterbury campuses, the UConn Health Center, or the UConn Law School).
Operational Boundaries
The University’s baseline for planning carbon neutrality includes all 2007 scope 1 and 2 emissions. The University is committed to tracking and reporting scope 1, 2, and 3 data, where realistically feasible (i.e., to the extent that data is available).
Scope 1 emissions are direct emissions from sources that are owned or controlled by the University. Scope 1 emissions, therefore, include those emissions resulting from the following sources:
Energy (i.e., thermal and electric) generated on campus
Operation of the university vehicle fleet (e.g., combustion of fossil fuels)
Fugitive emissions associated with the use and storage of refrigerants and chemicals
Fertilizer applications (e.g., nitrous oxide)
Campus agricultural herds (e.g., methane)
Scope 2 emissions are indirect emissions from sources that are neither university-owned nor operated, but whose products are directly linked to on-campus energy consumption. Since UConn does not purchase steam or chilled water from off-campus sources, the University’s scope 2 emissions are limited to those emissions resultant from electricity purchased from an outside supplier. Although produced off-site, the university exerts a certain degree of control over these emissions through the selection and purchase (and therefore financing) of power suppliers who offer an electrical mix with greater proportions of renewable energy (e.g., hydroelectric, wind, or nuclear).
Scope 3 emissions are all other indirect emissions that are attributed to the University that are neither University owned nor operated but are either directly financed or otherwise linked to the University. In most cases, the University has more limited control over these emissions (as compared to scope 1 and 2 emissions). The University of Connecticut accounts for the scope 3 emissions associated with the following activities:
Solid waste disposal
Wastewater treatment
Regular student, faculty and staff commuting (i.e., daily commuting to and from campus).
Study abroad travel
University reimbursed travel (i.e., directly financed outsourced travel) including athletics
Data associated with certain scope 3 emission sources is not readily available. Notably, the present University reimbursement data system provides ‘lump sum’ reimbursements, preventing the compilers of the University’s inventory from being able to distinguish between directly financed off-campus travel (e.g., rental cars, train tickets, air fare) and other travel expenses (e.g., hotel reservations, food purchases, conference fees). Similarly, detailed commuter data could not be obtained. Crude estimates of annual commuter miles were developed using campus population data.
Due to the complexity and limitations of data associated with scope 3 emissions the University does not include these emissions when establishing its baseline for neutrality. Nevertheless, the University will continue to seek to identify opportunities to minimize scope 3 emissions where feasible. Emphasis will

23
also be placed on working with the existing university departments and associated data reporting structures to facilitate and improve future inventory data collection efforts.
The University does not presently purchase greenhouse gas offsets and does not intend to do so in the near the future. Those activities which result in carbon sequestration (e.g., forestry and composting) are, however, included in the inventory.
Table 2.3. Inventory Data Sources
Data Requested Reporting Agency
Institutional Data
Operating & Research Budgets Office of Institutional Research
Energy Budget Energy Utility Services Manager (Facilities Operations)
Population Data (e.g., employees, students)
Office of Institutional Research
Campus Infrastructure (e.g., building space, research space)
University Master Planner (Architectural & Engineering Services)
Scope 1 Emissions
Cogeneration Facility (e.g., fuel use, electric & steam output, and efficiency)
Energy Utility Services Manager (Facilities Operations)
On Campus Stationary Sources (e.g., generators, boilers, small chillers)
Office of Environmental Policy
Campus Fleet (e.g. gasoline & diesel fuel use)
Motor Pool
Biodiesel Fuel Use UConn Biofuels Consortium
Refrigerants & Chemicals Office of Environmental Policy
Fertilizer Applications Farm Services Research & Education Facilities Manager (Plant Science Department); Athletics Department; Facilities Operations; Private Contractor
Animal Husbandry (e.g. animal head counts)
Farm Services Manager
Scope 2 Emissions
Purchased Electricity Energy Utility Services Manager (Facilities Operations)
Scope 3 Emissions
Commuter Data (e.g., parking pass data)
Parking Services
Directly Outsourced Travel (e.g., travel reimbursements)
Travel Services; Private Travel Agencies
Study Abroad Travel (e.g., destinations, participant counts)
Office of Study Abroad
Solid Waste (e.g., incinerated & landfilled waste tonnages)
Private Trash Hauler (Willimantic Waste)
Waste Water Volume Wastewater Treatment Facility Manager (Facilities Operations); Office of Environmental Policy
Offsets Composting Volumes Farm Services; Office of Environmental Policy
Forest Management Forest Manager (Cooperative Extension System)

24
Institutional Data
Institutional data (e.g., institutional budget, population and physical size) are collected annually in association with the campus greenhouse gas (GHG) inventory. These data are not used directly to calculate emissions, but, rather, are used to develop rough metrics of efficiency and energy use per capita and per square foot, allowing for comparison of GHG emissions statistics across institutions. Caution should be exerted when making comparisons, however because energy use is highly dependent upon building application (e.g., scientific research versus storage space).
Table 2.4 summarizes the University’s institutional data. Although 2007 is used for the baseline inventory, data for previous years is provided to illustrate data trends. In general, budget figures (e.g., operating, research, and energy) are reported for a fiscal year (i.e., July 1-June 31). Population data is reported according to the academic year, with counts generally conducted within the first weeks of the fall semester (i.e., September).
Table 2.4. Institutional Data2
Year:
Budget (in millions of $U.S.)
3
Population Physical Size
(Building space, million ft2)
Op
era
tin
g
Re
sear
ch
Ene
rgy
Full-
Tim
e
Stu
de
nts
Par
t-Ti
me
Stu
de
nts
Sum
me
r
Stu
de
nts
Facu
lty
Staf
f
Tota
l
Re
sear
ch
1990 406.6 45.0 12.5 14,550 3,317 8,319 1,253 4,379 5.7 1.6
2000 414.7 103.7 14.0 16,638 2,298 3,640 876 2,550 7.0 1.9
2005 736.7 64.4 23.4 17,496 2,198 8,291 985 2,733 9.2 2.5
2006 752.9 54.2 30.0 18,109 2,321 8,270 1,091 2,732 9.4 2.5
2007 766.8 56.3 29.3 18,531 1,855 6,699 1,113 2,771 10.7 0.7
Faculty and staff population counts generally include both full-time and part-time (at least 50%) employees. Special payroll employees (individuals paid for an occasional temporary service – days or weeks of service) are typically excluded.
Student population counts generally include full-time, part-time, degree-seeking, and non-degree-seeking students taking credit courses. The counts generally do not include non-credit registrations. The figures shown in Table 2.4 are actual matriculation numbers. Fall 2007 student enrollment expressed in full time enrollment (FTE), was:
Undergraduate degree and non-degree seeking students = 15,892
Graduate degree and non-degree seeking students = 2,414
Pharmacy and professional students = 296
Total Fall 2007 Storrs Campus student population = 18,602
FTE is calculated using the total registered credits divided by 15 for undergraduate students and by 12 for graduate and professional students.
According to the University’s Architectural & Engineering Services Office, the UConn Storrs campus had 10,677,000 square feet of building space (including the Depot Campus), with 720,197 square feet, or
2 Sources: UConn Office of Institutional Research, UConn Architectural & Engineering Services. 3 Budgets are normalized by 2005 $USD values.

25
6.7%, used for active research (excluding teaching laboratories) in 2007.4 Notably, over 3.4 million square feet, approximately 32% of all building space in 2007, was associated with student living facilities. UConn houses approximately 76% of all full-time undergraduate students in University-owned, on–campus housing, which has significant implications for the University’s energy and water demand.
Projected Campus Growth
The UConn Storrs Campus has experienced tremendous growth over the past decade (Table 2.5). Since 1995, building square footage (i.e., gross area) throughout the UConn system (i.e., including regional campuses) has increased by 43% despite a 5% reduction in building numbers. As of 2007, the University operated 525 buildings throughout the state, totaling 12.4 million gross square footage (GSF). Of the statewide UConn GSF, the 486 buildings located on the UConn Storrs campus comprised 86% of this total GSF, or 10.6 million square feet of total building space (Figure 2.4). (There was no change in campus area during 2008.)
Table 2.5. UConn Storrs Campus: Physical Size
Year: Total Building Space (ft2)
Total Research Building Space (ft
2)
1990 5,719,046 1,575,864
2000 7,082,871 1,906,811
2005 9,208,655 2,465,356
2006 9,374,400 2,465,356
2007 10,676,987 720,197*
4 Caution should be exerted when comparing research space for years prior to 2007. Prior to 2007, research space was calculated to include faculty offices, teaching space, and other passive space associated with research activities. As of 2007, the University uses AutoCAD drawings to calculate the space inventory. Only space categorized as “Research Laboratory,” as defined by the Postsecondary Education Facilities Inventory and Classification Manual (FICM) codes 250 and 255, is presently considered ‘research space.

26
Figure 2.4.5 Campus Building Trends Pre-1900 to 2007.
Limited additional building growth is expected over the next 5-10 years in order to provide quality space to meet the needs of the university research and teaching faculty. Student enrollment rates are expected to remain stable over the next several years.
Building Growth
Short-term growth projections for the campus are based upon the UConn 21st Century and UConn 2000 plans. In 1995, the Connecticut legislature passed a groundbreaking program of reconstruction and new building at the University called UConn 2000. This 10-year program to rebuild, renew and enhance the statewide campuses of the University remains unprecedented among public higher education in the United States. The transformation has been so remarkable that in 2002 the Legislature voted to extend the rebuilding program with an additional investment under the title 21st Century UConn. UConn 21st Century is scheduled to fund several new construction projects, including new academic buildings and residence halls at the Storrs campus.
Previous projections based upon UConn 21st Century plans estimated a 3% increase in overall gross building area (365,351 ft2) by 2015 (compared to 2007 data). Due to scheduled demolitions, building numbers, however, are expected to decline by 3% during this same time frame. This growth is primarily associated with anticipated increases in student support services, university operations, and academic building spaces (Table 2.6). Recent changes in the state budget, however, are expected to postpone several projects, resulting in lower annual growth rates than initially predicted (i.e., 1-2%) and causing growth to occur over a slightly longer period of time (i.e., 2009-2020).
Student Enrollment
The University does not anticipate changes in enrollment between 2009 and 2025. Enrollment projections are tied to birth rates, which have decreased in Connecticut over the past several years. This decrease in birth rates is expected to lead to lowering or stabilization of college and university enrollments throughout New England, for the foreseeable future.6 Conversely, recent declines in the state and national economy have the potential to increase enrollment rates, as students who otherwise would have attended out-of-state colleges and universities will instead remain in-state. However, the economic downturn has limited the university’s ability to provide the space and faculty to accommodate a growing student population. Therefore, the University is not in a position to increase enrollment rates to accommodate these students.
5 Source: February 14, 2008 UConn Architectural & Engineering Services (A&ES) presentation to the UConn Capital Project Planning Advisory Committee (CPPAC). 6 This does not account for changes in immigration or international student populations.

27
Table 2.6. Projected Storrs Campus Growth7
Number of Buildings
Gross Building
Area (ft2) Academics Academic Support
Student Living
Student Support Services
University Operations
Financial Operations Athletics (Other)
Pre-1995 513 7,470,933 2,505,796 630,783 2,451,475 233,057 956,568 26,478 456,582 210,195
2007 (Existing) 486 10,676,987 3,394,150 705,168 3,401,553 446,613 1,887,258 26,478 668,877 146,891
Difference (<’95-‘07) -27 3,206,054 888,354 74,385 950,079 213,556 930,690 0 212,294 -63,304
Percent -5% 43% 35% 12% 39% 92% 97% 0% 46% -30%
2015 (Projected)8 472 11,042,338 3,496,816 693,543 3,401,553 674,681 2,070,534 26,478 668,877 9,857
Difference (‘07-‘15) -14 365,351 102,666 -11,625 0 228,068 183,276 0 0 -137,034
Percent -3% 3% 3% -2% 0% 51% 10% 0% 0% -93%
Pre-1995 513 7,470,933 2,505,796 630,783 2,451,475 233,057 956,568 26,478 456,582 210,195
2015 (Projected) 472 11,042,338 3,496,816 693,543 3,401,553 674,681 2,070,534 26,478 668,877 9,857
Difference (<’95-‘15) -41 3,571,405 991,020 62,760 950,079 441,624 1,113,966 0 212,294 -200,338
Percent -8% 48% 40% 10% 39% 189% 116% 0% 46% -95%
7 Source: February 14, 2008 UConn Architectural & Engineering Services (A&ES) presentation to the UConn Capital Project Planning Advisory Committee (CPPAC). 8 Projected growth does not include facilities identified by the School of Fine Arts Master Plan, athletic facilities funded through department budget, and the proposed Student Services recreation center.

28
Scope 1 Emissions
Scope 1 emissions are direct emissions from sources that are owned and/or controlled by the University. Scope 1 emissions, therefore, include those emissions resulting from the following sources:
Energy (i.e., thermal and electric) generated on campus
Operation of the university vehicle fleet (e.g., combustion of fossil fuels)
Fugitive emissions associated with the use and storage of refrigerants and chemicals
Fertilizer applications (e.g., nitrous oxide)
Campus agricultural herds (e.g., methane)
Table 2.7 provides an overview of the University’s scope 1 emissions and the corresponding source. The sections to follow provide more detailed information about each emission source.
Table 2.7. Scope 1 Emissions Summary
Emission Source MTeCO2 %Scope 1 % Total9
Cogeneration Facility (Electric & Steam) 93,102.3 55.2 44.6
Other On-Campus Stationary 68,525.3 40.6 32.9
Campus Fleet 2,665.2 1.6 1.3
Refrigerants & Chemicals 3,317.3 2.0 1.6
Agricultural Sources (Fertilizers & Animal Husbandry) 1,029.0 0.6 0.5
Total Scope 1 Emissions: 168,639.4 - 80.8
Cogeneration Facility
The University of Connecticut’s state-of-the-art Cogeneration Facility began operation on March 15, 2006. The facility has an electrical production capacity of 24.9 Megawatts, a steam production capacity of 600 KP per hour, and a chilled water production capacity of 10,300 tons. Electrical demand averages ~18 MW per day. (The University’s energy dashboard provides real-time data online at http://www.fo.UConn.edu/cogen.html.) Total 2007 cogeneration facility GHG emissions were estimated to be 93,102 MTeCO2, approximately 45% of the University’s overall emissions. Direct reductions in cogeneration facility GHG emissions will be realized through increases in facility operational efficiency. Additional indirect reductions will be realized in response to decreases in campus energy demand associated due to changes in individual behavior, building design improvements, and building and utility system renovations. (Refer to Section 3 of this report for more details.)
As shown in Table 2.8, the primary fuel for the cogeneration facility is natural gas, recognized as one of the cleanest burning fossil fuels available. (The facility does not use residual oil (#5-6), liquid propane gas, coal, incinerated waste, wood chips, wood pellets, grass pellets, or biomass.) For the purposes of the University’s inventory, the cogeneration facility is defined as the newest installation of equipment in the Central Utility Plant (CUP), and is limited to the combustion turbines 1-3, steam turbine and
9 Total emissions include scope 1, 2, and 3 emissions.
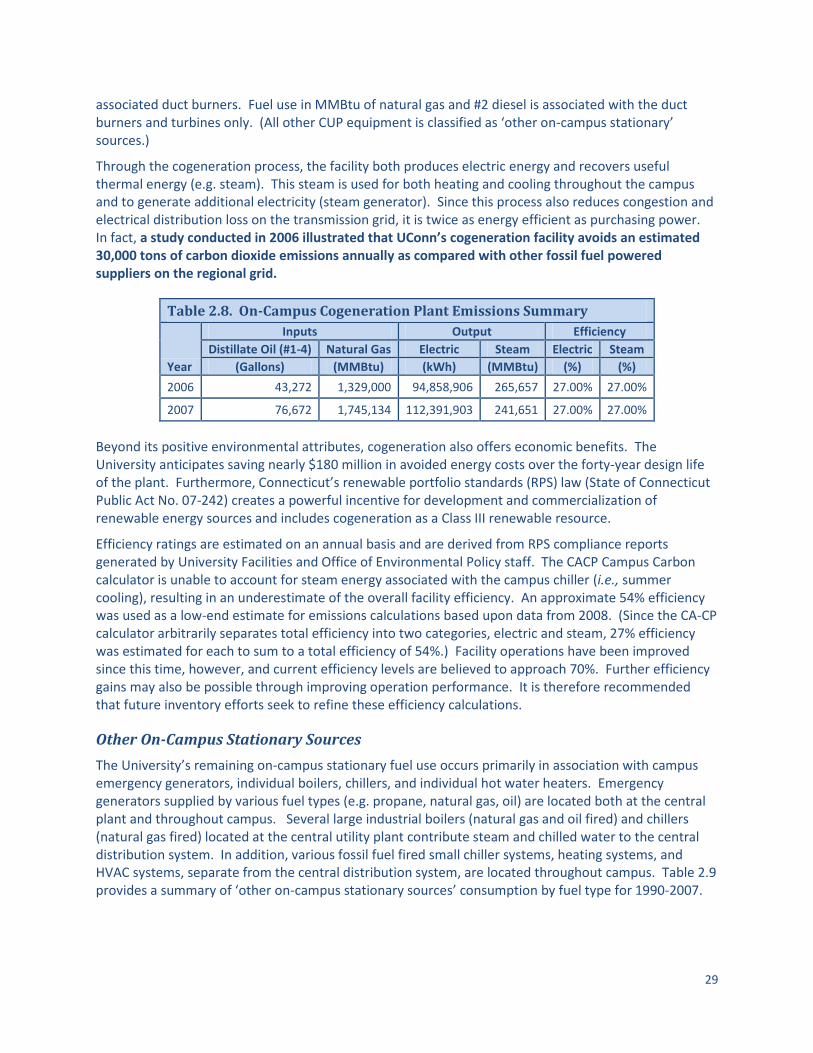
29
associated duct burners. Fuel use in MMBtu of natural gas and #2 diesel is associated with the duct burners and turbines only. (All other CUP equipment is classified as ‘other on-campus stationary’ sources.)
Through the cogeneration process, the facility both produces electric energy and recovers useful thermal energy (e.g. steam). This steam is used for both heating and cooling throughout the campus and to generate additional electricity (steam generator). Since this process also reduces congestion and electrical distribution loss on the transmission grid, it is twice as energy efficient as purchasing power. In fact, a study conducted in 2006 illustrated that UConn’s cogeneration facility avoids an estimated 30,000 tons of carbon dioxide emissions annually as compared with other fossil fuel powered suppliers on the regional grid.
Table 2.8. On-Campus Cogeneration Plant Emissions Summary
Year
Inputs Output Efficiency
Distillate Oil (#1-4) Natural Gas Electric Steam Electric Steam
(Gallons) (MMBtu) (kWh) (MMBtu) (%) (%)
2006 43,272 1,329,000 94,858,906 265,657 27.00% 27.00%
2007 76,672 1,745,134 112,391,903 241,651 27.00% 27.00%
Beyond its positive environmental attributes, cogeneration also offers economic benefits. The University anticipates saving nearly $180 million in avoided energy costs over the forty-year design life of the plant. Furthermore, Connecticut’s renewable portfolio standards (RPS) law (State of Connecticut Public Act No. 07-242) creates a powerful incentive for development and commercialization of renewable energy sources and includes cogeneration as a Class III renewable resource.
Efficiency ratings are estimated on an annual basis and are derived from RPS compliance reports generated by University Facilities and Office of Environmental Policy staff. The CACP Campus Carbon calculator is unable to account for steam energy associated with the campus chiller (i.e., summer cooling), resulting in an underestimate of the overall facility efficiency. An approximate 54% efficiency was used as a low-end estimate for emissions calculations based upon data from 2008. (Since the CA-CP calculator arbitrarily separates total efficiency into two categories, electric and steam, 27% efficiency was estimated for each to sum to a total efficiency of 54%.) Facility operations have been improved since this time, however, and current efficiency levels are believed to approach 70%. Further efficiency gains may also be possible through improving operation performance. It is therefore recommended that future inventory efforts seek to refine these efficiency calculations.
Other On-Campus Stationary Sources
The University’s remaining on-campus stationary fuel use occurs primarily in association with campus emergency generators, individual boilers, chillers, and individual hot water heaters. Emergency generators supplied by various fuel types (e.g. propane, natural gas, oil) are located both at the central plant and throughout campus. Several large industrial boilers (natural gas and oil fired) and chillers (natural gas fired) located at the central utility plant contribute steam and chilled water to the central distribution system. In addition, various fossil fuel fired small chiller systems, heating systems, and HVAC systems, separate from the central distribution system, are located throughout campus. Table 2.9 provides a summary of ‘other on-campus stationary sources’ consumption by fuel type for 1990-2007.

30
Table 2.9. Other On-Campus Stationary Sources Fuel Use Summary
Year:
Fuel Inputs
Distillate Oil (#1-4) Natural Gas LPG (Propane)
(Gallons) (MMBtu) (Gallons)
1990 3,000,006 412,001 No data
2000 843,273 864,960 30,777
2005 690,709 935,645 16,890
2006 690,709 935,645 16,890
2007 1,198,647 1,066,838 7,115
Total 2007 GHG emissions from on-campus stationary sources (excluding the cogeneration facility as defined above) were estimated to be 68,525 MTeCO2, approximately 33% of overall campus emissions.
On-Campus Vehicle Fleet
The University of Connecticut owns a large fleet of vehicles including, but not limited to, those vehicles owned and operated by Transportation Services (e.g., buses and shuttles), Facilities Management (i.e., heavy-duty trucks and other maintenance vehicles), Farm Services (i.e., tractors and other large agricultural equipment), University Mail Services (i.e., small motorized carts and box trucks), Dining Services (i.e., box trucks), and the various academic departments (i.e., cars, SUVs, and light-duty trucks). The majority of campus vehicles operate using either gasoline or diesel fuel. In addition, approximately 2-5% of the campus bus system’s annual fuel requirement is supplemented with biodiesel. The University does not currently own any natural gas, ethanol or hydrogen vehicles. University vehicles travelling on or near campus refuel at one of the campus fueling stations (i.e., the motor pool or the Farm Services pump); annual vehicle emissions are therefore calculated directly from fuel use recorded at these stations (Table 2.10). (Emissions associated with vehicles travelling and fueling up off-campus are considered scope 3 emissions as discussed later in this document.) An estimated 2,665 MT eCO2 of greenhouse gases were emitted in association with the operation of the campus fleet in 2007, approximately 1.3% of total campus emissions.
Table 2.10. On-Campus Vehicle Fleet Fuel Inputs
Year Vehicle Fuel Inputs (Gallons)
Gasoline Diesel B100
2005 123,708 104,667 0
2006 151,595 135,036 723
2007 158,602 124,025 1,600
Hybrid-Electric & Electric Vehicles
The UConn Office of Environmental Policy maintains annual preferred vehicle purchasing lists, which highlight recommended choices for each vehicle class based upon EPA fuel economy estimates and

31
emission standards. These lists are used by University Purchasing agents to encourage university buyers to purchase the most fuel efficient vehicles possible. Hybrid-electric vehicles are typically among the top vehicles recommended. The decision (and the cost) to purchase fuel efficient vehicles, including hybrid-electric vehicles, however, ultimately remains with the university buyer. Consequently, less than 1% of the University’s current 600-vehicle fleet is comprised of hybrid-electric or electric vehicles. In 2007, the State of Connecticut passed legislation mandating that beginning January 1, 2008, "any car or light duty truck purchased by the state shall have an efficiency rating that is in the top third of all vehicles in such purchased vehicle's class and fifty per cent of such cars and light duty trucks shall be an alternative fueled, hybrid electric or plug-in electric vehicle" (PA 07-242, Section 122). As a state agency, the University’s fleet is included in the determination of the state fleet mix. Therefore, it is expected that the proportion of hybrid-electric and plug-in electric vehicles on campus will increase significantly over the next several years.
Campus Bus & Shuttle Systems
The University currently provides transportation between the main Storrs campus, the Depot Campus, and nearby University owned housing sites via the UConn campus bus system. University shuttles also run on request to the airport, train station and ferry. In addition, the UConn Police Department runs a free service that provides students with a safe ride home during limited evening hours throughout the week. Greenhouse gas emissions associated with each of these services (i.e., vehicle fuel use) is included in the on-campus fleet emissions.
Biodiesel Production & Use
Biogenic emissions, those emissions resulting from combustion of a non-fossil fuel source such as pure biodiesel, are considered part of the "closed loop" carbon cycle. Therefore, for inventorying simplicity, the Clean Air-Cool Planet Campus Carbon Calculator (V6) assumes that B100 biodiesel has no net impact on greenhouse gas emissions. Combustion of biodiesel that is mixed with petro-diesel is assumed to emit a proportional amount of greenhouse gas emissions. For example, a B20 blend would be assumed to release 80% of the emissions associated with the use of ‘regular’ diesel, whereas a B5 blend would be assumed to release 95%, and so on.
In the summer of 2004, students and faculty in the University’s Chemical Engineering Department produced biodiesel from the University’s waste cooking oil for the first-time. Shortly thereafter, in 2005, the UConn Biofuels Consortium was established and began production of biodiesel on a consistent basis. In 2007, the Consortium produced B100 biodiesel at a rate of 50 gallons per week for the duration of the school year (approximately 32 weeks), producing approximately 1600 gallons of B100. (Pure biodiesel was then blended into the campus diesel stock, resulting in a final overall campus blend approaching B1.) Presently, the University (i.e., the UConn Biofuels Consortium) has the capability to replace up to ~5% of the petro-diesel fuel consumption of university vehicles, using waste vegetable oil from dining services as the feedstock. Biodiesel is delivered regularly to the university motor pool. Plans are underway to expand the University’s production capabilities to replace 100% of the campus petro-diesel fuel requirements.
Bicycling & Walking
Bicycling and walking are not directly represented in the University’s greenhouse gas inventory, yet remain important modes of transportation on campus. Improved pedestrian access and safety, specifically the establishment of a pedestrian-only campus core, is central the University’s Master Plan. Similarly, numerous efforts, including the development of a campus bicycle plan and a plan to develop a campus bicycle loaner program, are focused on increasing the proportion of individuals who opt to bike

32
around campus. Increasing bicycling and walking rates is assumed to indirectly decrease emissions associated with the campus fleet through reductions in total vehicle miles travelled.
Refrigerants & Chemicals
Refrigerants
2007 emissions due to campus refrigerants were estimated based upon purchase records (Table 2.11). (These records account for University purchases only; refrigerants purchased and used by on-campus vendors for large equipment are not included in these figures.) For emissions calculations purposes, it is assumed that all refrigerants purchased in a given year are used completely. The resulting calculated emissions are therefore a conservative estimate of what was actually used to replace the amounts in air conditioners, refrigerators, freezers, etc.
Table 2.11. 2007 Refrigerant Purchases10
Description Total (lbs.)
134A 390
404A (HP62) 360
409A 30
Freon 22 3120
MP39 (R401A) 120
MP66 (R401B) 120
Certain purchased refrigerants were reported as conglomerate refrigerants and required additional conversion to allow for input into the CA-CP calculator (Table 2.12). Manufacturer’s MSDS sheets were used to obtain the constituent percentages.
Table 2.12. Refrigerant Conversion
Refrigerant Trade Designation (ASHRAE) Total Weight (lbs) Constituent % Total
Constituent Weight (lb)
R401.A 120 HCFC-22 53 63.6
HCFC-124 34 40.8
HFC-152a 13 15.6
R401.B 120 HCFC-22 61 73.2
HCFC-124 28 33.6
HFC-152a 11 13.2
409A 30 HCFC-22 60 18.0
HCFC-124 25 7.5
HCFC-142b 15 4.5
Table 2.13 summarizes the 2007 refrigerant data and emissions. Based upon the inventory, total emissions due to campus refrigerant and chemical use in 2007 were approximately 3,317.3 MTeCO2, approximately 2% of total campus emissions. Greenhouse gas inventories conducted for the campus prior to 2007 did not include refrigerant data.
10 Source: UConn Office of Environmental Policy

33
Table 2.13. 2007 Greenhouse Gas Emissions Associated with Refrigerants
Chemical Input
(Pounds) Global Warming
Potential11
MTeCO2/lb
12
Emissions (MTeCO2)
%Total Refrigerant Emissions
HCFC-22 3,274.8 1,700 0.771 2525.22 76.12
HFC-404a 360 3,260 1.489 532.34 16.05
HFC-134a 390 1,300 0.590 229.97 6.93
HCFC-124 81.9 620 0.281 23.03 0.69
HCFC-142b 4.5 2,400 1.089 4.90 0.15
HFC-152a 28.8 140 0.064 1.83 0.06
TOTAL = 3,317.3 MTeCO2 100%
Green Cleaning
‘Green Cleaning’ is a widely accepted standard that uses procedures and products to make the health of building occupants, janitors, and the environment a primary concern. Some of the more potent cleaners contain volatile organic compounds, phenol compounds, or petroleum solvents. Few of these potent cleaners are biodegradable. In comparison, green cleaning products are characterized by environmentally ‘friendlier’ attributes, including biodegradability, low toxicity, low volatile organic compound (VOC) content, reduced packaging, and low life cycle energy use. Replacing more dangerous chemicals with green cleaners can therefore help improve water and indoor air quality.
Connecticut accepted the green cleaning standard on April 17, 2006, when Governor Jodi Rell issued an executive order which declares that all state facilities and workplaces shall "procure and use, whenever practicable, cleaning and/or sanitizing products having properties that minimize potential impacts to human health and the environment, consistent with maintaining clean and sanitary State facilities.” A year and a half after this executive order, the Connecticut Legislature passed Public Act 07-100, which mandates that cleaning products used in State buildings must meet environmental standards set by a state-approved environmental certification program (e.g., Green SealTM).
Agricultural Emissions: Fertilizer Applications & Animal Husbandry
Initially founded as the Storrs Agricultural School in 1881, the University of Connecticut continues to honor its agricultural legacy through an active Farm Services department and through the teaching and research of the College of Agriculture and Natural Resources and the Cooperative Extension System. The primary emissions associated with agricultural operations on campus include methane (i.e., from domesticated animals) and nitrous oxide (i.e., from fertilizer applications, animal production and waste, and certain crops). Energy and fuel use associated with crop and herd management, building operations, transporting food or feed to and from campus, and the disposal of associated wastes also contribute greenhouse gas emissions. These emissions, however, are captured within the campus vehicle fleet emissions, cogeneration facility, other stationary sources, and purchased electricity categories. The ‘agricultural category,’ therefore specifically addresses emissions associated with campus fertilizer applications and animal husbandry (Table 2.14).
11 Source: USEPA 2007. 12 MTeCO2/lb = (1lb)x(Global Warming Potential)x(kg/lb)x(MT/1000 kg).

34
Table 2.14. Campus Agricultural Emissions13
Fertilizer Application Animal Husbandry
Synthetic Organic Dairy Cows Beef Cows Swine Sheep Horses Poultry
Year Pounds %N Pounds %N # # # # # #
1990 ND14
ND ND ND 180 137 25 150 85 3,211
2005 16,070 23 ND ND 177 146 6 118 84 2,608
2006 16,070 23 8,000 45 207 130 ND 130 80 2,450
2007 28,000 32 18,000 45 201 60 81 80 82 6,090
A significant amount of fertilizer is used for non-agricultural purposes (i.e., athletic field maintenance and landscaping). Quantities of synthetic fertilizer in Table 2.14 are lump sums of all campus fertilizer use, regardless of application type, according to fertilizer nitrogen contents. Total synthetic fertilizer use in 2007 was 28,000 lbs (32% nitrogen), while 18,000 pounds of organic fertilizer (45% nitrogen, all urea) was applied. Actual synthetic fertilizer use in 2007 included 2,500 pounds of 15-15-15, 300 pounds of 46-0-0 (urea), and 200 pounds of 33.5-0-0 (ammonium nitrate).
The University uses soil testing both annually and seasonally to determine the fertility needs of the campus cropping area. All appropriate integrated pest management (IPM) methods are also implemented. The University also has on-going research related to low maintenance turf grass using organic (i.e., compost) and non-organic fertilizer methods; these small plot research treatments are not part of the above totals.
The University has an active animal husbandry program which includes dairy and beef cows, swine, sheep, horses and poultry. Animal husbandry efforts are primarily research and education oriented, however, associated food products are produced and used on campus (e.g., milk, cheese, ice cream, eggs). Animal wastes are currently stored on campus and spread throughout the year on campus agricultural fields. Plans are underway to construct a campus animal waste compost facility.
In 2007, combined campus fertilizer applications and animal husbandry efforts produced an estimated 1,029 MT eCO2, less than one percent of the University’s overall greenhouse gas emissions.
Scope 2 Emissions:
Scope 2 emissions are indirect emissions from sources that are neither university-owned nor operated, but whose products are directly linked to on-campus energy consumption. Since UConn does not purchase steam or chilled water from off-campus sources, the University’s scope 2 emissions are limited to those emissions resultant from electricity purchased from an outside supplier.
Table 2.15 provides an overview of the University’s scope 2 emissions and the corresponding source.
13 Source: UConn Farm Services Department. 14 ND =No data.

35
Table 2.15. Scope 2 Emissions Summary
Emission Source MTeCO2 %Scope 2 % Total15
Purchased Electricity 10,316.8 100 4.9
Purchased Steam 0 0 0
Purchased Chilled Water 0 0 0
Total Scope 2 Emissions: 10,316.8 100 4.9
Purchased Electricity
The University purchases less than 5% of its electrical need due to infrastructure limitations and to supplement electrical needs during periods when the cogeneration facility is offline. In 2007, the University purchased 24,916 MWh from Connecticut Light & Power (CL&P) (Table 2.16). According to the campus greenhouse gas inventory, an estimated 10,317 MTeCO2 was released in association with the generation of this electricity, approximately 4.9% of total campus greenhouse gas emissions in 2007.
Table 2.16. Purchased Electricity
Year MWh
1990 70,000
2000 110,621
2005 141,195
2006 70,591
2007 24,916
Emissions from purchased electricity are calculated using subregional emission factors (NPCC New England, Table 2.17) derived from the US EPA Office of Atmospheric Programs’ Emissions & Generation Resource Integrated Database (eGRID; USEPA 2000). eGRID integrates available data for regional electricity generating with EPA emissions data and EIA generation data to produce average subregional emission factors. The emissions factors shown in Table 2.17 are an average from 1998-2000.
Table 2.17. NPCC New England (NEWE) Emission Factors16
Carbon Dioxide Methane Nitrous Oxide Carbon Dioxide
Equivalents Transmission & Distribution
Loss Factor
(kg CO2/kWh) (kg CH4/kWh) (kg N2O/kWh) (MTeCO2/kWh) (%)
0.412 0.00000789 0.00000544 0.000414 9.0%
15 Total emissions include scope 1, 2, and 3 emissions. 16 Source: US EPA Office of Atmospheric Programs (2000) as cited in Clean Air-Cool Planet Campus Carbon Calculator V6.

36
The NEWE emission factor was used to calculate the greenhouse gas emissions associated with purchased electricity in 2007 because actual data regarding the University’s regional grid mix was not available. There are limitations, however, to using a constant electric emission factor, notably that the positive environmental impacts of switching to cleaner fuel sources will not be represented in calculations. As a state agency, the University has committed to increasing the proportion of renewable energy it purchases. As of 2009, the University purchases 15% green renewable power above the renewable portfolio standards (RPS) requirements. In order to capture the positive impact of this and any future such changes, it is recommended that a custom grid mix be used to calculate future purchased electricity emissions.
Scope 3 Emissions:
Scope 3 emissions are all other indirect emissions that are attributed to the University that are neither University owned nor operated but are either directly financed or otherwise linked to the University. In most cases, the University has limited control over these emissions (as compared to scope 1 and 2 emissions). The University of Connecticut tracks, to the extent that data is available, scope 3 emissions associated with the following activities:
Solid waste disposal
Wastewater treatment
Regular student, faculty and staff commuting (i.e., daily commuting to and from campus).
Study abroad travel
University reimbursed travel (i.e., directly financed outsourced travel) including athletics
Due to the complexity and limitations of data associated with scope 3 emissions the University does not include these emissions when establishing its baseline for neutrality. Table 2.18 provides an overview of the University’s scope 3 emissions and the corresponding source.
Table 2.18. Scope 3 Emissions Summary
Emission Source MTeCO2 %Scope 3 % Total17
Solid Waste Disposal 421.6 1.3 0.2
Wastewater Treatment 181.9 0.5 0.1
Student, Faculty & Staff Commuting 16,969.2 50.4 8.1
Study Abroad Travel 5,543.7 16.5 2.7
Directly Financed Off-Campus Travel 10,528.2 31.3 5.0
Total Scope 3 Emissions: 33,644.6 -- 16.1
The sections to follow provide more detailed information about each emission source.
17 Total emissions include scope 1, 2, and 3 emissions.

37
Solid Waste Disposal
Solid waste numbers were obtained from the contracted university waste hauler, Willimantic Waste. Data were reported as annual tonnages of municipal solid waste (MSW) and bulky waste, as shown in Table 2.19. According to Willimantic Waste, bulky waste is processed for recyclables; it was therefore assumed, based upon estimates provided by Willimantic Waste that 40% of the bulky waste collected annually is recycled. Municipal solid waste is not processed. It was further assumed based upon the data provided that approximately 50 percent of the net waste (excluding recycled bulky waste) is sent to mass burn incineration facilities and the remaining 50 percent is sent to landfills with methane (CH4) recovery and flaring. Actual disposal sites may vary. Final disposal is handled by a subcontractor of the University’s waste hauler; therefore, ultimate disposal sites may change, unbeknownst to the University, depending on economic or other factors.
It is estimated that -0.03 MTCE CO2 (-110 kg CO2) is generated per short ton of solid waste disposed through mass burn incineration. The factor includes emissions from the combustion of the waste, excluding biogenic sources. Energy recovery is assumed when using the CACP Campus Carbon Calculator; emissions factors are therefore negative because energy generation from solid waste incineration is assumed to result in fewer emissions than standard utility generation.18
Waste disposed at landfills with CH4 recovery and flaring resulted in an estimated 0.07 MTCE CH4 (12.22 kg CH4) per ton of waste disposed. The factor incorporates emissions associated with transporting the waste to the landfill and CH4 from biogenic sources, excluding the combustion of biogenic CH4.
19
Table 2.19. Solid Waste Disposal Data
Year
Waste (Tons) Incinerated Waste (Mass Burn)
Landfilled Waste (CH4 Recovery & Flaring)
Total Net Waste
MSW
Bulky Waste
Tons MTeCO2 Total Net Tons kgCO2 MTeCO2 Tons kgCH4 MTeCO2
2006 4,247 1,017 610 2,429 -267,190 -267 2,429 29,688 683 4,857 416
2007 4,077 1,420 852 2,464 - 271,040 -271 2,464 30,116 693 4,928 422
Using the USEPA/CACP calculator emissions factors it was calculated that approximately 421.6 MTeCO2 of greenhouse gas emissions were generated in 2007 in association with the University’s solid waste disposal. Data from 2006 is shown for comparison. In 2007, solid waste tonnages increased by 1.5% over the previous year’s tonnage, resulting in a parallel increase in solid waste greenhouse gas emissions. 2007 greenhouse gas emissions due to solid waste disposal, however, remain less than 1% of total estimated annual GHG emissions for the campus.
Wastewater Treatment
The University of Connecticut (Storrs Campus) serves as its own water supplier and source of wastewater treatment. Approximately 376.9 million gallons of wastewater were aerobically processed by the central treatment system in 2007, generating an estimated 181.9 MTeCO2 or 0.1% of the total campus emissions. The wastewater treatment emissions factors used to generate this estimate are shown in Table 2.20.
Table 2.20. Wastewater Treatment Emission Factors
18 Source: USEPA 2006 (as cited in the CACP Campus Carbon Calculator). 19 Source: USEPA 2006 (as cited in the CACP Campus Carbon Calculator).

38
kg BOD / gallon wastewater
% accidental anaerobic
degradation
% BOD removed by Primary Treatment
kg CH4 / kg BOD
kg CH4 / gallon wastewater
kg N2O / gallon wastewater
0.0007 0.0% 0.0% 0.18 0 1.63E-06
The University supplies water to the core campus from two well fields with a total registered diversion of 3.152 MGD. Storage consists of 5.4M gallons of untreated water in an underground reservoir and ~1.9M gallons of treated water in standpipes. All storage will be treated at the new chemical treatment facility at the Willimantic Well Field in 2009-2010. Most of the campus is served by gravity flow from these standpipes, although some flow is pumped to a booster pump station to serve higher elevations.
Wastewater is managed using the 2007 Water and Wastewater Master Plan and the 2006 Campus Wide Drainage Master Plan. The campus wastewater system includes the wastewater pollution control facility (WPCF), collection system pump stations, and collection system piping. The current service area for the wastewater collection system includes the campus and non-university properties immediately surrounding the campuses. (In addition, there are a few small septic systems which are not accounted for in the inventory.) The WPCF treatment capacity is 3.0 MGPD (on average) and 7.0 MGPD (peak flow). The wastewater collection system is served by a number of pump stations, including 22 stations that serve the main campus (including Depot Campus). A gravity pipeline conveys the treated wastewater to the Willimantic River.
The University is presently designing a reclaimed water utility that will provide additional treatment, storage, and distribution of WPCF effluent for reuse as central utility plant feed water, irrigation water, and for other applications.
Student, Faculty, & Staff Commuting
The commuting habits of University faculty, staff, and students are not well understood. Estimates of the associated greenhouse gas emissions are generated based upon assumptions for each population (i.e., faculty and staff, students). Due to data limitations, the inventory assumes that all commuting is conducted using personal vehicles; no students, faculty or staff, commute by bus, light rail, or passenger rail.
The University of Connecticut allows on-campus students with 56 or more credits to obtain a parking pass. Commuter students and graduate students are able to obtain a parking pass regardless of standing. Over 10,000 student parking passes were issued in the fall of 2007 (Table 2.21), 6,613 of which were issued to students living off-campus and graduate students (the majority of whom live off-campus). Therefore, it was estimated that approximately 35.5%20 of students commuted regularly to campus (i.e., 4 round-trips per week during the 30-week school year). A crude analysis of common off-campus housing patterns resulted in an average trip distance estimate of 16 miles per round-trip. Approximately 4% of those students commuting to campus were believed to carpool.
Table 2.21. Student Parking Permits Issued: 2007 & 2008
Parking Pass Type Eligibility Fall 2007 Fall 2008
Resident Student On-campus students 3659 3687
Commuter Student Students living off-campus 5103 4875
20 Based upon comparison to total student enrollment for the Fall 2007 semester in full time equivalents (18,602 FTE).

39
Grad Asst21
Graduate students with an assistantship* 1510 1528
Similar assumptions were used to estimate faculty and staff annual commuting mileage and the associated emissions. It is estimated that 92% of all Storrs campus faculty and staff in 2007 commuted to campus via personal vehicle. 3% of these individuals were believed to have carpooled. On average round-trip distance travelled is estimated to have been 29 miles (based upon analysis of faculty and staff addresses). Trips are assumed to have occurred 5.5 times per week for the duration of the calendar year. (Two weeks of vacation were assumed for staff and four for faculty.)
The Clean Air-Cool Planet calculator assumes that all vehicles are gasoline-powered and have the same average fuel efficiency for the given inventory year (regardless of vehicle make, model or year). In 2007, personal vehicles therefore were assumed to have an average fuel efficiency of 22.10 miles per gallon. Final estimates for total annual commuter mileage and fuel use (Table 2.22), were therefore calculated as follows:
Total Distance = [(#Individuals * % Drive Alone) + (#Individuals * % Carpool)/2] * (Trips Per Week) * (Commuting Weeks Per Year) x (Miles Per Trip)
Fuel Consumption = Total Distance / Fuel Efficiency
Table 2.22. 2007 Commuter Mileage and Fuel Use
Student Commuters Faculty & Staff Commuters
Students Commuters Total Distance Gasoline Faculty & Staff Commuters Total Distance Gasoline (# FTE) (%) (Miles) (Gallons) (#) (%) (Miles) (Gallons)
18,602 35.5 13,244,900 599,317 3884 92 23,720,205 1,073,312
Based upon the commuter fuel use estimates shown in Table 2.22, approximately 16,969.2 MTeCO2, or 8.1% of the University’s total greenhouse gas emissions, were generated in association with student, faculty and staff commuting to campus during the 2007 calendar year.
Off-Campus Travel
Each year faculty, staff, and students travel off-campus for University purposes (i.e. athletics, conferences, volunteer programs, study abroad, and research). Travel modes covered within the ‘off-campus travel’ category include bus, train, rental car, and air travel conducted on behalf of the University.
Given these data limitations, the current estimate of off-campus travel-related greenhouse gas emissions is assumed to be low. Future efforts will focus on rectifying these and other off-campus travel issues in order to better track the greenhouse gas emissions associated with off-campus travel.
Study Abroad
The University of Connecticut has an active Study Abroad program and each year students travel to locations throughout the world to earn credits towards their UConn degree. Actual travel data related to these trips, however, is limited. Under the present system, students make their travel arrangements independently of the University. Study abroad related travel was therefore calculated based upon non-stop flight distances from Hartford, Connecticut to the final destination. Using this method, 2007 study
21 Graduate assistant passes are issued to graduate students living both on and off campus.

40
abroad enrollment is estimated to have resulted in over 7 million air miles and over 14,000 train miles. This estimate does not include any travel required to get to the public transit stations or travel conducted while abroad and is assumed to be an underestimate of actual mileage.
Directly Financed Off-Campus Travel
A significant effort was made to determine directly financed off-campus travel mileage for 2007 (i.e., air travel, car rentals, etc.). However, in-house data was determined to be of limited utility for inventorying purposes. In certain cases, off-campus travel is paid for directly from a department budget (i.e. Athletics). Typically, however, an individual pays their travel expenses out-of-pocket and applies for reimbursement through the University Travel Services Department. Records of personal reimbursements are not itemized, however, but rather recorded as a lump sum reimbursement for all travel expenses (e.g., hotel reservation, food expenses, conference registration fees). Therefore, this information cannot be used to estimate greenhouse gas emissions associated with off-campus travel. Consequently, the final 2007 off-campus travel estimate was constructed by averaging data from previous years. Excluding study abroad related travel, it is estimated that the University faculty, staff and students travelled over 13.5 million air miles in 2007.
Combined off-campus travel (i.e., study abroad and directly financed) is estimated to have produced at least 16,071.9 MTeCO2 or approximately 7.7% of the University’s total greenhouse gas emissions for 2007. Actual emissions were assumed to be higher than this value.
Offsets & Sequestration Activities
It is generally acknowledged that most large research-oriented institutions will be unable to achieve carbon neutrality without the purchase of offsets. However, UConn does not presently purchase carbon offsets to supplement its greenhouse gas reduction activities. Furthermore, given the current fiscal situation, the University does not plan to pursue the purchase of large-scale offsets in the near future. Rather, it is the position of the University that the limited funds presently available are better directed towards achieving direct reductions in demand and increases in efficiency. Small offset certificates are, however, purchased on occasion through individual University departments. (For example, offset certificates have been purchased in the past in association with the university’s annual EcoMadness residence hall contest.) These small certificates are not included in the University’s greenhouse gas inventorying efforts.
The University can also seek to ‘mitigate’ emissions through on-campus carbon sequestration activities. Forest preservation and composting are the primary sequestration activities discussed in this action plan, though additional activities are possible (e.g., crop management to increase soil carbon) and should be pursued where appropriate. Current sequestration activities are limited in scope but are expected to increase in response to the strategies proposed through this plan.
Forest Management
According to recent GIS calculations, the University presently owns 2,273 acres of coniferous forest, deciduous forest, and forested wetlands22. Approximately 2,130 acres of this land is officially designated as “UConn Forest,” including several large forest tracts (e.g., the Fenton Tract, Moss Tract/Research
22 This figure was reached by merging Town of Mansfield parcel data and University parcel data. All UConn-owned polygons in the resultant file were then used to clip out the corresponding areas from the latest Center for Land Use Education and Research (CLEAR) 30m land cover data. The combined acreage of coniferous forest, deciduous forest and forested wetlands was then calculated.

41
Forest, Moss Sanctuary, North Eagleville Tract, and Spring Hill Tract). A map of the current university forest holdings is shown in Figure 2.5. These parcels are managed by the University’s Department of Natural Resources and the Environment and have been used for educational, research, and recreational purposes, along with (to a lesser extent) forest products (timber, maple syrup, honey, fuelwood). An individual forest management plan exists for each forest tract, though many of these plans are over a decade old and need updating. Primary management goals have traditionally centered around three objectives:
1. Sustain the health and biodiversity of the forest.
2. Demonstrate forest management practices appropriate for private forest landowners, land trusts, and municipal forests.
3. Create an outdoor classroom where students and Cooperative Extension clientele can develop skills and gain practical experience in natural resource conservation.
Previous University calculations estimated that, under current management plans, the University’s forest holdings sequester an estimated 3,840 MTeCO2 annually23. This plan recommends that the parcel management plans be updated to include a fourth management goal: maximize carbon sequestration. More intensive, proactive management of these lands could provide for additional carbon sequestration, as well as offer a variety of research, educational, environmental, and economic opportunities currently not explored. Additional details regarding this opportunity are discussed in Section 3.
23 This figure has not been verified.

42
Figure 2.5. University of Connecticut Forest Tracts.

43
Composting
Several small-scale composting efforts occur on campus. These efforts are grassroots, voluntary efforts that were spearheaded and managed by a relatively small group of individuals. Since composting is not yet common on campus, all current practices are recognized and included in the inventory to provide support and encouragement for their continuation. These small steps have led the way to the exploration of larger-scale campus composting, and therefore remain significant, regardless of size.
Total 2007 composting volumes were estimated to be 8.28 tons24. The Clean Air-Cool Planet Campus Carbon Calculator estimates that -0.385 MTeCO2 is sequestered for every short ton of wet compost produced. Therefore, the University’s composting activities in 2007 sequestered an estimated 3.19 MTeCO2.
Floriculture Greenhouse
In 2003, University staff at the Floriculture Greenhouses recognized an opportunity to divert organic waste from the campus waste stream and begin performing basic composting. All compostable materials are separated out of the greenhouse waste stream, stored in composting bins, and eventually redistributed around campus. It is estimated that approximately 20 yards of compost (~5.4 tons) is generated annually in this manner.
Plant Science Farm
For several years, the University’s Plant Science Research and Education Farm has maintained two small compost piles: one for brush and the other for compostable organic matter (e.g., turfgrass clippings, soilless media from pots). Each pile is an approximately 360 cubic feet in volume, producing an estimated 2.9 tons combined of compost per year.
EcoGarden Club & Dining Services
Beginning in the fall of 2008, the student led UConn EcoGarden Club, developed a cooperative composting program with the University’s dining halls. Food waste is delivered daily from Whitney and Towers (Gelfenbein Commons) dining halls to the garden by Dining Services staff. Total volume varies but averages approximately 60 pounds per day when the dining halls are in operation. EcoGarden members maintain the compost bins and use the finished product in the on-campus produce gardens. The annual composting volume from this program will be estimated during the fall of 2009.
Proposed Agricultural Waste Composting Facility
The University has completed plans to develop a large-scale composting facility on the Depot Campus. This new facility will convert the University’s animal waste into high-grade compost. The proposed UConn compost facility will be a 10,000 square foot hoop barn structure constructed on a concrete pad. In addition, the site will contain a 10,000 square foot paved pad for finished compost. The facility is expected to accommodate approximately 15-25 truckloads of dry manure, liquid manure, and leaves throughout the year. Additional details regarding this proposal are discussed in Section 3.
Conclusion
24 Estimates assume that approximately 40% of the original material collected is converted to usable compost.

44
The University remains committed to reducing its carbon footprint and maximizing environmental sustainability. As a signatory of the American College and University Presidents Climate Commitment, UConn has embarked on the long, arduous task of neutralizing our greenhouse gas emissions. According to the inventory presented in this section, the University scope 1 and 2 emissions during the 2007 calendar year totaled approximately 178,956 MTeCO2. This inventory represents the University’s first comprehensive attempt to document our greenhouse gas emissions in relation to campus sustainability efforts. This inventory is not without limitations, however, and should be interpreted as a tool to guide future action rather than a technical compliance report. Emission values noted throughout this document are meant to provide a baseline for comparison between emission sources, but are assumed to be estimates with inherent error.
Understanding Increases in Emissions
Given the University’s plan for continued physical expansion over the next decade (i.e., UConn 2000 and UConn 21st Century), emissions are likely to continue to increase if reduction strategies are not implemented. When measuring progress over time, it is important to understand true increases in emissions and those that are a result of data collection and inventory process improvements. As the inventory process becomes more institutionalized, the quality and accuracy of the campus greenhouse gas inventory are likely to increase. However, as emissions sources are better ‘captured’ through data collection and analysis improvements, an apparent increase in campus emissions is likely to be observed, even in the absence of true increases in emissions. Therefore, caution should be exerted when comparing data and inventories.
Obtaining complete inventory data for the years prior to 2007 has proven difficult. Data from years prior to 2007 have been included as available throughout this inventory. Previous greenhouse gas emissions inventories have been conducted by the university; however, these inventories were not conducted with the same rigor as the 2007 inventory, likely resulting in an underestimate of campus emissions. Specific causes for apparent emissions increases in the 2007 inventory include:
The 2007 inventory is the first to include the Depot Campus, resulting in an increase in total building space, research space, and, subsequently, emissions.
The university cogeneration facility came online in mid-2006, resulting in a redistribution of energy-related emissions. While the benefits of the facility are generally recognized (e.g., increased efficiency, cost savings, educational opportunities) the University purchases power from a regional grid that contains a significant proportion of renewable energy sources (e.g., nuclear, hydroelectric). Therefore, converting to a predominantly natural-gas fired source, while cleaner than other available fossil-fuel sources, resulted in a significant increase in campus emissions.
Data previously unavailable has since been obtained and included in the 2007 inventory. Specifically, refrigerants and study abroad travel data were not included prior to 2007. Several data sources, including campus fertilizer use, were also better tracked and reported than in previous years.
Efforts are underway to complete the University’s 2008 and 2009 inventories for comparison to the 2007 baseline. Implementation of the CAP will begin during fall 2009, however, there will likely be a lag period before the impact of emissions reductions strategies is observed in the greenhouse gas inventory. Furthermore, as University departments become more accustomed to annual inventory data requests, it is anticipated that data quality and availability will increase, further improving the accuracy of the inventories. This may however, result in additional apparent increases in campus emissions. Given these factors (i.e., improved data and lag periods associated with implementing reduction
45
strategies), the University should not expect immediate (i.e., within 5-years) reductions in the campus inventory.
Limitations of the Current Inventory
The process of inventorying campus emissions has increased campus awareness of the University’s commitment to carbon neutrality and has served as a valuable tool to help individuals and departments better understand the environmental impact of regular campus operation. Furthermore, the inventory has the potential to assist university efforts to reroute protocol and reporting regulations in order to achieve increased efficiency, sustainability and social responsibility.
UConn chose to use the Clean Air-Cool Planet Campus Carbon Calculator (i.e., CACP calculator) to inventory 2007 emissions for inclusion in the Climate Action Plan. Previous, less-detailed inventories have also been conducted using earlier versions of the CACP calculator. The Clean Air Cool Planet (CACP) Campus Carbon Calculator is an excellent resource for a variety of reasons, including:
It is easily accessible and can be obtained free of cost;
CACP provides excellent access to support staff;
Minimal training and expertise is required to conduct an inventory;
The inventory relies upon in-house data sources; and
Many colleges and universities, including the majority of ACUPCC signatories, use the calculator, allowing for easy comparisons between institutions.
The CACP calculator’s simplicity makes it an attractive choice for campuses new to the inventorying process. However, the calculator’s simplicity also creates several limitations. Notably, as a land grant institution with a strong tradition in the agricultural and natural resource sciences, the calculator undervalues the impact of land management strategies, instead focusing on campus infrastructure and fleet. Consequently, reliance on the calculator to measure emission reduction progress, ‘favors’ the selection of solutions that fit within the bounds of the inventory. For example, the only strategy that will produce a measurable reduction in ‘agricultural’ emissions, as defined by the CACP calculator, is a reduction in herd size. However research has demonstrated that herd management can also have carbon footprint implications.25
Using the CACP calculator output as the basis of CAP development also encourages the formation of a plan that outlines a series of projects with measurable emissions, rather than a plan that is able to inspire changes in institutional policy and pedagogy. The UConn climate action plan attempts to balance project-based solutions with those strategies that address core operational or management principles. The latter, however, are believed to form the true core of the University’s CAP - institutional change. Consequently, limited emphasis has been placed on attempting to model and project future emissions scenarios until either the CACP calculator further evolves or a more appropriate tool can be identified.
Recommendations for Future Improvement
The current inventory process lacks streamlined reporting as well as a sense of personal responsibility for recording, maintaining and internally reporting the data required to estimate campus greenhouse
25 e.g., Boadi et al. 2004; Lovett et al. 2006; Weiske et al. 2006.
46
gas emissions. Furthermore, the present system is restricted by the calculator upon which it is based and likely does not capture the complete carbon footprint of the University. Goals for future campus greenhouse gas inventorying efforts include:
1. Increase awareness and understanding of the University’s greenhouse gas inventory efforts;
2. Maximize efficiency and continuity of the data collection and inventory compilation process;
3. Refine the campus greenhouse gas inventory to identify data gaps and analysis errors, provide greater reporting flexibility, and better capture overall campus emissions and sinks.
In order to achieve the above goals and to improve the campus inventorying process overall, the following actions are recommended:
I. Immediate Actions (within 1 year):
Form a campus greenhouse gas inventory meta-data workgroup. The workgroup will ensure that future inventories can be conducted and repeated with greater ease and will provide a forum to address inventory data gaps, issues, and opportunities for improvement. The Environmental Policy Advisory Council (EPAC) should select workgroup members based upon familiarity with and access to the required data. Workgroup members will be expected to assist with annual data collection and serve as a liaison to their respective department leadership. It is recommended that the workgroup meet, at a minimum, once per year.
Continue to allocate funding for a student intern to compile the inventory. The 2007 inventory was compiled by a lead student intern working with the assistance of other interns and the Climate Action Plan Project Manager in the Office of Environmental Policy. Student interns provide a low-cost strategy for ensuring the completion of the campus inventory. In turn, students gain valuable hands-on experience interacting with various departments throughout the university, collecting and analyzing data, and problem solving solutions to inventory issues. The student intern(s) will serve as staff support to the meta-data workgroup, and be responsible for compiling associated progress reports to the EPAC.
II. Short-term Actions (within 2-3 years):
Work with relevant departments to establish a memorandum of agreement (MOA) regarding annual data submission requirements and reporting protocol. The interns compiling the 2007 inventory were fortunate to be able to identify campus ‘champions’ in many of the relevant departments, and therefore collect the necessary data for the inventory. However, certain departments do not maintain their data in a format that is amenable to use in the inventory (i.e., travel data). Without this data it will be difficult to estimate the associated emissions and to measure the impact of implementing reduction strategies. The meta-data workgroup and the student intern(s) should therefore:
o Communicate data needs and purpose to the leadership of each department involved in the inventory process;
o Work with department leadership and staff to develop a mutually agreeable annual reporting protocol;
o Establish a channel of communication (e.g., department representative on the meta-data workgroup) to discuss data collection and reporting issues as well as suggestions for improvement; and
o Develop an MOA with relevant departments outlining annual data submission requirements and reporting protocol.
47
III. Long-term Action (within 5-7 years):
Establish a web-based automated data reporting process. The current inventory process is labor intensive and dependent upon the voluntary cooperation of departments. Furthermore, the ability to tailor the calculator to the UConn Storrs campus is limited. Therefore, to increase the accuracy and utility of the inventory results and to encourage increased participation from across the University, the metadata workgroup should work with campus IT staff to develop a web-based, UConn-specific software service to inventory campus greenhouse gas emissions. This service should allow departments to access a department-customized, user-friendly interface to input required data on an on-going basis and edit data as needed. The software should then automatically route the reported data to the official campus inventory. Additional inventory sources and sinks should be added, as appropriate, to the inventory.

48
References
Boadi, D., Benchaar, C., Chiquette, J., and Massé, D. (2004) Mitigation strategies to reduce enteric methane emissions from dairy cows: Update review. Canadian Journal of Animal Science. 84: 319-335.
Lovett, D.K., Shalloo, L., Dillon, P., & O’Mara, F.P. 2006. A systems approach to quantify greenhouse gas fluxes from pastoral dairy production as affected by management regime. Agricultural Systems. 88(2-3): 156-179.
U.S. Environmental Protection Agency (USEPA). 2000. Emissions and Generated Resource Integrated Database (eGRID), Data Years 1996-2000, Version 2.01. Prepared by E.H. Pechan & Associates, Inc. for the US EPA Office of Atmospheric Programs.
U.S. Environmental Protection Agency (USEPA). September 2006. Solid Waste Management and Greenhouse Gases: A Life-Cycle Assessment of Emissions and Sinks. 3rd Edition. 140 pg. Available online at http://www.epa.gov/climatechange/wycd/waste/downloads/fullreport.pdf.
U.S. Environmental Protection Agency (USEPA). April 2007. Inventory of U.S. Greenhouse Gas Emissions and Sinks: 1990-2005. EPA 430-R-07-002. Annex 6.1. Tables A-227, A-228, and A-229. Available online at http://www.epa.gov/climatechange/emissions/usgginv_archive.html.
Weiske, A., Vabitsch, A., Olesen, J.E., Schelde, K., Michel, J., Friedrich, R., Kaltschmitt, M.. 2006. Mitigation of greenhouse gas emissions in European conventional and organic dairy farming. Agriculture, Ecosystems & Environment. 112(2-3): 221-232.

Section 3: Emissions Reduction Strategies
The University of Connecticut Climate Action Plan:
Guiding the Path toward Carbon Neutrality
Storrs Campus August 2009

49
Section 3:
Emissions Reduction Strategies
Table of Contents
Executive Summary ......................................................................................................................53
Emissions Reduction Strategy Evaluation & Selection................................................................... 53
Overview of Proposed Greenhouse Gas Emissions Reduction Strategies .............................. 53
Energy-Related Strategies .............................................................................................................................. 53
Sustainable Development-Related Strategies ......................................................................................... 54
Transportation-Related Strategies ............................................................................................................. 55
Conclusion ........................................................................................................................................................ 55
Energy ...............................................................................................................................................56
Strategy E.1: Plan for the Future ............................................................................................................. 58
E.1.1. Develop a campus Utilities Master Plan ........................................................................................ 58
E.1.2. Ensure energy efficiency through the building design process ............................................ 58
E.1.3. Commit to renewable energy goals for campus energy supply ........................................... 58
Strategy E.2: Reduce Demand ................................................................................................................... 59
E.2.1. Establish a program to continuously commission buildings ................................................ 59
E.2.2. Adjust building temperature set points and occupancy schedules ..................................... 59
E.2.3. Establish a lighting update program (interior and exterior)............................................... 60
E.2.4. Reduce fume hood energy consumption ....................................................................................... 60
E.2.5. Establish an energy-efficient computing policy ......................................................................... 60
E.2.6. Implement a residence hall appliance policy .............................................................................. 61
E.2.7. Minimize energy use associated with equipment and appliances ...................................... 61
E.2.8. Identify and improve energy efficiencies associated with campus food service equipment and appliances ................................................................................................. 61
Strategy E.3: Maximize Efficiency ........................................................................................................... 62
E.3.1. Correct inefficiencies in campus utility distribution systems ............................................... 62
E.3.2. Expand and better integrate current energy monitoring efforts ....................................... 62
Cover Photo: University of Connecticut President, Michael Hogan, demonstrates the Connecticut Global Fuel Cell Center’s fuel-cell powered go-kart during the University’s 2009 Earth Day celebration.

50
E.3.3. Promote continuous improvement of operational strategies at the cogeneration facility ........................................................................................................................................................ 63
E.3.4. Centralize utility systems as much as possible and examine opportunities to integrate building projects to maximize utility system efficiency ................................ 63
E.3.5. Improve the efficiency of building HVAC systems through heat zoning and high-efficiency filters .................................................................................................................. 63
E.3.6. Develop and initiate a boiler efficiency and emissions reductions program .................. 63
E.3.7. Develop and implement an equipment energy efficiency purchasing policy ................. 63
Strategy E.4: Substitute Green Technologies for Existing Technologies ................................ 64
E.4.1. Seek to incorporate alternative energy sources into new constructions and retrofit existing buildings were appropriate and feasible .................................................... 64
E.4.2. Maximize efficiency of laboratory airflow through new technologies.............................. 64
E.4.3. Identify and evaluate applications for variable-frequency drives (VFDs) ....................... 64
E.4.4. Evaluate the feasibility and appropriateness of developing a carbon neutral power plant ............................................................................................................................. 64
Strategy E.5: Demonstrate Alternative Technologies ..................................................................... 65
E.5.1. Develop a renewable energy master plan and implement demonstration projects .... 65
Sustainable Development ..........................................................................................................66
Strategy SD.1: Green the campus building and renovation process. ........................................ 68
SD.1.1. Revise the Sustainable Design and Construction Policy ....................................................... 68
SD.1.2. Update the Sustainable Design Guidelines and mandate their use for projects not required to meet LEED standards. ................................................................. 69
SD.1.3. Develop a construction materials selection, recycling and reuse guide ........................ 70
SD.1.4. Seek to achieve zero-carbon buildings ....................................................................................... 70
Strategy SD.2: Manage the campus forest to maximize carbon sequestration. ................... 70
SD.2.1. Establish a permanent position to oversee the management of University’s forest holdings ............................................................................................................... 71
SD.2.2.Inventory the University’s forest holdings and establish a plan to maximize carbon sequestration. ............................................................................................... 72
SD.2.3. Develop and implement a management plan to improve and expand the campus urban forest .................................................................................................................... 72
SD.2.4. Establish general forest acquisition goals and a ‘no net loss’ policy............................... 72
Strategy SD.3: Refine campus agricultural practices to minimize fuel and chemical inputs, while maximizing sequestration ................................................................ 73
SD.3.1. Develop an agricultural and landscaping waste composting system ............................ 73
SD.3.2. Identify additional opportunities to use agricultural wastes to generate new products ......................................................................................................................................... 75
SD.3.3.Maximize the use of organic, conservation-till agriculture on campus .......................... 75
SD.3.4.Manage herds to minimize associated emissions .................................................................... 75

51
Strategy SD.4: Minimize the carbon footprint of campus landscaping .................................... 75
S.D.4.1.Develop a campus landscaping master plan designed to minimize chemical, energy, and water use associated with campus landscaping .............................................. 76
S.D. 4.2.Improve turf quality on campus ................................................................................................... 76
S.D.4.3.Maximize recycling of landscaping organic waste ................................................................ 77
Strategy SD.5: Embody and implement low impact development (LID) principles .......... 77
S.D.5.1.Require the use of the LEED for Neighborhood Development Rating System to guide future development decisions ......................................................................................... 78
S.D.5.2.Establish a cap on impervious surface ........................................................................................ 78
S.D.5.3. Select surface materials that are characterized by a high albedo, high emissivity, and low heat capacity ................................................................................................... 79
S.D.5.4. Require integration of green roofs into all new building designs; retrofit existing buildings where possible .................................................................................................. 79
Strategy SD.6: Maximize water conservation and reuse ............................................................... 79
S.D.6.1. Correct inefficiencies in campus steam utility systems ........................................................ 80
S.D.6.2. Upgrade water fixtures in campus buildings to maximize efficiency ............................ 80
S.D.6.3. Construct a water reclamation facility ...................................................................................... 81
Strategy SD.7: Increase campus recycling and waste reduction rates ..................................... 81
S.D.7.1. Increase campus food waste recycling ....................................................................................... 82
S.D.7.2. Establish a green purchasing policy to minimize packaging and other waste associated with campus purchases ................................................................................... 83
Transportation ...............................................................................................................................84
Strategy T.1: Better integrate transportation into campus planning and design decisions .............................................................................................................................. 87
T.1.1. Develop a modal transportation advisory committee. ........................................................ 87
T.1.2. Develop a campus transportation master plan for travel to and from Storrs ........... 87
T.1.3. Establish a campus policy that transit be considered when planning new campus buildings ................................................................................................................................................. 87
Strategy T.2: Decrease the campus vehicle fleet annual fuel use ............................................ 87
T.2.1. Establish fleet efficiency purchasing requirements .............................................................. 88
T.2.2. Phase out older, inefficient vehicles; replace with higher efficiency vehicles appropriate for the intended use ................................................................................................. 88
T.2.3. Develop and implement a mandatory vehicle efficiency improvement program ..... 88
T.2.4. Enforce the state anti-idling policy ............................................................................................. 88
T.2.5. Increase the efficiency of on-campus delivery systems ........................................................ 89
T.2.6. Discourage unnecessary on-campus driving ........................................................................... 89
Strategy T.3: Increase the proportion of renewable fuels used annually ............................ 89
T.3.1. Increase the production and use of biodiesel in university vehicles ............................... 89
T.3.2. Increase the use of vehicles that run on carbon-neutral or low-carbon fuel sources ............................................................................................................................................ 90

52
Strategy T.4: Decrease annual commuter single occupancy vehicle trip frequency and per capita commuter vehicle miles travelled .............................................. 91
T.4.1. Work with campus unions to encourage flexibility in employee workday definition ................................................................................................................................................ 91
T.4.2. Increase access and provide incentives for telecommuting and online courses ........ 91
T.4.3. Develop a campus rideshare incentive program.................................................................... 91
T.4.4. Establish an on-campus carshare program ............................................................................. 92
T.4.5. Provide a weekday shuttle service to nearby off-campus park-and-ride lots ............. 93
T.4.6. Increase local housing options and availability ..................................................................... 93
T.4.7. Improve bicycle and pedestrian safety and access from off-campus housing ............ 93
T.4.8. Increase bus and shuttle availability to and from off-campus destinations ............... 94
T.4.9 Advocate for the development of a regional light rail commuting option .................. 96
Strategy T.5: Redesign campus parking to minimize commuter emissions ....................... 96
T.5.1. Establish a campus parking cap ................................................................................................... 96
T.5.2. Develop an incentive program to discourage parking pass purchases ......................... 97
T.5.3. Implement a campus-wide parking fee increase; use the revenue to fund improvements and expansions to campus mass transit options ...................................... 97
T.5.4. Price parking according to vehicle fuel efficiency and EPA emissions rating ............ 97
T.5.5. Offer a reduced-cost parking pass, priority parking and related emergency support services for rideshare participants ............................................................................. 97
T.5.6. Develop a reduced-cost parking pass for motorcycles and scooter when registered as the sole vehicle ......................................................................................................... 98
Strategy T.6: Increase walking and biking ........................................................................................ 98
T.6.1. Hire a pedestrian and bicycle coordinator to ensure implementation of Master Plan recommendations ..................................................................................................... 99
T.6.2. Improve campus bicycle amenities and paths ........................................................................ 99
T.6.3. Develop a bicycle commuter-incentive program ................................................................ 101
T.6.4. Create an affordable on-campus bicycle shop ..................................................................... 101
T.6.5. Establish a campus-wide bicycle loaner program .............................................................. 101
Strategy T.7: Reduce the carbon footprint of off-campus travel .......................................... 101
T.7.1. Require vehicle rental programs to provide efficient and alternative fuel vehicle options .................................................................................................................................. 102
T.7.2. Negotiate discounted bus and train ticket rates for UConn faculty, staff and students ...................................................................................................................................... 102
T.7.3. Discourage air travel to locations within reasonable driving or train distance .... 102
References .................................................................................................................................... 103

53
Executive Summary
Emissions Reduction Strategy Evaluation & Selection
The University plans to reduce its greenhouse gas emissions through the implementation of strategies relating to energy (i.e., generation, distribution and use), sustainable development (i.e., building design and land management), and transportation (i.e., campus fleet operation and off-campus travel). Reduction strategies selected for inclusion in the final Climate Action Plan were evaluated based upon four primary criteria:
Emissions Reductions (i.e., anticipated emissions reduction over the life of the project; reduction potential is estimated based upon current emission levels).
First Cost (i.e., initial investment required)
Return on Investment, ROI (i.e., payback period)
Time to Implement (i.e., time required to plan, design and begin implementing the strategy)
Specific parameters relating to the Emissions Reduction, First Cost and ROI criteria are described in Table 3.1. (The estimated time to implement each strategy is noted within the summary tables throughout this section.)
Table 3.1. Summary of Reduction Strategy Evaluation Criteria
Emissions Reduction
1 First Cost ROI
Limiting <1% >$500,000 >10 Years
Good 1-5% $50,000-$500,000 5-10 Years
Excellent >5% <$50,000 0-5 Years
The strategy summary tables provided in this section are meant to serve as tools to allow for easier comparison between proposed strategies. A rating of ‘limited’ for a given criteria is not meant to imply that the strategy should not be pursued. Rather, the ratings are intended to assist the decision making process, specifically the prioritization of initial CAP implementation. First cost, for example, will be large for certain strategies (e.g., improving the efficiency of campus utility systems). However, these strategies may also have the greatest estimated emissions reduction impact. Conversely, a strategy with only a limited impact on overall emissions should be pursued regardless, in particular when the cost of doing so is negligible or there are additional secondary benefits. Ultimately, any emissions reduction will have a positive impact on the campus footprint and move the University closer to carbon neutrality.
Overview of Proposed Greenhouse Gas Emissions Reduction Strategies
Energy-Related Strategies
Energy-related strategies form the ‘heart’ of the University’s Climate Action Plan. According to the 2007 UConn Storrs Campus greenhouse gas inventory, energy related emissions accounted for approximately
1 Greenhouse gas emissions reduction potential of a proposed strategy is described in terms of the estimated percent reduction in current emission levels. Emissions reduction ratings noted in this version of the Climate Action Plan are based upon the potential of the proposed strategy to reduce 2007 emission levels. A strategy with an ‘excellent’ emissions reduction potential is estimated to avoid more than 10,630 MTeCO2. It is estimated that strategies rated ‘Good’ and ‘Limiting’ will reduce 2,126-10,630 and less than 2,126 MTeCO2, respectively.

54
80% of the University’s greenhouse gas emissions. The majority of these emissions occurred in association with the operation of the University cogeneration facility (i.e., electricity and steam generation). Other on-campus stationary sources (e.g., emergency generators, large boilers and stand-alone chillers) and purchased electricity also contributed, to a lesser extent, to the campus emissions profile.
Given the significant proportion of the UConn Storrs Campus’s emissions profile that is related to campus energy use, energy efficiency improvements will serve as the foundation of campus emissions reductions efforts, especially in the near future. In addition, since the cogeneration facility will serve as the primary energy source for the Storrs campus over the next 20-30 years, the University will strive to operate the facility at maximum efficiency and reliability. Energy conservation and the exploration of alternative fuels will also remain high priorities.
In general, the University’s energy-related greenhouse gas emissions reduction plan relies upon five primary objectives:
1. Plan for the future (i.e., future demand, future technology improvements, etc.).
2. Reduce demand.
3. Increase efficiency.
4. Substitute green technology for existing technologies.
5. Demonstrate alternative technologies.
The Energy portion of this section further elaborates upon the individual emissions reduction strategies identified to achieve the objectives above.
Sustainable Development-Related Strategies
Emissions due to campus energy use can also be indirectly addressed through sustainable development, notably through building design and construction. In addition, sustainable development related strategies can help reduce campus emissions associated with campus land use (e.g., landscaping, agriculture, and forestry), water use (i.e., pumping, distribution and treatment) and waste disposal.
The design of the campus, in particular, how the University chooses to develop or conserve land in the future, has the potential to greatly influence the greenhouse gas inventory. It is therefore recommended that the University continue to abide by the responsible growth policies that have guided recent campus projects. In particular, the University should emphasize growth strategies and patterns that will:
Opt for re-development of built parcels over the development of forest or other hydric or vegetated landscapes;
Encourage mixed use development;
Promote ‘alternative’ forms of transportation, including walking, bicycling, and public transportation, while discouraging single-occupancy-vehicle (SOV) trips; and
Integrate green building and alternative energy design features whenever feasible.
Additional strategies that the University should pursue to reduce campus greenhouse gas emissions include:
1. Greening the campus building and renovation process;
2. Managing the campus forest to maximize carbon sequestration;
3. Refining campus agricultural practices to minimize fuel and chemical inputs, while maximizing sequestration;

55
4. Minimizing the carbon footprint of campus landscaping;
5. Embodying and implementing low impact development (LID) principles;
6. Maximizing water conservation and reuse; and
7. Increasing campus recycling and waste reduction rates.
The ‘Sustainable Development’ portion of this section provides additional details regarding these campus greenhouse gas reduction strategies.
Transportation-Related Strategies
The final piece of the University’s greenhouse gas emissions profile is related to transportation, specifically emissions associated with operation of the on-campus vehicle fleet; faculty, staff and student commuting to and from campus; and off-campus travel (e.g., rental cars, air travel). Therefore, in order to reduce greenhouse gas emissions associated with these transportation sources, the University will strive to achieve four main objectives:
1. Decrease annual vehicle fleet fuel use (e.g., gasoline, diesel);
2. Increase the proportion of renewable fuel sources (e.g., biodiesel) in annual fuel use;
3. Decrease annual commuter vehicle miles travelled to campus;
4. Minimize the impact of off-campus travel.
The ‘Transportation’ portion of this section provides additional details regarding campus greenhouse gas reduction strategies designed to achieve reductions in greenhouse gas emissions associated with campus transportation systems and university-related travel.
Conclusion
It will be the role of the Environmental Policy Advisory Council (EPAC) to prioritize implementation of the strategies proposed in this section. Evaluation criteria and ratings for each emissions reduction strategy are provided throughout this section to assist the EPAC with this task. The emissions reduction strategies and associated ratings are based upon the following assumptions about the University over the next 30-40 years:
1. There will be no significant changes in student enrollment.
2. The nature and delivery of education at the University will remain consistent.
3. The cogeneration facility will serve as the primary energy source for the campus.
However, circumstances change over time, and it is therefore recommended that the list of proposed emissions reduction strategies be reviewed on a regular basis (e.g., 5-7 years) to provide an opportunity to revise the ratings, and, if applicable, to allow for inclusion of previously overlooked emissions reduction strategies.

56
Emissions Reduction Strategies: Energy
Table 3.2. Energy-Related Emissions Reduction Strategies
E.1. Plan for the Future Emissions Reduction
First Cost ROI Time to
Implement
E.1.1. Develop a campus Utilities Master Plan. n/a n/a n/a n/a
E.1.2. Ensure energy efficiency through the building design process.
n/a n/a n/a n/a
E.1.3. Commit to renewable energy goals for campus energy supply.
n/a n/a n/a n/a
E.2. Reduce Demand Emissions Reduction
First Cost ROI Time to
Implement
E.2.1. Establish a program to continuously commission buildings.
0-2 years
E.2.2. Adjust building temperature set points and occupancy schedules.
In Progress
E.2.3. Establish a lighting update program (interior and exterior).
In Progress
E.2.4. Reduce fume hood energy consumption. In Progress
E.2.5. Establish an energy-efficient computing policy.
2-5 years
E.2.6. Implement a residence hall appliance policy.
0-2 years
E.2.7. Minimize energy use associated with equipment and appliances.
2-5 years
E.2.8. Identify and improve energy efficiencies associated with campus food service equipment and appliances.
2-5 years
E.3. Maximize efficiency Emissions Reduction
First Cost ROI Time to
Implement
E.3.1. Correct inefficiencies in campus utility distribution systems.
In Progress
E.3.2. Expand and better integrate current energy monitoring efforts.
In Progress
E.3.3. Promote continuous improvement of operational strategies at the cogeneration facility.
In Progress

57
E.3. Maximize efficiency (Continued) Emissions Reduction
First Cost ROI Time to
Implement
E.3.4. Centralize utility systems as much as possible and examine opportunities to integrate building projects to maximize utility system efficiency.
In Progress
E.3.5. Improve the efficiency of building HVAC systems through heat zoning and high-efficiency filters.
2-5 years
E.3.6. Develop and initiate a boiler efficiency and emissions reductions program.
0-2 years
E.3.7. Equipment energy efficiency purchasing policy.
0-2 years
E.4. Substitute green technologies for existing technologies
Emissions Reduction
First Cost ROI Time to
Implement
E.4.1. Seek to incorporate alternative energy sources into new constructions and retrofit existing buildings were appropriate and feasible.
2-5 years
E.4.2. Maximize efficiency of laboratory airflow through new technologies.
2-5 years
E.4.3. Identify and evaluate additional applications for variable-frequency drives (VFDs).
2-5 years
E.4.4. Evaluate the feasibility and appropriateness of developing a carbon neutral power plant.
>5 years
E.5. Demonstrate alternative technologies Emissions Reduction
First Cost ROI Time to
Implement
E.5.1. Develop a renewable energy master plan and implement demonstration projects.
2-5 years
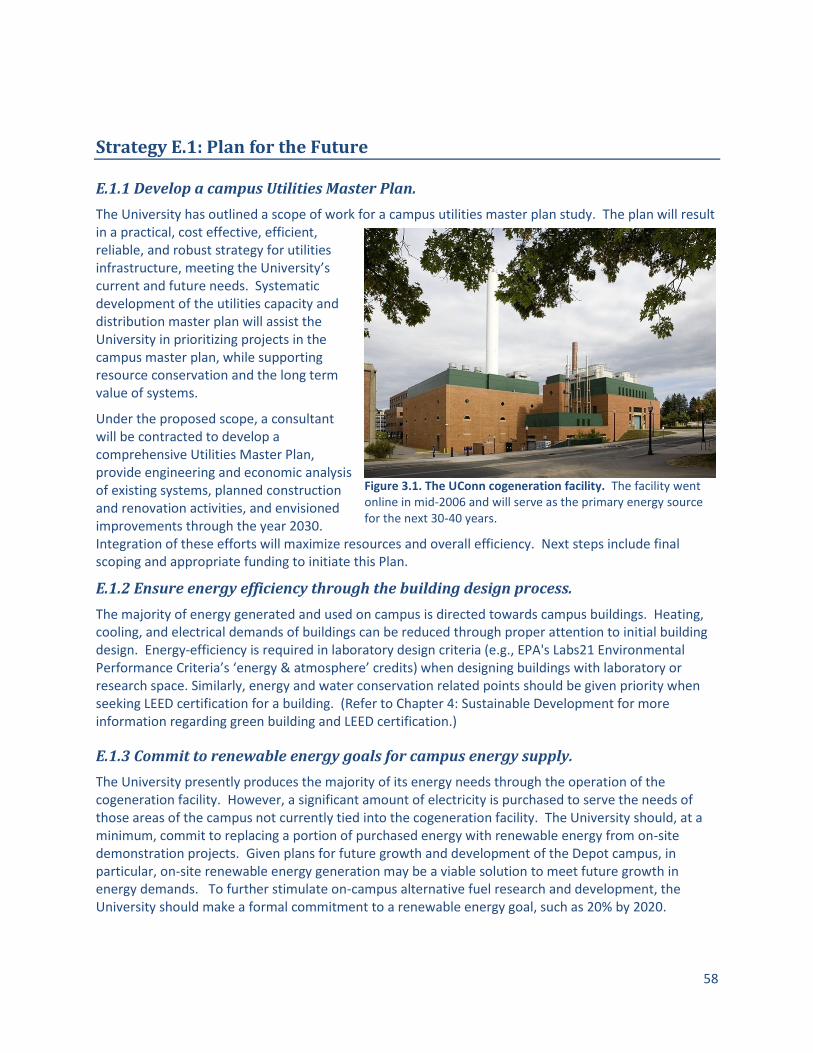
58
Strategy E.1: Plan for the Future
E.1.1 Develop a campus Utilities Master Plan.
The University has outlined a scope of work for a campus utilities master plan study. The plan will result in a practical, cost effective, efficient, reliable, and robust strategy for utilities infrastructure, meeting the University’s current and future needs. Systematic development of the utilities capacity and distribution master plan will assist the University in prioritizing projects in the campus master plan, while supporting resource conservation and the long term value of systems.
Under the proposed scope, a consultant will be contracted to develop a comprehensive Utilities Master Plan, provide engineering and economic analysis of existing systems, planned construction and renovation activities, and envisioned improvements through the year 2030. Integration of these efforts will maximize resources and overall efficiency. Next steps include final scoping and appropriate funding to initiate this Plan.
E.1.2 Ensure energy efficiency through the building design process.
The majority of energy generated and used on campus is directed towards campus buildings. Heating, cooling, and electrical demands of buildings can be reduced through proper attention to initial building design. Energy-efficiency is required in laboratory design criteria (e.g., EPA's Labs21 Environmental Performance Criteria’s ‘energy & atmosphere’ credits) when designing buildings with laboratory or research space. Similarly, energy and water conservation related points should be given priority when seeking LEED certification for a building. (Refer to Chapter 4: Sustainable Development for more information regarding green building and LEED certification.)
E.1.3 Commit to renewable energy goals for campus energy supply.
The University presently produces the majority of its energy needs through the operation of the cogeneration facility. However, a significant amount of electricity is purchased to serve the needs of those areas of the campus not currently tied into the cogeneration facility. The University should, at a minimum, commit to replacing a portion of purchased energy with renewable energy from on-site demonstration projects. Given plans for future growth and development of the Depot campus, in particular, on-site renewable energy generation may be a viable solution to meet future growth in energy demands. To further stimulate on-campus alternative fuel research and development, the University should make a formal commitment to a renewable energy goal, such as 20% by 2020.
Figure 3.1. The UConn cogeneration facility. The facility went online in mid-2006 and will serve as the primary energy source for the next 30-40 years.

59
Strategy E.2: Reduce Demand
E.2.1 Establish a program to continuously commission buildings.
It is estimated that retrocommissioning campus buildings can have an immediate impact of 10% or more on campus energy use (EH&E 2009). Furthermore, retrocommissioning doesn’t require an investment in capital equipment. Therefore, the University should identify campus ‘energy hogs’ and develop action plans to reduce building energy demand.
a. Establish a building HVAC retrocommissioning program, which includes:
Conducting complete energy audits on buildings;
Prioritizing audits by current building energy usage or by other economic means;
Reviewing maintenance and submetering records to identify unanticipated sources of high energy use, unexplained utility usage fluctuations or increases in maintenance calls; and
Developing action plans and implementing corrective actions.
b. Identify energy efficiency improvement opportunities associated with building maintenance and renovation. To minimize energy consumption, evaluate building envelopes (e.g. windows, insulation) and strive to maintain and upgrade where needed by:
Upgrading roof and wall insulation to current energy code levels;
Minimizing water and wind infiltration; and
Maximizing serviceability.
E.2.2 Adjust building temperature set points and occupancy schedules.
In general, estimates suggest a 1-2% savings of total utility costs for each degree that the temperature is raised or lowered (during summer and winter, respectively). The University should therefore implement a campus policy regarding temperature set points and occupancy schedules. The policy should include the following elements:
Building temperature ranges or set points tied to the ASHRAE 66-2004 or other appropriate industry standard.
Established hours of building operation and building occupancy schedules.
Identification of occupant responsibilities related to turning off lights, office equipment, closing fume hoods, etc.
Identification of specialized areas – such as animal facilities, collections, data center, galleries, etc. – that would be exempt from the guidelines.
A process to seek a deviation from operating hours via an appropriately identified University approving authority.
Identification of Energy Management Systems (EMS) role in the process.
To ensure effectiveness and continuous improvement:
Develop a list of the most energy efficient buildings and prioritize scheduling accordingly.
Conduct annual reviews of operational schedules and monitor for undocumented or unapproved modifications throughout the year.
Update occupancy schedules as needed to remain current with changes in building utilization and department needs.
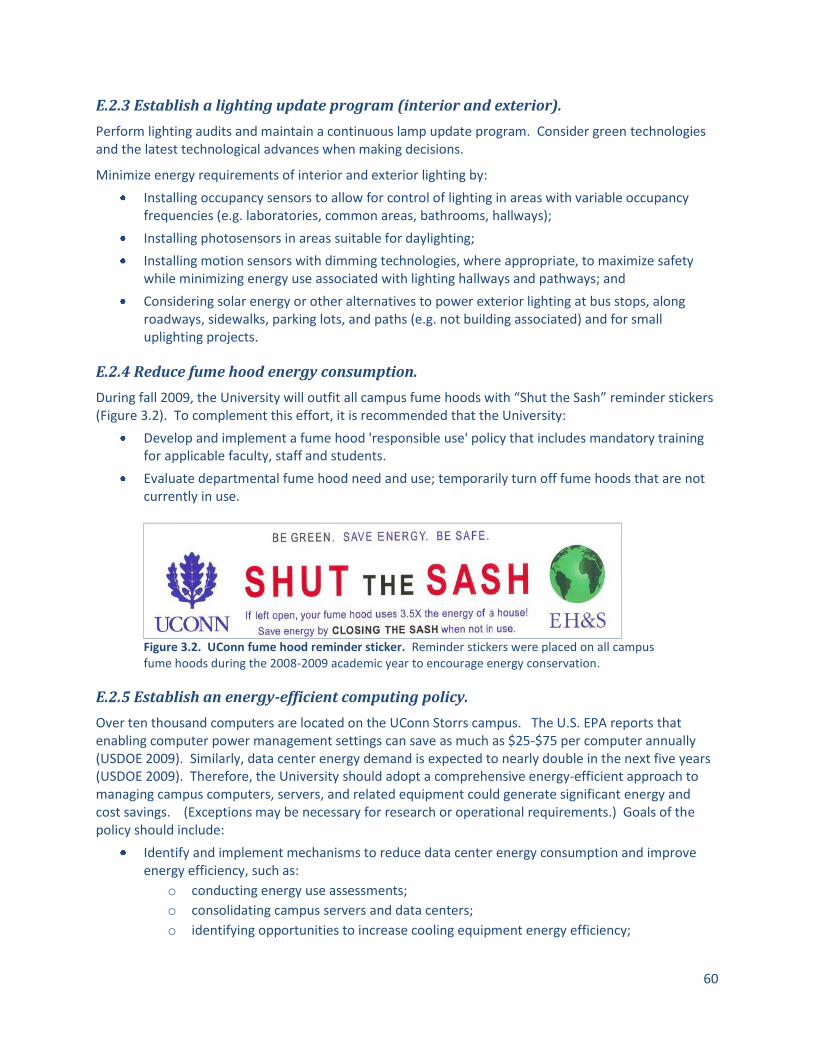
60
E.2.3 Establish a lighting update program (interior and exterior).
Perform lighting audits and maintain a continuous lamp update program. Consider green technologies and the latest technological advances when making decisions.
Minimize energy requirements of interior and exterior lighting by:
Installing occupancy sensors to allow for control of lighting in areas with variable occupancy frequencies (e.g. laboratories, common areas, bathrooms, hallways);
Installing photosensors in areas suitable for daylighting;
Installing motion sensors with dimming technologies, where appropriate, to maximize safety while minimizing energy use associated with lighting hallways and pathways; and
Considering solar energy or other alternatives to power exterior lighting at bus stops, along roadways, sidewalks, parking lots, and paths (e.g. not building associated) and for small uplighting projects.
E.2.4 Reduce fume hood energy consumption.
During fall 2009, the University will outfit all campus fume hoods with “Shut the Sash” reminder stickers (Figure 3.2). To complement this effort, it is recommended that the University:
Develop and implement a fume hood 'responsible use' policy that includes mandatory training for applicable faculty, staff and students.
Evaluate departmental fume hood need and use; temporarily turn off fume hoods that are not currently in use.
Figure 3.2. UConn fume hood reminder sticker. Reminder stickers were placed on all campus fume hoods during the 2008-2009 academic year to encourage energy conservation.
E.2.5 Establish an energy-efficient computing policy.
Over ten thousand computers are located on the UConn Storrs campus. The U.S. EPA reports that enabling computer power management settings can save as much as $25-$75 per computer annually (USDOE 2009). Similarly, data center energy demand is expected to nearly double in the next five years (USDOE 2009). Therefore, the University should adopt a comprehensive energy-efficient approach to managing campus computers, servers, and related equipment could generate significant energy and cost savings. (Exceptions may be necessary for research or operational requirements.) Goals of the policy should include:
Identify and implement mechanisms to reduce data center energy consumption and improve energy efficiency, such as:
o conducting energy use assessments;
o consolidating campus servers and data centers;
o identifying opportunities to increase cooling equipment energy efficiency;

61
o exploring virtualization tools, optical networks, and thin-client computing; and
o evaluating potential data center design changes.
Establish computer use expectations, including:
o enabling power management settings on computing resources; and
o shutting down computers and affiliated equipment when not in use.
E.2.6 Implement a residence hall appliance policy.
Develop a policy to address common, energy-intensive appliances used in the residence halls, such as refrigerators, microwaves, televisions, and/or lights.
Components of the policy might include:
Limit the number of each appliance type (e.g. refrigerator, microwave) allowed per room, and require ENERGY STAR certified appliances when available.
Restrict the use of personal appliances in the residence halls; provide University-owned energy efficient appliances and collect a student deposit to cover losses due to theft or damage.
Work with the UConn Co-op to ensure ENERGY STAR model appliances are regularly stocked and competitively priced; encourage students and their families to purchase appliances for residence halls from the Co-op.
E.2.7 Minimize energy use associated with equipment and appliances.
a. Minimize phantom loads associated with office appliances. Identify a team to evaluate campus phantom loads and develop a reduction strategy to minimize unnecessary electricity use. Office and residential equipment and appliances draw a significant amount of energy from the campus grid even when not in use (i.e. the ‘phantom load). Simple solutions, such as the distribution and use of power strips or education to encourage campus members to unplug appliances when not in use, can help reduce the campus phantom load.
b. Eliminate use of window air conditioning units wherever possible. Develop an official policy banning the use of personal air conditions in campus buildings, unless University approved for health or other qualifying reasons. All approved AC units must be covered during the winter months to prevent heating loss.
c. Discontinue the use of small individual space heaters through increased enforcement of the University’s space heater policy. The current policy is available at http://policy.uconn.edu/pages/findPolicy.cfm?PolicyID=223
E.2.8 Identify and improve energy efficiencies associated with campus food service equipment and appliances.
Food service vendors, both University-owned and private, are located throughout campus. Additional improvements to food service energy efficiency can be made by:
Evaluating university-owned refrigerators, freezers and dishwashers in order to identify and replace inefficient and/or older models;
Requiring the replacement of open display refrigerators or freezers with closed door units;
Consolidating campus food vendor equipment based upon need and frequency of use;
Working with vendors to ensure they are using the most efficient units possible; and

62
Installing vending machine misers on all equipment (e.g. soda and snack machines, food displays).
Strategy E.3: Maximize efficiency
E.3.1 Correct inefficiencies in the utility distribution systems.
An engineering consulting firm, Fuss & O’Neill, have been contracted to survey the existing steam and condensate infrastructure. A computer model will be developed enabling Facilities Operations to optimize operation, isolate sections for replacement with minimal interruptions to the customer base, and balance flows to reduce systems stresses. The first $2.6M replacement projects are expected to be included in the 2011 (fiscal year) deferred maintenance program. Similar expenditures will be required on an ongoing basis to stabilize degradation and commence upgrading the systems.
The Chilled Water system controls are currently being upgraded under the FY09 Deferred Maintenance Program. This upgrade will properly integrate the operation of the 1999 electric and gas driven chillers with 2006 steam chillers. Increased efficiency will result from being able to effectively run and balance loading using the most economical sequence of chiller operation.
E.3.2 Expand and better integrate current energy monitoring efforts.
Complete the on-going meter installation program and verify proper functioning. Expand the Energy Management System (Andover) to include areas not currently monitored. Develop a University protocol for monitoring, tracking and trending meter data, including integration with outreach efforts. For example, place Energy Kiosks at highly visible locations to display the metering data with recommended actions to reduce use. Based upon data collected identify campus 'energy hogs' and target these buildings for retrofitting to reduce energy usage.
The third phase of a four-phase meter installation program is in progress. Phase I focused on surveying the existing infrastructure and installing metering on the largest or externally billable users. Phase II focused on installing metering on the grant funded buildings and completing connection of all installed metering to the data historian. Phase III will begin integration of the data collection into analysis tools, developing a billing structure with cost estimates, and developing the evergreen principles necessary to maintain and repair the metering network components.
The outdated FASER 6.0 Energy management software should be updated to take advantage of the current generation of analysis tools. Increased national awareness of energy consumption and the need for conservation has driven the software manufacturers to broaden the abilities and lower costs associated with energy management software. Greater flexibility in determining energy improvement targets exist in current versions. This software serves as the central gathering point of external and internal energy consumption and billing data. Selection of this software should be an enterprise level effort to incorporate the needs of stakeholders such as Accounts Payable, Accounts Receivable, and Facilities Operation. The ability to accurately bill energy users and maintain all the required sub metering is dependent upon this software working correctly.
63
E.3.3 Promote continuous improvement of operational strategies at the cogeneration facility.
Identify and implement power plant efficiency improvement measures. Presently the power plant operates at approximately 60% efficiency and opportunities remain to further improve this efficiency.
E.3.4 Centralize utility systems as much as possible and examine opportunities to integrate building projects to maximize utility system efficiency.
All UConn buildings located on the campus, that still are on Connecticut Light and Power meters should be removed from the meters, and instead be rewired to the UConn campus grid. The cogeneration plant has the capacity to support this additional load. This will eliminate large quantities of electric charges and allows us to use our energy efficient cogeneration plant at near full capacity. This work will be need to be conducted in balance with increasing the steam usage on campus to effectively leverage the cogeneration effect.
Audit all campus transformers and downsize or consolidate where possible.
E.3.5 Improve the efficiency of building HVAC systems.
a. Install occupancy sensors to allow for control of HVAC in areas with variable occupancy frequencies (e.g. laboratories, common areas, bathrooms, hallways). Make this a UConn standard for all new construction and renovations.
b. Switch to heat zoning to address areas of buildings that require deviation from the established set point. Heat zoning allows the University to address certain areas of buildings based upon occupancy, equipment or functions, which require deviation from the established set point.
c. Require the use of high-efficiency filters for all HVAC systems to reduce drag. High quality filters should be used in all University HVAC systems. In addition, the University should require annual cleaning of all campus building heating/cooling HVAC coils and Air Handling Units (AHUs).
E.3.6 Develop and initiate a boiler efficiency and emissions reductions program.
The University should track small boilers and determine the associated efficiencies. An annual boiler maintenance plan should also be developed and implemented on a rotating basis.
E.3.7 Develop and implement an equipment energy efficiency purchasing policy.
EPA and DOE continually develop new ENERGY STAR specifications to expand the program to new products. Energy Star models are now available for commercial appliances, commercial heating & cooling, consumer electronics, residential appliances, residential lighting, commercial food service, construction products, office products, and residential heating & cooling products. A complete product specifications and updated lists of qualifying products is available at: http://www.energystar.gov/index.cfm?fuseaction=find_a_product.
Recommended components of the university equipment energy efficiency purchasing policy include:
Require that University vendors provide products that earn the Energy Star and meet the Energy Star specifications for energy efficiency when available.
64
Require departments to purchase Energy Star products when offered by campus vendors. Require written justification to purchase non-efficient products for which a more energy efficient model is available.
Strategy E.4: Substitute Green Technologies for Existing Technologies
E.4.1 Seek to incorporate alternative energy sources into new constructions and retrofit existing buildings were appropriate and feasible.
The University should make it standard practice to consider on-site renewable energy sources with new construction and renovation projects. When determining feasibility the upfront costs of the project should be compared to upfront costs of conventional designs as well as the difference in energy expenditures over the life of the building. Specific opportunities might include:
Incorporate solar thermal and solar photovoltaics (PV) into building designs. Solar water heaters have been demonstrated to reduce conventional water heating needs by approximately 66% (USDOE 2006). Solar PVs not only generate energy but also have excellent PR value, serving as a highly visible ‘announcement’ of the University of Connecticut’s commitment to sustainability.
Install geothermal heating or cooling systems. According to the EPA, geothermal heat pumps can reduce energy consumption—and corresponding emissions—up to 44% compared to air-source heat pumps and up to 72% compared to electric resistance heating with standard air-conditioning equipment. (USDOE 2008).
E.4.2 Maximize efficiency of laboratory airflow through new technologies.
Replace constant volume hoods on campus with the most efficient available hood type (e.g. variable air volume hood) for the intended purpose. Install Usage Based Controls (UBC) which modulate hood flows based on the presence or absence of a fume hood operator, Phoenix controls, or a comparable option, on all campus fume hoods. Install alarms to indicate to Facilities and Environmental Health & Safety when sashes are left open. Generate corresponding reports and send to department heads for action.
E.4.3 Identify and evaluate applications for variable-frequency drives (VFDs).
Variable frequency devices (VFDs) control the rotational speed of an alternating current electric motor by controlling the frequency of the electrical power supplied to the motor. The majority of the University’s chillers currently are equipped with variable frequency devices (VFDs). Additional on-campus applications of VFDs can save the University energy and money. (For example, Harvard University has successfully implemented VFDs to control kitchen exhaust hoods while Ball State University uses VFDs in association with campus distribution pumps.)
E.4.4 Evaluate the feasibility and appropriateness of developing a carbon-neutral power plant.
The cogeneration facility has approximately a 40-year design life. As our 2050 carbon neutrality goal approaches, it is likely that the University will still have emissions requiring neutralization. Therefore, it is recommended that the University plan to evaluate in the long-term, the feasibility of replacing the cogeneration facility with a carbon neutral power supply such as a fuel cell reactor.

65
Strategy E.5: Demonstrate Alternative Technologies
The University of Connecticut Storrs campus is already involved in an impressive array of alternative and renewable energy technologies. Faculty from across the University conduct research and outreach involving solar photovoltaics, fuel cells, geothermal energy, and biofuels. UConn Biodiesel Consortium has been involved with small-scale biodiesel testing and production since 2006 and has plans for extensive growth in the upcoming years. The Center for Clean Energy Engineering (C2E2), a leader in emerging fuel cell technologies, is located on the Depot campus. Building upon this tradition, members of the University are working together to make the Depot campus the first self-sustaining green campus in the nation. These recommendations will not only meet the campus energy demand in a carbon-neutral manner, but also increase the University’s prestige in sustainable energy both nationally and globally.
E.5.1 Develop a renewable energy master plan and implement demonstration projects.
Campus renewable energy demonstration projects serve several purposes. Successful projects will not only generate energy but may also test new technology. Of equal importance, campus demonstration projects serve as highly visible reminders and examples of the University’s commitment to sustainability.
The Climate Action Task Force therefore recommends that the University work with campus experts to develop a master plan, which would evaluate the suitability of wind, solar (PV and thermal), geothermal, biofuels, fuel cells, hydroelectric and any other appropriate renewable energy technology on the campus. The plan would seek to identify target locations for renewable energy expansion and new use, emphasizing high visibility pilot projects related to the University’s research endeavors.
Given the presence of the C2E2 and a proposal to develop an expanded campus biofuels facility, the Depot Campus may prove a valuable beta testing ground for these projects and technologies. Similarly, the UConn Dairy Bar attracts large numbers of campus members and visitors year-round and would serve as an excellent location to highlight renewable energy technologies, such as a fuel cell or a solar PV display, while ‘offsetting’ the greenhouse gas emissions associated with the livestock used to create the dairy products.
Where appropriate, consideration should be given to private and public partnerships to help defray costs.

66
Emissions Reduction Strategies: Sustainable Development
Table 3.3. Sustainable Development-Related Emissions Reduction Strategies
SD.1. Green the campus building and renovation process
Emissions Reduction
First Cost ROI Timeframe
SD.1.1. Revise the Sustainable Design and Construction Policy.
0-2 Years
SD.1.2. Update the Sustainable Design Guidelines and mandate their use for projects not required to meet LEED standards.
0-2 Years
SD.1.3. Develop a construction materials selection, recycling and reuse guide.
0-2 Years
SD.1.4. Seek to achieve zero-carbon buildings.
>5 years
SD.2. Manage the campus forest to maximize carbon sequestration
Emissions Reduction
First Cost ROI Timeframe
SD.2.1. Establish a permanent position to oversee the management of the University’s forest holdings.
2-5 years
SD.2.2. Inventory the University’s forest holdings and establish a plan to maximize carbon sequestration.
2-5 years
SD.2.3. Develop and implement a management plan to improve and expand the urban forest.
2-5 years
SD.2.4. Establish general forest acquisition goals and a ‘no net loss’ policy.
>5 years
SD.3. Refine campus agricultural practices to minimize fuel and chemical inputs, while maximizing sequestration
Emissions Reduction
First Cost ROI Timeframe
SD.3.1. Develop an agricultural and landscaping waste composting system.
In Progress
SD.3.2. Identify opportunities to use agricultural wastes to generate new products.
2-5 years
SD.3.3. Maximize the use of organic, conservation-till agriculture on campus.
2-5 years
SD.3.4. Manage herds to minimize associated emissions.
2-5 years

67
SD.4. Minimize the carbon footprint of campus landscaping
Emissions Reduction
First Cost ROI Timeframe
SD.4.1. Develop a campus landscaping master plan designed to minimize chemical, energy, and water use.
In Progress
SD.4.2. Improve turf quality on campus.
2-5 years
SD.4.3. Maximize recycling of landscaping organic waste.
0-2 years
SD.5. Embody and implement low impact development (LID) principles
Emissions Reduction
First Cost ROI Timeframe
SD.5.1. Require the use of the LEED for Neighborhood Development Rating System to guide future development decisions.
>5 years
SD.5.2. Establish a cap on impervious surface. >5 years
SD.5.3. Select surface materials that are characterized by a high albedo, high emissivity, and low heat capacity, instead of traditional impervious surface materials.
2-5 years
SD.5.4. Require integration of green roofs into all new building designs; retrofit existing buildings where possible.
2-5 years
SD.6. Maximize water conservation and reuse
Emissions Reduction
First Cost ROI Timeframe
SD.6.1. Correct inefficiencies in steam utility systems.
In Progress
SD.6.2. Upgrade water fixtures in campus buildings to maximize efficiency.
In Progress
SD.6.3. Construct a water reclamation facility.
In Progress
SD.7. Increase campus recycling and waste reduction rates
Emissions Reduction
First Cost ROI Timeframe
S.D.7.1. Increase campus food waste recycling. 2-5 years
S.D.7.2.
Establish a green purchasing policy to minimize packaging and other waste associated with campus purchases.
0-2 years

68
Strategy SD.1: Green the campus building and renovation process.
The University recognizes the environmental, health and productivity benefits, as well as long-term cost savings, inherent in sustainable design and construction practices. In 2004, the University developed Sustainable Design Guidelines (SDGs) to augment Leadership in Energy & Environmental Design (LEED) as a sustainability benchmark. These guidelines have since been updated through the adoption of the Sustainable Design and Construction Policy in March 2007 (Appendix D). This policy requires that the University shall establish LEED Silver as a minimum performance rating for any building construction project entering the pre-design planning phase (for which the estimated total project cost exceeds $6M, excluding the cost of equipment other than building systems). Finally, current state legislation (PA 07-242) requires LEED Silver certification for renovations costing $2M or more beginning January 1, 2010 (as well as construction projects exceeding $6M in costs starting January 1, 2009). The act also specifies that these facilities must exceed the current building code energy efficiency standards by at least 20%. Discussions are underway to update the University’s policy to reflect this legislation.
The University’s commitment to green building is impressive; however, in order to achieve the maximum emissions reductions benefits from the University’s green building and renovation efforts, the Climate Action Task Force recommends the following strategies:
SD.1.1. Revise the Sustainable Design and Construction Policy.
Green building is a rapidly expanding field, and the University of Connecticut policy needs to be routinely reevaluated to ensure that the policy remains current and at the forefront of the green building field. LEED certification provides assurance that a building's design utilizes energy and water efficiently and provides a healthy working environment for the building's occupants. As noted above, state law requires LEED-Silver certification for projects exceeding a certain fixed cost. However, the LEED Silver building of today may become a relic in ten years. Therefore, the University should alter the existing policy to:
Require evaluation of LEED certification potential for all new construction and renovation projects. The evaluation should be based on the anticipated life of the building to adequately capture the potential long-term savings (i.e. life cycle cost analysis or LCCA), rather than analysis of upfront costs alone.
Encourage the University to achieve the highest LEED certification possible for all new construction and renovation projects.
Figure 3.3. The UConn Burton Family Football Complex and Shenkman Training Center. The facilities were built to LEED-Silver green building standards, making them the first LEED-Silver certified NCAA athletic facilities in the nation.

69
Ensure that LEED certification points are pursued first through energy and water conservation related points. Achieving energy conservation points, in particular, will help maximize the greenhouse gas emissions reduction benefits of the LEED certification.
If the costs of obtaining LEED certification is determined to be unreasonably burdensome (through a demonstrated lifecycle analysis as described above), allow substitution of the University’s Sustainable Design Guidelines in lieu of LEED certification.
Promote involvement of all stakeholders during the approval of building schematics by requiring at least one ecocharrette (‘green meeting’) during the schematic phase of building approval. Involve the facilities personnel, who will be responsible for building operation and maintenance, as well as the anticipated building occupants, in design discussions.
SD.1.2. Update the Sustainable Design Guidelines and mandate their use for projects not required to meet LEED standards.
The present Sustainable Design Guidelines (SDGs) were developed in 2004 and need to be updated to reflect improvements in design standards since the guidelines first release. The following are specific recommendations for updating the SDGs:
Include a clear statement of design standards and specific building performance targets. Include resource use intensity targets, carbon or other environmental footprint targets, as well as performance goals relative to code baselines. Language regarding preferred, accepted, or rejected technologies and environmental priorities is needed.
Assign numerical benchmarks to each goal within the guidelines. A scoring matrix can then be used to assess whether new construction or renovation projects meet the University Sustainable Design Guidelines. As is recommended for the Design and Construction Policy, an emphasis should be placed on earning points through energy and water conservation measures.
Encourage the incorporation of ‘natural’ features into building designs, to maximize building efficiency, aesthetics, and safety while minimizing environmental impacts. Incorporating plants into the building design (e.g., shade trees and windbreaks, green roofs) not only can lead to a more attractive and inviting building, but can help increase heating and cooling efficiency while improving indoor air quality, and be an important component of stormwater management. Emphasize site selection and buildings designs which maximize use of passive solar energy and natural ventilation. Public safety concerns should be considered when considering available options.
Figure 3.4. The University's 2004 Campus Sustainable Design Guidelines.

70
SD.1.3. Develop a construction materials selection, recycling and reuse guide.
The proposed construction materials guide should outline targets for the materials selected for new construction and renovation projects. Emphasis should be placed on materials that are locally produced, have a high recycled content, are rapidly renewable, and/or are low in toxicity and emissions. In addition, the guide should outline a strategy to maximize the reuse of materials prior to building demolition and to maximize the proportion of demolition materials that are recycled. Information such as vendor pricing and contacts should be incorporated in order to assist the Purchasing Department with developing contracts that meet the goals outlined in the document.
SD.1.4. Seek to achieve zero-carbon buildings.
Green building and sustainable development are rapidly expanding fields. The associated technologies are not only increasing in availability but also in affordability. As a leader in these fields, the University should continue to innovate by ultimately striving to develop ‘zero-carbon’ buildings. These buildings typically incorporate on-site energy production, purification and reuse of water, and other features to neutralize the building footprint.
Strategy SD.2: Manage the campus forest to maximize carbon sequestration.
The University of Connecticut owns approximately 2,273 acres of forest land in association with the Storrs Campus. Along with a significant urban forest, the University possesses several large forest tracts officially designated as “UConn Forest.” These tracts are currently managed by the Department of Natural Resources and the Environment for educational, research, and recreational purposes along with, to a lesser extent, forest products.
UConn Forest lands provide numerous essential benefits including: water quality protection and improvements, water recharge, habitat features critical to insect pest control and pollination services, and air quality improvements including cooling cleansing, reduced summer ambient temperatures and increased oxygen. Campus forest lands also serve as a potential source of energy and products, as well as biotic diversity repositories.
The aesthetic value of these parcels is also significant. The majority of campus community members and visitors enter the Storrs Campus from access points along Route 195. The view of Horsebarn Hill from this roadway with the Fenton Tract as a backdrop has particular aesthetic value for the campus and local community as a visual reminder of the natural history of the region as well as the University’s legacy as a land grant institution.

71
Figure 3.5. The University’s forest lands offer a multitude of primary and secondary benefits. (Shown: the Fenton Tract.)
Finally, these forest lands serve as a valuable opportunity to sequester carbon. Carbon sequestration potential (as well as the other above-mentioned benefits and services) can be enhanced and optimized through the proper application of a balanced combination of management techniques and practices. Individual forest management plans currently exist for each forest tract, however the majority of these plans are over a decade old and in need of updating.
The University’s forests are an incredibly valuable resource, and like any valuable resource, the forest needs to be actively managed to maximize its worth – economically, academically, and environmentally. More intensive, proactive management of these lands could provide for additional carbon sequestration, as well as offer a variety of research, educational, environmental, and economic opportunities currently not explored. In order to improve the carbon sequestration and other essential benefits realized from our forest holdings, as well as to take advantage of the full suite of other benefits provided by this resource, the following strategies are proposed:
SD.2.1. Establish a permanent position to oversee the management of the University’s forest holdings.
There is a recognized need for a paid professional forest manager to best manage UConn forest parcels. Presently, the management plan for each forest parcel is approximately 12-16 years old and in need of updating. In order to further manage these parcels for additional carbon sequestration, an individual or group knowledgeable about this aspect of forestry needs to be involved. Additional resources, including a small labor force and certain specialized equipment will ultimately be required. The associated required investment is small and would be offset by the numerous benefits provided by the forest resource, including potential cost savings or revenue generating opportunities such as local timber production, expanded maple syruping, and carbon offsets.
The proposed position could be established within the UConn Natural Resources and the Environment Department. Alternatively, if such funding cannot be acquired, the University should seek to contract the services to an outside party. (However, since potential research and educational opportunities may be lost through contracting out the position, it is strongly recommended that the University exhaust all avenues to establish this position ‘in-house’ first.)
72
SD.2.2. Inventory of the University’s forest holdings and establish a plan to maximize carbon sequestration.
In order to best manage the UConn Forest for carbon sequestration potential, regular thorough inventories need to be conducted. Partial forest inventories are presently done on a volunteer basis by the UConn Natural Resources and the Environment Department, though this information is not comprehensive. A comprehensive, well-maintained inventory would be coordinated and managed by the proposed forest manager (see previous paragraph) and student interns, who could be supported by revenues generated from increased forest products production, as called for in resulting management plans. This information can be used to plan how to best steward the resource for maximum carbon sequestration.
SD.2.3. Develop and implement a management plan to improve and expand the campus urban forest.
The University of Connecticut is an arboretum campus, providing numerous unique and high-value tree specimens for the public to experience. Because established trees are comparatively low-maintenance, expanding the urban forest will result not only in increased aesthetic value, but also decreases in maintenance needs (and therefore energy requirements). In addition, if expansion of the urban forest is integrated with construction and renovation efforts, the improved shading benefits providing by the urban forest can result in lower energy requirements for nearby buildings. Improving the quality and of the urban forest can also assist with increasing on-campus carbon sequestration. (Additional benefits include increased wildlife habitat, recreational opportunities such as bird watching, and stormwater management improvements.) The University should therefore develop a comprehensive management plan for the University urban forest, including targets for improvement and expansion over time.
SD.2.4. Establish general forest acquisition goals and a ‘no net loss’ policy.
The value of creatively managing our forest holdings for carbon sequestration should not be understated. The University of Connecticut has a long academic history in this area. As a result, UConn has the in-house expertise and student interest necessary to become national leaders in this area of research and campus operation. When and where feasible, the University should seek to expand the acreage of the UConn Forest to further increase on-campus carbon sequestration (as well as for the multitude of other benefits described throughout this section). A “no net loss of forest” policy should be adopted to ensure the long-term carbon benefits of management efforts are not lost with new development plans.
The Town of Mansfield’s Plan of Conservation and Development (Town of Mansfield 2006) recognizes the need to work University officials to preserve State-owned forest and other natural areas. The Plan also identifies parcels suitable for sustainable development. Therefore, the University should establish forest acquisition and preservation goals in cooperation with the Town to prevent the unintended preservation of low-quality forest lands identified as suitable for sustainable development. Similarly, involving local organizations with an established history of local land preservation and conservation (e.g., Joshua’s Trust) will help ensure success in establishing and meeting local forest acquisition and management goals.

73
Strategy SD.3: Refine campus agricultural practices to minimize fuel and chemical inputs, while maximizing sequestration.
Initially founded as the Storrs Agricultural School in 1881, the University of Connecticut continues to honor its agricultural legacy through an active Farm Services department and through the teaching and research of the College of Agriculture and Natural Resources and the Cooperative Extension System. The primary emissions associated with agricultural operations on campus include methane (CH4) from domesticated animals (i.e., via enteric fermentation and decomposition of manure), and nitrous oxide (N2O) as a result of fertilizer applications to soils and animal production (NESCAUM et al. 2003). In addition, energy and fuel use associated with crop and herd management, building operation, transporting food or feed to and from campus, and the disposal of associated wastes contribute additional emissions.
Based upon current estimates, agricultural emissions account for a small portion of our total emissions profile. However the primary agricultural-related emissions – methane and nitrous oxide – are considered ‘potent’ greenhouse gases. Compared to carbon dioxide, the global warming potential of methane and nitrous oxide are 21 times and 310 times greater, respectively (CTDEP 2006). Therefore, despite comprising only a small portion of our emissions profile, it is important to address these emissions sources to the greatest extent possible. The following strategies will help minimize greenhouse gas emissions associated with campus agricultural practices:
SD.3.1. Develop an agricultural and landscaping waste composting system.
The University has completed design plans for a proposed agricultural and landscaping waste composting facility. The proposed facility will be a 10,000 square foot hoop barn structure constructed on a concrete pad. In addition, the site will contain a 10,000 square foot paved pad for finished compost. The facility is expected to accommodate approximately 36%2 of the University’s agricultural waste (e.g. manure, bedding) and landscaping wastes (e.g. leaves, brush) throughout the year (Table 3.4).
Table 3.4. Proposed Compost Facility Annual Waste Processing and Compost Production3
Materials Tons per
Year Volume Reduction After
Composting Annual Compost
Production
Animal Bedding & Solid Manure (Combined)
1,660 40-60% 862.6
Liquid Manure 600 80% 120.0
Leaves & Brush 30 60% 16.0
TOTAL 2,180 987.6
Compared to spreading raw manure on the University’s agricultural fields or storing on campus, composting agricultural waste offers numerous benefits and improvements, including a reduction in annual animal waste volumes and generation of research and educational opportunities. In addition, on campus compost production (compared to current waste management techniques) will reduce waste-related campus odors and reduce soluble nutrients and associated ground and surface water
2 With improvements in inefficiency, the proposed facility may be able to process up to 50% of all campus agricultural and landscaping wastes. 3Source: UConn Farm Services, personal communication, 7/22/2009.

74
contamination. Application of the finished product to campus fields and gardens will result in soil plant pathogen suppression, increased yields, and cost savings from decreased mulch and fertilizer purchases. Finally, the University estimates that the facility will result in a net reduction of campus greenhouse gas emissions.
Greenhouse Gas Emissions Reduction4
Composting is an aerobic process that converts organic materials such as landscape wastes (e.g. grass trimmings, leaves, branches) and animal wastes (e.g. manure, bedding) into a stable, humus-like material through microbial decomposition. Properly managed composting operations can help to ‘offset’ campus greenhouse gas emissions through three primary mechanisms:
(a) preventing emissions associated with breakdown in landfills or during storage,
(b) increasing carbon sequestration through improved soil condition and increased crop productivity, and
(c) reducing the need for artificial fertilizers (through replacement with finished compost).
Composting agricultural and landscaping waste prevents the CH4 and N2O emissions that would have otherwise occurred during storage or disposal. CH4 generated during the composting process is assumed to be oxidized and converted into CO2; consequently, properly managed composting operations emit only negligible amounts of methane. Similarly, organic materials are part of the short-term carbon cycle; therefore, the carbon dioxide emissions associated with their decomposition through composting are not considered ‘additional’ greenhouse gas emissions5. Based upon these factors, the following greenhouse gas emissions reduction estimate assumes that on-campus composting will be a carbon neutral process managed to achieve near-zero methane emissions. Emissions ‘offsets’ are therefore accrued by avoiding the methane emissions that otherwise would have occurred during storage, spreading, or disposal, and through increased soil carbon sequestration due to compost application as a soil amendment.
Current estimates project that the proposed facility will process approximately 2,180 tons per year of campus agricultural and landscaping wastes (approximately 36% of the total). Assuming that the average manure composition is approximately 80% dairy cow, 7% swine, and 13% chicken, the maximum methane generation capacity is approximately 2.97 MTCO2e/ton (Table 3.5).
Table 3.5. Maximum methane (CH4) generation capacity of feedstocks suitable for stabilization by composting6
Feedstock CH4 (kg/ton) MTCO2e/ton
Dairy Cow Manure 120 2.760
Swine Manure 141 3.243
Chicken Manure 179 4.117
Grass 101 2.323
Food Waste 190 4.370
If it is further assumed that approximately 60% of the total volume collected (1,090 tons) is pure manure, then approximately 140.8 metric tons of methane or 3,237.6 MTCO2e are avoided annually
4 A complete greenhouse gas emission-based lifecycle analysis of the proposed composting facility is beyond the scope of this document. The full GHG impacts of the final facility design, including energy requirements to transport feedstock to the facility, energy used during composting, and energy used to transport the finished product, have yet to be determined. 5Brown et al. 2008 6Adapted from Brown et al. 2008 (Table 5, p. 1402)

75
through composting. Furthermore, for every ton of compost applied to campus soils, approximately 0.07 MTCE are sequestered.7 Consequently, application of the finished compost generated by the proposed facility could avoid an additional 264.3 MTCO2e per year. Therefore, an estimated total 3,491.8 MTCO2e will be avoided annually through campus compost production and application based upon current design plans. 8
SD.3.2. Identify additional opportunities to use agricultural wastes to generate new products.
Even with the construction of the proposed compost facility, the University will have an excess of animal waste. (It is estimated that the proposed facility will be able to accommodate 26-40% of the manure currently generated on campus.) The University should therefore continue to explore alternative uses of agricultural wastes including the creation of a closed loop system to generate ethanol from organic wastes for use in campus laboratories or methane digesters for manure.
SD.3.3. Maximize the use of organic, conservation-till agriculture on campus.
Organic conservation-till practices have been demonstrated to increase carbon sequestration in agricultural fields (La Salle and Hepperly 2008), while minimizing additional environmental impacts, such as soil erosion. Both the carbon sequestration benefits as well as the additional environmental benefits are significant. (Exceptions to this policy would be appropriate for research purposes.) The University should therefore ensure that management of campus agricultural parcels includes practices such as conservation-till to maximize on-campus soil carbon storage.
SD.3.4. Manage herds to minimize associated emissions.
The university’s dairy cattle herds are one of the largest sources of methane emissions on campus. Emerging research has suggested that it may be possible to manage these animals’ diets to reduce the associate greenhouse gas emissions (Boadi et al. 2004). Similarly, there are ‘miniature’ versions of popular breeds that eat 60% as much feed as a ‘regular’ cow, yet can produce up to 76% as much beef (Huffstutter 2009). The Climate Action Task Force recommends that the University consider these research findings and conduct additional research to identify opportunities to minimize the emissions associated with the campus herds. Similarly, the Climate Action Task Force recommends the University evaluate the impact of maintaining only grass-fed herds in order to minimize energy requirements associated with growing and transporting feed. (Exceptions to the above proposed management strategies should be allowed, however, as necessary for research or animal health requirements.)
Strategy SD.4: Minimize the carbon footprint of campus landscaping.
Present landscaping best management practices include avoiding fertilization or irrigation of campus turfs as well as leaving clippings after campus mowing. Further reducing the water, fuel, fertilizer and other chemical and energy inputs associated with landscaping will result in a direct greenhouse emissions reduction. It is therefore recommended that the University:
7 USEPA 2006b 8This is a conservative estimate which does not account for the emissions that would have been released by the decomposition of the animal bedding, leaves, and brush. Including these avoided emissions as well as increases in total compost volume due to efficiency improvements, may increase this estimate substantially.

76
S.D.4.1. Develop a landscaping master plan to minimize chemical, energy, and water use associated with campus landscaping.
Presently the University lacks a coherent plan to guide campus landscaping operations. Therefore, the University is developing a landscape master plan to resolve issues of function and character throughout the campus as well as to improve the visual appeal of the University. The plan is presently expected to address roads, sidewalks, vegetation and lighting, as well as vehicle and pedestrian traffic. It is recommend that the University work with campus experts (i.e., staff and faculty) and university contractors, as appropriate, to expand the scope of this plan to encourage the development of a well-designed, attractive campus, while minimizing chemical applications, maintenance needs (i.e., fuel use), and watering requirements. The plan should address all aspects of campus landscaping operations, and additional goals should include the enhancement and protection of habitat, and the minimization of wildlife-human conflicts. Specifically, the plan should outline a strategy to:
Increase the use of non-invasive, pest resistant, low water requirement, and, preferably, native plant species, including grasses. Use of such species will minimize water inputs and result in a decrease in campus energy and chemical use. Similarly, the University should avoid planting monoculture lawns; mixed species lawns help promote biodiversity, which in turn increases resilience to pests, therefore reducing the need for pesticides.
Minimize outdoor watering, while maximizing the efficiency of campus irrigation practices. Along with appropriate (i.e., drought resistant) plant selection, the University can make operational and infrastructural changes to reduce outdoor water. Current irrigation systems can be automated based on moisture conditions at the time of watering or time of day. In addition, the University should switch to ultra-low-volume distribution devices for campus irrigation.
Minimize chemical and fertilizer use associated with campus landscaping. The University does not currently fertilize campus turf; however fertilizers are used on campus for certain applications. In these instances, chemical fertilizers should be replaced with local organic sources such as campus-produced compost. A comprehensive integrated pest management (IPM) program should also be outlined, including herbicide and pesticide use minimization and the selection of less toxic products. Species such as clover which provide nitrogen fixation, can also be integrated into campus lawns, providing a natural ‘fertilizer’ source.
Minimize campus mowing through restructuring of campus mowing scheduling, identification of ‘no-mow’ areas, and promotion of landscaping with native, low-maintenance wildflowers instead of turf. Restructuring mowing schedules will result in direct fuel and fertilizer use reductions, and therefore monetary savings and emissions reductions for the university. Mowing frequency at the Depot Campus in particular should be examined. In addition, adjusting campus mowing practices will have numerous secondary benefits, including an increase in staff hours available to address other university maintenance needs, improved wildlife habitat, increased aesthetic value, and decreases in stormwater runoff.
Establish a landscaping ‘low-waste’ goal. Identify opportunities to recycle and reuse organic materials generated through landscaping activities, thereby reducing disposal-related transportation requirements.
S.D. 4.2. Improve turf quality on campus for enhanced carbon sequestration and hydrologic benefits.
Turf presently occupies a large portion of the Storrs campus. Despite being vegetated, these surfaces are often compacted due to pedestrian and vehicular traffic, resulting in reduced rooting depth and
77
therefore limiting the soil’s carbon sequestration capacity. In addition, soil compaction results in decreased infiltration capacity, greater runoff, lowered available water for plant growth, and, consequently, increased watering requirements. Compacted turf areas therefore require greater maintenance and do not offer the full range of environmental services that undisturbed vegetation can provide. The University should therefore explore turf enhancements that will increase rooting depth and associated carbon storage, as well as increase infiltration rates, reduce runoff and associated water pollutants, decrease maintenance requirements, and provide greater benefits to campus wildlife.
Increasing earthworm populations can also help improve the carbon sequestration potential of campus soils. Earthworms have been shown to help maintain a healthy soil, including greatly helping to increase infiltration capacity once a vegetated surface is established. In general, a healthy earthworm population will occur if the proper soil conditions are present (e.g. low compaction, healthy vegetation). However, certain earthworm species, such as African ‘red wigglers,’ can actually be detrimental to soil quality and carbon sequestration potential. Therefore, the University should work with campus experts to identify management measures that will deter the establishment of these aggressive earthworm species.
S.D.4.3. Maximize recycling of landscaping organic waste.
It has been observed that present landscaping practices have a tendency to result in large quantities of scrap wood. This wood is treated as waste and transported off-site. Identifying alternative uses for organic ‘waste’ generated through landscaping practices will therefore result in decreased transportation costs (and associated emissions). Alternative uses for scrap wood, for example, would include habitat enhancement, chipping for animal bedding, erosion protection for campus trail systems, sale to off-campus vendors for conversion into wood pellets/ bricks or for use in a local biogeneration power plant, or mulching to reduce water losses associated with irrigation.9 Similarly, herbaceous organic wastes could be composted and used to enhance campus gardens.
Strategy S.D.5: Embody and implement low impact development principles.
Eagleville Brook, located in Mansfield, and flowing through the UConn campus, is the first stream in the nation to have an impervious cover based Total Maximum Daily Load (TMDL) allocation for pollutants. In the case of Eagleville Brook, stormwater has been identified as the primary stressor to the stream system. Since a large portion of the Eagleville Brook watershed is occupied by the UConn main campus, the University has been charged with identifying ways to reduce the effective imperviousness in the watershed in order to reduce stormwater runoff. (“Effective” impervious surface is considered to be those impervious surfaces which directly cause stormwater to be delivered to an aquatic ecosystem.)
Low-impact design (LID) strategies seek to minimize environmental disturbance associated with development. In the case of stormwater management, LID techniques seek to reduce the ‘effectiveness’ of impervious surfaces, by promoting infiltration of stormwater rather than allowing it to runoff along the surface and into a water body. Many of these LID strategies also have secondary benefits that have the potential to affect the University’s emissions profile. For example, reducing the amount of impervious cover or selecting to install surfaces with a higher albedo (greater reflective properties), have the added benefit of reducing the heat island effect created by large swaths of impervious
9 Caution should be exerted when using wood chips for mulch, as tannins released by the wood can inhibit plant growth and reduce decomposition.

78
surfaces. A reduced heat island effect will result in decreased cooling requirements for buildings in the campus core.
Since reducing effective impervious cover will not only help the University reach its mandatory reduction goal, but will also help the University reduce greenhouse gas emissions through reduction of the heat island effect, it is recommended that the University continue to integrate LID strategies into campus projects. Strategies recommended here are limited to those that that will also contribute to a reduction in the overall heat island effect.
S.D.5.1. Require the use of the LEED for Neighborhood Development Rating System to guide future development decisions.
The U.S. Green Building Council’s Leadership in Energy and Environmental Design (LEED) for Neighborhood Development rating system (USGBC 2007) embodies the responsible growth polices recommended by the CATF, and can serve as a valuable tool to guide future land use and development decisions of the University. Communities that are developed using the LEED for Neighborhood Development principles are designed to include infill development and Brownfield reuse, minimize habitat fragmentation, preserve recreation space, and increased transportation access, among other benefits (USGBC 2008).
A similar rating system, the Sustainable Sites Initiative (2008), can also serve as a useful tool for guiding the site selection process to ensure sustainable development. The Sustainable Sites Initiative includes an ‘Ecosystem Services Matrix,’ which indicates which credits provide ecosystem services, including ‘global climate regulation’ and ‘local climate regulation,’ among others.
The Storrs Center “Main Street” project is a current effort involving a partnership between the University of Connecticut and the Town of Mansfield that embodies these principles. Through this project, 17 acres of a 47.7 acre site adjacent to the southeastern portion of campus will be redesigned into a pedestrian-oriented, mixed-use downtown center. (The remaining 30.7 acres will be preserved for open space and recreational purposes.) During the initial planning phases of the project, design guidelines were developed to ensure that project embodied the principles of smart growth and sustainable development (Mansfield Downtown Partnership 2008) and the project was entered into the LEED for Neighborhood Development Rating System (USGBC 2007). As a direct result of the principles outlined in the LEED for Neighborhood Development Rating System, the Storrs Center project has the potential to become the ‘greenest’ college town center in the United States. Perhaps most importantly, the project has involved an unparalleled level of cooperation between the University and the surrounding community. Although the Storrs Center project is not included in the current University inventory, the project serves as a valuable model for future development of the Storrs campus.
It is recommended that the University require the use of the LEED for Neighborhood Development Rating System, the Sustainable Sites Initiative guidelines, or a combination thereof, as a tool to guide future growth decisions on the main campus. In particular, future development decisions pertaining to the Depot Campus could be structured using the LEED for Neighborhood Development rating system.
S.D.5.2. Establish a cap on impervious surface.
In light of the recent Eagleville Brook TMDL, establishing an effective impervious surface cap for the Storrs campus would help to ensure compliance in the Eagleville Brook matter, as well as to cause a reduction in campus emissions. Ensuring no net increase in effective impervious surfaces on campus will:
Prevent further heat island effects, resulting in decreased campus cooling and heating needs;

79
Encourage innovative transportation systems that reduce reliance on personal vehicles and single-occupancy-vehicle trips;
Encourage the reuse of ‘brown spaces’ and redevelopment of existing buildings over the development of ‘green spaces’ such as campus agricultural or forest lands that possess carbon sequestration potential; and
Encourage the use of permeable materials and designs that ‘disconnect’ impervious features, thereby reducing stormwater runoff and the associated impacts.
S.D.5.3. Select surface materials that are characterized by a high albedo, high emissivity, and low heat capacity, instead of traditional impervious surface materials.
If surfaces are selected with a higher albedo (greater reflectance and usually lighter color) or treated with a reflective coating, surface temperatures will remain cooler (e.g. ‘cool pavements’), resulting in a decrease in the urban heat island effect as well as other stormwater management benefits (Cambridge Systematics, Inc. 2006). Similarly, surfaces with a lower heat capacity are also preferable to avoid storage of solar energy throughout the day – natural materials such as dry soil and sand, for example have a lower heat capacity than materials such as steel and concrete (USEPA 2009). Reflective vegetation can also be utilized to achieve these results.
In addition, permeable surface materials such as permeable pavers, unit pavers, rubberized tiles, porous asphalt or concrete, and others promote the infiltration of precipitation, in order to better model the natural hydrology of the location. This, in turn, reduces the amount of stormwater runoff resulting from the associated development and results in surface cooling through increased evaporation.
S.D.5.4. Require integration of green roofs into all new building designs; retrofit existing buildings where possible.
As with paving materials, roofing materials can also reach extreme temperatures (up to 160 degrees Fahrenheit); this heat is then either radiated to the surrounding air or transferred via stormwater runoff. Along with selecting light colored roofing materials, vegetative treatments such as installation of living or ‘green’ roofs, can significantly reduce the urban heat island effect (USEPA 2009). In addition, impervious surfaces, such as rooftops, that are treated with an ecological installation (i.e. green roof) contribute to stormwater mitigation, resulting in a decreased overall effective impervious surface area. Depending on type and location, green roofs can also provide additional benefits, including increased wildlife habitat, increased aesthetic value, increased recreational area (i.e. roof-top picnic areas), and potential for outreach, education and research opportunities. Given the combined stormwater and urban heat island reduction benefits that green roofs provide, it is recommended that the University:
Require the integration of green roofs into all new building designs.
Retrofit existing buildings with green roofs, where possible.
Strategy S.D.6: Maximize water conservation and reuse.
The University is responsible for the production, distribution, and treatment of water throughout the campus. In addition to typical domestic water uses (drinking, showers, cooking, etc.) the water system is essential to the production of utilities such as electricity, chilled water, steam production and automatic fire protection systems.

80
In 2007, the University hired a private contractor to survey and analyze the university’s water consumption patterns. The resulting UConn Water Audit Report (WMI 2007) concluded that Storrs campus water consumption is approximately 498M gallons annually. The majority of this demand is associated with on-campus residential uses, on-campus academic uses, the central utility plant, and off-campus demand.
The process of pumping, treating, heating and distributing water across campus to meet daily demand requires a significant amount of energy. The USEPA estimates that approximately 0.006kWh of energy is used per gallons per day of water used.10 Once used, additional energy is required to return the water to the campus wastewater treatment plant for further treatment. Therefore, any measure to conserve water on campus and reduce demand will not only directly benefit local resources, but will also result in a decrease in campus energy demands. Therefore it is recommended that the University:
S.D.6.1. Correct inefficiencies in campus steam utility systems.
On average, the cogeneration produces 80,000 lbs/hr of steam, however only approximately 60% of the associated condensate is being returned. Losses are associated with broken condensate lines, steam trap failure, and losses associated with lines that lead to sanitary waste. To reduce losses it is recommended that the University:
Make the necessary repairs to the system, including the completion of the steam trap maintenance program in the Central Utility Plant and in the tunnels.
Develop a maintenance program for steam pits not covered under the current steam trap maintenance project, along with zone and shop/DRL buildings.
Perform a campus steam trap audit to ensure traps are right-sized and performing properly.
Conduct annual surveys (e.g., infrared) to locate leaks and failures in the system.
To further reduce waste, the University should add a steam powered chiller(s) to the South Campus chiller plant to utilize surplus steam generated producing electricity during summer months. Installing a South Campus steam chiller to provide that facility and chilled water loop with the same flexible capabilities as the central campus would eliminate the wasteful steam dumping that occurs when electrical demand exceeds steam demand on campus. Several buildings in close proximity to the chilled water and steam lines should be connected to these supplies as soon as possible. This will have the added benefit of decommissioning electric air conditioners and fossil fuel boilers which will lower the overall campus greenhouse gas emissions.
S.D.6.2. Upgrade water fixtures in campus buildings to maximize efficiency.
Existing, older and inefficient fixtures across campus should be phased-out and replaced with the highest efficiency models available. Low-flow showerheads and high-efficiency front loading washing machines are now common throughout campus. Upgrade and replacement efforts should therefore focus on toilets, urinals, and faucets. In addition, in order to ensure fixtures are performing to design
10 Source: USEPA Region 1 Office, personal communication, 11/06/07.
Figure 3.6. The University's "Stop the Drop" campaign educates about the importance of water conservation.

81
standards, university staff should perform regular checks to ensure low-flow devices are not only installed, but functioning properly. As a general rule, all replacement fixtures as well as all fixtures included in new construction should be low-flow, high-efficiency water fixtures.
S.D.6.3. Construct a water reclamation facility to recycle water from campus sewage treatment operations.
The University operates and maintains its own sewage treatment plant, or Water Pollution Control Facility (WPCF). Average daily demand is approximately 1.4 million gallons per day. Presently, the University releases the treated sewage effluent back into the local watershed without consideration for reuse. There are, however, opportunities to reuse this treated effluent elsewhere on campus, which would reduce overall pressure on our local water supply sources and potentially reduce pumping related energy use.
In 2008, the University began investigation, analysis and design of a potential campus water reclamation system. The system would be developed to recycle water from the University’s sewage treatment plant for non-potable water intensive uses. This would allow the university to reduce current demand on potable water. (Conceptually, the project would also include improvements to the treatment plant and distribution system.) Potential uses for this non-potable water include process water for the cogeneration facility, cooling plant and irrigation.
The Climate Action Task Force recommends that the University continue to analyze the feasibility and benefits of constructing a campus water reclamation facility. This analysis should include not only water conservation benefits, but also an analysis for increased energy demand (compared to current requirements to pump and distribute a similar volume of water), to determine the potential for undesirable greenhouse gas emissions increases
Strategy S.D.7: Increase campus recycling and waste reduction rates.
The University has an ongoing goal to increase recycling rates and to reduce total campus waste. In 2004, the University’s Environmental Policy Advisory Council (EPAC) formed a Recycling Workgroup to develop action plans to achieve this goal and to evaluate progress. In addition, in 2005, the University hired a private consulting firm to review the campus recycling program and recommend improvements. Implementation of the recommendations in 2007 resulted in a 28% increase in recycling rates over the previous year.11 However, the U.S. Environmental Protection Agency estimates that each pound of trash thrown away will emit around 0.94 pounds of carbon dioxide equivalent. In 2007, the University disposed 4,928.4 tons of waste or the equivalent of over 4,600 MTeCO2. Therefore, additional increases in campus recycling and waste reduction can still result in substantial decreases in the overall campus emissions.12
Several new recycling and reuse efforts have been implemented since 2007. These efforts are assumed to have reduced greenhouse gas emissions associated with campus solid waste disposal during 2008 and 2009.
11 Recycling weight increased from 881 tons in 2006, to an 1,129 tons of material in 2007 12 The CACP calculator uses a different emission factor for solid waste disposal. Estimates of emissions reductions will vary depending on the factor selected.

82
All campus buildings contain containers for recycling glass, metals, and plastic. (Blue desk side recycling bins are also located throughout academic and office buildings.) In addition, ten large outdoor can and bottle bins were placed in high-traffic locations on campus.
The Department of Residential Life now places recycling bags in each dorm room on campus to encourage students to recycle within their residence hall. In addition, at the end of each semester, the campus holds a “Give and Go” program to collect unwanted items such as clothing, nonperishable food, furniture and more.
An e-waste recycling program has become a very important and successful part of the campus recycling program. Drop boxes for recycling old cell phones, ink cartridges, and rechargeable batteries are placed around campus in highly trafficked locations.
UConn Dining Services switched to trayless dining in all but one dining unit. (Remaining trays on campus are reduced in size to minimize food waste.) In addition, disposable cups have been removed from the dining halls; instead students are encouraged to use a refillable mug to carry beverages out of the dining halls. In addition, recognizing an opportunity to begin food composting on campus, a new cooperative program between the student-led UConn EcoGarden and Dining Services was established. Still in its infancy, the program currently involves only two campus dining areas, but is expected to divert the majority of food waste from these areas towards campus composting and agricultural operations instead of the University waste stream.
Efforts to collect edible food ‘waste’ are also expanding across campus. In 2009, a pilot program was implemented by UConn Community Outreach and Residential Life staff to collect unwanted, nonperishable food items from students before they left for the semester. From one residential area alone, the University was able to collect and redirect 846 pounds of food from the campus trash stream to a local food bank.13
UConn Athletics increased recycling outreach during campus athletic events including the placement of recycling containers throughout major athletic venues (e.g., Gampel Pavilion, Rentschler Field). Student volunteers regularly “man the can” at campus basketball games to remind visitors to recycle.
The UConn Co-Op now offers shoppers the option of selecting a plastic bag or a wooden nickel which can then be donated to a charity, several of which are local environmental efforts.
Participation in Recyclemania. During their first competition in 2008, the UConn Huskies were in the top 50% for each of the categories in which we competed (per capita recycling, gross tonnage, paper, cardboard, and cans and bottles). In the gross tonnage category UConn placed 32nd out of 200 schools.
In addition to the continuation of the above programs, it is recommended that the University pursue the following additional strategies.
S.D.7.1. Further increase campus food waste recycling.
Efforts are made at UConn to recover edible food for donation to local shelters and food kitchens or to ‘recycle’ the food waste through small-scale composting. Despite these efforts, a significant volume of food waste continues to be sent for disposal (i.e. incineration or landfilling) via a local trash hauler each year. Unfortunately, once in a landfill, food waste can contribute significantly to the production of methane gas through anaerobic decomposition. An estimated 4.37-6.76 metric tons of CO2e are
13UConn Community Outreach, personal communication, 7/21/09.

83
generated per ton of food waste allowed to decompose anaerobically (e.g. landfilled).14 Given this, the ultimate goal of the University is to eliminate the practice (and associated costs) of disposing food waste as municipal trash. Food waste should be treated as a commodity, allowing for consideration of revenue generating opportunities (e.g. compost or biodiesel production), while minimizing campus environmental footprint. In addition to existing food waste reduction efforts, food waste-related emissions can be reduced through adoption of one or more of the following strategies:
Short-Term: Identify community partners to convert University food waste into a usable product. Current economic and space limitations will restrict the University’s ability to conduct on-campus food waste composting in the near future. Therefore, the University should identify community partners interested in accepting campus food waste for conversion to compost, biodiesel, or other use, thereby avoiding disposal through the campus solid waste stream.
Long-Term: Developing a campus-wide composting system for processing the University’s food waste. Because of the various additional benefits to on-site composting (e.g. publicity, research, reduced transportation costs), the University’s long-term goal should be to build upon the existing framework and success of the Dining Services pilot project and animal waste compost facility to develop a campus wide food waste composting system. Such a facility will produce a useful and economically valuable product (i.e. finished compost) that can either be used to improve the fertility of campus agricultural lands and gardens or sold or donated to the community. Because application of compost to soil can further increase carbon sequestration through improvements to soil structure and crop productivity, there may be opportunity to develop a ‘white tag’ program, earning the carbon sequestration credits of compost produced by the campus and donated free of charge to the local community.
S.D.7.2. Establish a green purchasing policy to minimize packaging and other waste associated with campus purchases.
Establish a campus green purchasing policy to ensure waste reduction at both the source (i.e., waste minimization) and upon disposal (i.e., recycling and reuse). Goals of the policy include:
Minimizing or eliminating packaging. Maximizing packaging recycling, reuse, or composting if packaging is required.
Encourage selection of products that minimize waste generation, have demonstrated durability, and incorporate local, recycled, or rapidly renewable resources. In addition, products that are energy efficient and locally produced should be given preference.
14The U.S. Composting Council (2008) estimates that every metric dry ton of food that goes to a landfill can generate up to 0.25 metric tons of methane in the first 120 days. Thus, composting one ton of food waste has the potential to reduce emissions by the equivalent of up to 5.75 metric tons of CO2. Brown et al. (2008) cited a similar figure, estimating that 4.37 MTCO2e are generated per ton of food waste.

84
Emissions Reduction Strategies: Transportation
Table 3.6. Transportation-Related Greenhouse Gas Emissions Reduction Strategies T.1. Better integrate transportation into
campus planning and design decisions Emissions Reduction
First Cost ROI Timeframe
T.1.1. Develop a modal transportation advisory committee.
N/A 0-2 years
T.1.2. Develop a campus transportation master plan for travel to and from Storrs.
N/A 2-5 years
T.1.3. Establish a campus policy that transit be considered when planning new campus buildings.
N/A 0-2 years
T.2. Decrease the campus vehicle fleet annual fuel use
Emissions Reduction
First Cost ROI Timeframe
T.2.1. Establish fleet efficiency purchasing requirements.
0-2 years
T.2.2. Phase out older, inefficient vehicles and replace with higher efficiency vehicles.
0-2 years
T.2.3. Develop and implement a mandatory vehicle efficiency improvement program.
0-2 years
T.2.4. Enforce the state anti-idling policy.
In Progress
T.2.5. Increase the efficiency of campus delivery systems.
0-2 years
T.2.6. Discourage unnecessary on-campus driving.
0-2 years
T.3. Increase the proportion of renewable fuels used annually
Emissions Reduction
First Cost ROI Timeframe
T.3.1. Increase the production and use of biodiesel in university vehicles.
2-5 years
T.3.2. Increase the use of vehicles that run on carbon-neutral or low-carbon fuel sources.
2-5 years
T.4. Decrease annual commuter single occupancy vehicle trip frequency and per capita commuter vehicle miles travelled
Emissions Reduction
First Cost ROI Timeframe
T.4.1. Work with campus unions to encourage flexibility in employee workday definition.
0-2 years

85
T.4. (Continued) Emissions Reduction
First Cost ROI Timeframe
T.4.2. Increase access and provide incentives for telecommuting and online courses.
2-5 years
T.4.3. Develop a rideshare incentive program.
0-2 years
T.4.4. Establish an on-campus carshare program.
In Progress15
T.4.5. Provide a weekday shuttle service to nearby off-campus park-and-ride lots.
0-2 years
T.4.6. Increase local housing options and availability.
2-5 years
T.4.7. Improve bicycle and pedestrian safety and access from off-campus housing.
In Progress
T.4.8. Increase bus and shuttle availability to and from off-campus destinations.
0-2 years
T.4.9 Advocate for the development of a regional light rail commuting option.
N/A N/A >5 years
T.5. Redesign campus parking to minimize commuter emissions
Emissions Reduction
First Cost ROI Timeframe
T.5.1. Establish a campus parking cap. 2-5 years
T.5.2. Develop an incentive program to discourage parking pass purchases.
0-2 years
T.5.3. Implement a campus-wide parking fee increase; use the revenue to fund campus mass transit improvements.
0-2 years
T.5.4. Price parking according to vehicle fuel efficiency and EPA emissions rating.
2-5 years
T.5.5. Offer a reduced-cost parking pass, priority parking and related emergency support services for rideshare participants.
0-2 years
T.5.6. Develop a reduced-cost parking pass for motorcycles and scooters.
0-2 years
T.6. Increase walking and biking Emissions Reduction
First Cost ROI Timeframe
T.6.1. Hire a pedestrian and bicycle coordinator to ensure implementation of Master Plan recommendations.
0-2 years
T.6.2. Improve campus bicycle amenities and paths. 2-5 years
T.6.3. Develop a bicycle commuter-incentive program.
2-5 years
T.6.4. Create an affordable on-campus bicycle shop. 2-5 years
15 The University is currently exploring the potential for and feasibility of implementing an on-campus car share program; however, the University has not committed to implementing a program at this time.

86
T.6. (Continued) Emissions Reduction
First Cost ROI Timeframe
T.6.5. Establish a campus-wide bicycle loaner program
2-5 years
T.7. Reduce the carbon footprint of off-campus travel
Emissions Reduction
First Cost ROI Timeframe
T.7.1. Require vehicle rental programs to provide efficient and alternative fuel vehicle options.
N/A In Progress
T.7.2. Negotiate discounted bus and train ticket rates for UConn faculty, staff and students.
N/A 0-2 years
T.7.3. Discourage air travel to locations within reasonable driving or train distance. 0-2 years

87
Strategy T.1: Better integrate transportation into campus planning and design decisions
T.1.1. Develop a modal transportation advisory committee.
In order to address changing needs, maximize resource use, and ensure consistency in vision, a regular dialogue must be maintained between the University and the surrounding community. The University should therefore establish a modal transportation advisory committee specifically focused on improving connection and access issues, reducing overall vehicular traffic to and from campus, increasing the availability of public transportation options, supporting pedestrian and cyclists, and encouraging rideshare. Representatives from UConn, Eastern Connecticut State University, Windham Region Council of Governors, and surrounding towns (e.g., Mansfield, Tolland, Windham) as well as individuals with specific expertise in transportation demand management and planning should be included on the advisory committee.
T.1.2. Develop a campus transportation master plan for travel to and from Storrs.
With plans for continued growth in both student body size and infrastructure, it is imperative that the University develop a transportation master plan. This plan should be written to align with the current campus master plan, ensuring that proposed future growth reduces rather than increases transportation needs. For example, the plan should ensure that new buildings are constructed near existing facilities to minimize increased transportation service and infrastructure needs. Furthermore the plan should discourage SOV trips to, from, and around campus, focus on improving mass transit options in the region, encouraging rideshare, and improving access and safety for pedestrians and cyclists.
T.1.3. Establish a campus policy that transit be considered when planning new campus buildings.
It is recommended that the University establish a policy requiring the consideration of transit during campus building planning and design activities. The policy can be developed either as part of the above proposed master plan or as a separate stand-alone policy. The policy should require an analysis of the transportation impact of the proposed building project as well as the participation of transportation representatives during campus planning meetings and site reviews. An evaluation of potential increases in parking demand and other transportation infrastructure under proposed alternatives should also be required with all new construction projects. Finally, the policy should require a statement regarding how the proposed project will contribute to improvements to campus transportation services (i.e., campus bus system) as well as to pedestrian and bicycle access and safety.
Strategy T.2: Decrease the university vehicle fleet’s annual fuel use.
The University does not currently have established standards or goals regarding fleet efficiency or composition. For several years, annual preferred vehicle purchasing lists have been used by University Purchasing agents to encourage university buyers to purchase the most fuel efficient vehicles possible. However, until 2008, these lists remained recommendations not University mandate. In 2007, the State of Connecticut, passed legislation (PA 07-242, Section 122) which mandates that beginning January 1,

88
2008, “any car or light duty truck purchased by the state shall have an efficiency rating that is in the top third of all vehicles in such purchased vehicle's class…" As a state agency, this requirement applies to all University vehicle purchases after January 1, 2008. In addition, state law now requires that fifty per cent of all new car and light duty trucks purchased by the state after January 1, 2008 must be alternative fueled, hybrid electric or plug-in electric vehicles. This is a state-wide requirement, however, rather than a direct mandate for individual state agencies such as the University. Consequently, less than 1% of the University’s 600-vehicle fleet remains comprised of hybrid-electric or electric vehicles.
T.2.1. Establish fleet efficiency purchasing requirements.
According to state legislation all new vehicles purchased must now be among the most efficient (i.e., top third) available vehicles in that given vehicle class. The University should establish additional fleet fuel efficiency standards to further mirror state law and to maximize campus fleet efficiency. Recommended policy components include:
Establish an average fleet fuel efficiency goal for the Storrs campus fleet.
Establish vehicle composition goals for the fleet (e.g. 50% hybrid electric or plug-in electric vehicles).
Establish guidelines to ensure that vehicles are right-sized for the intended use.
T.2.2. Phase out older, inefficient vehicles; replace with higher efficiency vehicles appropriate for the intended use.
Older, inefficient vehicles may be inadvertently costing the University money through unnecessary fuel use. The University should develop a low-cost trade-in system to encourage the replacement of these vehicles. Additional incentives, such as subsidies for purchase of new vehicles in the top 10% of their class for fuel efficiency, may also help encourage older vehicle replacement.
T.3.3. Develop and implement a mandatory vehicle efficiency improvement program.
Proper vehicle maintenance (e.g., tire pressure checks and tune-ups) helps ensures that a vehicle will run more smoothly and require less fuel. Therefore, the University should develop a vehicle efficiency improvement program. All university-owned vehicles should be required to regularly participate in the program.
T.2.4. Enforce the state anti-idling policy.
Connecticut state law (R.C.S.A. 22a-174-18) prohibits the idling of any vehicle for longer than 3 minutes.16 The law applies to all vehicles in Connecticut and although the
law is intended to encourage voluntary compliance, violations are subject to enforcement by Department of Environmental Protection staff. (In addition, Public Act No. 02-56, An Act Concerning the Idling of School Buses, gives ticketing authority to
16 Exceptions are made during extreme weather conditions, for health reasons, and for certain service vehicles.
Figure 3.7. The State of Connecticut has aggressive anti-idling laws in place to prevent unnecessary vehicle fuel use and to protect air quality.

89
police who witness school buses idling for longer than 3 minutes.) The University should therefore work with state staff to encourage awareness of the law on campus and to enforce violations as they are observed.
T.2.5. Increase the efficiency of on-campus delivery systems.
University-owned as well as privately owned vehicles travel throughout campus making daily deliveries. The University is presently completing an access management study examining the details of campus traffic and deliveries to maximize pedestrian safety and operational efficiency. It is recommended that during this process, the University evaluate the feasibility of implementing a hub-and-spoke delivery system to consolidate trips throughout campus, thereby minimizing fuel use associated with these deliveries. In addition, the number of vehicles entering the campus core, particularly large delivery vehicles, would be reduced, thereby increasing pedestrian safety and campus aesthetics. Under the proposed hub-and-spoke delivery system, off-campus delivery vehicles would be allowed to enter the campus only through pre-established access points and routes. Deliveries would then be dropped off at a ‘hub’ along the campus perimeter, consolidated, and then re-routed to the campus core via cleaner or more fuel-efficient vehicles.
T.2.6. Discourage unnecessary on-campus driving.
Most locations on campus are within walking and biking distance, or are accessible by the university’s campus bus system. Unnecessary on-campus driving wastes fuel, releases additional greenhouse gas emissions, and contributes to campus congestion. The University should therefore discourage on-campus driving through:
replacement of core roadways with sidewalks, bicycle lanes and shuttle bus-only lanes, and
speed limit reductions, increased frequency of speed bumps and stop signs, or other measures on remaining roadways.
Measures such as these slow or restrict average personal vehicle travel time across campus making walking, bicycling, or utilizing public transportation more appealing options. By encouraging transportation mode shifts away from personal vehicles, the University will decrease greenhouse gas emissions, save fuel and associated costs, increase pedestrian safety, and create a more aesthetically appealing campus.
Strategy T.3: Increase the proportion of renewable fuels used annually
T.3.1. Increase the production and use of biodiesel in university vehicles.
Biodiesel can be used as a direct replacement for #2 diesel and heating oil. Switching to biodiesel results in reductions in both sulfur and aerosols. Furthermore, pure biodiesel is considered carbon-neutral because the organic material used to produce the fuel is part of the short-term carbon cycle. Therefore, replacing a portion, if not all, of the 200,000 gallons of diesel used annually on campus would result in substantial greenhouse gas emissions reductions.
Presently, the university replaces approximately 1% of total vehicle diesel requirements with B100 biodiesel. The University has the capacity to expand biodiesel production thereby increasing this percentage. The campus transportation system (e.g., buses) and agricultural vehicles and equipment (e.g., tractors, etc.), in particular, would serve as logical points of expanded biodiesel use on campus;

90
campus buses travel regularly throughout campus generating excellent publicity and outreach opportunities, while use of biodiesel in the agricultural operations is a logical extension of the university’s commitment to sustainable agriculture.
It has therefore been proposed that a biodiesel production facility be developed on the UConn Depot Campus. The proposed facility would include a partnership between the University, the towns of Mansfield and Tolland, and a private biodiesel blending and distribution company. Under the proposed arrangement, the blending and distribution company would purchase the entire output of the plant, blend it with petroleum products into typical commercial product formulae for heating oil and transportation fuel, and resell the final product to the university and other interested customers (i.e., Mansfield and Tolland). Proposed output capacity is estimated to be 50,000-100,000 gallons per year of biodiesel.
The proposed agreement is beneficial to the University for a variety of reasons. Notably under the proposed tolling arrangement, the University avoids all responsibility associated with transporting the finished product. Furthermore, by outlining a contract which allows the University to sell biodiesel to the private blending and distribution company at the rack price and purchase the product fuels at the state contract price it is assumed that the University can reduce the cost of diesel fuel purchases by roughly 10%. Finally, the proposed project has direct academic and research synergies. The university would continue to remain at the forefront of test method development for the industry. In addition, the facility provide ample opportunity for collaboration with other departments, colleges, and research groups (e.g., fuel cell, biobutanol fermentation).
T.3.2. Increase the use of vehicles that run on carbon-neutral or low-carbon fuel sources.
17Vehicles fueled by carbon neutral or low-carbon fuel sources (e.g., solar, fuel cell, hydrogen) are increasingly available, but in most cases, are still cost prohibitive. Nevertheless, with recent and ongoing increases in investment in green technologies and infrastructure, vehicles powered by carbon neutral sources are expected to become more viable options in the future. Therefore, a long-term goal of the campus should be to expand the use of vehicles powered by fuel cell, hydrogen, solar, or other carbon-neutral sources.
Strategy T.4: Decrease annual commuter
17 Photo courtesy of The Connecticut Hydrogen-Fuel Cell Coalition)
Figure 3.9. New England's first zero-emission fuel cell-powered hybrid bus made its debut in Connecticut on April 10, 2007.
Figure 3.8. A biodiesel powered tractor displayed during the University’s 2009 Earth Day Spring Fling.

91
vehicle miles travelled
T.4.1. Work with campus unions to encourage flexibility in employee work day definition.
A high proportion of the approximately 4,000 faculty and staff employed at the UConn Storrs campus share the same residence, many also have one or more children currently attending the University. The University should therefore encourage campus unions to allow employees shift flexibility (i.e., start and end times, duration) to accommodate carpooling from individual households. Additional incentives such as a single, reduced rate ‘family’ parking pass could also be offered to families willing to revoke their privileges to one or more campus parking passes in exchange for the discounted ‘family’ pass.
T.4.2. Increase access and provide incentives for online courses and telecommuting.
The University presently offers a variety of online courses, but can continue to expand its offerings. In particular, the University should increase the proportion of off-campus students enrolled in one or more online courses. Doing so will help reduce annual student commuter miles and the associated greenhouse gas emissions. In addition, online courses reduce the University’s need for physical teaching space and the energy required to maintain that space.
In order to encourage enrollment in online courses, the University should expand course offerings by increasing the number and diversity of courses offered, as well as the time (e.g., night versus day) and day of the week that courses are offered. To encourage development of new courses, the University should provide incentives and support to faculty willing to offer online sections of an existing course or create a new course offering.
Similarly, the University should increase telecommuting options for employees. Telecommuting allows an individual to perform their work duties from home via telephone and computer access. Allowing individuals to telecommute one or more days a week will reduce annual faculty and staff commuter vehicle miles. Secondary benefits may also include decreased campus traffic congestion and parking demand, as well as improved employee morale and productivity.
T.4.3. Develop a University rideshare incentive program.
The University benefits from increased participation by campus members in rideshare programs. Fewer vehicles travelling to campus results in a reduced parking demand and the need for associated transportation infrastructure. In addition, campus congestion is reduced thereby increasing pedestrian safety and campus beauty. Finally, average greenhouse gas emissions per commuter per mile is decreased, reducing the University’s overall greenhouse gas profile.
Ridesharing, however, inevitably involves trade-offs. Individuals forfeit access to a personal vehicle at their convenience to instead share the burden of driving (e.g., fuel costs, vehicle wear) with a group. For some individuals, the desire for the convenience of a personal vehicle will outweigh the direct benefits of rideshare. Therefore, the University should develop an incentive program to provide additional benefits or rewards to those who choose to carpool.
Reduced-cost parking pass. Individuals who register for a carpool parking pass forfeit their right to an individual parking pass. Therefore to offset this ‘loss’ and to encourage participation in the carpool program, the University should offer the carpool parking pass at a significantly reduced charge to each individual.
92
Reserved priority parking for carpool and vanpools. To provide further incentive as well as to increase awareness and visibility of the program, carpools and vanpools should be guaranteed parking in a desirable location on campus (e.g.¸ parking garages, central lot).
Automatic enrollment in a guaranteed ride home program. A guaranteed-ride-home service provides the user with an alternative source of transportation in the case of urgent situations and emergencies. Presently, individuals who participate in an Easy Street® vanpool are automatically eligible for the Connecticut Commuter Services Guaranteed Ride Home Program.
The University should develop a UConn-specific program to address all university members participating in a carpool, vanpool, or other rideshare program. Any individual who registers with a carpool should be automatically enrolled in the on-campus guaranteed ride home service. The individual is then ensured that the University will provide them a ride home free of charge in the case of an emergency. The specific details of the service will need to be determined by the University, but can be directly linked to the establishment of a group carpool parking pass. (For example, in order to qualify an individual may need to register for the carpool parking pass, thereby forfeiting their individual pass.)
Development of an expanded on-line, interactive campus community carpool tool.
Presently, the University’s Human Resource Department provides employees and students access to a campus carpool list.18 Individuals register their contact information and commute origin on this list and can then identify and contact individuals with whom they might be interested in carpooling. Once an individual has found an appropriate carpool partner or team, it is assumed they will then remove themselves from the list.
This tool is an excellent starting point to match individuals interested in developing a regular carpool arrangement. However, the current tool does not provide incentives to individuals hesitant to carpool. In addition, the tool has very limited flexibility and doesn’t allow individuals in identifying a rideshare partner for one-time trips to off-campus destinations (e.g., for academic conferences, students returning home during break, etc.).
It is therefore recommended that the University either develop an expanded ride matching service or work with external partners to promote existing resources that would result in increases in campus carpooling. Connecticut Commuter Services, for example, has partnered with NuRide to encourage rideshare in the state. Individuals can participate in the NuRide network free of charge and earn rewards for their transportation decisions (e.g., bicycling, carpooling).
T.4.4. Establish an on-campus carshare program.
In response to concerns and frustrations expressed by students who are ineligible for parking passes (e.g. freshman and sophomores) and their families, UConn Storrs Off Campus Student Services is presently exploring the option of implementing a campus carshare program at the Storrs campus. Development of a University carshare program allows members of the University community access to a vehicle at their convenience without requiring ownership or possession of a vehicle on campus. Therefore it is expected that developing a campus carshare program would provide additional benefits to the University including:
18 https://secure.uconn.edu/hr/carpool/

93
Increased individuals willing to forfeit access to a personal vehicle on campus, thereby reducing overall parking demand and the associated impacts.
Increased participation in rideshare programs, further reducing parking demand and campus congestion.
To encourage participation the University should considered discounted membership for those individuals willing to forgo a personal parking pass or who register as part of a campus rideshare.
T.4.5. Provide a weekday shuttle service to nearby off-campus park-and-ride lots.
Shuttle service should be provided at regular intervals (e.g., half hourly) during the start and end of the work day to accommodate flexibility in work hours. Initial lots for priority consideration would be the I-84/Rt. 195 lot and the Rt. 66/Rt. 6 lot. These existing park-and-ride lots, which are often underutilized, provide convenient off-campus, free parking for UConn employees and students. By providing a regular shuttle service to and from the lots, the University would reduce on-campus parking demand and traffic congestion, while also reducing commuter produced greenhouse gas emissions.
T.4.6. Increase local housing options and availability.
The University houses approximately 75% of all full-time undergraduate students attending the Storrs campus as well as a small proportion of the staff. The remaining students, faculty, and staff live off campus. By working with the surrounding communities to increase available housing options, the average commute distance can decrease and the proportion of individuals living within walking, bicycling or public transit distance of campus can increase. (It is important to note, however, that the more dispersed student housing becomes, the more difficult it will be to serve those residents with a bus system.) Therefore increases in off-campus housing need to be coordinated through a regional plan.
This is a long-term strategy to reduce campus greenhouse gas emissions, and in order to be truly successful with this strategy the University will need to integrate this goal into campus planning. In addition, the University will need to ensure that this goal is communicated and integrated into state and local planning policy as well as state infrastructure policy development.
T.4.7. Improve bicycle and pedestrian safety and access from off-campus housing.
Many of those individuals living within walking and bicycling distance regularly commute to campus by foot or by bicycle. Consequently, the University and the Town of Mansfield have several projects underway to improve, among other goals, bicycle and pedestrian access in the local community. The Town is completing final stages of the Hunting Lodge Road bikeway/walkway project, which will provide an 8-foot wide paved bikeway and walkway for residents living along Hunting Lodge Road to access the main campus. A similar project was completed in 2007 along Separatist Road. Both roads (i.e., Hunting Lodge and Separatist) house a significant number of campus faculty, staff and students; the bikeway and walkways will therefore provide safer access to the campus from these residences. Similarly, the University is in the planning and design phases of a North Hillside Road extension project. The proposed extension, which would serve as an alternate entrance to the University, will include a bikeway and walkway. Notably, the extension will provide direct access for on-campus residents to a nearby shopping plaza, reducing the need for off-campus personal vehicle trips.
The above mentioned projects will contribute to an atmosphere of improved bicycle and pedestrian safety and access between the surrounding community and the campus. However, the University can take additional steps, potentially increasing the proportion of off-campus residents commuting to campus by bike or foot. The State of Connecticut’s 2009 Statewide Bicycle and Pedestrian Plan Update,
94
identifies supporting and encouraging pedestrian and bicycle connections between neighborhoods, commercial areas, employment centers, schools, state and municipal parks, and other destinations serving the community as one of seven state goals relating to bicycling and walking. In addition, the Regional Transportation Plan (WINCOG 2005) cites improvements to bicycle and pedestrian facilities as a major regional transportation need, and provides specific recommendations for the Town of Mansfield including University owned properties. The University should therefore work with the State as well as the surrounding communities to continue to improve bicycling and pedestrian connections in the area. Emphasis should be placed on continuing to connect the campus via walkways and bikeways to nearby off-campus areas densely populated students, faculty and staff.
T.4.8. Increase bus and shuttle availability to and from off-campus destinations.
Despite a dedicated Transportation and Parking Services Office, transportation from the UConn Storrs campus to the surrounding communities remains limited. (A summary of available transportation options is provided in Table 3.7.) The primary off-campus transportation available to University community members includes:
UConn Services: Campus Bus and Shuttle Service. The University currently provides transportation to the Depot Campus and to nearby University owned housing sites via the UConn campus bus system. Students are charged a $35 per semester fee to fund this service. Only privately owned housing, located along the existing university bus routes are serviced; regular public transportation is not provided to the majority of off-campus housing located in Mansfield. The University does not currently provide regular transportation to nearby metropolitan areas; however shuttles are available on request to the airport, train station and ferry for a fee.
Public Transit: Local Bus Services. Additional limited day-time public transportation is also provided between the Storrs campus and Willimantic via the WRTD Storrs-Willimantic bus. Peter Pan Bus, a private bus company provides twice daily service from the campus to Manchester, Hartford, and Providence for a fee as well.
It is recommended that the University expand bus and shuttle availability from the campus to:
Off-campus housing complexes in the surrounding communities (e.g., Tolland and Windham County) known to house a high density of students, faculty and staff; and to
Nearby urban centers, including Willimantic, Manchester, and Hartford, Connecticut as well as Providence, Rhode Island (Figure 3.10).
Specifically, it is recommended that the University work with the State and surrounding communities to pursue the following improvement needs relating to public transit, many of which were cited in the Windham Council of Governors (WINGOG) 2005 Regional Transportation Plan:
• Expansion of UConn shuttle bus routes to service all larger apartment developments in Mansfield, Willington and Ashford in addition to continued service to UConn’s Depot campus.
• Enhancement of the WRTD, Willimantic/Storrs bus service to increase service hours and the frequency of service stops, including expansion of bus service along Routes 44 and 32, including service to UConn’s Depot Campus.
• Expansion of Dial-a-Ride program to include evening and weekend service and out-of-region services.
• Expansion of Hartford commuter bus service to UConn’s Depot and Storrs campuses.

95
Table 3.7. Available Off-Campus Transportation Services
Service Availability19
Cost Additional Notes
Campus Bus System
Mon. – Thurs. (7a-12a) Fri. (7a-10p)
$35/semester (mandatory student fee)
University Service; limited to UConn-owned housing and adjacent housing only; Website
University Shuttle Service
By request. Destinations include Bradley International Airport, Union Station (Hartford, CT), and the New London, CT ferry terminal.
$50/one-way $100/round-trip
University Service; Website
Husky Watch (Police escort service to/from campus)
Daily (6p-8p) Free with UConn ID
University Service; limited off-campus range; does not service individuals who are suspected of drinking; Website
WRTD Storrs-Willimantic Bus Service
Mon.-Fri. (7a-7p) Sat. (9a-5p)
Free with UConn ID
University-Municipal Partnership; Website
GUARD Dogs Fri. & Sat. (11p-3a) Free to UConn Students
Private Service; Website
Peter Pan Bus Twice daily service with additional AM route on Friday and Sunday.
$13-16/one-way $25-31/round-trip
Private Service; Website
Figure 3.10.
20 Map of the UConn Storrs campus (red dashed circle) and nearby urban regions (solid green
circles). Willimantic is located approximately 9 miles south of the UConn campus, and features the Eastern Connecticut State University campus as well as several smaller local businesses and food establishments. Manchester and Hartford are located approximately 20 and 25 miles west of the UConn Storrs campus,
19 As of March 2009; trip availability and fees are likely to change. 20 Figure generated using GoogleTM Map.

96
respectively, and feature a wealth of shopping, dining, and entertainment opportunities. Providence, Rhode Island (not shown) is located approximately 54 miles to the east of the campus.
Primary barriers to improving public transportation between the Storrs campus and the surrounding communities have historically included funding limitations, the rural nature of the surrounding community, and a high level of access to personal vehicles (and corresponding low demand for public transportation). Therefore, the University will need to address these issues in order to address improvements to off-campus transportation services. The University should consider all potential partnerships, including partnerships with regional business centers (e.g., the Buckland Hills and Evergreen Walk areas in Manchester).
T.4.9. Advocate for the development of a regional light rail commuting option.
Given the University’s proximity to Willimantic, CT and Eastern Connecticut State University, as well as to Hartford, CT, light rail should be considered as a potentially viable future option (e.g. long-term emissions reduction strategy) for campus commuters and visitors. The 2005 Regional Transportation Plan specifically advocates for the ‘establishment of additional passenger service along the New England Central Railroad, including passenger stops to serve Willimantic and the University of Connecticut, including the Depot Campus.’ Light rail would allow increased access to the campus without compromising the beauty of the region or creating undesirable traffic congestion. The University should therefore continue to advocate for the exploration of regional light rail commuting options.
Strategy T.5. Redesign campus parking to minimize commuter emissions
Across the nation, parking has traditionally been undervalued. Parking generates costs through construction activities, lost opportunity costs for the land in question, maintenance costs, and operational costs including public safety requirements. Despite this, there is continued demand for reliable, convenient parking to service the growing number of vehicles travelling to campus each day. Unfortunately, providing convenient, easily accessible parking for all has a variety of negative environmental and social impacts. Traditional asphalt parking spaces result in increased stormwater runoff, elevated urban heat island effects, and habitat destruction, among other negative environmental benefits. Providing an excess of parking results in land, which otherwise could have been conserved as vegetated common spaces or built for academic or research purposes, to instead lie underutilized. An excess of parking also contributes to the transportation demand management issues associated with increases in single-occupancy-vehicle trips to campus. When all individuals are guaranteed a convenient and private parking space, there is little incentive to carpool or utilize public transportation. In order to maximize the efficiency and revenues generated from campus parking, while minimizing the associated negative environmental and social impacts, it is recommended that the University:
T.5.1. Establish a campus parking cap.
Several colleges and universities have established a campus parking cap, committing to no net increases in campus parking area. Such a cap encourages innovation in campus parking and transportation systems, while providing the added benefit of protecting campus natural resources.
Limiting campus parking increases the value of existing spaces. Those individuals who wish to continue to drive to campus by car will pay an increased price for the opportunity to continue to park on campus. On the other hand, those individuals who do not require access to on-campus parking are likely to forego their ability to purchase a parking pass. A properly designed parking price system can therefore

97
increase parking-related revenues while decrease the number of parking spaces available. (Decreased parking further increases net profit through decreases in maintenance and safety personnel requirements.) More importantly, restricting campus parking results limits the number of vehicles travelling to campus each day. Instead, individuals will be encouraged to switch to alternative modes of transportation (e.g., foot, bicycle, bus). In turn, per capita greenhouse gas emissions associated with campus commuting will decrease.
The University of Connecticut has already committed to achieving significant impervious surface reductions, as recommended by the Eagleville Brook Total Maximum Daily Load requirements. Establishing a net parking cap, will assist the campus in achieving local water quality goals, while still allowing considerable flexibility in parking design.
T.5.2. Develop an incentive program to discourage parking pass purchases.
The University should identify ways to encourage faculty, staff and students to not purchase on-campus parking, thereby reducing demand and the emissions that otherwise would have been generated through vehicle trips to campus. Potential incentives might include offering a cash-out option, free membership in a campus carshare program, discounted regional mass transit passes, or a free bicycle loan.
T.5.3. Implement a campus-wide parking fee increase; use the revenue to fund improvements and expansions to campus mass transit options.
Parking is traditionally undervalued at the university. Parking rates at comparable institutions are almost double the UConn-Storrs rates. Increases in campus parking prices can help reduce campus parking demand and the associated maintenance and operational costs, while generating increased revenue. Revenues collected should be directed towards improvements in campus transportation systems, in particular, campus transportation services (e.g., buses or shuttles) to off-campus housing.
T.5.4. Price parking passes according to vehicle fuel efficiency and emissions rating.
A parking system that is based upon greenhouse gas emissions is likely to result in real decreases in campus emissions. The proposed parking fee increased discussed in Strategy T.5.3. could also be developed based upon vehicle fuel efficiency and emissions rating. The proposed system would require individuals to specify their vehicle make, model, and year. This information in turn would be used to identify the associated EPA emissions rating for the vehicle. A CAP ‘surcharge,’ pro-rated according to vehicle emissions rating, would then be added to the parking pass cost. Vehicles above a certain emissions threshold (e.g. ‘cleaner’ vehicles) would be exempt from the surcharge. Similarly, vehicles registered as part of a rideshare group (e.g., carpool or vanpool) would be exempt. The funds generated from this charge would be used to make additional improvements to campus transportation systems in order to further reduce associated emissions.
T.5.5. Offer a reduced-cost parking pass, priority parking and emergency support services for rideshare participants.
As the University continues to expand, increasing the proportion of campus members that participate in carpool and vanpool services will be an important strategy to maintain or reduce campus parking demand. In addition, as discussed previously in this section, increasing the proportion of individuals participating in a carpool or rideshare program will help reduce greenhouse gas emissions associated with commuter trips to campus. The University should therefore encourage rideshare by offering a reduced cost parking pass and priority parking for registered campus carpools and vanpools. To ensure

98
a reduction in individual vehicles travelling to campus (and therefore total commuter miles), individuals registering for the reduced rate rideshare parking pass will be required to forfeit an individual parking pass. However, to accommodate rideshare group members faced with unusual or urgent situations which require the use of their personal vehicle, the University could offer a guaranteed ride home service (e.g., Strategy T.4.3.), provide discounted parking to registered carpoolers in the parking garages, offer a limited number of single-use day passes, or a similar alternative to provide insurance against emergency transportation needs.
T.5.6. Develop a reduced-cost parking pass for motorcycles and scooters when registered as the sole vehicle.
Presently, motorcycle owners are allowed to register their motorcycle as a second vehicle for a significantly reduced rate ($10). However, individuals wishing to register only a motorcycle must pay the full parking permit cost, thereby eliminating any parking-based incentive to commute via the smaller, more fuel efficient vehicle.
Motorcycles and scooters require less parking area per vehicle and have a higher fuel economy than most cars, trucks and SUVs. Therefore, the University should encourage the use of motorcycles and scooters by offering a reduced-price parking pass for this class of vehicles. In addition, parking areas should be specifically designated for these vehicles, to accommodate retrofitting existing spaces with a kick-stand pad to prevent vehicle damage during warmer months. Increases in the proportion of individuals commuting to campus by motorcycle or scooter will result in decreased commuter-generated greenhouse gas emissions.
Strategy T.6. Increase walking and biking
The University’s Master Plan, first released in 1998, emphasizes the creation of a pedestrian core and improving bicycling on campus. Specifically recommendations to improve pedestrian circulation included:
Circulate vehicles around the perimeter of neighborhoods to minimize conflicts between pedestrians.
Promote pedestrian circulation as the primary mode of on-campus movement.
Remove existing roads which are not required for daily access to increase the pedestrian environment.
Control and monitor service vehicle access on pedestrian walkways.
Properly identify and furnish all campus walkways in order to provide a safe and comfortable, efficient and safe route to campus.
Work with the community to establish pedestrian walkways and bikeways along major community roads leading to campus.
Recommendations to improve bicycle circulation on campus included:
Coordinate and work with the community to establish dedicated routes to the campus.
Plan to provide dedicated bicycle lanes within the campus roadway system.
Provide bicycle storage facilities at each University facility.
Provide lockers, showers and change rooms for promoting bicycles as an alternative to the car.
99
Develop and maintain a unified bicycle sign and pavement marking system throughout campus.
Cooperate with state, county and local jurisdictions in planning for bicycle facilities.
Similarly, in 2005 in an effort to assess the current attitudes towards bicycling on campus, the Institute for Transportation Engineers (ITE) student chapter on campus surveyed faculty, staff and students throughout campus. The resulting data were used to develop a proposal for a campus bicycle master plan. The plan included a proposed network of bicycle lanes, sharrows and signage throughout campus (Figure 3.11).
T.6.1. Hire a pedestrian and bicycle coordinator to ensure implementation of Master Plan recommendations.
Over the past decade the University has made progress towards improving pedestrian and bicycling access and safety on campus. Notably, parking and roadways have been moved towards the outer perimeters of campus in order to establish a pedestrian campus core. In addition, recent improvements were also made throughout campus to significantly improve the visibility of pedestrian safety features including lighting, crosswalks, and associated signage. Nevertheless, many of the recommendations of the Master Plan (developed over a decade ago) and the ITE campus bicycle plan (developed four years ago) remain unimplemented.
The University should therefore hire a pedestrian and bicycle coordinator to increase the rate at which bicycling and pedestrian objectives outlined in the Master Plan are implemented. In addition, the coordinator will serve as the primary staff person responsible for:
Identifying additional strategies to improve pedestrian and bicyclist safety and access on campus;
Working closely with the Town of Mansfield to improve local access and safety issues (e.g., from off-campus housing and adjacent shopping districts to campus);
Identifying and pursuing funding opportunities related to improvements to campus bicycling and pedestrian services; and
Developing a campus bicycle and pedestrian outreach program to increase campus awareness and safety.
T.6.2. Improve campus bicycle amenities and paths.
A coordinated bike path system does not exist on campus. As recommended by the Master Plan, the University should strive to develop and maintain a unified bicycle sign and pavement marking system throughout campus. In addition, bicycling amenities are presently limited and in need of expansion. Therefore, it is recommended that the University:
Increase and enhance existing on-campus bicycle pathways to improve connectivity, visibility and appeal.
Improve signage throughout campus to raise awareness and increase safety.
Increase the availability of bicycle racks, including those with shelter from the elements.
Install bicycle storage lockers in campus perimeter parking lots and near residence halls.
Increase storage within residence halls.
Ensure that bicycle racks and/or storage lockers are located near all transit stops
Ensure that campus buses are equipped with bicycle racks. (Priority should be placed on first outfitting those buses that service periphery lots and off-campus apartments.)

100
Figure 3.11. 2005 proposed bicycle plan network.

101
T.6.3. Develop a bicycle commuter-incentive program.
Numerous faculty, staff and students live within bicycling distance to campus. The University should therefore develop a bicycle commuter-incentive program to increase bicycle ridership to campus, and therefore reduce vehicle trips to campus and parking demand. Potential incentives might include a monetary reward to cyclists willing to forfeit access to a parking permit, free shower and locker access for registered bicycle commuters, and a guaranteed-ride-home service for emergencies. Cyclists can also be offered the opportunity to purchase low-cost daily parking permits (e.g., via an online system accessible from home) to allow for exceptions when a personal vehicle is required (e.g., poor weather conditions, illness, etc.). An on-campus network of bicycle commuters should also be established to connect individuals interested in identifying commuting partners or groups.
T.6.4. Create an affordable on-campus bicycle shop.
Presently, the nearest bicycle repair facility is located 7 miles off campus. There are no nearby bicycle repair facilities that are directly accessible by public transportation. Therefore to increase accessibility to repair services, and therefore encourage bicycling as a primary means of transportation, it is recommended that the University establish a bicycle shop on campus, or, alternative, work with the Community to establish a shop directly adjacent to the campus. Recommended potential locations therefore include the new on-campus student recreational services facility or in association with the Storrs Center Project.
T.6.5. Establish a campus-wide bicycle loaner program.
The University offers bicycle rentals for a fee through the UConn Outdoors program. Pricing is designed for daily rather than semester use, however. (For example, based on present costs, bicycle rental for the semester (i.e., 15 weeks) would cost $900.) Furthermore, rental options are limited to mountain bikes rather than commuter bicycles. Unfortunately, individuals able to afford this rental rate are likely to purchase their own bicycle rather than rent from the University, making the program an ineffective option for a campus bicycle loaner program. It is therefore recommended that the University establish a separate campus bicycle loaner program, either university-run or outsourced (i.e., run by a local private business). The proposed program could also be potentially run out of the bicycle shop proposed in T.6.5.
Strategy T.7. Reduce the carbon footprint of off-campus travel
Off-campus travel contributes significantly to the University’s overall greenhouse gas inventory. Primary modes of off-campus travel include rental cars, air travel, and, to a lesser extent, bus, train, taxi and ferry trips. In addition, personal vehicle mileage reimbursed by the University is included in the ‘off-campus travel’ category of the inventory.
The University is limited in its ability to reduce the emissions associated with off-campus travel. Strategies that seek to eliminate the need for travel (e.g., videoconferencing, telecommuting) or encourage mode shifts to those that emit less greenhouse gas emissions per capita per mile, can, however, minimize these emissions. In addition, the following strategies are recommended:
102
T.7.1. Require vehicle rental programs to provide efficient and alternative fuel vehicle options.
The University recently negotiated a contract with Enterprise for an on-campus Enterprise vehicle rental office. The contract contains specific vehicle fleet guidelines, requiring a minimum 10% of the available daily rental fleet be composed of gasoline hybrid electric vehicles (GHEVs). In addition, the available fleet will include a mix of vehicle sizes and rental rates increase with vehicle size. It is recommended that the University work with Enterprise to identify additional measures to minimize the carbon impact of related off-campus travel. In addition, similar language should be included in future University contracts with other off-campus travel-related agencies.
T.7.2. Negotiate discounted bus and train ticket rates for UConn faculty, staff and students.
To encourage students, faculty and staff to utilize existing regional bus and train services for off-campus travel, the University should work with participating companies to establish and promote a discount rate or incentive program (e.g., a mileage reward program) for UConn ID holders.
T.7.3. Discourage air travel to locations within reasonable driving or train distance.
The University should discourage air travel to locations that are within reasonable (e.g., several hours) driving or public transit distance. For example, prior to reimbursement the University should require written justification or documentation that costs or other variables precluded travel to the location by train or car. In addition, the University should seek to educate faculty, staff and students regarding impacts of air travel. The University should therefore develop a list of ‘green’ airlines (e.g., those that purchase carbon offsets, use alternative fuels, or otherwise seek to reduce their carbon footprint) and encourage the purchase of flights from companies on this list.

103
References
Boadi, D., Benchaar, C., Chiquette, J., and Massé, D. 2004. Mitigation strategies to reduce enteric methane emissions from dairy cows: Update review. Canadian Journal of Animal Science. 84: 319-336.
Brown, S., Kruger, C., & Subler, S. 2008. Greenhouse Gas Balance for Composting Operations. Journal of Environmental Quality. 37: 1396-1410.
Cambridge Systematics, Inc. 2006. Cool Pavement Report (EPA Cool Pavements Study – Task 6). Cambridge Systematics, Inc.: Chevy Chase, MD. 64 p.
Connecticut Department of Environmental Protection (CTDEP). 2006. Connecticut Greenhouse Gas Inventory: 1990–2001. CTDEP: Hartford, Connecticut, USA. 6p. Accessed 01 April 2009 at http://ctclimatechange.com/documents/FinalCT-2006-Inventory-V6.pdf.
Environmental Health & Engineering, Inc. (EH&E). 2009. The First (Big) Step to Reducing Your Campus Carbon Footprint (Whitepaper). 9 pg. Available at http://www.eheinc.com/form/CampusRetroCx.pdf.
Huffstutter, P.J. 2009. “Farms downsize with miniature cows.” Los Angeles Times (Online). Accessed 03 June 2009 at http://www.latimes.com/news/nationworld/nation/la-na-miniature-cows24-2009may24,0,7037767.story.
La Salle, T.J. and Hepperly, P. 2008. Regenerative Organic Farming: A Solution to Global Warming. Rodale Institute: Kutztown, Pennsylvania, USA. 13p. Accessed 01 April 2009 at http://www.rodaleinstitute.org/files/Rodale_Research_Paper-07_30_08.pdf.
Mansfield Downtown Partnership, Inc. & LeylandAlliance, LLC. 2008. Design Guidelines for a Sustainable Community. Leyland Alliance, Inc. 46 p. Accessed 27 April 2009 at http://www.storrscenter.com/.
Northeast States for Coordinated Air Use Management (NESCAUM), Connecticut Department of Environmental Protection, and Connecticut Clean Energy Fund. 2003. Connecticut Greenhouse Gas Inventory: 1990-2000. 71p. . Accessed 01 April 2009 at http://ctclimatechange.com/pdf/CC_Inventory_Report.pdf.
Sustainable Sites Initiative. 2008. “About Us.” Sustainable Sites Initiative (Online). Accessed 28 April 2009 at http://www.sustainablesites.org/about/.
Town of Mansfield. 2006. Mansfield Plan of Conservation and Development. Town of Mansfield Town Council and Planning and Zoning Commission. Accessed at www.mansfield.ct.org/town/departments/pnz/pocd/index.php on
United States Department of Energy (USDOE). 2006. “Solar Water Heating.” Solar Energy Technologies Program Website. Last Updated 20 July 2006. Accessed 22 June 2009 at http://www1.eere.energy.gov/solar/sh_basics_water.html.
United States Department of Energy (USDOE). 2008. “Benefits of Geothermal Heat Pump Systems.” Energy Efficiency and Renewable Energy Website. Last updated 30 December 2008. Accessed 22 June 2009 at http://www.energysavers.gov/your_home/space_heating_cooling/index.cfm/mytopic=12660.

104
United States Department of Energy (USDOE). 2009. Audit Report: Department of Energy Efforts to Manage Information Technology Resources in an Energy-Efficient and Environmentally Responsible Manner. May 2009: OAS-RA-09-03. 30 pg. Accessed 23 June 2009 at http://www.ig.energy.gov/documents/OAS-RA-09-03.pdf.
United States Environmental Protection Agency (USEPA). 2006a. Labs21 Environmental Performance Criteria: Version 2.1. Available online http://www.epa.gov/lab21gov/pdf/epc21_printable_608.pdf.
United States Environmental Protection Agency (USEPA). 2006b. Solid waste management and greenhouse gases: A life-cycle assessment of emission and sinks. EPA630-R-02-006. U.S. Environmental Protection Agency: Washington, DC. Accessed 20 July 2009 at http://yosemite.epa.gov/OAR/globalwarming.nsf/UniqueKeyLookup/TMAL6GDR3K/$File/Energy%20Savings.pdf
United States Environmental Protection Agency (USEPA). 2009. Reducing Urban Heat Islands: Compendium of Strategies. USEPA: Washington, DC. Updated 9 February 2009. Accessed 29 April 2009 at http://www.epa.gov/heatisld/resources/compendium.htm.
United States Green Building Council (USGBC). 2007. Pilot Version: LEED for Neighborhood Development Rating System. The U.S. Green Building Council. 166 p. Accessed 27 April 2009 at http://www.usgbc.org/ShowFile.aspx?DocumentID=2846.
United States Green Building Council (USGBC). 2008. “LEED for Neighborhood Development.” U.S. Green Building Council (Online). Accessed 27 April 2009. At http://www.usgbc.org/DisplayPage.aspx?CMSPageID=148.
Water Management, Inc. (WMI). 2007. UConn Water Audit Report: Water Conservation Opportunities. Prepared by Water Management, Inc., Alexandria, VA, for the University of Connecticut. Accessed 03 June 2009 at http://www.fo.uconn.edu/Dec%2007%20Wtr%20Plan.pdf.
Windham Region Council of Governments (WINCOG). 2005. Regional Transportation Plan. Accessed 17 August 2009 at http://www.wincog.org/publications/RTP.pdf.
1
0 The University of Connecticut
Climate Action Plan:
Guiding the Path toward Carbon Neutrality
Storrs Campus
September 2009
Section 4:
Funding Opportunities

106
Section 4:
Funding Opportunities
Table of Contents
Executive Summary ...................................................................................................................... 108
Introduction .................................................................................................................................... 111
Balancing Long-Term Gains with Short-Term Investments ......................................................... 111
Don’t Forget to Measure Carbon Savings! ............................................................................................ 111
Ensuring Success: Administrative Costs ............................................................................... 112
Existing & Allocated Funds ........................................................................................................ 113
UConn Green Campus Fund ........................................................................................................................ 113
UConn 2000 & UConn 21st Century ......................................................................................................... 113
Potential On-Campus Funding Mechanisms ........................................................................ 114
Sale of Renewable Energy Credits ........................................................................................................... 114
Revolving Loan Fund ..................................................................................................................................... 115
Sale of Excess Power Generation ............................................................................................................. 116
Campus Energy Efficiency Incentive Program ................................................................................... 117
Campus Parking Surcharges ...................................................................................................................... 118
Self-Sustaining Forestry Program ............................................................................................................ 118
Student Utility/ Sustainability Fee .......................................................................................................... 119
Student Project & Activity Funding Sources ........................................................................................ 120
Alumni Funding Opportunities ................................................................................................................. 121
Voluntary Donation Program .................................................................................................................... 122
External Funding Opportunities .............................................................................................. 122
State & Federal Opportunities ................................................................................................................... 123
Private Funding Opportunities ................................................................................................................. 123
Direct Grant Opportunities .............................................................................................................................. 123
Performance Contracts & Energy Service Companies (ESCOs).......................................................... 123
Third Party Financing Options ....................................................................................................................... 124
Other On-Campus Partnerships ...................................................................................................................... 124

107
Municipal Partnerships ................................................................................................................................ 125
White Tag Programs .......................................................................................................................................... 125
Related Resources......................................................................................................................... 126
References ....................................................................................................................................... 128

108
Executive Summary
The University of Connecticut’s Climate Action Plan (CAP) seeks to minimize the University’s greenhouse gas emissions toward a carbon-neutral campus by 2050. To do so, various strategies relating to campus energy, transportation and sustainable development are outlined in this document. Many of these strategies are underway with funding already allocated, while others are in development and will require new funding. The good news is that, in the majority of cases, reducing campus emissions translates into a corresponding reduction in energy use (e.g., fuel, electricity) and therefore cost savings over the life of the project. Furthermore, the strategies proposed throughout the CAP are consistent with University’s Academic Plan, which stresses the environment as one of three focus areas of excellence and specifically calls for the development of “a university plan to reduce our carbon footprint.”
This section of the CAP outlines select funding sources currently available to the University and several proposed new funding sources. This section was developed with two critical assumptions in mind: new funding opportunities are likely to emerge, and mechanisms appropriate today may no longer be relevant several years from now. This section, therefore, is meant to be a ‘first screening’ of funding opportunities, rather than a comprehensive funding plan for the next forty years.
There are three main costs associated with implementation of the plan: administrative, operational and maintenance, and capital.
o Administrative Costs. The successful development of the CAP is the result of the hard work of more than 100 individuals. The coordination of this effort, however, would not have been possible without dedicated staff, particularly the CAP project manager, as well as the part-time sustainability coordinator in the OEP. A similar level of commitment, such as a full-time sustainability coordinator in the Office of Environmental Policy, will be required in the future to ensure successful implementation.
o Operating and Maintenance Costs. Day-to-day campus activities require investments in personnel, supplies and equipment to operate, maintain and continuously improve programs and services. In general, the greenhouse gas reduction strategies proposed in the CAP directly correspond to reduced operating expenses. Through energy efficiency and conservation programs that cut the University’s carbon emissions, we also lower our fuel and energy costs for electricity, heating, cooling, and operating our water supply
OVERVIEW:
o The UConn Climate Action Plan outlines various strategies to minimize campus greenhouse gas emissions.
o Implementation of these strategies will require direct funding as well as administrative support.
o Reducing greenhouse gas emissions, however, often directly correlates to saving energy (i.e., electricity, heating, cooling) and other resources, therefore saving money over the long-term.
o There are 3 main types of funding required: administrative, operational and maintenance, and capital.
o Several funding strategies are outlined in this document. However, this is not an exhaustive list and will need to be updated regularly to account for new and emerging funding sources.
o To ensure success and maximize savings, the University should assign a specific individual or team the task of regularly identifying and pursuing CAP-related funding.

109
system. However, many strategies have associated first costs for the purchase of more fuel-efficient vehicles or energy-efficient equipment used for retrofits and replacements. Other strategies will necessitate a change in routine maintenance, which might entail re-training custodial staff or hiring experts to operate new systems or oversee new programs. Such costs will likely have a rapid return on investment (ROI) or payback period, which is when the overall energy savings begin to exceed the first cost. However, these first costs must nonetheless become part of annual operating budgets over the next few years, when such budgets have been held to "zero sum" increases at best during these difficult economic times. Even with a dedicated funding source, that will mean resetting institutional priorities and reallocating time and money to better align with the carbon reduction strategies recommended in the CAP.
o Capital Costs. Strategies that recommend new construction, major renovations, or the development of master plans will require capital funding. Several of the proposed strategies have funding already allocated through the UConn 2000 and UConn 21st Century programs. Additional projects, including several building envelope and utility infrastructure (e.g., steam, water, and sewer) repair and replacement projects, are proposed in capital/deferred maintenance budgets in upcoming fiscal years. Completion of these projects is expected to have a positive impact on the University’s carbon footprint.
Many funding mechanisms exist to finance the implementation of the University’s Climate Action Plan. It is recommended that the University take a multifaceted approach to funding the CAP since it is unlikely that any one funding source will be large enough or broad enough to finance all proposed activities. Proposed funding mechanisms discussed in this section include:
o Federal and state grants, loans, and rebate programs.
o Private funding through direct grant opportunities, performance contracts, third party financing, or other partnerships.
o Proceeds from the sale of the cogeneration facility Renewable Energy Credits (RECs). The sale of RECs is projected to net hundreds of thousands of dollars annually, most, if not all of which, should be set aside for energy efficiency projects and other GHG mitigation strategies recommended in the CAP.
o Voluntary donations. The Green Campus Fund, part of the UConn Foundation's annual appeal, has generated more than $20,000 from alumni and other individual donors in a few

110
short years. It may serve as a source of seed money for equipment expenses and green features in capital improvement projects.
o Proceeds from the sale of excess power generation sold back to the grid during periods of peak demand.
o A campus parking surcharge to encourage carpooling and minimize commuter emissions.
o A student sustainability fee to seed a revolving loan fund for campus energy improvements.
o Campus student activity funding sources for student-led emission reduction projects.
o A self-sustaining forestry program (i.e., timber harvesting) that enables management to maximize carbon sequestration.
Additional research will be needed to determine feasibility and appropriateness of the proposed mechanisms for each cost type. It is therefore recommended that the University assign an individual to the ongoing task of identifying and pursuing CAP-related funding for the campus.

111
Introduction
Implementation of this plan will require upfront investment by the University. Acquisition of funding will at times be a challenge, and innovative funding strategies will be necessary. Nevertheless, topics such as alternative energy production and greenhouse gas emissions reduction are increasingly gaining attention and, therefore, financial support.
Furthermore, the University serves as an example to the students that it teaches. UConn must not fail its students by letting an issue as comparatively trivial as funding thwart the University’s efforts to tackle a challenge as great as global climate change. The cost of inaction is far greater than an upfront investment in our students’ future. (As the next sections will reiterate, upfront costs are often outweighed by long-term savings and secondary benefits when evaluated over the long-term.)
This section is meant to serve as a starting point, but will undoubtedly need to be updated on a regular, ongoing basis since available funding sources and mechanisms will change over time. Dedicating a particular individual or team to this task will ensure that valuable funding opportunities are not missed or overlooked by the University.
Balancing Long-Term Gains with Short-Term Investments
It is easy to dismiss proposed projects with high upfront costs as unworkable solutions. However, analysis based on upfront costs alone does not consider annual operations and maintenance costs or the savings that can be accrued through changes in both. Constructing a LEED-Silver certified building, for example, may require additional upfront costs over the construction of a ‘traditional’ building. However, the energy and water savings, increased employee productivity, and other benefits generated will often pay for these upfront costs several times over during the life of the building. Therefore, before funding any project, the University should require a lifecycle cost analysis (LCA) comparison of all available alternatives.
Don’t Forget to Measure Carbon Savings!
When considering the secondary benefits of project alternatives, the University should strive to specifically quantify the expected emission reduction, or carbon savings. While this remains difficult to do, estimates of the ‘cost’ of carbon, which range from $130 to $300 per ton, are beginning to appear. This will allow for at least a qualitative comparison between proposed solutions (Bookart 2008). In addition, there is evidence to suggest that future state and federal regulations
KEY POINTS:
1. Implementing the Climate Action Plan will require funding.
2. The majority of the proposed strategies, however, will save the University money in the long-term.
3. Employ lifecycle cost analysis (LCA) to balance initial costs with the savings and secondary benefits accrued over the life of a proposed project.
4. Available funding sources will change over time.
5. Reducing emissions today will avoid future costs.
112
will drive the cost of carbon even higher. Avoiding these future elevations in carbon cost by acting quickly will, therefore, save the University money in the long run.
Ensuring Success: Administrative Costs
Over the course of the 2008-2009 academic year, UConn has invested a substantial amount of resources (i.e., time, finances, and labor) towards the development of this climate action plan. Continued human resources will be required in order for the plan to be successfully implemented and achieve measurable results.
ACUPCC signatories are required to submit annual greenhouse gas inventories as well as biennial progress reports. During the 2008-2009 academic year, a full-time paid project manager as well as two part-time paid student interns were charged with the development of the plan and completion of the campus greenhouse gas inventory. (Over 100 volunteers also contributed their time and expertise.) A similar level of commitment will be required to complete future annual inventories and progress reports.
The CATF recommends that the University continue to hire one or more student interns through the Office of Environmental Policy to compile the annual greenhouse gas inventory. If funding is not immediately available, the Office of Environmental Policy may seek qualified students to perform a for-credit student internship focused on the University’s greenhouse gas inventory. Utilizing two or more interns can assist with overcoming continuity issues due to frequent turnover, minimal training requirements, and loss of information.
In addition, the CATF recommends that the University seek to assign a staff person to manage the implementation of the climate action plan, including the identification and acquisition of funding. This individual should be knowledgeable of campus operations, and be able to communicate effectively with campus experts (e.g., utility managers, alternative energy researchers, campus planners, etc.) as well as student populations, and possess experience and skill in identifying and acquiring funding sources for college or university sustainability (i.e., emissions reduction) projects. If funding is not immediately available, this role may temporarily be assigned to a qualified, existing employee or graduate student at the University. A long-term goal, however, should be to establish a permanent position to oversee the University’s climate action effort, particularly the financing of emission reduction efforts and the tracking of progress.
RECOMMENDATION:
1. Continue to allocate resources to employ one or more students per semester to compile the University’s greenhouse gas inventory.
2. Establish a campus position to oversee the implementation, tracking and financing of the University’s climate action plan.

113
Existing & Allocated Funds
UConn Green Campus Fund
In 2006, seeking to promote energy efficient and environmentally sensitive practices on campus, the UConn Foundation launched a Green Campus Fund to support sustainable building enhancements for new construction and renovation projects (UConn Foundation 2006). Donations to the Green Campus Fund, which exceed $20,000 to date, have supported recycling infrastructure improvements, bicycle racks, campus green roof seating, and other sustainability improvements on campus. The Fund is managed by the UConn Foundation, and projects are selected in consultation with the Director of Environmental Policy. To support future CAP efforts, the University and the UConn Foundation should develop and implement a plan to ensure continued donations to the Green Campus Fund.
UConn 2000 & 21st Century UConn
State of Connecticut Public Act 95-230, or The University of Connecticut 2000 Act (i.e., ‘UConn 2000’), was passed by the CT General Assembly in 1995. The program represents a $1 billion, ten-year investment to build, renew and enhance UConn’s physical infrastructure through new building construction, major renovations, deferred maintenance, equipment replacements and upgrades, utilities improvements, and public access improvements.
The 21st Century UConn initiative will extend and expand the unprecedented and extremely successful UConn 2000 program. It will be an eleven-year program that adds $1 billion to continue the infrastructure improvements at University of Connecticut’s main campus in Storrs (as well as at the five regional campuses and the School of Law). Recently completed projects that will help increase campus energy efficiency include the first phase of a campus metering project and a Residential Life window replacement project.
Several million dollars in funding has been also approved for additional building construction, renovations, and improvements, including numerous projects that will contribute to campus carbon footprint reductions. Funded projects with a greenhouse gas emission reduction benefit include:
agricultural waste compost facility
water reuse facility
water distribution system upgrades and modifications
steam and condensate distribution system improvements
improvements to the central utility plant
completion of the North Hillside Road extension project
continued meter installations
window replacements in campus housing units
UCONN GREEN CAMPUS FUND:
o Approximately $20,000 presently available for campus ‘greening’ activities
o Potential funding source for small equipment costs
o Supported by voluntary, private donations.
o Recommended to establish long-term fund raising goals and to develop a plan to achieve goals.
UCONN 2000 & UCONN 21ST
CENTURY:
o A combined $2.3 billion to be invested over 20 years.
o Funding to build, renew, and enhance the University’s physical infrastructure, including utility systems and building envelope upgrades.
o Funding allocated for the campus compost facility, water reuse facility, North Hillside Road extension, metering program, and utility system improvements, among other projects.

114
Unfortunately, in June 2009, the Governor’s Office notified the University that the scheduled FY10 bond authorization for the UConn 2000 program would be deferred. Included among the expected impacts are delays to critical building envelope and utility infrastructure (e.g., steam, water, and sewer) renovation and maintenance projects. Delay of these projects will translate into a delay in energy cost savings opportunities. The University, however, will continue to advocate for critical funding to update and maximize the efficiency of campus utility systems and buildings. Investing in these projects will yield annual operational cost savings for the University while contributing to the minimization of campus emissions, making them ‘high priority’ investments for the University.
Potential On-Campus Funding Mechanisms
There is no one single funding mechanism that will be appropriate for the University. Just as addressing climate change will require a multifaceted approach, so will funding campus emission reduction efforts. Options potentially appropriate for the University include sale of RECs generated through operation of the cogeneration facility, the establishment of a campus revolving loan fund, implementation of a student fee, and voluntary campus donation programs. These are only a short sample of the many strategies available to the University.
Sale of Renewable Energy Credits
Background Information
The State of Connecticut’s renewable portfolio standard (RPS) requires that all state electricity providers obtain a minimum of 4% of their total load from combined heat and power systems (i.e., cogeneration facilities) and energy efficiency by 2010. The RPS also requires that these entities obtain a minimum of 23% of their load from renewable energies by January 1, 2020 (CTDPUC 2008). Facilities that are classified as Class I, II, or III renewable energy sources generate Renewable Energy Credits (RECs), which can be sold at auction to electricity providers seeking to achieve the required renewable energy mix.
Implementation at UConn
RECOMMENDATION:
Continue to sell cogeneration facility RECs to generate funding for the University.
o Reinvest a significant portion of the annual sales towards campus energy projects (i.e. efficiency improvements, conservation, and demand reduction).

115
In December 2008, the State approved the University’s application to generate Class III RECs in association with the efficient operation of the cogeneration facility. Consequently, the University is now able to sell the RECs to those electric companies seeking Class III power sources. In the spring of 2009, the University placed the RECs it had generated during the final weeks of the previous quarter on the market for bid; the sale of the RECs generated an impressive $90,000. 25% of the revenue from the sale of the RECs is provided to the Connecticut Conservation and Load Management Fund which manages additional programs to incentivize efficient energy use, reduce air pollution and negative environmental impacts while promoting economic development and energy security. There is also additional tax liability associated with the income generated by the sale of the RECs.
Although it is agreed that this was an unusually prosperous sale, sale of the University’s RECs are likely to provide a significant source of funding for the University in the near future. It is estimated that future sales of RECs will generate approximately $1-2.5 million per calendar year. This estimate is based upon current conditions; prices are highly volatile and will respond to fluctuations in market conditions. A significant portion, if not all, of this future REC revenue will be dedicated to financing continuing improvements in the University’s energy efficiency and sustainability.
Revolving Loan Fund
Background Information
At large universities it is often particularly difficult to bridge capital and operating costs, despite direct connections between the two. Revolving loan funds are a unique way to overcome this barrier in funding campus sustainability projects while maximizing return on investments several times over. An increasing number of schools, both private and public, are developing revolving loan funds to tackle campus sustainability projects. These include:
Harvard University (Green Campus Loan Fund)
Iowa State University (Energy Conservation Loan Fund)
Tufts University (Energy Reserve Fund)
University of Maine (Green Loan Fund)
Carleton College (Sustainability Revolving Fund)
Connecticut College (Energy Conservation & Efficiency Fund)
Universities have taken various approaches to structuring revolving loan funds. Generally, loans are awarded to projects believed to have an (a) demonstrable cost savings and emissions reduction and (b) that will have a payback period of approximately 5 years or less. Several schools allow worthwhile projects with longer payback periods to be coupled with projects that have immediate high returns to create an average payback within the required timeframe. Loan agreements
RECOMMENDATION:
Establish a campus revolving loan fund to invest in campus carbon footprint reduction.
o Redirect a portion of the proceeds from the annual sale of the cogeneration facility RECs towards the fund.
o Ensure proper management of the fund to encourage growth over time.
116
are structured so that project savings are returned to the fund until the initial loan is paid off. Certain schools require an additional payback percentage to ensure growth of the fund over time. Once the initial loan funds are returned, any further savings generated are retained by the department responsible for implementing the project. Projects commonly funded relate to campus energy efficiency improvements and renewable energy development projects to supplement campus power needs.
Perhaps one of the most well known campus revolving loan funds, Harvard University’s Green Campus Fund (GCF) has allowed for the investment of over $14.5 million in 160 projects since its inception in 2002. Average simple payback is approximately 3.5 years and average return on investment exceeds 30% (AASHE 2005-2009).
Implementation at UConn
Sale of 2008 and 2009 cogeneration facility RECs may provide an ample source of seed money for a UConn revolving loan fund dedicated to campus energy improvements (e.g., efficiency improvements, demand reduction efforts, renewable energy generation, etc.) and subsequent emission reductions and cost savings.
It is critical to note that proper management of the fund is potentially more important than the initial value. Selection of a careful mix of projects will ensure cost savings and emissions reductions while allowing the fund to grow over time. Carefully selected and implemented initial projects will demonstrate the potential of the fund and encourage additional donations. This, in turn, will ensure ongoing investments in projects that will results in further savings and emission reductions.
Similarly, the management team should be small enough to remain effective, yet broad enough to include representation from major stakeholders and experts among campus administrators, faculty, facilities staff, student leaders, community members and alumni. A carefully executed and managed UConn revolving loan fund will benefit the University for many years to come through development and demonstration of innovative alternative energy sources, reduced greenhouse gas emissions, and the significant cost savings associated with demand reductions and maximization of utility efficiency.
Sale of Excess Power Generation
The University of Connecticut’s state-of-the-art Cogeneration Facility has an electrical production capacity of 24.9 Megawatts, a steam production capacity of 600 KP per hour, and a chilled water production capacity of 10,300 tons. The facility does not usually operate at maximum capacity; rather, electrical demand averages approximately 18 MW per day.
RECOMMENDATION:
Explore opportunities to generate and sell excess power.
o Ensure that generation of excess power does not compromise the facility’s status as a Class III power source.

117
The University should investigate and determine the feasibility of securing authority to export excess power to the grid. In return for this export, the University could either seek direct monetary compensation or arrange to be credited towards power purchases at the regional campuses or the UConn Health Center. Any revenue or savings generated could then be reinvested in campus carbon footprint reduction efforts.
Caution should be exerted, however, when pursuing this funding strategy to ensure the positive environmental benefits of cogeneration are not lost. If the facility is operating at or near maximum capacity to produce excess electricity for export, excess steam will also be generated. If this additional steam cannot be utilized, it will result in wasted energy. This, in turn, will reduce the overall efficiency of the plant and compromisethe University’s potential to earn (and therefore sell) Class III RECs. (State law requires that a minimum efficiency of 50% is maintained to be classified as a Class III power source.)
Campus Energy Incentive Program
Thousands of individuals contribute to the daily campus energy demand (i.e., heating, cooling, and electricity). A reduction in this overall demand would save the University thousands of dollars, and avoid a significant amount of greenhouse gas emissions annually. Unfortunately, the campus energy system is structured in a way that provides little incentive for campus energy users to reduce consumption. To increase the perceived value of campus energy, and to provide incentives for individuals and groups to conserve energy, the CATF recommends that the University implement a campus energy incentive program.
There is no single ‘best’ way to structure a campus energy incentive program, and any successful program will need to be flexible. It is important to remember that the primary goal of the program is not to raise funds. Instead, its focus should be to encourage campus energy users to take responsibility for their usage through energy conservation. Any funds generated should be reinvested into campus energy utility systems, or similar efforts, to reduce energy-related costs and emissions.
Potential aspects of a campus program might include:
Bill back university customers. Develop a system to charge university units (e.g. departments, offices, centers) and on-campus vendors for energy use. Pro-rate building use by department square footage and implement an annual fee based upon department size and function. Reward units for conservation efforts.
RECOMMENDATION:
Develop an energy incentive program to encourage demand reduction through accountability and conservation.
o Reward individuals and departments that work to reduce their campus energy use.
o Reinvest funds collected into campus energy improvement projects.

118
Require a flat fee or the return of a portion of grant monies associated with energy intensive research. To encourage the selection of maximum efficiency equipment and operation protocol, the university should offer a fee waiver to researchers that demonstrate that they are using the most energy efficient equipment and methods available.
Charge an on-campus student utility fee. Offer a rebate to students in those residence halls that remain below an established energy use standard for that building.
Campus Parking Surcharge
Automobile emissions are a significant source of greenhouse gas emissions. Incentives that encourage individuals to forgo a personal vehicle on campus in favor of alternative transportation will directly impact the campus emissions profile. One such incentive is a parking pass surcharge that is price-based according to EPA emissions ratings. This can be developed by working with parking services and UITS.
The funds generated from this charge would then be invested in improving the campus transportation system and promoting alternative modes of transportation (e.g. off-campus public transit options, a car share program), in order to further reduce associated emissions.
Vehicles above a certain emissions threshold (e.g. ‘cleaner’ vehicles) would be exempt from the surcharge. Individuals who carpool, regardless of vehicle type would also avoid any charges.
Self-Sustaining Forestry Program
The University of Connecticut owns approximately 2,130 acres of forest land in association with the Storrs Campus. These resources are presently managed by the Department of Natural Resources and the Environment for education, research, recreation, and forest products (e.g., timber, maple syrup, honey, and fuelwood). Although forest management plans are in place for each of the University-owned parcels, these plans are out-dated. Furthermore, these past management plans do not emphasize the carbon sequestration value of the forests, which is central to the University’s greenhouse gas emissions reduction plan. The establishment of a forest manager is necessary to maximize the carbon value of the University’s forest holdings.
To fund this position, it is recommended that the University establish an on-campus lifecycle forestry process. For example, the UConn forests can be managed to provide a continuous supply of hardwood lumber to the University facilities carpentry shop, which will result in cost savings to the University. These savings can then be directed toward supporting the forest manager position.
RECOMMENDATION:
Develop a parking pass surcharge according to vehicle emissions rating.
o Base surcharge rates upon EPA vehicle greenhouse gas emission ratings.
o Offer a waiver for individuals participating in a carpool program.
o Reinvest funds collected into alternative transportation systems and amenities to further reduce emissions.
RECOMMENDATION:
Develop a sustainable on-campus forestry program to fund a campus forest manager position.
o University forest resources are currently underutilized and, if properly managed, can offer greater economic and environmental benefits.
o A forest manager is required to maximize these benefits.
o Campus forestry operations can be self-sustaining and provide cost savings for the University.
o Proper management of UConn’s forest will result in increased carbon sequestration.

119
Properly conducted small-scale harvesting and production will result in greater monetary, carbon sequestration, and other silvicultural benefits than are presently realized. Establishment of this program will provide a sustainable example of locally grown products being incorporated into the University’s activities, serving as a unique educational opportunity for students, local industry, and forest landowners. Furthermore, the practice of harvesting timber and converting it into long-term durable products (while new trees grow to repeat the process) will increase the carbon sequestration, potential of the University’s forest resources and therefore, offset additional greenhouse gas emissions.
Student Utility/Sustainability Fee
Background Information
More than fifty colleges and universities nationwide have instituted student sustainability, or ‘green’, fees, including:
Appalachian State University
Chico State University
Colorado College
Connecticut College
Evergreen State College
Green Mountain University
Harvard University
Humboldt State University
Messiah College
Northland College
The University of Illinois
Tufts University
UMass Boston
University of California, Berkley
University of California, Santa Cruz
University of California, Santa Barbara
University of Colorado, Boulder
University of Idaho
University of Illinois, Urbana-Champaign
University of Kansas
University of Kentucky
University of North Carolina, Chapel Hill
University of Oregon
University of Tennessee
University of the South, Sewanee
University of Virginia
University of Wisconsin, Green Bay
Western University
Western Washington University
RECOMMENDATION:
Establish a student utility or sustainability fee.
o Colleges and universities across the country utilize student fees to help fund campus sustainability and, in particular, energy efforts.
o Engage UConn student leaders to develop a student fee appropriate for the Storrs campus (i.e., fee amount and purpose).
o Invest monies raised in expansion of sustainable student services (e.g., expanding sustainable transportation options, greening campus housing, increased production and use of renewable energy).

120
Fees are generally established by passing a referendum on a student government or student body voting ballot (Campus in Power 2008) and have ranged from less than $1 to over $25 per semester per student. Notably, UConn’s state peer, Connecticut College, charges a $25 student fee to fund renewable energy purchases. The majority of the universities achieved tangible results within only a few years of fee implementation. Measured successes include reduced reliance on fossil fuels, increased education, and financial benefits, all in accordance with the intended purposes of the fees. Research conducted on the above universities has indicated that these fees are generally student proposed, student supported, and student run. Their efficacy correlated with student involvement, as well as faculty and staff support.
Implementation at UConn
Based upon UConn’s fall 2008 Storrs campus enrollment, implementing a similar campus fee would generate approximately $17,500-$420,000 per semester depending on the established fee level. These funds could then be directed toward expanding student services (e.g., expanding sustainable transportation options and greening campus housing), maximizing campus utility systems, or increasing the production and use of renewable energies on campus. Although student fees have the potential for controversy, a well-designed fee that is collected at the request of students will significantly increase student-driven campus sustainability efforts. The University should, therefore, work with student environmental group leaders to determine interest in pursuing the establishment of a student sustainability fee.
Student Project & Activity Funding Sources
Arguably, the true goal of the ACUPCC is to educate this generation by involving them in the identification and pursuit of solutions to climate change. Therefore, students and student groups play a valuable role in assisting the University in achieving emissions reductions. More and more frequently, students are interested in implementing campus projects that will contribute to a reduction in campus emissions or heighten awareness of climate change issues. In fact, UConn became an ACUPCC signatory in direct response to student pressure!
Students bring enthusiasm, determination, creative solutions, and potentially even funding, to the challenge of tackling the campus carbon footprint. They should not be overlooked as an important component of campus sustainability efforts. Directly involving students in the emission reduction process does not only provide access to a valuable source of funding. It also encourages students to gain ‘real world’ experience by working alongside campus professionals to implement environmental solutions.
RECOMMENDATION:
Establish a plan or system to encourage the development of student-led carbon footprint reduction projects; utilize available student funding sources.
o Significant campus funding exists to support student activities and projects.
o Student-led projects provide students with valuable hands-on experience while driving reductions in campus emissions.
o The University can better support students interested in driving on-campus carbon reduction projects.

121
Campus funding for UConn student groups interested in implementing campus sustainability projects is more abundant that many may realize. The following organizations, for example, have funding regularly allocated through the University fee system to support the activities of students and student groups:
Undergraduate Student Government (USG)
Student Affairs Committee
Graduate Student Senate (GSS)
It is important to note that the above organizations are not focused specifically on funding campus sustainability improvements or environmental projects. However, if these efforts are properly presented, they are likely to fall within the broad umbrella of interests that the organizations are able to fund during a given academic year.
This is not an exhaustive list of funding opportunities available to students or student groups on campus. For example, campus and local chapters of regional or national organizations may also be eligible to apply for funding through these ‘parent’ organizations. Similarly, the UConn Chapter of the Public Interest Research Group (PIRG) collects funds through a ‘negative check-off’ system associated with the campus fee bill. All funds collected by PIRG are transferred directly to the state PIRG system rather than being reinvested in campus greening activities. Future efforts should focus on encouraging PIRG to reinvest this student money into the campus.
The University should be proactive about assisting student groups in identifying such opportunities. By working with students to develop and implement campus carbon footprint reduction projects, students can gain valuable hands-on experience including research and leadership skills. The University, in turn, benefits from a potential reduction in greenhouse gas emissions.
Alumni Funding Opportunities
The UConn alumni network contains thousands of individuals, many of whom possess a passion for environmental sustainability and climate change action. In addition, these individuals represent connections to thousands of private entities that may be positioned to support the University’s climate action efforts through direct financial donations or provision of technical and consulting expertise.
It is suggested that the EPAC arrange to discuss potential opportunities with the UConn Alumni Association.
RECOMMENDATION:
Engage alumni in campus climate action planning.
o Alumni can serve as a source of direct donations for campus greening projects.
o The alumni network represents a relatively untapped network of professional organizations through which campus climate action planning partnerships can be developed.

122
Voluntary Donation Program
Background
Students, faculty and staff at the University of Connecticut all possess campus ID cards as part of the University’s Husky One Card program. The cards are linked to a personal Husky Bucks debit account, which can be used in lieu of cash throughout campus. Husky Bucks are currently accepted in the dining halls and cafes, the student recreation facility, the laundry rooms of the residence halls, the University Co-Op, campus photocopying centers, and various other private businesses on and near campus. Many individuals prefer to use funds deposited into their Husky Bucks account instead of other payment methods for on-campus purchases.
Implementation at UConn
The Husky One Card program provides an excellent vehicle for the development of a voluntary donation system. The University’s milestones for emission reduction center on a targeted 2% decrease per year. Therefore, it is proposed that the University develop and implement a program that allows individuals to voluntary sign up for one of the following options. In the first option, students can make a one-time single swipe donation of $2. In the second option, students can sign up to be a ‘climate change champion’ and donate $0.02 for every dollar in purchases made during the semester. Students can be approached at various points during the academic year to enroll in the program, including at the time of ID issuance and during scheduled fundraising drives.
Given that donations are expected to be primarily from students, the funds should be directed towards activities and projects that will directly involve and benefit students. Therefore, it is proposed that the funds be transferred to a student loan program for on-campus projects that will either result in a reduction in campus emissions or further student research in climate change or a related field.
External Funding Opportunities
External funding can serve as an important source of ‘seed’ money for campus emissions reduction projects. Funding sources discussed in this section include state and federal utility rebates, grants, public-private partnerships, and municipal partnerships. Other funding sources are likely to exist as well, and should be evaluated for appropriateness as they are identified.
RECOMMENDATION:
Develop a system to encourage voluntary donations through the existing campus HuskyOne card system.
o All students, faculty, and staff are issued a HuskyOne card, which can be used as a debit card on campus and at nearby businesses.
o A ‘swipe for change’ program would encourage voluntary donations over the course of the academic year.
o Funds will be reinvested in programs and activities that will directly benefit students while reducing campus emissions.

123
State & Federal Opportunities
Many federal and state utility rebates, grant programs, and similar opportunities exist to support emission reduction and related efforts. The University should be proactive about identifying and acquiring these funding sources. For example, the University can engage Department of Administrative Services contractors to perform lighting and HVAC audits when Clean Energy Efficiency Fund monies can be used to finance projects.
As sources constantly change over time with availability and legislation, a list is not included in this section. However, a list of state and federal resources, which may be appropriate for funding the strategies described, is provided at the end of this section.
Private Funding Sources
The private sector has historically served as a significant source of funding for university initiatives nationwide. Many of the University of Connecticut’s present research endeavors are the result of successful partnerships between the University and private parties. In 2007, for example, Pratt & Whitney donated $10,000 to the University to fund the on-campus biodiesel laboratory, resulting in the successful generation of 2,600 gallons of B100 per year. Similarly, the 21st Century Jobs Act, which became law in 2006, authorized $4 million in state funding to create a public-private partnership called the Eminent Faculty Program. This enabled the University to hire six national experts of alternative energy technology in 2008.
Private funding sources will continue to be a valuable resource for the University and should be pursued to help implement the recommendations of this plan. Potential funding mechanisms include:
Direct Grant Opportunities Many organizations will offer direct funding for campus projects. As an example, the University can utilize the incentive programs currently available from Connecticut Light & Power (CL&P) and Ameresco to develop a list of the top ten opportunities for energy improvements for building envelopes. This list should then be narrowed to the projects executable within each that will maximize the incentive usage and/or provide the quickest payback per investment. As with state and federal funding opportunities, grant money availability changes on an annual basis and must be constantly pursued to be a successful source of financing.
Performance Contracts & Energy Service Companies (ESCOs) Performance contracts are an increasingly popular way to ensure return on investments while minimizing university responsibility. Rather than pay the up-front cost required to install energy efficient technologies in a facility, the University enters into a performance
KEY POINTS:
o Federal and state utility rebates and grant programs offer funding to support climate change planning efforts.
o Available funding sources will emerge and change over time.
o In order to capitalize on these opportunities, the University must be proactive about identifying opportunities.
KEY POINTS:
o Private funding has historically been an important source of campus funding and will continue to serve as an important source of funding for campus carbon footprint reduction efforts.
o Private funding can occur in various forms, including:
- Direct grant opportunities
- Performance contracts
- Third party financing agreements
- On-campus demonstration partnerships

124
contract with an ESCO. The ESCO then finances the initial project costs with a guarantee of future utility savings to the University. In exchange, the University agrees to return a portion of these savings to the ESCO as payment. Generally, the ESCO is responsible for long-term (i.e., 5-20 years) management of the facilities and any losses incurred if the project does not produce the expected savings.
Third Party Financing Options Power purchase agreements with renewable energy companies, for example, are an increasingly popular strategy for decreasing the campus energy footprint. Under the agreement, a third party installs a renewable energy system on campus for free and retains ownership of the system. The University enters into a long-term contract to purchase electricity from the system, often at a reduced rate. The private entity benefits from energy sales and tax breaks. The University benefits through access to an on-campus demonstration system (and the associated research and education opportunities), the ability to purchase electricity at a reduced rate, and the avoidance of the capital investment otherwise necessary to install and operate the system. If the University purchases the associated RECs, it will also be able to retain the carbon benefits of the purchase. The UConn Torrington campus is currently considering implementing a wind energy project through third party financing.
Other On-Campus Partnerships On-campus public-private partnerships can take numerous other forms beyond those listed above. In general, the University provides a location for the project and access to existing resources (e.g., space, personnel, equipment) while the private entity provides the capital investment. Both parties benefit from positive publicity, returns on investment, and research findings.

125
Municipal Partnerships
Many of the strategies proposed in this plan will require cooperation between the University and the surrounding towns. This is particularly true for those strategies that seek to minimize transportation-related emissions through improved mass transit and increased local housing. By working together, the University and the local municipalities can expand access to resources and better brainstorm and implement solutions to regional transportation-related greenhouse gas emissions.
White Tag Programs
While not a funding source, there are long-term opportunities for the University to achieve greenhouse gas emission reductions through partnership with the local community. ‘White tag’ programs are a creative approach to acquiring carbon offsets: an institution invests in the surrounding community through a greenhouse gas emission reduction effort (e.g., tree plantings, solar panel installations, homeowner energy efficiency education programs, etc.) and, in turn, obtains the credit for any emission reductions realized, including those that occur off-campus. The municipality retains the benefit of the investment (i.e., the aesthetic or environmental benefits of the trees, the power generated by the solar panels, or the energy savings associated with conservation behavioral changes) while the University is able to report an offset or reduction in its annual greenhouse gas inventory. Compared to other offset programs, white tag programs allow the University to not only see the impact of its investment but also to indirectly benefit from the program (i.e., through improved community relationships and research opportunities).
KEY POINTS:
o Municipalities and universities have access to different funding pools. By partnering, each party can improve access to funding and increase the success of mutually beneficial projects.
o Transportation issues will require coordination with local municipalities.
o University-municipality ‘white tag’ programs, while not a funding source, are a creative and attractive alternative to purchasing carbon offsets.

126
Related Resources:
Database of State Incentives for Renewables & Efficiency (DSIRE): http://www.dsireusa.org/
o DSIRE Federal Incentives/Policies for Renewables & Efficiency: http://www.dsireusa.org/incentives/index.cfm?State=US&ee=1&re=1
Grants.gov (federal grants search engine): http://www07.grants.gov/search/basic.do
The Environmental Protection Agency (EPA) - http://www.epa.gov/epahome/grants.htm
U.S. Department of Agriculture - http://www.csrees.usda.gov/fo/funding.cfm
U.S. Department of Energy (DOE), Energy Efficiency & Renewable Energy (EERE) Office - http://www1.eere.energy.gov/financing/
The National Science Foundation (NSF) - http://www.nsf.gov/funding/
State Grant Programs:
o CEF - Community Innovations Grant Program
o CCEF - On-Site Renewable DG Program
o CCEF - Project 150 Initiative
o DPUC - Capital Grants for Customer-Side Distributed Resources
State Loan Programs:
o CHIF - Energy Conservation Loan
o DPUC - Low-Interest Loans for Customer-Side Distributed Resources
State Rebate Programs:
o CCEF - Affordable Housing Initiative Solar PV Rebate Program
o CCEF - Solar PV Rebate Program
o Furnace and Boiler Replacement Rebate Program
Utility Grant Program: The United Illuminating Company - Energy Conscious Blueprint Grant Program

127
Utility Rebate Programs:
o Connecticut Light & Power - Commercial Energy Efficiency Rebates
o Connecticut Light & Power - Energy Opportunities Efficiency Program
o Connecticut Light & Power - Express Rebate Programs
o Connecticut Light & Power - Operation and Maintenance Program
Renewables Portfolio Standard: Renewable Portfolio Standard
Industry Recruitment/Support:
o CCEF - Operational Demonstration Program
o New Energy Technology Program
Leasing/Lease Purchase: CCEF - CT Solar Lease Program
Property Tax Exemptions: Property Tax Exemption for Renewable Energy Systems
Appliance/Equipment Efficiency Standards: Energy Efficiency Standards for Appliances
Building Energy Code: Connecticut Building Energy Code with Green Building Provisions
Contractor Licensing: Solar and Wind Contractor Licensing
Energy Standards for Public Buildings: Green Building Standards for State Facilities
Generation Disclosure: Fuel Mix and Emissions Disclosure
Green Power Purchasing/Aggregation: Connecticut - Green Power Purchase Plan
Net Metering: Connecticut - Net Metering
Public Benefits Fund:
o Connecticut Clean Energy Fund
– Connecticut Energy Efficiency Fund

128
References
Association for the Advancement of Sustainability in Higher Education (AASHE). 2005-2009. Campus Sustainability Revolving Loan Funds and Similar Funds. Accessed 29 July 2009 at http://www.aashe.org/resources/rlfs.php.
Campus In Power. November 2008. Raise the Funds Campus Action Toolkit: A Student and Administrator’s Guide to Funding Mechanisms for Campus Sustainability Initiatives. Pp 50. Available for download at http://www.aashe.org/documents/resources/Raise_the_Funds_Toolkit.pdf.
State of Connecticut Department of Public Utility Control (CTDPUC). 2008. Connecticut Renewable Portfolio Standards Overview. Accessed on 28 July 2009 at http://www.ct.gov/dpuc/cwp/view.asp?a=3354&q=415186.
UConn Foundation. 2006. “New Fund To Support “Green” Buildings At UConn.” Momentum (UConn Foundation newsletter). Winter 2006. Accessed 28 July 2009 at http://www.foundation.uconn.edu/basepage.asp?page=0174

129
Section 5: Education, Research & Outreach
The University of Connecticut Climate Action Plan:
Guiding the Path toward Carbon Neutrality
Storrs Campus August 2009
130
Education, Research & Outreach
Table of Contents
Introduction ................................................................................................................................. 131
Undergraduate Education ....................................................................................................... 131
Research ........................................................................................................................................ 135
Green Depot Campus Initiative ............................................................................................................. 136
Outreach ........................................................................................................................................ 136
Conclusion .............................................................................................................................. ......139 UConn Case Study: Annual ‘EcoMadness’ Residence Hall Competition.............................................140
Chapter cover photo was taken by UConn undergraduate student Emily Moser (2006-2007 UConn Environmental Expressions contest winner in the Photography category).
131
Introduction
The American College and University Presidents Climate Commitment reinforces the concept that the campus is a living, learning laboratory – both inside the classroom and out. The Commitment therefore requires signatories to address how they will integrate concepts of environmental sustainability and climate change awareness into day-to-day operations and educational activities.
The University of Connecticut has a strong commitment to the integration of environmental principles into the student learning experience. As a land and sea grant institution, UConn is committed to active engagement with the larger community as well as the promotion of the state’s economic development and well-being through the advancement of new science and the protection of natural resources. Furthermore, the most recent academic plan, Our World, Our People, Our Future: The University of Connecticut Academic Plan 2009-20141, identifies the environment as one of three ‘focus areas of excellence’. In fact, the Academic Plan specifically called for the development of ‘a university plan to reduce our carbon footprint that involves university staff, students and faculty as well as community members and leaders.’
This section is meant to illustrate several examples of how the University can further integrate climate change and environmental sustainability concepts into academic, research and outreach efforts. However, the Academic Plan remains the University’s primary guidance document regarding the University’s vision for academic, research, and outreach endeavors. The examples provided in this section are meant to serve as a starting point to stimulate discussion and action. The recommendations to follow focus primarily on undergraduate education and experiences.
Undergraduate Education
The UConn Academic Plan notes that, ‘problems of environmental sustainability cannot be addressed solely by grasping the scientific principles that lead to technical solutions. Successful resolution also requires understanding their ethical, social, legal, and cultural implications from a global perspective.’ Similarly, climate change is a complex issue and the ramifications of inaction will spread beyond direct environmental consequences. Educating how social factors influence climate change drivers and solutions, as well as teaching how to understand climate change impacts on societal patterns are important aspects of interdisciplinary environmental education.
The Academic Plan calls for the University to leverage our emerging excellence in environmental studies to offer focused programs that will enhance the ability of our students to understand and solve critical environmental and ecological issues. Similarly, the Plan recognizes that learning cannot be a static process, isolated from ‘real world’ experiences. Based upon the guidance provided by the Academic Plan, several programs designed to improve campus environmental awareness are currently in development, including:
1 The University’s Academic Plan can be downloaded at http://www.academicplan.uconn.edu/.

132
Development of an interdisciplinary Environmental Studies undergraduate program.
An ad hoc group of faculty working under the auspices of the Environmental Policy Advisory Council (EPAC) and the Climate Action Task Force (CATF)’s Environmental Literacy Workgroup are presently exploring the development of an undergraduate environmental studies program. The essential feature of the proposed Environmental Studies (ES) major is the interdisciplinary examination of the relationship between humans and the environment. Drawing from resources in the College of Liberal Arts and Sciences, the College of Agriculture and Natural Resources, the School of Engineering, and the School of Fine Arts, students would be introduced to varying ideas about nature across cultures and time periods, as expressed in policy, works of intellectual history, and creative responses to the environment. Under the proposed ES program, students will study, debate, and articulate current issues of global citizenship, including environmental justice, sustainability, and the communication of environmental concerns to the public.
If developed, it is recommended that the proposed program include at a minimum one or more courses related to climate change, and preferably, an individual concentration relating to climate science and developing an understanding of global climate change.
Establish an environmentally themed living and learning community.
Learning Communities comprise a research-proven means of pedagogy and engaged learning. Learning Communities allow students to take what they have learned in the classroom (theory) and apply it (practice) to campus, community, and/or world problems. The size and scope of learning communities varies, but they all require faculty leadership and a strong academic component that could include one or two credit seminars and/or course clusters related to an individual community’s theme.
Building on a rich tradition of learning communities, the University’s first interdisciplinary, environmentally themed living and learning community, EcoHouse, will open during the fall 2009 semester. EcoHouse will house approximately 120 students, and is designed to connect students across academic disciplines who share an interest in environment issues (e.g., environmental economics, sustainable agriculture, nature writing, etc.) Residents will participate in a seminar course that will acquaint them with environmental issues and resources on the UConn campus and in the local community. Through hands-on experience ‘greening’ the infrastructure of the residence hall, to guided nature hikes, to faculty led discussion, students will be immersed in interdisciplinary environmental learning.
It is recommended that the leaders of EcoHouse work with campus climate change experts to develop climate change related programs for the students participating in EcoHouse. Building improvement efforts should be tied into educational opportunities designed to increase student understanding of their carbon footprint.
Establish a UConn sustainable farming living-learning experience for students.
Food systems form the basis of societies. Many individuals, however, have become increasingly disconnected from their food sources. There is a growing awareness of the need to reexamine and redefine how we produce and distribute our food.
Interest in sustainable agriculture has grown tremendously at the University of Connecticut over the past several years. The University’s Dining Services now runs Local Routes, a program devoted to increasing the use of locally produced food sources. The University also boasts a highly successful student-run on-campus garden led by the EcoGarden Club. In addition,

133
membership of the newly formed Real Slow Food student group at the University has increased at an unprecedented rate.
Given this demonstrated interested in sustainable agricultural systems, a group of faculty and staff are developing a proposal for an on-campus, student-led sustainable agriculture living-learning experience. A potential location and building have been identified on a University-owned agricultural parcel.
Given the University’s existing strengths in agricultural education and climate change education, it is recommended that the advisory group developing this initiative ensure the inclusion of faculty members with expertise in these areas (e.g., climate change science, agricultural science, food policy). Proposed academic opportunities should strive to cultivate an increased understanding of climate change and the potential impacts on global food production systems.
In addition to the above programs, the University can further improve environmental awareness and expand climate change understanding through the following recommended actions and programs:
Expand the number of introductory energy courses available to students.
Introductory level and 1-credit elective courses are an excellent way to introduce students to energy themed sustainability concepts such as energy generation and conservation. In particular, this is a valuable way to reach new students who may be more susceptible to behavioral changes. These courses should be taught without assumption of prior knowledge and should encourage exploration of interdisciplinary subject matter. Work with First Year Programs (FYP) to identify faculty members interested in developing such courses and with the Academic Center for Entering Students (ACES) to help with the promotion of these courses to new students. Distribute a list of campus ‘energy experts’ (e.g. faculty, staff, and graduate students) to facilitate the integration of guest lectures and on-campus ‘field trips’ into courses.
Encourage senior design projects or Honors theses that increase campus energy efficiency and/or conservation.
To further enhance the student learning experience while reducing the campus carbon footprint, the University should strive to support the development of student projects that directly contribute to campus energy efficiency and conservation. The development of low-cost, basic support tools, such as the following, would assist with this goal:
o Develop a list of faculty energy expertise and distribute to students interested in conducting campus research.
o Create an online clearinghouse of faculty-proposed student research projects. Students could then browse proposed research topics in order to identify both a project and an advisor for their senior design or thesis work.
o Develop a small grant program to fund student projects that will lead to demonstrable energy savings for the University.
Expand the University’s academic offerings related to sustainable design and green building. It is recommended that the University provide students with learning opportunities that match the University’s own sustainable development goals. Expanding academic offerings related to sustainable design and green building will provide students with an opportunity to learn about

134
current development practices in the design and construction fields, and to graduate with the education necessary to implement these principles throughout the country.
It is specifically recommended that the University develop one or more classes in sustainable design. It should be the goal of the University to further expand offerings over time toward the long-term goal of establishing an undergraduate minor or certificate program in sustainable design.
Involve Students in campus greening through the identification of research and educational opportunities.
It is recommended that the University leverage student interest in the ‘campus greening’ process by organizing hands-on projects, through which students would assist with the implementation of green building renovations across campus (e.g. green roof installations). Relevant student organizations, such as the EcoGarden Club and the Green Building Club, should be involved in order to encourage student leadership in the organization and implementation of appropriate campus projects (e.g., the creation of a sustainable dwelling project). By encouraging the integration of student research into campus greening efforts, the University will be acting to directly advance the field of green building.
Develop a green job training program; integrate with campus renewable energy and energy efficiency efforts.
The green job market is expanding at an unprecedented rate – According to the Pew Charitable Trusts, between 1998 and 2007, growth in the emerging clean energy sector grew nearly two and half times faster than overall job growth. Universities that do not quickly position themselves to capitalize on this opportunity may lose highly qualified students and faculty to better situated institutions. Therefore, in 2008 ten new faculty members with research interests focusing on alternative and/or renewable energies were hired under the University’s Eminent Faculty Program. The program, which is a public-private partnership between the University, UTC Power, the Northeast Utilities Foundation and Fuel Cell Energy, is designed to promote economic development and help build the industry's future energy workforce.
To remain competitive and on the forefront of renewable energy and related research, it is recommended that the University continue to expand upon existing resources and programs to ensure that our students leave prepared to enter this new workforce.
Develop a student-led building energy audit program.
Development of a student energy audit program would not only provide a hands-on learning experience for students, but also will provide the University with an inexpensive, ongoing method of identifying building inefficiencies. Students would be trained to conduct basic energy audits and then be assigned to one or more buildings for a semester. Working with campus professional staff, students would document sources of energy use, identify inefficiencies, and develop recommendations for corrective actions or improvements.
Identify and explore unique research and education opportunities related to the University’s forest holdings. The University’s forest resources are currently undervalued from both an economic and academic standpoint. It is therefore recommended that the University identify and pursue unique activities related to the UConn Forest holdings that would not only increase on-campus

135
carbon sequestration but also provide additional environmental, academic, social and economic benefits. Existing and proposed examples include:
o Development of a lifecycle-based forestry process. There is a real opportunity to create a lifecycle process where forest products are produced on campus by UConn students. Properly conducted small-scale harvesting and production can result in greater carbon sequestration and other silvicultural benefits than a ‘hands off’ management approach. For example, portions of the UConn forests could be managed to provide a continuous supply of hardwood lumber to the University Facilities Carpentry shop. This activity would not only provide a sustainable example of locally grown products being incorporated into the University’s activities, but would serve to also further sequester carbon in long-term durable products (while new trees grow to repeat the process). Such a project would serve as a unique educational opportunity for students as well as an educational example for local industry and the forest landowners in the state that own 83% of Connecticut’s forests. Costs and revenues, land impacts, biological and ecological responses and social and educational impacts of forest management activities could easily be tracked and studied, involving further involvement opportunity for students investigating questions of sustainability across a range of disciplines, including the natural and social sciences.
o Establishment of a timber sports team. During the 2007-2008 academic year, a UConn Timber Sports Team was established in association with the Department of Natural Resources and the Environment. The team, which competes in lumberjack sports which require accuracy, precision and endurance, relies upon the University’s forest resources to practice and hold competitions.
Additional research opportunities relating to plants, animal habitat, forest hydrology, soils, diseases, resource economics, and other fields are also possible.
Increase the number of environmentally-themed study abroad and international exchange program opportunities available to students.
It is recommended that the University work to assist the campus Study Abroad Office to specifically identify and market programs that cultivate an increased understanding of global environmental issues, in particular climate change. In addition, the University should encourage partnerships with institutions abroad to facilitate faculty participation in international exchange programs and conferences.
Research
The University’s Academic plan emphasizes the need for expanded interdisciplinary research. The University already has a strong tradition of environmental research, including numerous faculty members focused on climate change science, modeling, alternative energy and distribution systems. It is recommended that the University continue to support the development and improvement of these programs as outlined in the Academic Plan.

136
UConn’s Green Depot Campus Initiative: Taking Breakthrough Ideas to Large Scale Validation The University should continue to strengthen its research, at the basic science and engineering level, into the sustainable generation, transmission and distribution of energy, and the demonstration and development of these technologies, as proposed in the “Green Depot Campus Initiative.” UConn’s Depot campus is located approximately two miles from the Storrs campus on a 440-acre parcel bisected by Route 44. It was conveyed by the Connecticut Department of Public Works to UConn in 1993 and consists of the property and buildings of the former Mansfield Training School. The Center for Clean Energy Engineering (C2E2) and the Connecticut Transportation Institute are both located on the Depot Campus. Most utilities on the property are at, or near, the end of their life and will need to be replaced or upgraded in the not-too-distant future. Given the opportunity to redefine this parcel, the School of Engineering, the College of Agriculture and Natural Resources and the College of Liberal Arts and Sciences are working together on a proposal titled Green Depot Campus Initiative. The proposed initiative, which will include a partnership among UConn, the State of Connecticut, industry and the federal government, will seek to conduct research towards the development of clean and efficient energy systems capable of operation utilizing a multitude of conventional and renewable fuels ranging from hydrogen to biomass and hydrocarbons. The technology development under this initiative will lead to the fundamental understanding of basic scientific and engineering principles that will subsequently lead to the development of engineered systems for concept validation. Features related to efficiency, carbon neutrality, environmental impact and energy sustainability will be studied and modeled at the
“community level.” The goal is to take a holistic approach that facilitates technology transfer and collaborative research into green energy sources, smart storage, sequestration of CO2 and reduction of
the generation of other greenhouse gases, as well as water management. Initially planned to validate and demonstrate a one megawatt (MW) system that will emulate a local community, the campus will be developed to allow for engineered scaling up to five MWs. The campus will utilize power generation based upon adaptive fuel switching and energy storage to assist in utility load leveling using a smart grid.
Outreach
Outreach efforts can help to increase awareness of climate change and environmental sustainability. In particular, campus outreach efforts can influence behavioral changes. To ensure the most efficient use of resources, assessments should be performed before and after the implementation of outreach programs in order to track changes in behavior and therefore gauge the effectiveness of the outreach program.
The following actions and programs are recommended outreach programs to further increase campus environmental sustainability and climate change awareness efforts:
Better integrate green building and low impact design efforts into university education and outreach efforts.
137
‘High profile’ buildings are useful locations to not only demonstrate the University’s commitment to reducing our carbon footprint, but also to educate the community. Athletic facilities, entertainment facilities, and residence halls, in particular, are spaces that are frequently occupied by large groups of individuals. By advertising and labeling these buildings’ “green” features (e.g., signage, energy dashboards), individuals who otherwise might not be exposed to concepts of climate change and environmental sustainability can be interactively educated.
Residence halls, in particular, should be perceived as opportunities to develop living-learning laboratories. Student competitions, similar to the University’s annual EcoMadness residence hall competition, provide active learning opportunities for students, while providing additional incentives to improve efficiency. Similarly, making real time monitoring of energy and water use in residences visible to the public throughout the year, can help to make residents more aware of their footprint while at UConn. EcoHouse, the environmentally themed living-learning community scheduled to open fall 2009, will serve as an excellent learning platform for transforming current residence halls to living-learning laboratories.
Develop a department/building monitor program to identify opportunities to increase energy efficiency and conservation.
Identify staff or faculty to serve as a department or building energy monitors. Currently, many buildings have ‘building managers’ who serve as a point contact in the case of interruption to building services (e.g. electricity, water) to assist with communication to building occupants. The proposed ‘energy monitors’ would expand upon the existing system, training monitors to not only identify and report energy-related problems in their assigned building, but also to communicate energy conservation practices to building occupants.
Place energy dashboards in highly trafficked campus buildings.
Electronic displays, also called energy ‘dashboards’, are an important tool in energy conservation outreach and education. Dashboards are highly visible reminders to building occupants that energy is a valuable resource. By arranging a series of dashboards throughout campus, occupants are able to compare their building’s energy use with real-time data from other buildings on campus. These dashboards can also be integrated with regular PSA-type energy saving ‘tips.’ Dashboards will also inform campus visitors and potential students that UConn is serious about energy conservation.
Increase the number of in-residence hall education opportunities and projects.
College students are bombarded with messages and information throughout the course of the academic year. Ensure that energy conservation remains a concern and is regularly practiced within the residence halls through increased energy conservation outreach efforts. Increase the availability and diversity of sustainable living and energy conservation trainings and resources available to hall directors and community assistants. Individual halls should be encouraged to approach the task of increasing energy awareness in unique and different ways.
o Conduct routine energy conservation challenges within the residence halls. Since fall 2006, the University has conducted an annual 3-week energy and water conservation challenge in the residence halls. (See ‘UConn Case Study: EcoMadness.’) Given that demonstrated energy savings have been shown to occur during the month in which the challenge is held, expand this challenge across campus, increasing the duration of the

138
competition. Track changes in energy use before, during, and, in particular, after, the challenge; determine whether the exercise has a lasting impression on student behavior or whether students need to be consistently reminded to use energy wisely.
o Implement housing based educational/demonstration opportunities. The University is fortunate to have a wealth of faculty and staff expertise relating to renewable energies, including solar, geothermal, biofuels, and fuel cell technology. While a significant portion of UConn students are directly enrolled in an academic program which will increase their awareness and knowledge of these technologies, the vast majority are not. Therefore, in order to reach a wider audience, encourage residential life-research partnerships that result in housing-based education and demonstration opportunities.
o Develop a student eco-rep program. Identify a group of students to serve as energy and water monitors in their residence halls. These individuals will work closely with Residential Life staff as well as Facilities staff to identify inefficiencies in building utility systems (e.g. leaks, malfunctioning lights) and to identify and implement programs and activities focused on encouraging student behavioral changes. These students may serve voluntarily, for independent research credits, or for a small stipend.
Work with Athletics to renewable energy displays into campus athletic events.
Athletic events draw large volumes of people, including potential students and campus donors, to the campus and off-campus University facilities. By powering athletics lighting with nearby renewable energy demonstration units (e.g. solar, fuel cell, biomass, wind) the University can not only reduce its carbon footprint and energy demand, but can also educate thousands more individuals each year about renewable energy technologies and campus sustainability efforts.
Establish additional on-campus gardens for UConn community members.
On-campus gardens provide an excellent opportunity for students to learn about food production and agriculture, teach organic and low-impact farming techniques, build community, and encourage healthier eating and activity patterns. Presently, the EcoGarden Club operates a highly successful on campus garden. Unfortunately, the garden is located on the fringes of campus, and as a result, many students may remain unaware of this opportunity. Furthermore, it is important to educate not only those students who are passionate about food production and local agriculture, but perhaps, more importantly, those who are not. Passive education can be achieved by locating community gardens in high visibility areas on campus. The University should seek to provide additional community garden opportunities for community members within the campus core. The residence hall experience, in particular, could be greatly enhanced through the development of a complex garden. The newly established EcoHouse, which is located near the campus core, would serve as an excellent pilot location.
Identify additional opportunities to purchase, produce, and serve locally-grown food sources.
Over the past few years, the University has rapidly expanded and promoted the use of locally-grown food sources, including those grown or harvested right here on the main campus. Honey, cage-free eggs, cheese and ice cream are just some of the food products produced here at the Storrs campus. In addition, the Forestry and Wildlife Club of the Natural Resource and the Environment (NRE) Department works with university faculty and Cooperative Extension educators to produce locally grown maple syrup. In 2006, Whitney Dining Hall became the home of the award-winning Local Routes Program, which sources and serves local sustainable

139
foods, including honey from a campus apiary. The previously mentioned EcoGarden Club works with the Local Routes Program to provide campus-grown produce to the dining halls throughout the growing season. The Workgroup commends the University and the individuals responsible for the local, sustainable food efforts to-date and encourages the eventual expansion of these ideals to all dining halls on campus.
Develop and expand existing transportation-based education and outreach programs.
The University should work to expand existing transportation-based education and outreach programs. These programs should be designed to promote a pedestrian and bicycle friendly campus and discourage the use of personal vehicles (e.g., cars, trucks, etc.) In particular the University should:
o Work with University Communications to expand existing outreach programs regarding the available alternative transportation options on campus.
o Develop a campus bicycling safety and education campaign.
o Work with on-campus athletic programs (e.g., Bodywise, UConn Outdoors) to develop campus walking and bicycling challenges, bicycle related giveaways and workshops related to bicycle safety and maintenance.
Conclusion
As mentioned previously, the University’s Academic Plan is the official guidance document regarding campus education, research, and outreach efforts. While the Academic Plan places a high priority on ensuring environmental education, the proposed actions above are specifically recommended to increase campus awareness of climate change, personal carbon footprint, and related environmental sustainability issues. This is not an exhaustive list. The University is encouraged to identify and pursue additional opportunities as the present themselves.

140
UConn Case Study: Annual ‘EcoMadness’ Residence Hall Competition
Since the fall of 2006, UConn has held student "EcoMadness" competitions. During these competitions, residence halls compete against each other to achieve the greatest water and energy savings over a three week period. Residential areas are selected to target the greatest number of first-year students possible. Water and energy use is monitored before and during the competition. Data is then compiled and the amount of water and energy saved per person and per day is calculated for each building.
In 2008, building energy use was reduced, on average by approximately 10% by those buildings participating in the
EcoMadness competition. The largest reduction achieved was a 28.3% decrease in total building energy use over the 3-week period. Water use was reduced by just under 6% on average, with the highest reductions achieved approaching 10%.
The UConn Office of Environmental Policy (OEP) and Resident Life Office advertised extensively for the competition. Articles were published before, during, and after the competition in the student newspaper, a daily publication on campus. The University also held evening environmental awareness events throughout the competition; students who attended earned additional points for their building, which were factored into the final standings.
The most successful means of advertising was getting students to volunteer as an "Eco-Captain" for their residence hall. Eco-Captains were trained by UConn OEP staff and were responsible for spearheading the initiative within their building. Eco-Captains served as a source of motivation to their peers, leading various activities during the three weeks, including a door-to-door CFL light bulb giveaway and weekly postings displaying building rankings. As further incentive, the Eco-Captain deemed "Best Motivator" was also given an individual prize.
Important Lessons Learned. EcoMadness is an evolving program. Important "lessons learned" to-date include:
Involve the residence hall Community Assistants (CAs). These individuals possess important knowledge about key building features, and potential student leaders within their communities. As paid University staff, CAs also have the ability to community directly with supervisors in Residential Life and/or Facilities Operations about issues such as leaking faucets, or malfunctioning lights.
Get early buy-in from your Residential Life Office and Facilities Operations Department. Working with Residential Life and Facilities early on in the process ensures a smooth communication process. Staff members were allowed input into the competition design process and were informed that outside individuals would be working with the students living in the residence halls.
Ensure adequate unique advertising to draw attention to the program. On college campuses, students are constantly bombarded with messages from competing arenas. Planning unique advertising and outreach events such as the door-to-door CFL giveaway and evening community events, allows for direct, dynamic communication with students.
A‐1
APPENDIX A: THE AMERICAN COLLEGE AND UNIVERSITY PRESIDENTS CLIMATE COMMITMENT
We, the undersigned presidents and chancellors of colleges and universities, are deeply concerned about the unprecedented scale and speed of global warming and its potential for large‐scale, adverse health, social, economic and ecological effects. We recognize the scientific
consensus that global warming is real and is largely being caused by humans. We further recognize the need to reduce the global emission of greenhouse gases by 80% by mid‐century at the latest, in order to avert the worst impacts of global warming and to reestablish the more stable climatic conditions that have made human progress over the last 10,000 years possible.
While we understand that there might be short‐term challenges associated with this effort, we believe that there will be great short‐, medium‐, and long‐term economic, health, social and environmental benefits, including achieving energy independence for the U.S. as quickly as possible.
We believe colleges and universities must exercise leadership in their communities and throughout society by modeling ways to minimize global warming emissions, and by providing the knowledge and the educated graduates to achieve climate neutrality. Campuses that address the climate challenge by reducing global warming emissions and by integrating sustainability into their curriculum will better serve their students and meet their social mandate to help create a thriving, ethical and civil society. These colleges and universities will be providing students with the knowledge and skills needed to address the critical, systemic challenges faced by the world in this new century and enable them to benefit from the economic opportunities that will arise as a result of solutions they develop.
We further believe that colleges and universities that exert leadership in addressing climate change will stabilize and reduce their long‐term energy costs, attract excellent students and faculty, attract new sources of funding, and increase the support of alumni and local communities. Accordingly, we commit our institutions to taking the following steps in pursuit of climate neutrality:
1. Initiate the development of a comprehensive plan to achieve climate neutrality as soon as possible.
• Within two months of signing this document, create institutional structures to guide the development and implementation of the plan.
• Within one year of signing this document, complete a comprehensive inventory of all greenhouse gas emissions (including emissions from electricity, heating, commuting, and air travel) and update the inventory every other year thereafter.
• Within two years of signing this document, develop an institutional action plan for becoming climate neutral, which will include:
‐ A target date for achieving climate neutrality as soon as possible. ‐ Interim targets for goals and actions that will lead to climate neutrality. ‐ Actions to make climate neutrality and sustainability a part of the
curriculum and other educational experience for all students. ‐ Actions to expand research or other efforts necessary to achieve climate
neutrality. ‐ Mechanisms for tracking progress on goals and actions.

A‐2
2. Initiate two or more of the following tangible actions to reduce greenhouse gases while the more comprehensive plan is being developed.
• Establish a policy that all new campus construction will be built to at least the U.S. Green Building Council’s LEED Silver standard or equivalent.
• Adopt an energy‐efficient appliance purchasing policy requiring purchase of ENERGY STAR certified products in all areas for which such ratings exist.
• Establish a policy of offsetting all greenhouse gas emissions generated by air travel paid for by our institution.
• Encourage use of and provide access to public transportation for all faculty, staff, students and visitors at our institution
• Within one year of signing this document, begin purchasing or producing at least 15% of our institution’s electricity consumption from renewable sources.
• Establish a policy or a committee that supports climate and sustainability shareholder proposals at companies where our institution's endowment is invested.
• Participate in the Waste Minimization component of the national RecycleMania competition, and adopt 3 or more associated measures to reduce waste.
3. Make the action plan, inventory, and periodic progress reports publicly available by providing them to the Association for the Advancement of Sustainability in Higher Education (AASHE) for posting and dissemination.
In recognition of the need to build support for this effort among college and university administrations across America, we will encourage other presidents to join this effort and become signatories to this commitment.
Signed, The Signatories of the American College & University Presidents Climate Commitment
B-1
APPENDIX B:
2008-2009 UCONN CATF WORKGROUPS & MEMBERS
ENERGY WORKGROUP
Co-Chairs:
Ronald Gaudet, Energy Utility Services Manager, Facilities Operations
Dr. Mehdi Anwar, Professor, Electrical & Computer Engineering
Workgroup Participants:
Alexandra Cooper, Undergraduate Student, Chemical Engineering
Benjamin Maycock, Electronic Integrated Control Systems Technician, Facilities Operations
Damiana Serafini, Graduate Student, Agricultural & Resource Economics
Denise Beal, Assistant Director, Dining Services
Dennison Nash, Faculty Emeritus, Anthropology
Douglas Cooper, Professor, Chemical, Materials & Biomolecular Engineering
Dylan Kletter, Alumni, UConn Law School
Ethan Butler, Undergraduate Student, Mechanical Engineering
Eugene Roberts, Director, Facilities Operations
Frank Simao, Facilities Professional, Facilities Operations
George Sabo, Electrical Shop Supervisor, Facilities Operations
Jay Johnston, Residence Hall Complex Manager, Residential Life
Jennifer Sayers, Sustainability Coordinator, Environmental Policy
Jim Missel, Facilities Professional, Law School Dean's Office
John Bennett, Associate Professor & Associate Dean, Mechanical Engineering
Lee Langston, Faculty Emeritus, Mechanical Engineering
Lisa Sarubbi, Undergraduate Student, Environmental Engineering
Mark Mazzola, Owner, First Choice Construction; Mansfield Community Member
Martin Fox, Professor, Department of Electrical and Computer Engineering
Melissa Tweedie, Undergraduate Student, Chemical Engineering
Michelle Przybylek, Undergraduate Student, Environmental Engineering
Mike Accorsi, Professor & Department Head, Civil & Environmental Engineering
Mike Pacholski, Assistant Director, Facilities Operations
Nate Wallshein, Undergraduate Student, Environmental Science Program; Intern, Environmental Policy
Penny Guerin, Procurement Contracts Manager, Purchasing & Central Stores
Peter McQueeney, Energy Management Systems Supervisor, Mechanical Services
Philip Lang, Agent, Purchasing & Central Stores
Rachelle Howard, Graduate Student, Chemical Engineering
Ross Friedberg, Graduate Student, UConn Law School; President, UConn Law Society
Scott Gallo, Facilities Development Manager, Residential Life
Stanley Nolan, Energy Service Engineer, Facilities Operations
Stefan Wawzyniecki, Manager, Environmental Health & Safety
Stephanie Marks, Environmental Compliance Analyst, Environmental Policy
Steven Werth, Qualified Craft Worker (Electrician), Structural Services
Tim Grady, Power Plant Supervisor, Facilities Operations
Tim Tussing, Utilities (Water/Sewer) Manager, Facilities Operations
Timothy Dzurilla, Graduate Student, Political Science
Tom Trahan, Zone Maintenance Manager, Facilities Operations
Wayne Landry, Supply Manager, Central Stores
Zbigniew Grabowski, Graduate Student, Ecology & Evolutionary Biology; Intern, Environmental Policy

B-2
SUSTAINABLE DEVELOPMENT WORKGROUP:
Co-Chairs:
Alexandria Roe, Director of Planning, Architectural & Engineering Services
Dr. John Volin, Professor & Department Head, Natural Resources & the Environment
Workgroup Participants:
Dr. John Alexopoulos, Associate Professor, Plant Science
Chet Arnold, Cooperative Extension Educator, Department of Extension; Associate Director, Center for Land Use Education & Research
Dr. Jack Barclay, Professor, Natural Resources & the Environment
Sally Beaudet, Facilities Professional, Design, Planning & Construction Management
Dr. Joseph Bushey, Assistant Professor, Civil & Environmental Engineering
Jason Coite, Environmental Compliance Analyst, Environmental Policy
Amy Crim, Administrative Manager, Residential Life
Ken Crowell, Assistant Director, Facilities Management
Terri Dominguez, Environmental Health & Safety Manager, Environmental Health & Safety
Paul Ferri, Environmental Compliance Analyst, Environmental Policy
Fran Gast, Facilities & Space Planner, Design, Planning & Construction Management
Steve Kremer, Executive Director, Residential Life
Philip Lang, Purchasing Agent, Purchasing & Central Stores
Dr. Donald Les, Professor, Ecology & Evolutionary Biology
Dave Lotreck, Facilities Professional, Facilities Management
Dr. Allison Mackay, Associate Professor, Civil & Environmental Engineering
Kathryn Miller, Graduate Student, School of Business
James Moriarty, Undergraduate student, Civil & Environmental Engineering; President, UConn Green Building Club
Clinton Morse, Manager of Growth Operations, Ecology & Evolutionary Biology
Michael Pacholski, Assistant Director, Facilities Management – Regional Campuses
Dennis Pierce, Director, Dining Services
James Pietrzak, Senior Project Manager, Architectural and Engineering Services
John Rozum, Associate Cooperative Extension Educator in Residence, Department of Extension; Director, Connecticut NEMO Program
Carl Salsedo, Cooperative Extension Educator, Department of Extension
Anji Seth, Assistant Professor, Geography
Harinee Trivedi, Graduate Student, Civil Engineering
Tim Tussing, Facilities Professional, Facilities Management
Dr. Glenn Warner, Professor, Natural Resources & the Environment
Dr. Mark Westa, Associate Professor, Plant Science/Architectural & Engineering Services
Vaughn Williams, Executive Assistant, Athletic Sports Operations
Tom Worthley, Associate Cooperative Extension Educator, Department of Extension

B-3
TRANSPORTATION WORKGROUP:
Co-Chairs: Wayne Landry, Supply Manager, Motor Pool & Central Stores
Dr. Norman Garrick, Associate Professor, Civil & Environmental Engineering
Workgroup Participants: Ann Denny, Transportation Services Administrator, Transportation & Parking Services
Annemarie Ryan, Secretary, Central Stores & Motor Pool
Chris McCahill, Graduate Student, Civil Engineering
Cornel Gaalswjik, Operations Manager, UConn Co-Op
Damiana Serafini, Graduate Student, Agricultural & Resource Economics
Dennis Pierce, Director, Dining Services
Eric Sabo, Qualified Craft Worker (HVAC & Refrigeration), Facilities Operations
Frank Simao, Facilities Professional, Facilities Operations
Gerry Bailey, Automotive Maintenance Supervisor, Motor Pool Repairs
James Stuart, Faculty Emeritus, Chemistry; Research Scientist, Materials Science Institute
Janet Freniere, Transportation Services Administrator, Transportation & Parking Services
Jay Johnston, Residence Hall Complex Manager, Residential Life
Jenna Nichols, Graduate Student, Civil Engineering
Jennifer Sayers, Sustainability Coordinator, Environmental Policy
Jessica Mortell, Undergraduate Student, Civil Engineering
Jim Hintz, Program Manager, Off Campus Student Services
John R. Rodriguez, Qualified Craft Worker (HVAC & Refrigeration), Facilities Operations
Johnathan Nader, Graduate Student, Civil Engineering
Mark Westa, Landscape Architect, Architectural & Engineering Services; Associate Professor, Plant Science
Michael DePlante, Electronics Technician, Facilities Operations
Mike Zambo, Material Storage Supervisor, Motor Pool Repairs
Nate Wallshein, Undergraduate Student, Environmental Science Program; Intern, Environmental Policy
Nicholas Frechette, Undergraduate Student, Chemical, Materials & Biomolecular Engineering
Regina Curtis, Administrative Services Specialist, Transportation & Parking Services
Rhoda Averna, Police Captain, Police Services
Richard Parnas, Associate Professor, Chemical, Materials & Biomolecular Engineering
Scott Harmon, Assistant Director, Dining Services
Tracy Cree, Residence Hall Complex Coordinator, Residential Life
Wesley Marshall, Graduate Student, Civil Engineering
Zbigniew Grabowski, Graduate Student, Ecology & Evolutionary Biology; Intern, Environmental Policy

C‐1
APPENDIX C: ENVIRONMENTAL SUSTAINABILITY STRATEGIES RECOMMENDED FOR FURTHER CONSIDERATION BY THE ENVIRONMENTAL POLICY ADVISORY COUNCIL
• Ensure optimal indoor air quality by limiting use of chemical such as sealants and paints, and running make‐up air through electric air cleaners.
• Install oil and grease separators on all campus parking lot storm drains.
• Eliminate toxic ‘air fresheners’ and deodorants, which are comprised of benzene and thalates – effervescent and water soluble contaminants.
• Water conservation strategies:
o Minimize Dining Services related water use
o Minimize water use associated with campus laboratories
o Minimize agricultural water use.
o Implement a rainwater harvesting program to supplement campus water requirements.
o Install underground storage units to collect surplus stormwater runoff.
• Work with surrounding towns to increase local attractions.
• Ban trucks and automobiles in the campus core during operating regular work hours to minimize traffic congestion.
• Further expand the distance‐based parking permit program (i.e. permits for lots located farthest from the campus core would be least expensive; those located near the core would be most expensive).
• Construct covered walkways, pedestrian bridges, and/or tunnels at major intersections.
• Refuse parking permits to individuals within walking, bicycling or public transit distance.
• Provide and locate shower access near bicycle storage locations.
• Encourage flights to be purchased through airlines listed on ‘green airlines’ lists.
• Reward departments with fewest vehicle miles travelled per person during a given time frame (e.g. semester, annually).

D‐1
APPENDIX D: UNIVERSITY OF CONNECTICUT SUSTAINABLE DESIGN & CONSTRUCTION POLICY
Adopted March 2007
The University of Connecticut shall plan, design, construct, renovate and maintain sustainable, energy‐ and water‐efficient buildings that:
• Yield cost savings through lowered lifetime operating costs,
• Provide enhanced learning atmospheres for students and healthier environments for all building occupants and visitors, and
• Realize the University’s commitment to responsible growth and environmental stewardship.
Accordingly, for any building construction or renovation project entering the pre‐design planning phase, and whenever the estimated total project cost exceeds $5 million, excluding the cost of equipment other than building systems, the University shall establish the Leadership in Energy & Environmental Design (LEED) Silver rating as a minimum performance requirement. The University shall comply with all applicable LEED protocols, including registering the project with the US Green Building Council at the beginning of the design phase and applying for LEED certification at project completion.
The University may exempt a project from the minimum performance requirements of this policy only with the approval of the University’s Board of Trustees (acting through its Building, Grounds & Environment Committee). To attain such exemption, and in addition to complying with procedures specified for a similar exemption pursuant to any applicable state law or regulation, the University shall prepare a written analysis substantiating that the costs of achieving LEED certification would significantly outweigh the benefits.