The United Nations Financial Situation 9 October 2013 United Nations Yukio Takasu...
26
The United Nations Financial Situation 9 October 2013 United Nations Yukio Takasu Under-Secretary-General for Management
-
Upload
angelica-tamsyn-mason -
Category
Documents
-
view
215 -
download
1
Transcript of The United Nations Financial Situation 9 October 2013 United Nations Yukio Takasu...

The United NationsFinancial Situation
9 October 2013
United Nations
Yukio TakasuUnder-Secretary-General for Management

1
The United Nations Financial Situation
Key Components
5 Oct 2012
31 Dec 2012
1 Oct 2013
Assessments Regular budget 2,412 2,412 2,606
Peacekeeping* 4,644 4,883 9,767
Tribunals 232 232 248
Capital Master Plan - - -
Unpaid Assessments Regular budget 855 327 945
Peacekeeping 1,850 1,329 3,406
Tribunals 63 36 60
Capital Master Plan 5 3 2
Unpaid/Assessments % Regular budget 35% 14% 36%
Peacekeeping 40% 27% 35%
Tribunals 27% 16% 24%
Capital Master Plan - - -
(US$ millions)
*Peacekeeping assessments for 2012/2013 fiscal year decreased in 2012 and increased in 2013 due to timing of decision on scale of assessment rates applicable to 2013.

2
The United Nations Financial Situation
Key Components
5 Oct 2012
31 Dec 2012
1 Oct 2013
Cash on Hand * Regular budget* 149 - 55
Peacekeeping* 3,597 2,605 3,353
Tribunals 159 128 216
Capital Master Plan* 585 467 244
(US$ millions)
*Not including reserve accounts** Not including letters of assist, and death and disability claims
Outstanding Paymentsto Member States**
Peacekeeping 460 525 423
31 Dec 2013
(Projected)31 Dec
201216 Oct
2012

3
2012 2013 Difference
Prior year’s balance (1 January) 454 327 (127)
Assessments2,412 2,606 194
Payments received 2,011 1,988 (23)
Unpaid assessments (5 Oct 2012 and 1 Oct 2013) 855 945 90
The United Nations Financial Situation
Regular Budget: Assessment Status(US$ millions)
Regular budgetPeacekeepingTribunalsCapital Master Plan

4
The United Nations Financial Situation
Regular Budget AssessmentsNumber of Member States paying in full at Year-end
131
124
140 140
146
136138
143 143
134
139
100
110
120
130
140
150
2003 2004 2005 2006 2007 2008 2009 2010 2011 2012 2013
* At 1 October 2013, compared to 129 Member States as at 5 October 2012
*
Regular budgetPeacekeepingTribunalsCapital Master Plan

5
SingaporeSlovakiaSlovenia Solomon IslandsSouth Africa SpainSri LankaSwazilandSwedenSwitzerlandTajikistanThailandTongaTunisiaTurkeyTurkmenistanTuvaluUkraineUnited Arab Emirates United Kingdom United Republic of TanzaniaUruguay UzbekistanYemenZambiaZimbabwe
MoroccoMozambiqueMyanmar Namibia NetherlandsNew ZealandNicaraguaNigeriaNorwayOmanPanamaPeruPhilippinesPolandPortugal QatarRepublic of KoreaRepublic of MoldovaRussian FederationRwandaSaint LuciaSamoa San MarinoSaudi ArabiaSenegalSerbiaSeychellesSierra Leone
GuyanaHaitiHungaryIcelandIndiaIndonesiaIreland IsraelItalyJapanJordanKazakhstanKenyaKuwaitLao People’s Democratic RepublicLatviaLesothoLiechtensteinLuxembourgMalawiMaldivesMaltaMarshall IslandsMexicoMonacoMongoliaMontenegro
Costa RicaCote d’Ivoire CroatiaCubaCyprus Czech RepublicDemocratic Republic of CongoDenmarkDjiboutiDominicaDominican RepublicEcuadorEgyptEl SalvadorEquatorial GuineaEritreaEstonia EthiopiaFinland France GabonGambiaGeorgiaGermanyGreeceGuatemalaGuinea
AfghanistanAlbaniaAlgeria Andorra AngolaAntigua and BarbudaArmenia Australia Austria Azerbaijan BahamasBahrainBarbadosBelgium BhutanBoliviaBosnia and HerzegovinaBotswanaBrunei Darussalam Bulgaria Burkina FasoCambodiaCanadaChina Colombia Congo
The United Nations Financial Situation
Regular Budget Assessments Fully paid at 1 October 2013: 134 Member States*
* Compared to 129 Member States at 5 October 2012
Regular budgetPeacekeepingTribunalsCapital Master Plan

Unpaid Regular Budget Assessments(US$ millions)
The United Nations Financial Situation
6
Outstanding
Member State 1 Oct 2013
United States 795
Brazil 75
Venezuela (Bolivarian Republic of) 22
56 Other Member States 53
Total 945
Regular budgetPeacekeepingTribunalsCapital Master Plan

7
Regular Budget Cash PositionActual (US$ millions)
The United Nations Financial Situation31 December 2012 1 October 2013
Regular Budget - 55
Working Capital Fund* 115 150
Special Account 258 259
Combined General Fund 373 464
* Resolution 67/254 authorized the use of the Working Capital Fund as a cash flow bridging mechanism to cover payments pending the receipt of insurance settlements related to storm Sandy, with the cash position of the Organization to be monitored and reported to the General Assembly on a regular basis within existing mechanisms.
As at 1 October 2013, the Working Capital Fund has not been utilized for this purpose.
Regular budgetPeacekeepingTribunalsCapital Master Plan
8
The United Nations Financial Situation
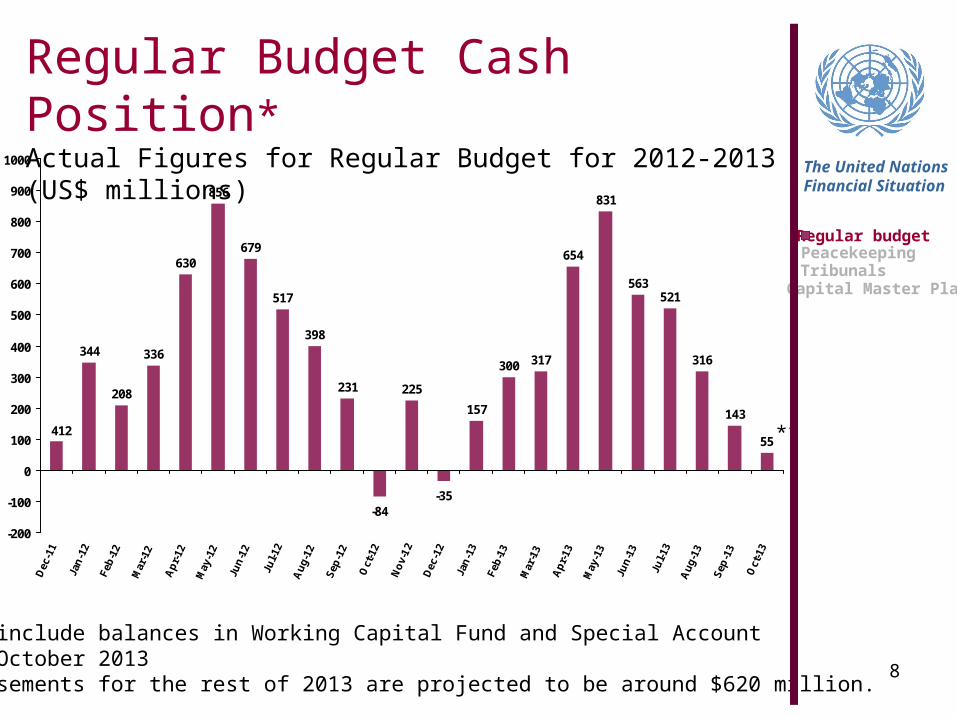
Regular Budget Cash Position*Actual Figures for Regular Budget for 2012-2013 (US$ millions)
344
208
336
630
856
679
517
398
231
-84
225
-35
157
300 317
654
831
563521
316
143
55412
-200
-100
0
100
200
300
400
500
600
700
800
900
1000
Dec-11
Jan-12
Feb-12
Mar-12
Apr-12
May-12
Jun-12
Jul-12
Aug-12
Sep-12
Oct-12
Nov-12
Dec-12
Jan-13
Feb-13
Mar-13
Apr-13
May-13
Jun-13
Jul-13
Aug-13
Sep-13
Oct-13
* Does not include balances in Working Capital Fund and Special Account** As at 1 October 2013 Disbursements for the rest of 2013 are projected to be around $620 million.
**
Regular budgetPeacekeepingTribunalsCapital Master Plan

The United Nations Financial Situation
Regular budgetPeacekeepingTribunalsCapital Master Plan
Outstanding assessments at 31 Dec 2012 1,329
Assessments during Jan - Oct 2013 9,767
Total 11,096
Payments/credits received during Jan - Oct 20137,690
Outstanding assessments at 1 Oct 2013* 3,406
Peacekeeping: Assessment Status at 1 October 2013 (US$ millions)
* Including assessments within 30-day period for UNIFIL ($426 million) and UNMIL ($371 million) which were issued on 16 and 20 September 2013)
9

10*Compared to 32 Member States at 11 October 2012
Peacekeeping Assessments Fully paid - due and payable at 1 Oct 2013: 33 Member States*
The United Nations Financial Situation
Regular budgetPeacekeepingTribunalsCapital Master Plan
Antigua and BarbudaAustralia
AustriaCanada
CongoCosta Rica
Cote d’IvoireCuba
DenmarkFinland
GermanyHungary
IcelandIrelandLatvia
Liechtenstein
MalawiNetherlandsNew ZealandNigeriaNorwayRepublic of KoreaSaint LuciaSamoaSenegalSierra LeoneSingaporeSouth AfricaSweden SwitzerlandThailandTuvaluUnited Republic of Tanzania

Unpaid Peacekeeping Assessments* (Actual) (US$ millions)
Regular budgetPeacekeepingTribunalsCapital Master Plan
= 40%
Member State 1 Oct 2013**
United States 651
Japan 621
China 404
Italy 255
France 224
Others* 1,251
Total 3,406
11
*Payments received after the cut-off date of 1 October 2013 are not reflected on this page.
Member State 5 Oct 2012
Japan 356
United States 347
Italy 137
Ukraine 134
Saudi Arabia 118
Others 758
Total 1,850
Unpaid assessments Total assessments
= 35%Unpaid assessments Total assessments
** Including assessments within 30-day period for UNIFIL ($426 million) and UNMIL ($371 million) which were issued on 16 and 20 September 2013

12
Peacekeeping Cash PositionActual Figures for Peacekeeping for 2012-2013 (US$ millions)
The United Nations Financial Situation
Regular budgetPeacekeepingTribunalsCapital Master Plan
* At 1 October 2013
*
29182
3353
0
1000
2000
3000
4000
5000
Active MissionsPK Reserve FundClosed Missions

13
Outstanding Payments to Member StatesAmounts Owed for Troops/Formed-Police Units and Contingent-Owned Equipment (US$ millions)
The United Nations Financial Situation
Regular budgetPeacekeepingTribunalsCapital Master PlanActual 2012* Projected 2013**
1 January 529 525
New obligations 2,077 2,137
Payments to Member States (2,081) (2,239)
31 December 525Over 12 months: 97
Less than 12 months: 428
423Over 12 months: 86
Less than 12 months: 337
* Reference A/67/723, table 15

Outstanding Payments to Member StatesProjected 2013 Outstanding Payments (US$ millions)
14
The United Nations Financial Situation
Regular budgetPeacekeepingTribunalsCapital Master Plan
a Payments for troops/formed police unit costs for all missions including supplemental payments are current up to July- Aug 2013, except for MINURSO which is up to Mar 2011, UNFICYP up to Jan 13, and UNMISS, UNMIL and UNISFA up to May 2013.
b Payments for troops in the total amount of 159 million are scheduled for 10 October 2013.
C Payments for COE for active missions are current up to Mar 13 for all missions, except for MINURSO up to Oct 2010, UNFICYP up to Jun 2010, UNMISS and MINUSTAH up to Jan 13.
d Payments for COE in the amount of 169 million are scheduled for 11 October 2013
e Does not include Letters of Assist and death and disability claim costs which have balances of $66 million and $1 million respectively as at 1 October 2013.
31 Dec 2012 1st Oct 2013 31 Dec 2013 d
(Projected)
Troop/formed police unit costs 233 267 134
COE claims (active missions) 206 442 203
COE claims (closed missions) 86 86 86
TOTAL e 525 795 423
a b
c d

The United Nations Financial Situation
Regular budgetPeacekeepingTribunalsCapital Master Plan
Outstanding Payment to Member StatesAmounts Owed for Troops/Formed Police Units and COE
at 1 October 2013 (US$ millions)
TOTAL 862 million**including Letter of assist
83 Member States
15

The United Nations Financial Situation
Regular budgetPeacekeepingTribunalsCapital Master Plan
16
Tribunals: Assessment Status*
The United Nations Financial Situation
Regular budgetPeacekeepingTribunalsCapital Master Plan
5 Oct 2012 1 October 2013
Member States paid in full 95 96
Member States with amounts outstanding to one or both tribunals, and/or international residual mechanism
97 97
Payments received (US$ millions) 195 224
Unpaid Assessments (US$ millions) 63 60
* Including assessments for the International Tribunal for the Former Yugoslavia, the International Criminal Tribunal for Rwanda, and the International Residual Mechanism for Criminal Tribunals.

AlgeriaAndorraAntigua and BarbudaArgentinaArmenia Australia Austria AzerbaijanBelgium BhutanBosnia and HerzegovinaBrunei Darussalam Bulgaria Burkina FasoCanadaChile ChinaColombiaCongoCosta RicaCote d’IvoireCroatiaCubaCyprusCzech Republic
DenmarkEgypt El SalvadorEquatorial GuineaEritreaFinland Gabon GeorgiaGermanyGhanaGreeceGuatemalaHondurasHungaryIceland IndiaIreland IsraelItalyJapanKazakhstanKenyaKuwaitLao People’s Democratic Republic
LatviaLesotho LiechtensteinLithuania LuxembourgMalawiMauritiusMexico Monaco MongoliaNamibiaNauruNetherlands New ZealandNigeria NorwayOmanPanamaPolandRepublic of KoreaRepublic of MoldovaRomaniaSaint LuciaSamoa
San MarinoSenegalSerbiaSierra LeoneSingaporeSlovakiaSloveniaSolomon IslandsSouth AfricaSpainSwazilandSwedenSwitzerlandThailandTrinidad and TobagoTurkeyTurkmenistanTuvaluUnited Arab EmiratesUnited KingdomUnited Republic of Tanzania UzbekistanZimbabwe
17
Tribunal AssessmentsFully paid at 1 October 2013: 96 Member States*
The United Nations Financial Situation
Regular budgetPeacekeepingTribunalsCapital Master Plan
*Compared to 95 Member States at 5 October 2012

18
Outstanding Tribunal Assessments at 31 December (US$ millions)
The United Nations Financial Situation
Regular budgetPeacekeepingTribunalsCapital Master Plan
25
51
3426
37
27 27
60
36
0
10
20
30
40
50
60
70
2005 2006 2007 2008 2009 2010 2011 2012 2013
* Outstanding as at 1 October 2013
*

19
The United Nations Financial Situation
Regular budgetPeacekeepingTribunalsCapital Master Plan
Unpaid Tribunal Assessments at 1 October 2013 (US$ millions)
Member State Outstanding
United States 32
Russian Federation 6
Brazil 4
Indonesia 4
Venezuela 3
92 Other Member States 11
Total 60
97 Member States

20
The United Nations Financial Situation
Regular budgetPeacekeepingTribunalsCapital Master Plan
Tribunals Cash PositionActual Figures for Tribunals for 2012-2013 (US$ millions)
128.6
114.2
169.9174
161.2 161.5
130 127.7
109.6101.5
161.4
179.9
200.9194.7
185.3190.6
215.7 215.7
187.4
201.4
218.6
201.8
168.2
0
20
40
60
80
100
120
140
160
180
200
220
240
* At 1 October 2013
*

21
Assessments 1,868.7
Payments at 1 October 2013* 1,867.1
Unpaid assessments (26 Member States) 1.6
* Not including payments to the working capital reserve fund of $45 million, which had an outstanding balance of $6,300 at 1 October 2013.
Capital Master Plan(US$ millions)
The United Nations Financial Situation
Regular budgetPeacekeepingTribunalsCapital Master Plan

22
The United Nations Financial Situation
Regular budgetPeacekeepingTribunalsCapital Master Plan
Capital Master Plan Cash Position*Actual figures for CMP Fund for 2012-2013 ($US millions)
882843
800760
714687
635
586 574
522
467434
414387
303282
263 249 244
895861
353325
0
100
200
300
400
500
600
700
800
900
1000
1100
* Does not include balances in Working Capital Reserve** At 1 October 2013
**

23
Capital Master Plan Fully paid at 1 October 2013: 166 Member States*
The United Nations Financial Situation
Regular budgetPeacekeepingTribunalsCapital Master Plan
*Compared to 149 Member States at 5 October 2012
AlbaniaAlgeriaAndorraAngolaAntigua and BarbudaArgentinaArmeniaAustraliaAustriaAzerbaijanBahamasBahrainBangladeshBarbadosBelarusBelgiumBelizeBeninBhutanBosnia and HerzegovinaBotswanaBrazilBrunei DarussalamBulgariaBurkina FasoCameroonCanada
Cape VerdeCentral African RepublicChileChinaColombiaCongoCosta RicaCote d’IvoireCroatiaCubaCyprusCzech RepublicDemocratic People’s Republic of KoreaDemocratic Republic of CongoDenmarkDjiboutiEcuadorEgyptEl SalvadorEquatorial GuineaEritrea EstoniaEthiopia FinlandFranceGabonGeorgia
GermanyGhanaGreeceGrenadaGuatemalaGuineaGuyanaHaitiHondurasHungaryIcelandIndiaIndonesiaIran (Islamic Republic of)IraqIrelandIsraelItalyJapanJordanKazakhstanKenyaKiribatiKuwaitKyrgyzstanLao People’s Democratic Republic
LatviaLebanonLesothoLiberiaLibyaLiechtensteinLithuaniaLuxembourgMadagascarMalawiMalaysiaMaldivesMaliMaltaMauritiusMexicoMonacoMongoliaMontenegroMozambiqueMyanmarNamibiaNauruNetherlandsNew ZealandNicaraguaNigerNigeriaNorwayOman
PakistanPalauPanamaPapua New GuineaParaguayPhilippinesPolandPortugalQatarRepublic of KoreaRepublic of MoldovaRomaniaRussian FederationSaint Kitts and NevisSaint LuciaSamoaSan MarinoSaudi ArabiaSenegalSerbiaSeychellesSierra LeoneSingaporeSlovakiaSloveniaSolomon IslandsSouth AfricaSpainSri LankaSuriname
SwazilandSwedenSwitzerlandSyrian Arab RepublicTajikistanThailandThe former Yugoslav Republic of MacedoniaTimor-LesteTogoTrinidad and TobagoTunisiaTurkeyTurkmenistanTuvaluUgandaUkraineUnited Arab EmiratesUnited Kingdom United Republic of Tanzania United States of AmericaUruguayUzbekistanVenezuela (Bolivarian Republic of)Viet NamZambiaZimbabwe

24
All Assessments Due and payable at 9 October 2013 Paid in Full: 33 Member States*
The United Nations Financial Situation
Antigua and Barbuda
Australia
Austria
Canada
Congo
Costa Rica
Cote d’Ivoire
Cuba
Denmark
Finland
Germany
Hungary
Iceland
Ireland
Latvia
Liechtenstein
Malawi
Netherlands
New Zealand
Nigeria
Norway
Republic of Korea
Saint Lucia
Samoa
Senegal
Sierra Leone
Singapore
South Africa
Sweden
Switzerland
Thailand
Tuvalu
United Republic of Tanzania
*Compared to 31 Member States at 11 October 2012

25
Conclusions
The United Nations
Financial Situation
Cash positions are projected positive at year end except for the regular budget, which is at a low level.
Projected expenditure of $620 million for the regular budget through end December 2013 will exceed the level of reserves.
Final cash position of the regular budget will depend on last quarter incoming contributions
As committed, every effort has been made to streamline and expedite and as a result outstanding payments to Member States (TCC/COE) is projected to decrease to $423 million at the end of 2013.
Given the limited reserves available, the financial health of the Organization continues to depend on Member States meeting their financial obligations in full and on time.
The number of Member States meeting full obligations continues to show improvement. For the regular budget, 134 Member States have paid in full, compared to 129 at this time last year.
However, a significant level of unpaid regular budget contributions is concentrated among the remaining Member States


![Regulatory Perspective - Yukio Hiyama[1]](https://static.fdocuments.net/doc/165x107/5571fe1b49795991699aa356/regulatory-perspective-yukio-hiyama1.jpg)