The Unit Testlet Dilemma: PISA Sample
20
International Journal of Assessment Tools in Education 2021, Vol. 8, No. 3, 613–632 https://doi.org/10.21449/ijate.948734 Published at https://ijate.net/ https://dergipark.org.tr/en/pub/ijate Research Article 613 The Unit Testlet Dilemma: PISA Sample Cansu Ayan 1,* , Fulya Baris Pekmezci 2 1 Ankara University, Faculty of Educational Sciences, Department of Educational Sciences, Educational Measurement and Evaluation, Ankara, Turkey 2 Yozgat Bozok University, Faculty of Education, Department of Educational Sciences, Measurement and Evaluation in Education, Yozgat, Turkey ARTICLE HISTORY Received: Sep. 24, 2020 Revised: Mar. 18, 2021 Accepted: May 25, 2021 Keywords: PISA, Testlet items, Local Dependence, Marginal item parameters. Abstract: Testlets have advantages such as making it possible to measure higher- order thinking skills and saving time, which are accepted in the literature. For this reason, they have often been preferred in many implementations from in-class assessments to large-scale assessments. Because of increased usage of testlets, the following questions are controversial topics to be studied: “Is it enough for the items to share a common stem to be assumed as a testlet?” “Which estimation method should be preferred in implementation containing this type of items?” “Is there an alternative estimation method for PISA implementation which consists of this type of items?” In addition to these, which statistical model to use for the estimations of the items, since they violate the local independence assumption has become a popular topic of discussion. In light of these discussions this study aimed to clarify the unit-testlet ambiguity with various item response theory models when testlets consist of a mixed item type (dichotomous and polytomous) for the science and math tests of the PISA 2018. When the findings were examined, it was seen that while the bifactor model fits the data best, the uni-dimensional model fits quite closely with the bifactor model for both data sets (science and math). On the other hand, the multi-dimensional IRT model has the weakest model fit for both test types. In line with all these findings, the methods used when determining the testlet items were discussed and estimation suggestions were made for implementations using testlets, especially PISA. 1. INTRODUCTION PISA (Program for International Student Assessment) is a large-scale examination implemented by the OECD (Organization for Economic Co-operation and Development), which is attended by many countries that evaluate the knowledge and skills acquired by students aged 15 in three-year periods. The main purpose of PISA is to measure students’ ability to transfer the knowledge and skills they have learned at school into daily life. Within this scope, there are three main evaluation areas, namely science, math and reading literacy in the part where cognitive evaluation is made. The concept of “literacy” used in PISA research is defined as the capacity of students to transfer their knowledge into daily life and to make logical *CONTACT: Cansu AYAN [email protected] Ankara University, Faculty of Education, Department of Educational Sciences, Measurement and Evaluation in Education, Ankara, Turkey e-ISSN: 2148-7456 /© IJATE 2021
Transcript of The Unit Testlet Dilemma: PISA Sample
International Journal of Assessment Tools in Education
2021, Vol. 8, No. 3, 613–632
https://doi.org/10.21449/ijate.948734
Published at https://ijate.net/ https://dergipark.org.tr/en/pub/ijate Research Article
613
The Unit Testlet Dilemma: PISA Sample
Cansu Ayan 1,*, Fulya Baris Pekmezci 2
1Ankara University, Faculty of Educational Sciences, Department of Educational Sciences, Educational
Measurement and Evaluation, Ankara, Turkey 2Yozgat Bozok University, Faculty of Education, Department of Educational Sciences, Measurement and
Evaluation in Education, Yozgat, Turkey
ARTICLE HISTORY
Received: Sep. 24, 2020
Revised: Mar. 18, 2021
Accepted: May 25, 2021
Keywords:
PISA,
Testlet items,
Local Dependence,
Marginal item parameters.
Abstract: Testlets have advantages such as making it possible to measure higher-
order thinking skills and saving time, which are accepted in the literature. For this
reason, they have often been preferred in many implementations from in-class
assessments to large-scale assessments. Because of increased usage of testlets, the
following questions are controversial topics to be studied: “Is it enough for the
items to share a common stem to be assumed as a testlet?” “Which estimation
method should be preferred in implementation containing this type of items?” “Is
there an alternative estimation method for PISA implementation which consists of
this type of items?” In addition to these, which statistical model to use for the
estimations of the items, since they violate the local independence assumption has
become a popular topic of discussion. In light of these discussions this study aimed
to clarify the unit-testlet ambiguity with various item response theory models when
testlets consist of a mixed item type (dichotomous and polytomous) for the science
and math tests of the PISA 2018. When the findings were examined, it was seen
that while the bifactor model fits the data best, the uni-dimensional model fits quite
closely with the bifactor model for both data sets (science and math). On the other
hand, the multi-dimensional IRT model has the weakest model fit for both test
types. In line with all these findings, the methods used when determining the testlet
items were discussed and estimation suggestions were made for implementations
using testlets, especially PISA.
1. INTRODUCTION
PISA (Program for International Student Assessment) is a large-scale examination
implemented by the OECD (Organization for Economic Co-operation and Development),
which is attended by many countries that evaluate the knowledge and skills acquired by students
aged 15 in three-year periods. The main purpose of PISA is to measure students’ ability to
transfer the knowledge and skills they have learned at school into daily life. Within this scope,
there are three main evaluation areas, namely science, math and reading literacy in the part
where cognitive evaluation is made. The concept of “literacy” used in PISA research is defined
as the capacity of students to transfer their knowledge into daily life and to make logical
*CONTACT: Cansu AYAN [email protected] Ankara University, Faculty of Education,
Department of Educational Sciences, Measurement and Evaluation in Education, Ankara, Turkey
e-ISSN: 2148-7456 /© IJATE 2021

Ayan & Baris-Pekmezci
614
inferences. As can be understood from the definition, this international test administration
focuses on the higher-order skills such as analysing and evaluation rather than the cognitive
levels such as memorizing or remembering information directly. Many different item types are
used to serve this purpose (OECD, 2019c).
One of the PISA item types that make it easy to measure higher-order thinking skills is the item
types, which are linked to a common stimulus. Types of items linked to a common stimulus are
named “Testlet Items” in the literature. In this item type, many item stems are created from
contents such as a picture, a text or a scenario that is used as a common stimulus. Thanks to the
content it uses, this format helps make it possible to measure higher-order thinking levels by
bringing measurement-evaluation practices closer to real-life problem situations. Furthermore,
it can save time by having many items created from the same content (Bao, 2007; DeMars,
2006; Wainer et al., 2000).
In addition to the many advantages of testlet items, which are mentioned above, their limitations
have also been a topic of discussion in the related literature. The first one of these discussions
is that these items threaten the local independence (LID) assumption, which is one of the main
assumptions of the Item Response Theory (IRT). Local independence means that whether a
person responds to an item correctly or incorrectly depends only on the ability of that person,
and that the items s/he has answered before do not affect this situation (Embretson & Reise,
2000; Hambleton et al., 1991). While in the literature there are many known reasons for local
item dependence, one of the most frequently discussed reasons is the dependence arising from
the fact that the items are linked to a text (Yen, 1993). The responses to the items may be related
to each other in item groups with the same content. For example, for a set of items connected
to a reading item, an individual’s interest in the content presented in the reading can be a second
factor that will affect answering the items correctly. In this case, it may not be correct to claim
that the answers given to these items are independent from each other (Bao, 2007; Fukuhara &
Kamata, 2011; Yen, 1993). Many studies that are consistent with this situation have also shown
that when a testlet is used in tests, the LID assumption is violated (Lee et al., 2001; Sireci et al.,
1991; Wainer & Lewis, 1990; Yen, 1993).
The fact that uni-dimensional IRT models are insufficient in estimating the model parameters,
since they violate the LID assumption in the tests where the testlets are used, has become a
current issue. Many studies have been conducted on how uni-dimensional IRT estimates affect
the results without taking the LID assumption into consideration (Bradlow et al., 1999; Chen
& Thissen, 1997; DeMars, 2012; DeMars, 2006; Li et al., 2005; Marais & Andrich, 2008; Sireci
et al., 1991; Tuerlinckx & De Boeck, 2001; Wainer & Wang, 2000; Yen, 1993). Overestimation
of reliability or information and underestimation of standard errors for ability estimates are
possible drawbacks of violation of LID (Wainer &Wang, 2000; Yen, 1993). This also leads to
misestimation of parameters. Wainer and Wang (2000) showed that when the local dependence
that stemmed from the testlet structure was ignored, item difficulties were still well estimated
but lower asymptotes were overestimated, and the discrimination parameters that were
overestimated for one test were underestimated for another test. Wainer et al., (2000) proved
that by ignoring testlet dependence, discrimination was the most affected parameter among
other parameters (trait and difficulty). Wainer and Wang (2000) found that when the testlet
dependence was ignored and not modelled, the item discriminations were underestimated for
testlet items and overestimated for independent items. Ackerman (1987) found that when the
items were locally dependent, item discriminations were underestimated. When a multi-
dimensional structure exists, alternative psychometric models should be used for modelling
LID. In this context, the issue of which alternative psychometric model to use for measurements
using testlets has become a popular topic of discussion. Based on all these research findings,
one of the psychometric models proposed for measurements involving testlets is the bifactor

Int. J. Assess. Tools Educ., Vol. 8, No. 3, (2021) pp. 613–632
615
model. The bifactor model is a special version of multi-dimensional IRT developed as an
extension of Spearman’s bifactor theory (Holzinger & Swineford, 1937). In the bifactor model,
it can be possible to load items in two different factors, being one general factor and one or
more than one specific factors. In this way, both general and specific factor effects on the items
can be estimated and interpreted simultaneously (Canivez, 2016; Houts & Cai, 2013; Reise et
al., 2010). This can be considered as a solution for tests in which item sets are used. In the
bifactor model, items using the same content are loaded on the same specific factor and also all
items are loaded on the general factor. Thus, the properties resulting from the common content
of the items that cause the violation of the LID assumption can be modelled in the specific
factors (Gibbons & Hedeker, 1992; Houts & Cai, 2013). In the light of all this information, the
estimation model of PISA, where item sets are frequently used, can also be discussed.
When the PISA estimation procedure was investigated, it was seen that in the PISA 2018, the
uni-dimensional multiple-group IRT model for binary items and the generalized partial credit
(GPC) model for the polytomous item responses were used for each of the domains (OECD,
2019c). In this context, when the literature was examined, studies comparing the estimation
accuracy of the bifactor model with other IRT models using the PISA items (DeMars, 2006;
Yılmaz Koğar, 2016) were found. As a result of these studies, it was seen that the best fitting
model was the bifactor model. In the related studies, all items in the same unit were analysed
by assuming they were connected to the same common stem. According to PISA, math items
are arranged in units that share the stimulus material and it is usually the case that all items in
the same unit belong to the same context category (OECD, 2019a). Moreover, PISA science
items are arranged in units that are introduced by the specific stimulus material, which may be
a brief written passage, or a text accompanying a table, a chart, a graph or a diagram (OECD,
2019b). However, when the reading items released by the PISA 2018 were examined, it was
seen that there were three reading passages named “Professor’s Blog”, “Review of Collapse”,
and “Did Polynesian Rats Destroy Rapa Nui’s Trees?” in the unit named “Rapa Nui”. Similarly,
there were two reading passages named “Farm to Market” and “Just Say No” in the unit named
“Cow’s Milk”. In this case, it would not be correct to consider all the items in the units “Rapa
Nui” and “Cow’s Milk” as if they shared the same common stem.
Similarly, when the science items released by the PISA 2015 were examined, in the “Bird
Migration” unit, it was seen that there were two different reading passages named “Bird
Migration” and “Golden Plovers”. When the math items released by the PISA 2012 were
investigated, it was seen that in the “Penguins” unit, the first three items partially shared the
same passage but the fourth item had its own graph and the student used just that graph to solve
that item. In this case, it would not be correct to consider and analyse the items in the
aforementioned units as if they shared the same stem. Besides, Baldonado et al., (2015) pointed
out the danger that considering items as locally dependent may overestimate the true
dependence among the items, even for items sharing the same common stem, without doing
any extra investigations. In contrast, they proposed another method, which is based on
determining which sentence or information in the passage is used to answer the item correctly,
and which requires a detailed examination of the item contents. Underlining that the entire
passage is less important than the part needed to answer the item correctly, they state that there
is often no dependence for items referring to unique parts of the text.
As stated before, when the items released by the PISA 2018, 2015 and 2012 were examined,
units with more than one stimulus were found. However, in the PISA 2018 Framework, it was
stated that the items shared a common stimulus (OECD, 2019a; OECD, 2019b). It was seen in
the examinations that the fact that the items were from the same unit does not guarantee that
they would share the same common stem.

Ayan & Baris-Pekmezci
616
Consequently, it is questionable for the items to be considered as a testlet for all situations
where a common stem is used. This situation especially raises more suspicion for situations
such as the PISA implementations, where the items are not published and the contents cannot
be examined in detail. All these ambiguities make it necessary to conduct more studies on this
topic. Due to the advantages they provide, testlet items are a type of item, which is increasingly
used in many areas from small-scale classroom implementations to large-scale international
implementations. It is thought that having both conceptual and psychometric discussions about
this item type is very important for obtaining valid and reliable results from implementations
using this item type. This research is an important study, since it aims to help eliminate the unit-
testlet ambiguity in PISA in the literature. Within the scope of this study, the estimation results
of the bifactor model, uni-dimensional IRT model and multi-dimensional IRT model were
compared in the presence of testlets in which both dichotomous and polytomous items existed.
The main purpose of this research is to compare the model estimation results of the bifactor-
GPC model with the multi-dimensional-GPC (multi-GPC) model and uni-dimensional GPC
(uni-GPC) model for dichotomous and polytomous items from science and math tests in PISA
2018 and to clarify the unit-testlet dilemma.
For this purpose, the following research questions were asked. For science and math;
(1) Do the items show local dependence for each of the bifactor-GPC, multi-GPC and
uni-GPC models?
(2) What are the model fit indices of the bifactor-GPC, multi-GPC and uni-GPC model
estimations?
(3) What are the item parameters obtained from the bifactor-GPC, multi-GPC and uni-
GPC models?
(4) What are the variance rates explained on the basis of general and specific factors?
2. METHOD
2.1. Participants
The participants of the study were selected from students who participated in the PISA 2018.
Among these people, the study was carried out with individuals who took the selected booklets
without making a country distinction. In this context, 9365 examinees who completed the
selected booklet were selected for the math test. Similarly, 6487 examinees were also selected
for the science test with the same method.
2.2. Instrument
The results of the PISA 2018 were used in this study for the real data. Math and science tests
were used by selecting a booklet from each. Selected booklets were determined according to its
number of polytomous items. The items on the math test came from Booklet 11. Booklet 11
consisted of 24 items in total: two 2-item testlets, three 3-item testlets, one 4-item testlet and
seven independent items. Independent items in Booklet 11 were removed, as they were not
within the scope of this study. After removing the independent items, 17 items remained.
Among these 17 items, four were polytomous (partial credit) and the other 13 were dichotomous
items. Polytomous items were coded as follows: 0 for no credit, 1 for partial credit and 2 for
full credit. The items on the science test came from Booklet 15. Booklet 15 consisted of 38
items in total: two 5-item testlets, three 4-item testlets, four 3-item testlets and two 2-item
testlets. There were no independent items in Booklet 15. Among these 38 items, four were
polytomous and 34 were dichotomous items.
2.3. Estimation Procedure
In this study, a mixed item type (dichotomous and polytomous) was used. For both the math
and science tests, the items were analyzed according to the GPC model for three IRT models

Int. J. Assess. Tools Educ., Vol. 8, No. 3, (2021) pp. 613–632
617
(bifactor, uni-dimensional and multi-dimensional). Since PISA items are partially scored items,
Muraki (1992)’s Generalized Partial Credit (GPC) model was used for parameter estimations.
The GPC model is a generalized form of the two-parameter logistic (2PL) model for
polytomous data, which describes an examinee’s probability of selecting a possible score
category among all score categories. When an item has two response categories, the GPC model
is equal to the 2PL model.
Chon et al., (2007) found that the GPC model fits mixed data (polytomous and dichotomous)
better than 3PL (three-parameter logistic) or 2PL (two-parameter logistic) models. The
Metropolis-Hastings Robbins-Monro (MH-RM) algorithm was used for the parameter
estimation method. The MH-RM is ideal for mixing different item response models
(dichotomous and polytomous) with many items, many factors and a large sample size (Cai,
2010). Finally, all analyses were made with R-Studio 1.2.5001 and Excel.
2.3.1. Estimation of marginal item parameters
According to Stucky and Edelen (2014), in the bifactor model, slopes on the general trait have
an effect of specific traits. So, the inflation of conditional slopes of the general trait is a
consequence of the conditional relation between the specific traits and the general trait. Thus,
direct comparison should not be made between specific and general slopes (Stucky et al., 2013).
Therefore, marginal slopes were calculated to compare the model (uni-GPC, bifactor-GPC,
multi-GPC) parameters using equations (Eq.1. Eq.2. Eq.3) (Stucky & Edelen, 2014; Stucky et
al., 2013).
𝜆𝑗∗𝐺 =
𝛼𝐽𝐺/𝐷
√ 1+(𝛼𝑗𝐺/𝐷)2+(𝛼𝑗
𝑆/𝐷)2 (Eq.1)
(𝜎𝑗∗𝐺)2 = 1 − (𝜆𝑗
∗𝐺)2 (Eq.2)
𝛼𝑗∗𝐺 = (
𝜆𝑗∗𝐺
√(𝜎𝑗∗𝐺)2
) (Eq.3)
According to the equations, D= a scaling constant of 1.7, 𝜆𝑗∗𝐺 = marginal loading of item j on
the general trait, (𝜎𝑗∗𝐺)2 = unexplained (unique) item variance on the general trait, 𝛼𝐽
𝐺 =con-
ditional slope for item j on the general trait, 𝛼𝑗𝑆 = conditional slope for item j on a specific trait.
The marginal location parameter on the general trait should be calculated according to Eq. 4
(Stucky & Edelen, 2014).
bj(k)∗ =
−cjk
αjG (Eq.4)
Ip (2010) showed that marginalization of parameters does not affect the b- and c- parameters.
However, in this study, all parameters were marginalized for both the general trait and specific
traits (see Appendix B).
2.3.2. Dimensionality analysis
Before the IRT analysis, dimensionality of the data was detected for both math and science
tests. If the tests were uni-dimensional, then there would be no significant testlet factors. For
dimensionality analysis, parallel analysis was done via psych (Revelle & Revelle, 2015)
package in R.

Ayan & Baris-Pekmezci
618
Figure 1. Parallel analysis for science test
Figure 2. Parallel analysis for math test
Item clusters that had eigenvalues greater than 1 were designated as components and the
existence of more than one component showed that data were not uni-dimensional. According
to the scree plots for science (Figure 1) and math (Figure 2), it was seen that the data were not
uni-dimensional. For math data 4 factors, and for science data 6 factors were extracted.
3. RESULT / FINDINGS
3.1. Evaluation of Local Indepence
Local Indepence (LID) is examined according to Chen and Thissen’s (1997) standardized local
dependence (LD) 𝜒2 statistics. Large positive LD values indicate that the covariation between
item responses is not completely modelled by a given IRT model. Local dependence was
calculated via R-Studio 1.2.5001. R computes the local dependence according to Cramer’s V.
When an item has two categories, Cramer’s V gives the same output with the phi coefficient.
The datasets of this research consisted of mixed items. Therefore, the LD matrix was interpreted
according to Cramer’s V coefficient cut-off values, the same as phi, which is > 0.15 for strong
association and > 0.25 for very strong association (Akoğlu, 2018). Table 1 summarizes the
items, which shows LD for three IRT models (for all LD values see Appendix A).

Int. J. Assess. Tools Educ., Vol. 8, No. 3, (2021) pp. 613–632
619
Table 1. Number of items with LD.
IRT Models
Uni-GPC Multi-GPC Bifactor-GPC
Math (17 items) 1 13 None
Science (38 items) None 34 None
Large positive LD values show that there is an unmodelled covariance between items by a given
IRT model (Cai et al., 2015). As seen in Table 1, for math, while only one item (M32 with
M33) showed local dependence in the uni-GPC model, for the multi-GPC model almost all
items showed local dependence. In addition to this, none of the items showed local dependence
in the bifactor-GPC model. As with the math test, similar results were seen for the science test.
In the science test, none of the items showed local dependence in the bifactor-GPC and uni-
GPC, whereas for the multi-GPC, almost all items showed local dependence. This result reveals
that in modeling of item covariance, bifactor-GPC and uni-GPC are better than multi-GPC.
Also, it seems possible that this result is due to the unmodelled item covariance regarding the
general factor in the multi-GPC.
3.2. Global Model-Data Fit and Comparison
Nested models should be compared in terms of goodness of fit with the deviance statistics. The
deviance statistics are calculated by the difference between the more complex model (more
parameters) and the reduced model (fewer parameters) and have a 𝜒2 distribution. In this study,
the Akaike information criterion (AIC) and Bayesian information criterion (BIC) were used for
model fit. Also, Cai and Monroe (2014) omnibus limited-information goodness-of-fit statistic,
𝐶2, was used for model fit. 𝐶2 was chosen over other goodness-of-fit statistics (𝑀2∗: Cai &
Henson, 2013; 𝑀2: Maydeu-Olivares & Joe, 2005) because it was suitable for the ordinal
response data and shows the same performance as 𝑀2 and 𝑀2∗ but can be more powerful (Cai
& Monroe, 2014). 𝐶2, 𝑀2and 𝑀2∗ are equal when the items are dichotomous. Because 𝐶2 has a
𝜒2 distribution, it is sensitive to the sample size. Therefore, model error or misspecification can
be computed, such as the root mean square error of approximation (RMSEA), as in the
structural equation modelling literature, but it is computed based on the 𝐶2 statistic
(𝑅𝑀𝑆𝐸𝐴𝐶2) (Toland et al., 2017). As Toland et al., (2017) emphasize, IRT models are non-
linear models and traditional RMSEA is for linear models, so cut-off (RMSEA ≤0.08- adequate
fit) should be interpreted cautiously. Smaller RMSEA values are an indicator of a better model-
data fit.
Table 2. Model-data fits for three IRT models.
IRT models -2LL BIC AIC 𝐶2 (df) 𝑅𝑀𝑆𝐸𝐴𝐶2
Math Bifactor-GPC -92372.3 185247.6 184854.7 251.78(98)*** 0.013
Uni-GPC -92739.3 185826.1 185554.6 1190.51(119)*** 0.031
Multi-GPC -92513.9 185133.9 185512.6 12156.09(104)*** 0.111
Science Bifactor-GPC -145160.2 291356.2 290556.5 1211.47(623)*** 0.013
Uni-GPC -145360.5 291423.2 290881.0 1747.55(665)*** 0.016
Multi-GPC -153924.4 308682.6 308038.8 15347.26(650)*** 0.059 *** p < 0.001
Table 2 summarizes the three IRT model comparisons. All fit statistics (AIC, BIC, 𝑅𝑀𝑆𝐸𝐴𝐶2)
prove that, for both tests, bifactor-GPC has a better fit than the other two IRT models. When
𝑅𝑀𝑆𝐸𝐴𝐶2 statistics were compared, for both tests (math and science), the bifactor-GPC model
showed the lowest value among the models. The uni-GPC model comes after the multi-GPC
model, which had the largest 𝑅𝑀𝑆𝐸𝐴𝐶2 value among the models. Since the 𝑅𝑀𝑆𝐸𝐴𝐶2 statistics

Ayan & Baris-Pekmezci
620
should be interpreted cautiously for non-linear models, they were interpreted relatively. To
understand the models in depth, detailed inspection was made for the bifactor-GPC and uni-
GPC based on the item parameters.
3.3. Comparison of Item Parameters / Model parameters
The marginal slopes are the adjusted slopes to compare the uni-GPC and bifactor-GPC models.
For the math test, when the conditional and marginal parameters were examined, there were
slight differences detected between those parameters for items M13, M53, M61, and M62,
which had slopes close to “0” on the specific trait. These differences could have occurred be-
cause the specific trait did not affect the probability of responding to the item. Only item M33
showed local dependence in the uni-GPC, and had higher slopes in both the uni-GPC and bi-
factor-GPC. Also, that item’s marginal and conditional slopes differed greatly. There was a
slight difference between uni-GPC and bifactor-GPC slope parameters. When the multi-GPC
slopes were compared with those of the uni-GPC and the marginal coefficient for the bifactor-
GPC, it was seen that the multi-GPC had larger slopes than both of the other models. Inflation
of slopes may have resulted from the larger LD values of the multi-GPC. The larger LD values
may have arisen from the undefined latent factor (general factor) underlying the items.
For the science test, similar results were obtained to those of the math test. When the conditional
and marginal parameters were examined, there were no differences detected between those pa-
rameters for items SC71 and SC94, which had slopes close to “0” on the specific trait. It was
seen that when the specific trait slopes became higher, the gap between the marginal and con-
ditional slopes increased. When the slope parameters were compared between the bifactor-GPC
and uni-GPC, slight differences were detected. When the multi-GPC slopes were compared
with those of the uni-GPC and the marginal coefficients for the bifactor-GPC, it was seen that
the multi-GPC had larger slopes than both of the other models. Inflation of slopes may have
resulted from the larger LD values and the undefined general trait of the multi-GPC.
3.4 Explained Common Variance
The explained common variance (ECV) index is a useful psychometric measure to determine
both the magnitude of the general trait related to a specific trait and essential uni-dimensionality
(Reise et al., 2010).
Table 3. Explained common variances for math items.
Item 𝐼𝐸𝐶𝑉𝐺 𝐼𝐸𝐶𝑉𝑆
M11 0.916 0.084
M12 0.760 0.240
M13 0.988 0.012
M14 0.927 0.073
M21 0.981 0.019
M22 0.773 0.227
M31 0.960 0.040
M32 0.675 0.325
M33 0.796 0.204
M41 0.920 0.080
M42 0.805 0.195
M43 0.718 0.282
M51 0.953 0.047
M52 0.965 0.035
M53 0.997 0.003
M61 0.999 0.001
M62 0.852 0.148

Int. J. Assess. Tools Educ., Vol. 8, No. 3, (2021) pp. 613–632
621
Table 4. Explained common variances for science items.
Item 𝐼𝐸𝐶𝑉𝑆 Item 𝐼𝐸𝐶𝑉𝑆 Item 𝐼𝐸𝐶𝑉𝑆 Item 𝐼𝐸𝐶𝑉𝑆
SC11 0.89 SC63 0.98 SC11 0.11 SC63 0.02
SC12 0.66 SC71 1.00 SC12 0.34 SC71 0.00
SC13 0.52 SC72 0.86 SC13 0.48 SC72 0.14
SC14 0.84 SC73 0.99 SC14 0.16 SC73 0.01
SC21 0.95 SC74 0.97 SC21 0.05 SC74 0.03
SC22 0.88 SC81 0.99 SC22 0.12 SC81 0.01
SC23 0.75 SC82 0.94 SC23 0.25 SC82 0.06
SC31 0.92 SC83 0.80 SC31 0.08 SC83 0.20
SC32 0.78 SC91 0.82 SC32 0.22 SC91 0.18
SC33 0.92 SC92 0.98 SC33 0.08 SC92 0.02
SC34 0.91 SC93 0.91 SC34 0.09 SC93 0.09
SC35 0.85 SC94 1.00 SC35 0.15 SC94 0.00
SC41 0.83 SC101 0.98 SC41 0.17 SC101 0.02
SC42 0.95 SC102 0.80 SC42 0.05 SC102 0.20
SC51 0.90 SC103 0.85 SC51 0.10 SC103 0.15
SC52 0.92 SC104 0.92 SC52 0.08 SC104 0.08
SC53 0.96 SC105 0.81 SC53 0.04 SC105 0.19
SC61 0.71 SC111 0.87 SC61 0.29 SC111 0.13
SC62 0.96 SC112 0.90 SC62 0.04 SC112 0.10
Table 3 and Table 4 summarize The ECV indices, which were calculated for items, and general
and specific traits. For the math data, results showed that general trait and specific factors
explained respectively 86%, 2%, 1%, 7%, 4%, 0.40% and 0.10% of the common variance.
Specific traits explained a small amount of variance in contrast with the general trait except S3,
which explained 7% of the variance. That specific factor contained the items (M33 with M32)
with LD in the uni-GPC model. This proves that the S3 specific factor had a unique effect on
those items. Because other specific factors had a small amount of unique (specific) variance,
the uni-GPC model may have shown almost the same slope parameters as the bifactor-GPC.
For the science test, results showed that general trait and specific factors explained respectively
89%, 2%, 1%, 2%, 0%, 1%, 1%, 0%, 1%, 0%, 3% and 1% of the common variance. Specific
traits explained a small amount of the variance. As with the math test, because of the low
uniqueness, the uni-GPC and bifactor-GPC slope parameter estimates also became closer in the
science test.
4. DISCUSSION and CONCLUSION
Within the scope of the study, an attempt was made to determine the most appropriate
estimation model for the data by comparing the uni-GPC, multi-GPC and bifactor-GPC model
estimations for the two booklets selected from the science and math sections of the PISA 2018.
As a result, an effort was made to eliminate the unit-testlet ambiguity in PISA in the literature.
Care was taken to ensure that both the testlet item groups and the binary and multiple scored
item samples were all together in the selected booklets, and how this situation would affect the
estimation results was emphasized. In this context, model-fit indices related to the three models
(uni-GPC, multi-GPC, bifactor-GPC), differences in item parameter estimation results, and
variance ratios explained within the scope of general and specific traits were examined. Before
presenting and discussing the results, it can be said that the first findings were very similar for
the science and math data. The discussions within this scope are valid for both areas.

Ayan & Baris-Pekmezci
622
In the literature, it was stated that in addition to interaction among the items, multi-
dimensionality can also reveal local item dependence (Embretson & Reise, 2000; Tuerlinckx
& De Boeck, 2001). In this context, it was observed in this study that the items were multi-
dimensional for both data sets (math and science) in the dimensionality analyses made before
starting the estimations. However, when the model-data fit analyses were examined, it was seen
that the multi-GPC model indicated the worst fit in both the math and science data set. While
the bifactor-GPC model provided the best fit, the uni-GPC model fit was very close to that of
the bifactor-GPC. Among the compared models, the bifactor-GPC model was expected to
indicate the best model fit, which is a consistent finding with the studies by Demars (2006) and
Yılmaz Koğar (2016). On the other hand, the fact that the data set of the uni-GPC provided
close results to those of the bifactor-GPC and that the multi-GPC provided the worst fit is an
unexpected case. This may be because the data set has minor factors. McDonald (2000) explains
that the bifactor model should only be meaningfully applied when definable “content facets”
that form well-structured secondary dimensions exist. Additionally, Ackerman et al., (2003)
state that if subsets of items are from distinct content areas and/or cognitive skills, these items
have the potential of being in distinct dimensions.
In order to make a detailed investigation between the models, the item parameters were also
examined. While the slopes were very close to each other in the bifactor-GPC and uni-GPC
models, larger slopes were obtained in the multi-GPC model than in the other two models. For
this case, it can be said that the unmodelled covariance causes slope parameters to be
overestimated. The fact that slopes were larger than actual in item parameter estimations
without considering local independence is consistent with many study findings in the literature
(Ackerman, 1987; Bradlow et al., 1999; Chen & Thissen, 1997; DeMars, 2006; DeMars, 2012;
Lee et al., 2001; Li et al., 2005; Sireci et al., 1991; Tuerlinckx & De Boeck, 2001; Wainer et
al., 2000; Wang & Wilson, 2005; Yen, 1993).
Examining the variance rates explained on the basis of general and specific factors was another
investigation made on the dataset. Most of the variance explained (about 85%) stemmed from
the general trait. The effect of specific traits on the variance was very low.
In the specific trait that had the highest contribution to variance in the math data, it was seen
that the uni-GPC model analyses included locally dependent items (M32-M33), which is in fact
exactly as expected. Locally dependent items also showed considerable weight in the specific
trait. However, when the math data were evaluated as a whole, it was determined that the
specific factor weights predominantly were quite small, which means that there was a data set
with a dominant general factor. This finding is also consistent with the model fit result. Having
a dominant general factor caused the model to be the most compatible with the data, after the
bifactor model, to be a uni-dimensional IRT model rather than a multi-dimensional model. This
result may mean that the accepted assumption in the literature that analyzing with uni-
dimensional models will have erroneous results when there is a testlet item must be rethought,
and that its limits must be redrawn. In their study with a data set made up of questions based on
a reading passage, Baldonado et al., (2015) pointed out the danger that simple approaches that
accept all of the items using the same content as local dependent could overestimate the actual
dependence among the items. In order to reach more accurate conclusions about the dependence
of the items, they proposed another method in which the “necessary information”, which
indicated the information used in the passage to examine the content of each item and answer
the item correctly, was identified. They argued that the entire passage is less important than the
part, which is required to answer an item correctly, and that the approach that assumes the items
as dependent since they belong to the same passage, regardless of whether the items share
common “necessary information”, would be an overly general approach. Often, multiple
questions associated with the same passage refer to different parts of the text. In such cases, a
situation where a common passage causes some dependence among the item response processes

Int. J. Assess. Tools Educ., Vol. 8, No. 3, (2021) pp. 613–632
623
may not occur. This also points to the need to consider to what extent the items with the same
content in PISA are testlets in various studies. On the other hand, the method proposed by
Baldonado et al., (2015) requires examining the item contents based on expert opinion.
Considering that PISA items are not disclosed, this situation becomes quite difficult. In cases
in which the effect of specific factors is very low in the data set and a general factor is observed,
researchers’ analysis with uni-IRT will not cause a large bias in the results.
In the light of all these results and discussions, researchers who are to work on testlet items are
recommended not to make decisions based on the use of the same content only and if possible,
to examine the contents of the items in detail. If this is not possible, it is suggested that they
decide which model is to be used by carefully examining the variance rates (based on general
and specific factors) which are explained by the local dependence analysis results.
Declaration of Conflicting Interests and Ethics
The authors declare no conflict of interest. This research study complies with research
publishing ethics. The scientific and legal responsibility for manuscripts published in IJATE
belongs to the authors.
Authorship Contribution Statement
Cansu Ayan: Investigation, Resources, Visualization, Software, Analyze, and Writing. Fulya
Baris-Pekmezci: Investigation, Methodology, Analyze, Supervision, Validation, and Writing.
ORCID
Cansu Ayan https://orcid.org/0000-0002-0773-5486
Fulya Baris Pekmezci https://orcid.org/0000-0001-6989-512X
5. REFERENCES
Ackerman, T. A. (1987, April). The robustness of LOGIST and BILOG IRT estimation pro-
grams to violations of local independence. Paper presented at the annual meeting of the
American Educational Research Association. Washington, DC.
Ackerman, T. A., Gierl, M. J., & Walker, C. M. (2003). Using multidimensional item response
theory to evaluate educational and psychological tests. Educational Measurement: Issues
and Practice, 22(3), 37-51. https://doi.org/10.1111/j.1745-3992.2003.tb00136.x
Akoğlu, H. (2018). User's guide to correlation coefficients. Turkish Journal of Emergency Med-
icine, 18(3), 91-93. https://doi.org/10.1016/j.tjem.2018.08.001
Baldonado, A. A., Svetina, D., & Gorin, J. (2015). Using necessary information to identify item
dependence in passage-based reading comprehension tests. Applied Measurement in
Education, 28(3), 202-218. https://doi.org/10.1080/08957347.2015.1042154
Bao, H. (2007). Investigating differential item function amplification and cancellation in
application of item response testlet models [Doctoral dissertation, University of
Maryland]. ProQuest Dissertations and Theses Global.
Bradlow, E. T., Wainer, H., & Wang, X. (1999). A Bayesian random effects model for testlets.
Psychometrika, 64, 153–168.
Cai, L. (2010). Metropolis-Hastings Robbins-Monro algorithm for confirmatory item factor
analysis. Journal of Educational and Behavioral Statistics, 35(3), 307-335.
https://doi.org/10.3102/1076998609353115
Cai, L., du Toit, S. H. C., & Thissen, D. (2015). IRTPRO: Flexible professional item response
theory modeling for patient reported outcomes (version 3.1) [computer software]. SSI-
International.
Cai, L., & Hansen, M. (2013). Limited-information goodness-of-fit testing of hierarchical item
factor models. British Journal of Mathematical and Statistical Psychology, 66(2), 245-
276. https://doi.org/10.1111/j.2044-8317.2012.02050.x

Ayan & Baris-Pekmezci
624
Cai, L., & Monroe, S. (2014). A new statistic for evaluating item response theory models for
ordinal data. (CRESST Report 839). National Center for Research on Evaluation,
Standards, and Student Testing (CRESST).
Canivez, G. L. (2016). Bifactor modeling in construct validation of multifactored tests:
Implications for understanding multidimensional constructs and test interpretation. In K.
Schweizer & C. DiStefano (Eds.). Principles and methods of test construction: Standards
and recent advancements (pp. 247-271). Hogrefe Publishers.
Chen, W. H., & Thissen, D. (1997). Local dependence indexes for item pairs using item re-
sponse theory. Journal of Educational and Behavioral Statistics, 22(3), 265–289.
https://doi.org/10.3102/10769986022003265
Chon, K. H., Lee, W., & Ansley, T. N. (2007). Assessing IRT model-data fit for mixed format
tests. (CASMA Research Report 26). Center for Advanced Studies in Measurement and
Assessment.
DeMars, C. E. (2006). Application of the bi-factor multidimensional item response theory
model to testlet-based tests. Journal of Educational Measurement, 43, 145–168.
https://doi.org/10.1111/j.1745-3984.2006.00010.x
DeMars, C. E. (2012). Confirming testlet effects. Applied Psychological Measurement, 36,
104–121. https://doi.org/10.1177/0146621612437403
Embretson, S., & Reise, S. P. (2000). Item response theory for psychologists. Mahwah: Law-
rence Erlbaum Associates Inc.
Fukuhara, H., & Kamata, A. (2011). Functioning analysis on testlet-based items a bifactor mul-
tidimensional item response theory model for differential items. Applied Psychological
Measurement, 35(8), 604–622. https://doi.org/10.1177/0146621611428447
Gibbons, R. D., & Hedeker, D. R. (1992). Full-information bi-factor analysis. Psychometrika,
57, 423–436.
Hambleton, R. K., Swaminathan, H., & Rogers, H. J. (1991). Fundamentals of item response
theory. SAGE Publications.
Holzinger, K. J., Swineford, F. (1937). The Bi-factor method. Psychometrika, 2, 41–54.
https://doi.org/10.1007/BF02287965
Houts, C. R., & Cai, L. (2013). Flexible multilevel multidimensional item analysis and test
scoring [FlexMIRT R user’s manual version 3.52]. Vector Psychometric Group.
Ip, E. H. (2010). Interpretation of the three-parameter testlet response model and information
function. Applied Psychological Measurement, 34(7), 467-482. https://doi.org/10.1177/
0146621610364975
Lee, G., Dunbar, S. B., & Frisbie, D. A. (2001). The relative appropriateness of eight
measurement models for analyzing scores from tests composed of testlets. Educational
and Psychological Measurement, 61, 958-975. https://doi.org/10.1177/00131640121971
590
Li, Y., Bolt. D. M., & Fu, J. (2005). A test characteristic curve linking method for the testlet
model. Applied Psychological Measurement, 29(5), 340-356. https://doi.org/10.1177/01
46621605276678
Marais, I. D., & Andrich, D. (2008). Effects of varying magnitude and patterns of local depend-
ence in the unidimensional Rasch model. Journal of Applied Measurement, 9, 105–124.
Maydeu-Olivares, A., & Joe, H. (2005). Limited and full information estimation and testing in
2" contingency tables: A unified framework. Journal of the American Statistical Associ-
ation. https://doi.org/10.1198/016214504000002069
McDonald, R. P. (2000). A basis for multidimensional item response theory. Applied
Psychological Measurement, 24(2), 99-114. https://doi.org/10.1177/0146621002203155
2

Int. J. Assess. Tools Educ., Vol. 8, No. 3, (2021) pp. 613–632
625
Muraki, E. (1992). A generalized partial credit model: Application of an EM algorithm. ETS
Research Report Series, 1992(1), i-30. https://doi.org/10.1002/j.2333-8504.1992.tb0143
6.x
OECD (2019a). “PISA 2018 Mathematics Framework”. in PISA 2018 Assessment and Analyt-
ical Framework. OECD Publishing. https://doi.org/10.1787/13c8a22c-en
OECD (2019b). “PISA 2018 Science Framework”. in PISA 2018 Assessment and Analytical
Framework. OECD Publishing. https://doi.org/10.1787/f30da688-en
OECD (2019c). “Scaling PISA data”. in PISA 2018 Technical Report. OECD Publishing.
https://www.oecd.org/pisa/data/pisa2018technicalreport/Ch.09-Scaling-PISA-Data.pdf
Reise, S. P., Moore, T. M., & Haviland, M. G. (2010). Bifactor models and rotations: Exploring
the extent to which multidimensional data yield univocal scale scores. Journal of Person-
ality Assessment, 92(6), 544-559. https://doi.org/10.1080/00223891.2010.496477
Revelle, W., & Revelle, M. W. (2015). Package ‘psych’. The comprehensive R archive network,
337, 338.
Sireci, S. G., Thissen. D., & Wainer, H. (1991). On the reliability of testlet-based tests. Journal
of Educational Measurement, 28, 237-247. https://doi.org/10.1111/j.1745-3984.1991.tb
00356.x
Stucky, B. D., & Edelen, M. O. (2014). Using hierarchical IRT models to create unidimensional
measures from multidimensional data. In S. P. Reise & D. A. Revicki (Eds.) Handbook
of item response theory modelling. (pp. 201-224). Routledge.
Stucky, B. D., Thissen, D., & Orlando Edelen, M. (2013). Using logistic approximations of
marginal trace lines to develop short assessments. Applied Psychological
Measurement, 37(1), 41-57. https://doi.org/10.1177/0146621612462759
Toland, M. D., Sulis, I., Giambona, F., Porcu, M., & Campbell, J. M. (2017). Introduction to
bifactor polytomous item response theory analysis. Journal of School Psychology, 60, 41-
63. https://doi.org/10.1016/j.jsp.2016.11.001
Tuerlinckx, F., & De Boeck, P. (2001). The effect of ignoring item interactions on the estimated
discrimination parameters in item response theory. Psychological Methods, 6(2), 181–
195. https://doi.org/10.1037/1082-989X.6.2.181
Wainer, H., Bradlow, E. T., & Du, Z. (2000). Testlet response theory: An analog for the 3PL
model useful in testlet-based adaptive testing. In W. J. van der Linden & C. A. W Glas
(Eds.). Computerized adaptive testing: Theory and practice (pp. 245–269). Springer,
Dordrecht.
Wainer, H., & Lewis, C. (1990). Toward a psychometrics for testlets. Journal of Educational
Measurement, 27(1), 1–14. https://doi.org/10.1111/j.1745-3984.1990.tb00730.x
Wainer, H., & Wang, X. (2000). Using a new statistical model for testlets to score TOEFL.
Journal of Educational Measurement, 37(3), 203–220. https://doi.org/10.1111/j.1745-
3984.2000.tb01083.x
Wang, W. C., & Wilson, M. (2005). The Rasch testlet model. Applied Psychological
Measurement, 29(2), 126-149. https://doi.org/10.1177/0146621604271053
Yen, W. M. (1993). Scaling performance assessments Strategies for managing local item
dependence. Journal of Educational Measurement, 30, 187-213. https://doi.org/10.1111
/j.1745-3984.1993.tb00423.x
Yılmaz Kogar, E. (2016). Madde takımları içeren testlerde farklı modellerden elde edilen
madde ve yetenek parametrelerinin karşılaştırılması [Comparison of item and ability
parameters obtained from different models on tests composed of testlets] [Doctoral
dissertation, Hacettepe University]. Hacettepe University Libraries, https://avesis.hacett
epe.edu.tr/yonetilen-tez/c2ade6a0-6a2d-4147-beb0-8a3feb0642c5/madde-takimlari-
iceren-testlerde-farkli-modellerden-elde-edilen-madde-ve-yetenek-parametrelerinin-
karsilastirilmasi

Ayan & Baris-Pekmezci
626
6. APPENDIX
6.1. Appendix A
Figure A1. LD values from math data for three IRT models.
*Note: u=uni-GPC model, m=multi-GPC model
Figure A2. LD values from science data for three IRT models.

Int. J. Assess. Tools Educ., Vol. 8, No. 3, (2021) pp. 613–632
627
6.2. Appendix B
Table B1. Uni-GPC and Multi-GPC parameters for Math.
Uni-GPC Multi-GPC
Item id. a1 c1 c2 a1 a2 a3 a4 a5 a6 c1 c2
M11 1.02 0.19 1.27 1.15 0.31 1.38
M12 1.44 1.39 1.60 1.46 M13 0.86 -1.59 -1.84 0.95 -1.59 -1.92
M14 0.98 0.30 1.04 0.31 M21 1.72 -0.15 2.34 -0.16 M22 0.87 -0.23 0.96 -0.23 M31 1.39 2.52 1.55 2.66 M32 1.56 0.45 2.03 0.55 M33 2.60 -1.36 5.13 -2.32 M41 1.66 1.30 1.99 1.45 M42 1.60 -0.64 2.01 -0.71 M43 0.84 -2.48 -0.38 1.02 -2.42 -0.41
M51 1.06 1.24 1.12 1.27 M52 1.36 -0.58 1.50 -0.60 M53 1.19 -2.93 -3.40 1.37 -3.00 -3.74
M61 1.22 1.21 2.00 1.54 M62 0.42 -0.50 0.42 -0.50
Table B2. Bifactor-GPC conditional parameters for Math.
Item id. ag a1 a2 a3 a4 a5 a6 c1 c2
M11 1.07 0.33 0.27 1.35
M12 1.59 0.90 1.56
M13 0.88 0.09 -1.59 -1.86
M14 0.99 0.27 0.31
M21 1.79 0.25 -0.14
M22 0.93 0.52 -0.24
M31 1.41 0.30 2.56
M32 1.95 1.59 0.62
M33 3.70 2.11 -1.99
M41 1.70 0.51 1.35
M42 1.72 0.89 -0.70
M43 1.01 0.66 -2.37 -0.46
M51 1.09 0.24 1.26
M52 1.39 0.26 -0.59
M53 1.23 0.05 -2.94 -3.47
M61 1.26 0.03 1.23
M62 0.42 0.18 -0.51
Ayan & Baris-Pekmezci
628
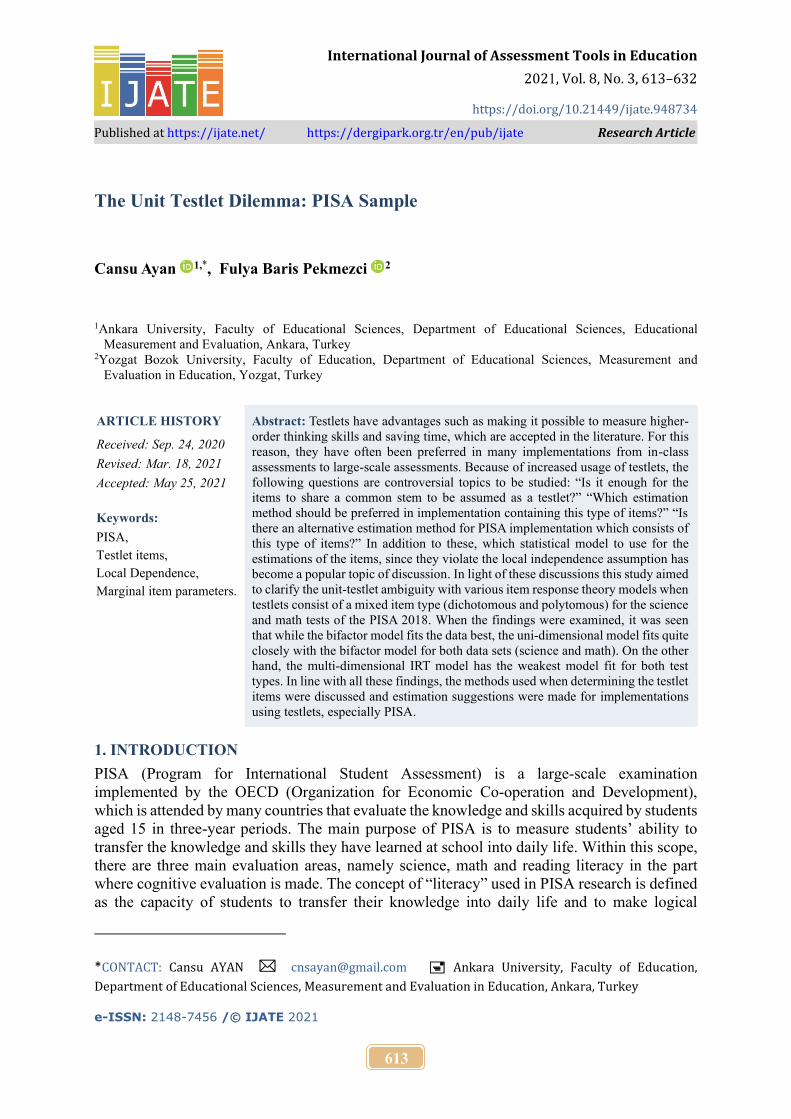
Table B3. Bifactor-GPC marginal parameters for Math.
Item id. ag a1 a2 a3 a4 a5 a6 b1 b2
M11 1.06 0.28 0.26 1.26
M12 1.40 0.66 0.98
M13 0.88 0.08 -1.81 -2.12
M14 0.98 0.23 0.31
M21 1.77 0.17 -0.08
M22 0.88 0.46 -0.25
M31 1.39 0.23 1.82
M32 1.43 1.04 0.32
M33 2.32 0.88 -0.54
M41 1.63 0.36 0.80
M42 1.52 0.63 -0.41
M43 0.94 0.57 -2.36 -0.46
M51 1.08 0.20 1.15
M52 1.37 0.20 -0.42
M53 1.23 0.04 -2.40 -2.83
M61 1.26 0.03 0.97
M62 0.42 0.17 -1.21

Int. J. Assess. Tools Educ., Vol. 8, No. 3, (2021) pp. 613–632
629
Table B4. Uni- GPC model parameters for Science.
a1 a2 a3 a4 a5 a6 a7 a8 a9 a10 a11 c1 c2
1.37
0.23
0.94
-1.19
0.66
0.03
1.28
-0.73
2.01
-0.50
1.10
-0.12
0.96
1.08
0.73
0.48 0.77
1.59
1.54
2.22
0.00
1.20
0.53 0.05
1.42
-2.16 -3.22 0.94
-0.14
1.50
-1.05
1.61
-0.09
1.10
0.63
1.22
0.20
0.79
0.51
1.31
0.34
1.59
1.33
0.65
-0.30
0.88
0.70
1.22
0.21
1.19
-0.68
1.06
1.47
1.81
1.07
0.76
-0.77 -1.30
0.63
-0.53
1.62
0.72
0.82
-0.07
1.54
0.31
1.25
-0.65
4.32
3.02
2.25
0.24
2.07
-1.40
0.94
-1.70
1.08 -0.89
1.49 2.32

Ayan & Baris-Pekmezci
630
Table B5. Multi-GPC model parameters for Science.
a1 a2 a3 a4 a5 a6 a7 a8 a9 a10 a11 c1 c2
1.37
0.23
0.94
-1.19
0.66
0.03
1.28
-0.73
2.01
-0.50
1.10
-0.12
0.96
1.08
0.73
0.48 0.77
1.59
1.54
2.22
0.00
1.20
0.53 0.05
1.42
-2.16 -3.22 0.94
-0.14
1.50
-1.05
1.61
-0.09
1.10
0.63
1.22
0.20
0.79
0.51
1.31
0.34
1.59
1.33
0.65
-0.30
0.88
0.70
1.22
0.21
1.19
-0.68
1.06
1.47
1.81
1.07
0.76
-0.77 -1.30
0.63
-0.53
1.62
0.72
0.82
-0.07
1.54
0.31
1.25
-0.65
4.32
3.02
2.25
0.24
2.07
-1.40
0.94
-1.70
1.08 -0.89
1.49 2.32
Int. J. Assess. Tools Educ., Vol. 8, No. 3, (2021) pp. 613–632
631
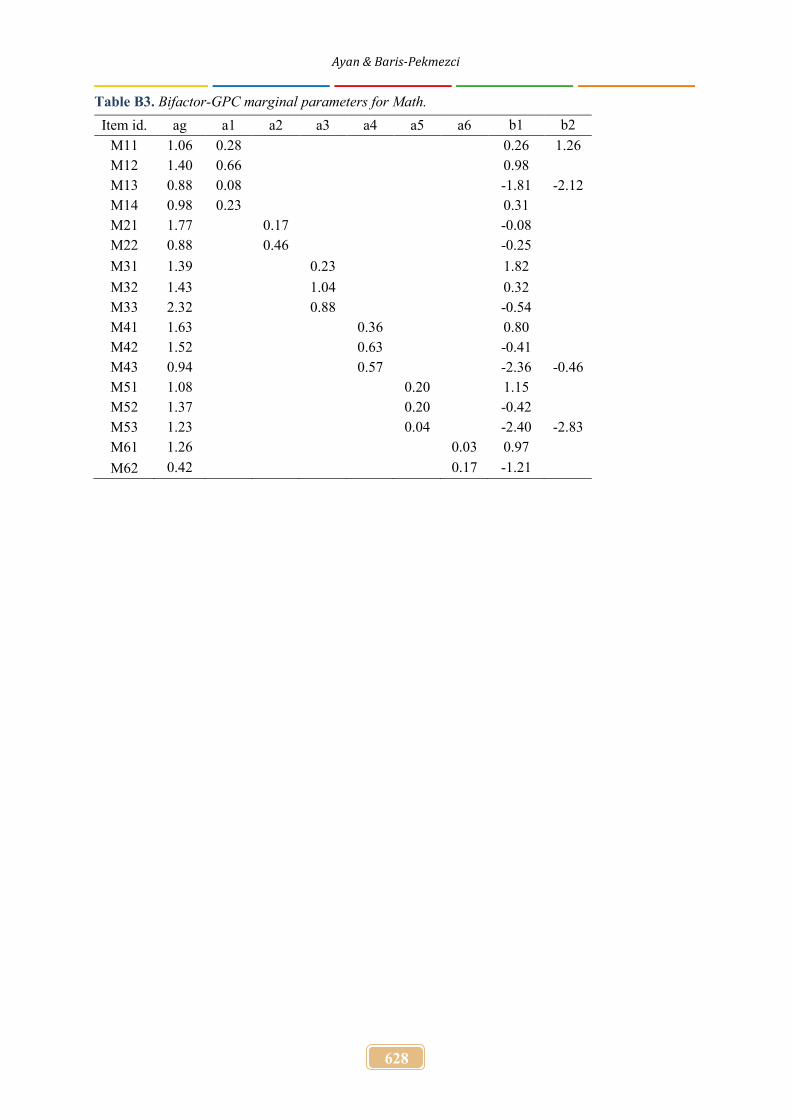
Table B6. Bifactor-GPC conditional parameters for Science.
ag a1 a2 a3 a4 a5 a6 a7 a8 a9 a10 a11 c1 c2
1.12 0.39 0.21 0.82 0.59 -1.22 0.56 0.55 0.03 1.03 0.45 -0.71 1.60 0.35 -0.46 1.02 0.37 -0.13 0.89 0.52 1.10 0.67 0.19 0.46 0.75
1.47 0.78 1.58 1.96 0.56 -0.02 1.09 0.35 0.49 0.03
1.38 0.58 -2.20 -3.38
0.80 0.37 -0.14 1.12 0.25 -0.96 1.44 0.49 -0.11 0.95 0.27 0.60 1.08 0.20 0.19 0.74 0.49 0.52 1.15 0.25 0.32 1.30 0.19 1.22 0.71 0.00 -0.31 0.81 0.33 0.69 1.19 0.14 0.20 1.22 0.22 -0.71 1.08 0.12 1.50 1.49 0.38 1.01 0.80 0.40 -0.76 -1.40
0.66 0.32 -0.54 1.42 0.20 0.68 0.84 0.26 -0.08 1.63 -0.02 0.30 1.58 -0.22 -0.74 3.21 1.60 2.63 2.09 0.88 0.22 1.91 0.58 -1.41 0.93 0.46 -1.75 1.22 0.48 -0.98 1.43 0.49 2.33

Ayan & Baris-Pekmezci
632
Table B7. Bifactor-GPC marginal parameters for Science.
ag a1 a2 a3 a4 a5 a6 a7 a8 a9 a10 a11 b1 b2
1.09 0.32 -0.19
0.77 0.53 1.58
0.53 0.52 -0.05
1.00 0.38 0.71
1.57 0.26 0.29
1.00 0.32 0.13
0.85 0.46 -1.30
0.66 0.18 -0.69 -1.13
1.34 0.59 -1.18
1.86 0.37 0.01
1.07 0.29 -0.46 -0.03
1.30 0.45 1.69 2.59
0.78 0.34 0.18
1.11 0.21 0.86
1.39 0.37 0.08
0.94 0.24 -0.64
1.08 0.17 -0.17
0.72 0.44 -0.72
1.14 0.21 -0.28
1.29 0.15 -0.95
0.71 0.00 0.43
0.79 0.29 -0.87
1.19 0.12 -0.17
1.21 0.18 0.58
1.08 0.10 -1.40
1.46 0.29 -0.69
0.78 0.36 0.98 1.80
0.65 0.30 0.84
1.41 0.16 -0.48
0.83 0.23 0.09
1.63 -0.02 -0.18
1.56 -0.16 0.48
2.34 0.75 -1.12
1.86 0.56 -0.12
1.80 0.39 0.78
0.89 0.40 1.95
1.17 0.39 0.84
1.37 0.37 -1.70


![Comparison of integrated testlet and constructed-response ...examination [10,13]. A reading comprehension testlet provides a classic example of a traditional testlet, with a ... chem-istry,](https://static.fdocuments.net/doc/165x107/5f1781c12018f27c6453dbbd/comparison-of-integrated-testlet-and-constructed-response-examination-1013.jpg)