The Union Wage Premium in the US and the UK - Dartmouth College
43
The Union Wage Premium in the US and the UK David G. Blanchflower ‡ and Alex Bryson † David Blanchflower Alex Bryson Department of Economics Policy Studies Institute, Dartmouth College 100 Park Village East Hanover, NH 03755 London NW1 3SR Email: [email protected] [email protected] Internet: www.dartmouth.edu/~blnchflr www.psi.org.uk/people/person.asp?person_id=14 We thank Bernt Bratsberg, Bernard Corry, Henry Farber, Richard Freeman, Barry Hirsch, Andrew Oswald, Jim Ragan, participants at NBER Labor Studies and the 56 th Annual Meeting of the Industrial Relations Research Association in San Diego for their comments. We also thank the Economic and Social Research Council for their financial assistance (grant R000223958). We thank the BSAS team – particularly Katarina Thomson – at the National Centre for Social Research for providing the BSAS data. We acknowledge the Department of Trade and Industry, the Economic and Social Research Council, the Advisory, Conciliation and Arbitration Service and the Policy Studies Institute as the originators of the 1998 Workplace Employee Relations Survey data, and the Data Archive at the University of Essex as the distributor of the WERS data. None of these organizations or individuals bears any responsibility for the authors’ analysis and interpretations of the data. ‡ Bruce V. Rauner 1978 Professor of Economics, Dartmouth College and Research Associate, National Bureau of Economic Research † Principal Research Fellow, Policy Studies Institute and Research Associate, Centre for Economic Performance, London School of Economics.
Transcript of The Union Wage Premium in the US and the UK - Dartmouth College

The Union Wage Premium in the US and the UK
David G. Blanchflower‡ and Alex Bryson†
David Blanchflower Alex Bryson Department of Economics Policy Studies Institute, Dartmouth College 100 Park Village East Hanover, NH 03755 London NW1 3SR Email: [email protected] [email protected] Internet: www.dartmouth.edu/~blnchflr www.psi.org.uk/people/person.asp?person_id=14
We thank Bernt Bratsberg, Bernard Corry, Henry Farber, Richard Freeman, Barry Hirsch, Andrew Oswald, Jim Ragan, participants at NBER Labor Studies and the 56th Annual Meeting of the Industrial Relations Research Association in San Diego for their comments. We also thank the Economic and Social Research Council for their financial assistance (grant R000223958). We thank the BSAS team – particularly Katarina Thomson – at the National Centre for Social Research for providing the BSAS data. We acknowledge the Department of Trade and Industry, the Economic and Social Research Council, the Advisory, Conciliation and Arbitration Service and the Policy Studies Institute as the originators of the 1998 Workplace Employee Relations Survey data, and the Data Archive at the University of Essex as the distributor of the WERS data. None of these organizations or individuals bears any responsibility for the authors’ analysis and interpretations of the data.
‡ Bruce V. Rauner 1978 Professor of Economics, Dartmouth College and Research Associate, National Bureau of Economic Research † Principal Research Fellow, Policy Studies Institute and Research Associate, Centre for Economic Performance, London School of Economics.

Abstract
This paper presents evidence of both counter-cyclical and secular decline in the union
membership wage premium in the US and the UK over the last couple of decades. The premium
has fallen for most groups of workers, the main exception being public sector workers in the US.
By the beginning of the 21st Century the premium remained substantial in the US but there was
no premium for many workers in the UK. Industry, state and occupation-level analyses for the
US identify upward as well as downward movement in the premium characterized by regression
to the mean. Using linked employer-employee data for Britain we show estimates of the
membership premium tend to be upwardly biased where rich employer data are absent and that
OLS estimates are higher than those obtained with propensity score matching.
JEL classification: J51, J52 Keywords: union membership wage premium.

The decline in union density in the United States and the United Kingdom has prompted some
commentators to wonder whether unions matter anymore. In particular, there has been
speculation that the intensification of competition since the 1980s, coupled with a diminution of
union bargaining strength, has prevented unions from obtaining the sort of wage premium they
achieved in the past. It is evident that unions are not as central to the economy as they used to be,
but union decline is not apparent everywhere: many employers continue to contend with strong
unions, raising important questions about union effects in those sectors.
This paper estimates trends in the union wage premium over the last few decades in the
UK and the US. We identify both counter-cyclical and secular decline in the union membership
wage premium in the US and the UK over the last couple of decades. The premium has fallen for
most groups of workers, the main exception being public sector workers in the US. By the
beginning of the 21st Century the premium remained substantial in the US but there was no
premium for many workers in the UK. Industry, state and occupation-level analyses for the US
identify upward as well as downward movement in the premium characterized by regression to
the mean. We also indicate the need for some caution in interpreting the magnitude of the
premium estimated using standard OLS techniques. Using linked employer-employee data for
Britain, we show estimates of the membership premium tend to be upwardly biased where rich
employer data are absent and that OLS estimates are higher than those obtained with propensity
score matching.
Background
In his definitive empirical work, H. Gregg Lewis (1986) found that the overall impact of
unions in the US economy was approximately 15 per cent and showed relatively little variation
across years – varying between 12 per cent and 19 per cent between 1967 and 1979. Subsequent
2
work confirmed constancy of the differential until the 1990s. For example, Hirsch and his co-
authors have produced a series of papers estimating changes in the differential over time and
concluded there has been some decline in the premium in recent years (e.g. Hirsch, Macpherson
and Schumacher, 2002; Hirsch and Schumacher, 2002; Hirsch and Macpherson, 2002).
Bratsberg and Ragan (2002) come to similar conclusions in their examination of private sector
union wage differentials. They also conclude that dispersion in the wage premium across
industries has substantially declined as the US economy has become more competitive.
Counter-cyclical movement in the union wage premium may occur when unions can
protect their members from downward wage pressures workers in general face when market
conditions are unfavorable (Freeman and Medoff, 1984). Conversely, when demand for labor is
strong, employees rely less on unions to bargain for better wages because market rates rise
anyway. A second factor that might induce counter-cyclical movement in the premium is the
length of union contracts relative to non-union ones, which means union wages are less
responsive to the cycle. However, if the union premium comes from employers sharing rents, it
is plausible that the premium will be higher when those rents are higher, in which case the wage
gap would be pro-cyclical. Empirical evidence suggests pro-cyclical movement in union wages
in the 1970s (Moore and Raisian, 1980; Grant, 2001), disappeared in the 1980s (Grant, 2001;
Wunnava and Okunade, 1996). Taking a longer-time frame through to 1999, Bratsberg and
Ragan (2002) find clear evidence of a counter-cyclical union wage premium.
A factor that should reduce the cyclical sensitivity of the union wage premium is the cost-
of-living-adjustment (COLA) clauses in union contracts that increase union wages in response to
increases in the consumer price level. According to Freeman and Medoff (1984: 54), despite a
dramatic rise in COLA coverage in the 1970s, their wage estimates for manufacturing suggest

3
that COLA provisions “contributed only a modest amount to the rising union advantage” in the
1970s. Bratsberg and Ragan (2002) revisit this issue and find an increased sensitivity of the
premium to the cycle that they attribute, in part, to reduced COLA coverage from the late 1980s.
The recent spate of studies that have looked at the impact of union membership on wages
in the UK has been occasioned by a growing belief that the union wage premium may be falling.
Some argue that a decline in the average union premium is consistent with diminishing union
influence over pay setting. There is certainly evidence pointing in that direction. First, case
studies suggest the scope of bargaining has narrowed substantially in companies that continue to
bargain with unions (Brown et al., 1998). Second, pay settlements in the private sector by the end
of the 1990s were no greater where trade unions were involved than in their absence (Forth and
Millward, 2000a). Third, even where managers say employees have their pay set through
workplace-level or organization-level collective bargaining, union representatives and officials
are either not involved or are only consulted in a minority of cases (Millward, Forth and Bryson,
2001). But there is also evidence to the contrary. For example, unions continue to have a
substantial effect on pay structures, bringing up the wages of the lowest paid and thus narrowing
pay differentials across gender, ethnicity, health and occupation (Metcalf, Hansen, and
Charlwood, 2001). These studies, which indicate union effects despite substantial declines in
union density, might suggest that those unions that have survived are the stronger and, as such,
better able to command a wage premium (thus raising the “batting average” of unions).
The consensus in the earlier literature is that the mean union wage gap was approximately
10 per cent (Blanchflower, 1999). Despite the rapid decline in union density experienced in the
UK since 1979, the gap remained roughly constant from 1970 – the year for which the earliest

4
estimate is available (Shah, 1984) – to 1995 (see Blanchflower, 1999).1 However, while the
union effect was persisting, the premium declined for some workers (Blanchflower, 1999;
Hildreth, 1999). Hildreth (1999: 7) argues that stability in the union premium for blue-collar
male workers in 1991-95 compared with a declining premium for their white-collar counterparts
may reflect their respective abilities to maintain their bargaining power. The picture emerging
from research through to 1998/99 is suggestive of a more widespread decline in the premium.
Machin’s (2001) analysis of longitudinal data from the British Household Panel Survey indicates
that, although there was a wage gain for people moving into union jobs in the early 1990s, this
had disappeared by the late 1990s. Booth and Bryan (2004) using linked employer-employee
data for 1998 also find no significant wage premium. Forth and Millward (2002b) find the
premium was confined to workers in workplaces with high bargaining coverage or multiple
unions.
On the basis of this evidence for the UK, it is difficult to establish what has happened to
the trend in the premium over time because, as others note (Andrews et al., 1998; Lanot and
Walker, 1998: 343) there have been no studies estimating the premium over the 1980s and 1990s
with a consistent methodology and comparable data.
Trends in the union wage premium in the United States
Table 1 presents estimates of the wage gap using separate log hourly earnings equations
for each of the years from 1973 to 1981 using the National Bureau of Economic Research’s
(NBER) May Earnings Supplements to the Current Population Survey (CPS) and for the years
1 However, there is some dispute on this question. Establishment-level analyses indicate that the union wage premium in the early 1980s was most evident where unions were strong, as indicated by the presence of a closed shop (Stewart, 1987). This premium seems to have declined in the second half of the 1980s, a trend which has been attributed to a decline in the incidence and impact of the closed shop, coupled with unions’ inability to establish differentials in new workplaces (Stewart, 1995).

5
since then using data from the NBER’s Matched Outgoing Rotation Group (MORG) files of the
CPS.2 For both the May and the MORG files a broadly similar, but not identical, list of control
variables is used, including a union status dummy, age and its square, a gender dummy,
education, race and hours controls plus state and industry dummies.
(Table 1 near here)
The first column of Table 1 reports time-consistent estimates of the union wage premium
for the union coefficient in log hourly earnings equations for the total sample whereas the second
and third columns report them for the private sector. Results obtained by Hirsch and Schumacher
(2002) with a somewhat different set of controls are reported in the final column of the table.3
The time series properties of all three of the series are essentially the same.
The wage gap averages between 17 and 18 percent over the period, and is similar in size
in the private sector as it is in the economy as a whole. What is notable is the high differential in
the early-to-mid 1980s and a slight decline thereafter, which gathers pace after 1995, with the
series picking up again as the economy started to turn down in 2000.
(Figure 1 near here)
Figure 1 plots the point estimates of the US whole economy and private sector union
wage premia, taken from the first and second columns of Table 1, against unemployment for
1973-2002. The premium moves counter-cyclically.
The US private sector union wage premium by worker type.
(Table 2 near here)
2 Table 1 is taken from Blanchflower and Bryson (2003a) which also contains full details of problems regarding data imputation in CPS. The May extracts of the CPS extracts in Stata format from 1969-1987 are available from the NBER at http://www.nber.org/data/cps_may.html. There was no CPS survey with wages and union status in 1982. 3 For a discussion of the reason for these differences, see Blanchflower and Bryson (2003a).
6
Table 2 presents union wage gaps obtained from estimating a series of equations for sub-
groups of private sector employees since the mid-1970s. To ensure large sample sizes we pooled
together six successive May CPS files from 1974-1979 and compare those to wage gaps
estimated for the years 1996-2001 using data from the Matched Outgoing Rotation Group
(MORG) files of the CPS. Two points stand out from these analyses. First, no group of workers
in the private sector sample has experienced a substantial increase in their union premium.
Clearly, unions have found it harder to maintain a wage gap over time. Second, with the
exception of the manual/nonmanual gap, those with the highest premiums in the 1970s saw the
biggest falls, so there has been some convergence in the wage gaps. Nevertheless, with the
exception of the most highly educated and non-manual workers, the wage premium remains
around 10 percent or more.
The US public sector union wage premium by worker type.
By 2001, public sector unions accounted for 44 percent of all union members in the US
compared with 32.5 percent in 1983.
(Table 3 near here)
Table 3 is comparable to Table 2 for the private sector in that it presents disaggregated
union wage gap estimates but, due to data constraints, the base period is from the early 1980s.
Because sample sizes in the public sector are small using the May CPS files we use data from the
ORG files of the CPS for the years 1983-1988 for comparison purposes with the 1996-2001
data.4 The private sector union wage gap has fallen over the two periods (21.5 percent to 17.0
percent) whereas a slight increase was observed in the public sector (13.3 percent to 14.5
4 Data for the years 1979-1982 could not be used, as no union data are available. A further advantage of the 1983-1988 data is that information is available on individuals whose earnings were allocated who were then excluded from the analysis.

7
percent, respectively). Furthermore, the majority of the worker groups in the public sector
experienced increases in their union wage premium over the period.
Industry, Occupation and State-Level Wage Premia5
The conventional assumption is that unions can procure a wage premium by capturing
quasi-rents from the employer (Blanchflower et al., 1996). If this is so, there must be rents
available to the firm arising from its position in the market place, and unions must have the
ability to capture some of these rents through their ability to monopolize the firm’s labor supply.
Individual-level data can tell us little about these processes. Instead, the literature has
concentrated on industry-level wage gaps. In this section we model the change in the union
wage premium at three different units of observation: industry, state, and occupation.
Industries. We used our data to estimate separate results for 44 two digit industries for 1983-
1988 and 1996-2001.6 In contrast to the analysis by worker characteristics, which reveal near
universal decline in the premium – at least in the private sector – we found that the wage gap
rose in 17 industries and declined in 27. The decline in the wage gap for the whole economy,
presented earlier, is due to the fact that the industries experiencing a decline in their wage gap
make up a higher percentage of all employees than those experiencing a widening gap. The
results are similar to those presented by Bratsberg and Ragan (2002) who found that, over the
period 1971-1999, the regression-adjusted wage gap closed in 16 industries and increased in 16
others.
The gap rose by more than ten percentage points in autos (+12 percent) and leather (+19
percent). It declined by more than twenty percentage points in other agriculture (-33 percent)
5 See Blanchflower and Bryson (2004) for full details on the estimations used in this section. 6 We chose these years as it was possible to define industries identically using the 1980 industry classification.

8
retail trade (-20 percent) and private households (-29 percent). Many of the industries
experiencing a fall in the union premium between 1983 and 2001 would have been subject to
intensifying international trade (such as textiles, apparel and furniture) but this was equally true
for those experiencing rising premiums (such as machinery, electrical equipment, paper, rubber
and plastics, leather).
Some of the biggest declines in the premium have been concentrated in the three
industries with more than a 10 percent share in private sector union membership in 2002. In
construction and transport, which both make up an increasing proportion of all private sector
union members, the premium fell by around 10 percentage points. In retail trade, where the
share of private sector union membership has remained roughly constant at 10 percent, the
premium fell 20 percentage points.
(Table 4 near here)
To explore these changes in the private sector industry union wage premium over time
we ran panel fixed effects estimates. Our first step was to estimate separate first-stage
regressions for each of our industries in each year from 1983-2001 with the dependent variable
the log hourly wage along with controls for union membership, age, age squared, male, 4 race
dummies, the log of hours, and 50 state dummies. Three sectors with very small sample sizes
(toys, tobacco, and forestry and fisheries) were deleted. We extracted the coefficient on the union
variable, giving us 19 years * 42 industries or 798 observations in all. The coefficient on the
union variable was then turned into a wage gap taking anti-logs, deducting 1 and multiplying by
100 to turn the figure into a percentage. We used the ORG files to estimate the proportion of
workers in the industry who were union members both in the private sector and overall and
mapped that onto the file. Unemployment rates at the level of the economy are used as industry-

9
specific rates are not meaningful: workers move a great deal between industries and considerably
more than they do between states.
Regression results, reported in columns 1 and 2 of Table 4, estimate the impact of the
lagged premium, lagged unemployment, and a time trend on the level of the industry-level wage
premium. The number of observations is 756 as we lose 42 observations in generating the lag on
the wage premium and the union density variables.
In the unweighted equation in column (1) the lagged premium is positively and
significantly associated with the level of the premium the following year indicating regression to
the mean. Unemployment and the time trend are not significant. However, once the regression
is weighted by the number of observations in the industry in the first-stage regression, (column
(2)) lagged unemployment is positive and significant, indicating counter-cyclical movement in
the premium, while the negative time trend indicates secular decline in the premium.
Bratsberg and Ragan (2002) reported that the industry-level premium was influenced by a
number of other variables.7 In particular they found that COLA clauses reduced the cyclicality
of the union premium and that increases in import penetration were strongly associated with
rising union premiums. They also found some evidence that industry deregulation had mixed
effects. Their main equations (their Table 2) did not include a lagged dependent variable. Table
5 reports results using their data for the years 1973-1999 using their method and computer
programs that they kindly provided to us. Column 1 of Table 5 reports the results they reported
in column 2 of their Table 2. Column 2 reports our attempt to replicate their findings. We are
7 Bratsberg and Ragan (2002) also use CPS data. But their analysis differs in several ways. First, they assess trends over the period 1971-1999 whereas we present trends over the period 1983-2001. Second, we adjust for wage imputation as recommended by Hirsch and Schumacher (2002) whereas Bratsberg and Ragan do not. Third, specifications producing the regression-adjusted estimates differ somewhat. Fourth, the samples differ. In particular, Bratsberg and Ragan exclude government workers, and they present results for some different industries. Fifth, their wage premium relates to weekly wages whereas all of our estimates are derived from (log) hourly wages.

10
unable to do so exactly but there are several similarities – we find import penetration both in
durables and nondurables, COLA clauses, deregulations in communications, and the
unemployment rate all have positive and significant effects. We also found, as they did, that
deregulation in finance lowered the premium. In contrast to Bratsberg and Ragan, however, the
inflation rate and the two interaction terms with the unemployment rate were insignificant. The
model is rerun in column 3, but without the insignificant interaction term. A linear time trend is
added in column 4: this is negative and significant, and eliminates the COLA effect and the
negative effect of deregulation in the finance sector. Column 5 adds the lagged union wage
premium, which is positive and significant. Its introduction makes inflation positive and
significant. In columns (6) to (8) models are run without the four insignificant deregulation
dummies. Column (6) indicates that using an unweighted regression, the size of the lagged
premium effect drops markedly and the time trend and inflation lose significance, showing these
results are sensitive to the weighting of the regression. The smaller coefficient on the lagged
dependent variable is unsurprising given that there is much less likely to be variation in the union
wage gap estimates in industries with large sample sizes that have higher weights in the former
case. We are able to confirm Bratsberg and Ragan’s finding that the unemployment rate,
deregulation in communications, and import penetration in both durables and nondurables have
positive impacts on the premium but not the findings on COLA, inflation, or any of the other
deregulations identified.
That import penetration in durable and nondurable goods sectors increases the premium
suggests that union wages are more resilient than nonunion wages to foreign competition. Import
penetration is likely correlated with unmeasured industry characteristics that depress the
premium inducing a negative bias that is removed once industry characteristics are controlled

11
for. Import penetration has likely reduced demand for union and nonunion labor, with union
wages holding up better than nonunion wages, but at the expense of reduced union employment.
There are theoretical and empirical reasons as to why this might occur. For instance, since union
wages tend to be less responsive to market conditions generally, union wages may be sluggish in
responding to increased import competition. Alternatively, industries characterized by “end-
game” bargaining may witness perverse union responses to shifts in product demand as the union
tries to extract maximum rents in declining industries (Lawrence and Lawrence, 1985). Another
possibility is that increased import penetration reduces the share of union employment in labor -
intensive firms and increasing it in capital-intensive firms. Greater capital intensity reduces
elasticity of demand for union labor, allowing rent maximizing unions to raise the premium
(Staiger, 1988).
It is not obvious that weights should be used if we regard each industry as a separate
observation. Columns (1) to (6) are GLS estimates accounting for potential correlation in error
terms. Column (7) switches to a weighted OLS and shows that results are not sensitive to the
switch. The unweighted OLS in column (8) gives broadly the same results as the unweighted
GLS in column (6). Taking off the weights has a much bigger effect than switching from GLS to
OLS.
Furthermore, the industries defined by Bratsberg and Ragan are very different in size.
Some industries are very broadly defined – for example industry 32 Services covers SIC codes
721-900 whereas tobacco covers one SIC code (#130). Retail trade averaged 19,075
observations. Column 9 of Table 5 illustrates the sensitivity of the results to industry exclusions.
It is exactly equivalent in all respects to column 5 of Table 5 except that it drops the 32
observations from retail trade. The lagged dependent variable falls dramatically from .60 to .32.

12
The COLA variable is now significantly positive while the inflation variable moves from being
significantly positive to insignificant. The unweighted results (not reported) are little changed.
Bratsberg and Ragan’s results appear to be sensitive to both the use of weights and the sample of
industries used.
States. A similar procedure was adopted to estimate state-level premia over time for the 50 states
plus Washington D.C. We compare results using merged samples of the CPS’s MORG for
1983-1988 and 1996-2001 files.8 The mean state union wage gap was 23.4 percent between 1983
and 1988, falling to 17.2 percent in 1996-2001. The premium fell in all but five states. The
premium only rose markedly in Maine, where it increased 9 percentage points (from 7 percent to
16.1 percent). We then ran 969 separate first-stage regressions, one for each state in each year
from 1983-2001 with the dependent variable the log hourly wage along with controls for union
membership, age, age squared, male, 4 race dummies, the log of hours, and 44 industry
dummies. The sample was restricted to the private sector. We extracted the coefficient on the
union variable, giving us 19 years * 51 states (including D.C.), 969 observations in all. We then
mapped to that file the unemployment rate in the state-year cell.9 Once again we ran a series of
second-stage regressions where the dependent variable is the one-year level of the premium
(obtained by taking anti-logs of the union coefficient and deducting one) on a series of RHS
variables including the lagged premium and lagged unemployment and union density rates.10
8 The source of the data is the Union Membership and Coverage Database which is an Internet data resource providing private and public sector union membership, coverage, and density estimates compiled from the Current Population Survey (CPS) using BLS methods. Economy-wide estimates are provided beginning in 1973; estimates by state, detailed industry, and detailed occupation begin in 1983; and estimates by metropolitan area begin in 1986. The Database, constructed by Barry Hirsch (Trinity University) and David Macpherson (Florida State University), is updated annually. The Database can be accessed at http://www.unionstats.com. 9 Source: http://data.bls.gov/labjava/outside.jsp?survey=la. 10 We experimented with both the level of the unemployment rate and the log and the latter always worked best.

13
Results are reported in columns (3) and (4) of Table 4. The number of observations is 918 - we
lose 51 observations in generating the lag on the wage premium and the union density variables.
Both unweighted and weighted results are presented where the weights are total employment in
the state by year. Controlling for state fixed effects with 50 state dummies we find that with an
unweighted regression (column (3)), the lagged premium is positive and significant, as it was at
industry level. Again, as in the case of industry-level analysis, the effect is apparent when
weighting the regression (column (4)). The positive, significant effect of lagged state-level
unemployment confirms the counter-cyclical nature of the premium - the effect is apparent
whether the regression is weighted or not. There is also evidence of a secular decline in the
state-level premium, but only where the regression is unweighted.11
Occupations. Finally, we moved on to estimate wage gaps at the level of the occupation pooling
six years of data for each of the time periods 1983-1988 and 1996-2001. In each case we used
files from the Outgoing Rotation Group files of the CPS. Out of the 44 groups, 13 showed
increases in the size of the differential over time while the remainder had decreases. We used the
same method described above for industries and states, with occupations defined in a comparable
way through time. Columns (5) and (6) of Table 4 show that whether the occupation-level
analysis is weighted or not, there is clear evidence of regression to the mean, with the lagged
premium positive and significant, as well as evidence of a secular decline in the premium. A
significant counter-cyclical effect is evident when the regression is weighted, but not in the
unweighted regression.
11 State fixed effects account for state-level variance in union density where the effect is fixed over time. However, Farber (2003) argues that there remain potential unobserved variables which simultaneously determine density and wages, but which are time-varying, and thus not picked up in fixed effects, which might bias our results.

14
In all three units of observation– industry, state, and occupation – there is evidence that
the private sector premium moves counter-cyclically and that it has been declining over time. In
all three cases the lagged level of the premium entered significantly positively and was larger
when the weights were used than when they were not. The size of the lag was greatest when
industries were used as the unit of observation and least when occupations were used.
Translating the results from levels into changes – that is by deducting t-1 from both sides –
leaves all of the other coefficients unchanged. Using the weighted results in Table 4 the results
reported below imply mean convergence.
State level ∆Premium t - t-1 = -.7949Premiumt-1 Industry level ∆Premium t - t-1 = -.6457Premiumt-1 Occupation level ∆Premium t - t-1 = -.8254Premiumt-1
The higher the level of the premium in the previous period the lower the change in the next
period.
Trends in the union wage premium in the United Kingdom
Table 6 presents the union membership wage premium over the period 1985-2002.
Column 1 estimates the premium for the UK since 1993 using the Labour Force Survey (LFS),
while column 2 estimates it for Britain since 1985 using the British Social Attitudes Surveys
(BSAS). Both series are based on standard specifications for each separate year (details are
contained in the Data Appendix available on request). In identifying the union effect over time,
we make what we think is the reasonable assumption that any bias in our estimates arising
through unobserved heterogeneity is constant over time.
The LFS estimates tend to be above the BSAS estimates, but in both series there has been
a decline in the log hourly union wage premium since 1994 (with the BSAS estimate for 1997

15
being an outlier, perhaps due to the much smaller sample that year).12 Although the premium
remains roughly 10 per cent in the 2000 LFS, it falls to a statistically insignificant 5 per cent in
BSAS 2000, and falls even further in 2001. However, it recovers to a statistically significant
6.4% in 2002 as unemployment rises, further evidence of counter-cyclical movement in the
premium which is brought out more clearly in Figure 2.
(Tables 6 and Figure 2 near here)
Trends by worker type.
In analyses not presented here we find a large fall in the wage premium across most types of
worker, indicated by the sub-group regressions (see Blanchflower and Bryson, 2003a for details).
In 1993, analyses of LFS indicate only one group of employees (the highly educated) had a
premium well below 10 per cent. In 2000, all but three out of the 17 types of worker had a
premium below 10 per cent. Those worse affected were manufacturing workers, men, private
sector workers and non-whites, all of whom had no significant premium by 2000. Results are
similar when using BSAS data. In 1993-95, only two types of worker (non-manuals and the
highly qualified) had a union premium of less than 10 per cent. By 1999-2001, eleven types of
worker had a premium of less than 10 per cent. For five types of worker (men, younger workers,
those in the private sector, non-manuals, and the highly educated) the membership premium was
no longer statistically significant.
The impact of data richness and estimation method on the magnitude of the union membership wage premium 12 The estimate for 1997 is smaller (13%) when the data are weighted. Further support for the proposition that the BSAS 1997 point estimate is an outlier comes from the authors’ calculations of the log hourly wage premium using the same methodology (unweighted estimates of the mid-point earnings) for individual level data from the Workplace Employee Relations Survey 1998, the fieldwork for which spanned 1997 and 1998. The raw membership premium is .226 (25.4%). This shifts with the addition of controls as follows: + demographics = .121; + job = .114; + establishment = .076; + geographical = .091. In short, these estimates point to a premium of around 10% in 1997/98.

16
Our knowledge of the size of the union membership wage premium in the US and the UK
derives largely from analyses of individual and household survey data. There will be an upward
bias in these estimates, induced by the paucity of employer controls in such data, if unionized
employers are better payers than non-unionized employers. This deficiency in employer controls
is addressed directly in this section with linked employer-employee data from the Workplace
Employee Relations Survey 1998 (WERS). As well as information on individual employees’
union membership, WERS contains rich information on the employer, including workplace-level
union density and pay bargaining arrangements for occupations within the workplace. The
regression coefficient for the union membership dummy in an OLS can be interpreted as the
causal effect of union membership on wages if the variables entering the regression equation
account fully for endogenous selection into membership status. This requires very informative
data. We assess the sensitivity of results to this assumption by varying the information set
entering the estimation – first utilizing individual-level data only, and then introducing
workplace-level data.
An alternative to OLS to control for bias on observables is the semi-parametric statistical
matching approach known as propensity score matching (PSM) (Rosenbaum and Rubin, 1983;
Heckman et al., 1999) which compares wage outcomes for unionized workers with ‘matched’
non-unionized workers. The method shares the causal identification assumption of the OLS in
that it yields unbiased estimates of the treatment impact where differences between individuals
affecting the outcome of interest are captured in their observed attributes (the conditional
independence assumption, or CIA).13 However, matching has three distinct advantages relative
to regression in identifying an unbiased causal impact of membership on wages. First, it is semi-
13 For a full description of the PSM technique and its application in this case see Bryson (2002).

17
parametric, so it does not require the assumption of linearity in the outcome equation. Second, it
leaves the individual causal effect completely unrestricted so heterogeneous treatment effects are
allowed for and no assumption of constant additive treatment effects for different individuals is
required. Thirdly, matching estimators highlight the problem of common support and thus the
short-comings of parametric techniques which involve extrapolating outside the common support
(Heckman, et al., 1998). The appropriateness of the CIA is dependent on having data that
account for selection into membership. As in the case of the OLS estimates, the sensitivity of
results to data quality is assessed by altering the information set entering estimation.
Table 7 reports OLS estimates of the union membership wage premium in the private
sector as a whole and for coverage, gender and occupational sub-groups. Using individual-level
data only, the estimated membership premium for the whole private sector is 15% (the
exponentiated coefficient for union member in column 1). Column 2 introduces data collected
from the employer. The employer variables are jointly significant and improve the model fit.
What is more, they reduce the membership premium by over half to 6.1%. This pattern, whereby
the premium estimated using individual-level only data is substantially reduced with the
introduction of workplace-level data, is repeated across the sub-group analyses. The impact of
workplace-level data is particularly marked for men and manual workers. These findings suggest
that, at least in the British case, OLS estimates of the membership premium based on individual-
level and household survey data are upwardly biased because some of the positive wage effect
attributed to membership is actually due to members being employed at better paying
workplaces. There are many possible reasons why union workplaces might be better payers than
non-union workplaces. Unions may target organizing efforts on employers with the biggest rents
to share. ‘Better’ employers may chose to unionize to create stable firm-employer conditions

18
conducive to investment in human capital. Alternatively, if union members are ‘better’ workers
than their non-member counterparts in ways unobservable to the analyst but observable to
employers, members may be able to sort themselves into the best employers, or may be chosen
by the best employers (Abowd et al., 1999).
These analyses for the whole private sector condition on whether the individual is located
in a workplace where the employer engages with a union in pay bargaining, as well as on union
density at the workplace where the employee works.14 However, if the biggest component of
any membership premium is that generated by collective bargaining, the premium should be
much smaller where the sub-sample consists solely of workers in covered occupations. In
general, all these workers should benefit from pay bargaining, unless employers discriminate
between members and non-members. In fact, the OLS estimates for covered occupations
presented in row 2 differ little from those for the whole private sector. Again, the size of the
premium falls substantially once account is taken of workplace heterogeneity, but it remains
sizeable and statistically significant at 6.7%. On this evidence, the membership premium among
covered workers, evident in other recent studies using individual-level data only (for the US,
Schumacher, 1999, Budd and Na, 2000; and for Britain, Hildreth, 2000), persists having
accounted for workplace heterogeneity.
Intriguingly, the 14% of employees who are members in uncovered occupations receive a
similar membership premium of 5.7% when the OLS is run with individual and workplace-level
controls. However, almost three-quarters (71%) of these members are located in workplaces
14 The full union-nonunion wage differential combining membership and coverage is obtained by exponentiating the sum of the membership and workplace-level union recognition coefficients exp(.059 + -.018) = 4.2%. The union recognition dummy is never statistically significant in the equations presented in Table 7, but wages rise with union density.
19
where other workers have their pay set through collective bargaining. This suggests that these
members benefit from the spillover effects of collective bargaining at their workplace.15
The most striking evidence that union membership effects are heterogeneous comes from
analyses by broad occupation. Running analyses for manual and non-manual employees
separately, results confirm those from other studies in showing a larger membership premium
among manual workers (Booth, 1995; Forth and Millward, 2002b). Indeed, with the introduction
of workplace controls, non-manual workers are the only group of workers for whom the OLS
estimates do not produce a statistically significant membership premium.
Table 8 presents the PSM analyses. These are run on identical samples to those used in
the OLS estimates in Table 7. The sample sizes are smaller than those appearing in Table 7
because, in the process of matching members to their nearest neighbors, PSM leaves many non-
members out of the estimation sample (the Data Appendix, available on request, contains
details). In addition, a small number of members have no support in the non-member population,
so it is not possible to estimate membership effects for this subset. Fortunately this group tends
to be small, ranging between 3%-6% in most cases. This means common support is not a
problem, so PSM can estimate the effect of membership on members for nearly all of the
member population. As in the case of the OLS estimates in Table 7, PSM estimates are run with
individual controls only, and with individual plus workplace controls.
The results are striking. The first row in column 1 shows the membership premium based
on matching with individual data alone is estimated to be 8.9%. When workplace data are used
in the matching this premium disappears and is even negatively signed. As in the case of the
OLS estimates in Table 7, the introduction of workplace-level data always reduces the
membership premium, confirming the potential for upward bias in estimates based on individual-
15 Forth and Millward (2002b) find evidence of such spillover effects in their analysis of WERS.

20
level data – whether estimated via OLS or PSM. But, in stark contrast to the OLS estimates in
Table 7, there is no significant membership premium for any type of employee where matching
is based on individual and workplace-level data. The premia are always statistically significant
if one runs OLS on the matched data (see Data Appendix for details), so one can discount sample
size differences and common support enforcement as reasons for differences in the OLS and
PSM results. Rather, the OLS estimates are upwardly biased due to the linear functional form
assumption. Of course, it is arguable that the OLS models are simply misspecified and that
results could be reconciled through the addition of appropriate interaction terms. In practice, this
requires a great deal of trial and effort and, in any event, OLS will still be linear, albeit in non-
linear covariates. This is illustrated by the fact that the OLS-generated premium remains large
and significant across coverage, gender and broad occupation, three dimensions where one is
most likely to find heterogeneous membership effects. Yet, in each case, the PSM-generated
premia are not significant. In estimates not shown, the membership premium for uncovered
workers where matching is based on individual and workplace-level data is –2.4%. It is true
that, at 6.9%, the PSM estimate of the premium for manual workers comes close to statistical
significance (with the bootstrapped 95% confidence interval presented in the Data Appendix
only just straying into negative territory). So, if there was a membership premium for anyone in
Britain in 1998, it was for manual workers.
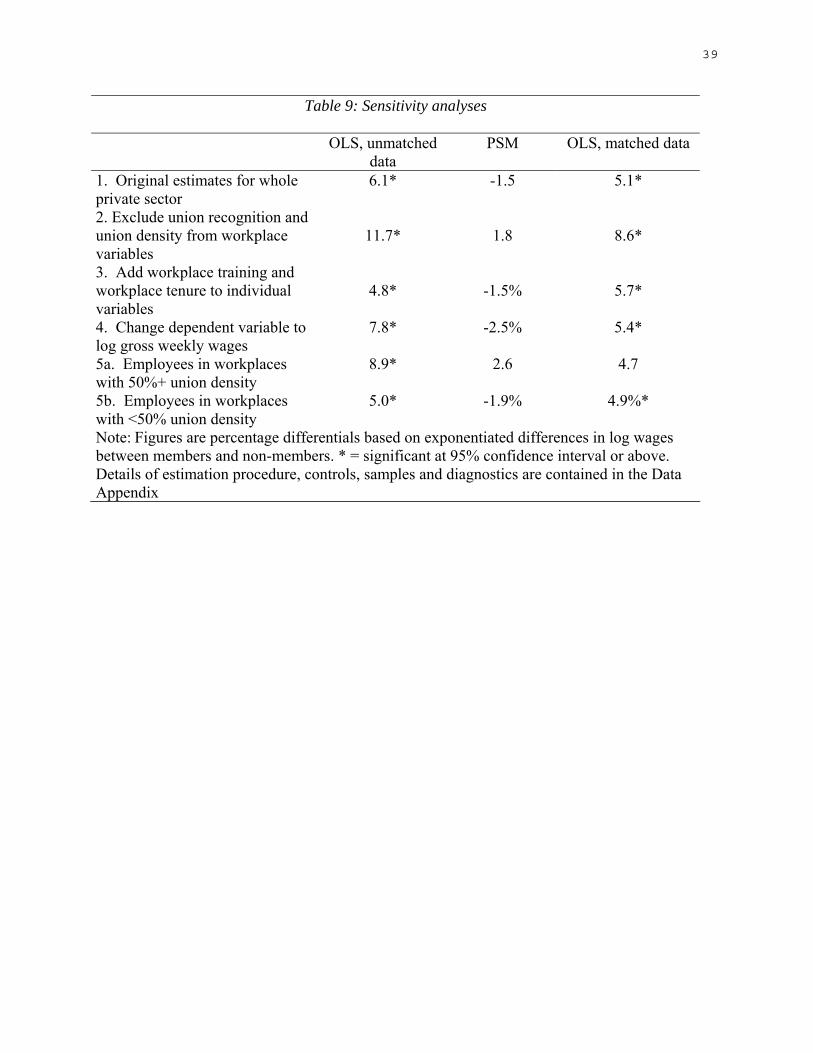
Table 9 presents four sensitivity analyses. The first row reproduces results from Tables 7
and 8 for the ‘baseline’ estimates. The first two sensitivity analyses involve alterations to the X
vector used in the OLS estimation and estimation of the propensity score. The third sensitivity
analysis estimates effects on weekly wages, as opposed to hourly wages. The fourth involves
splitting the analyses according to union strength at the workplace employing the worker. In

21
each case, the first column presents results from the OLS using individual-level and workplace-
level controls. The second column presents the PSM results, and the third column presents the
OLS results run on the matched data.
Although there is a sizeable union wage premium literature conditioning on bargaining
coverage and union density, it is at least arguable that density and union recognition are
endogenous with respect to membership in that these workplace features are, in part, a function
of individuals’ decisions to unionize. A comparison of results in row 2 Table 9 with the whole
private sector estimates in row 1 shows the premium estimates rise in the absence of density and
recognition controls. However, the pattern of results remains the same, with OLS producing
sizeable and statistically significant premia, whereas the PSM estimate is small and statistically
non-significant.
Workplace training and workplace tenure may also be endogenous with respect to
membership, which is why they were omitted from the earlier estimates. Their inclusion in row
3 of Table 9 makes no difference at all to the PSM estimates, and very little difference to the
OLS using matched data. The premium estimated with OLS on unmatched data falls a little.
There is the potential for measurement error in the hourly earnings measure and estimates
of the wage premium can differ across hourly and weekly earnings measures due to different
working patterns of members and non-members. Row 4 in Table 9 therefore shows the
sensitivity of results to the use of a weekly earnings measure. Again, the pattern of results is
largely unchanged.
Empirical evidence for Britain (Stewart, 1987) and the United States (Schumacher, 1999)
indicates that the union premium is higher where union density is higher. This may be because a
higher incidence of ‘free-riding’ can weaken union bargaining strength, or else causation may

22
work the other way if the incentive to join a union is higher where the union commands a larger
premium. Splitting the analysis into employees working in lower and higher density workplaces
offers some support for the proposition that the membership premium is higher where the union
is stronger. Using OLS to estimate the membership effect on unmatched data, the premium is
much larger among employees in workplaces with 50%+ density than it is among those located
in workplaces with less than 50% density. There is also a differential using PSM although the
premium is not significant in either case.
Across all these sensitivity analyses, OLS identifies a sizeable and statistically significant
membership premium whereas PSM finds no significant premium, supporting the main
conclusion from the baseline analyses. In the case of OLS and PSM, the introduction of rich
employer controls substantially reduces the size of the membership premium, sometimes
rendering it statistically non-significant. Using the same data set Booth and Bryan (2004) came
to a similar conclusion having controlled for workplace fixed effects. The two studies confirm
the importance of controlling for workplace heterogeneity in accurately estimating the union
membership wage premium.
Conclusions
The union membership wage premium has been higher in the US than the UK in the last
couple of decades. In both countries the premium was untrended in the years up to the mid-
1990s, but it has fallen since then. Much of this is due to counter-cyclical movement and thus, as
we might expect, the premium rose with unemployment in both countries in 2001 and 2002 after
a number of years of decline. However, we also find clear evidence in the US of a secular
decline in the premium. Even so, in 2002, the premium in the US economy was 16.5%, just a
little below the 17.1% average for the period 1973-2002. In the private sector it was 1

23
percentage point above the average of 17.6% for the period. In the UK, on the other hand, there
are real questions as to whether there is a significant union wage premium for workers at the
beginning of the 21st Century. Standard OLS estimates of the premium show no statistically
significant premium for many types of worker. The analyses for 1998 using linked employer-
employee data suggest that LFS and BSAS estimates of the premium in the UK may even
overstate the size of the premium, as do the analyses using PSM instead of OLS.
In the US and the UK the premium has fallen for virtually all types of private sector
employee, with those with the largest premiums at the outset suffering the greatest declines.
These include more vulnerable workers such as the lower educated and women, raising questions
about unions’ ability to bid up the wages of those who with lower marginal productivity and
those who may be earning below their marginal product as a result of discrimination or labor
market segmentation. The picture was very different when we estimated the US premium at the
level of industry, state and occupation. The premium went up in many industries and
occupations, and down in others, but again there was regression to the mean.
US analyses for the public sector revealed quite a different picture. Here the premium
rose a little and did so for all types of public sector worker.
What are the implications for trade unions? The size of the premium in the US might
suggest that the benefits of membership, net of dues and other costs, remain sizeable. So why
has density been declining in the private sector? One possibility is that the premium comes at
the cost of union jobs – evidence for the US and the UK shows unionized establishments grow at
a slower rate than non-unionized establishments (Blanchflower, et al., 1991; Leonard, 1992;
Bryson, 2004). Unionized companies face greater competition from nonunion employers at a
time when increasing price competitiveness means employers are less able to pass the costs of

24
the premium onto the consumer. Declining union density, by increasing employers’
opportunities to substitute nonunion products for union products, fueled this process. So too did
rising import penetration: if imports are nonunion goods, regardless of US union density, they
increase the opportunity for nonunion competition. These pressures have increased the
employment price of any union wage premium. A second possibility – not inconsistent with the
first – is that the costs of membership have risen, most notably through increasing employer
opposition to union organizing (Kleiner, 2002). That opposition may even be fuelled, in part, by
the size of the wage premium if employers might view it as the price tag attached to successful
union organizing campaigns. Either way, it is clear that unions’ relative success in the
bargaining arena is not going to bring about a reversal in union fortunes. In the UK, the problem
is that unions are struggling to procure any premium for members. At a time when the new
cohort of employers has turned away from unions (Bryson, Gomez and Willman, 2004), raising
the costs of employees joining unions, this dip in the premium means a further reduction in the
net benefits of membership, making it increasingly difficult for unions to recruit new members.

25
References
Abowd, John M., Francis Kramarz and David N. Margolis. “High Wage Workers and High
Wage Firms.” Econometrica 67 (March 1999): 251-333
Andrews, M. J., M. B. Stewart, J. K. Swaffield, and R. Upward (1998), ‘The Estimation of
Union Wage Differentials and the Impact of Methodological Choices’, Labour Economics, 5 (4),
449-474.
Blanchflower, D. G. (1999), ‘Changes Over Time In Union Relative Wage Effects in Great
Britain and the United States’, in S. Daniel, P. Arestis, and J. Grahl (eds.), The History and
Practice of Economics: Essays in Honour of Bernard Corry and Maurice Peston, Volume. 2,
Northampton, Mass.: Edward Elgar, pp. 3-32.
Blanchflower, D. and Bryson, A. (2003a) ‘Changes over time in union relative wage effects in
the UK and the US Revisited’, chapter 7 in International Handbook of Trade Unions, John T.
Addison and Claus Schnabel (eds.), Edward Elgar, Cheltenham England and Northampton
Mass., USA
Blanchflower, D. and Bryson, A. (2004) ‘What Effect Do Unions Have on Wages Now and
Would “What Do Unions Do?” Be Surprised”, Journal of Labor Research, forthcoming
Blanchflower, D. G., Millward, N. and Oswald, A. J., (1991). Unionism and Employment
Behaviour. The Economic Journal, 101, 815-834
Blanchflower, D. G., A. J. Oswald, and P. Sanfey (1996), ‘Wages, Profits and Rent Sharing’,
Quarterly Journal of Economics, 111 (1), 227-251.
Booth, A.L. The Economics of the Trade Union. 1995. Cambridge University Press, England
Booth, A. L., and M. L. Bryan (2004), ‘The Union Membership Wage-Premium Puzzle: Is There
A Free Rider Problem?’, Industrial and Labor Relations Review,, forthcoming.

26
Brown, W., S. Deakin, M. Hudson, C. Pratten, and P. Ryan (1998), The Individualisation of
Employment Contracts in Britain’, Employment Relations Research Series 4, London:
Department of Trade and Industry.
Bratsberg, B., and J. F. Ragan (2002), ‘Changes in the Union Wage Premium by Industry – Data
and Analysis’, Industrial and Labor Relations Review, 56 (1) October.
Bryson, A. (2004) ‘Unions and Employment Growth in British Workplaces During the 1990s: A
Panel Analysis’, Scottish Journal of Political Economy, forthcoming
Bryson, A. (2002) The Size of the Union Membership Wage Premium in Britain’s Private Sector,
PSI Discussion Paper No. 9, PSI Report No. 886 (http://www.psi.org.uk)
Bryson, A., Gomez, R. and Willman, P. (2004) ‘The End of the Affair? The Decline in
Employers’ Propensity to Unionize’, in J. Kelly and P. Willman (eds.), Union Organization and
Activity, Routledge, London, forthcoming
Budd, J.W., and I-G Na (2000), ‘The Union Membership Wage Premium for Employees
Covered by Collective Bargaining Agreements’, Journal of Labor Economics, 18 (4), 783-807.
Farber, H. S. (2003) ‘Nonunion Wage Rates and the Threat of Unionization’, NBER Working
Paper #9705
Forth, J., and N. Millward (2000a), ‘Pay Settlements in Britain’, NIESR Discussion Paper
No.173, London: National Institute for Social and Economic Research.
Forth, J. and N. Millward (2002b). “Union effects on pay levels in Britain”. Labour Economics
9 (2002): 547-561
Freeman, R. B. and J. Medoff (1984), What Do Unions Do?, New York: Basic Books.

27
Grant, D. (2001), ‘A Comparison of the Cyclical Behavior of Union and Nonunion Wages in the
United States’, Journal of Human Resources, 36 (1), 31-57.
Heckman, J., Ichimura, H., Smith, J. and P. Todd. (1998) “Characterizing selection bias using
experimental data”. Econometrica 66: 1017-1098.
Heckman, J., LaLonde, R. and Smith, J. (1999) ‘The Economics and Econometrics of Active
Labor Market Programs’ in Ashenfelter, O. and Card, D. (eds.) The Handbook of Labour
Economics, Vol. III, Amsterdam: North Holland
Hildreth, A. K. G. (1999), ‘What Has Happened to the Union Wage Differential in Britain in the
1990s?’, Oxford Bulletin of Economics and Statistics, 61 (1), 5-31.
Hildreth, A. K. G. (2000), ‘Union Wage Differentials For Covered Members And Non-Members
In Great Britain’, Journal of Labor Research, 21 (1), 133-147.
Hirsch, B.T. and D. A. Macpherson (2002), Union Membership and Earnings Data Book:
Compilations from the Current Population Survey (2002 Edition). Washington: Bureau of
National Affairs.
Hirsch, B. T., D. A. Macpherson, and E. J. Schumacher (2002), ‘Measuring Union and Non-
Union Wage Growth: Puzzles in Search of Solutions’, paper presented at the 23rd Middlebury
Economics Conference, Changing Role of Unions, Middlebury, Vermont, April.
Hirsch, B. T. and E. J. Schumacher (2002), ‘Match Bias In Wage Gap Estimates Due To
Earnings Imputation’, Mimeograph, Trinity University, available at www.trinity.edu/bhirsch/ or
www.ssrn.com.
Kleiner, M. (2002) ‘Intensity of Management Resistance: Understanding the Decline of
Unionization in the Private Sector’, in James T. Bennett and Bruce E. Kaufman (eds.) The

28
Future of Private Sector Unionism in the United States, Armonk, N.Y.: M.E. Sharpe, pp. 292-
316
Lanot, G., and I. Walker (1998), ‘The Union/Non-Union Wage Differential: An Application of
Semi-Parametric Methods’, Journal of Econometrics, 84 (2), 327-349.
Lawrence, C. and R.Z. Lawrence. (1985) “Manufacturing Wage Dispersion: An End Game
Interpretation”, Brookings Papers on Economic Activity 0 (1): 47-116.
Lewis, H. G. (1986), Union Relative Wage Effects: A Survey, Chicago, Ill.: University of
Chicago Press.
Leonard, J. S. (1992) “Unions and Employment Growth”, Industrial Relations 31: 80-94.
Machin, S. (2001), ‘Does It Still Pay To Be In Or To Join A Union?’ Working Paper, University
College London..
Metcalf, D., K. Hansen, and A. Charlwood (2001), ‘Unions and the Sword of Justice: Unions and
Pay Systems, Pay Inequality, Pay Discrimination and Low Pay’, National Institute Economic
Review, 176, 61-75.
Millward, N., J. Forth, and A. Bryson (2001), Who Calls the Tune at Work? The Impact of
Unions on Jobs and Pay, York: Joseph Rowntree Foundation.
Moore, W. J., and J. Raisian (1980), ‘Cyclical Sensitivity of Union/Non-Union Relative Wage
Effects’, Journal of Labor Research, 1 (1), 115-132.
Rosenbaum, P. and Rubin, D. (1983). ‘The central role of the propensity score in observational
studies for causal effects’. Biometrica 70: 41-50.

29
Schumacher, E. J. (1999), ‘What Explains Wage Differences between Union Members and
Covered Non-Members?’, Southern Economic Journal, 65 (3), 493-512.
Shah, A. (1984), ‘Job Attributes and the Size of the Union/Non-Union Wage Differential’,
Economica, 51 (204), 437-446.
Staiger, Robert W. “Organized Labor and the Scope of International Specialization”, Journal of
Political Economy, 96 (October 1988): 1022-1047.
Stewart, M. B. (1987), ‘Collective Bargaining Arrangements, Closed Shops and Relative Pay’,
Economic Journal, 97 (385), 140-156.
Stewart, M. B. (1995), ‘Union Wage Differentials in an Era of Declining Unionization’, Oxford
Bulletin of Economics and Statistics, 57 (2), 143-166.
Wunnava, P. V., and A. A. Okunade (1996), ‘Countercyclical Union Wage Premium? Evidence
for the 1980s’, Journal of Labor Research, 17 (2), 289-296.

30
Table 1. Union Wage Gap Estimates for the United States, 1973-2002 (%) (excludes workers with imputed earnings)
All Sectors Private Sector Private Sector Year Blanchflower/Bryson Blanchflower/Bryson Hirsh/Schumacher 1973 14.1 12.7 17.5 1974 14.6 13.8 17.5 1975 15.1 14.3 19.2 1976 15.5 14.6 20.4 1977 19.0 18.3 23.9 1978 18.8 18.6 22.8 1979 16.6 16.3 19.7 1980 17.7 17.0 21.3 1981 16.1 16.3 20.4 1983 19.5 21.2 25.5 1984 20.4 22.4 26.2 1985 19.2 21.0 26.0 1986 18.8 20.1 23.9 1987 18.5 20.0 24.0 1988 18.4 19.1 22.6 1989 17.8 19.2 24.5 1990 17.1 17.6 22.5 1991 16.1 16.6 22.0 1992 17.9 19.2 22.5 1993 18.5 19.6 23.5 1994 18.5 18.2 25.2 1995 17.4 18.0 24.5 1996 17.4 18.4 23.5 1997 17.4 17.7 23.2 1998 15.8 16.1 22.4 1999 16.0 16.9 22.0 2000 13.4 14.3 20.4 2001 14.1 15.1 20.0 2002 16.5 18.6 1973-2002 average 17.1 17.6 22.4 Note: See Data Appendix for details of sample and controls.

31
Table 2. Private Sector Union/Nonunion Log Hourly Wage Differentials,
1974-1979 and 1996-2001, in Percent 1974-1979 1996-2001 Men 19 17 Women 22 13 Ages 16-24 32 19 Ages 25-44 17 16 Ages 45-54 13 14 Ages >=55 19 16 Northeast 14 11 Central 20 15 South 24 19 West 23 22 < High school 33 26 High school 19 21 College 1-3 years 17 15 College >=4 years 4 3 Whites 21 16 Non-white 22 19 Tenure 0-3 years 20 20 Tenure 4-10 16 15 Tenure 11-15 10 11 Tenure 16+ 17 8 Manual 30 21 Non-manual 15 4 Manufacturing 16 10 Construction 49 39 Services (excl. construction) 34 16 Private sector 21 17 Note: See Data Appendix for details of samples and controls.

32
Table 3. Union Wage Differentials in the Public Sector, in Percent
1983-1988 1996-2001 Private 22 17 Public 13 15 Federal 2 8 State 9 10 Local 16 20 Male 8 10 Female 17 16 Age <25 28 23 Age 25-44 13 15 Age 45-54 8 11 Age >=55 13 14 New England 17 17 Central 16 16 South 10 12 West 10 13 <High School 26 18 High School 15 13 College 1-3 13 11 College >= 4 Years 8 11 Whites 13 14 Non-whites 15 16 Manual 18 18 Non-manual 13 14 Registered Nurses (95) 5 6 Teachers (156-8) 15 21 Social workers (174) 12 12 Lawyers (178) 5 17 Firefighters (416-7) 15 19 Police & correction officers (418-424) 16 18 Notes: sample excludes individuals with allocated earnings. Controls and data as in Table 2.

33
Table 4. Industry, State, and Occupation Level Analysis of the Private Sector Union Wage Premium, 1983-2001
(1) (2) (3) (4) (5) (6) Level of Analysis Industry Industry State State Occupation Occupation Premiumt-1 .2584* .3453* .2051* .2366* .0907* .1746* (.0367) (.0350) (.0337) (.0333) (.0379) (.0374) Unemployment ratet-1 .6333 .5866* .4373* .5366* .3799 .5823* (.4035) (.2821) (.1449) (.1175) (.5084) (.2900) Time -.0463 -.2344* -.1547* -.0651 -.3419* -.2416* (.1056) (.0762) (.0468) (.0379) (.1343) (.0788) State/industry/occupation dummies 50 50 41 41 41 41 Weighted by # obs at 1st stage No Yes No Yes No Yes R2 .6187 .7749 .5071 .5861 .7345 .8453 N 756 756 918 918 756 756 Source: Outgoing Rotation Groups of the CPS, 1984-2001. Samples exclude individuals with imputed earnings. Standard errors in parentheses.

34
Table 5. Industry Level Analysis of the Union Wage Premium in the Private Sector, 1973-1999
(1) (2) (3) (4) (5) (6) (7) (8) (9) Premiumt-1 .6030* .2759* .6001* .2468* .3196* (.0274) (.0350) (.0284) (.0361) (.0333) Time -.0019* -.0012* .0002 -.0011* -.0001 -.0009* (.0004) (.0003) (.0004) (.0003) (.0004) (.0003) Unemployment rate .0187* .0131* .0108* .0083* .0064* .0064* .0061* .0070* .0052* (.0017) (.0017) (.0011) (.0014) (.0010) (.0021) (.0011) (.0022) (.0010) COLA .0763* .0767* .0403* .0155 -.0065 .0139 .0041 .0156 .0141* (.0313) (.0303) (.0126) (.0134) (.0090) (.0140) (.0108) (.0144) (.0096) Inflation -.0182* -.0077 .0012 .0006 .0024* .0026 .0020* .0032 .0002 (.0065) (.0069) (.0008) (.0008) (.0007) (.0015) (.0008) (.0016) (.0008) Unempt rate*COLA -.0092* -.0047 (.0038) (.0036) Unempt rate*Inflation .0026* .0012 (.0009) (.0009) Import penetration .2048* .2201* .2362* .3090* .1688* .1234* .1738* .1668* .1811* Durables (.0427) (.0414) (.0441) (.0424) (.0326) (.0416) (.0461) (.0549) (.0302) Import penetration .1655* .1459* .1491* .1698* .0939* .0880* .0914* .0945* .1043* Non-durables (.0513) (.0525) (.0509) (.0488) (.0302) (.0208) (.0419) (.0265) (.0314) Dereg.Communications .0752* .0609* .0589* .0612* .0451* .0625* .0506* .0734* .0532* (.0316) (.0244) (.0246) (.0248) (.0200) (.0307) (.0234) (.0261) (.0193) Deregulation Rail .0329 .0400 .0394 .0580 .0200 .0333 (.0905) (.0844) (.0855) (.0839) (.0616) (.0606) Deregulation Trucking -.0716 -.0617 -.0630 -.0394 -.0139 -.0332 (.0560) (.0570) (.0565) (.0518) (.0429) (.0398) Deregulation Air .0554 .0684 .0661 .0815 .0087 .0214 (.1262) (.1217) (.1190) (.1161) (.0852) (.0804) Deregulation Finance -.0614* -.0599* -.0587* -.0329 .0179 -.0174 (.0191) (.0188) (.0195) (.0203) (.0160) (.0150) Weighted .Yes Yes Yes Yes Yes No Yes No Yes Method GLS GLS GLS GLS GLS GLS OLS OLS GLS Wald Chi2/ R2 2325.01 2781.32 2686.37 3190.74 10961.71 1220.21 .8973 .6516 6189.4 N 832 832 832 832 832 832 832 832 806 Notes: all equations also include a full set of 31 industry dummies. Data are taken from Bratsberg and Ragan 2002. GLS regression estimated with industry specific AR(1) process in error term. Where indicated ach observation in the GLS regressions is weighted by the industry observation count of the first step following Bratsberg and Ragan (2002). Column 9 excludes Retail Trade. Standard errors in parentheses.

35
Table 6
Time-Series Estimates of Union Wage Premium (%), UK and Britain
LFS BSA 1985 3.5 1986 11.1 1987 7.9 1989 6.3 1990 6.3 1991 4.8 1993 14.9 11.4 1994 17.5 13.7 1995 14.6 13.1 1996 14.8 7.3 1997 11.4 17.7 1998 12.2 11.0 1999 10.2 9.5 2000 10.3 5.0 2001 4.4 2002 6.4 Note: See Data Appendix for samples and controls used.

36
Table 7: Estimated coefficients on union membership dummy from hourly pay equations
Individual Individual + workplace Whole private sector .140* .059* Covered occupations .125* .065* Men .165* .060* Women .098* .061* Manual .204* .075* Non-manual .055* .019 Note: * = significant at 95% confidence interval or above. Details of estimation procedure, controls, samples and diagnostics are contained in the Data Appendix

37
Table 8: Mean percentage hourly wage premium for union members using propensity
score matching Individual Individual + workplace Whole private sector 8.9* -1.5 Covered occupations 2.8* -1.0 Men 11.1* 2.1 Women 1.3 -3.3 Manual 17.7* 6.9 Non-manual 3.6 -1.0 Note: * = significant at 95% confidence interval or above. Details of estimation procedure, controls, samples and diagnostics are contained in the Data Appendix

39
Table 9: Sensitivity analyses
OLS, unmatched data
PSM OLS, matched data
1. Original estimates for whole private sector
6.1* -1.5 5.1*
2. Exclude union recognition and union density from workplace variables
11.7*
1.8
8.6*
3. Add workplace training and workplace tenure to individual variables
4.8*
-1.5%
5.7*
4. Change dependent variable to log gross weekly wages
7.8* -2.5% 5.4*
5a. Employees in workplaces with 50%+ union density
8.9* 2.6 4.7
5b. Employees in workplaces with <50% union density
5.0* -1.9% 4.9%*
Note: Figures are percentage differentials based on exponentiated differences in log wages between members and non-members. * = significant at 95% confidence interval or above. Details of estimation procedure, controls, samples and diagnostics are contained in the Data Appendix

40
Figure 1: Movement in the US union membership wage premium, 1973-2002
3
7
11
15
19
23
73 74 75 76 77 78 79 80 81 82 83 84 85 86 87 88 89 90 91 92 93 94 95 96 97 98 99 00 01 02
Unem ploym ent W hole econom y Private sector

41
Figure 2: Movements in the UK/British Union Membership Wage Premium, 1985-2002
Note: Unemployment using ILO definition. BSAS figures are unweighted mid-point estimates using banded earnings data.
2
4
6
8
10
12
14
16
18
20
1985 1986 1987 1988 1989 1990 1991 1992 1993 1994 1995 1996 1997 1998 1999 2000 2001 2002
BSAS UK LFS UK unemployment