The Unintended Consequences of Employment Based...
54
The Unintended Consequences of Employment Based Safety Net Programs Tianshu Li * and Sheetal Sekhri † September 2013 Abstract Employment guarantee programs are a widely used anti-poverty lever in the developing world. In this paper, we examine the consequences of increasing rural employment opportunities for the human capital accumulation of children in ru- ral areas. We evaluate the impact of India’s flagship National Rural Employment Guarantee Scheme (NREGA) on school enrollment. We exploit the timing of roll- out of NREGA across Indian districts and find that introduction of NREGA results in lower relative enrollment in treated districts. However, there is heterogeneity in the impact across households. Enrollment in private schools increases while that in government schools falls. Grade repetition and pass rates worsen in private schools despite a modest increase in the number of teachers, indicating that the scale of the program results in perverse general equilibrium effects. JEL classification: O12, O15, I25, J21 Keywords - Rural employment, Human Capital, General Equilibrium Effects * University of Virginia, PO Box 400182, Department of Economics, Monroe Hall, Charlottesville, VA 22904-4182, [email protected]. † Corresponding author: Sheetal Sekhri, University of Virginia, PO Box 400182, Department of Economics, Monroe Hall, Charlottesville, VA 22904-4182, [email protected], Phone: 434-982- 4286
Transcript of The Unintended Consequences of Employment Based...
The Unintended Consequences of Employment Based Safety Net
Programs
Tianshu Li∗ and Sheetal Sekhri†
September 2013
Abstract
Employment guarantee programs are a widely used anti-poverty lever in the
developing world. In this paper, we examine the consequences of increasing rural
employment opportunities for the human capital accumulation of children in ru-
ral areas. We evaluate the impact of India’s flagship National Rural Employment
Guarantee Scheme (NREGA) on school enrollment. We exploit the timing of roll-
out of NREGA across Indian districts and find that introduction of NREGA results
in lower relative enrollment in treated districts. However, there is heterogeneity in
the impact across households. Enrollment in private schools increases while that in
government schools falls. Grade repetition and pass rates worsen in private schools
despite a modest increase in the number of teachers, indicating that the scale of
the program results in perverse general equilibrium effects.
JEL classification: O12, O15, I25, J21
Keywords - Rural employment, Human Capital, General Equilibrium Effects
∗University of Virginia, PO Box 400182, Department of Economics, Monroe Hall, Charlottesville,
VA 22904-4182, [email protected].
†Corresponding author: Sheetal Sekhri, University of Virginia, PO Box 400182, Department of
Economics, Monroe Hall, Charlottesville, VA 22904-4182, [email protected], Phone: 434-982-
4286

1 Introduction
Employment Guarantee Schemes have been widely used as anti-poverty policies both
in developed and developing countries.1 As one of the most successfully implemented
safety net schemes, these programs smooth income shocks for vulnerable populations.
Consequently, these schemes can affect what beneficiaries spend on their children di-
rectly through income and substitution effects. We focus on schooling outcomes, which
involve an investment in the human capital of the next generation. In addition, school-
ing outcomes may respond to the scale of such programs indirectly through congestion
effects. This paper uses the temporal and spatial variation in the roll-out of the Indian
government’s 2005 National Rural Employment Guarantee Act (NREGA) to evaluate
the impact of the policy on children’s educational outcomes.
Employment guarantee schemes can influence schooling directly. The schooling out-
comes can improve due to an income effect. However, if adult’s work on government
program cites, labor becomes scarce, increasing the shadow value of children’s time to
work either on farms or in the household. The resulting substitution effect arising from
intra-household reallocation of labor , could result in deterioration of schooling outcomes.
The net result is theoretically ambiguous and depends on which effect dominates. Al-
ternatively, if parents participate in the program, they may not be able to pick up the
children from school and provide after-school supervision, preferring to withdraw them
entirely and bring them to work sites. Moreover, as demonstrated in other contexts
such as food prices (Jayachnadran et al , 2010) and consumption (Angelucci and Giorgi,
2009), large scale safety net programs can have non-trivial general equilibrium effects.
In the case of schooling, a massive influx of children into schools can dilute the quality
of education. The first contribution of this paper is to evaluate the impact of NREGA
on school enrollment in rural India, shedding light on relative magnitude of the income
effect. The second contribution is to examine the general equilibrium effects of the pro-
gram on educational outcomes including grades, pass-rates, and drop-out in rural India.
A number of factors make India’s flagship NREGA program an ideal setting to study
the impact of employment guarantee schemes on schooling. First, the massive scale of
this program makes India a compelling case to study. The program started in 2006, and
by the school year 2010-11 the program provided employment opportunities to 53 million
1The earliest experiments with this policy lever date back to the 1817 Poor Employment Act and the1834 Poor Law Amendment Act in Great Britain (Blaug, 1963, 1964), and the New Deal program ofthe 1930s in the United States (Kesselman, 1978; Bernstein, 1970). More recently Chile in 1987, Indiain 1978 and 2001, Pakistan in 1992, Bangladesh in 1983, Philippines in 1990, Botswana in 1960, andKenya in 1992 have implemented variants of employment grantee schemes. See Mukherjee and Sinha(2013) for details.
2

households for 2.3 billion man-days, making it the world’s largest operating employment
guarantee scheme. Second, the program was gradually rolled out in the districts of
India as per their “backward” status, which was defined on the basis of pre-determined
characteristics measured 10-15 years prior to the program. This variation provides an
excellent opportunity to evaluate the impact of this program.
Using a longitudinal data set of 1.13 million primary and upper-primary schools
in India, we compare within school enrollment across the districts which received the
program early versus late. We find that, conditional on school characteristics and the
net cost of attending school, growth in enrollment slows down and this result is driven by
primary schools rather than upper primary schools. This suggests that primary school
aged children are either substituting for adults in household production or are being
withdrawn from school due to lack of after school adult supervision at home. Qualitative
reports indicate that primary age children are substituting for in home production such
as taking care of younger siblings and animals or escorting parents to the work sites.
Responses to the program are heterogeneous. We find that enrollment in low-quality,
free public schools drops, while it rises in better quality, expensive private schools.2
Thus, the program increases household educational expenditure for some households,
possibly the somewhat better off households among participants in the program. Despite
this increase in allocation toward education, the quality of education received does not
improve. We observe deterioration in the grade level passing rate as well as an increase
in grade level repeaters in private schools. We find a modest increase in the number of
private school teachers in response to the program. However, it is not big enough to
fully compensate and offset the negative effects on educational outcomes.
In order to address non-random placement of the program, we control for the three
characteristics that determine the program roll out: district Schedule Caste and Tribe
population in the 1991 Census of India, 1996-97 agricultural wages, and the 1990-1993
output per agricultural worker. We include both school and year fixed effects to control
for school specific time invariant heterogeneity, and macro trends in enrollment. We also
include state-by-year time trends to control for state-specific funding decisions that may
impact schooling outcomes. In order to control for supply side effects, we include a very
comprehensive set of school- and district-level controls. Using the data for three years
before the policy was implemented (2003-2005) for a large sub-sample of the states,3 we
2A number of surveys in India show that the quality of private schools in India is much better thanpublic schools and private schools are much more expensive (Muralidharan and Kremer (2007); Desiaet al (2008))
3Only 10 states and union territories covering a very small fraction of rural India are excluded in thepre-trend comparison.
3

also compare the pre-trends in the districts that received the program early to the ones
that received it late. We do not see any evidence of differential pre-trends in enrollment.
Using this sample, we demonstrate that controlling for changes in yearly enrollment from
2003 to 2005 and allowing the trend to vary over time in subsequent years does not change
our results. We show that results are similar in the full sample and in the sub-sample
for which we have pre-treatment data to rule out bias emerging from selection into the
sample. We also show that the timing of the change in enrollment coincides with the
introduction of NREGA in early districts.
Our paper contributes to three strands of literature. The first strand examines the
causal effects of employment guarantee schemes and other safety net programs on de-
velopment outcomes. Several other studies have evaluated safety net programs, and in
particular, this program. 4 Previous evaluation has shown that NREGA increased un-
skilled wages (Imbert and Papp, 2012; Azam, 2012; Berg et al, 2012) and female labor
force participation (Azam, 2012). Imbert and Papp (2012) develop a theoretical model of
labor markets. They use their model to isolate the general equilibrium effects on wages
and quantify the redistributive welfare effects of the program. Using survey data, Ravi
and Engler (2009) evaluate the effect on the consumption of the participating house-
holds relative to non-participants. Afridi et al (2012) examine the effects of a relative
increase in mothers’ income on schooling outcomes exploiting the increase in women’s
employment resulting from NREGA in a few districts in one state. We complement this
literature and examine the effects of the program on schooling outcomes more gener-
ally.5 Further more, we show that there are unintended consequences of the program
for non-beneficiaries due to congestion externalities in schools. Our findings have impor-
tant policy implications: without adequate improvements in school infrastructure, large
scale safety net programs designed to smooth household consumption may result in poor
quality of schooling.
Our study also contributes to the literature on identifying general equilibrium effects
4See Skoufias and Parker(2003) for an in-depth analysis of the effects of Mexico’s PROGRESA onchild outcomes. PROGRESA is a conditional cash transfer program where transfers to the householdswere conditioned on children’s attending school. So the incentives households face are very differentfrom NREGA.
5Unlike Afridi et al (2012), we do not find an improvement in schooling outcomes. There are anumber of differences between our paper and their study. While Afridi et al (2012) focus on one state,we use data from the entire country from 2005 to 2008. Their study uses data from 5 districts inAndra Pradesh from 2007 and 2009. Hence, our design allows us to understand the general equilibriumeffects of the scaled up program. By 2007 NREGA was already implemented in the poorest parts ofthe country, and was being implemented in the rest of the districts. Hence, their study only makes postintroduction comparison and uses the intensity of exposure for identification. We use the roll-out timingfor identification and compare outcomes pre- and post-implementation. We also examine a very rich setof schooling outcomes, whereas they focus on time spent in school.
4

of social programs. Angelucci and Giorgi (2009) show that cash transfer programs can
increase the consumption of non-beneficiaries through transfers within social networks.
Jayachandran et al (2011) find that food subsidy programs can affect prices of food
and other durable household purchases. Ardinton et al (2009) find that social transfers
affect labor supply in South Africa. More closely related to this paper, Imbert and Papp
(2012) show that employment guarantee programs affect rural wages and employment.
They find that NREGA had re-distributive effects on rural wealth. We examine the
consequences of this widely used program on schooling outcomes and show that the scale
of the program generates unintended congestion effects in private schools at least in the
short run. Although congestion in schools can also be accompanied by compositional
changes generating negative peer effects, our findings cannot be reconciled with only
such negative peer effects.
We also contribute to a growing body of research on targeting in social programs.
Nichols and Zeckhauser (1982) and Besley and Coate (1992) present theoretical argu-
ments for using micro-ordeals such as work for benefits in designing poverty alleviation
programs. Alatas et al. (2013) and Dupas et al. (2013) empirically study the efficacy
of micro-ordeals in welfare targeting. Our study has important implications for policy
design. We show that micro-targeting that involves work for benefit can have perverse
effects on children and lower their human capital accumulation. This effect needs to be
factored in welfare calculations.
The rest of the paper is organized as follows: In section 2 , we offer more detailed
information on the NREGA in India. Section 3 discusses a simple conceptual framework
to motivate the empirical analysis. Section 4 presents the data used and Section 5
documents the results. Section 6 provides the results of the robustness tests. Section 7
offers concluding remarks.
2 Contextual Information
2.1 Background-National Rural Employment Guarantee Act
The National Rural Employment Guarantee Act, passed in 2005, provides 100 days of
guaranteed wage employment per financial year to every individual residing in rural
India. The program provides unskilled manual work at the officially determined min-
imum wage of about 2 USD per day. In a district covered by the program, an adult
can apply for work under NREGA and is entitled to public works employment works
within 15 days; otherwise, the state government provides a payment of unemployment
5

allowance (Ministry of Rural Development, 2008b). Typical projects under NREGA are
road construction, earthworks related to irrigation, water conservation, or other rural
public projects (Azam, 2012). Any households living in the rural area can apply to
work, but they cannot choose what type of project to work on. To become a beneficiary
of NREGA, adults residing in rural household need to apply for a job card (free of cost)
at the local Gram Panchayat where they reside.6 Within 15 days of application, the
Gram Panchayat issues the Job Card, which bears the photographs of all adult members
of the household willing to work under NREGA. Meanwhile, a 33% participation rate
for women is mandatory under NREGA (Ministry of Rural Development, 2008b).
While the wage is set by each state government, the central government is responsible
for the entire cost of wages of unskilled manual workers and 75% of the cost of material
and wages of skilled and semi-skilled workers. On the other hand, the state governments
bear the cost of material and wages of skilled and semi-skilled workers, as well as the
cost of the unemployment allowance (Ministry of Rural Development, 2008b). Wages are
typically paid by piece-rate but some areas also pay fixed daily wages. Daily earnings are
below the set wage due to theft and leakage in the program.7 Imbert and Papp (2012)
claim that despite its shortcomings, the program is effective at attracting casual labor
relative to the private sector.
The budget for NREGA is almost 4 billion USD, 2.3 percent of total central gov-
ernment spending, which makes the program the best endowed anti-poverty program
in India (Ministry of Rural Development, 2008a; Azam, 2012). The program provided
2.27 billions person-days of employment to 53 millions households in 2010-11, with the
whole budget in the country Rs. 345 billions (7.64 billions USD); representing 0.6% of
the GDP (Imbert and Papp, 2012).
2.2 Roll-out of the NREGA Program
NREGA was implemented in three phases. Backwardness status of the districts was
used to determine roll-out priority with representation in Phase-I provided to each state
(Planning Commission, 2003). The Planning Commission of India explicitly calculated
and ranked the backward status of Indian districts (Planning Commission, 2003). The
official ranking of backwardness of the districts in each state was based on the Scheduled
Caste and Tribe population in 1991, agricultural wages in 1996-97 and output per agri-
cultural worker in 1990-93. In the first phase of the program, 200 backward districts were
6A Gram Panchayat usually comprises of a group of villages, and is the lowest level of administrationin the Indian government (Azam, 2012).
7See Niehaus and Sukhtankar, 2008 for details.
6

notified to implement the policy in February 2006. The program was then introduced in
an additional 130 districts in the second phase in April 2007,8 and all the remaining 270
districts received the program in the last phase in April 2008.9 Figure 1 shows a map of
the districts coverage by phases. Currently, the scheme covers the entire country with
the exception of districts that have one hundred percent urban population (Ministry of
Rural Development, 2008b). This variation in the introduction of the program enables
us to identify the causal effect of this scheme on schooling outcomes. 10
3 Conceptual Framework
Decision to Enroll in School : A number of research studies have shown that rural
wages increased in response to the introduction of the program (Azam, 2012 ; Berg et
al, 2012; Imbert and Papp, 2012). In a framework where rural households are choosing
to send their children to school or not, this would result in an increase in the income
of the rural households, and hence have a positive effect on enrollment. The program
also mandated that 33 percent of the jobs be reserved for women. An increase in the
income of the mother may have an independent positive effect on children’s enrollment
in school due to improved bargaining power within the household (Qian,2008; Duflo,2003
; Thomas, 1994). On the other hand, women’s labor force participation may adversely
affect enrollment by raising the shadow value of children’s time working in the household.
Elder children of school going age may substitute for adults to provide child care for
younger siblings. In the absence of availability of after school care, women may want
to take their children to work sites. Finally, if farm labor becomes scarce, children may
work in the farms while adults find jobs under NREGA. Thus, children may substitute
for adult labor in the farm sector or household production. These factors may reduce
the enrollment in school. 11 Thus, given these opposing effects, the program yields
ambiguous effects theoretically.
8The program commenced in May in 17 phase 2 districts in Uttar Pradesh due to state legislativeassembly elections
9Due to splitting of districts for which data for the parent and split district was not available in allyears, the number of districts in our sample are 193, 123, and 254 respectively.
10Prior to February 2006, the government experimented with a pilot program (the Food for WorkProgram) in November 2004 in 150 of the 200 phase-I districts. Field observations (Dreze, 2005) andresearch studies (Imbert and Papp, 2012) have found little evidence of increase in public works due tothis pilot.
11Note that liquidity constraints can impede households from sending their children to school (Ed-monds, 2006). Households will also weigh the immediate pecuniary benefits of enrolling children in theschools against the cost. Thus, the pecuniary benefits of school enrollment (for example- if midday mealis offered) will have an impact on the enrollment decision.
7

We use grade level and gender specific enrollment data to understand the relative
importance of the above mentioned mechanisms. An increase in enrollment will imply
that the income effect dominates. However, a decline in enrollment is consistent with four
possible explanations: (1) Children substitute in farm sector, (2) Children substitute in
household production, (3) Adults are unable to find suitable after school child care so
they take their children to work sites with them, (4) returns to schooling fall locally due
to the program so children are withdrawn from school.12
We can compare primary and upper primary enrollment to speak to these alternate
explanations. A decline in enrollment for primary grades but not for upper primary
grades, is consistent with either (2) or (3) (or both), but not (1) and (4) as children in
primary classes are too young to work as substitutes in the farms but they can substitute
in home production. For example, they can help take care of younger siblings. On the
other hand, a decline in enrollment for only upper primary grades is consistent with (1),
(2) or (4) (or all of these) but not (3). Our data will allow us to distinguish: (i) if income
effect dominates overall or not, and (ii) whether some of these alternative mechanisms
are collectively at play. We cannot isolate the specific individual mechanism. 13
Choice of School Type Conditional on Deciding to Enroll: The households
for whom the income effect dominates are also faced with the choice of different types
of school to send their children to. Given that elementary government schools are free
and lower quality than private schools, households with higher disposable income may
increase their allocation for human capital of children and send them to better but
expensive private schools. This will result in increased enrollment in private schools
with an accompanying decrease in enrollment in government or other types of schools.
Supply side Response of Schools and General Equilibrium Effects The
schools may also respond to the increased demand for schooling resulting in additional of
teachers, classrooms, or other school infrastructure. The number of schools may increase
as well. If markets or state institutions compensate for increasing enrollment such that
the infrastructure, number of teachers, and (or) number of schools increase commensurate
to the enrollment, then we should see no effect on the performance outcomes. However,
if the supply side does not adjust rapidly to offset the demand shock, there might be
general equilibrium effects of the program. An increase in enrollment may result in
12Jensen (2010) shows the enrollment in India responds to information about returns to education.13NREGA guidelines mandated reservation of jobs for women. If the mother’s additional income has
an effect on children’s outcomes through preferences and the mother prefers children’s education morethan the father, then we should observe the enrollment of both girls and boys increase. However, weshould observe a larger impact on girls’ enrollment as they lag behind boys’ enrollment in school inIndia.
8

congestion externalities and there are two ways in which this can result in deterioration
of schooling quality. First, the increase in the number of students may increase the pupil-
teacher ratio and reduce the per capita access to school resources. Second, negative peer
effects can arise if the new students who enroll in school are not well prepared for school.
Both of these effects can arise on the intensive margin in private schools, that is, if
the students previously enrolled in government schools shift to private schools. Note
that the increased number of teachers reducing the pupil-teacher ratio can offset any
negative peer effects as well. Thus, school performance outcomes provide insights into
whether the program results in such unintended externalities. While our data allow us
to examine the overall effects, we are not able to decompose the overall effect into pure
peer or congestion effects.
4 Data
The principal source of data is the annual panel of Indian elementary schools called the
District Information System for Education (DISE). 14 The data covers grades 1 through 8
in 1.13 million schools in the country. School characteristics include: staff characteristics
such as gender and qualification of teachers, infrastructure measures including availability
of common toilets, gender specific toilets, drinking water facilities, and electrification,
and enrollment by gender and grade. The data also include appearance and pass rates
pass for school examinations for grades 5 and 7 and grade repetition for all grades.
Primary schools in India may have only primary classes (grades 1 through 5), only
upper-primary classes (grade 6 through 8), or both (grade 1 through 8). The data provide
information about whether the school offers only primary classes, only upper-primary
classes, or both. The school management categories in the data include (1) Department
of Education, (2) Tribal/Social Welfare Department, (3)Local body, (4)Private Aided,
(5) Private Unaided, (6) Others, and (7) Un-recognized. We construct three aggregated
categories- government run schools (1 and 2), private schools (4 and 5) and others (3
, 6, and 7). In addition to these features, the data report ongoing incentive schemes
in various schools to increase enrollment. Various schemes running in schools before
NREGA provide free uniforms, textbooks, stationery, and attendance fellowships. 15
14DISE is collected every year in a joint collaboration between the Government of India, UNICEF andthe National University of Educational Planning and Administration (NUEPA). The data is publiclyavailable from NEUPA.
15These data are collected using a district level administrative structure. School principals fill astandardized survey about the school. The data are manually checked at various levels for completeness,accuracy, and inconsistencies. States also implement checks. NEUPA has commissioned an external
9

The district level characteristics are from the Census of India 1991 and 2001. These in-
clude total population, population growth rate, percentage of female population, literacy
rate, female literacy rate, percentage of Scheduled Caste and Scheduled tribe population,
and percentage of working population. Agricultural wages 1996-97 and total output per
agricultural worker for 1990-93 are from the Planning Commission’s 2003 report. Tables
1 through 6 present the summary statistics.
Table 1 provides the summary statistics for the outcome variables for the schools
in the sample period. The average enrollment is 220.22 students per school, of these
114.8 are boys and 106 are girls. Average enrollment in primary classes is higher at
214 students compared to 108 in upper primary classes. The pass rate for enrolled
students is approximately 90 percent for grade 5 and 87 percent for grade 7. Some
children do not take exams and the pass rate in grades 5 and 7 conditional on taking
exams is 96 and 91 percent, respectively. Overall 6.1 percent students repeat grades.
Grade repetition is higher for primary school children at 6.4 percent compared to 4.8
for the upper primary students. Grade repetition among boys is higher than girls in
both primary and upper-primary. On average, there are 3.5 teachers in a government
school and 6.38 in private schools. Both government and private schools have more male
teachers than female teachers. The average enrollment is 222.7 students in government
schools, 286.8 students in private schools , and 170 students in other schools.
Table 2 provides the summary statistics for other variables used in the analysis. Most
notably, 13 percent of the schools in the sample are private schools and 66 percent are
government schools. Around 60 percent schools have a toilet, only 27 percent are elec-
trified, and 86 percent have a drinking water facility. There are 3.75 classrooms per
school on average, of which 2.6 are in good condition. A number of pre-existing incen-
tive schemes are benefiting around half the students. These are targeted towards girls.
As discussed later, a government of India flagship program was initiated much before
NREGA and affected schooling for girls. Table 3 and 4 show the summary statistics
of outcome variables and other variables by phases of NREGA districts. Consistent
with the roll-out criterion, Phase- III districts have better educational outcomes, more
private schools, and better schools facilities. Finally, Table 5 compares the overall char-
acteristics of the districts in the three phases of NREGA. While there is no difference
in the population growth rate, the literacy rate is much higher in phase III districts.
The three criteria used to determine the roll-out confirm that phase I districts are the
audit of the school data. These audits check 5 percent of the schools chosen randomly from at least10 percent of the districts from each state. The auditors also visit the schools. These audits haveestablished that the enrollment data reported by the principals are remarkably accurate.
10

most “backward”. Average Schedule Castes and Tribes population at 38.4 percent is the
highest, while agricultural wages and output per worker are the lowest. Over this period,
educational outcomes improved in all districts: Enrollment increased and proportion of
repeaters declined. There is also a growth in number of schools. Hence, our data is an
unbalanced panel of schools.
5 Empirical Strategy
We use the timing of roll-out of the NREGA program across districts of India for identi-
fication. Phase-I districts received the program in February 2006, Phase-II in 2007 and
Phase-III in April 2008. We use 2005 as the baseline year and include data from 2005-
2008 in our analysis. Later we use data from 2003 to provide support to our identifying
assumption.
5.1 Roll-out and Selection
The timing of the roll-out of the program was not randomly determined. The selection
criterion based on characteristics described above would not be orthogonal to schooling
decisions of households. For example, higher output per agricultural worker may generate
higher income which would affect a household’s allocation toward education. Thus, a
simple comparison of the districts across different phases is not likely to generate causal
estimates of the program. In order to circumvent this issue, we compare outcomes within
districts that received program in different phases over time. This allows us to control
for time invariant differences in unobserved characteristics of districts that received the
program in different phases. We also use within-school variation for identification by
including school fixed effects to purge any time invariant school level characteristics that
may be correlated with the treatment.
We further interact the three variables determining selection into the phase of roll-out
with year indicators to control for trends in these variables. In addition, we include a
rich set of district specific controls including: 2001 levels of total population, percentage
of rural population, population growth rate, overall literacy rate and female literacy rate
interacted with year indicators. We also control for a state specific time trend to control
for state specific time-varying unobserved heterogeneity, such as discretionary state-level
education funding. Our identifying assumption is that the outcomes in districts that
received the program in different phases are not trending differentially prior to treatment
after controlling for trending program criteria. For a sub-sample of states for which data
11

is available from 2003, we show that growth in school enrollment in districts that received
the program in different phases is very similar prior to the program. We also show that
the within-school results are invariant to including changes in enrollment from 2003 to
2005. We do not have data from 2003-2005 for 10 small states and union territories.
We verify that excluding these 10 states in our empirical analysis does not influence the
results to rule out selection into the sample.
5.2 Estimation Procedure
We use school level data from 1.13 million schools from 2005 to 2008 to test our hypothe-
ses. Our empirical specification is as follows:
Yidst = α0 +α1NREGAdt +α2 Xidst +α3 Zds ∗Tt +α4 States ∗ trend+Tt +Iids +εidst (1)
where Yidst is the outcome variable for school i in district d in state s in year t.
NREGAdt is an indicator that takes value 1 if district d in state s has started the
NREGA program in year t, and 0 otherwise; Xidst is a vector of school level controls
including different kinds of incentives received by the students, and the characteristics
of the teachers and infrastructure of the school i in district d in state s in year t; Zds
is a vector of district-level controls for demographic characteristics, and is interacted
with year indicators to control for trends; States is a vector of state indicators, and is
interacted with time trends to control for state-specific trends; Tt and Iids are year- and
school-fixed effects, respectively, and εidst is the idiosyncratic error term. We drop the
NREGA phase indicators due to multi-collinearity in our school fixed effects model. We
cluster errors at the district level to account for arbitrary correlation over time.
In order to examine the school choices conditional on deciding to enroll, we interact
the introduction of NREGA with the type of school. The empirical model is as follows:
Yimdst = β0 + β1NREGAdt + β2 Pids ∗NREGAdt + β3 Gids ∗NREGAdt
+β4 Ximdst + β5 Zds ∗ Tt + β6 States ∗ trend+ Tt + Iids + εidst
where Yimdst is the outcome variable for school i of type m in district d in state s
in year t. Pids is an indicator equal to 1 for private schools and 0 otherwise and Gids is
an indicator which takes value 1 for government schools and 0 otherwise. The omitted
category is others. We include the the interaction of the NREGA policy indicator with
each of these type indicators to examine whether enrollment differs by school type.
Note that once we include the school fixed effects, indicators for school type (private
12

and government) are not included as these are time invariant properties of schools. As
before, we also drop the phase indicators due to multi-collinearity in the school fixed
effects model.
The outcomes we examine are: pass rate, pass rate conditional on taking the exams,
taking the exams and grade repetition. We also investigate whether number of teach-
ers, number of classrooms, and number of schools respond to the increased demand for
schooling, if such a demand arises in this context. 16
6 Results
6.1 Overall Enrollment
We test the implications of the the conceptual framework we presented in Section 3.
First, in order to evaluate the effect of NREGA on equilibrium overall enrollment, we
estimate equation 1 and present the results in Table 6. Column (i) presents the basic
difference-in-difference specification with school and year fixed effects. This result is ro-
bust to controlling for state specific time trends as reported in column (ii), which may
capture state spending priorities. Both specifications control for district level controls
that influenced the roll-out priorities. We control for the Scheduled Castes and Tribes
population as per Census of India 1991, agricultural wage in 1996-97, and output per agri-
cultural worker in 1990-93, interacted with time indicators to account for the backward
district status that influenced selection into the program. In addition, we also control for
the districts level total population, percentage of urban population, population growth
rate, overall literacy rate, and women’s literacy rate. The school-level controls include
any attendance scholarships being offered at the time, uniform, books, stationery and
other such subsidies offered to girls, the number of classrooms, the number of classrooms
in good condition, availability of common toilets, girls toilets, drinking water facilities,
electrification status, number of male teachers, and number of female teachers.
The coefficient in column (i) is -2.19 and is statistically significant at the 5 percent
level. Overall, enrollment is this period is increasing and thus this coefficient indicates
that introduction of NREGA results in a smaller increase in within school enrollment
in treated districts across the years in the sample. Hence implementation of NREGA
results in relative slower growth in enrollment, with 2 fewer children enrolled per school
in the treated districts.
16Conditional on school fixed effects, changes in the variables that are determined by the schools areinterpreted as the supply side response.
13

When split by primary and upper primary grades, it is clear that this effect is driven
by primary classes where the magnitude is 2.23 (Columns (iii) and (iv)). This implies
that young children either substitute for adults in home production or are being taken
to work sites due to unavailability of suitable after school child care. We do not find
any change in the enrollment of children in upper-primary classes. Since these children
are already past elementary school (which is free in case of government schools), it is
possible that households do not want to withdraw these children from schools as they
have invested in their schooling substantially. 17
The field work conducted by Centre for Social Protection (Sudarshan, 2011) indicates
that a majority of women who work in NREGA projects take their primary school aged
children to work sites or leave them at home to provide child care for younger siblings.
The study conducted semi-structured interviews of the women on NREGA sites in various
districts. One woman reported “Nobody is there to look after the child. Women have to
take care of their own children. Some women do come with a small baby but they bring
along an older son or daughter to take care of the infant while the woman carries out her
work.” The field investigators reported that older children seemed to be 10 to 12 years
old. When the interviewer asked if these children go to school, one woman said, “Madam
jo site par jayega woh school kaise ja sakta hai?” (If a child has to go to the site how
can she go to school?). At another place, the response was, “Women do not come with
their children but leave their children at home with other siblings who look after them.”
Other field studies have reported similar findings (Bhatty , 2006). These qualitative
findings corroborate our quantitative finding that the program induces primary school
aged children to withdraw from school. These children either substitute for adults in
home production or are taken to work sites.
6.2 Effects by Type of Schools
In order to examine if the type of school that children attend is affected due to an increase
in the income of the parents, we evaluate equation 2 and report the results in Table 7. In
Table 7, we show the interaction of the NREGA implementation policy dummy interacted
with government school indicator and private school indicator. The excluded category
is ‘other types’ schools. Columns (i), (iii), and (v) repeat the results of the estimation
of equation 1 for overall enrollment, primary enrollment and upper-primary enrollment.
17However, it is also possible that households who are employed in NREGA sites are younger and donot have children beyond the primary grades. In our subsequent analysis, we do observe heterogenouseffects on children in upper primary schools as well. Hence we do not think that participating household’sdemographic composition is driving these results.
14

These are reported in columns (iv)-(vi) in Table 7 and are reproduced for comparison.
Overall enrollment in government schools decreases by 3 additional children per school
whereas it increases in private schools by 23.8 additional children per school (column
(ii)). This is equivalent to 0.2 of a within standard deviation in private schools. The
coefficient on the interaction term with the government school indicator is significant at
the 5 percent level and with the private school indicator at the 1 percent significance
level. Among primary schools, the decrease in government school enrollment is 4.52 per
school, and the increase in private school enrollment is 25.6. This effect is muted in the
upper-primary classes, where there is no drop in government school enrollment but an
increase of 5.48 in private schools. Hence parents shift children previously enrolled in
the other types of schools into private schools. Since 66 percent schools in the data are
government schools and only 13 percent are private schools, the increase in enrollment
per private school is much larger than decrease in government schools.
The effect of the program on overall enrollment is small in magnitude and is around
1 percent reduction in enrollment. Using the average number of government, private and
other schools per district in the sample period, our results indicate that 9,824 children
per district are not attending school due to the program. However, our results indicate
a 9.8 percent change in enrollment in private schools. Private primary school enrollment
increases 12 percent (or 10.8 percentage point of a base of 90 percent enrollment in
primary schools) and the private upper primary school increases 4.7 percent. These
effects are sizable and comparable in magnitude to the effects found in other studies that
examine interventions focussing on increasing school enrollment in India. For example-
Oster and Millet (2010) find that call centers in India result in a 5.7% increase in children
enrolled in schools.18 In Appendix Tables 1 and 2, we report the coefficients of the
interaction term by grade. The increase in the private school enrollment is spread across
classes until grade 7. The effect in grade 8 is the lowest. It is only in lower grades,
that we observe a decrease in enrollment in government schools. This further suggests
that overall enrollment is unaffected in higher classes by NREGA due to sunk cost in
investment in children’s education.
6.3 General Equilibrium Effects
We next turn to understanding the effects of the program on performance in schools.
As discussed in the conceptual framework, the program could lead to a deterioration in
18In a work in progress, Muralidharan and Prakash (2012) find that providing bicycles to girls increasessecondary school enrollment for 4-5 percentage points. Our results do not vary by gender. We find similareffects for girls and boys.
15

the performance outcomes if there are congestion effects or negative peer effects arising
from increased enrollment. The DISE data provides various measures of performance in
school. For grade 5 and 7, DISE includes the number of students passing the annual
examinations and the number of students appearing for such exams. We construct 3
measures from these variables:the pass rate as the number of students passing divided
by the total students enrolled, the number of students passing conditional on appearing in
the exam, and the number of students appearing in the exam conditional on enrollment.
We present the results in Table 8. Pass rate in government schools is unaffected even
though the enrollment drops (Table 8, columns (i) - (iv)). However, the pass rate in
private schools declines in grade 5. In grade 7, the effect is much smaller and the
coefficient is statistically significant at the 10 percent level for only girls although we
cannot reject equality of the effect on boys and girls. A one-child-per-school increase in
enrollment results in approximately a 1.17 percent decrease in the pass rate for boys and
a 1.8 percent decrease in the pass rate for girls in grade 5. However, a one-child-per-
school increase in enrollment in private school enrollment for boys in grade 7 does not
result in a reduction in the pass rate and a 0.5 per school increase in enrollment for girls
reduces the pass rate by 0.68 percent.
In columns (v) through (viii) of Table 8, we examine the impact on passing conditional
on appearing in the exam. In grade 5 of private schools, we observe a highly statistically
significant decline in this measure of performance as well. The effect for boys and girls is
the same in magnitude around (1 percent decline) and sign. However, there is no effect in
grade 7. Appendix Table 3 shows that the number of children appearing in exams falls in
private schools for boys and girls in both grade 5 and 7, but the magnitude of the effect
is smaller in grade 7. Since the pass rate conditional on appearing in exams falls, this is
on account of fewer children passing rather than an increase in children taking the exam.
Grade 5 has fewer students on average than grade 7. The average number of students
in grade 5 in private schools is 25.51 with a standard deviation of 30.7 (the average for
boys is 14.4 and the girls is 10.7 ). By contrast, the average number of students in grade
7 in private schools is 45 with a standard deviation of 50.1 (the average number of boys
is 26 and girls is 20.3). Thus, the marginal congestion effect of adding one more child in
classes with lower enrollment level is larger in magnitude.
In Table 9, we evaluate the impact on grade repetition. This data is available for
all classes. The program results in around 0.5 percent additional repeaters in private
schools (column (i)) and this is statistically significant at the 5 percent level. This effect
is the same for boys and girls (columns (ii) and (iii)). Splitting this by primary and
upper primary grades, we can see that the effect is driven by grade repetition in primary
16

grades as shown in columns (iv)-(ix). This is consistent with the evidence presented so
far. Appendix Tables 4 and 5 show grade-by-grade repetition.
6.4 Supply Side Response
We have demonstrated that the program induced an increase in enrollment in private
schools and a deterioration in the performance measures taking into account the supply
side response. But it is instructive to examine how the schools responded to the demand
shock. Therefore, we also examine the supply side response to the program. Specifically,
we examine whether or not schools hire more teachers, in total and by gender and report
the results in column (i) - (vi) in Table 10. Overall, there was a very small increase
in the number of teachers per school. This is marginally significant at the 10 percent
level (column (i)). However, the number of teachers in private schools increased by 0.2
per school and this is statistically significant at the 1 percent level. The number of
teachers in government schools decreased by 0.138 per school, also significant at the 1
percent level. The number of male teachers declined in government schools and increased
in private schools with no increase in the total number (columns (iii) and(iv)). Hence
there is a flight of male teachers from government schools and other type of schools
to private schools. The overall increase in teachers is driven by an increase in female
teachers. Female teachers in government schools are unchanged whereas the number
increases in private schools by 0.1 teacher per school (columns (v) and(vi)). In columns
(vii) through (x), we examine the effect of the program on the number of classrooms
and the number of classrooms in good condition. We do not detect any effect. Despite
the improvements in schools due to more teachers, the performance in private schools
deteriorates. Hence the program generates negative externalities on students in private
schools that the markets are not able to internalize. The government schools become
less crowded and also lose teachers. Hence, there is no evidence showing a net benefit to
students attending government schools.
6.5 Congestion Effects versus Substitution Effect
We have demonstrated that children’s performance worsens in private schools as en-
rollment increases. We argue that this is on account of either congestion effects or a
combination of congestion and negative peer effects. One alternative explanation might
be that this is purely a substitution effect operating on the intensive margin: children
who attend school also help with house work or in the fields and thus have fewer hours
to devote to studying. There are a number of facts that indicate that this is not the
17

case. First we observe this deterioration in private schools and not government schools.
Because government schools have fewer students and fewer teachers, if performance were
affected only through the substitution effect, then we would see a worsening of outcomes
for the government school students as well. That the performance of government school
children is not worsening indicates the existence of a congestion effect. Second, within
private schools this effect varies in primary and upper primary schools. We discern a
negative significant effect on performance in primary grades (grade 5) but not in upper
primary grades (grade 7). The upper primary children have an advantage at substitution,
but these children’s outcomes are not relatively worse. Third, there are fewer children
in primary classes than in upper primary grades and the addition of 1 child per grade
has a larger negative effect in primary classes versus upper primary classes. This is not
consistent with a hypothesis that a pure substitution effect is driving our results. In fact,
the patterns within private schools provide strong evidence of congestion externalities.
Adding a student in a large class (grade 7) does not worsen the average educational
outcomes, while adding an additional student to a smaller class worsens educational
outcomes (grade 5).
6.6 Congestion Effects versus Peer Effects
Another possibility is that the marginal student who moved to a private school is from
the lower end of the ability distribution and this pulls down the average performance
in primary grades of private schools. This alone cannot consistently explain all our
findings because it is not consistent with the results for private schools. Adding a weak
student in grade 7 in private schools does not affect average educational outcomes but
adding a weak student in grade 5 worsens the average educational outcomes, all else
equal. If negative peer effects were the only driving mechanism, these patterns would
not be plausible. A more nuanced possibility is that parents are strategic about which
children to move from government schools to private schools. If they shifted only very
smart children in upper primary grades and relatively weaker students in primary grades,
then peer effects would explain the effects in private schools though not in government
schools. Under this hypothesis the upper primary government schools would lose their
good students and some teachers. If so, we should see a deterioration in their educational
outcomes but we do not discern any effects. Hence, our results are not due to from peer
effects alone. However, we cannot rule out that these peer effects operate in addition to
congestion effects.
18

7 Robustness Checks and Sensitivity Analysis
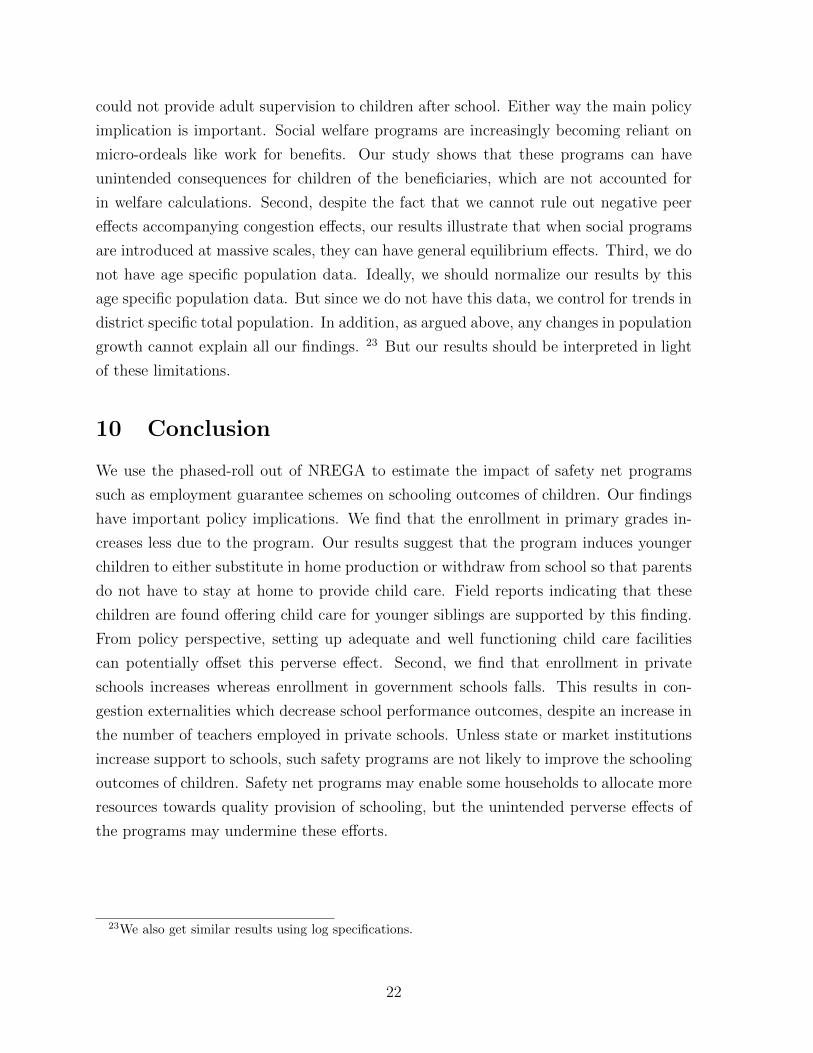
Our identifying assumption is that there are no pre-trends in enrollment in districts
belonging to different phases prior to NREGA’s implementation. DISE data is not
available for all states prior to 2005, although major states are covered since 2003. We
use data from 2003 to 2005 to check if there are differential pre-trends in enrollment by
phases of NREGA roll-out. Since we are using a sub-sample of states from our main
sample to conduct this test, we first show that this sub-sample is not selected in any
way that can confound our results. There are 10 states or Union Territories for which
data is available in years subsequent to 2003 but prior to 2005 and are thus used in
the empirical analysis in the paper. 19 We exclude these states from our sample and
replicate the analysis from Table 6 and Table 7 for only the states for which DISE data
is available since 2003. The results from this exercise are reported in Appendix Tables 6
and 7 and are remarkably similar to those reported in Tables 6 and 7. This test assures
that selection into the sample does not confound our results.
Given that our main results are no different if we exclude or include these states,
we proceed to show that for the sample for which we have the pre-program data, the
pre-trends in enrollment are similar. Phase III districts are better in levels. But the
growth rate in enrollment is similar. Figures 2 and 3 show that between 2003 and 2005,
the growth in enrollment and number of schools looks similar across districts in different
phases. 20 In Table 11, we control for district specific changes in enrollment from 2003
to 2005 (pre-treatment years) and allow this to vary over time by interacting with year
indicators for the states for which we have data pre-program data.21 The overall effect on
enrollment and enrollment by primary and upper primary are similar to those reported
in Table 8 and Appendix Table 7. These two tests together show that pre-trends in
enrollment are not biasing our results.
We also conduct an event study analysis to examine the timing of the effects for the
states that we have the data from 2003 onwards. We run a year-by year difference-in-
difference model comparing early versus late NREGA districts and plot the coefficients
in Figure 4. We observe a large decline in enrollment in 2006, the year NREGA was
introduced and subsequently enrollment in early phase districts continues to be lower
19These states or Union territories are: Jammu and Kashmir, Haryana, Arunachal Pradesh, Manipur,Daman and Diu, Dadra and Nagar Haveli, Goa, Lakshadweep, Pondicherry, and Andaman and NicobarIslands.
20Limited data for a few states is also available for 2001 and 2002 but the coverage is not as expansive.Since data for many states and many variables is not available, we do not use these years.
21We lose 0.7 percent of our sample schools as new districts were carved in 2004 and we are unableto use their pre-trend data.
19

relative to the pre-program years. This further substantiates our study design. 22
Some schools report very small enrollment in our sample. We cannot directly verify if
this is due to coding and measurement error by district officials. Thus we run a sensitivity
test. We exclude the schools in the 5th percentile of the enrollment distribution and re-
run our basic specifications from Tables 6 and 7. The results are invariant to this change
in the sample and are reported in Appendix Tables 8 and 9.
8 Alternative Channels
8.1 Other Programs
The Government of India introduced two programs in the early 2000s to promote direct
enrollment in schools. The first program,the Sarva Shiksha Abhiyan (SSA, was intended
to provide universal access to elementary education for children between 6-14 years.
SSA directly aimed to increase enrollment, retention, and the quality of education in
elementary schools by infrastructure provision and scholarships for marginalized social
groups. The provisions also aimed to eliminate gender differences. This program was
started in 2001, much earlier than the launch of NREGA. Although this program targeted
educationally backward blocks, these did not coincide with the districts in a particular
phase of NREGA. Another government of India program, the Midday meal scheme, was
also intended to increase school enrollment. This program was in effect prior to 2000 and
following a 2001 Supreme Court directive, states increased outlays for this program. Thus
the intensity of coverage increased sharply in many states following this directive. This
program was in place for several years before the introduction of NREGA. In addition,
many states increased provision of midday meals at the same time. Therefore, the timing
did not coincide with NREGA’s phased roll-out and we do not think that our results are
confounded by these programs.
8.2 Growth and Demand for Private Schools
One concern might be that the increase in private schools is driven by growth in the
private school market, independent of the program. For example, economic growth may
increase the demand for private schooling. During this time, the Indian economy was
22Note that for 2003 and 2004, we do not have several school level control variables in the data.Specifically, we do not have data on teacher characteristics and school infrastructure variables. Thus,the regression analysis in this event study excludes these variables. Also, we get the same patterns ifwe use 2002 as baseline year instead of 2003.
20

growing very rapidly and the demand for schooling maybe increasing as well. Any global
economic shocks are captured by the time fixed effects. In addition, the estimates are
robust to including state specific trends. Therefore, different trajectories of growth across
states is not generating our results. It is unlikely that growth driven demand for private
schools affects the specific districts of NREGA phases from different states at specific
timings that coincide with the introduction of NREGA. Figure 5 shows phase wise trends
in expansion of schools. Panel A shows trends for government schools and Panel B shows
the trends for private schools. Regardless of the school type, these trends are very similar
across early and late NREGA districts. Thus, an independent increase in demand for
private schools is unlikely to be driving our results.
8.3 Migration and Population Changes
Anecdotal evidence suggests that NREGA reduced out-migration from poor districts to
richer ones. To the extent that this does not change the composition of the districts
before and after the program, this should not be a concern for our analysis. One concern
is that we show changes in enrollment but not enrollment rate. We address this using
the baseline district population from the Census of India 2001 and interacting it with
time indicators to control flexibly for trends in population. If NREGA attracts migrants
into districts, and in-migrants are richer and send their children to private schools, then
the results could be driven by changes in population. Across district migration in India
is very low (Topolova, 2010 ). Land markets are thin so richer households do not tend
to permanently migrate, at least in the short run. Finally, if migration were responsible
for the changes in enrollment, then we would expect similar sized effects for primary and
upper primary grades and individual classes within these grades. As shown in Table 8
and Appendix Tables 1 and 2, the size of the effect is much larger in grades 1 through
5 and much smaller in grades 6 through 8 with no effect discerned in grade 8. It seems
implausible that rich households with children only in specific age groups would migrate
into the NREGA districts to find work, especially since the early phase districts were
poorer and have worse infrastructure. It is less likely that our results are confounded by
the changes in population due to massive in-migration.
9 Caveats
While we can identify that the program slowed down enrollment growth in schools, we
cannot isolate if this was due to substitution into home production or because households
21
could not provide adult supervision to children after school. Either way the main policy
implication is important. Social welfare programs are increasingly becoming reliant on
micro-ordeals like work for benefits. Our study shows that these programs can have
unintended consequences for children of the beneficiaries, which are not accounted for
in welfare calculations. Second, despite the fact that we cannot rule out negative peer
effects accompanying congestion effects, our results illustrate that when social programs
are introduced at massive scales, they can have general equilibrium effects. Third, we do
not have age specific population data. Ideally, we should normalize our results by this
age specific population data. But since we do not have this data, we control for trends in
district specific total population. In addition, as argued above, any changes in population
growth cannot explain all our findings. 23 But our results should be interpreted in light
of these limitations.
10 Conclusion
We use the phased-roll out of NREGA to estimate the impact of safety net programs
such as employment guarantee schemes on schooling outcomes of children. Our findings
have important policy implications. We find that the enrollment in primary grades in-
creases less due to the program. Our results suggest that the program induces younger
children to either substitute in home production or withdraw from school so that parents
do not have to stay at home to provide child care. Field reports indicating that these
children are found offering child care for younger siblings are supported by this finding.
From policy perspective, setting up adequate and well functioning child care facilities
can potentially offset this perverse effect. Second, we find that enrollment in private
schools increases whereas enrollment in government schools falls. This results in con-
gestion externalities which decrease school performance outcomes, despite an increase in
the number of teachers employed in private schools. Unless state or market institutions
increase support to schools, such safety programs are not likely to improve the schooling
outcomes of children. Safety net programs may enable some households to allocate more
resources towards quality provision of schooling, but the unintended perverse effects of
the programs may undermine these efforts.
23We also get similar results using log specifications.
22

Acknowledgements: We wish to thank Leora Friedberg, Kartini Shastry, and Heidi
Schram for valuable suggestions.
Conflict of Interest: The authors have no conflict of interest to declare.
23

References
[1] Afridi, F. , A.p Mukhopadhyay, and S. Sahoo (2012), “ Female Labour Force Partic-
ipation and Child Education in India: The Effect of the National Rural Employment
Guarantee Scheme”, IZA Discussion Paper No. 6593.
[2] Alatas, V., A. Banerjee, R. Hanna, B. Olken, R. Purnamasari, and M. Wai-poi
(2013), “Ordeal Mechanisms In Targeting: Theory And Evidence From A Field
Experiment In Indonesia”, NBER working paper 19127.
[3] Angelucci, M. and G. Giorgi (2009), “ Indirect Effects of an Aid Program: How
do Cash Injections Affect Ineligibles’ Consumption?”, American Economic Review,
Vol. 99 (1), pp.486-508.
[4] Ardington, C., A. Case, and V. Hosegood (2009), “ Labor Supply Responses to Large
Social Transfers: Longitudinal Evidence from South Africa,” American Economic
Journal: Applied Economics, Vol. 1 (1), pp. 22-48.
[5] Azam, M. (2012),“ The Impact of Indian Job Guarantee Scheme on Labor Market
Outcomes: Evidence from a Natural Experiment,” IZA Discussion Paper.
[6] Basu, A. K. (2011), “ Impact of Rural Employment Guarantee Schemes on Seasonal
Labor Markets: Optimum Compensation and Workers’ Welfare” IZA Discussion
Paper No. 5701.
[7] Basu, A. K., N. H. Chau, and R. Kanbur (2009), “ A Theory of Employment
Guarantees: Contestability Credibility and Distributional Concerns,” Journal of
Public economics, Vol. 93 (4), pp. 482-497.
[8] Berg, E., S. Bhattacharyya, R. Durgam, and M. Ramachandra (2012), “ Can Rural
Public Works Affect Agricultural Wages? Evidence from India”, CSAE Working
Paper 2012-05.
[9] Bernstein, Barton J. (1968), “ The New Deal: The Conservative Achievements of
Liberal Reform” Towards a New Past: Dissenting Essays in American History,
edited by Bernstein, Barton J., New York: Pantheon Books.
[10] Besley, T. and S. Coate (1992), “ Workfare versus Welfare: Incentive Arguments for
Work Requirements in Poverty-Alleviation Programs,” American Economic Review,
Vol. 82 (1), 249-261.
24

[11] Bhatty, K. (2006) “Employment guarantee and child rights”, Economic and Political
Weekly, pp. 1965-1967.
[12] Blaug, M. (1963),“ The Myth of the Old Poor Law and the Making of the New,”
Journal of Economic History Vol. 23, 151 - 184.
[13] Blaug, M. (1964), “ The Poor Law Report Re-examined,” Journal of Economic
History Vol. 24, 229 - 245.
[14] Datt, G. and M. Ravallion (1994), “ Transfer Benefits from Public-Works Employ-
ment: Evidence for Rural India,” The Economic Journal,Vol. 104 (427), 1346-1369.
[15] Desia, S., Dubey,A., Vanneman,R. and R. Banerji (2008), “Private Schooling in
India: A New Educational Landscape”, India Human Development Survey Working
Paper 11.
[16] Dreze, J. and A. Goyal (2003), “ The future of mid-day meals, Economic and Po-
litical Weekly November 1, 4673-4683.
[17] Dupas, P., V. Hoffmann, M. Kremer, and A. Zwane (2013), “Micro-ordeals and
preventive health products: Evidence on short-term take-up and habit formation”.
[18] Edmonds, E. (2006), “Child Labor and Schooling Responses to Anticipated Income
in South Africa,” Journal of Development Economics, vol. 81(2), pp. 386-414.
[19] Imbert, C. and J. Papp (2012), “Equilibrium Distributional Impacts of Government
Employment Programs: Evidence from Indias Employment Guarantee” Centre for
Micro Finance Working Paper.
[20] Institute of Applied Manpower Research (2009), “ All-India Report on Evaluation
of NREGA: A Survey of Twenty Districts”.
[21] Kremer, M. and K. Muralidharan (2007) ,“ Public and Private Schools in Rural
India”, Harvard University unpublished manuscript.
[22] Jacoby, H. and E. Skoufias (1997), “Risk, Financial Markets, and Human Capital
in a Developing Country”, Review of Economic Studies, vol. 64, pp. 311-335.
[23] Jayachandran, S., J. Cunha, and G. D. Giorgi (2010), “ The Price Effect of Cash
Versus In-Kind Transfers”, CEPR Development Economics Workshop Working Pa-
per.
25

[24] Jensen, R. (2010), “The (Perceived) Returns to Education and the Demand for
Schooling,” Quarterly Journal of Economics, Vol. 125(2), p. 515-548.
[25] Kesselman, Jonathan R. (1978), “ Work relief programs in the Great Depression”
Creating Jobs: Public Employment Programs and Wage Subsidies, edited by Palmer,
J.L., Washington, D.C.: Brookings Institution.
[26] Khera, R. (Ed.) (2011). The Battle for Employment Guarantee. Oxford University
Press.
[27] Ministry of Rural Development (2008a), “Annual Report (2007-2008)”, Government
of India.
[28] Ministry of Rural Development (2008b), “The National Rural Employment Guar-
antee Act 2005 (NREGA): Operational Guidlines 2008”, Government of India.
[29] Mukherjee, D. and U. B. Sinha (2013), “ Understanding NREGA: A Simple Theory
and Some Facts” Human Capital and Development: The Indian Experience, Ch 7,
103 - 128.
[30] Murgai, R. and M. Ravallion (2005), “ Employment Guarantee in Rural India: What
Would It Cost and How Much Would It Reduce Poverty?” Economic and Political
Weekly, Vol.40 (31), 3450-3455.
[31] Nichols, A. and R. Zeckhauser (1982), “Targeting Transfers through Restrictions
on Recipients,” American Economic Review, Papers and Proceedings, Vol. 72, pp.
372-7.
[32] Niehaus, P. and S. Sukhtankar (2009), “ Corruption Dynamics: The Golden Goose
Effect”, BREAD Working Paper 223.
[33] Oster, E. and Millet, B. (2010), “ Do Call Centers Promote School Enrollment?
Evidence From India”, NBER Working paper 15922.
[34] Psacharopoulos, G. (1997), “Child Labor versus Educational Attainment: Some
Evidence from Latin America”, Journal of Population Economics, vol. 10.
[35] Planning Commision (2003), “Identification of Districts for Wage and Self employ-
ment programmes”.
26

[36] Qian, Nancy (2008), “Missing Women and the Price of Tea in China: The Effect of
Sex-Specific Income on Sex Imbalance”, The Quarterly Journal of Economics, Vol.
123 (3).
[37] Rogers, C. and K. Swinnerton, K. (2004), “Does Child Labor Decrease when
Parental Incomes Rise”, Journal of Political Economy, vol. 112.
[38] Rosenzweig, M. and R. Evenson (1977), “Fertility, Schooling and the Economic
Contribution of Children in Rural India: An Econometric Analysis”, Econometrica,
vol. 45, 1065-1079.
[39] Ravi, S. and M. Engler (2009), “ Workfare in Low Income Countries: An Effective
Way to Fight Poverty? The Case of NREGS in India” Working paper.
[40] Ravallion, M. (1991), “Reaching the Rural Poor Through Public Employment: Ar-
guments, Evidence, and Lessons from South Asia,” World Bank Research Observer
Vol. 6(2), pp. 153175.
[41] Ray, R. (2000), “Child Labor, Child Schooling and Their Interaction with Adult
Labor : Empirical Evidence for Peru and Pakistan”, World Bank Economic Review,
vol. 14.
[42] Schultz, T. P. (2004), “School Subsidies for the Poor: Evaluating the Mexican
Progresa Poverty Program”, Journal of Development Economics, vol. 74.
[43] Shastry, G. (2012), “Human Capital Response to Globalization: Education and
Information Technology in India, ” Journal of Human Resources, Vol. 47(2), pp.
287-330.
[44] Skoufias, E. (1993) , “Labor Market oppurtunities and Intrafamily time allocation
in Rural households in South Asia, ” Journal of Development Economics, Vol. 40(2),
pp. 277-310.
[45] Skoufias, E. and Parker, S. (2003), “The Impact of Progressa on Child Work and
Schooling” in P.F. Orazem, G. Sedlacek and Z. Tzannatos (eds.; forthcoming) ’Child
Labor and Education in Latin America’. Washington DC: InterAmerican Develop-
ment Bank and World Bank.
[46] Sudarshan, R. (2011), “India’s National Rural Employment Guarantee Act:
women’s participation and impacts in Himachal Pradesh, Kerala and Rajasthan” ,
CSP Research Report 06.
27

[47] Sharma, A. (2009),“ NCAER-PIF Study on Evaluating Performance of National Ru-
ral Employment Guarantee Act,” National Council of Applied Economic Research.
[48] Thomas, D. (1994), “Like Father Like Son; Like Mother Like Daughter: Parental
Resources and Child Height”, The Journal of Human Resources, Vol. 29, pp. 950-
988.
[49] Topalova, P. (2010), “ Factor Immobility and Regional Impacts of Trade Liberaliza-
tion: Evidence on Poverty and Inequality from India, American Economic Journal:
Applied Economics, Vol. 2 (4), pp. 1-41.
28

Fig
gure 1: Distriicts in Differeent Phases of NREGA

0
10
20
30
40
50
60
70
80
90
2003 2004 2005 2006
No. o
f Students (million)
Figure 2:Total Enrolment
Phase 1
Phase 2
Phase 3
0
50000
100000
150000
200000
250000
300000
350000
400000
2003 2004 2005 2006
No. o
f Schools
Figure 3:Total Number of Schools
Phase 1
Phase 2
Phase 3

Figure 4: The figure plots year by year DID coefficients relative to baseline year 2003. NREGA was introduced in February, 2006. We observe a significant relative decline in enrollment in 2006 in early
NREGA districts relative to later ones. Subsequently, the enrollment is lower compared to pre‐program
years.
‐10
‐9
‐8
‐7
‐6
‐5
‐4
‐3
2004 2005 2006 2007 2008
Figure 4: Year Wise Impact
DID Coefficients, Phase I and II relative to Phase III

Figure 5: Phase Wise Expansion in Different Types of Schools
100000
150000
200000
250000
300000
2005 2006 2007 2008
Number of Government Schools by NREGA Phases
Phase 1 Phase 2 Phase 3
0
10000
20000
30000
40000
50000
60000
70000
80000
2005 2006 2007 2008
Number of Private Schools by NREGA Phases
Phase 1 Phase 2 Phase 3

Table 1: Summary Statistics Outcome variables (All phases, all years)
Obs Mean Std. dev. Min Max
Overall 3583317 220.22 215.20 1 16155Boys 3553987 114.79 112.48 1 8807Girls 3566489 106.88 105.83 1 8070
Overall 3053180 214.50 194.99 1 16145Boys 3052337 110.65 100.28 1 8075Girls 3052508 103.90 95.29 1 8070
Overall 1113283 108.73 112.48 1 3517Boys 1071456 60.66 67.18 1 3474Girls 1085242 51.68 58.27 1 2137
Overall 2673492 0.90 0.19 0 1Boys 2584726 0.90 0.20 0 1Girls 2569174 0.90 0.21 0 1
Overall 898816 0.87 0.21 0 1Boys 859311 0.87 0.22 0 1Girls 859681 0.88 0.23 0 1
Overall 2744763 0.96 0.14 0 1Boys 2645710 0.96 0.14 0 1Girls 2623691 0.96 0.15 0 1
Overall 921451 0.91 0.19 0 1Boys 878589 0.91 0.20 0 1Girls 879953 0.91 0.20 0 1
Enrollment
Total
Primary Classes
Upper-primary Classes
Grade 5
Grade 7
Passing Rate conditional on being enrollment
Passing Rate conditional on appearing in the exam
Grade 5
Grade 7

Summary Statistics Outcome variables Continued (All phases, all years)Obs Mean Std. dev. Min Max
Overall 3555960 0.061 0.122 0 1Boys 3526696 0.064 0.127 0 1Girls 3539271 0.057 0.120 0 1
Overall 3041941 0.064 0.125 0 1Boys 3035745 0.067 0.129 0 1Girls 3041378 0.061 0.121 0 1
Overall 1104825 0.048 0.111 0 1Boys 1063233 0.051 0.118 0 1Girls 1076257 0.044 0.113 0 1
Total 2366670 3.50 2.76 1 85Male 2366670 2.36 2.01 0 70
Female 2366670 1.14 1.68 0 64
Total 471220 6.38 4.84 1 99Male 471220 3.80 3.16 0 98
Female 471220 2.58 3.77 0 93
Total 745427 3.83 3.06 1 77Male 745427 2.29 2.11 0 48
Female 745427 1.54 1.99 0 54
Total 2366670 222.71 211.16 1 16155Boys 2365568 116.24 110.58 1 8807Girls 2366059 108.18 103.46 1 8070
Total 471220 286.86 279.26 1 13841Boys 470933 151.71 145.92 1 6912Girls 471055 137.79 138.89 1 6929
Total 745427 170.39 162.48 1 8040Boys 745398 87.26 83.48 1 4022Girls 745417 83.38 80.55 1 4018
Enrollment in Private Schools
Enrollment in Other Schools
Number of teachers in Other Schools
Enrollment in Government Schools
Number of teachers in Government schools
Number of teachers in Private Schools
Total
Proportion of repeaters conditional on being
enrollment
Primary
Upper-primary

Table 2: Other Summary Statistics
Observations Proportionmean Std. dev Min Max
Primary classes 3583317 0.86 0.35 0 1
Upper-primary classes 3583317 0.32 0.47 0 1
Private schools 3583317 0.13 0.34 0 1
Government schools 3583317 0.66 0.47 0 1
Common toilet 3583317 0.60 0.49 0 1
Women's toilet 3583317 0.44 0.50 0 1
Electricity 3583317 0.27 0.45 0 1
Drinking water 3583317 0.86 0.34 0 1
No. of Classrooms 3583317 3.75 3.28 0 98
No. of Classrooms in good condition 3583317 2.66 3.13 0 98
Boys 3053180 38.90 62.40 0 18300Girls 3053180 43.21 60.98 0 20025
Boys 3053180 3.48 21.98 0 9995Girls 3053180 3.68 25.54 0 16129
Boy 3053180 5.77 31.78 0 10800Girl 3053180 18.25 46.79 0 14425
Boy 3053180 9.33 85.14 0 26650Girl 3053180 11.80 87.51 0 29492
Boy 3053180 6.38 144.07 0 21094Girl 3053180 5.82 132.03 0 21086
Boy 1113283 36.94 78.17 0 12000Girl 1113283 40.52 80.86 0 16490
Boy 1113283 3.34 29.73 0 8040Girl 1113283 3.39 26.84 0 8200
Boy 1113283 6.49 35.96 0 10750Girl 1113283 10.48 36.68 0 8800
Boy 1113283 10.62 96.33 0 16800Girl 1113283 9.69 89.09 0 24040
Boy 1113283 3.80 84.75 0 28174Girl 1113283 4.06 77.48 0 22105
Attendence Scholarship
Other incentives
Number of students in primary classes who received incentives
Number of students in upper-primary classes
who received incentives
Textbook
Stationery
Uniform
Attendence Scholarship
Other incentives
Textbook
Stationery
Uniform

Table 3: Summary Statistics- Outcome Variables by NREGA Phases
Obs Mean Std. Dev. Obs Mean Std. Dev. Obs Mean Std. Dev.
Boy 1427235 117.03 114.99 811491 120.64 114.79 1343173 108.91 108.06Girl 1427426 108.35 107.80 811560 111.71 107.29 1343545 102.43 102.62Boy 1261288 113.35 101.94 713703 117.92 101.99 1162206 103.25 96.87Girl 1261288 105.73 96.49 713703 109.74 95.55 1162206 98.32 93.50Boy 390606 63.28 70.75 230351 63.72 70.65 480773 57.11 62.21Girl 394851 53.95 60.59 233685 54.36 62.20 486980 48.60 54.16
Boy 1010061 0.88 0.22 578243 0.90 0.20 997588 0.93 0.18Girl 1001533 0.88 0.24 574849 0.90 0.21 993956 0.92 0.19Boy 288666 0.86 0.23 174525 0.87 0.22 396463 0.88 0.21Girl 288796 0.86 0.24 175007 0.87 0.22 396225 0.89 0.22
Boy 1033617 0.95 0.16 598546 0.96 0.15 1014716 0.96 0.13Girl 1020888 0.95 0.17 594126 0.96 0.15 1009842 0.96 0.13Boy 294195 0.91 0.21 179799 0.91 0.20 404934 0.91 0.19Girl 294826 0.91 0.22 180573 0.91 0.20 404889 0.91 0.20
Boy 1406690 0.075 0.14 800454 0.063 0.13 1319552 0.052 0.11Girl 1411635 0.068 0.13 804017 0.057 0.12 1323619 0.047 0.10Boy 1223532 0.081 0.14 694532 0.066 0.13 1117691 0.052 0.11Girl 1225410 0.072 0.13 696167 0.059 0.12 1119801 0.048 0.11Boy 378336 0.052 0.12 223641 0.051 0.12 461256 0.050 0.11Girl 382089 0.046 0.12 226756 0.044 0.12 467412 0.042 0.11
Government 1006795 233.43 224.016 576487 242.598 221.815 783388 194.43 181.14Private 133146 293.188 281.589 94408 266.932 262.3 243666 291.22 284.06Others 287683 158.715 144.307 140809 159.299 145.04 316935 185.54 182.38
Grade 7
Phase I Phase II
Enrollment
Phase III
Enrollment
Total
Primary
Upper-primary
Passing Rate Conditional on being enrolled
Grade 5
Grade 7
Proportion of repeaters
conditional on enrollment
Total
Primary
Upper-primary
Passing Rate Conditional on Appearing in
Exams
Grade 5

Table 4: Summary Statistics -School Charactersitcis by NREGA Phases
Primary classes 1427624 0.87 0.34 811704 0.86 0.35 1343989 0.84 0.36Upper-primary classes 1427624 0.29 0.45 811704 0.30 0.46 1343989 0.37 0.48Private school 1427624 0.09 0.29 811704 0.12 0.32 1343989 0.18 0.38Government school 1427624 0.70 0.46 811704 0.71 0.46 1343989 0.58 0.49
Number of Teachers Male 1427624 2.51 2.15 811704 2.60 2.35 1343989 2.52 2.35Female 1427624 1.17 1.77 811704 1.35 1.97 1343989 1.72 2.64
No. of Classrooms 1427624 3.36 2.84 811704 3.61 3.01 1343989 4.25 3.76No. of Classrooms in good condition 1427624 2.30 2.68 811704 2.41 2.84 1343989 3.19 3.62Common Toilet 1427624 0.54 0.50 811704 0.60 0.49 1343989 0.67 0.47Women's Toilet 1427624 0.35 0.48 811704 0.42 0.49 1343989 0.54 0.50Electricity 1427624 0.19 0.40 811704 0.23 0.42 1343989 0.39 0.49Drinking water 1427624 0.84 0.36 811704 0.86 0.35 1343989 0.89 0.32
Boy 1239521 39.32 60.34 695788 41.69 64.20 1130260 36.74 63.41Girl 1239521 43.73 56.02 695788 46.90 62.73 1130260 40.37 64.85Boy 1239521 2.66 18.16 695788 3.22 27.84 1130260 4.53 21.68Girl 1239521 2.84 18.83 695788 3.45 40.22 1130260 4.73 19.60Boy 1239521 3.94 27.18 695788 3.84 20.45 1130260 8.95 40.67Girl 1239521 17.42 41.17 695788 17.85 45.20 1130260 19.41 53.09Boy 1239521 8.96 101.20 695788 9.37 71.50 1130260 9.71 72.69Girl 1239521 11.81 100.07 695788 11.67 72.80 1130260 11.87 80.81Boy 1239521 8.64 163.96 695788 8.35 173.61 1130260 2.70 91.01Girl 1239521 7.64 147.35 695788 7.31 150.90 1130260 2.92 97.28
Boy 407609 39.54 77.38 239568 37.90 74.13 505412 34.43 80.53Girl 407609 42.57 77.49 239568 41.85 83.69 505412 38.26 82.06Boy 407609 2.56 23.35 239568 2.92 25.12 505412 4.16 35.64Girl 407609 2.71 24.02 239568 2.97 23.84 505412 4.13 30.08Boy 407609 4.74 34.82 239568 4.53 21.85 505412 8.79 41.61Girl 407609 10.49 35.02 239568 9.21 28.93 505412 11.07 40.97Boy 407609 11.16 104.09 239568 10.07 73.22 505412 10.45 99.47Girl 407609 10.02 92.31 239568 9.58 66.51 505412 9.47 95.56Boy 407609 4.48 102.27 239568 4.44 116.67 505412 2.95 39.34Girl 407609 4.17 92.26 239568 4.76 103.41 505412 3.64 42.39
No. of students in upper-primary
classes who received
incentives
Textbook
Stationery
Uniform
Attendence Scholarship
Other incentives
No. of students in primary classes
who received incentives
Textbook
Stationery
Uniform
Attendence Scholarship
Other incentives

Table 5: Comparison of District Level Characteristics across NREGA Phases
Year of Measurement Mean Std Dev. Mean Std. Dev. Mean Std. Dev.
Total Population (1,000 people) 2001 1,831 1,112 2,047 1,429 1,992 1,119
Population Growth rate (%) 1991-2001 21.13 6.96 21.18 8.03 20.75 9.67
Overall Literacy Rate (%) 2001 47.16 10.45 52.51 12.39 58.23 10.32
Percentage of Female Population (%) 2001 48.68 1.24 48.31 1.27 48.04 1.98
Female Literacy rate (%) 2001 43.55 12.55 49.32 15.32 58.46 14.17
Percentage of Working Population (%) 2001 42.25 6.65 40.01 6.94 40.35 7.12
Percentage Scheduled Caste 1991 38.42 20.74 31.27 21.63 25.76 20.87 and Scheduled Tribe Population (%)
Agricultural wages (Rs/person/Day) 1996-97 32.14 9.58 37.72 9.84 46.44 18.48
Output per Agricultural Worker 1990-1993 5,196 3,401 7,025 5,212 11,868 9,521 (Rs/worker)
Phase I Phase II Phase III

Table 6: The Impact of Introduction of NREGA on Enrollment (2005-2008)
Primary Upper Primary(i) (ii) (iii) (iii)
-2.23** -1.96** -2.23** -0.42(1.02) (0.95) (1.04) (0.56)
Year Fixed Effects Yes Yes Yes YesSchool Fixed Effects Yes Yes Yes YesDistrict Demographics Yes Yes Yes YesControls for Backwardness Yes Yes Yes YesIncentives Yes Yes Yes YesSchool Infrustructure Yes Yes Yes YesNumber of Teachers Yes Yes Yes YesState Time Trend No Yes Yes YesObservations 3,053,180 1,113,283Number of Schools 941,390 378,324Notes:*** p<0.01, ** p<0.05, * p<0.1
i) School Incentive programs include textbooks, stationary, uniforms, attendance scholarship, and other incentives; teacher characteristicsinclude the number of male and female teachers; infrastructure includes the number of classrooms, classrooms in good condition,the existence of common toilet, women's toilet, electricity, and water facilities; and district level demographic characteristcs includetotal population, percentage of urban population, population growth rate, overall literacy rate, and women's literacy rate.ii) Each regression controls for year fixed effects and school fixed effects. In addition, we also control for Scheduled Castes and Tribes popuation a per Census of India 1991, agricultural wage in 1996-97, and output per agricultural worker in 1990-93, interacted with time indicators to account for the backward district status that influenced selection into the program.iii) Robust standard errors clustered at district level are reported in parantheses.
NREGA Commenced
Overall Enrolment
3,583,3171,106,957

Table 7: Heterogneous Impact of the Introduction of NREGA on Enrollment (2005-2008)
Primary Enrollment
(i) (ii) (iii) (iv) (v) (vi)
-1.95** -3.01*** -2.20** -2.01** -0.43 -1.45**(0.96) (1.09) (1.04) (1.02) (0.56) (0.67)
-3.06** -4.52*** -0.48(1.45) (1.47) (0.83)
23.80*** 25.61*** 5.48***(2.03) (2.126) (0.877)
Incentives Yes Yes Yes Yes Yes YesTeacher Characteristics Yes Yes Yes Yes Yes YesSchool Infrustructure Yes Yes Yes Yes Yes YesDistrict Demographics Yes Yes Yes Yes Yes YesControls for Backwardness Yes Yes Yes Yes Yes YesYear Fixed Effects Yes Yes Yes Yes Yes YesSchool Fixed Effects Yes Yes Yes Yes Yes YesState Time Trend Yes Yes Yes Yes Yes YesObservationsNumber of Schools
i) School Incentive programs include textbooks, stationary, uniforms, attendance scholarship, and other incentives; teacher characteristicsinclude the number of male and female teachers; infrastructure includes the number of classrooms, classrooms in good condition,the existence of common toilet, women's toilet, electricity, and water facilities; and district level demographic characteristcs includetotal population, percentage of urban population, population growth rate, overall literacy rate, and women's literacy rate.ii) Each regression controls for year fixed effects, school fixed effects and state-specific time trends. Each regression also includesindicators for the type of school and whether school offers primary classes and\or upper primary classes. In addition, we also control forScheduled Castes and Tribes popuation as per Census of India 1991, agricultural wage in 1996-97, and output per agricultural worker in 1990-93,interacted with time indicators to account for the backward district status that influenced selection into the program.iii) Robust standard errors clustered at district level are reported in parantheses.
Upper Primary Enrollment
*** p<0.01, ** p<0.05, * p<0.1
NREGA Commenced
NREGA Commenced *Government School
NREGA Commenced *Private School
Total Enrollment
3,583,3171,106,957
1,113,283378,324
3,053,180941,390

Table 8: The Impact of the Introduction of NREGA on Performance Outcomes (2005-2008)
(i) (ii) (iii) (iv) (v) (vi) (vii) (viii)
Boys Girls Boys Girls Boys Girls Boys Girls
0.32 0.31 -0.92* -0.76 0.16 0.18 -0.88* -0.66(0.33) (0.34) (0.48) (0.49) (0.24) (0.26) (0.45) (0.46)
-0.22 -0.32 -0.49 -0.77 -0.11 -0.16 -0.14 -0.52(0.44) (0.47) (0.57) (0.61) (0.35) (0.38) (0.54) (0.57)
-1.17*** -1.79*** -0.60 -0.68* -0.76*** -1.10*** -0.37 -0.33(0.29) (0.33) (0.38) (0.39) (0.23) (0.26) (0.37) (0.37)
Incentives Yes Yes Yes Yes Yes Yes Yes YesTeacher Characteristics Yes Yes Yes Yes Yes Yes Yes YesSchool Infrustructure Yes Yes Yes Yes Yes Yes Yes YesDistrict Demographics Yes Yes Yes Yes Yes Yes Yes YesControls for Backwardness Yes Yes Yes Yes Yes Yes Yes YesYear Fixed Effects Yes Yes Yes Yes Yes Yes Yes YesSchool Fixed Effects Yes Yes Yes Yes Yes Yes Yes YesState Time Trend Yes Yes Yes Yes Yes Yes Yes YesObservations 2,584,726 2,569,174 859,311 859,681 2,645,710 2,623,691 878,589 879,953Number of Schools 834,812 833,173 311,403 314,233 839,023 836,656 313,675 316,481
i) School Incentive programs include textbooks, stationary, uniforms, attendance scholarship, and other incentives; teacher characteristicsinclude the number of male and female teachers; infrastructure includes the number of classrooms, classrooms in good condition,the existence of common toilet, women's toilet, electricity, and water facilities; and district level demographic characteristcs includetotal population, percentage of urban population, population growth rate, overall literacy rate, and women's literacy rate.ii) Each regression controls for year fixed effects, school fixed effects and state-specific time trends. Each regression also includesindicators for the type of school and whether school offers primary classes and\or upper primary classes. In addition, we also control forScheduled Castes and Tribes popuation a per Census of India 1991, agricultural wage in 1996-97, and output per agricultural worker in 1990-93,interacted with time indicators to account for the backward district status that influenced selection into the program.iii) Robust standard errors clustered at district level are reported in parantheses.
Pass/Enrollment Pass/Appearing at Exam
*** p<0.01, ** p<0.05, * p<0.1
Grade 5 Grade 7 Grade 5 Grade 7
NREGA Commenced(unit: %)
NREGA Commenced *Gov't School (unit: %)
NREGA Commenced*Private School (unit: %)

Table 9: The Impact of the Introduction of NREGA on Repeaters (2005-2008)
Overall Boys Girls Overall Boys Girls Overall Boys Girls(i) (ii) (iii) (iv) (v) (vi) (vii) (viii) (ix)
-0.57** -0.63** -0.51* -0.61*** -0.67*** -0.55** -0.15 -0.086 -0.16(0.28) (0.30) (0.26) (0.23) (0.25) (0.22) (0.19) (0.20) (0.19)
0.48 0.52 0.45 0.18 0.20 0.15 0.35 0.32 0.38(0.31) (0.33) (0.30) (0.25) (0.27) (0.24) (0.23) (0.24) (0.23)
0.49** 0.50** 0.50** 0.56*** 0.56*** 0.55*** 0.11 0.047 0.13(0.21) (0.22) (0.20) (0.16) (0.17) (0.15) (0.17) (0.18) (0.16)
Incentives Yes Yes Yes Yes Yes Yes Yes Yes YesTeacher Characteristics Yes Yes Yes Yes Yes Yes Yes Yes YesSchool Infrustructure Yes Yes Yes Yes Yes Yes Yes Yes YesDistrict Demographics Yes Yes Yes Yes Yes Yes Yes Yes YesControls for Backwardness Yes Yes Yes Yes Yes Yes Yes Yes YesYear Fixed Effects Yes Yes Yes Yes Yes Yes Yes Yes YesSchool Fixed Effects Yes Yes Yes Yes Yes Yes Yes Yes YesState Time Trend Yes Yes Yes Yes Yes Yes Yes Yes YesObservations 3,555,960 3,526,696 3,539,271 3,041,941 3,035,745 3,041,378 1,104,825 1,063,233 1,076,257Number of Schools 1,103,959 1,094,768 1,099,905 980,714 978,544 980,714 384,590 379,430 384,590
i) School Incentive programs include textbooks, stationary, uniforms, attendance scholarship, and other incentives; teacher characteristicsinclude the number of male and female teachers; infrastructure includes the number of classrooms, classrooms in good condition,the existence of common toilet, women's toilet, electricity, and water facilities; and district level demographic characteristcs includetotal population, percentage of urban population, population growth rate, overall literacy rate, and women's literacy rate.ii) Each regression controls for year fixed effects, school fixed effects and state-specific time trends. Each regression also includesindicators for the type of school and whether school offers primary classes and\or upper primary classes. In addition, we also control forScheduled Castes and Tribes popuation a per Census of India 1991, agricultural wage in 1996-97, and output per agricultural worker in 1990-93,interacted with time indicators to account for the backward district status that influenced selection into the program.iii) Robust standard errors clustered at district level are reported in parantheses.
*** p<0.01, ** p<0.05, * p<0.1
Primary Grades Upper Primary Grades
NREGA Commenced(unit: %)
NREGA Commenced *Gov't School (unit: %)
NREGA Commenced*Private School (unit: %)
Total

Table 10: The Impact of the Introduction of NREGA on Teachers and Classrooms (2005-2008)
(i) (ii) (iii) (iv) (v) (vi) (vii) (viii) (ix) (x)
0.042* 0.10*** 0.021 0.076*** 0.021* 0.028 0.017 0.049 0.0019 0.0020(0.024) (0.038) (0.014) (0.024) (0.013) (0.019) (0.023) (0.039) (0.023) (0.030)
-0.14*** -0.11*** -0.032 -0.039 0.00052(0.041) (0.025) (0.020) (0.043) (0.034)
0.22*** 0.11*** 0.10*** -0.050 -0.0037(0.041) (0.026) (0.024) (0.049) (0.042)
Incentives Yes Yes Yes Yes Yes Yes Yes Yes Yes YesSchool Infrustructure Yes Yes Yes Yes Yes Yes Yes Yes Yes YesDistrict Demographics Yes Yes Yes Yes Yes Yes Yes Yes Yes YesControls for Backwardness Yes Yes Yes Yes Yes Yes Yes Yes Yes YesYear Fixed Effects Yes Yes Yes Yes Yes Yes Yes Yes Yes YesSchool Fixed Effects Yes Yes Yes Yes Yes Yes Yes Yes Yes YesState Time Trend Yes Yes Yes Yes Yes Yes Yes Yes Yes Yes
ObservationsNumber of Schools
i) School Incentive programs include textbooks, stationary, uniforms, attendance scholarship, and other incentives; teacher characteristicsinclude the number of male and female teachers; infrastructure includes the number of classrooms, classrooms in good condition,the existence of common toilet, women's toilet, electricity, and water facilities; and district level demographic characteristcs includetotal population, percentage of urban population, population growth rate, overall literacy rate, and women's literacy rate.ii) Each regression controls for year fixed effects, school fixed effects and state-specific time trends. Each regression also includesindicators for the type of school and whether school offers primary classes and\or upper primary classes. In addition, we also control forScheduled Caste and Tribes popuation as per Census of India 1991, agricultural wage in 1996-97, and output per agricultural worker in 1990-93,interacted with time indicators to account for the backward district status that influenced selection into the program.iii) Robust standard errors clustered at district level are reported in parantheses. Robust standard errors clustered at district level are reported in parantheses.
No. of Teachers No. of ClassroomsTotal in Good Condition
3,583,317
FemaleMaleTotal
1,106,957*** p<0.01, ** p<0.05, * p<0.1
NREGA Commenced
NREGA Commenced *Government School
NREGA Commenced *Private School

Controlling pre-trends from 2003 to 2005, excluding states for which 2003-2005 data is unavailable. Table 11: The Impact of the Introduction of NREGA on Enrollment (2005-2008)
(i) (ii) (iii) (iv) (v) (vi)-1.91** -2.64** -2.15** -1.93* -0.43 -1.16(0.97) (1.14) (1.06) (1.13) (0.61) (0.71)
-3.62** -4.76*** -0.91(1.48) (1.54) (0.88)
24.01*** 26.83*** 5.40***(2.04) (2.21) (0.90)
Incentives Yes Yes Yes Yes Yes YesTeacher Characteristics Yes Yes Yes Yes Yes YesSchool Infrustructure Yes Yes Yes Yes Yes YesDistrict Demographics Yes Yes Yes Yes Yes YesControls for Backwardness Yes Yes Yes Yes Yes YesControls for Pre-trend Yes Yes Yes Yes Yes YesYear and School Fixed Effects Yes Yes Yes Yes Yes YesState Time Trend Yes Yes Yes Yes Yes YesObservationsNumber of Schools
i) Excluded Jammu and Kashmir, Haryana, Arunachal Pradesh, Manipur, Daman and Diu, Dadra and Nagar Haveli, Goa, Lakshadweep, Pondicherry, and Andaman and Nicobar Islands, to form a consistent panel with Figures 1-6.ii) We also add the controls for district-level pre-trends, which include the changes from 2003-04, and 2004-05, interacted with year dummies.iii) School Incentive programs include textbooks, stationary, uniforms, attendance scholarship, and other incentives; teacher characteristicsinclude the number of male and female teachers; infrastructure includes the number of classrooms, classrooms in good condition,the existence of common toilet, women's toilet, electricity, and water facilities; and district level demographic characteristcs includetotal population, percentage of urban population, population growth rate, overall literacy rate, and women's literacy rate.iv) Each regression controls for year fixed effects, school fixed effects and state-specific time trends. Each regression also includesindicators for the type of school and whether school offers primary classes and\or upper primary classes. In addition, we also control forScheduled Castes and Tribes popuation as per Census of India 1991, agricultural wage in 1996-97, and output per agricultural worker in 1990-93,interacted with time indicators to account for the backward district status that influenced selection into the program.v) Robust standard errors clustered at district level are reported in parantheses.
NREGA Commenced
NREGA Commenced *Government School
NREGA Commenced *Private School
*** p<0.01, ** p<0.05, * p<0.1
3,469,9951,060,053
Primary EnrollmentTotal Enrollment Upper Primary Enrollment
2,953,317900,590
1,072,039360,252

Online Appendix: Supplementary Evidence

Appendix Table 1: The Impact of the Introduction of NREGA on Enrollment in Primary Grades (2005-2008)
(i) (ii) (iii) (iv) (v) (vi) (vii) (viii) (ix) (x)Boys Girls Boys Girls Boys Girls Boys Girls Boys Girls
0.0083 -0.056 -0.036 0.075 -0.070 -0.092 -0.21** -0.18** -0.30*** -0.29***(0.11) (0.12) (0.082) (0.081) (0.075) (0.0772) (0.081) (0.086) (0.074) (0.076)
-0.36** -0.33** -0.53*** -0.71*** -0.30*** -0.33*** 0.00037 -0.063 0.13 0.13(0.16) (0.15) (0.12) (0.13) (0.097) (0.11) (0.10) (0.12) (0.098) (0.11)
1.46*** 2.06*** 1.59*** 1.56*** 1.33*** 1.27*** 1.38*** 1.27*** 1.10*** 1.04***(0.21) (0.19) (0.16) (0.15) (0.13) (0.13) (0.13) (0.14) (0.12) (0.12)
Incentives Yes Yes Yes Yes Yes Yes Yes Yes Yes YesTeacher Characteristics Yes Yes Yes Yes Yes Yes Yes Yes Yes YesSchool Infrustructure Yes Yes Yes Yes Yes Yes Yes Yes Yes YesDistrict Demographics Yes Yes Yes Yes Yes Yes Yes Yes Yes YesControls for Backwardness Yes Yes Yes Yes Yes Yes Yes Yes Yes YesYear Fixed Effects Yes Yes Yes Yes Yes Yes Yes Yes Yes YesSchool Fixed Effects Yes Yes Yes Yes Yes Yes Yes Yes Yes YesState Time Trend Yes Yes Yes Yes Yes Yes Yes Yes Yes YesObservations 3,035,745 3,041,378 3,035,745 3,041,378 3,035,745 3,041,378 3,035,745 3,041,378 3,035,745 3,041,378Number of Schools 940,947 941,259 940,947 941,259 940,947 941,259 940,947 941,259 940,947 941,259*** p<0.01, ** p<0.05, * p<0.1i) School Incentive programs include textbooks, stationary, uniforms, attendance scholarship, and other incentives; teacher characteristicsinclude the number of male and female teachers; infrastructure includes the number of classrooms, classrooms in good condition,the existence of common toilet, women's toilet, electricity, and water facilities; and district level demographic characteristcs includetotal population, percentage of urban population, population growth rate, overall literacy rate, and women's literacy rate.ii) Each regression controls for year fixed effects, school fixed effects and state-specific time trends. Each regression also includesindicators for the type of school and whether school offers primary classes and\or upper primary classes. In addition, we also control forScheduled Castes and Tribes popuation as per Census of India 1991, agricultural wage in 1996-97, and output per agricultural worker in 1990-93,interacted with time indicators to account for the backward district status that influenced selection into the program.iii) Robust standard errors clustered at district level are reported in parantheses.
Grade 5
NREGA Commenced
NREGA Commenced *Government School
NREGA Commenced *Private School
Grade 1 Grade 2 Grade 3 Grade 4

Appendix Table 2: The Impact of the Introduction of NREGA on Enrollment in Upper-primary Grades (2005-2008)
(i) (ii) (iii) (iv) (v) (vi)
Boys Girls Boys Girls Boys Girls
-0.38** -0.36** -0.19 -0.077 -0.12 -0.21(0.19) (0.18) (0.18) (0.15) (0.25) (0.21)
-0.27 -0.35* -0.061 -0.12 -0.054 0.25(0.22) (0.21) (0.20) (0.18) (0.28) (0.23)
1.76*** 1.45*** 1.03*** 0.50*** 0.49* 0.28(0.20) (0.19) (0.18) (0.16) (0.27) (0.22)
Incentives Yes Yes Yes Yes Yes YesTeacher Characteristics Yes Yes Yes Yes Yes YesSchool Infrustructure Yes Yes Yes Yes Yes YesDistrict Demographics Yes Yes Yes Yes Yes YesControls for Backwardness Yes Yes Yes Yes Yes YesYear Fixed Effects Yes Yes Yes Yes Yes YesSchool Fixed Effects Yes Yes Yes Yes Yes YesState Time Trend Yes Yes Yes Yes Yes YesObservations 1,063,233 1,076,257 1,063,233 1,076,257 1,063,233 1,076,257Number of Schools 365,259 370,670 365,259 370,670 365,259 370,670
i) School Incentive programs include textbooks, stationary, uniforms, attendance scholarship, and other incentives; teacher characteristicsinclude the number of male and female teachers; infrastructure includes the number of classrooms, classrooms in good condition,the existence of common toilet, women's toilet, electricity, and water facilities; and district level demographic characteristcs includetotal population, percentage of urban population, population growth rate, overall literacy rate, and women's literacy rate.ii) Each regression controls for year fixed effects, school fixed effects and state-specific time trends. Each regression also includesindicators for the type of school and whether school offers primary classes and\or upper primary classes. In addition, we also control forScheduled Castes and Tribes popuation a per Census of India 1991, agricultural wage in 1996-97, and output per agricultural worker in 1990-93,interacted with time indicators to account for the backward district status that influenced selection into the program.iii) Robust standard errors clustered at district level are reported in parantheses.
*** p<0.01, ** p<0.05, * p<0.1
NREGA Commenced
NREGA Commenced *Government School
NREGA Commenced *Private School
Grade 8Grade 6 Grade 7

Appendix Table 3: The Impact of the Introduction of NREGA on Performance Outcomes (2005-2008)
(i) (ii) (iii) (iv)
Boys Girls Boys Girls
0.21 0.19 -0.064 -0.091(0.19) (0.20) (0.14) (0.16)
-0.14 -0.20 -0.44** -0.35*(0.25) (0.26) (0.20) (0.21)
-0.52*** -0.91*** -0.23* -0.30**(0.18) (0.20) (0.13) (0.15)
Incentives Yes Yes Yes YesTeacher Characteristics Yes Yes Yes YesSchool Infrustructure Yes Yes Yes YesDistrict Demographics Yes Yes Yes YesControls for Backwardness Yes Yes Yes YesYear Fixed Effects Yes Yes Yes YesSchool Fixed Effects Yes Yes Yes YesState Time Trend Yes Yes Yes YesObservations 2,408,048 2,393,084 805,782 805,782Number of Schools 834,329 832,650 311,174 313,951
i) School Incentive programs include textbooks, stationary, uniforms, attendance scholarship, and other incentives; teacher characteristicsinclude the number of male and female teachers; infrastructure includes the number of classrooms, classrooms in good condition,the existence of common toilet, women's toilet, electricity, and water facilities; and district level demographic characteristcs includetotal population, percentage of urban population, population growth rate, overall literacy rate, and women's literacy rate.ii) Each regression controls for year fixed effects, school fixed effects and state-specific time trends. Each regression also includesindicators for the type of school and whether school offers primary classes and\or upper primary classes. In addition, we also control forScheduled Castes and Tribes popuation a per Census of India 1991, agricultural wage in 1996-97, and output per agricultural worker in 1990-93,interacted with time indicators to account for the backward district status that influenced selection into the program.iii) Robust standard errors clustered at district level are reported in parantheses.
*** p<0.01, ** p<0.05, * p<0.1
NREGA Commenced(unit: %)
NREGA Commenced *Gov't School (unit: %)
NREGA Commenced*Private School (unit: %)
Appearing at exam/EnrollmentGrade 5 Grade 7

Appendix Table 4: The Impact of the Introduction of NREGA on Repeaters in Primary Grades (2005-2008)
(i) (ii) (iii) (iv) (v) (vi) (vii) (viii) (ix) (x)Boys Girls Boys Girls Boys Girls Boys Girls Boys Girls
-1.30*** -1.14** -0.54** -0.62*** -0.51** -0.46** -0.43** -0.45*** -0.40* -0.23(0.49) (0.48) (0.24) (0.24) (0.21) (0.20) (0.18) (0.17) (0.24) (0.23)
0.47 0.27 0.24 0.35 0.17 0.17 0.084 0.077 -0.024 -0.14(0.49) (0.48) (0.26) (0.26) (0.23) (0.23) (0.21) (0.20) (0.30) (0.30)
0.59* 0.50* 0.38** 0.50*** 0.36** 0.42*** 0.29** 0.37*** 0.24 0.31*(0.30) (0.29) (0.18) (0.19) (0.16) (0.15) (0.13) (0.13) (0.18) (0.19)
Incentives Yes Yes Yes Yes Yes Yes Yes Yes Yes YesTeacher Characteristics Yes Yes Yes Yes Yes Yes Yes Yes Yes YesSchool Infrustructure Yes Yes Yes Yes Yes Yes Yes Yes Yes YesDistrict Demographics Yes Yes Yes Yes Yes Yes Yes Yes Yes YesControls for Backwardness Yes Yes Yes Yes Yes Yes Yes Yes Yes YesYear Fixed Effects Yes Yes Yes Yes Yes Yes Yes Yes Yes YesSchool Fixed Effects Yes Yes Yes Yes Yes Yes Yes Yes Yes YesState Time Trend Yes Yes Yes Yes Yes Yes Yes Yes Yes YesObservations 2,867,237 2,868,590 2,844,002 2,844,533 2,801,925 2,800,654 2,742,414 2,735,402 2,263,704 2,249,607Number of Schools 930,525 931,716 924,146 925,070 911,336 911,828 894,355 893,807 744,613 743,177
i) School Incentive programs include textbooks, stationary, uniforms, attendance scholarship, and other incentives; teacher characteristicsinclude the number of male and female teachers; infrastructure includes the number of classrooms, classrooms in good condition,the existence of common toilet, women's toilet, electricity, and water facilities; and district level demographic characteristcs includetotal population, percentage of urban population, population growth rate, overall literacy rate, and women's literacy rate.ii) Each regression controls for year fixed effects, school fixed effects and state-specific time trends. Each regression also includesindicators for the type of school and whether school offers primary classes and\or upper primary classes. In addition, we also control forScheduled Castes and Tribes popuation as per Census of India 1991, agricultural wage in 1996-97, and output per agricultural worker in 1990-93,interacted with time indicators to account for the backward district status that influenced selection into the program.iii) Robust standard errors clustered at district level are reported in parantheses.
Grade 3 Grade 4 Grade 5
*** p<0.01, ** p<0.05, * p<0.1
NREGA Commenced(unit: %)
NREGA Commenced *Gov't School (unit: %)
NREGA Commenced*Private School (unit: %)
Grade 1 Grade 2

Appendix Table 5: The Impact of the Introduction of NREGA on Repeaters in Upper-primary Grades(2005-2008)
(i) (ii) (iii) (iv) (v) (vi)
Boys Girls Boys Girls Boys Girls
-0.36* -0.30 -0.032 -0.16 0.49 0.49(0.21) (0.19) (0.17) (0.17) (0.37) (0.34)
0.48** 0.39* 0.20 0.29 0.44 0.51(0.24) (0.22) (0.21) (0.21) (0.42) (0.40)
0.10 0.040 -0.21 -0.038 0.14 0.16(0.18) (177) (0.17) (0.17) (0.29) (0.256)
Incentives Yes Yes Yes Yes Yes YesTeacher Characteristics Yes Yes Yes Yes Yes YesSchool Infrustructure Yes Yes Yes Yes Yes YesDistrict Demographics Yes Yes Yes Yes Yes YesControls for Backwardness Yes Yes Yes Yes Yes YesYear Fixed Effects Yes Yes Yes Yes Yes YesSchool Fixed Effects Yes Yes Yes Yes Yes YesState Time Trend Yes Yes Yes Yes Yes YesObservations 1,018,129 1,026,801 972,736 977,557 637,551 640,595Number of Schools 357,166 361,360 342,140 345,795 232,565 235,984
i) School Incentive programs include textbooks, stationary, uniforms, attendance scholarship, and other incentives; teacher characteristicsinclude the number of male and female teachers; infrastructure includes the number of classrooms, classrooms in good condition,the existence of common toilet, women's toilet, electricity, and water facilities; and district level demographic characteristcs includetotal population, percentage of urban population, population growth rate, overall literacy rate, and women's literacy rate.ii) Each regression controls for year fixed effects, school fixed effects and state-specific time trends. Each regression also includesindicators for the type of school and whether school offers primary classes and\or upper primary classes. In addition, we also control forScheduled Caste and Tribes popuation as per Census of India 1991, agricultural wage in 1996-97, and output per agricultural worker in 1990-93,interacted with time indicators to account for the backward district status that influenced selection into the program.iii) Robust standard errors clustered at district level are reported in parantheses.
*** p<0.01, ** p<0.05, * p<0.1
NREGA Commenced*Private School (unit: %)
Grade 8Grade 6 Grade 7
NREGA Commenced(unit: %)
NREGA Commenced *Gov't School (unit: %)
Excluding States for which 2003‐2005 data is unavailable
Appendix Table 6: The Impact of Introduction of NREGA on Enrollment (2005-2008)
Dependent Variable: Total Enrollment
Primary Upper Primary(i) (ii) (iii) (iv)
-2.23** -1.93** -2.20** -0.42(1.04) (0.98) (1.06) (0.59)
Year Fixed Effects Yes Yes Yes YesSchool Fixed Effects Yes Yes Yes YesDistrict Demographics Yes Yes Yes YesControls for Backwardness Yes Yes Yes YesIncentives Yes Yes Yes YesSchool Infrustructure Yes Yes Yes YesNumber of Teachers Yes Yes Yes YesState Time Trend No Yes Yes Yes
Observations 2,961,395 1,073,974Number of Schools 908,531 362,132Notes:*** p<0.01, ** p<0.05, * p<0.1i) Excluded Jammu and Kashmir, Haryana, Arunachal Pradesh, Manipur, Daman and Diu, Dadra and Nagar Haveli, Goa, Lakshadweep, Pondicherry, and Andaman and Nicobar Islands, to form a consistent panel with Figures 1-6.ii) School Incentive programs include textbooks, stationary, uniforms, attendance scholarship, and other incentives; teacher characteristicsinclude the number of male and female teachers; infrastructure includes the number of classrooms, classrooms in good condition,the existence of common toilet, women's toilet, electricity, and water facilities; and district level demographic characteristcs includetotal population, percentage of urban population, population growth rate, overall literacy rate, and women's literacy rate.iii) Each regression controls for year fixed effects and school fixed effects. In addition, we also control for Scheduled Castes and Tribes popuation as per Census of India 1991, agricultural wage in 1996-97, and output per agricultural worker in ,1990-93 interacted with time indicators to account for the backward district status that influenced selection into the program.iv) Robust standard errors clustered at district level are reported in parantheses.
NREGA Commenced
3,478,3761,068,298
Overall Enrolment
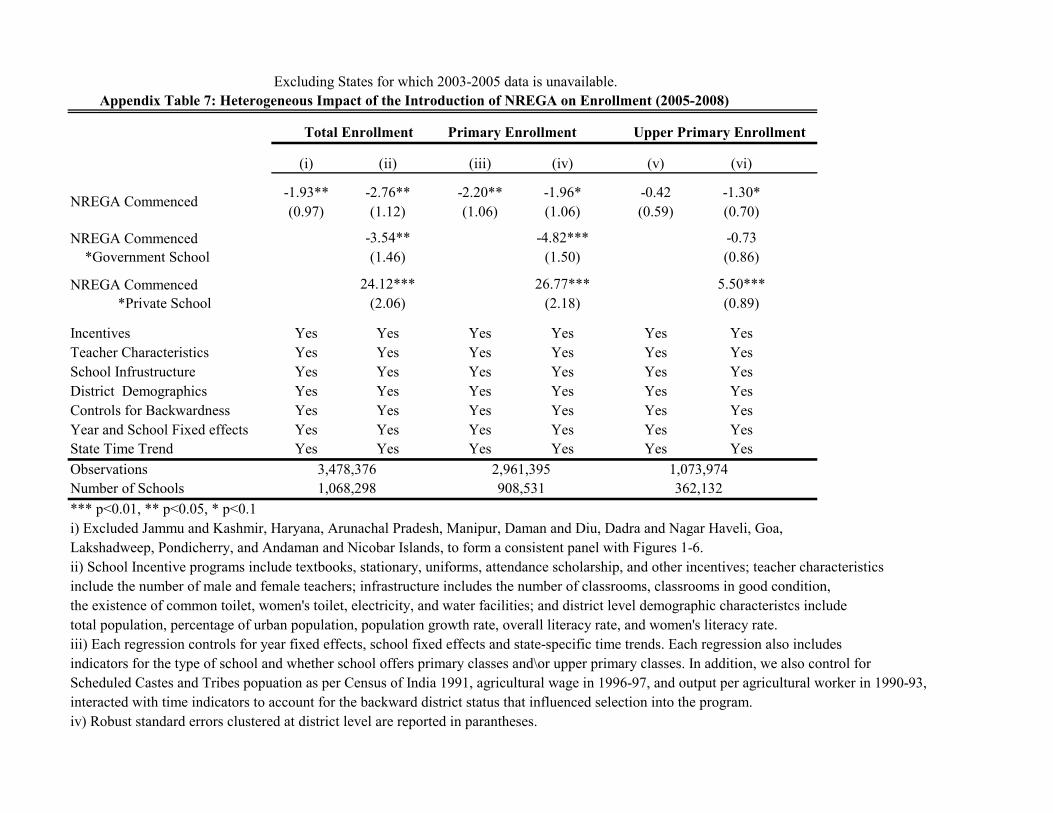
Excluding States for which 2003-2005 data is unavailable. Appendix Table 7: Heterogeneous Impact of the Introduction of NREGA on Enrollment (2005-2008)
Primary Enrollment
(i) (ii) (iii) (iv) (v) (vi)
-1.93** -2.76** -2.20** -1.96* -0.42 -1.30*(0.97) (1.12) (1.06) (1.06) (0.59) (0.70)
-3.54** -4.82*** -0.73(1.46) (1.50) (0.86)
24.12*** 26.77*** 5.50***(2.06) (2.18) (0.89)
Incentives Yes Yes Yes Yes Yes YesTeacher Characteristics Yes Yes Yes Yes Yes YesSchool Infrustructure Yes Yes Yes Yes Yes YesDistrict Demographics Yes Yes Yes Yes Yes YesControls for Backwardness Yes Yes Yes Yes Yes YesYear and School Fixed effects Yes Yes Yes Yes Yes YesState Time Trend Yes Yes Yes Yes Yes YesObservationsNumber of Schools
i) Excluded Jammu and Kashmir, Haryana, Arunachal Pradesh, Manipur, Daman and Diu, Dadra and Nagar Haveli, Goa, Lakshadweep, Pondicherry, and Andaman and Nicobar Islands, to form a consistent panel with Figures 1-6.ii) School Incentive programs include textbooks, stationary, uniforms, attendance scholarship, and other incentives; teacher characteristicsinclude the number of male and female teachers; infrastructure includes the number of classrooms, classrooms in good condition,the existence of common toilet, women's toilet, electricity, and water facilities; and district level demographic characteristcs includetotal population, percentage of urban population, population growth rate, overall literacy rate, and women's literacy rate.iii) Each regression controls for year fixed effects, school fixed effects and state-specific time trends. Each regression also includesindicators for the type of school and whether school offers primary classes and\or upper primary classes. In addition, we also control forScheduled Castes and Tribes popuation as per Census of India 1991, agricultural wage in 1996-97, and output per agricultural worker in 1990-93,interacted with time indicators to account for the backward district status that influenced selection into the program.iv) Robust standard errors clustered at district level are reported in parantheses.
*** p<0.01, ** p<0.05, * p<0.1
Total Enrollment Upper Primary Enrollment
NREGA Commenced
NREGA Commenced *Government School
NREGA Commenced *Private School
3,478,3761,068,298
2,961,395908,531
1,073,974362,132

Sensitivity Analysis- Excluding Schools with Enrollment less than 5th percentile
Appendix Table 8: The Impact of Introduction of NREGA on Enrollment (2005-2008)
Dependent Variable: Total Enrollment
Primary Upper Primary(i) (ii) (iii) (iv)
-2.273** -2.015** -2.217** -0.428(1.046) (0.977) (1.064) (0.589)
Year Fixed Effects Yes Yes Yes YesSchool Fixed Effects Yes Yes Yes YesDistrict Demographics Yes Yes Yes YesControls for Backwardness Yes Yes Yes YesIncentives Yes Yes Yes YesSchool Infrustructure Yes Yes Yes YesNumber of Teachers Yes Yes Yes YesState Time Trend No Yes Yes Yes
Observations 2,915,417 1,044,560Number of Schools 891,452 350,039Notes:*** p<0.01, ** p<0.05, * p<0.1
i) School Incentive programs include textbooks, stationary, uniforms, attendance scholarship, and other incentives; teacher characteristicsinclude the number of male and female teachers; infrastructure includes the number of classrooms, classrooms in good condition,the existence of common toilet, women's toilet, electricity, and water facilities; and district level demographic characteristcs includetotal population, percentage of urban population, population growth rate, overall literacy rate, and women's literacy rate.ii) Each regression controls for year fixed effects and school fixed effects. In addition, we also control for Scheduled Castes and Tribes popuation as per Census of India 1991, agricultural wage in 1996-97, and output per agricultural worker in 1990-93, interacted with time indicators to account for the backward district status that influenced selection into the program.iii) Robust standard errors clustered at district level are reported in parantheses.
NREGA Commenced
3,411,5811,043,311
Overall Enrolment

Senstivity Check- Excluding Schools with Enrollment less than 5th percentile Appendix Table 9: The Impact of the Introduction of NREGA on Enrollment (2005-2008)
Primary Enrollment
(i) (ii) (iii) (iv) (v) (vi)
-2.02** -3.14*** -2.22** -1.99* -0.43 -1.53**(0.98) (1.11) (1.06) (1.05) (0.59) (0.70)
-3.12** -4.55*** -0.41(1.48) (1.51) (0.84)
24.35*** 25.52*** 5.65***(2.05) (2.15) (0.91)
Incentives Yes Yes Yes Yes Yes YesTeacher Characteristics Yes Yes Yes Yes Yes YesSchool Infrustructure Yes Yes Yes Yes Yes YesDistrict Demographics Yes Yes Yes Yes Yes YesControls for Backwardness Yes Yes Yes Yes Yes YesYear Fixed Effects Yes Yes Yes Yes Yes YesSchool Fixed Effects Yes Yes Yes Yes Yes YesState Time Trend Yes Yes Yes Yes Yes YesObservationsNumber of Schools
i) School Incentive programs include textbooks, stationary, uniforms, attendance scholarship, and other incentives; teacher characteristicsinclude the number of male and female teachers; infrastructure includes the number of classrooms, classrooms in good condition,the existence of common toilet, women's toilet, electricity, and water facilities; and district level demographic characteristcs includetotal population, percentage of urban population, population growth rate, overall literacy rate, and women's literacy rate.ii) Each regression controls for year fixed effects, school fixed effects and state-specific time trends. Each regression also includesindicators for the type of school and whether school offers primary classes and\or upper primary classes. In addition, we also control forScheduled Castes and Tribes popuation as per Census of India 1991, agricultural wage in 1996-97, and output per agricultural worker in 1990-93,interacted with time indicators to account for the backward district status that influenced selection into the program.iii) Robust standard errors clustered at district level are reported in parantheses.
Upper Primary Enrollment
*** p<0.01, ** p<0.05, * p<0.1
NREGA Commenced
NREGA Commenced *Government School
NREGA Commenced *Private School
Total Enrollment
3,411,5811,043,311
1,044,560350,039
2,915,417891,452

![20110712 Unintended Consequences 12[1].07](https://static.fdocuments.net/doc/165x107/577d278b1a28ab4e1ea429b5/20110712-unintended-consequences-12107.jpg)