The Underserved Populations in Hawaii
66
Equal Opportunity Employer/Program If you need an auxiliary aid/service or other accommodation due to a disability, please contact the WDC at (808) 586-8866 (for TTY/TTD Dial 711 then ask for (808) 586-8866) as soon as possible. Requests made as early as possible will allow adequate time to fulfill your request. Upon request, this notice is available in alternative formats such as large print, Braille, or electronic copy. The Underserved Populations in Hawaii July 25, 2018 Wayne Liou Employment Analyst IV Workforce Development Council
Transcript of The Underserved Populations in Hawaii

Equal Opportunity Employer/Program If you need an auxiliary aid/service or other accommodation due to a disability, please contact the WDC at (808) 586-8866
(for TTY/TTD Dial 711 then ask for (808) 586-8866) as soon as possible. Requests made as early as possible will allow adequate time to fulfill your request. Upon request, this notice is available in alternative formats such as large print, Braille, or electronic copy.
The Underserved Populations in Hawaii
July 25, 2018
Wayne Liou
Employment Analyst IV
Workforce Development Council

In order for workforce development programs to maximize their effectiveness, state and local programs need to develop strategies to improve access for underserved populations. Underserved populations include veterans, racial minorities, those with disabilities, and those with low levels of income or literacy. While the state of Hawaii has a smaller percentage of people with disabilities and a lower rate of poverty than the United States average, there is a significant range of values across the counties that the State’s average masks. Similarly, while the State has a higher proportion of veterans than the nation average, these veterans are concentrated on the island of Oahu. Thus, each county requires unique strategies to address its unique underserved populations. This document provides a snapshot of each county’s underserved population. Unless otherwise noted, data for this document comes from the American Community Survey 5-Year Estimates, via the Census Bureau’s American FactFinder.
The American Community Survey 5-Year Estimates are population estimates based on American Community Survey data collected over a 5-year period. Any population estimates based on the American Community Survey 5-Year Estimates will thus not be particularly current, as it will include data from up to 5 years ago. Even though 1-Year Estimates are available and would provide more current data, the accuracy of the estimates would be rather low for smaller units of observation, such as specific demographic groups (people of a particular age and gender) or smaller geographic areas (sub-county level geographies). The Census Bureau recommends using the 1-Year Estimates only when the population is more than 65,000. Considering Kauai’s entire population is barely above that number, any estimates of particular populations on Kauai, demographic or geographic, would almost certainly require a 5-Year Estimate in order to be reliable. Thus, for consistency’s sake, all estimates provided are based on 5-year samples. Writing out the sample period repeatedly (e.g. “between 2012 and 2016”) would be cumbersome, however, so references to sample years are limited to the final year of the sample (i.e. “in 2016” means “between 2012 and 2016”, “since 2012” means “since the time period between 2008 and 2012”).
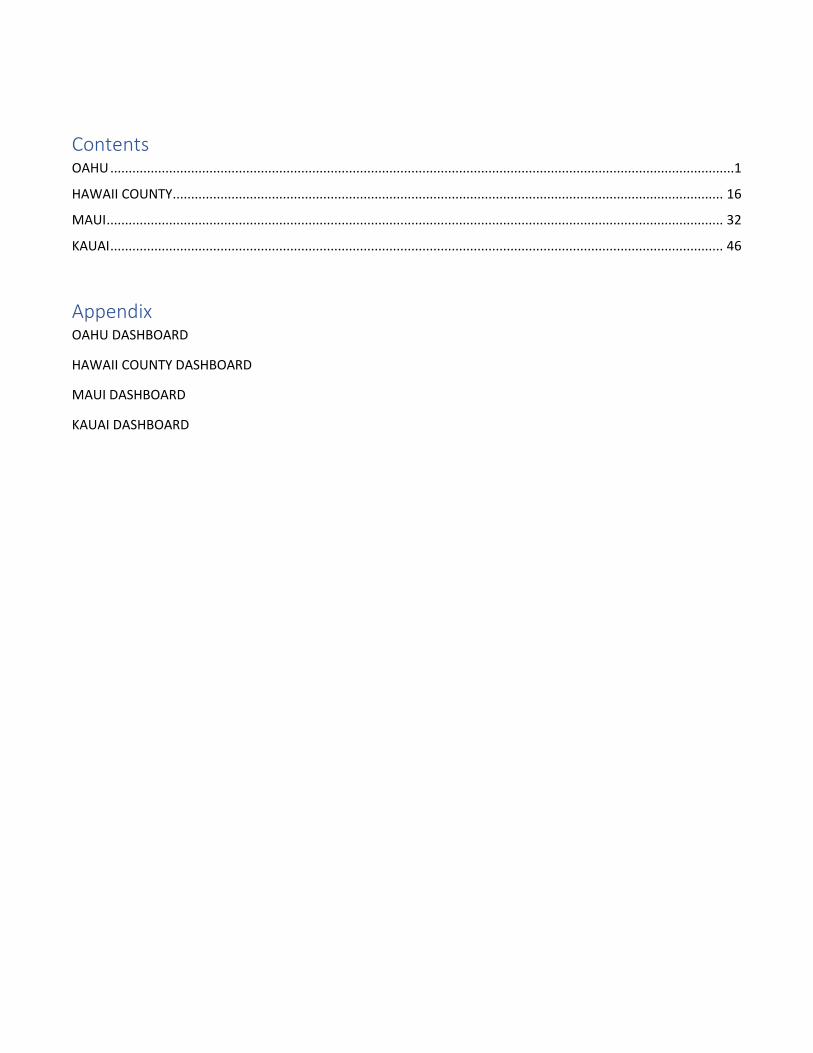
Contents OAHU ..........................................................................................................................................................................1
HAWAII COUNTY ...................................................................................................................................................... 16
MAUI ........................................................................................................................................................................ 32
KAUAI ....................................................................................................................................................................... 46
Appendix OAHU DASHBOARD
HAWAII COUNTY DASHBOARD
MAUI DASHBOARD
KAUAI DASHBOARD

1
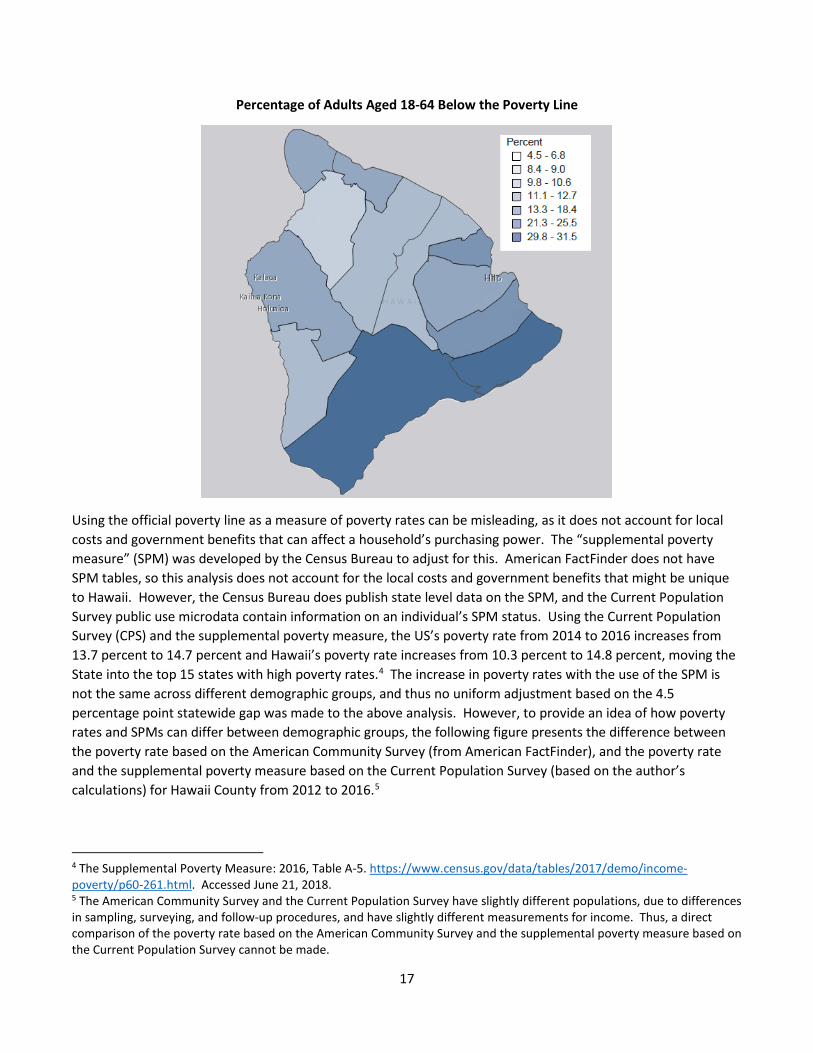
OAHU Poverty In 2016, Hawaii had one of the lowest poverty rates in the nation: the nation’s poverty rate was 15.1 percent and Hawaii’s poverty rate was 10.8 percent. Only four states had a lower poverty rate than Hawaii. The State’s low poverty rate was driven primarily by adults aged 18-64 on Oahu; the poverty rate for males aged 18-34 was 8.5 percent, males aged 35-64 was 6.9 percent, females aged 18-34 was 13.6 percent, and females aged 35-64 was 8.6 percent.
The census county division (CCD) with the highest rates of poverty was Waianae CCD, with just over 22 percent of the adults aged 18-64 in the CCD below the poverty line. Central Oahu, North Shore, and metro Honolulu had a poverty rate around 10 percent, and Ewa and the Windward side had the lowest poverty rates, around 6 percent.
0%5%
10%15%20%25%30%
18-34 35-64 18-34 35-64
Male Female
US Hawaii Oahu
Poverty Rate, Oahu
2012-2016 2008-2012
2
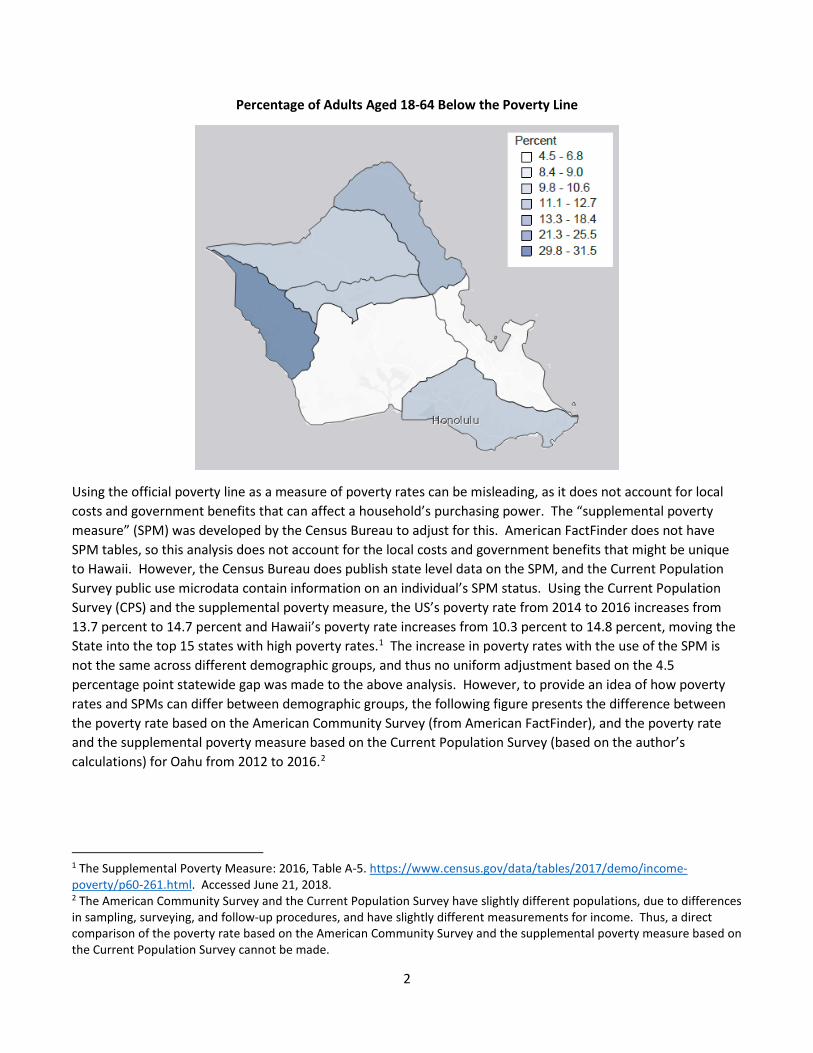
Percentage of Adults Aged 18-64 Below the Poverty Line
Using the official poverty line as a measure of poverty rates can be misleading, as it does not account for local costs and government benefits that can affect a household’s purchasing power. The “supplemental poverty measure” (SPM) was developed by the Census Bureau to adjust for this. American FactFinder does not have SPM tables, so this analysis does not account for the local costs and government benefits that might be unique to Hawaii. However, the Census Bureau does publish state level data on the SPM, and the Current Population Survey public use microdata contain information on an individual’s SPM status. Using the Current Population Survey (CPS) and the supplemental poverty measure, the US’s poverty rate from 2014 to 2016 increases from 13.7 percent to 14.7 percent and Hawaii’s poverty rate increases from 10.3 percent to 14.8 percent, moving the State into the top 15 states with high poverty rates.1 The increase in poverty rates with the use of the SPM is not the same across different demographic groups, and thus no uniform adjustment based on the 4.5 percentage point statewide gap was made to the above analysis. However, to provide an idea of how poverty rates and SPMs can differ between demographic groups, the following figure presents the difference between the poverty rate based on the American Community Survey (from American FactFinder), and the poverty rate and the supplemental poverty measure based on the Current Population Survey (based on the author’s calculations) for Oahu from 2012 to 2016.2
1 The Supplemental Poverty Measure: 2016, Table A-5. https://www.census.gov/data/tables/2017/demo/income-poverty/p60-261.html. Accessed June 21, 2018. 2 The American Community Survey and the Current Population Survey have slightly different populations, due to differences in sampling, surveying, and follow-up procedures, and have slightly different measurements for income. Thus, a direct comparison of the poverty rate based on the American Community Survey and the supplemental poverty measure based on the Current Population Survey cannot be made.

3
Educational Attainment Hawaii’s level of educational attainment is generally better than the national average. In 2016, 87 percent of adults in the U.S. had a high school degree or higher and 30.3 percent had a bachelor’s degree or higher, compared to 91.3 percent and 31.4 percent in Hawaii, respectively; the national average of those with graduate or professional degrees was slightly higher than in Hawaii. Among adults aged 18-64, the percentage who had not earned a high school degree was 12 percent for the nation and 6.6 percent for the State.
Younger adults on Oahu tended to have more education; the percentage of males aged 18-34 (5.9 percent) and females aged 18-34 (5.2 percent) without a high school degree was below the state average. Males aged 35-34 and women aged 35-34 on Oahu had an average level of educational attainment slightly lower than the state average, both with 7.2 percent of this population without a high school degree or equivalent. A smaller percentage of people on Oahu failed to earn their bachelor degree, compared to the national average, as well. These numbers have slightly improved since 2012, particularly among females.
0.0%
5.0%
10.0%
15.0%
20.0%
25.0%
30.0%
18-34 35-64 18-34 35-64
Male Female
Oahu Poverty Rates
ACS CPS Official Poverty Line CPS SPM
0%2%4%6%8%
10%12%14%16%
18-34 35-64 18-34 35-64
Male Female
US Hawaii Oahu
No High School Degree, Oahu
2012-2016 2008-2012

4
Even though Oahu had the highest percentage of students who received a high school degree or equivalent among the counties, it also had the census county division (CCD) with the lowest high school degree attainment rate in the State. Almost 14 percent of the Waianae CCD adult population did not have a high school diploma. The graduation rate is so low that even though females tend to be more educated than males, the graduation rate for females in Waianae CCD was lower than the total graduation rate in all other CCDs except for Kahului.
Percentage of Adults with a High School Degree or Equivalent
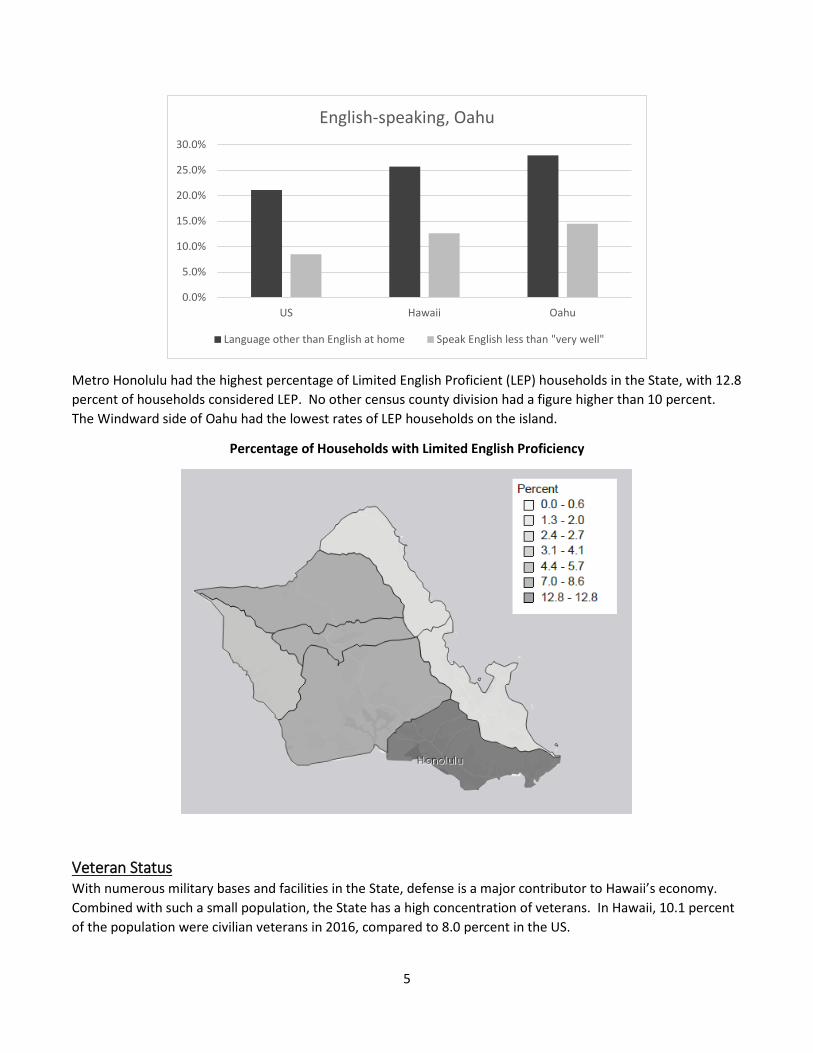
English Proficiency The State has a history of large inflows of immigrants, and its history and location lend to continued immigrant inflows. Thus, the percentage of people 5 years and older who do not speak English at home is relatively high, as is the percentage of people who speak English less than “very well”. Note that this is a subjective and self-reported measure, so an individual could be reasonably proficient at English, but still report in the American Community Survey that he or she does not speak English well (the opposite could also be true). In the US, 21.1 percent of people 5 years and older did not speak English at home, compared to 25.7 percent in Hawaii, in 2016. Of these people who did not speak English at home, the proportion who did not speak English well is higher in the State compared to the national average. In the US, 8.5 percent of people older than 5 spoke English less than “very well” in 2016, about 40 percent of the people who did not speak English at home.
In contrast, in Hawaii, almost half of the people who speak a language other than English at home spoke English less than “very well” – 12.6 percent of people 5 years and older in Hawaii spoke English less than “very well”. In fact, on Oahu, over half of the people who did not speak English at home did not speak English “very well”: 27.9 percent of people spoke a language other English at home, compared to the 14.5 percent of people who did not speak English “very well”.
5
Metro Honolulu had the highest percentage of Limited English Proficient (LEP) households in the State, with 12.8 percent of households considered LEP. No other census county division had a figure higher than 10 percent. The Windward side of Oahu had the lowest rates of LEP households on the island.
Percentage of Households with Limited English Proficiency
Veteran Status With numerous military bases and facilities in the State, defense is a major contributor to Hawaii’s economy. Combined with such a small population, the State has a high concentration of veterans. In Hawaii, 10.1 percent of the population were civilian veterans in 2016, compared to 8.0 percent in the US.
0.0%
5.0%
10.0%
15.0%
20.0%
25.0%
30.0%
US Hawaii Oahu
English-speaking, Oahu
Language other than English at home Speak English less than "very well"

6
Because most of the military bases and facilities are located on Oahu, the veteran population is located primarily on Oahu: 10.5 percent of males aged 18-34 and 16.1 percent of males aged 35-64 had veteran status in 2016. In contrast, 3.2 percent of females aged 18-34 and 2.4 percent of females aged 35-64 had veteran status. While the veteran population for males aged 35-64 decreased since 2012, the veteran population for other 18-64 year old adults remained relatively unchanged.
Most of the civilian veterans on Oahu stayed close to the military bases and facilities: Ewa CCD (Pearl Harbor and Hickam Air Force Base), Wahiawa (Schofield Barracks and Wheeler Airfield), and Kaneohe (Marine Corps Base Hawaii). Waialua also had a high percentage of the population with veteran status.
Percentage of Adults 18 Years and Over with Veteran Status
0%
5%
10%
15%
20%
18-34 35-64 18-34 35-64
Male Female
US Hawaii Oahu
Veteran Status, Oahu
2012-2016 2008-2012

7
Disability Status Hawaii is generally considered a relatively healthy state, and the percentage of adults aged 18-64 with a disability reflects this. In the US, 14.2 percent of adults aged 18-64 had a disability in 2016, compared to Hawaii’s 10.4 percent of adults aged 18-64. As one might expect, fewer younger adults had disabilities.
On Oahu, approximately 5 percent of younger adults had a disability (5.2 percent for males aged 18-34 and 4.1 percent for females aged 18-34) compared to double that percentage for older adults (10.4 for males aged 35-64 and 8.9 for females aged 35-64). This was a slight increase from the percentages in 2012.
The only census county division (CCD) on Oahu with a better disability rate than the state average was Koolauloa CCD, with a 9.1% disability rate. The other counties were around the state average except for Waialua CCD, at 13 percent, and Waianae CCD, at 15.1 percent.
0%2%4%6%8%
10%12%14%16%
18-34 35-64 18-34 35-64
Male Female
US Hawaii Oahu
Disability Rate, Oahu
2012-2016 2008-2012

8
Percentage of the Population with a Disability
Native Hawaiian or Other Pacific Islander While the State is known for its racial diversity, and has a high percentage of racial minorities, the race that is of primary concern when it comes to being underserved is the Native Hawaiian population. In 2016, 0.2 percent of the population was Native Hawaiian or other Pacific Islander and 0.8 percent of the population was Native Indian or Alaska Native in the United States. In contrast, in the State of Hawaii, the Native Hawaiian and other Pacific Island population made up 10.2 percent of the population in 2016.
On Oahu, this population was close to the State average, at 9.4 percent. Focusing in on the 18-64 year old population, in 2016, 9.7 percent of males aged 18-34, 8.9 percent of males aged 35-64, 10.7 percent of females aged 18-34, and 8.7 percent of females aged 35-64 were Native Hawaiian or other Pacific Islander. These numbers have been relatively unchanged since 2012.

9
Even though Oahu had a percentage of Native Hawaiian or other Pacific Islander that is less than the other counties, Waianae had one of the highest concentrations of Native Hawaiian or other Pacific Islander in the State, at almost 37 percent. This was exceeded only by Hana and West Molokai. About 18 percent of Koolauloa CCD is Native Hawaiian or other Pacific Islander, and the other census county divisions on Oahu had a lower percentage of Native Hawaiian or other Pacific Islander than the state average.
Percentage of the Population Native Hawaiian or Other Pacific Islander
Labor Force Participation and Unemployment Hawaii’s labor force participation and unemployment rates are marginally better than the national average; for all adults age 16 and over, Hawaii’s labor force participation rate was about 2 percentage points higher than the
0%
5%
10%
15%
20%
18-34 35-64 18-34 35-64
Male Female
US Hawaii Oahu
Native Hawaiian or Other Pacific Islander,Oahu
2012-2016 2008-2012

10
nation’s (65.2 percent compared to 63.5 percent) and the State’s unemployment rate was about 2 percentage points lower than the nation’s (5.5 percent compared to 7.4 percent) in 2016. Individuals in the underserved populations tended to have lower labor force participation rates and higher rates of unemployment, except for veterans. While the State’s better labor market outcomes tended to be consistent across the underserved populations, there are a few populations who do worse than the national average. Adults below the poverty level and Native Hawaiian or other Pacific Islander adults had lower labor force participation rates than the national average (46.5 percent compared to 51.3 percent, and 63.7 percent compared to 66.8 percent, respectively) and Native Hawaiian or other Pacific Islander adults had approximately the same unemployment rate as Native Hawaiian or other Pacific Islander adults across the nation.
On Oahu, labor force participation rates and unemployment rates for the underserved populations tended to be better than the state average, though still falling short of the national average for labor force participation rates among adults below the poverty level and Native Hawaiian or other Pacific Islander adults.
* “Less than high school graduate” is taken from adults 25-64, whereas the other populations are taken from all adults 16 and over.
0.0%10.0%20.0%30.0%40.0%50.0%60.0%70.0%80.0%90.0%
Population 16years and over
Below povertylevel
Less than highschool
graduate*
Language otherthan English at
home
Veterans With anydisability
Native Hawaiianor other Pacific
Islander
Labor Force Participation by Status, Oahu
United States Hawaii Oahu County

11
* “Less than high school graduate” is taken from adults 25-64, whereas the other populations are taken from all adults 16 and over.
Self-Employed Workers The Workforce Innovation and Opportunity Act (WIOA) is expected to improve labor market outcomes for workers through several channels, including enhanced services for workers who might have received limited assistance in the past. One category of workers targeted in WIOA is self-employed workers. Hawaii has slightly more self-employed workers than the national average, with the difference coming primarily from more self-employed workers in own not incorporated businesses. In 2016, in the US, approximately 11.5% of males (4.7% in own incorporated business, 6.8% in own not incorporated business) and 7.3% of females (2.2% in own incorporated business, 5.1% in own not incorporated business) were self-employed, compared to 11.9% (4.3% in own incorporated business, 7.6% in own not incorporated business) and 8.9% (2.7% in own incorporated business, 6.2% in own not incorporated business), respectively, in Hawaii. Both males and females in Hawaii were slightly more likely to be unpaid family workers, as well. Oahu males and females were less likely than US males and females to be self-employed overall, though Oahu females were slightly more likely to be self-employed in an incorporated business than US females (2.4% compared to 2.2%, respectively).
0.0%
5.0%
10.0%
15.0%
20.0%
25.0%
30.0%
Population 16years and over
Below povertylevel
Less than highschool graduate*
Veterans With any disability Native Hawaiian orother Pacific
Islander
Unemployment Rate by Status, Oahu
United States Hawaii Oahu

12
Another way to measure workers who are not traditionally employed is through the number of nonemployer establishments. A nonemployer establishment is a business that has no paid employees, has annual business receipts of $1,000 ($1 or more in the construction industries), and is subject to federal income taxes. Most nonemployers are self-employed individuals, but it also includes independent contractors who might not consider themselves self-employed. If a nonemployer establishment is considered a single (self-employed) worker, then the percentage of paid employees and annual payroll that nonemployer establishments make up is higher in Hawaii than in the US overall. With the percentage of annual payroll for nonemployer establishments higher than the percentage of paid employees that are nonemployer establishments, this means that nonemployer establishments take home more pay, on average, than paid employees. Oahu still has fewer nonemployer establishments, but these establishments make up a larger percentage of annual payroll than the US average.
Data comes from the American Factfinder 2016 Business Patterns; this data is for 2016 only, and does not contain data from 2012-2015, unlike most of the other data in this report.
0.0%
5.0%
10.0%
15.0%
20.0%
United States Hawaii Oahu United States Hawaii Oahu
Male Female
Class of Worker, Oahu
Self-employed, incorporated business Self-employed, not incorporated business
0.0%
5.0%
10.0%
15.0%
20.0%
25.0%
30.0%
35.0%
40.0%
Percentage of paid employees Percentage of Annual Payroll
Nonemployer Establishments, Oahu
United States Hawaii Oahu

13
Underserved populations who are self-employed can be of particular concern for workforce development programs. In Hawaii, self-employed workers are more likely to have family income below the poverty line, have not completed a high school degree, speak English less than very well, or have a disability. Workers who work for wages at traditional jobs are more likely to be a veteran or Native Hawaiian or other Pacific Islander. Some of this is intuitive: those who have no high school degree, speak English less than well, or have a disability have barriers to traditional employment that might encourage them to become self-employed, instead.3
Based on author’s calculations from the American Community Survey, 2012 to 2016
Youth One characteristic that has been associated with poor outcomes for children is having a single head of household; children in households with married couples tend to fare better than children with only a mother or father present. Children in households led by a single mother, in particular, do poorly on a variety of socioeconomic measures. In Hawaii, this is generally less of a concern; the percentage of children in married couple households was higher than the national average, 70.5 percent to 66 percent in 2016. The percentage of children in a household with a female head of household was almost 5 percentage points lower than the national average. Oahu had an even higher percentage of married couple households and an even lower percentage of female heads of households.
3 People who are neither self-employed workers or workers who work for wages, i.e. those who are not working, are all more likely to be underserved; in some cases, significantly more so. For example, over 30% of those who are not working are below the poverty line.
0.0%2.0%4.0%6.0%8.0%
10.0%12.0%
Self-employed Works for wages
Percentage of Self-Employed that is Underserved
Below poverty line No HS degree
Speaks English less than well Veteran status
Disability status Native Hawaiian or other Pacific Islander

14
Even more so, the youth in each respective household tended to be less likely to be underserved than the national average (children in households led by a single female still are more likely to be in an underserved population than children in households with a married couple or led by a single male). Except for the percentage of youth that is Native Hawaiian or other Pacific Islander, Hawaii and Oahu youth were less likely to be disabled and less likely to in a household with income below poverty level in the past 12 months. While children in married couple households and single male householder households were more likely to live in a household with public assistance, children in households with a single female householder had lower rates of using public assistance; across all households, children in Hawaii were less likely to be in a household with public assistance. One reason why children in households led by a single householder in Hawaii might do better than the national average is because a higher percentage of children in single householder households are in multigeneration households. In other words, even though the head of household is single, the children in said household is the grandchild of the head of the household, and so the child’s parent, who is the householder’s son or daughter, is also present and mitigating some of the problems associated with single householder outcomes.
0%10%20%30%40%50%60%70%80%90%
100%
United States Hawaii Oahu
Householder Type, Oahu

15
Even though the youth in Hawaii were less likely to be disabled, less likely to live in a household with public assistance, and less likely to live in a household with income below poverty level, they’re more likely to not be enrolled in school or be idle (not enrolled in school and not employed). There was almost a 10 percentage point difference between males aged 16-19 school enrollment rates at the state and national level, and there was approximately a 5 percentage point different between females aged 16-19 school enrollment rate. Oahu youth were more likely to be in school or working than the state average, but still do worse than the national average, except for idleness among males aged 16-19.
0.0%
10.0%
20.0%
30.0%
40.0%
50.0%
60.0%
70.0%
Income in the past 12months below poverty level
Children living in householdswith public assistance
With any disability Native Hawaiian or otherPacific Islander
Underserved Youth by Householder Type, Oahu
0.0%5.0%
10.0%15.0%20.0%25.0%30.0%35.0%40.0%
Not enrolled inschool
Idle Not enrolled inschool
Idle Not enrolled inschool
Male 16 to 19 Male 16 to 19 Female 16 to 19 Female 16 to 19 Children 3 to 17
School Enrollment and Idleness, Oahu
US Hawaii Oahu

16
HAWAII COUNTY Poverty In 2016, Hawaii had one of the lowest poverty rates in the nation: the nation’s poverty rate was 15.1 percent and Hawaii’s poverty rate was 10.8 percent. Only four states had a lower poverty rate than Hawaii. The State’s overall good numbers masks high poverty rates in certain counties, however.
In Hawaii County, the poverty rate approached that of Mississippi’s poverty rate of 21.1 percent, the worst in the nation. Some demographics had a poverty rate that exceeded that amount – one quarter of females aged 18-34 had incomes that were considered poverty status. For males aged 18-34, the poverty rate was 20.3 percent. Older males and females did a little better: males aged 35-64 had a poverty rate of 16.0 percent and females aged 35-64 had a poverty rate of 16.9 percent. The poverty rate has increased for three of these demographics since 2012, and could continue to increase if a robust workforce development strategy for this population is not developed.
Only one census county division in Hawaii County had a poverty rate below the state average: South Kohala CCD. North Hilo and Paauhau-Paauilo CCD had poverty rates just above the state average. Kau and Pahoa-Kalapana CCD had some of the highest poverty rates in the State.
0%5%
10%15%20%25%30%
18-34 35-64 18-34 35-64
Male Female
US Hawaii Hawaii County
Poverty Rate, Hawaii County
2012-2016 2008-2012
17
Percentage of Adults Aged 18-64 Below the Poverty Line
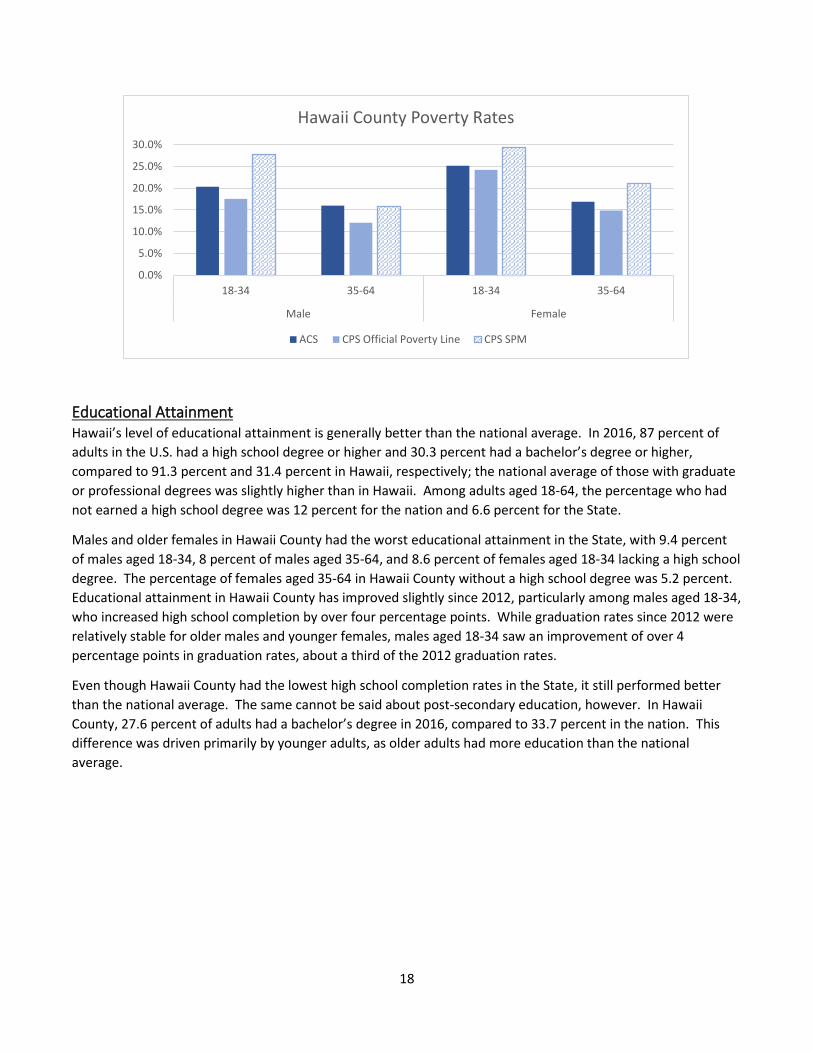
Using the official poverty line as a measure of poverty rates can be misleading, as it does not account for local costs and government benefits that can affect a household’s purchasing power. The “supplemental poverty measure” (SPM) was developed by the Census Bureau to adjust for this. American FactFinder does not have SPM tables, so this analysis does not account for the local costs and government benefits that might be unique to Hawaii. However, the Census Bureau does publish state level data on the SPM, and the Current Population Survey public use microdata contain information on an individual’s SPM status. Using the Current Population Survey (CPS) and the supplemental poverty measure, the US’s poverty rate from 2014 to 2016 increases from 13.7 percent to 14.7 percent and Hawaii’s poverty rate increases from 10.3 percent to 14.8 percent, moving the State into the top 15 states with high poverty rates.4 The increase in poverty rates with the use of the SPM is not the same across different demographic groups, and thus no uniform adjustment based on the 4.5 percentage point statewide gap was made to the above analysis. However, to provide an idea of how poverty rates and SPMs can differ between demographic groups, the following figure presents the difference between the poverty rate based on the American Community Survey (from American FactFinder), and the poverty rate and the supplemental poverty measure based on the Current Population Survey (based on the author’s calculations) for Hawaii County from 2012 to 2016.5
4 The Supplemental Poverty Measure: 2016, Table A-5. https://www.census.gov/data/tables/2017/demo/income-poverty/p60-261.html. Accessed June 21, 2018. 5 The American Community Survey and the Current Population Survey have slightly different populations, due to differences in sampling, surveying, and follow-up procedures, and have slightly different measurements for income. Thus, a direct comparison of the poverty rate based on the American Community Survey and the supplemental poverty measure based on the Current Population Survey cannot be made.
18
Educational Attainment Hawaii’s level of educational attainment is generally better than the national average. In 2016, 87 percent of adults in the U.S. had a high school degree or higher and 30.3 percent had a bachelor’s degree or higher, compared to 91.3 percent and 31.4 percent in Hawaii, respectively; the national average of those with graduate or professional degrees was slightly higher than in Hawaii. Among adults aged 18-64, the percentage who had not earned a high school degree was 12 percent for the nation and 6.6 percent for the State.
Males and older females in Hawaii County had the worst educational attainment in the State, with 9.4 percent of males aged 18-34, 8 percent of males aged 35-64, and 8.6 percent of females aged 18-34 lacking a high school degree. The percentage of females aged 35-64 in Hawaii County without a high school degree was 5.2 percent. Educational attainment in Hawaii County has improved slightly since 2012, particularly among males aged 18-34, who increased high school completion by over four percentage points. While graduation rates since 2012 were relatively stable for older males and younger females, males aged 18-34 saw an improvement of over 4 percentage points in graduation rates, about a third of the 2012 graduation rates.
Even though Hawaii County had the lowest high school completion rates in the State, it still performed better than the national average. The same cannot be said about post-secondary education, however. In Hawaii County, 27.6 percent of adults had a bachelor’s degree in 2016, compared to 33.7 percent in the nation. This difference was driven primarily by younger adults, as older adults had more education than the national average.
0.0%
5.0%
10.0%
15.0%
20.0%
25.0%
30.0%
18-34 35-64 18-34 35-64
Male Female
Hawaii County Poverty Rates
ACS CPS Official Poverty Line CPS SPM

19
Even though Hawaii County had, on average, the highest rate of people without a high school degree, only a few census county divisions (CCD) in Hawaii County had a percentage of people without a high school degree substantially higher than the State average: Honokaa-Kukuihaele CCD, Kau CCD, and Paauhau-Paauilo CCD. Further, the CCD with the one of the highest percentage of people who received a high school diploma was located in Hawaii County (South Kohala CCD).
Percentage of Adults with a High School Degree or Equivalent
0%2%4%6%8%
10%12%14%16%
18-34 35-64 18-34 35-64
Male Female
US Hawaii Hawaii County
No High School Degree, Hawaii County
2012-2016 2008-2012

20
English Proficiency The State has a history of large inflows of immigrants, and its history and location lend to continued immigrant inflows. Thus, the percentage of people 5 years and older who do not speak English at home is relatively high, as is the percentage of people who speak English less than “very well”. Note that this is a subjective and self-reported measure, so an individual could be reasonably proficient at English, but still report in the American Community Survey that he or she does not speak English well (the opposite could also be true). In the US, 21.1 percent of people 5 years and older did not speak English at home, compared to 25.7 percent in Hawaii, in 2016. Of these people who did not speak English at home, the proportion who did not speak English well is higher in the State compared to the national average. In the US, 8.5 percent of people older than 5 spoke English less than “very well” in 2016, about 40 percent of the people who did not speak English at home.
In contrast, in Hawaii, almost half of the people who speak a language other than English at home spoke English less than “very well” – 12.6 percent of people 5 years and older in Hawaii spoke English less than “very well”. In Hawaii County, fewer people had limited English-speaking abilities than the national average. In Hawaii County, 18.7 percent of people spoke a language other than English at home and 5.9 percent of people spoke English less than “very well”.
Hawaii County did not have any census county divisions (CCD) that had more than 5 percent of the households considered as Limited English Proficient (LEP) households. With that being said, aside from North Kohala and North Hilo, no CCD had LEP households make up less than 2 percent of the households.
0.0%
5.0%
10.0%
15.0%
20.0%
25.0%
30.0%
US Hawaii Hawaii County
English-speaking, Hawaii County
Language other than English at home Speak English less than "very well"

21
Percentage of Households with Limited English Proficiency
Veteran Status With numerous military bases and facilities in the State, defense is a major contributor to Hawaii’s economy. Combined with such a small population, the State has a high concentration of veterans. In Hawaii, 10.1 percent of the population were civilian veterans in 2016, compared to 8.0 percent in the US.
While most of the military bases and facilities are located on Oahu, the Pohakuloa Training Area is located in Hawaii County. The percentage of males aged 18-34 and males aged 35-64 with veteran status was 6.5 percent and 13.6 percent, respectively. The percentage of females aged 18-34 and females aged 35-64 with veteran status was 1.4 percent and 0.9 percent, respectively. The percentage of males aged 18-34 with veteran status increased by over two percentage points, from 4.2 percent, since 2012, but decreased for males aged 35-64 by over four percentage points.

22
Even though the town closest to the Pohakuloa Training Area is Hilo, the census county divisions (CCD) with the highest rates of civilian veterans are Pahoa-Kalapana CCD and Keaau-Mountain View CCD. In fact, these two CCDs have the highest rates of civilians with veteran status outside of Oahu. About 10 percent of the population in Hilo and Kona have served in the military.
Percentage of Adults 18 Years and Over with Veteran Status
0%
5%
10%
15%
20%
18-34 35-64 18-34 35-64
Male Female
US Hawaii Hawaii County
Veteran Status, Hawaii County
2012-2016 2008-2012

23
Disability Status Hawaii is generally considered a relatively healthy state, and the percentage of adults aged 18-64 with a disability reflects this. In the US, 14.2 percent of adults aged 18-64 had a disability in 2016, compared to Hawaii’s 10.4 percent of adults aged 18-64.
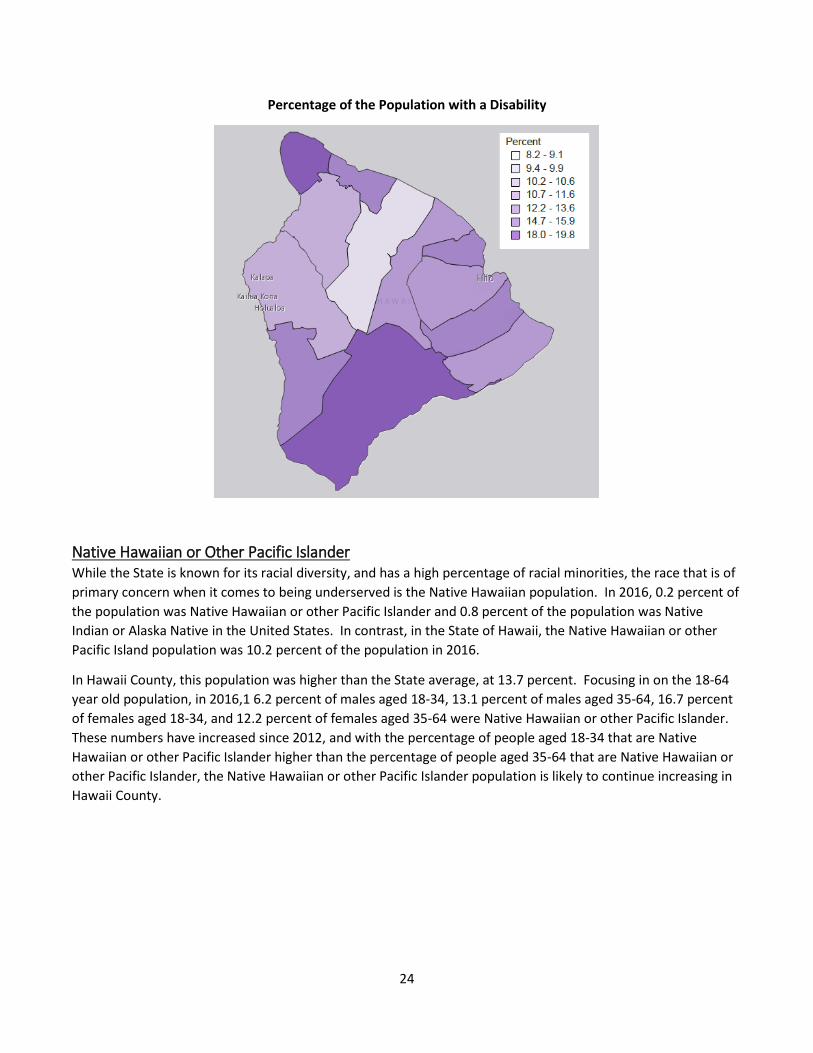
Hawaii County is the county with the highest rates of disability. In fact, older adults in Hawaii County have disabilities at rates higher than the national average: 12.5 percent for males aged 35-64 and 10.8 for females aged 35-64. Between 6 and 7 percent of male and females aged 18-34 have at least one disability. While the percentage of males aged 18-34 and males aged 35-64 with a disability has decreased by about 20 percent since 2012, but the percentage of females aged 18-34 has increased by almost half.
Only one census county division in Hawaii County had a disability rate better than the state average: Paahua-Paauilo CCD. Some of the highest disability rates were found in Hawaii County, with Kau CCD and North Kohala CCD having disability rates approaching 20 percent.
0%2%4%6%8%
10%12%14%16%
18-34 35-64 18-34 35-64
Male Female
US Hawaii Hawaii County
Disability Rate, Hawaii County
2012-2016 2008-2012
24
Percentage of the Population with a Disability
Native Hawaiian or Other Pacific Islander While the State is known for its racial diversity, and has a high percentage of racial minorities, the race that is of primary concern when it comes to being underserved is the Native Hawaiian population. In 2016, 0.2 percent of the population was Native Hawaiian or other Pacific Islander and 0.8 percent of the population was Native Indian or Alaska Native in the United States. In contrast, in the State of Hawaii, the Native Hawaiian or other Pacific Island population was 10.2 percent of the population in 2016.
In Hawaii County, this population was higher than the State average, at 13.7 percent. Focusing in on the 18-64 year old population, in 2016,1 6.2 percent of males aged 18-34, 13.1 percent of males aged 35-64, 16.7 percent of females aged 18-34, and 12.2 percent of females aged 35-64 were Native Hawaiian or other Pacific Islander. These numbers have increased since 2012, and with the percentage of people aged 18-34 that are Native Hawaiian or other Pacific Islander higher than the percentage of people aged 35-64 that are Native Hawaiian or other Pacific Islander, the Native Hawaiian or other Pacific Islander population is likely to continue increasing in Hawaii County.

25
Despite having the highest percentage of Native Hawaiian or other Pacific Islanders in the State, no census county division (CCD) in Hawaii County had among the highest concentrations of Native Hawaiian or other Pacific Islanders; much of the Native Hawaiian or other Pacific Islander population was spread out, with half of the CCDs having an approximately 15 to 20 percent Native Hawaiian or other Pacific Islander population. North Hilo had the lowest percentage of Native Hawaiian or other Pacific Islander in the State, at 2 percent.
Percentage of the Population Native Hawaiian or Other Pacific Islander
0%
5%
10%
15%
20%
18-34 35-64 18-34 35-64
Male Female
US Hawaii Hawaii County
Native Hawaiian or Other Pacific Islander,Hawaii County
2012-2016 2008-2012

26
Labor Force Participation and Unemployment Hawaii’s labor force participation and unemployment rates are marginally better than the national average; for all adults age 16 and over, Hawaii’s labor force participation rate was about 2 percentage points higher than the nation’s (65.2 percent compared to 63.5 percent) and the State’s unemployment rate was about 2 percentage points lower than the nation’s (5.5 percent compared to 7.4 percent) in 2016. Individuals in the underserved populations tended to have lower labor force participation rates and higher rates of unemployment, except for veterans. While the State’s better labor market outcomes tended to be consistent across the underserved populations, there were a few populations who do worse than the national average. Adults below the poverty level and Native Hawaiian or other Pacific Islander adults had lower labor force participation rates than the national average (46.5 percent compared to 51.3 percent, and 63.7 percent compared to 66.8 percent, respectively) and Native Hawaiian or other Pacific Islander adults had approximately the same unemployment rate as Native Hawaiian or other Pacific Islander adults across the nation.
In Hawaii County, labor force participation rates tended to be worse than even the national average, except for those in households where a language other than English is spoken at home. Unemployment rates for the underserved populations tended to be worse than the state average, except for those falling below the poverty level; the unemployment rate for veterans in Hawaii County was particularly bad, relative to the national average.
* “Less than high school graduate” is taken from adults 25-64, whereas the other populations are taken from all adults 16 and over.
0.0%10.0%20.0%30.0%40.0%50.0%60.0%70.0%80.0%90.0%
Population 16years and over
Below povertylevel
Less than highschool
graduate*
Language otherthan English at
home
Veterans With anydisability
Native Hawaiianor other Pacific
Islander
Labor Force Participation by Status, Hawaii County
United States Hawaii Hawaii County

27
* “Less than high school graduate” is taken from adults 25-64, whereas the other populations are taken from all adults 16 and over.
Self-Employed Workers The Workforce Innovation and Opportunity Act (WIOA) is expected to improve labor market outcomes for workers through several channels, including enhanced services for workers who might have received limited assistance in the past. One category of workers targeted in WIOA is self-employed workers. Hawaii has slightly more self-employed workers than the national average, with the difference coming primarily from more self-employed workers in own not incorporated businesses. In the US, approximately 11.5% of males (4.7% in own incorporated business, 6.8% in own not incorporated business) and 7.3% of females (2.2% in own incorporated business, 5.1% in own not incorporated business) were self-employed, compared to 11.9% (4.3% in own incorporated business, 7.6% in own not incorporated business) and 8.9% (2.7% in own incorporated business, 6.2% in own not incorporated business), respectively, in Hawaii. Both males and females in Hawaii were slightly more likely to be unpaid family workers, as well. Hawaii County males and females were far more likely than US males and females to be self-employed overall, particularly when it comes to self-employed workers in own not incorporated businesses (11.5% for males and 9.6% for females in Hawaii County).
0.0%
5.0%
10.0%
15.0%
20.0%
25.0%
30.0%
Population 16years and over
Below povertylevel
Less than highschool graduate*
Veterans With any disability Native Hawaiian orother Pacific
Islander
Unemployment Rate by Status, Hawaii County
United States Hawaii Hawaii County
28
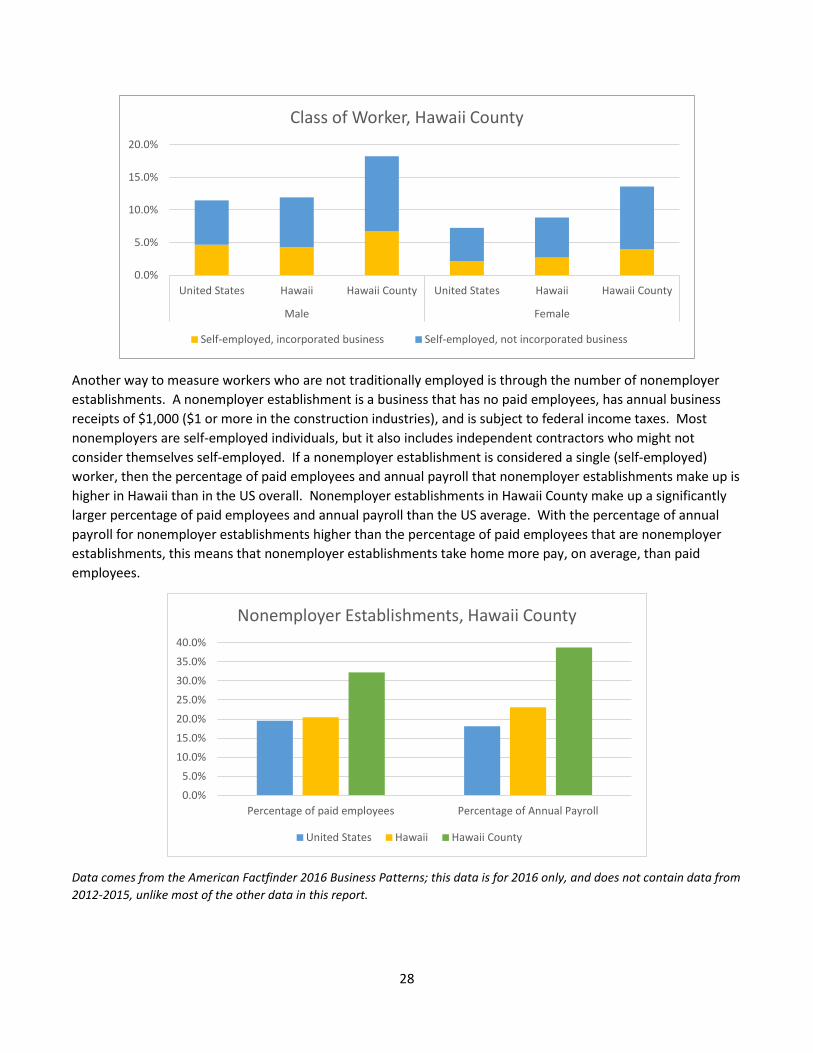
Another way to measure workers who are not traditionally employed is through the number of nonemployer establishments. A nonemployer establishment is a business that has no paid employees, has annual business receipts of $1,000 ($1 or more in the construction industries), and is subject to federal income taxes. Most nonemployers are self-employed individuals, but it also includes independent contractors who might not consider themselves self-employed. If a nonemployer establishment is considered a single (self-employed) worker, then the percentage of paid employees and annual payroll that nonemployer establishments make up is higher in Hawaii than in the US overall. Nonemployer establishments in Hawaii County make up a significantly larger percentage of paid employees and annual payroll than the US average. With the percentage of annual payroll for nonemployer establishments higher than the percentage of paid employees that are nonemployer establishments, this means that nonemployer establishments take home more pay, on average, than paid employees.
Data comes from the American Factfinder 2016 Business Patterns; this data is for 2016 only, and does not contain data from 2012-2015, unlike most of the other data in this report.
0.0%
5.0%
10.0%
15.0%
20.0%
United States Hawaii Hawaii County United States Hawaii Hawaii County
Male Female
Class of Worker, Hawaii County
Self-employed, incorporated business Self-employed, not incorporated business
0.0%
5.0%
10.0%
15.0%
20.0%
25.0%
30.0%
35.0%
40.0%
Percentage of paid employees Percentage of Annual Payroll
Nonemployer Establishments, Hawaii County
United States Hawaii Hawaii County

29
Underserved populations who are self-employed can be of particular concern for workforce development programs. In Hawaii, self-employed workers are more likely to have family income below the poverty line, have not completed a high school degree, speak English less than very well, or have a disability. Workers who work for wages at traditional jobs are more likely to be a veteran or Native Hawaiian or other Pacific Islander. Some of this is intuitive: those who have no high school degree, speak English less than well, or have a disability have barriers to traditional employment that might encourage them to become self-employed, instead. 6
Based on author’s calculations from the American Community Survey, 2012 to 2016
Youth One characteristic that has been associated with poor outcomes for children is having a single head of household; children in households with married couples tend to fare better than children with only a mother or father present. Children in households led by a single mother, in particular, do poorly on a variety of socioeconomic measures. In Hawaii, this is generally less of a concern; the percentage of children in married couple households was higher than the national average, 70.5 percent to 66 percent in 2016. The percentage of children in a household with a female head of household was almost 5 percentage points lower than the national average.
Children in Hawaii County were less likely to be in married couple households compared to the national average, but this is offset by a higher percentage in male heads of households; the percentage of children in households with female heads of households was only 1 percentage point higher than the national average.
6 People who are neither self-employed workers or workers who work for wages, i.e. those who are not working, are all more likely to be underserved; in some cases, significantly more so. For example, over 30% of those who are not working are below the poverty line.
0.0%2.0%4.0%6.0%8.0%
10.0%12.0%
Self-employed Works for wages
Percentage of Self-Employed that is Underserved
Below poverty line No HS degree
Speaks English less than well Veteran status
Disability status Native Hawaiian or other Pacific Islander

30
While Hawaii youth in each respective household tended to be less likely to be underserved than the national average, this is not the case for Hawaii County, except for youth with disabilities. Youth in Hawaii County are more likely to be Native Hawaiian or other Pacific Islander, live in a household with public assistance, and live in a household with income in the past 12 months below poverty level.
Even though the youth in Hawaii were less likely to be disabled, less likely to live in a household with public assistance, and less likely live in a household with income below poverty level, they’re more likely to not be enrolled in school or be idle (not enrolled in school and not employed). There was almost a 10 percentage point
0%10%20%30%40%50%60%70%80%90%
100%
United States Hawaii Hawaii County
Householder Type, Hawaii County
0.0%
10.0%
20.0%
30.0%
40.0%
50.0%
60.0%
70.0%
Income in the past 12months below poverty level
Children living in householdswith public assistance
With any disability Native Hawaiian or otherPacific Islander
Underserved Youth by Householder Type, Hawaii County

31
difference between males aged 16-19 school enrollment rates at the state and national level, and there was approximately a 5 percentage point different between females aged 16-19 school enrollment rate. This difference is even larger in Hawaii County, which had a higher percentage of underserved youth. The percentage of males aged 16-19 and females aged 16-19 either not in school or idle in Hawaii County was nearly double that of the national average (idleness for females aged 16-19 was more than double the national average).
0.0%5.0%
10.0%15.0%20.0%25.0%30.0%35.0%40.0%
Not enrolled inschool
Idle Not enrolled inschool
Idle Not enrolled inschool
Male 16 to 19 Male 16 to 19 Female 16 to 19 Female 16 to 19 Children 3 to 17
School Enrollment and Idleness, Hawaii County
US Hawaii Hawaii County

32
MAUI Poverty In 2016, Hawaii had one of the lowest poverty rates in the nation: the nation’s poverty rate was 15.1 percent and Hawaii’s poverty rate was 10.8 percent. Only four states had a lower poverty rate than Hawaii.
While Maui’s poverty rates for all people and for adults aged 18-64 were below the State’s average, young adults had a higher poverty rate than the state average. Males aged 18-34 had a poverty rate of 11.7 percent and females aged 18-34 had a poverty rate close to the national average, 14.3 percent. In contrast, males aged 35-64 had a poverty rate of 8.5 percent and females aged 35-64 had a poverty rate of 9.2 percent. While the poverty rate for females aged 18-34 is on the right path, decreasing by 3 percentage points since 2012, the poverty among males aged 18-34 increased from 2012.
The poverty rates for adults aged 18-64 on Maui had high variance; Lahaina, Waihee-Waikapu CCD, and Haiku had some of the lowest poverty rates in the State, with poverty rates below 6 percent, while Spreckelsville and West Molokai had some of the highest poverty rates, with poverty rates above 30 percent. Kahului and Kihei’s poverty rates were around the state average of 10 percent.
0%5%
10%15%20%25%30%
18-34 35-64 18-34 35-64
Male Female
US Hawaii Maui
Poverty Rate, Maui
2012-2016 2008-2012

33
Percentage of Adults Aged 18-64 Below the Poverty Line
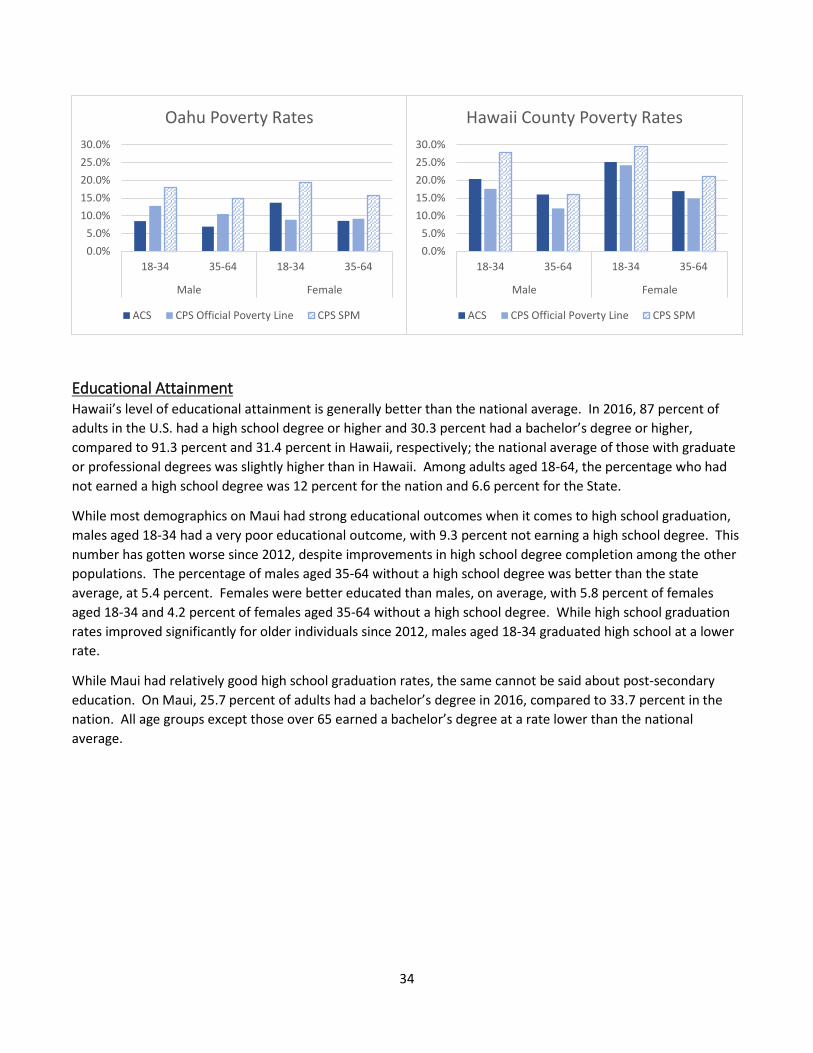
Using the official poverty line as a measure of poverty rates can be misleading, as it does not account for local costs and government benefits that can affect a household’s purchasing power. The “supplemental poverty measure” (SPM) was developed by the Census Bureau to adjust for this. American FactFinder does not have SPM tables, so this analysis does not account for the local costs and government benefits that might be unique to Hawaii. However, the Census Bureau does publish state level data on the SPM, and the Current Population Survey public use microdata contain information on an individual’s SPM status. Using the Current Population Survey (CPS) and the supplemental poverty measure, the US’s poverty rate from 2014 to 2016 increases from 13.7 percent to 14.7 percent and Hawaii’s poverty rate increases from 10.3 percent to 14.8 percent, moving the State into the top 15 states with high poverty rates.7 The increase in poverty rates with the use of the SPM is not the same across different demographic groups, and thus no uniform adjustment based on the 4.5 percentage point statewide gap was made to the above analysis. However, to provide an idea of how poverty rates and SPMs can differ between demographic groups, the following figure presents the difference between the poverty rate based on the American Community Survey (from American FactFinder), and the poverty rate and the supplemental poverty measure based on the Current Population Survey (based on the author’s calculations) for Hawaii County and Oahu from 2012 to 2016.8 Due to data availability, such a comparison cannot be made for Maui and Kauai.
7 The Supplemental Poverty Measure: 2016, Table A-5. https://www.census.gov/data/tables/2017/demo/income-poverty/p60-261.html. Accessed June 21, 2018. 8 The American Community Survey and the Current Population Survey have slightly different populations, due to differences in sampling, surveying, and follow-up procedures, and have slightly different measurements for income. Thus, a direct comparison of the poverty rate based on the American Community Survey and the supplemental poverty measure based on the Current Population Survey cannot be made.
34
Educational Attainment Hawaii’s level of educational attainment is generally better than the national average. In 2016, 87 percent of adults in the U.S. had a high school degree or higher and 30.3 percent had a bachelor’s degree or higher, compared to 91.3 percent and 31.4 percent in Hawaii, respectively; the national average of those with graduate or professional degrees was slightly higher than in Hawaii. Among adults aged 18-64, the percentage who had not earned a high school degree was 12 percent for the nation and 6.6 percent for the State.
While most demographics on Maui had strong educational outcomes when it comes to high school graduation, males aged 18-34 had a very poor educational outcome, with 9.3 percent not earning a high school degree. This number has gotten worse since 2012, despite improvements in high school degree completion among the other populations. The percentage of males aged 35-64 without a high school degree was better than the state average, at 5.4 percent. Females were better educated than males, on average, with 5.8 percent of females aged 18-34 and 4.2 percent of females aged 35-64 without a high school degree. While high school graduation rates improved significantly for older individuals since 2012, males aged 18-34 graduated high school at a lower rate.
While Maui had relatively good high school graduation rates, the same cannot be said about post-secondary education. On Maui, 25.7 percent of adults had a bachelor’s degree in 2016, compared to 33.7 percent in the nation. All age groups except those over 65 earned a bachelor’s degree at a rate lower than the national average.
0.0%5.0%
10.0%15.0%20.0%25.0%30.0%
18-34 35-64 18-34 35-64
Male Female
Oahu Poverty Rates
ACS CPS Official Poverty Line CPS SPM
0.0%5.0%
10.0%15.0%20.0%25.0%30.0%
18-34 35-64 18-34 35-64
Male Female
Hawaii County Poverty Rates
ACS CPS Official Poverty Line CPS SPM

35
Maui’s generally good educational attainment rates mask one of the State’s worst graduation rates: Kahului has the second worst high school graduation rates in the state, with almost 14 percent of the adult population not earning a high school degree. Wailuku and Lanai also had over 10 percent of the population not earning a high school degree. The other census county divisions on Maui, except for West Molokai, had graduation rates better than the state average.
Percentage of Adults with a High School Degree or Equivalent
English Proficiency The State has a history of large inflows of immigrants, and its history and location lend to continued immigrant inflows. Thus, the percentage of people 5 years and older who do not speak English at home is relatively high, as is the percentage of people who speak English less than “very well”. Note that this is a subjective and self-reported measure, so an individual could be reasonably proficient at English, but still report in the American Community Survey that he or she does not speak English well (the opposite could also be true). In the US, 21.1 percent of people 5 years and older did not speak English at home, compared to 25.7 percent in Hawaii, in 2016.
0%2%4%6%8%
10%12%14%16%
18-34 35-64 18-34 35-64
Male Female
US Hawaii Maui
No High School Degree, Maui
2012-2016 2008-2012
36
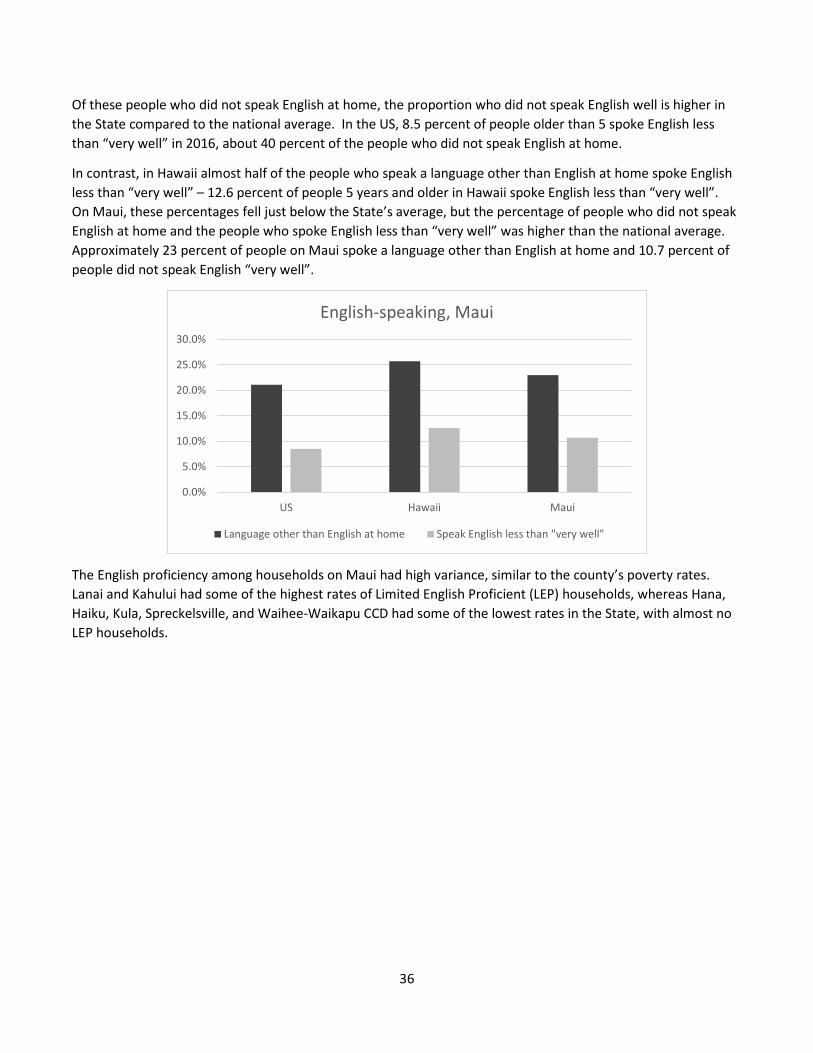
Of these people who did not speak English at home, the proportion who did not speak English well is higher in the State compared to the national average. In the US, 8.5 percent of people older than 5 spoke English less than “very well” in 2016, about 40 percent of the people who did not speak English at home.
In contrast, in Hawaii almost half of the people who speak a language other than English at home spoke English less than “very well” – 12.6 percent of people 5 years and older in Hawaii spoke English less than “very well”. On Maui, these percentages fell just below the State’s average, but the percentage of people who did not speak English at home and the people who spoke English less than “very well” was higher than the national average. Approximately 23 percent of people on Maui spoke a language other than English at home and 10.7 percent of people did not speak English “very well”.
The English proficiency among households on Maui had high variance, similar to the county’s poverty rates. Lanai and Kahului had some of the highest rates of Limited English Proficient (LEP) households, whereas Hana, Haiku, Kula, Spreckelsville, and Waihee-Waikapu CCD had some of the lowest rates in the State, with almost no LEP households.
0.0%
5.0%
10.0%
15.0%
20.0%
25.0%
30.0%
US Hawaii Maui
English-speaking, Maui
Language other than English at home Speak English less than "very well"

37
Percentage of Households with Limited English Proficiency
Veteran Status With numerous military bases and facilities in the State, defense is a major contributor to Hawaii’s economy. Combined with such a small population, the State has a high concentration of veterans. In Hawaii, 10.1 percent of the population were civilian veterans in 2016, compared to 8.0 percent in the US.
However, there are no military bases or facilities on Maui. Thus, only 3.19 percent of males aged 18-34, 0.89 percent of females aged 18-34, and 0.61 percent of females aged 35-64 were veterans. The veteran population on Maui for older males was higher than the state average, though: 11.51 percent of males aged 35-64 were veterans in 2016. Some of these older males could be retired with a sufficient military pension, and might not be in need of employment, training, or other workforce development support services. These numbers have generally declined since 2012.
Maui’s veteran population is concentrated around Kahului and Kula, but due to the large population in Kahului, the percentage of civilians with veteran status in Kahului is among the lowest in the State. West Maui also has a
0%
5%
10%
15%
20%
18-34 35-64 18-34 35-64
Male Female
US Hawaii Maui
Veteran Status, Maui
2012-2016 2008-2012

38
very low rate of civilians with veteran status. Over 10 percent of civilians in Kula, East Molokai, and Spreckelsville have veteran status.
Percentage of Adults 18 Years and Over with Veteran Status
Disability Status Hawaii is generally considered a relatively healthy state, and the percentage of adults aged 18-64 with a disability reflects this. In the US, 14.2 percent of adults aged 18-64 had a disability in 2016, compared to Hawaii’s 10.4 percent of adults aged 18-64.
Aside from older males, adults aged 18-64 on Maui had a lower rate of disability than the US 18-64 year old average: 10.8 percent of males aged 35-64 had a disability, compared to 4.5 percent of males aged 18-34, 2.9 percent of females aged 18-34, and 8.9 percent of females aged 35-34. Unfortunately, not only was this one of the demographics with the highest percentage of people with a disability in the state, the percentage of males aged 35-64 with a disability on Maui increased from 2012, whereas the other adults aged 18-64 on Maui all had a decrease in the percentage of people with a disability.
0%2%4%6%8%
10%12%14%16%
18-34 35-64 18-34 35-64
Male Female
US Hawaii Maui
Disability Rate, Maui
2012-2016 2008-2012

39
While much of Maui County had disability rates around the state average of 10.8 percent, with some census county divisions having disability rates as low as 8.5 percent (Lahaina and Lanai), East Molokai CCD had one of the highest disability rates in the State.
Percentage of the Population with a Disability
Native Hawaiian or Other Pacific Islander While the State is known for its racial diversity, and has a high percentage of racial minorities, the race that is of primary concern when it comes to being underserved is the Native Hawaiian population. In 2016, 0.2 percent of the population was Native Hawaiian or other Pacific Islander and 0.8 percent of the population was Native Indian or Alaska Native in the United States. In contrast, in the State of Hawaii, the Native Hawaiian or other Pacific Island population was 10.2 percent of the population in 2016.
On Maui, this population was close to the State average, at 10.9 percent. Focusing in on the 18-64 year old population, in 2016, 13.8 percent of males aged 18-34, 9.6 percent of males aged 35-64, 12.0 percent of females aged 18-34, and 9.0 percent of females aged 35-64 were Native Hawaiian or other Pacific Islander. These numbers have slightly increased since 2012, and with the percentage of people aged 18-34 that are Native Hawaiian or other Pacific Islander higher than the percentage of people aged 35-64 that are Native Hawaiian or other Pacific Islander, the Native Hawaiian or other Pacific Islander population is likely to continue increasing on Maui.

40
Maui had three of the top five census county divisions (CCD) with the highest percentage of Native Hawaiian or other Pacific Islander: West Molokai, Hana, and East Molokai. This was balanced out by four of five CCDs with the lowest percentage of Native Hawaiian or other Pacific Islander: Spreckelsville CCD, Haiku-Pauwela CCD, Kihei, and Lahaina.
Percentage of the Population Native Hawaiian or Other Pacific Islander
Labor Force Participation and Unemployment Hawaii’s labor force participation and unemployment rate are marginally better than the national average; for all adults age 16 and over, Hawaii’s labor force participation rate was about 2 percentage points higher than the nation’s (65.2 percent compared to 63.5 percent) and the State’s unemployment rate was about 2 percentage points lower than the nation’s (5.5 percent compared to 7.4 percent) in 2016. Individuals in the underserved populations tended to have lower labor force participation rates and higher rates of unemployment, except for veterans. While the State’s better labor market outcomes tended to be consistent across the underserved populations, there are a few populations who did worse than the national average in 2016. Adults below the
0%
5%
10%
15%
20%
18-34 35-64 18-34 35-64
Male Female
US Hawaii Maui
Native Hawaiian or Other Pacific Islander,Maui
2012-2016 2008-2012

41
poverty level and Native Hawaiian or other Pacific Islander adults had lower labor force participation rates than the national average (46.5 percent compared to 51.3 percent, and 63.7 percent compared to 66.8 percent, respectively) and Native Hawaiian or other Pacific Islander adults had approximately the same unemployment rate as Native Hawaiian or other Pacific Islander adults across the nation.
On Maui, labor force participation rates were better than or about equal to the national average, except for those in households where a language other than English is spoken at home. The labor force participation for individuals without a high school degree was particularly high, relative to the national average. Unemployment rates for the underserved populations also were generally better than the national average, except for adults below the poverty level and Native Hawaiian or other Pacific Islander adults, which had about the same unemployment rates as the nation.
* “Less than high school graduate” is taken from adults 25-64, whereas the other populations are taken from all adults 16 and over.
* “Less than high school graduate” is taken from adults 25-64, whereas the other populations are taken from all adults 16 and over.
0.0%10.0%20.0%30.0%40.0%50.0%60.0%70.0%80.0%90.0%
Population 16years and over
Below povertylevel
Less than highschool
graduate*
Language otherthan English at
home
Veterans With anydisability
Native Hawaiianor other Pacific
Islander
Labor Force Participation by Status, Maui
United States Hawaii Maui
0.0%
5.0%
10.0%
15.0%
20.0%
25.0%
30.0%
Population 16years and over
Below povertylevel
Less than highschool graduate*
Veterans With any disability Native Hawaiian orother Pacific
Islander
Unemployment Rate by Status, Maui
United States Hawaii Maui

42
Self-Employed Workers The Workforce Innovation and Opportunity Act (WIOA) is expected to improve labor market outcomes for workers through several channels, including enhanced services for workers who might have received limited assistance in the past. One category of workers targeted in WIOA is self-employed workers. Hawaii has slightly more self-employed workers than the national average, with the difference coming primarily from more self-employed workers in own not incorporated businesses. In the US, approximately 11.5% of males (4.7% in own incorporated business, 6.8% in own not incorporated business) and 7.3% of females (2.2% in own incorporated business, 5.1% in own not incorporated business) were self-employed, compared to 11.9% (4.3% in own incorporated business, 7.6% in own not incorporated business) and 8.9% (2.7% in own incorporated business, 6.2% in own not incorporated business), respectively, in Hawaii. Both males and females in Hawaii were slightly more likely to be unpaid family workers, as well. Maui males and females were more likely than US males and females to be self-employed overall, particularly among self-employed females working in own not incorporated businesses; while there are around 1.5 percentage points more self-employed workers in Maui for the other self-employed workers, female self-employed workers in own not incorporated businesses is 3.5 percentage points higher than the national average.
Another way to measure workers who are not traditionally employed is through the number of nonemployer establishments. A nonemployer establishment is a business that has no paid employees, has annual business receipts of $1,000 ($1 or more in the construction industries), and is subject to federal income taxes. Most nonemployers are self-employed individuals, but it also includes independent contractors who might not consider themselves self-employed. If a nonemployer establishment is considered a single (self-employed) worker, then the percentage of paid employees and annual payroll that nonemployer establishments make up is higher in Hawaii than in the US overall. These measurements reflect the higher rate of self-employment on Maui, as Maui’s nonemployer establishments make up a higher percentage of paid employees and annual payroll than in the US as a whole (26.2% of paid employees and 32.4% of annual payroll in Maui, compared to 19.6% of paid employees and 18.1% of annual payroll in the US). With the percentage of annual payroll for nonemployer establishments higher than the percentage of paid employees that are nonemployer establishments, this means that nonemployer establishments take home more pay, on average, than paid employees.
0.0%
5.0%
10.0%
15.0%
20.0%
United States Hawaii Maui United States Hawaii Maui
Male Female
Class of Worker, Maui
Self-employed, incorporated business Self-employed, not incorporated business

43
Data comes from the American Factfinder 2016 Business Patterns; this data is for 2016 only, and does not contain data from 2012-2015, unlike most of the other data in this report.
Underserved populations who are self-employed can be of particular concern for workforce development programs. In Hawaii, self-employed workers are more likely to have family income below the poverty line, have not completed a high school degree, speak English less than very well, or have a disability. Workers who work for wages at traditional jobs are more likely to be a veteran or Native Hawaiian or other Pacific Islander. Some of this is intuitive: those who have no high school degree, speak English less than well, or have a disability have barriers to traditional employment that might encourage them to become self-employed, instead. 9
Based on author’s calculations from the American Community Survey, 2012 to 2016
9 People who are neither self-employed workers or workers who work for wages, i.e. those who are not working, are all more likely to be underserved; in some cases, significantly more so. For example, over 30% of those who are not working are below the poverty line.
0.0%
5.0%
10.0%
15.0%
20.0%
25.0%
30.0%
35.0%
40.0%
Percentage of paid employees Percentage of Annual Payroll
Nonemployer Establishments, Maui
United States Hawaii Maui
0.0%2.0%4.0%6.0%8.0%
10.0%12.0%
Self-employed Works for wages
Percentage of Self-Employed that is Underserved
Below poverty line No HS degree
Speaks English less than well Veteran status
Disability status Native Hawaiian or other Pacific Islander

44
Youth One characteristic that has been associated with poor outcomes for children is having a single head of household; children in households with married couples tend to fare better than children with only a mother or father present. Children in households led by a single mother, in particular, do poorly on a variety of socioeconomic measures. In Hawaii, this is generally less of a concern; the percentage of children in married couple households was higher than the national average, 70.5 percent to 66 percent in 2016. The percentage of children in a household with a female head of household was almost 5 percentage points lower than the national average.
Children on Maui were less likely to be in married couple households or in households with female heads of households compared to the national average, with a higher percentage of children in households with male heads of households.
Even more so, youth in Hawaii in each respective household tended to be less likely to be underserved than the national average (children in households led by a single female still are more likely to be in an underserved population than children in households with a married couple or led by a single male) in 2016. Except for the percentage of youth that is Native Hawaiian or other Pacific Islander, Hawaii and Maui youth were less likely to be disabled and less likely to in a household with income below poverty level in the past 12 months. While children in married couple households and single male householder households were more likely to live in a household with public assistance, children in households with a single female householder had lower rates of using public assistance; across all households, children in Hawaii were less likely to be in a household with public assistance. One reason why children in households led by a single householder in Hawaii might do better than the national average is because a higher percentage of children in single householder households are in multigeneration households. In other words, even though the head of household is single, the children in said household is the grandchild of the head of the household, and so the child’s parent, who is the householder’s son or daughter, is also present and mitigating some of the problems associated with single householder outcomes.
0%10%20%30%40%50%60%70%80%90%
100%
United States Hawaii Maui
Householder Type, Maui

45
Even though the youth in Hawaii were less likely to be disabled, less likely to live in a household with public assistance, and less likely to live in a household with income below poverty level, they’re more likely to not be enrolled in school or be idle (not enrolled in school and not employed). There was almost a 10 percentage point difference between males aged 16-19 school enrollment rates at the state and national level, and there is approximately a 5 percentage point different between females aged 16-19 school enrollment rate in 2016. This difference was even larger on Maui, despite having a lower percentage of underserved youth. The percentage of males aged 16-19 and females aged 16-19 either not in school or idle on Maui was nearly double that of the national average (lack of school enrollment for males aged 16-19 was more than double the national average).
0.0%
10.0%
20.0%
30.0%
40.0%
50.0%
60.0%
70.0%
Income in the past 12months below poverty level
Children living in householdswith public assistance
With any disability Native Hawaiian or otherPacific Islander
Underserved Youth by Householder Type, Maui
0.0%5.0%
10.0%15.0%20.0%25.0%30.0%35.0%40.0%
Not enrolled inschool
Idle Not enrolled inschool
Idle Not enrolled inschool
Male 16 to 19 Male 16 to 19 Female 16 to 19 Female 16 to 19 Children 3 to 17
School Enrollment and Idleness, Maui
US Hawaii Maui

46
KAUAI Poverty In 2016, Hawaii had one of the lowest poverty rates in the nation: the nation’s poverty rate was 15.1 percent and Hawaii’s poverty rate was 10.8 percent. Only four states had a lower poverty rate than Hawaii.
Kauai’s poverty rate for all people and for adults aged 18-64 was similar to the state average, and females aged 35-64 and all males had poverty rates below that. The primary concern is for females aged 18-34: the poverty rate for this demographic was 13.4 percent, though the poverty rate for females aged 18-34 could be moving in the right direction, as it decreased by almost 10 percent since 2012. However, the poverty rate for males aged 35-34 increased during that timespan, from 7.6 percent to 8.9 percent.
Koloa-Poipu CCD, Lihue, and Kapaa had the highest poverty rates on Kauai, around 20 percent. The census county divisions around Lihue had some of the lowest poverty rates in the State.
0%5%
10%15%20%25%30%
18-34 35-64 18-34 35-64
Male Female
US Hawaii Kauai
Poverty Rate, Kauai
2012-2016 2008-2012

47
Percentage of Adults Aged 18-64 Below the Poverty Line
Using the official poverty line as a measure of poverty rates can be misleading, as it does not account for local costs and government benefits that can affect a household’s purchasing power. The “supplemental poverty measure” (SPM) was developed by the Census Bureau to adjust for this. American FactFinder does not have SPM tables, so this analysis does not account for the local costs and government benefits that might be unique to Hawaii. However, the Census Bureau does publish state level data on the SPM, and the Current Population Survey public use microdata contain information on an individual’s SPM status. Using the Current Population Survey (CPS) and the supplemental poverty measure, the US’s poverty rate from 2014 to 2016 increases from 13.7 percent to 14.7 percent and Hawaii’s poverty rate increases from 10.3 percent to 14.8 percent, moving the State into the top 15 states with high poverty rates.10 The increase in poverty rates with the use of the SPM is not the same across different demographic groups, and thus no uniform adjustment based on the 4.5 percentage point statewide gap was made to the above analysis. However, to provide an idea of how poverty rates and SPMs can differ between demographic groups, the following figure presents the difference between the poverty rate based on the American Community Survey (from American FactFinder), and the poverty rate and the supplemental poverty measure based on the Current Population Survey (based on the author’s calculations) for Hawaii County and Oahu from 2012 to 2016.11 Due to data availability, such a comparison cannot be made for Maui and Kauai.
10 The Supplemental Poverty Measure: 2016, Table A-5. https://www.census.gov/data/tables/2017/demo/income-poverty/p60-261.html. Accessed June 21, 2018. 11 The American Community Survey and the Current Population Survey have slightly different populations, due to differences in sampling, surveying, and follow-up procedures, and have slightly different measurements for income. Thus, a direct comparison of the poverty rate based on the American Community Survey and the supplemental poverty measure based on the Current Population Survey cannot be made.

48
Educational Attainment Hawaii’s level of educational attainment is generally better than the national average. In 2016, 87 percent of adults in the U.S. had a high school degree or higher and 30.3 percent had a bachelor’s degree or higher, compared to 91.3 percent and 31.4 percent in Hawaii, respectively; the national average of those with graduate or professional degrees was slightly higher than in Hawaii. Among adults aged 18-64, the percentage who had not earned a high school degree was 12 percent for the nation and 6.6 percent for the State.
The percentage of males on Kauai without a high school degree was only marginally better than Hawaii County, the worst county in the State with respect to high school graduation rates. Just over 9 percent of males aged 18-34 had no high school degree and the percentage of males aged 35-64 with no high school degree was 7.6 percent. Females were better educated than males, on average, with a smaller proportion that did not have a high school diploma: 6.9 percent of females aged 18-34 and 4.8 percent of females aged 35-64. Males and females of all age groups saw an improvement in graduation rates since 2012.
While Kauai had relatively good high school graduation rates compared to the national average, the same cannot be said about post-secondary education. On Kauai, 27.8 percent of adults had a bachelor’s degree in 2016, compared to 33.7 percent in the nation. All age groups except those over 65 earned a bachelor’s degree at a rate lower than the national average.
0.0%5.0%
10.0%15.0%20.0%25.0%30.0%
18-34 35-64 18-34 35-64
Male Female
Oahu Poverty Rates
ACS CPS Official Poverty Line CPS SPM
0.0%5.0%
10.0%15.0%20.0%25.0%30.0%
18-34 35-64 18-34 35-64
Male Female
Hawaii County Poverty Rates
ACS CPS Official Poverty Line CPS SPM
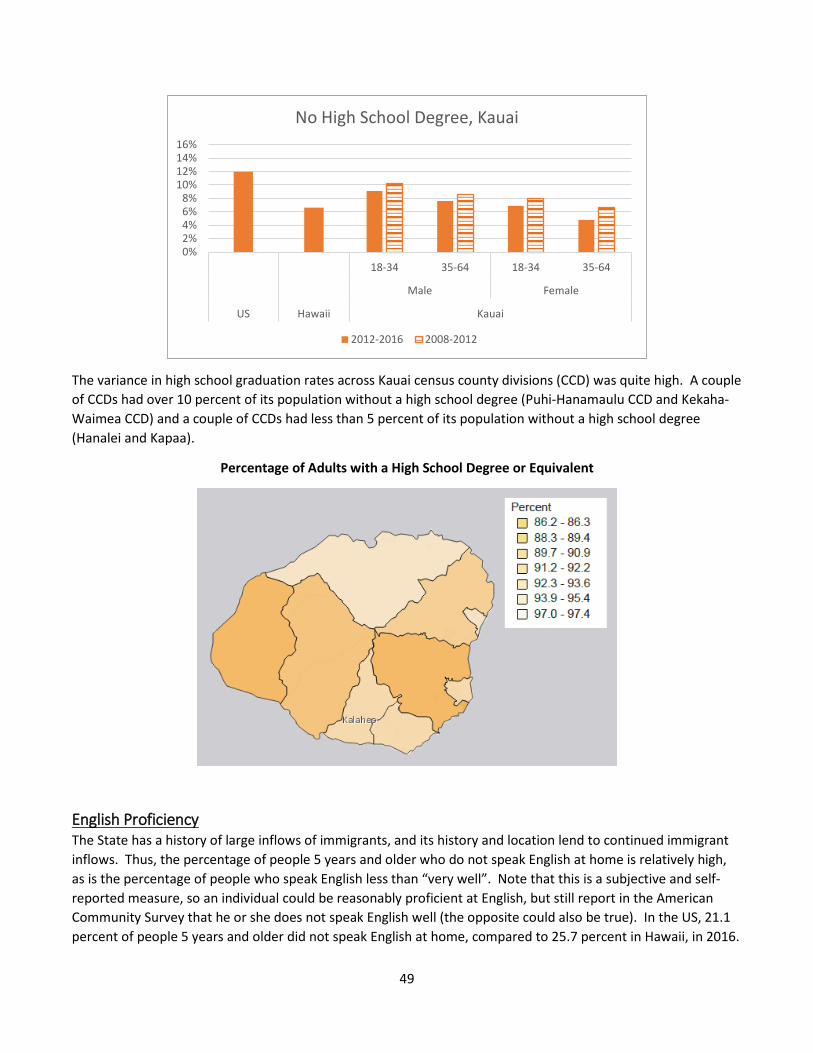
49
The variance in high school graduation rates across Kauai census county divisions (CCD) was quite high. A couple of CCDs had over 10 percent of its population without a high school degree (Puhi-Hanamaulu CCD and Kekaha-Waimea CCD) and a couple of CCDs had less than 5 percent of its population without a high school degree (Hanalei and Kapaa).
Percentage of Adults with a High School Degree or Equivalent
English Proficiency The State has a history of large inflows of immigrants, and its history and location lend to continued immigrant inflows. Thus, the percentage of people 5 years and older who do not speak English at home is relatively high, as is the percentage of people who speak English less than “very well”. Note that this is a subjective and self-reported measure, so an individual could be reasonably proficient at English, but still report in the American Community Survey that he or she does not speak English well (the opposite could also be true). In the US, 21.1 percent of people 5 years and older did not speak English at home, compared to 25.7 percent in Hawaii, in 2016.
0%2%4%6%8%
10%12%14%16%
18-34 35-64 18-34 35-64
Male Female
US Hawaii Kauai
No High School Degree, Kauai
2012-2016 2008-2012

50
Of these people who did not speak English at home, the proportion who did not speak English well is higher in the State compared to the national average. In the US, 8.5 percent of people older than 5 spoke English less than “very well” in 2016, about 40 percent of the people who did not speak English at home.
In contrast, in Hawaii, almost half of the people who speak a language other than English at home spoke English less than “very well” – 12.6 percent of people 5 years and older in Hawaii spoke English less than “very well”. Kauai’s percentages were very similar to the nation’s average. On Kauai, 20.5 percent of people 5 years and older spoke a language other than English at home and 8.9 percent of people spoke English less than “very well” in 2016.
The Limited English Proficient (LEP) population on Kauai was relatively spread out. While Lihue had one of the higher LEP household rates in the State, at 7.4 percent, no county had a rate that fell below 2.5 percent, with most census county divisions falling between 3.5 and 5.5 percent.
Percentage of Households with Limited English Proficiency
0.0%
5.0%
10.0%
15.0%
20.0%
25.0%
30.0%
US Hawaii Kauai
English-speaking, Kauai
Language other than English at home Speak English less than "very well"

51
Veteran Status With numerous military bases and facilities in the State, defense is a major contributor to Hawaii’s economy. Combined with such a small population, the State has a high concentration of veterans. In Hawaii, 10.1 percent of the population were civilian veterans in 2016, compared to 8.0 percent in the US.
While most of the military bases and facilities are located on Oahu, the Pacific Missile Range Facility Barking Sands is located on Kauai. The percentage of adults aged 18-64 with veteran status was still low: 3.2 percent for males aged 18-34, 0.7 percent for females aged 18-34, and 1.0 percent for females aged 35-34. For males aged 35-64, 10.9 percent had veteran status. There has been a large decline in the percentage of males 35-64 with veteran status on Kauai since 2012.
Even though the percentage of older males with veteran status was relatively high, the veteran population on Kauai was evenly distributed; no census county division has a veteran population that exceeded 10 percent of the population or was below 6.5 percent of the population.
0%
5%
10%
15%
20%
18-34 35-64 18-34 35-64
Male Female
US Hawaii Kauai
Veteran Status, Kauai
2012-2016 2008-2012

52
Percentage of Adults 18 Years and Over with Veteran Status
Disability Status Hawaii is generally considered a relatively healthy state, and the percentage of adults aged 18-64 with a disability reflects this. In the US, 14.2 percent of adults aged 18-64 had a disability in 2016, compared to Hawaii’s 10.4 percent of adults aged 18-64.
Kauai is even healthier when using disability as a metric; 4.4 percent of males aged 18-34, 9 percent of males 35-64, 2.7 percent of females aged 18-34, and 6.9 percent of females aged 35-64 had a disability in 2016. These numbers have generally improved since 2012, with substantial improvements for older females.
Only two census county divisions (CCD) on Kauai have a disability rate significantly higher than the state average: Kaumakani-Hanapepe CCD and Lihue CCD. In contrast, there are three CCDs with a disability rate significantly lower than the state average: Hanalei, Kapaa, and Puhi-Hanamaulu CCD.
0%2%4%6%8%
10%12%14%16%
18-34 35-64 18-34 35-64
Male Female
US Hawaii Kauai
Disability Rate, Kauai
2012-2016 2008-2012
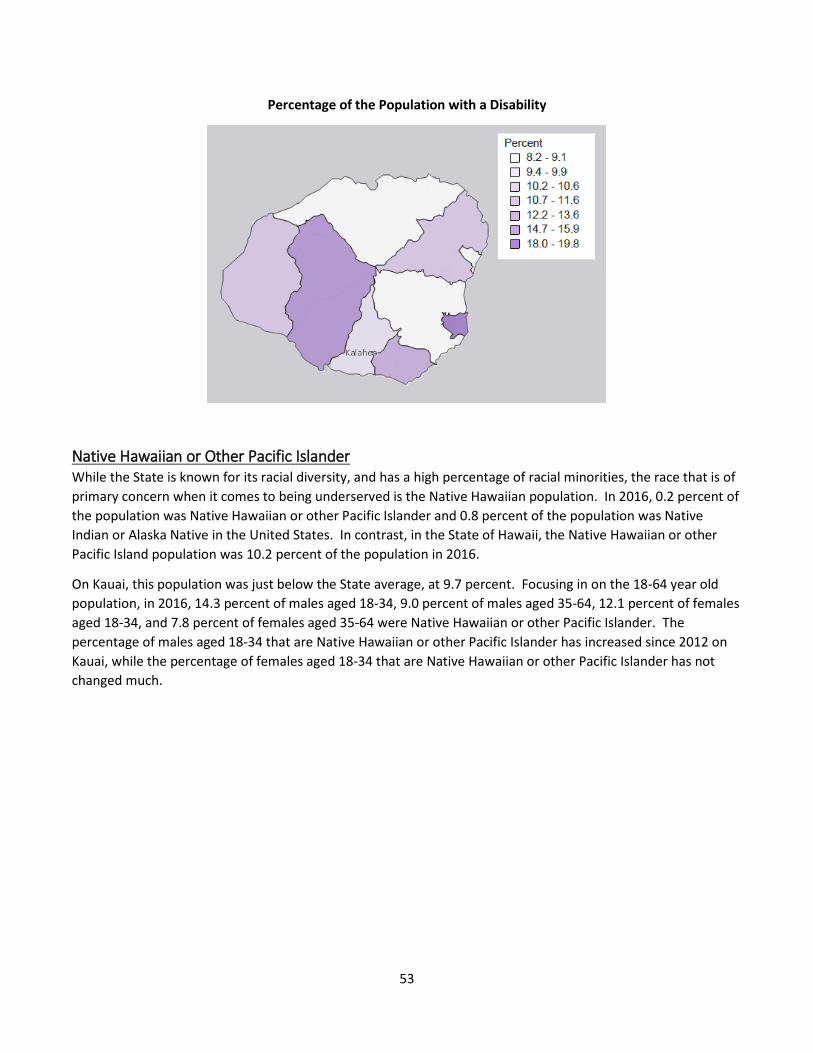
53
Percentage of the Population with a Disability
Native Hawaiian or Other Pacific Islander While the State is known for its racial diversity, and has a high percentage of racial minorities, the race that is of primary concern when it comes to being underserved is the Native Hawaiian population. In 2016, 0.2 percent of the population was Native Hawaiian or other Pacific Islander and 0.8 percent of the population was Native Indian or Alaska Native in the United States. In contrast, in the State of Hawaii, the Native Hawaiian or other Pacific Island population was 10.2 percent of the population in 2016.
On Kauai, this population was just below the State average, at 9.7 percent. Focusing in on the 18-64 year old population, in 2016, 14.3 percent of males aged 18-34, 9.0 percent of males aged 35-64, 12.1 percent of females aged 18-34, and 7.8 percent of females aged 35-64 were Native Hawaiian or other Pacific Islander. The percentage of males aged 18-34 that are Native Hawaiian or other Pacific Islander has increased since 2012 on Kauai, while the percentage of females aged 18-34 that are Native Hawaiian or other Pacific Islander has not changed much.

54
On Kauai, only Kekaha-Waimea CCD had a Native Hawaiian or other Pacific Islander population that was higher than the state average, as a percentage of the population. Most of the other census county divisions had a percentage lower than 10 percent, with Hanalei, Kapaa, and Koloa-Poipu CCD below 6 percent.
Percentage of the Population Native Hawaiian or Other Pacific Islander
Labor Force Participation and Unemployment Hawaii’s labor force participation and unemployment rate are marginally better than the national average; for all adults age 16 and over, Hawaii’s labor force participation rate was about 2 percentage points higher than the nation’s (65.2 percent compared to 63.5 percent) and the State’s unemployment rate was about 2 percentage points lower than the nation’s (5.5 percent compared to 7.4 percent) in 2016. Individuals in the underserved populations tended to have lower labor force participation rates and higher rates of unemployment, except for veterans. While the State’s better labor market outcomes tended to be consistent across the underserved
0%
5%
10%
15%
20%
18-34 35-64 18-34 35-64
Male Female
US Hawaii Kauai
Native Hawaiian or Other Pacific Islander,Kauai
2012-2016 2008-2012

55
populations, there are a few populations who did worse than the national average. Adults below the poverty level and Native Hawaiian or other Pacific Islander adults had lower labor force participation rates than the national average (46.5 percent compared to 51.3 percent, and 63.7 percent compared to 66.8 percent, respectively) and Native Hawaiian or other Pacific Islander adults had approximately the same unemployment rate as Native Hawaiian or other Pacific Islander adults across the nation.
On Kauai, labor force participation rates were about the same as the national average, except for being significantly lower for those in households with income below the poverty level. Unemployment rates for the underserved populations on Kauai were generally better than the national average.
* “Less than high school graduate” is taken from adults 25-64, whereas the other populations are taken from all adults 16 and over.
* “Less than high school graduate” is taken from adults 25-64, whereas the other populations are taken from all adults 16 and over.
0.0%10.0%20.0%30.0%40.0%50.0%60.0%70.0%80.0%90.0%
Population 16years and over
Below povertylevel
Less than highschool
graduate*
Language otherthan English at
home
Veterans With anydisability
Native Hawaiianor other Pacific
Islander
Labor Force Participation by Status, Kauai
United States Hawaii Kauai
0.0%
5.0%
10.0%
15.0%
20.0%
25.0%
30.0%
Population 16years and over
Below povertylevel
Less than highschool graduate*
Veterans With any disability Native Hawaiian orother Pacific
Islander
Unemployment Rate by Status, Kauai
United States Hawaii Kauai

56
Self-Employed Workers The Workforce Innovation and Opportunity Act (WIOA) is expected to improve labor market outcomes for workers through several channels, including enhanced services for workers who might have received limited assistance in the past. One category of workers targeted in WIOA is self-employed workers. Hawaii has slightly more self-employed workers than the national average, with the difference coming primarily from more self-employed workers in own not incorporated businesses. In the US, approximately 11.5% of males (4.7% in own incorporated business, 6.8% in own not incorporated business) and 7.3% of females (2.2% in own incorporated business, 5.1% in own not incorporated business) were self-employed, compared to 11.9% (4.3% in own incorporated business, 7.6% in own not incorporated business) and 8.9% (2.7% in own incorporated business, 6.2% in own not incorporated business), respectively, in Hawaii. Both males and females in Hawaii were slightly more likely to be unpaid family workers, as well. Kauai males and females were more likely than US males and females to be self-employed overall, particularly among self-employed females working in own not incorporated businesses; while there are around 1.5 percentage points more self-employed workers in Kauai for the other self-employed workers, female self-employed workers in own not incorporated businesses is 3.5 percentage points higher than the national average.
Another way to measure workers who are not traditionally employed is through the number of nonemployer establishments. A nonemployer establishment is a business that has no paid employees, has annual business receipts of $1,000 ($1 or more in the construction industries), and is subject to federal income taxes. Most nonemployers are self-employed individuals, but it also includes independent contractors who might not consider themselves self-employed. If a nonemployer establishment is considered a single (self-employed) worker, then the percentage of paid employees and annual payroll that nonemployer establishments make up is higher in Hawaii than in the US overall. These measurements reflect the higher rate of self-employment on Kauai, as Kauai’s nonemployer establishments make up a higher percentage of paid employees and annual payroll than in the US as a whole (26.2% of paid employees and 32.4% of annual payroll in Kauai, compared to 19.6% of paid employees and 18.1% of annual payroll in the US). With the percentage of annual payroll for nonemployer establishments higher than the percentage of paid employees that are nonemployer establishments, this means that nonemployer establishments take home more pay, on average, than paid employees.
0.0%
5.0%
10.0%
15.0%
20.0%
United States Hawaii Kauai United States Hawaii Kauai
Male Female
Class of Worker, Kauai
Self-employed, incorporated business Self-employed, not incorporated business

57
Data comes from the American Factfinder 2016 Business Patterns; this data is for 2016 only, and does not contain data from 2012-2015, unlike most of the other data in this report.
Underserved populations who are self-employed can be of particular concern for workforce development programs. In Hawaii, self-employed workers are more likely to have family income below the poverty line, have not completed a high school degree, speak English less than very well, or have a disability. Workers who work for wages at traditional jobs are more likely to be a veteran or Native Hawaiian or other Pacific Islander. Some of this is intuitive: those who have no high school degree, speak English less than well, or have a disability have barriers to traditional employment that might encourage them to become self-employed, instead. 12
Based on author’s calculations from the American Community Survey, 2012 to 2016
12 People who are neither self-employed workers or workers who work for wages, i.e. those who are not working, are all more likely to be underserved; in some cases, significantly more so. For example, over 30% of those who are not working are below the poverty line.
0.0%
5.0%
10.0%
15.0%
20.0%
25.0%
30.0%
35.0%
40.0%
Percentage of paid employees Percentage of Annual Payroll
Nonemployer Establishments, Kauai
United States Hawaii Kauai
0.0%2.0%4.0%6.0%8.0%
10.0%12.0%
Self-employed Works for wages
Percentage of Self-Employed that is Underserved
Below poverty line No HS degree
Speaks English less than well Veteran status
Disability status Native Hawaiian or other Pacific Islander

58
Youth One characteristic that has been associated with poor outcomes for children is having a single head of household; children in households with married couples tend to fare better than children with only a mother or father present. Children in households led by a single mother, in particular, do poorly on a variety of socioeconomic measures. In Hawaii, this is generally less of a concern; the percentage of children in married couple households was higher than the national average, 70.5 percent to 66 percent in 2016. The percentage of children in a household with a female head of household was almost 5 percentage points lower than the national average.
Children on Kauai were even less likely to be in households with female heads of households compared to the national average, by 10 percentage points. This was offset by a higher percentage of children in married couple households by 5 percentage points and households with male heads of households by 5 percentage points, compared to the national average.
Even more so, youth in Hawaii in each respective household tended to be less likely to be underserved than the national average (children in households led by a single female still were more likely to be in an underserved population than children in households with a married couple or led by a single male). Except for the percentage of youth that is Native Hawaiian or other Pacific Islander, Hawaii and Kauai youth were less likely to be disabled and less likely to in a household with income below poverty level in the past 12 months, in 2016. While children in married couple households and single male householder households were more likely to live in a household with public assistance, children in households with a single female householder had lower rates of using public assistance; across all households, children in Hawaii were less likely to be in a household with public assistance. One reason why children in households led by a single householder in Hawaii might do better than the national average is because a higher percentage of children in single householder households are in multigeneration households. In other words, even though the head of household is single, the children in said household is the grandchild of the head of the household, and so the child’s parent, who is the householder’s
0%10%20%30%40%50%60%70%80%90%
100%
United States Hawaii Kauai
Householder Type, Kauai

59
son or daughter, is also present and mitigating some of the problems associated with single householder outcomes.
Even though the youth in Hawaii were less likely to be disabled, less likely to live in a household with public assistance, and less likely to live in a household with income below poverty level, they’re more likely to not be enrolled in school or be idle (not enrolled in school and not employed). There was almost a 10 percentage point difference between males aged 16-19 school enrollment rates at the state and national level, and there was approximately a 5 percentage point different between females aged 16-19 school enrollment rate in 2016. This difference was even larger on Kauai, despite having a lower percentage of underserved youth. The percentage of males aged 16-19 and females aged 16-19 either not in school or idle on Kauai was nearly double that of the national average. Another major concern for youth on Kauai is the large number of children aged 3 to 17 that are not enrolled in school. While less than 10 percent of children aged 3 to 17 were not enrolled in school in the nation, on Kauai, more than 15 percent of children aged 3 to 17 were not enrolled in school.
0.0%
10.0%
20.0%
30.0%
40.0%
50.0%
60.0%
70.0%
Income in the past 12months below poverty level
Children living in householdswith public assistance
With any disability Native Hawaiian or otherPacific Islander
Underserved Youth by Householder Type, Kauai
0.0%5.0%
10.0%15.0%20.0%25.0%30.0%35.0%40.0%
Not enrolled inschool
Idle Not enrolled inschool
Idle Not enrolled inschool
Male 16 to 19 Male 16 to 19 Female 16 to 19 Female 16 to 19 Children 3 to 17
School Enrollment and Idleness, Kauai
US Hawaii Kauai
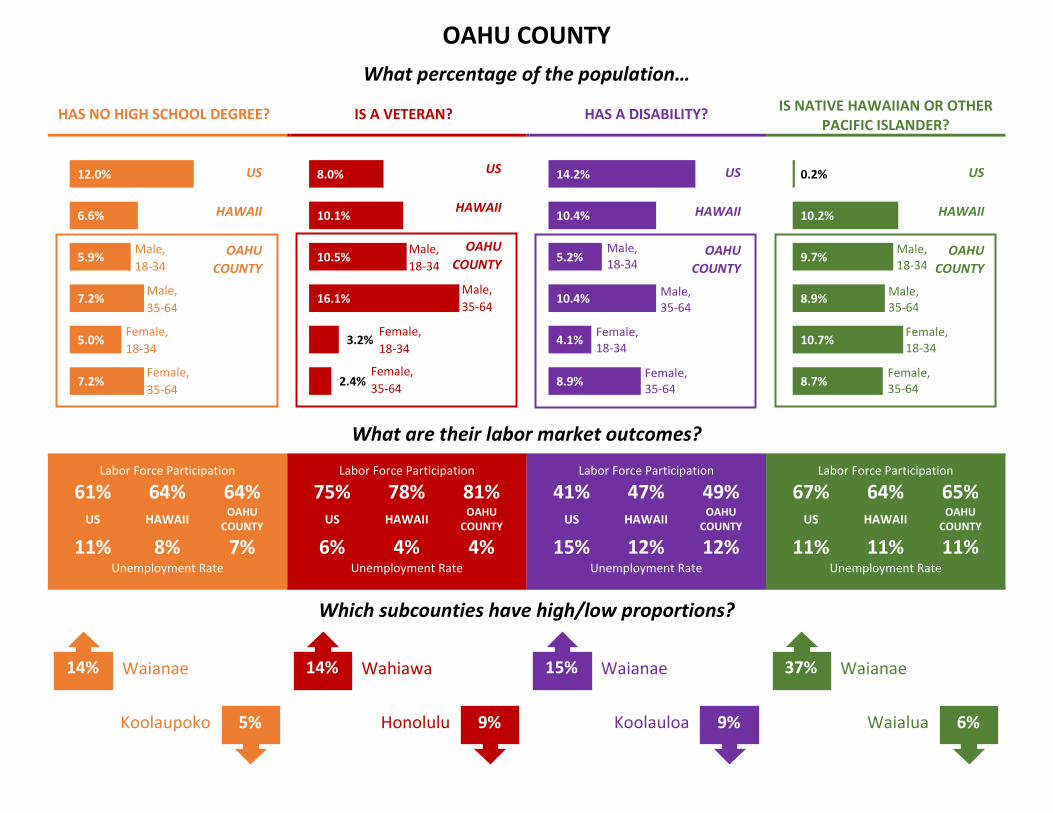
OAHU COUNTY What percentage of the population…
HAS NO HIGH SCHOOL DEGREE? IS A VETERAN? HAS A DISABILITY? IS NATIVE HAWAIIAN OR OTHER PACIFIC ISLANDER?
What are their labor market outcomes?
Labor Force Participation
61% 64% 64% US HAWAII OAHU
COUNTY
11% 8% 7% Unemployment Rate
Labor Force Participation
75% 78% 81% US HAWAII OAHU
COUNTY
6% 4% 4% Unemployment Rate
Labor Force Participation
41% 47% 49% US HAWAII OAHU
COUNTY
15% 12% 12% Unemployment Rate
Labor Force Participation
67% 64% 65% US HAWAII OAHU
COUNTY
11% 11% 11% Unemployment Rate
Which subcounties have high/low proportions?
12.0%
6.6%
5.9%
7.2%
5.0%
7.2%
8.0%
10.1%
10.5%
16.1%
3.2%
2.4%
14.2%
10.4%
5.2%
10.4%
4.1%
8.9%
0.2%
10.2%
9.7%
8.9%
10.7%
8.7%
US
HAWAII
OAHU COUNTY
US
HAWAII
OAHU COUNTY
Male, 18-34
Male, 35-64
Female, 35-64
Female, 18-34
14%
5% Koolaupoko
Waianae 15%
9% Koolauloa
Waianae 14%
9% Honolulu
Wahiawa 37%
6% Waialua
Waianae
Male, 18-34
Male, 35-64
Female, 35-64
Female, 18-34
Male, 18-34
Male, 35-64
Female, 18-34
US
HAWAII
OAHU COUNTY
Male, 18-34
Male, 35-64
Female, 35-64
Female, 18-34
US
HAWAII
OAHU COUNTY
Male, 18-34
Male,35-64
Female,35-64
Female, 18-34

HAWAII COUNTY What percentage of the population…
HAS NO HIGH SCHOOL DEGREE? IS A VETERAN? HAS A DISABILITY? IS NATIVE HAWAIIAN OR OTHER PACIFIC ISLANDER?
What are their labor market outcomes?
Labor Force Participation
61% 64% 56% US HAWAII HAWAII
COUNTY
11% 8% 11% Unemployment Rate
Labor Force Participation
75% 78% 64% US HAWAII HAWAII
COUNTY
6% 4% 9% Unemployment Rate
Labor Force Participation
41% 47% 36% US HAWAII HAWAII
COUNTY
15% 12% 15% Unemployment Rate
Labor Force Participation
67% 64% 59% US HAWAII HAWAII
COUNTY
11% 11% 12% Unemployment Rate
Which subcounties have high/low proportions?
12.0%
6.6%
9.4%
8.0%
8.6%
5.2%
US
HAWAII
HAWAIICOUNTY
Male,18-34
Male,35-64
Female,35-64
Female,18-34
8.0%
10.1%
6.5%
13.6%
1.4%
0.9%
US
HAWAII
HAWAIICOUNTY
14.2%
10.4%
6.3%
12.5%
6.8%
10.8%
US
HAWAII
HAWAIICOUNTY
0.2%
10.2%
16.2%
13.1%
16.7%
12.2%
US
HAWAII
HAWAIICOUNTY
Male, 18-34
Male, 35-64
Female, 35-64
Female, 18-34
11%
6% South Kohala
Paauhau-Paauilo 20%
10% Paauhau-Paauilo
Kau 14%
7% Paauhau-Paauilo
Pahoa-Kalapana 20%
2% North Hilo
Keaau-Mountain View
Male, 18-34
Male, 35-64
Female, 35-64
Female, 18-34
Male, 18-34
Male, 35-64
Female, 35-64
Female, 18-34
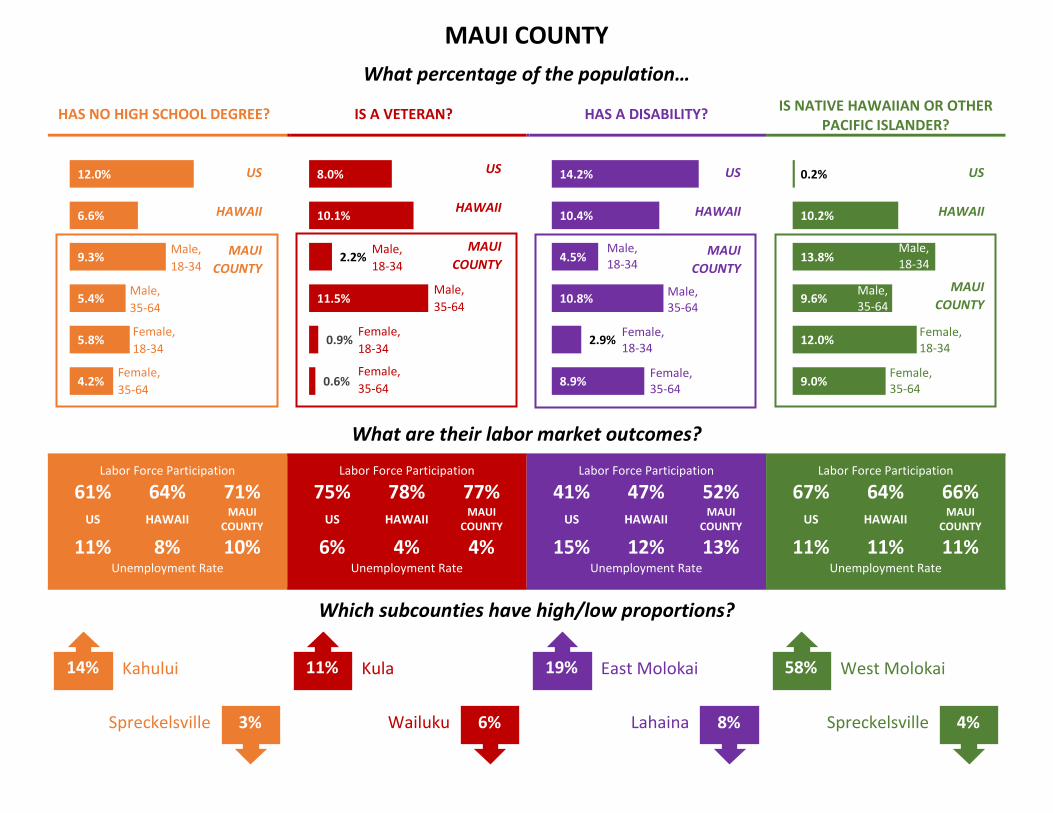
MAUI COUNTY What percentage of the population…
HAS NO HIGH SCHOOL DEGREE? IS A VETERAN? HAS A DISABILITY? IS NATIVE HAWAIIAN OR OTHER PACIFIC ISLANDER?
What are their labor market outcomes?
Labor Force Participation
61% 64% 71% US HAWAII MAUI
COUNTY
11% 8% 10% Unemployment Rate
Labor Force Participation
75% 78% 77% US HAWAII MAUI
COUNTY
6% 4% 4% Unemployment Rate
Labor Force Participation
41% 47% 52% US HAWAII MAUI
COUNTY
15% 12% 13% Unemployment Rate
Labor Force Participation
67% 64% 66% US HAWAII MAUI
COUNTY
11% 11% 11% Unemployment Rate
Which subcounties have high/low proportions?
12.0%
6.6%
9.3%
5.4%
5.8%
4.2%
8.0%
10.1%
2.2%
11.5%
0.9%
0.6%
14.2%
10.4%
4.5%
10.8%
2.9%
8.9%
0.2%
10.2%
13.8%
9.6%
12.0%
9.0%
US
HAWAII
MAUI COUNTY
14%
3% Spreckelsville
Kahului 19%
8% Lahaina
East Molokai 11%
6% Wailuku
Kula 58%
4% Spreckelsville
West Molokai
US
HAWAII
MAUI COUNTY
US
HAWAII
MAUI COUNTY
Male, 18-34
Male, 35-64
Female, 35-64
Female, 18-34
Male, 18-34
Male, 35-64
Female, 35-64
Female, 18-34
Male, 18-34
Male, 35-64
Female, 18-34
Male, 35-64
Female, 35-64
Female, 18-34
US
HAWAII
MAUI COUNTY
Male, 18-34
Male, 35-64
Female, 35-64
Female, 18-34

KAUAI COUNTY What percentage of the population…
HAS NO HIGH SCHOOL DEGREE? IS A VETERAN? HAS A DISABILITY? IS NATIVE HAWAIIAN OR OTHER PACIFIC ISLANDER?
What are their labor market outcomes?
Labor Force Participation
61% 64% 60% US HAWAII KAUAI
COUNTY
11% 8% 10% Unemployment Rate
Labor Force Participation
75% 78% 77% US HAWAII KAUAI
COUNTY
6% 4% 4% Unemployment Rate
Labor Force Participation
41% 47% 52% US HAWAII KAUAI
COUNTY
15% 12% 13% Unemployment Rate
Labor Force Participation
67% 64% 67% US HAWAII KAUAI
COUNTY
11% 11% 11% Unemployment Rate
Which subcounties have high/low proportions?
12.0%
6.6%
9.1%
7.6%
6.9%
4.8%
8.0%
10.1%
3.2%
10.9%
0.7%
1.0%
14.2%
10.4%
4.4%
9.0%
2.6%
6.9%
0.2%
10.2%
14.3%
9.0%
12.1%
7.8%
US
HAWAII
KAUAI COUNTY
12%
5% Kapaa
Kekaha-Waimea 15%
8% Hanalei
Lihue 10%
7% Puhi-Hanamaulu
Kekaha-Waimea 22%
5% Koloa-Poipu
Kekaha-Waimea
US
HAWAII
KAUAI COUNTY
US
HAWAII
KAUAI COUNTY
Male, 18-34
Male, 35-64
Female, 35-64
Female, 18-34
Male, 18-34
Male, 35-64
Female, 35-64
Female, 18-34
Male, 18-34
Male, 35-64
Female, 18-34
Male, 35-64
Female, 35-64
Female, 18-34
US
HAWAII
KAUAI COUNTY
Male, 18-34
Male, 35-64
Female, 35-64
Female, 18-34