![UK Withdrawal from the European Union (Continuity ... · SP Bill 77 Session 5 (2020) UK Withdrawal from the European Union (Continuity) (Scotland) Bill [AS INTRODUCED] CONTENTS. Section](https://static.fdocuments.net/doc/165x107/600de2f78baa576e5d77fc86/uk-withdrawal-from-the-european-union-continuity-sp-bill-77-session-5-2020.jpg)
THE UK & THE EUROPEAN UNION - Choose your...
161
The UK & The European Union Report – ICM Research 1/1 THE UK & THE EUROPEAN UNION NOVEMBER 2002
Transcript of THE UK & THE EUROPEAN UNION - Choose your...

The UK & The European Union Report – ICM Research
1/1
THE UK & THE
EUROPEAN UNION
NOVEMBER 2002
The UK & The European Union Report – ICM Research
2/2
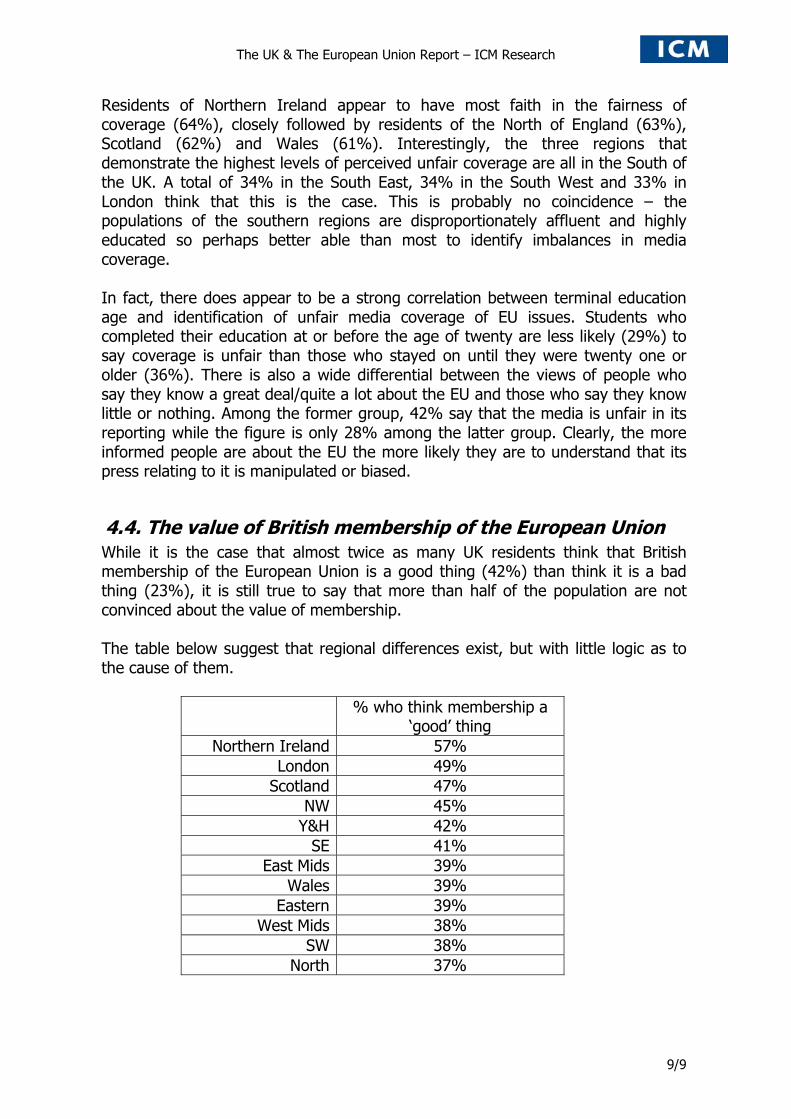
1. Table of contents Page Methodology 3 Summary on a page 4 Research results 5 4.1 Knowledge of the EU – Depth 5 4.2 Knowledge of the EU – Source 6 4.3 Media coverage of the EU 8 4.4 The value of British membership of the EU 9 4.5 Has the UK benefited from EU membership? 11 4.6 Attitudes toward scrapping the EU 12 4.7 Where should decisions be made? 14 4.8 Level of support for potential policy decisions 16 4.9 Trust in institutions 17 5 Appendix 19 6. Tabular results 23

The UK & The European Union Report – ICM Research
3/3
2. Methodology ICM Research interviewed a random sample of 6,029 people aged 15+ by
telephone between 8th-26th November 2002. Equal numbers of interviews were
achieved in each Government Office region of the country thereby enabling
statistical comparisons between the regions. Data within each region was
weighted to the profile of all adults in that area. To obtain data representative of
the whole country, data was then weighted to reflect the actual proportion of the
total population living in each area.
NORTH.................................. 504 INTERVIEWS
NORTH WEST........................ 503 INTERVIEWS
YORKS & HUMBERSIDE ........ 505 INTERVIEWS
EAST MIDLANDS................... 507 INTERVIEWS
WEST MIDLANDS.................. 504 INTERVIEWS
EASTERN............................... 501 INTERVIEWS
GREATER LONDON ............... 500 INTERVIEWS
SOUTH EAST ......................... 502 INTERVIEWS
SOUTH WEST ........................ 503 INTERVIEWS
WALES .................................. 500 INTERVIEWS
SCOTLAND ............................ 500 INTERVIEWS
NORTHERN IRELAND............ 500 INTERVIEWS
TOTAL (UK)........................... 6,029 INTERVIEWS

The UK & The European Union Report – ICM Research
4/4
3. Summary on a page �� The UK public knows little about the European Union as an institution, or
indeed about its policies. One in three (29%) say they know nothing about it, while 58% say they know a little. Just one in ten (12%) say that they know either a great deal or quite a lot.
�� Television (78%) is relied on the most as a source of EU news and
information, but almost as many also use daily newspapers (72%). Leaflets and brochures are used by about three in ten, but twice as many would actually prefer to use these sources.
�� Well over half of the UK public think that the media provide fair coverage of
the European Union. Less than one in three think that it is unfair. �� Less than half of the UK population think that British membership of the
European Union is a good thing (42%), despite twice as many thinking that membership it is a good thing compared to those who think it is a bad thing. There are real regional differences involved – people in Northern Ireland are much more positive about the EU, as are Londoners and Scots - than people living in areas including the North of England and the South West.
�� Slightly more people think that British membership of the EU has been
beneficial than think it has been detrimental to our interests. Again, there are significant regional differences in opinion, with people in Northern Ireland, London and Scotland upbeat about British membership. However, the inhabitants of six other regions, including Yorkshire and Humberside and Eastern, are inclined to think that Britain has not benefited.
�� Nearly half the population would be indifferent if the EU were scrapped.
Slightly more (27%) would be more sorry than pleased (22%). �� Fighting terrorism should be the decision-making domain of the EU according
to seven in ten. Other areas where the EU receives strong (although not quite majority) support as the primary decision making body include protecting the environment, and fighting organised crime and drug trafficking – all policy areas that render national boundaries irrelevant.
�� The EU is trusted by just under half of the population. While it is not trusted
quite as much as traditionally impartial UK institutions like the civil service or broadcast media, or indeed political frameworks like the House of Commons, it is still trusted more than overtly political organisations including the government, trade unions and political parties.

The UK & The European Union Report – ICM Research
5/5
4. Research Results
4.1 Knowledge of the EU – Depth There is little doubt that the British public are largely ignorant about most aspects of the European Union, and they have little hesitation in admitting it. In fact, overwhelming swaths of the public (87%) say that they know either a little (58%) or nothing (29%) about its institutions and policies. Only one in ten (11%) think that they know quite a lot, while a tiny proportion (1%) say they know a great deal about it. The findings are very consistent across the regions, with the slightly more educated and affluent residents of London (15%) and the South East (13%) a little more likely to say that they know ‘quite a lot’. The chart below demonstrates how patterns of knowledge about the EU are relatively consistent across the regions. Q1. How much do you feel you know about the EU, its policies, its
institutions? Would you say….
1 1 1 1 2 2 1 2 2 2 2 1 1
11 9 9 10 12 10 13 15 13 12 8 116
5855 56 57
5855
5961 61 58
5556
57
2935 33 31 28
3328
22 24 2736 31
36
0%
20%
40%
60%
80%
100%
Total
North NW
Y&H
East
Mid
s.
West
Mid
s.
East
ern
Londo
n SESW
Wale
s
Scot
land NI
Great deal Quite a lot A little Nothing
Base: All respondents (6,029)

The UK & The European Union Report – ICM Research
6/6
Variations in response are apparent, however, when it comes to demographic analysis, particularly in relation to sex, age, and terminal education age. When it comes to gender, men are much less likely to admit to knowing nothing at all (23%) compared to women (36%), with men (16%) also more than twice as likely as women (7%) to say that they know ‘quite a lot’. Knowledge of the EU, however slight, appears to increase with age. The table below shows that there is a gradual, but consistent growth in the depth of knowledge, as people get older.
% who know a great deal/
quite a lot 15-24 9% 25-34 9% 35-44 12% 45-54 14% 55-64 16%
65+ 16% The level of EU knowledge increases more dramatically when it comes to educational achievement, as one might expect. Only 9% of school-leavers under the age of 16 years say they know a great deal or quite a lot about the EU, but the level rises consistently with terminal education age – to 12% among 17-18 year old leavers, 14% among 19-20 year old leavers, and to 24% among 21+ year olds (all of whom, we can presume are educated to degree level). If the EU were scrapped, knowledgeable people would be more sorry than pleased. A total of 22% of those who know a great deal/a lot about the EU say they would very sorry, while 16% would be pleased. 7% would be indifferent. Clearly, if the EU were better able to educate people in the UK about what it does, it would see incremental increases in the level of support it receives.
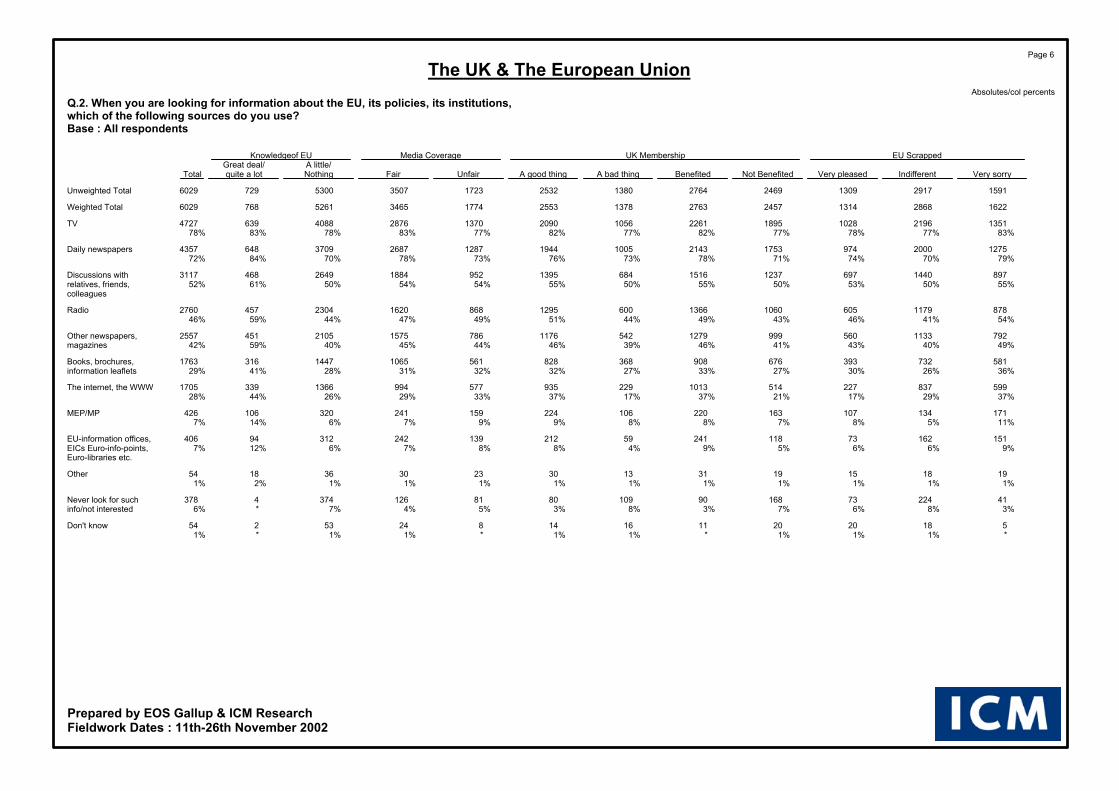
4.2 Knowledge of the EU – Source Given that the level of knowledge is so low, it would appear that the sources of information available to people have a negligible impact. This is not to say that they do not use many sources, however, because on average, a total of 3.6 sources are used to gather information on the EU. Foremost among these is TV. The chart below shows that three-quarters (78%) use the medium as a source for their EU information, with older age groups most likely of all to depend on it (81% of 55-64 year olds), although of course, it is probably the case they watch more TV and read more newspapers than other age groups. Daily newspapers are used by almost as many (72%) as the TV. As with the TV, older people are more likely to rely on newspapers, Metropolitan dwellers (who

The UK & The European Union Report – ICM Research
7/7
are presumably reading their newspaper while commuting in and out of work), are also highly likely to use the newspaper (77%) as a source. Other sources are used much less. Just over half (52%) say they have discussions with friends and colleagues, just less than half (46%) get it from the radio and 42% get information from other newspapers (Sunday’s) and magazines. Sources which are more ‘direct’ – those that require a decision to actively pursue the information, are used by very few, with the exception of the internet, which a quarter (28%) say they have used to find information of the EU. As for the others, less than one in ten (7%) has sought out their own MEP or MP, while a similar number (7%) has visited EU information offices, info-points or Euro-libraries.
Q2. When you are looking for information about the EU, its policies, its institutions, which of the following sources do you use?
Q3. In general, how would you prefer to get information about the EU?
7872
5246
42
29 28
7 71
6
7570
4946
59
36
0 04 4
0
10
20
30
40
50
60
70
80
90
TV
Daily newsp
apers
Discuss
ions
Radio
Other n
ewsp
apers
/mags.
Books/b
roch
ures/
leafle
ts
The Inte
rnet
MEP/MP
EU info
. Offi
ces
Other
Never l
ooked/D
on't want i
nfo.
Sourcesused
Sourcesprefer
Base: All respondents (6,029)
As one might expect, there is a high correlation between sources actually used, and sources people would prefer to use. For example, while 78% actually use the TV, only very slightly fewer (75%) would prefer to use. The same applies to daily newspapers – 72% actually use them and 70% would prefer to use them. The only real differentials that arise relate to the use of books, brochures and leaflets, and use of the Internet. With regard to the former, less than one in three

The UK & The European Union Report – ICM Research
8/8
(29%) actually use them for information, but considerably more (59%) would like to use them. While a quarter 28% says they actually use the Internet, a total of 36% would prefer to get information in this way. This is probably not so much to do with an inability to get online, but more with a deliberate decision to get this information in this way. For example, a considerably higher than average 48% of Londoners say they would prefer to get their information via the Net. London as a region has the highest level of Internet penetration in the UK, permitting the inference that a deliberate decision to seek out information on the EU has been made among many people who already have access.
4.3.Media coverage of the European Union Twice as many people think that UK media coverage of the EU is fair (57%) than think it is unfair (29%). Of those who do think it’s fair, only a small proportion (6%) think is it ‘very fair’, whilst the remainder (52%) think it is merely ‘quite fair’. Similarly, of those who don’t think coverage is fair, one in five (21%) think it is ‘not very fair’ whilst the remaining 9% think coverage is ‘not at all fair’. The chart below shows how the pattern of response varies by region.
Q4. How fairly do you think the media cover European Union affairs?
5764 63 62 61 60 60 59 58 57 54 53 51
2925 24 27 26 28 27 27 29 33
34 30 34
13 11 14 10 13 12 13 14 13 10 13 17 15
0%
20%
40%
60%
80%
100%
Tota
l NI
North
Scotla
ndW
ales
Wes
t Mid
s.
East
ern
NW
East
Mid
s.
London SW
Y&H SE
Fairly Unfairly DK
Base: All respondents (6,029)
The UK & The European Union Report – ICM Research
9/9
Residents of Northern Ireland appear to have most faith in the fairness of coverage (64%), closely followed by residents of the North of England (63%), Scotland (62%) and Wales (61%). Interestingly, the three regions that demonstrate the highest levels of perceived unfair coverage are all in the South of the UK. A total of 34% in the South East, 34% in the South West and 33% in London think that this is the case. This is probably no coincidence – the populations of the southern regions are disproportionately affluent and highly educated so perhaps better able than most to identify imbalances in media coverage. In fact, there does appear to be a strong correlation between terminal education age and identification of unfair media coverage of EU issues. Students who completed their education at or before the age of twenty are less likely (29%) to say coverage is unfair than those who stayed on until they were twenty one or older (36%). There is also a wide differential between the views of people who say they know a great deal/quite a lot about the EU and those who say they know little or nothing. Among the former group, 42% say that the media is unfair in its reporting while the figure is only 28% among the latter group. Clearly, the more informed people are about the EU the more likely they are to understand that its press relating to it is manipulated or biased.
4.4. The value of British membership of the European Union While it is the case that almost twice as many UK residents think that British membership of the European Union is a good thing (42%) than think it is a bad thing (23%), it is still true to say that more than half of the population are not convinced about the value of membership. The table below suggest that regional differences exist, but with little logic as to the cause of them.
% who think membership a ‘good’ thing
Northern Ireland 57% London 49%
Scotland 47% NW 45%
Y&H 42% SE 41%
East Mids 39% Wales 39%
Eastern 39% West Mids 38%
SW 38% North 37%

The UK & The European Union Report – ICM Research
10/10
Northern Ireland (57%) is the only region in which a majority believe that membership is good, although Londoners (49%) and Scots (47%) are not far away from majorities. The North and the South West – two regions as geographically far apart as any – demonstrate the lowest belief that membership is a good thing. When it comes to demographics, more consistent patterns of response are observable. As the chart below demonstrates, men (42%) are (statistically) significantly more likely to think membership is a good thing compared to women (37%), while membership is thought to be less of a good thing, as people get older. It is also the case that metropolitan dwellers are much more positive (50%) toward UK membership than are town or urban dwellers (42%) or indeed rural dwellers (39%).
Q5. Generally speaking, do you think that the UK’s membership of EU is…..
4248
37
52 4843 42 38
31
2823
32
34
31
3026
24
19
23 2421
812
19 2631
40
7 5 9 6 9 8 5 6 9
0%
20%
40%
60%
80%
100%
Total Men Women 15-24 25-34 35-44 45-54 55-64 65+
A good thing Neither good nor bad A bad thing DK
Base: All respondents (6,029)
The UK & The European Union Report – ICM Research
11/11
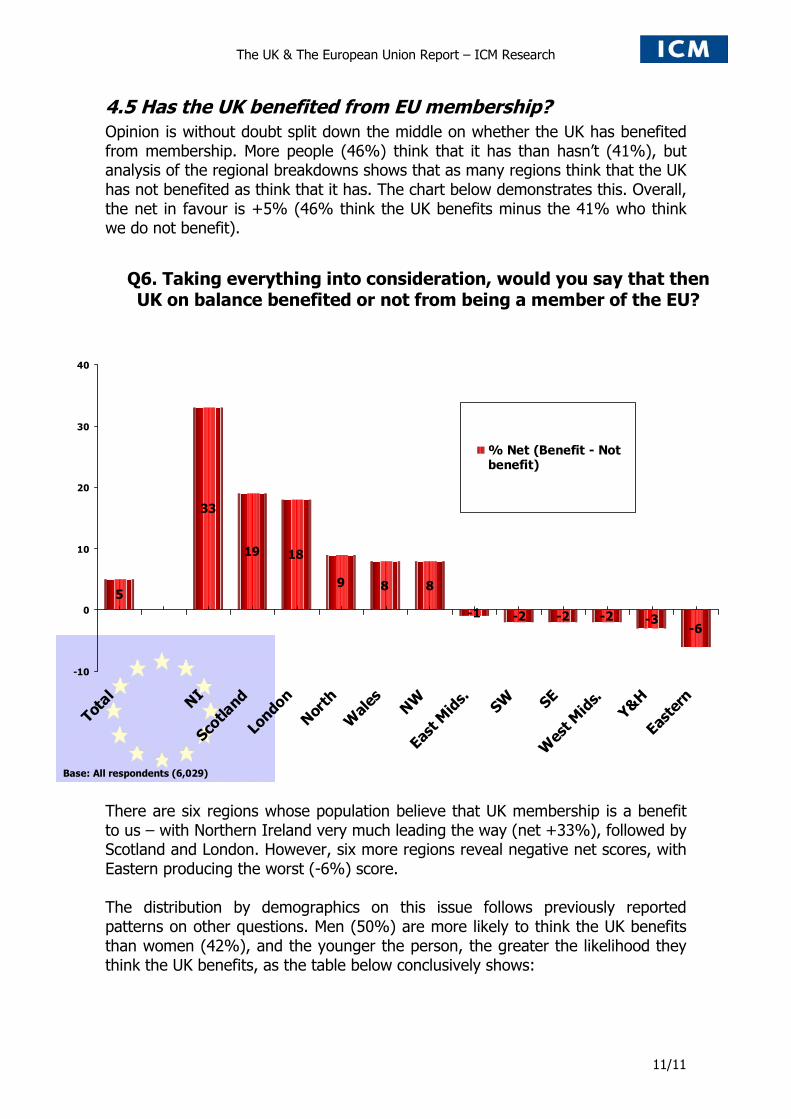
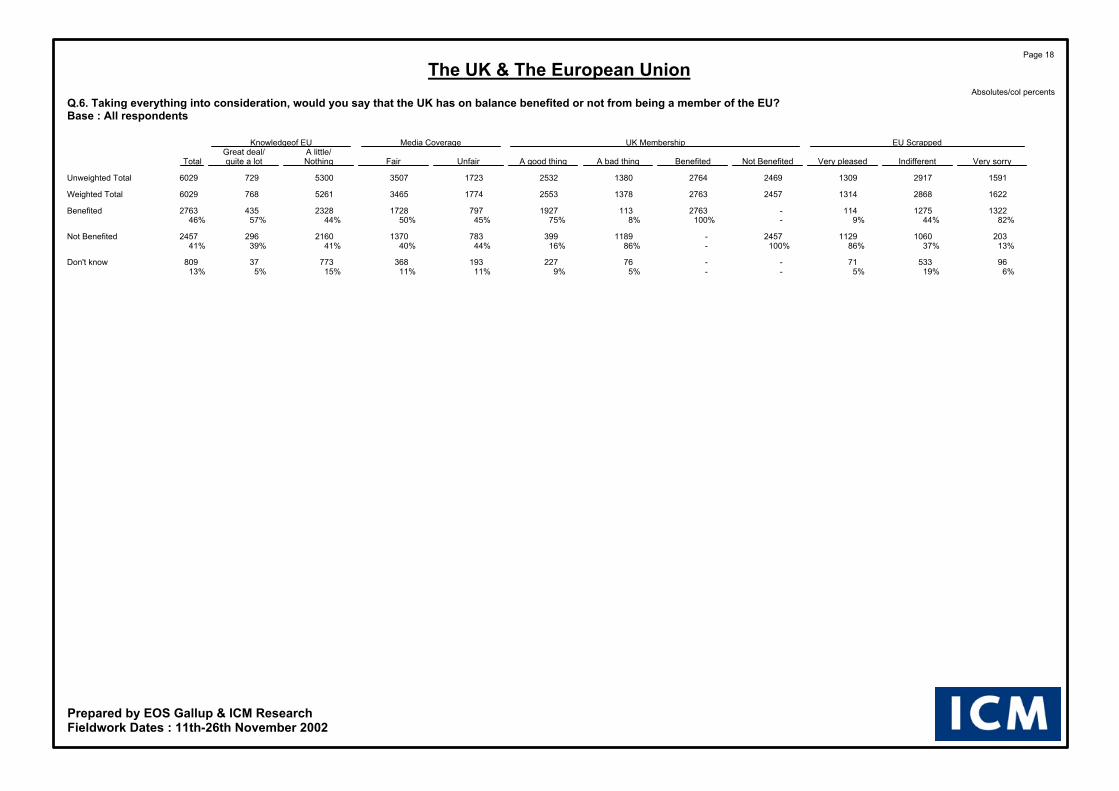
4.5 Has the UK benefited from EU membership? Opinion is without doubt split down the middle on whether the UK has benefited from membership. More people (46%) think that it has than hasn’t (41%), but analysis of the regional breakdowns shows that as many regions think that the UK has not benefited as think that it has. The chart below demonstrates this. Overall, the net in favour is +5% (46% think the UK benefits minus the 41% who think we do not benefit).
Q6. Taking everything into consideration, would you say that then UK on balance benefited or not from being a member of the EU?
5
33
19 18
9 8 8
-1 -2 -2 -2 -3-6
-10
0
10
20
30
40
Total
NI
Scotla
nd
London
North
Wale
sNW
East M
ids. SW SE
Wes
t Mid
s.Y&H
Easte
rn
% Net (Benefit - Notbenefit)
Base: All respondents (6,029)
There are six regions whose population believe that UK membership is a benefit to us – with Northern Ireland very much leading the way (net +33%), followed by Scotland and London. However, six more regions reveal negative net scores, with Eastern producing the worst (-6%) score. The distribution by demographics on this issue follows previously reported patterns on other questions. Men (50%) are more likely to think the UK benefits than women (42%), and the younger the person, the greater the likelihood they think the UK benefits, as the table below conclusively shows:

The UK & The European Union Report – ICM Research
12/12
% who think UK benefits 15-24 60% 25-34 51% 35-44 48% 45-54 45% 55-64 40%
65+ 32% Those people who say they think they know a great deal/a lot about the EU are also more most likely to think the UK benefits (57%), which suggests that a well targeted information campaign is likely to produce positive results. Three quarters (75%) of the people who think the UK’s membership is a good thing believes that it has benefited from membership, although more, (86%) of those who think UK membership is a bad thing think we have not benefited.
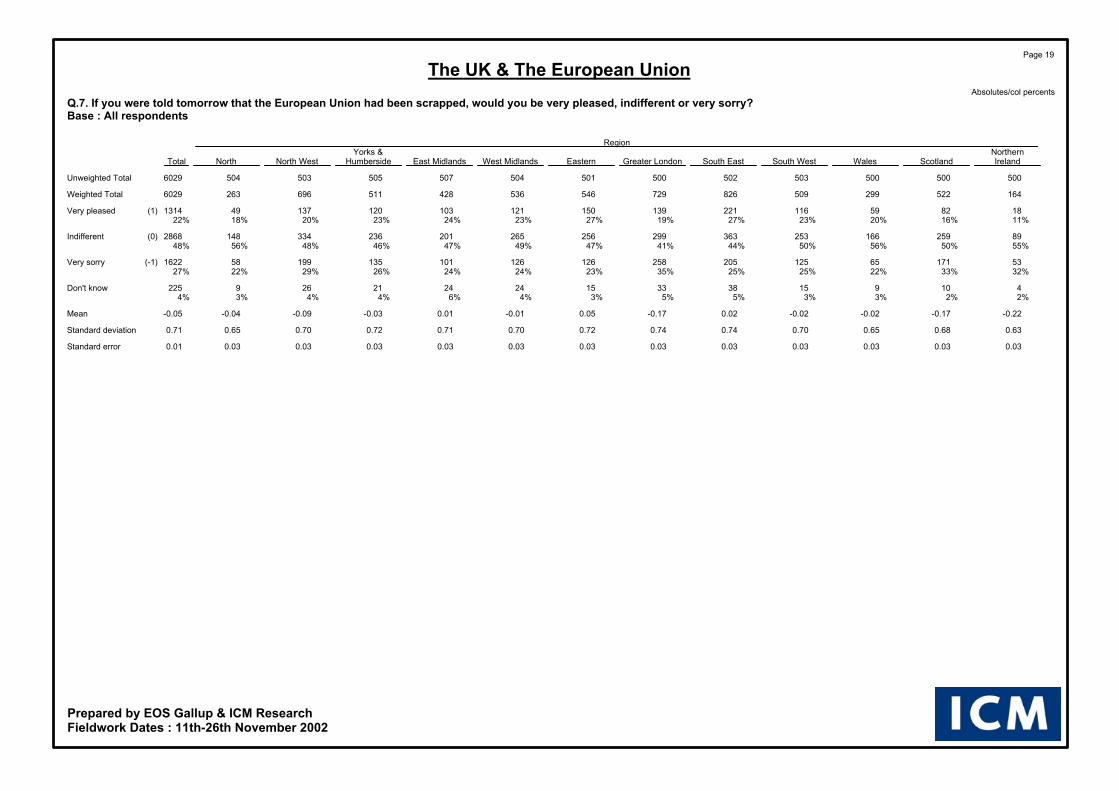
4.6 Attitudes toward scrapping the EU More people would currently be sorry (27%) than pleased (22%) if the EU were scrapped, but given the level of indifference (48%), it is clear that it would cause little in the way of consternation in the UK. The chart below shows how there remains pockets of strong support for the EU in Northern Ireland, Scotland and London amongst other places, but that the Eastern region and South East are hotspots of opposition.
5
2117 16
94 3 2 2 1 0 -2 -4
-10
0
10
20
30
40
Total
NI
Scotla
nd
London
NWNor
thY&H
Wal
es SW
Wes
t Mid
s.
East M
ids. SE
Easte
rn
% Net (very sorry minusvery pleased)
Base: All respondents (6,029)
Q7. If you were told tomorrow that the EU had been scrapped, would you be very pleased, indifferent or very sorry?

The UK & The European Union Report – ICM Research
13/13
However, the chart below suggests that this measure is likely to move in a positive direction in the future (if only by default), as older people dominate the age profile of those who would be pleased to see it scrapped now. As the older generation passes away, the new cohort will be more apathetic and indifferent (62% of 15-24 year olds say they would be indifferent), thereby turning the public opinion tide in a more positive direction. The problem then, of course, becomes the attempt to motivate an electorate which simply does not care about the EU, rather than outwardly antagonistic toward it.
Q7. If you were told tomorrow that the EU had been scrapped, would you be very pleased, indifferent or very sorry?
22
6 1016
2533
41
48
62 5754
4437
32
27 28 2927 27 26 25
4 5 5 3 4 4 3
0%
20%
40%
60%
80%
100%
Total 15-24 25-34 35-44 45-54 55-64 65+
Very pleased Indifferent Very sorry DK
Base: All respondents (6,029)

The UK & The European Union Report – ICM Research
14/14
4.7 Where should decisions be made? Fighting unemployment is conclusively thought to be something that should fall within the sphere of UK government policy making. Overall, 80% think that this should be the case, with only one in five (18%) saying that decisions on this should be made at EU level. This is arguably the only area that could be called ‘off limits’ as far as EU involvement is concerned. There are a number of other areas where around one in three think that decision-making should be made at European level. This is the case with tackling the challenges of an aging population (34%), protecting consumers (39%) and fighting poverty and social exclusion (39%).
Q10. For each of the following areas, do you think that the decisions should be made by the UK government, or at European Union level?
57
58
62
80
39
39
34
18
4
3
3
2
0% 20% 40% 60% 80% 100%
Fighting poverty andsocial exclusion
Protecting consumers &guaranteeing quality of
other products
Tackling the challengesof an ageing population
Fighting unemployment
By UK Government At European level DK
Base: All respondents (6,029)
Whilst the influence of the EU could be argued to be formative on the issues shown in the chart above, when it comes to the other issues we asked about – which are shown on the chart overleaf- its influence could be said to be already strong. They include fighting terrorism, crime and drug trafficking and protecting the environment. The majority of these areas involve practical considerations that extend beyond the concept of national boundaries, something that appears to have been perceived by the UK public given the pattern of their response.

The UK & The European Union Report – ICM Research
15/15
Fighting terrorism is seen to be a pan-European issue, for which collusion between governments (that only the EU is best able to ensure on the European continent) is necessary. Two in three (69%) think that decisions should be taken at EU level on this issue – a significantly higher proportion than for all other policy areas. However, more people think that the EU should be responsible for protecting the environment than think the UK government should be, whilst an exact split between the two is produced for fighting organised crime and drug trafficking. More people still think that the UK government should be responsible for guaranteeing rights and guaranteeing food quality, but one might imagine that it might not be long before a majority is more in favour of EU decision making.
Q10. For each of the following areas, do you think that the decisions should be made by the UK government, or at European Union level?
28
48
49
52
54
69
50
49
44
44
3
2
2
4
2
0% 20% 40% 60% 80% 100%
Fighting terrorism
Protecting theenvironment
Fighting organised crime& drug trafficking
Guaranteeing individualsrights & respect for
democracy principles
Guaranteeing foodquality
By UK Government At European level DK
Base: All respondents (6,029)

The UK & The European Union Report – ICM Research
16/16
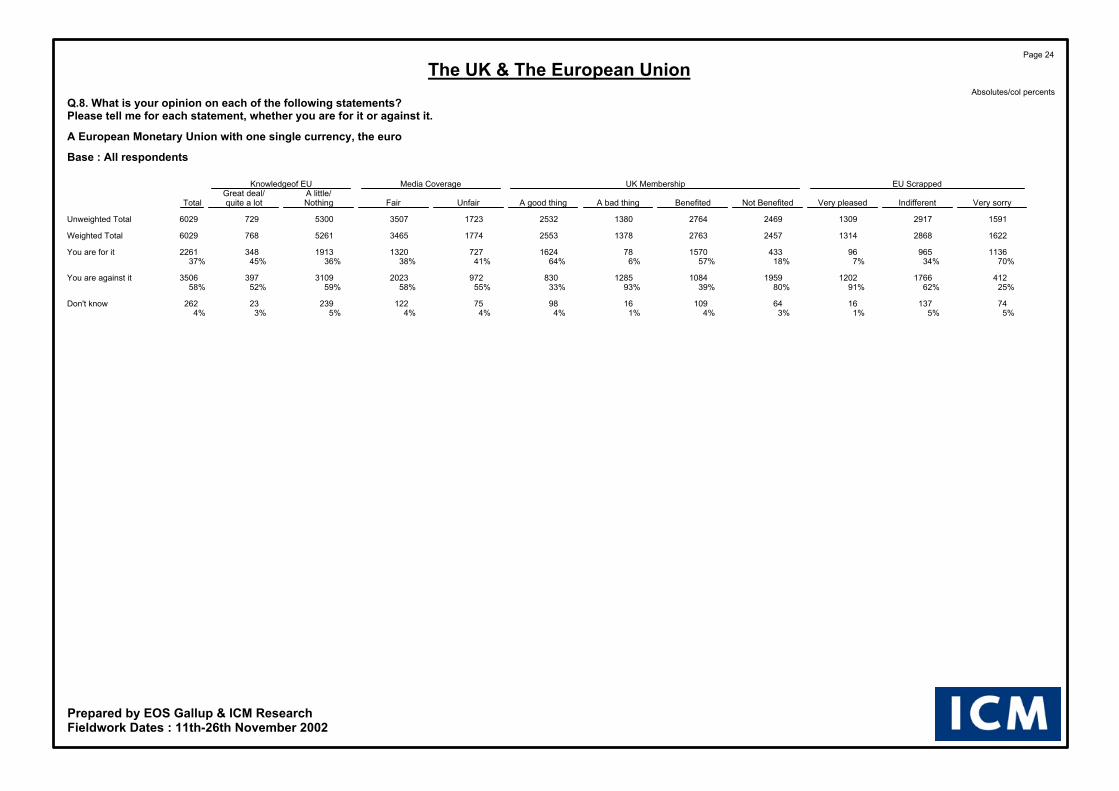
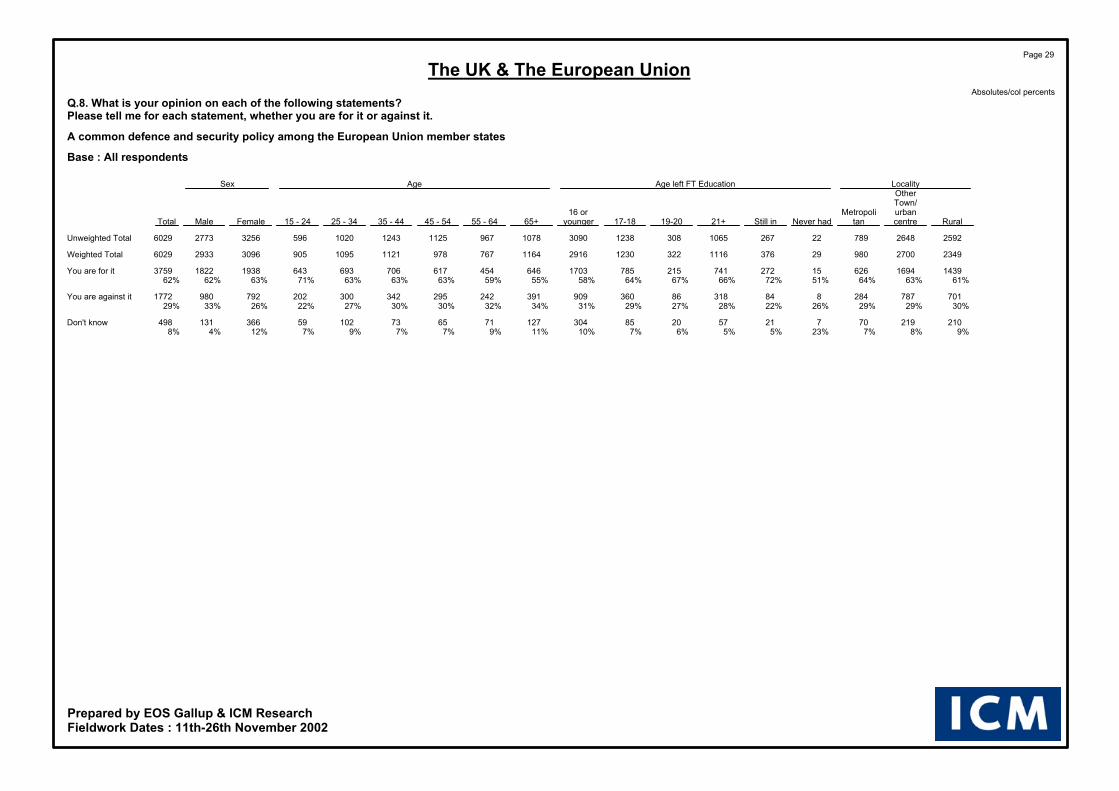
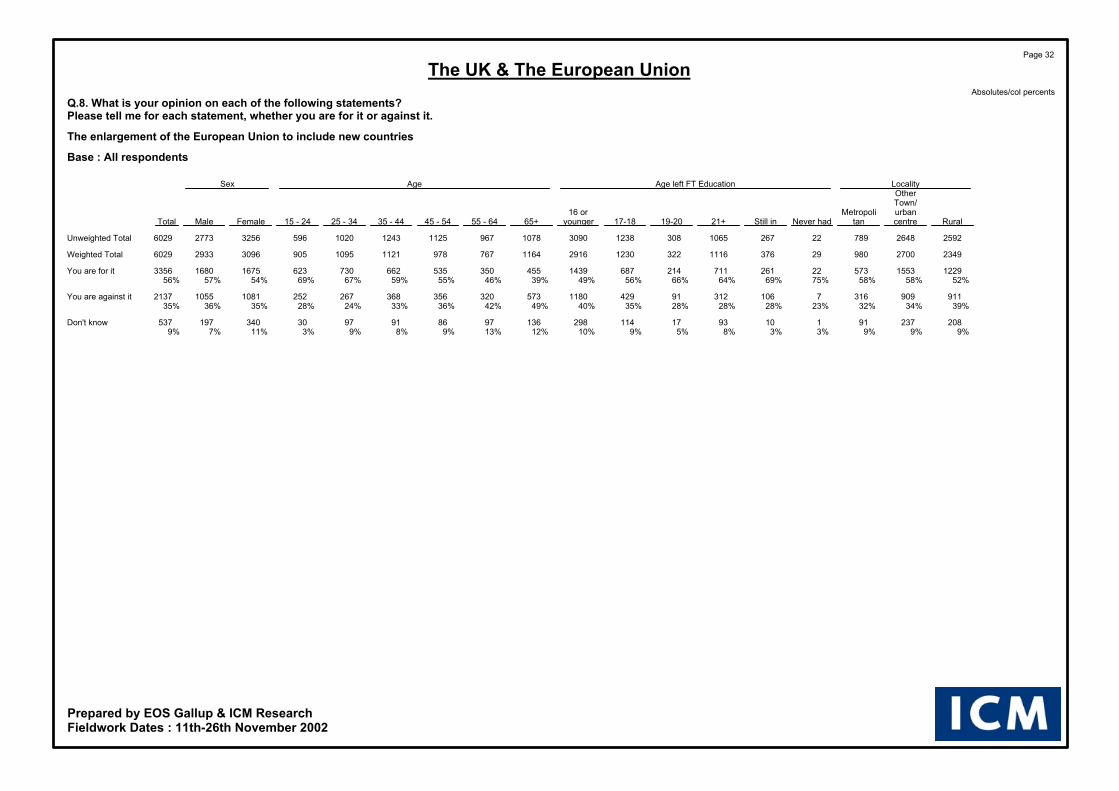
4.8 Level of support for potential policy decisions There is widespread support for many EU policy proposals. Foremost amongst them, is the idea to teach school children about the framework of EU institutions, which is supported by almost nine in ten (86%) of the UK public. This is easily the most well supported proposal, but three more – the resignation of the President and Commission if they lose the support of the Parliament (66%), a common defence and security policy (62%), and EU enlargement (62%) – receive support from two in three.
Q8. What is your opinion for each of the following statements? For each one, please tell me whether you are for or against it.
37
43
47
56
62
66
86
58
48
43
35
29
21
11
4
9
10
9
8
13
3
0% 20% 40% 60% 80% 100%
Monetary union
Common foreign policy
EU responsible for othermatters ineffectively handled
by national governments
EU enlargement
Common defence and security
Resignation of EC President &Commisoners if not supported
by European Parliament
Teaching children about wayEU institutions work
For Against DK
Base: All respondents (6,029)
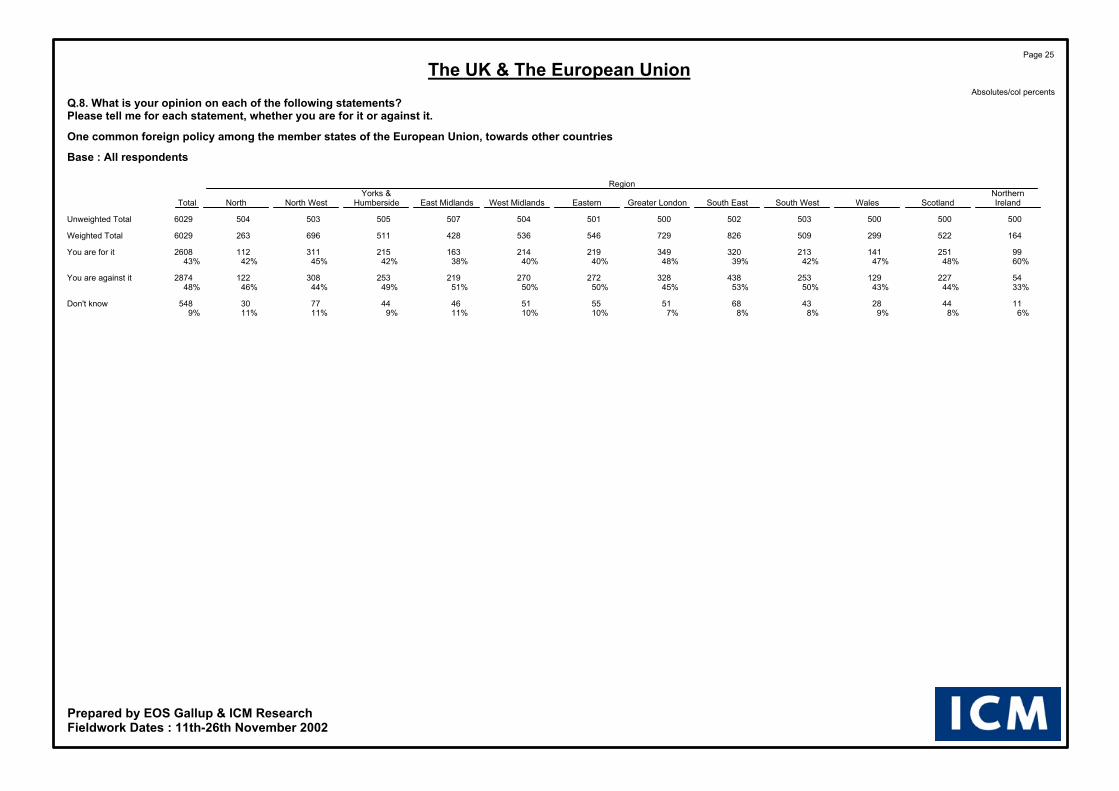
There is one other policy where more people are in favour than against, but which still fails to achieve majority backing. Just under half (47%) support the idea that the EU should be responsible for matters that national governments have failed to handle effectively. More people are against a common foreign policy, with 48% saying this is the case compared to 43% who are in favour. Given the determination of the British government to retain decision-making in this kind of area, it is something of a surprise that the result is so tight. However, it appears that the public in the UK

The UK & The European Union Report – ICM Research
17/17
realise that increasing levels of cooperation are required in a modern political landscape in which threats are levelled at EU members as an entity rather than as independent states. The only area where the public remain decisively against is that of monetary union. The level of support for British entry into the single currency has been measured (by ICM) for over ten years, and support for it does not often rise over the 30% mark. (Full month-by-month trend analysis using the ICM question can be found at http://www.icmresearch.co.uk/reviews/vote-intention-reports/single-currency-trends.htm). However, this latest question has produced something of a more favourable response, with 37% saying they are for monetary union, with one single currency. This probably remains well below the level needed to convince the Prime Minister to call a referendum on the issue in the short term, but will no doubt be well received by the ‘yes’ camp none the less.
4.9 Trust in institutions The European Union is trusted by less than half (43%) of the UK public, which is less than British political institutions like the British Parliament (48%) and Civil Service (50%), but more than the British government or indeed political parties (17%) in general.
Q9. I would like to ask you a question about how much trust you have in certain institutions. For each of the following institutions, please tell me if you tend to trust it or tend not to trust it?
17
18
25
38
39
40
43
48
50
65
66
72
78
78
68
44
52
55
46
47
42
27
29
21
5
3
7
18
10
5
11
5
8
8
4
7
0% 20% 40% 60% 80% 100%
Political parties
The press
Big companies
NGO's
Trade unions
The British government
European union
The British Parliament
The civil service
Radio
Television
United Nations
Tend to trust Tend not to trust DK
Base: All respondents (6,029)

The UK & The European Union Report – ICM Research
18/18
Trust in the EU more or less follows a pattern evident within answers to other questions. Residents of Northern Ireland (62%) display the greatest level of support (trust) in the EU, followed by Scots (50%) and Londoners (48%). People in the South East (51%), Yorkshire and Humberside (51%) and the Eastern (49%) regions show the highest level of distrust. Breakdown by age also shows a familiar pattern. The table below shows that people are less trustful of the EU the older they are. The question, of course, is whether the current oldest cohort is alone in its distrust of the EU or whether people become more distrustful of it as they get older? The former is more likely to be the case, and one might hypothesise that distrust in the EU gradually dissipates over time.
% who trust the EU
15-24 69% 25-34 54% 35-44 40% 45-54 39% 55-64 31%
65+ 26%
When it comes to the other institutions, the survey answers match what one might have intuitively expected. The United Nations is perceived to be the most trustworthy institution (72%), followed television (66%) and radio (65%). In the UK, most television and radio stations are legally obliged to be impartial, and the public, (despite the scepticism of up to one in three), largely accepts this. Institutions that are perceived to be overtly political in nature are naturally trusted less. Hence the British government is trusted less than the institutional framework of government (the parliament), while trade unions (39%), NGO’s (38%), big companies (25%), the written press (18%) and most especially political parties (17%) are trusted by even fewer people. Of course, most people in the UK are deeply cynical when it comes to politics. Most have little time or interest in politics, and few people admire politicians. Party politics – and politicians - are increasingly viewed with disdain, and voter apathy has increased significantly over the last decade. For these reasons, it is inevitable that political parties are the least trusted institution, if only by a slight margin from the press, which is correctly perceived to be biased in its reporting of political issues and viewed with equal cynicism by many people.

The UK & The European Union Report – ICM Research
19/19
Appendix – the questionnaire in CATI format (Computer Assisted Telephone Interviewing) Introduction: Good evening, my name is .........,I'm calling from ICM Research the independent market research company. We are conducting a research project which requires us to talk to a representative sample of people throughout the country on issues that affect all people. We have selected your telephone number purely at random and would greatly appreciate your help for a few minutes to answer some simple questions. IF RESPONDENT SOUNDS LIKE THEY WANT TO REFUSE SAY: For the purpose of our research project it is most important that we talk to a representative cross section of all people. Therefore, your views are extremely important to us and the interview will only take a few minutes of your time. IF RESPONDENT STILL SOUNDS LIKE THEY WANT TO REFUSE, SAY: If you cannot spare the time at the moment I would really appreciate it if we could call you back at your own convenience over the next ... days. As I say, your own views are very important to us.' Q.1. How much do you feel you know about the European Union, its policies, its institutions? Would you say that... READ OUT 'You know a great deal about it' 'You know quite a lot about it' 'You know a little about it' 'You know nothing at all about it' DK Q.2. When you are looking for information about the EU, its policies, its institutions, which of the following sources do you use..... READ OUT. CODE ALL THAT APPLY 'Discussions with relatives, friends, colleagues' 'Daily newspapers' 'Other newspapers, magazines' 'TV' 'Radio' 'The internet, the WWW' 'Books, brochures, information leaflets' 'EU-information offices, EICs Euro-info-points, Euro-libraries etc.' 'MEP/MP' 'Other' '(DO NOT READ OUT): Never look for such info/not interested’ DK Q.3. In general, how would you prefer to get information about the EU.... READ OUT. CODE ALL THAT APPLY 'A leaflet or a brochure' 'On the internet' 'From the TV' 'From the radio' 'From the daily papers' 'From other papers/magazines' 'Other' '(DO NOT READ OUT): I don't want info about the EU '(DO NOT READ OUT): None of these ways' DK

The UK & The European Union Report – ICM Research
20/20
Q.4. How fairly do you think the media cover European Union Affairs... READ OUT 'Very fairly' 'Quite fairly' 'Not very fairly' 'Not at all fairly' DK Q.5. Generally speaking do you think that the UK''s membership of the EU is..... READ OUT 'A good thing ' 'Neither a good nor a bad thing ' 'A bad thing ' DK Q.6. Taking everything into consideration, would you say that the UK has on balance benefited or not from being a member of the EU? 'Benefited' 'Not Benefited' DK Q.7. If you were told tomorrow that the European Union had been scrapped, would you be very pleased, indifferent or very sorry? 'Very pleased' 'Indifferent' 'Very sorry' DK Q.8. What is your opinion on each of the following statements? Please tell me for each statement, whether you are for it or against it..... 'You are for it'/ 'You are against it' DK 'A European Monetary Union with one single currency, the euro' 'One common foreign policy among the member states of the European Union, towards other countries' 'A common defence and security policy among the European Union member states' 'The enlargement of the European Union to include new countries' 'The European Union being responsible for matters that cannot be effectively handled by national, regional and local governments' 'The resignation of the President of the European Commission and the European Commissioners if they do not have the support of a majority in the European Parliament' 'Teaching school children about the way European Union institutions work'

The UK & The European Union Report – ICM Research
21/21
Q.9 I would like to ask you a question about how much trust you have in certain institutions. For each of the following institutions, please tell me if you tend to trust it or tend not to trust it.... 'You tend to trust it' 'You tend not to trust it' DK 'The press' 'Radio' 'Television' 'Trade unions' 'Political parties' 'The civil service' 'Big companies' 'The British government' 'The British Parliament (House of Commons)' 'The European Union' 'The United Nations' 'Non-Governmental Organisations (NGO)' Q.10 For each of the following areas, do you think that decisions should be made by the UK government or at the European Union level... 'By the UK government'/ 'At the European Union level' DK 'Fighting poverty and social exclusion' 'Protecting the environment' 'Guaranteeing the quality of food products' 'Protecting consumers and guaranteeing the quality of other products' 'Fighting unemployment' 'Fighting organised crime and drug trafficking' 'Guaranteeing the rights of the individual and respect for the principles of democracy ' 'Fighting terrorism ' 'Tackling the challenges of an ageing population' Just a few questions now to help us classify the answers you have given... D.2. Firstly, Can you tell me your age please? D.3. At what age did you leave full time education? D.4. As far as your current occupation is concerned, would you say you are self-employed, an employee (non-manual), a manual worker or would you say that you are without a professional activity? 1.'Self-employed'
�� 'Farmer, forester, fisherman' �� 'Owner of a shop, craftsman' �� 'Professional (lawyer, medical practitioner, accountant, architect,)' �� 'Manager of a company' �� 'Other self employed'

The UK & The European Union Report – ICM Research
22/22
2. 'Employee (non-manual)' �� 'Professional (employed doctor, lawyer, accountant, architect)' �� 'General management, director or top management' �� 'Middle management' �� ‘Civil servant' �� 'Office clerk' �� 'Other employee (salesman, nurse, etc)' �� 'Other employee'
3.'Manual worker' 'Supervisor / foreman (team manager, etc )' 'Manual worker' 'Unskilled manual worker' 'Other manual worker'
4. Without a professional activity' �� 'Other manual worker' �� 'Looking after the home' �� 'Student (full time)' �� 'Retired' �� 'Seeking a job' �� 'Other not working'
5. 'Refused' D.6. And the area you live in, would you describe it as ...? READ OUT 'Metropolitan' 'Other Town/urban centre' 'Rural' DK On behalf of ICM, I would like to thank you for the time and help you''ve given me today. D.1. INTERVIEWER CODE SEX OF RESPONDENT 'Male'/ 'Female'

The UK & The European Union Report – ICM Research
23/23
TABULAR RESULTS

RegionNorthernYorks &IrelandScotlandWalesSouth WestSouth EastGreater LondonEasternWest MidlandsEast MidlandsHumbersideNorth WestNorthTotal
5005005005035025005015045075055035046029Unweighted Total
1645222995098267295465364285116962636029Weighted Total
15591415512778290You know a great deal1%1%2%2%2%2%1%2%2%1%1%1%1%about it
10592364108109695251496123678You know quite a lot6%11%8%12%13%15%13%10%12%10%9%9%11%about it
932931652965024443202932472923931453483You know a little about57%56%55%58%61%61%59%55%58%57%56%55%58%it
58165106141203161153179123162234931777You know nothing at all36%32%36%28%25%22%28%33%29%32%34%35%29%about it
Page 1
The UK & The European UnionAbsolutes/col percents
Q.1. How much do you feel you know about the European Union, its policies, its institutions?Would you say that ...?Base : All respondents
Prepared by EOS Gallup & ICM ResearchFieldwork Dates : 11th-26th November 2002

LocalityAge left FT EducationAgeSexOtherTown/urbanMetropoli16 or
RuralcentretanNever hadStill in21+19-2017-18younger65+55 - 6445 - 5435 - 4425 - 3415 - 24FemaleMaleTotal
25922648789222671065308123830901078967112512431020596325627736029Unweighted Total
2349270098029376111632212302916116476797811211095905309629336029Weighted Total
402228-7301203023141914146246690You know a great deal2%1%3%-2%3%*2%1%2%2%2%1%1%1%1%2%1%about it
258291130242234461192311581101141279277220459678You know quite a lot11%11%13%7%11%21%14%10%8%14%14%12%11%8%8%7%16%11%about it
13291557597131647091927671619715483615636618417175417303483You know a little about57%58%61%46%44%64%59%62%56%61%63%63%57%56%46%57%59%58%it
7228302261416314383324103726816023034537040510996781777You know nothing at all31%31%23%47%43%13%26%26%36%23%21%24%31%34%45%36%23%29%about it
Page 2
The UK & The European UnionAbsolutes/col percents
Q.1. How much do you feel you know about the European Union, its policies, its institutions?Would you say that ...?Base : All respondents
Prepared by EOS Gallup & ICM ResearchFieldwork Dates : 11th-26th November 2002
EU ScrappedUK MembershipMedia CoverageKnowledgeof EUA little/Great deal/
Very sorryIndifferentVery pleasedNot BenefitedBenefitedA bad thingA good thingUnfairFairNothingquite a lotTotal
15912917130924692764138025321723350753007296029Unweighted Total
16222868131424572763137825531774346552617686029Weighted Total
391730434024534741-9090You know a great deal2%1%2%2%1%2%2%3%1%-12%1%about it
324160183253395186386274365-678678You know quite a lot20%6%14%10%14%13%15%15%11%-88%11%about it
9701640785144316798091534103221143483-3483You know a little about60%57%60%59%61%59%60%58%61%66%-58%it
28810503167176493605804209451777-1777You know nothing at all18%37%24%29%23%26%23%24%27%34%-29%about it
Page 3
The UK & The European UnionAbsolutes/col percents
Q.1. How much do you feel you know about the European Union, its policies, its institutions?Would you say that ...?Base : All respondents
Prepared by EOS Gallup & ICM ResearchFieldwork Dates : 11th-26th November 2002

RegionNorthernYorks &IrelandScotlandWalesSouth WestSouth EastGreater LondonEasternWest MidlandsEast MidlandsHumbersideNorth WestNorthTotal
5005005005035025005015045075055035046029Unweighted Total
1645222995098267295465364285116962636029Weighted Total
1194082394146405604474183424185212004727TV73%78%80%81%77%77%82%78%80%82%75%76%78%
1083932133815995564033783243504781774357Daily newspapers66%75%71%75%72%76%74%70%76%68%69%67%72%
712621582664444232972662342603071303117Discussions with43%50%53%52%54%58%54%50%55%51%44%49%52%relatives, friends,
colleagues
65210127255421359268234215228282972760Radio40%40%43%50%51%49%49%44%50%45%41%37%46%
642131282263453492262271882352571012557Other newspapers,39%41%43%44%42%48%41%42%44%46%37%38%42%magazines
5015886141224231148167137161188711763Books, brochures,30%30%29%28%27%32%27%31%32%32%27%27%29%information leaflets
4614767145250279155138114130168661705The internet, the WWW28%28%23%28%30%38%28%26%27%25%24%25%28%
143831366257283932442915426MEP/MP9%7%10%7%8%8%5%7%8%9%4%6%7%
114016363773393828324115406EU-information offices,7%8%5%7%5%10%7%7%7%6%6%6%7%EICs Euro-info-points,
Euro-libraries etc.
315431531346654Other2%*2%1%*2%1%*1%1%1%2%1%
143425225126203418347722378Never look for such9%7%9%4%6%4%4%6%4%7%11%9%6%info/not interested
2325101031945254Don't know1%1%1%1%1%1%1%*2%1%1%1%1%
Page 4
The UK & The European UnionAbsolutes/col percents
Q.2. When you are looking for information about the EU, its policies, its institutions,which of the following sources do you use?Base : All respondents
Prepared by EOS Gallup & ICM ResearchFieldwork Dates : 11th-26th November 2002

LocalityAge left FT EducationAgeSexOtherTown/urbanMetropoli16 or
RuralcentretanNever hadStill in21+19-2017-18younger65+55 - 6445 - 5435 - 4425 - 3415 - 24FemaleMaleTotal
25922648789222671065308123830901078967112512431020596325627736029Unweighted Total
2349270098029376111632212302916116476797811211095905309629336029Weighted Total
18552106766252718762569932279930618805873862638241023174727TV79%78%78%87%72%79%80%81%78%80%81%82%78%79%71%78%79%78%
16781922756182498842389212019849585736796783608218821694357Daily newspapers71%71%77%61%66%79%74%75%69%73%76%75%71%72%67%71%74%72%
12021383531161976541676651403540388519575623473168814293117Discussions with51%51%54%57%52%59%52%54%48%46%51%53%51%57%52%55%49%52%relatives, friends,
colleagues
10901163507121236161605681266550409480548482293135314072760Radio46%43%52%43%33%55%50%46%43%47%53%49%49%44%32%44%48%46%
1017109244781705511545711088436329422481493395129612612557Other newspapers,43%40%46%28%45%49%48%46%37%37%43%43%43%45%44%42%43%42%magazines
68276931381313771013577783382483143132762739717921763Books, brochures,29%28%32%26%35%34%31%29%27%29%32%32%28%25%30%31%27%29%information leaflets
56277137214214506118394441731272553894344278078981705The internet, the WWW24%29%38%48%57%45%37%32%15%6%17%26%35%40%47%26%31%28%
175163884268823931871007173726545220206426MEP/MP7%6%9%15%7%8%7%8%6%9%9%8%6%6%5%7%7%7%
15118273234962091154695258676992195211406EU-information offices,6%7%7%8%9%9%6%7%5%6%7%6%6%6%10%6%7%7%EICs Euro-info-points,
Euro-libraries etc.
212310-11163716951111910282654Other1%1%1%-3%1%1%1%1%1%1%1%1%1%1%1%1%1%
15918533124261663244953255656369220158378Never look for such7%7%3%4%6%2%5%5%8%8%4%6%6%6%8%7%5%6%info/not interested
24246-4367346891588282754Don't know1%1%1%-1%*2%1%1%*1%1%1%1%1%1%1%1%
Page 5
The UK & The European UnionAbsolutes/col percents
Q.2. When you are looking for information about the EU, its policies, its institutions,which of the following sources do you use?Base : All respondents
Prepared by EOS Gallup & ICM ResearchFieldwork Dates : 11th-26th November 2002
EU ScrappedUK MembershipMedia CoverageKnowledgeof EUA little/Great deal/
Very sorryIndifferentVery pleasedNot BenefitedBenefitedA bad thingA good thingUnfairFairNothingquite a lotTotal
15912917130924692764138025321723350753007296029Unweighted Total
16222868131424572763137825531774346552617686029Weighted Total
13512196102818952261105620901370287640886394727TV83%77%78%77%82%77%82%77%83%78%83%78%
1275200097417532143100519441287268737096484357Daily newspapers79%70%74%71%78%73%76%73%78%70%84%72%
8971440697123715166841395952188426494683117Discussions with55%50%53%50%55%50%55%54%54%50%61%52%relatives, friends,
colleagues
8781179605106013666001295868162023044572760Radio54%41%46%43%49%44%51%49%47%44%59%46%
792113356099912795421176786157521054512557Other newspapers,49%40%43%41%46%39%46%44%45%40%59%42%magazines
581732393676908368828561106514473161763Books, brochures,36%26%30%27%33%27%32%32%31%28%41%29%information leaflets
599837227514101322993557799413663391705The internet, the WWW37%29%17%21%37%17%37%33%29%26%44%28%
171134107163220106224159241320106426MEP/MP11%5%8%7%8%8%9%9%7%6%14%7%
151162731182415921213924231294406EU-information offices,9%6%6%5%9%4%8%8%7%6%12%7%EICs Euro-info-points,
Euro-libraries etc.
191815193113302330361854Other1%1%1%1%1%1%1%1%1%1%2%1%
41224731689010980811263744378Never look for such3%8%6%7%3%8%3%5%4%7%*6%info/not interested
518202011161482453254Don't know*1%1%1%*1%1%*1%1%*1%
Page 6
The UK & The European UnionAbsolutes/col percents
Q.2. When you are looking for information about the EU, its policies, its institutions,which of the following sources do you use?Base : All respondents
Prepared by EOS Gallup & ICM ResearchFieldwork Dates : 11th-26th November 2002

RegionNorthernYorks &IrelandScotlandWalesSouth WestSouth EastGreater LondonEasternWest MidlandsEast MidlandsHumbersideNorth WestNorthTotal
5005005005035025005015045075055035046029Unweighted Total
1645222995098267295465364285116962636029Weighted Total
1153702303966065424364163184115071924537From the TV70%71%77%78%73%74%80%78%74%80%73%73%75%
1063672063535595523843913073544981644240From the daily papers65%70%69%69%68%76%70%73%72%69%72%62%70%
1032891702924864353093212543204391513569A leaflet or a brochure63%55%57%57%59%60%57%60%59%63%63%57%59%
732331332944183742732522042493181062928From the radio45%45%45%58%51%51%50%47%48%49%46%40%49%
722161392253603712422532042473221092761From other papers/44%41%47%44%44%51%44%47%48%48%46%41%46%magazines
5317682191302348193189144149241862154On the internet32%34%28%38%37%48%35%35%34%29%35%33%36%
61615194224222518183419257Other4%3%5%4%5%3%4%5%4%3%5%7%4%
73014232426121815303716253I don't want info about4%6%5%5%3%4%2%3%4%6%5%6%4%the EU
1717243668136686None of these ways*1%*1%3%*1%1%2%2%1%2%1%
*2-3-632223125Don't know**-1%-1%1%*1%**1%*
Page 7
The UK & The European UnionAbsolutes/col percents
Q.3. In general, how would you prefer to get information about the EU?Base : All respondents
Prepared by EOS Gallup & ICM ResearchFieldwork Dates : 11th-26th November 2002

LocalityAge left FT EducationAgeSexOtherTown/urbanMetropoli16 or
RuralcentretanNever hadStill in21+19-2017-18younger65+55 - 6445 - 5435 - 4425 - 3415 - 24FemaleMaleTotal
25922648789222671065308123830901078967112512431020596325627736029Unweighted Total
2349270098029376111632212302916116476797811211095905309629336029Weighted Total
17692034734212958062609412186843597739847833679236621714537From the TV75%75%75%74%78%72%81%77%75%72%78%76%76%76%75%76%74%75%
16371868735152668242329091967783549679790786653216320764240From the daily papers70%69%75%53%71%74%72%74%67%67%72%69%70%72%72%70%71%70%
13491646574152286272077791691637473618639638564197315963569A leaflet or a brochure57%61%59%52%60%56%64%63%58%55%62%63%57%58%62%64%54%59%
11511265512111686291716101323531396494584527395144114882928From the radio49%47%52%37%45%56%53%50%45%46%52%51%52%48%44%47%51%49%
1047121949672155411686171198402328453519561499142813342761From other papers/45%45%51%24%57%48%52%50%41%35%43%46%46%51%55%46%45%46%magazines
7289724541526957315349462796157316471558555102211322154On the internet31%36%46%51%72%51%48%40%21%8%21%32%42%51%61%33%39%36%
9912632212692348102523128574742124133257Other4%5%3%5%3%6%7%4%3%4%4%3%5%4%5%4%5%4%
123101281118738185110273838309133120253I don't want info about5%4%3%4%*2%2%3%6%9%4%4%3%3%1%4%4%4%the EU
433310-2124145223131913118394786None of these ways2%1%1%-1%1%1%1%2%2%2%2%1%1%1%1%2%1%
988-23-317268224101525Don't know**1%-**-*1%*1%1%****1%*
Page 8
The UK & The European UnionAbsolutes/col percents
Q.3. In general, how would you prefer to get information about the EU?Base : All respondents
Prepared by EOS Gallup & ICM ResearchFieldwork Dates : 11th-26th November 2002

EU ScrappedUK MembershipMedia CoverageKnowledgeof EUA little/Great deal/
Very sorryIndifferentVery pleasedNot BenefitedBenefitedA bad thingA good thingUnfairFairNothingquite a lotTotal
15912917130924692764138025321723350753007296029Unweighted Total
16222868131424572763137825531774346552617686029Weighted Total
127321759271774217994820131277275239725654537From the TV79%76%71%72%79%69%79%72%79%76%74%75%
122119969021665207792918841209263636455944240From the daily papers75%70%69%68%75%67%74%68%76%69%77%70%
99617077521388172572715931063212331344353569A leaflet or a brochure61%60%57%56%62%53%62%60%61%60%57%59%
9211312592107814755911362893173624944342928From the radio57%46%45%44%53%43%53%50%50%47%57%49%
8541296534102213965281288808170723434192761From other papers/53%45%41%42%51%38%50%46%49%45%55%46%magazines
728108228063812622931159711125317873672154On the internet45%38%21%26%46%21%45%40%36%34%48%36%
8511450100124451259114120948257Other5%4%4%4%4%3%5%5%4%4%6%4%
29117881404311054707823914253I don't want info about2%4%7%6%2%8%2%4%2%5%2%4%the EU
83631471833122230761086None of these ways*1%2%2%1%2%*1%1%1%1%1%
551312811351222325Don't know**1%**1%******
Page 9
The UK & The European UnionAbsolutes/col percents
Q.3. In general, how would you prefer to get information about the EU?Base : All respondents
Prepared by EOS Gallup & ICM ResearchFieldwork Dates : 11th-26th November 2002

RegionNorthernYorks &IrelandScotlandWalesSouth WestSouth EastGreater LondonEasternWest MidlandsEast MidlandsHumbersideNorth WestNorthTotal
5005005005035025005015045075055035046029Unweighted Total
1645222995098267295465364285116962636029Weighted Total
1043241812744224173293232472714081653465Net Very/Quite fairly64%62%61%54%51%57%60%60%58%53%59%63%57%
133016173956283029304217346Very fairly (2)8%6%5%3%5%8%5%6%7%6%6%6%6%
912941662563843623012932192413671483119Quite fairly (1)56%56%55%50%46%50%55%55%51%47%53%56%52%
2810455128199172111948396145451259Not very fairly (-1)17%20%18%25%24%24%20%18%19%19%21%17%21%
144023438167355440584217514Not at all fairly (-2)8%8%8%8%10%9%6%10%9%11%6%7%9%
4114378171280240146148124154187621774Net Not very/Not at all25%27%26%34%34%33%27%28%29%30%27%24%29%fairly
18554065124727265578610036790Don't know11%10%13%13%15%10%13%12%13%17%14%14%13%
0.430.370.370.180.140.250.370.320.300.210.370.450.29Mean
1.181.151.151.171.221.231.121.201.211.261.141.121.19Standard deviation
0.060.050.060.060.060.060.050.060.060.060.050.050.02Standard error
Page 10
The UK & The European UnionAbsolutes/col percents
Q.4. How fairly do you think the media cover European Union Affairs?Base : All respondents
Prepared by EOS Gallup & ICM ResearchFieldwork Dates : 11th-26th November 2002

LocalityAge left FT EducationAgeSexOtherTown/urbanMetropoli16 or
RuralcentretanNever hadStill in21+19-2017-18younger65+55 - 6445 - 5435 - 4425 - 3415 - 24FemaleMaleTotal
25922648789222671065308123830901078967112512431020596325627736029Unweighted Total
2349270098029376111632212302916116476797811211095905309629336029Weighted Total
13201573572162526072017381627586428565652634601181516513465Net Very/Quite fairly56%58%58%54%67%54%62%60%56%50%56%58%58%58%66%59%56%57%
12615070213552560191774663625445160185346Very fairly (2)5%6%7%7%4%5%8%5%7%7%6%6%6%5%5%5%6%6%
11941423502142395521766781436509382502590580556165414653119Quite fairly (1)51%53%51%47%64%49%55%55%49%44%50%51%53%53%61%53%50%52%
516532211678306672605352691741972182241765856741259Not very fairly (-1)22%20%22%22%21%27%21%21%18%23%23%20%19%20%19%19%23%21%
1962279041696279727312865811038849227287514Not at all fairly (-2)8%8%9%14%4%9%9%8%9%11%9%8%9%8%5%7%10%9%
7137603011094402943578083972402793213122268139611774Net Not very/Not at all30%28%31%36%25%36%29%29%28%34%31%29%29%28%25%26%33%29%fairly
3173671073301072713548218110013414814978469321790Don't know13%14%11%11%8%10%8%11%17%16%13%14%13%14%9%15%11%13%
0.260.320.290.120.450.160.350.310.300.140.250.320.300.300.450.360.230.29Mean
1.191.181.211.321.031.191.191.151.221.271.201.191.191.171.071.151.221.19Standard deviation
0.030.020.050.300.070.040.070.030.020.040.040.040.040.040.050.020.020.02Standard error
Page 11
The UK & The European UnionAbsolutes/col percents
Q.4. How fairly do you think the media cover European Union Affairs?Base : All respondents
Prepared by EOS Gallup & ICM ResearchFieldwork Dates : 11th-26th November 2002

EU ScrappedUK MembershipMedia CoverageKnowledgeof EUA little/Great deal/
Very sorryIndifferentVery pleasedNot BenefitedBenefitedA bad thingA good thingUnfairFairNothingquite a lotTotal
15912917130924692764138025321723350753007296029Unweighted Total
16222868131424572763137825531774346552617686029Weighted Total
8771770734137017287141558-346530604063465Net Very/Quite fairly54%62%56%56%63%52%61%-100%58%53%57%
991389713417183157-34630441346Very fairly (2)6%5%7%5%6%6%6%-10%6%5%6%
7771632637123615576311401-311927553643119Quite fairly (1)48%57%48%50%56%46%55%-90%52%47%52%
4535052675276112995811259-10242361259Not very fairly (-1)28%18%20%21%22%22%23%71%-19%31%21%
176170144256186168195514-42985514Not at all fairly (-2)11%6%11%10%7%12%8%29%-8%11%9%
6296754107837974667761774-14533211774Net Not very/Not at all39%24%31%32%29%34%30%100%-28%42%29%fairly
116423170304238198218--74842790Don't know7%15%13%12%9%14%9%--14%5%13%
0.110.430.240.220.360.140.32-1.291.100.330.060.29Mean
1.241.091.251.221.141.271.160.450.301.171.231.19Standard deviation
0.030.020.040.030.020.040.020.010.010.020.050.02Standard error
Page 12
The UK & The European UnionAbsolutes/col percents
Q.4. How fairly do you think the media cover European Union Affairs?Base : All respondents
Prepared by EOS Gallup & ICM ResearchFieldwork Dates : 11th-26th November 2002

RegionNorthernYorks &IrelandScotlandWalesSouth WestSouth EastGreater LondonEasternWest MidlandsEast MidlandsHumbersideNorth WestNorthTotal
5005005005035025005015045075055035046029Unweighted Total
1645222995098267295465364285116962636029Weighted Total
94245116195340361210203166213311982553A good thing (1)57%47%39%38%41%49%39%38%39%42%45%37%42%
43144103144238191158147121127161831660Neither a good nor a26%28%35%28%29%26%29%27%28%25%23%32%28%bad thing (0)
219758137191142140136105130162581378A bad thing (-1)13%19%20%27%23%19%26%25%24%25%23%22%23%
63521325835375036416224438Don't know4%7%7%6%7%5%7%9%8%8%9%9%7%
0.460.300.210.120.190.320.140.140.160.180.230.170.21Mean
0.720.780.770.830.810.790.820.820.820.840.830.790.81Standard deviation
0.030.040.040.040.040.040.040.040.040.040.040.040.01Standard error
Page 13
The UK & The European UnionAbsolutes/col percents
Q.5. Generally speaking do you think that the UK's membership of the EU is ...?Base : All respondents
Prepared by EOS Gallup & ICM ResearchFieldwork Dates : 11th-26th November 2002

LocalityAge left FT EducationAgeSexOtherTown/urbanMetropoli16 or
RuralcentretanNever hadStill in21+19-2017-18younger65+55 - 6445 - 5435 - 4425 - 3415 - 24FemaleMaleTotal
25922648789222671065308123830901078967112512431020596325627736029Unweighted Total
2349270098029376111632212302916116476797811211095905309629336029Weighted Total
927113249416203678163514953365294413483526471115913942553A good thing (1)39%42%50%55%54%61%51%42%33%31%38%42%43%48%52%37%48%42%
65578422210120239853828182241862593423413099916691660Neither a good nor a28%29%23%33%32%21%26%31%28%19%24%26%30%31%34%32%23%28%bad thing (0)
61157619233414757263871470240253212132726647141378A bad thing (-1)26%21%20%9%9%13%18%21%30%40%31%26%19%12%8%21%24%23%
157208721195217712751044853859553282156438Don't know7%8%7%3%5%5%5%6%9%9%6%5%8%9%6%9%5%7%
0.140.220.330.480.470.500.350.220.03-0.100.080.170.260.390.470.180.240.21Mean
0.830.800.800.670.660.730.780.790.830.880.860.830.780.710.650.790.840.81Standard deviation
0.020.020.030.150.040.020.050.020.020.030.030.030.020.020.030.010.020.01Standard error
Page 14
The UK & The European UnionAbsolutes/col percents
Q.5. Generally speaking do you think that the UK's membership of the EU is ...?Base : All respondents
Prepared by EOS Gallup & ICM ResearchFieldwork Dates : 11th-26th November 2002

EU ScrappedUK MembershipMedia CoverageKnowledgeof EUA little/Great deal/
Very sorryIndifferentVery pleasedNot BenefitedBenefitedA bad thingA good thingUnfairFairNothingquite a lotTotal
15912917130924692764138025321723350753007296029Unweighted Total
16222868131424572763137825531774346552617686029Weighted Total
13681020993991927-2553776155821144392553A good thing (1)84%36%8%16%70%-100%44%45%40%57%42%
1711216214737617--420102615571031660Neither a good nor a11%42%16%30%22%--24%30%30%13%28%bad thing (0)
5135594611891131378-46671411682101378A bad thing (-1)3%12%72%48%4%100%-26%21%22%27%23%
3227654131106--11116742216438Don't know2%10%4%5%4%--6%5%8%2%7%
0.830.26-0.67-0.340.68-1.001.000.190.260.200.300.21Mean
0.450.680.620.750.550.000.000.840.790.800.880.81Standard deviation
0.010.010.020.020.010.000.000.020.010.010.030.01Standard error
Page 15
The UK & The European UnionAbsolutes/col percents
Q.5. Generally speaking do you think that the UK's membership of the EU is ...?Base : All respondents
Prepared by EOS Gallup & ICM ResearchFieldwork Dates : 11th-26th November 2002

RegionNorthernYorks &IrelandScotlandWalesSouth WestSouth EastGreater LondonEasternWest MidlandsEast MidlandsHumbersideNorth WestNorthTotal
5005005005035025005015045075055035046029Unweighted Total
1645222995098267295465364285116962636029Weighted Total
992701432213513892232181822143291232763Benefited61%52%48%43%42%53%41%41%43%42%47%47%46%
461741192313622542542311882302681012457Not Benefited28%33%40%45%44%35%47%43%44%45%39%38%41%
1978375711486698658679940809Don't know12%15%12%11%14%12%13%16%14%13%14%15%13%
Page 16
The UK & The European UnionAbsolutes/col percents
Q.6. Taking everything into consideration, would you say that the UK has on balance benefited or not from being a member of the EU?Base : All respondents
Prepared by EOS Gallup & ICM ResearchFieldwork Dates : 11th-26th November 2002

LocalityAge left FT EducationAgeSexOtherTown/urbanMetropoli16 or
RuralcentretanNever hadStill in21+19-2017-18younger65+55 - 6445 - 5435 - 4425 - 3415 - 24FemaleMaleTotal
25922648789222671065308123830901078967112512431020596325627736029Unweighted Total
2349270098029376111632212302916116476797811211095905309629336029Weighted Total
9871249527192436971745661042371305443541562541130414582763Benefited42%46%54%66%65%62%54%46%36%32%40%45%48%51%60%42%50%46%
105610693313922881095031453662377439427331220127811782457Not Benefited45%40%34%11%24%26%34%41%50%57%49%45%38%30%24%41%40%41%
306381122741131391624211308596153202143513296809Don't know13%14%12%23%11%12%12%13%14%11%11%10%14%18%16%17%10%13%
Page 17
The UK & The European UnionAbsolutes/col percents
Q.6. Taking everything into consideration, would you say that the UK has on balance benefited or not from being a member of the EU?Base : All respondents
Prepared by EOS Gallup & ICM ResearchFieldwork Dates : 11th-26th November 2002
EU ScrappedUK MembershipMedia CoverageKnowledgeof EUA little/Great deal/
Very sorryIndifferentVery pleasedNot BenefitedBenefitedA bad thingA good thingUnfairFairNothingquite a lotTotal
15912917130924692764138025321723350753007296029Unweighted Total
16222868131424572763137825531774346552617686029Weighted Total
13221275114-27631131927797172823284352763Benefited82%44%9%-100%8%75%45%50%44%57%46%
203106011292457-1189399783137021602962457Not Benefited13%37%86%100%-86%16%44%40%41%39%41%
9653371--7622719336877337809Don't know6%19%5%--5%9%11%11%15%5%13%
Page 18
The UK & The European UnionAbsolutes/col percents
Q.6. Taking everything into consideration, would you say that the UK has on balance benefited or not from being a member of the EU?Base : All respondents
Prepared by EOS Gallup & ICM ResearchFieldwork Dates : 11th-26th November 2002
RegionNorthernYorks &IrelandScotlandWalesSouth WestSouth EastGreater LondonEasternWest MidlandsEast MidlandsHumbersideNorth WestNorthTotal
5005005005035025005015045075055035046029Unweighted Total
1645222995098267295465364285116962636029Weighted Total
188259116221139150121103120137491314Very pleased (1)11%16%20%23%27%19%27%23%24%23%20%18%22%
892591662533632992562652012363341482868Indifferent (0)55%50%56%50%44%41%47%49%47%46%48%56%48%
5317165125205258126126101135199581622Very sorry (-1)32%33%22%25%25%35%23%24%24%26%29%22%27%
410915383315242421269225Don't know2%2%3%3%5%5%3%4%6%4%4%3%4%
-0.22-0.17-0.02-0.020.02-0.170.05-0.010.01-0.03-0.09-0.04-0.05Mean
0.630.680.650.700.740.740.720.700.710.720.700.650.71Standard deviation
0.030.030.030.030.030.030.030.030.030.030.030.030.01Standard error
Page 19
The UK & The European UnionAbsolutes/col percents
Q.7. If you were told tomorrow that the European Union had been scrapped, would you be very pleased, indifferent or very sorry?Base : All respondents
Prepared by EOS Gallup & ICM ResearchFieldwork Dates : 11th-26th November 2002

LocalityAge left FT EducationAgeSexOtherTown/urbanMetropoli16 or
RuralcentretanNever hadStill in21+19-2017-18younger65+55 - 6445 - 5435 - 4425 - 3415 - 24FemaleMaleTotal
25922648789222671065308123830901078967112512431020596325627736029Unweighted Total
2349270098029376111632212302916116476797811211095905309629336029Weighted Total
59353918222314647262827473252240181112556836301314Very pleased (1)25%20%19%7%6%13%15%21%28%41%33%25%16%10%6%22%21%22%
11141347407152144041506141452371284435601619559159812702868Indifferent (0)47%50%42%50%57%36%47%50%50%32%37%44%54%57%62%52%43%48%
565712345111215341113105232872032683013132506929291622Very sorry (-1)24%26%35%38%32%48%35%25%18%25%26%27%27%29%28%22%32%27%
7710247118321444114332735385141122104225Don't know3%4%5%4%5%3%4%4%4%3%4%4%3%5%5%4%4%4%
0.01-0.07-0.17-0.32-0.28-0.36-0.21-0.040.110.160.07-0.03-0.11-0.19-0.23*-0.11-0.05Mean
0.710.690.730.620.570.710.690.690.690.800.780.730.660.610.550.680.740.71Standard deviation
0.010.010.030.140.040.020.040.020.010.020.030.020.020.020.020.010.010.01Standard error
Page 20
The UK & The European UnionAbsolutes/col percents
Q.7. If you were told tomorrow that the European Union had been scrapped, would you be very pleased, indifferent or very sorry?Base : All respondents
Prepared by EOS Gallup & ICM ResearchFieldwork Dates : 11th-26th November 2002

EU ScrappedUK MembershipMedia CoverageKnowledgeof EUA little/Great deal/
Very sorryIndifferentVery pleasedNot BenefitedBenefitedA bad thingA good thingUnfairFairNothingquite a lotTotal
15912917130924692764138025321723350753007296029Unweighted Total
16222868131424572763137825531774346552617686029Weighted Total
--131411291149469941073411012131314Very pleased (1)--100%46%4%69%4%23%21%21%28%22%
-2868-106012753551020675177026911772868Indifferent (0)-100%-43%46%26%40%38%51%51%23%48%
1622--203132251136862987712583631622Very sorry (-1)100%--8%48%4%54%35%25%24%47%27%
---64522665608521115225Don't know---3%2%2%3%3%2%4%2%4%
-1.000.001.000.39-0.450.66-0.51-0.13-0.04-0.03-0.20-0.05Mean
0.000.000.000.640.580.550.570.770.690.680.850.71Standard deviation
0.000.000.000.010.010.010.010.020.010.010.030.01Standard error
Page 21
The UK & The European UnionAbsolutes/col percents
Q.7. If you were told tomorrow that the European Union had been scrapped, would you be very pleased, indifferent or very sorry?Base : All respondents
Prepared by EOS Gallup & ICM ResearchFieldwork Dates : 11th-26th November 2002

RegionNorthernYorks &IrelandScotlandWalesSouth WestSouth EastGreater LondonEasternWest MidlandsEast MidlandsHumbersideNorth WestNorthTotal
5005005005035025005015045075055035046029Unweighted Total
1645222995098267295465364285116962636029Weighted Total
100239112186281311180177148180260862261You are for it61%46%37%37%34%43%33%33%35%35%37%33%37%
602641702984894013433352643094081653506You are against it37%51%57%58%59%55%63%63%62%60%59%63%58%
31917255617232315222812262Don't know2%4%6%5%7%2%4%4%4%4%4%5%4%
Page 22
The UK & The European UnionAbsolutes/col percents
Q.8. What is your opinion on each of the following statements?Please tell me for each statement, whether you are for it or against it.
A European Monetary Union with one single currency, the euro
Base : All respondents
Prepared by EOS Gallup & ICM ResearchFieldwork Dates : 11th-26th November 2002

LocalityAge left FT EducationAgeSexOtherTown/urbanMetropoli16 or
RuralcentretanNever hadStill in21+19-2017-18younger65+55 - 6445 - 5435 - 4425 - 3415 - 24FemaleMaleTotal
25922648789222671065308123830901078967112512431020596325627736029Unweighted Total
2349270098029376111632212302916116476797811211095905309629336029Weighted Total
806102742810190572147444882329249378443465397107011912261You are for it34%38%44%34%50%51%46%36%30%28%32%39%39%42%44%35%41%37%
14391550516191744831607411908785497566621572466186716393506You are against it61%57%53%66%46%43%50%60%65%67%65%58%55%52%52%60%56%58%
10412336-13611545126502134585841159103262Don't know4%5%4%-3%5%5%4%4%4%3%3%5%5%5%5%4%4%
Page 23
The UK & The European UnionAbsolutes/col percents
Q.8. What is your opinion on each of the following statements?Please tell me for each statement, whether you are for it or against it.
A European Monetary Union with one single currency, the euro
Base : All respondents
Prepared by EOS Gallup & ICM ResearchFieldwork Dates : 11th-26th November 2002
EU ScrappedUK MembershipMedia CoverageKnowledgeof EUA little/Great deal/
Very sorryIndifferentVery pleasedNot BenefitedBenefitedA bad thingA good thingUnfairFairNothingquite a lotTotal
15912917130924692764138025321723350753007296029Unweighted Total
16222868131424572763137825531774346552617686029Weighted Total
1136965964331570781624727132019133482261You are for it70%34%7%18%57%6%64%41%38%36%45%37%
41217661202195910841285830972202331093973506You are against it25%62%91%80%39%93%33%55%58%59%52%58%
74137166410916987512223923262Don't know5%5%1%3%4%1%4%4%4%5%3%4%
Page 24
The UK & The European UnionAbsolutes/col percents
Q.8. What is your opinion on each of the following statements?Please tell me for each statement, whether you are for it or against it.
A European Monetary Union with one single currency, the euro
Base : All respondents
Prepared by EOS Gallup & ICM ResearchFieldwork Dates : 11th-26th November 2002
RegionNorthernYorks &IrelandScotlandWalesSouth WestSouth EastGreater LondonEasternWest MidlandsEast MidlandsHumbersideNorth WestNorthTotal
5005005005035025005015045075055035046029Unweighted Total
1645222995098267295465364285116962636029Weighted Total
992511412133203492192141632153111122608You are for it60%48%47%42%39%48%40%40%38%42%45%42%43%
542271292534383282722702192533081222874You are against it33%44%43%50%53%45%50%50%51%49%44%46%48%
114428436851555146447730548Don't know6%8%9%8%8%7%10%10%11%9%11%11%9%
Page 25
The UK & The European UnionAbsolutes/col percents
Q.8. What is your opinion on each of the following statements?Please tell me for each statement, whether you are for it or against it.
One common foreign policy among the member states of the European Union, towards other countries
Base : All respondents
Prepared by EOS Gallup & ICM ResearchFieldwork Dates : 11th-26th November 2002

LocalityAge left FT EducationAgeSexOtherTown/urbanMetropoli16 or
RuralcentretanNever hadStill in21+19-2017-18younger65+55 - 6445 - 5435 - 4425 - 3415 - 24FemaleMaleTotal
25922648789222671065308123830901078967112512431020596325627736029Unweighted Total
2349270098029376111632212302916116476797811211095905309629336029Weighted Total
9471204457151985531625291130405276423491520493135112572608You are for it40%45%47%50%53%50%50%43%39%35%36%43%44%47%55%44%43%43%
11861241447111475081306021461632419472544476330135615182874You are against it51%46%46%38%39%46%40%49%50%54%55%48%49%43%37%44%52%48%
216255764325530993261287283869981389159548Don't know9%9%8%12%8%5%9%8%11%11%9%8%8%9%9%13%5%9%
Page 26
The UK & The European UnionAbsolutes/col percents
Q.8. What is your opinion on each of the following statements?Please tell me for each statement, whether you are for it or against it.
One common foreign policy among the member states of the European Union, towards other countries
Base : All respondents
Prepared by EOS Gallup & ICM ResearchFieldwork Dates : 11th-26th November 2002

EU ScrappedUK MembershipMedia CoverageKnowledgeof EUA little/Great deal/
Very sorryIndifferentVery pleasedNot BenefitedBenefitedA bad thingA good thingUnfairFairNothingquite a lotTotal
15912917130924692764138025321723350753007296029Unweighted Total
16222868131424572763137825531774346552617686029Weighted Total
1018127224969316162441551773159022693392608You are for it63%44%19%28%58%18%61%44%46%43%44%43%
512130498115879891032833881162324734002874You are against it32%45%75%65%36%75%33%50%47%47%52%48%
922938417715810316812025251929548Don't know6%10%6%7%6%7%7%7%7%10%4%9%
Page 27
The UK & The European UnionAbsolutes/col percents
Q.8. What is your opinion on each of the following statements?Please tell me for each statement, whether you are for it or against it.
One common foreign policy among the member states of the European Union, towards other countries
Base : All respondents
Prepared by EOS Gallup & ICM ResearchFieldwork Dates : 11th-26th November 2002

RegionNorthernYorks &IrelandScotlandWalesSouth WestSouth EastGreater LondonEasternWest MidlandsEast MidlandsHumbersideNorth WestNorthTotal
5005005005035025005015045075055035046029Unweighted Total
1645222995098267295465364285116962636029Weighted Total
1143312023124894793263252523134541623759You are for it70%63%68%61%59%66%60%61%59%61%65%62%62%
3614572162259197180168141157179761772You are against it22%28%24%32%31%27%33%31%33%31%26%29%29%
134525367952414335426226498Don't know8%9%8%7%10%7%7%8%8%8%9%10%8%
Page 28
The UK & The European UnionAbsolutes/col percents
Q.8. What is your opinion on each of the following statements?Please tell me for each statement, whether you are for it or against it.
A common defence and security policy among the European Union member states
Base : All respondents
Prepared by EOS Gallup & ICM ResearchFieldwork Dates : 11th-26th November 2002
LocalityAge left FT EducationAgeSexOtherTown/urbanMetropoli16 or
RuralcentretanNever hadStill in21+19-2017-18younger65+55 - 6445 - 5435 - 4425 - 3415 - 24FemaleMaleTotal
25922648789222671065308123830901078967112512431020596325627736029Unweighted Total
2349270098029376111632212302916116476797811211095905309629336029Weighted Total
14391694626152727412157851703646454617706693643193818223759You are for it61%63%64%51%72%66%67%64%58%55%59%63%63%63%71%63%62%62%
701787284884318863609093912422953423002027929801772You are against it30%29%29%26%22%28%27%29%31%34%32%30%30%27%22%26%33%29%
2102197072157208530412771657310259366131498Don't know9%8%7%23%5%5%6%7%10%11%9%7%7%9%7%12%4%8%
Page 29
The UK & The European UnionAbsolutes/col percents
Q.8. What is your opinion on each of the following statements?Please tell me for each statement, whether you are for it or against it.
A common defence and security policy among the European Union member states
Base : All respondents
Prepared by EOS Gallup & ICM ResearchFieldwork Dates : 11th-26th November 2002

EU ScrappedUK MembershipMedia CoverageKnowledgeof EUA little/Great deal/
Very sorryIndifferentVery pleasedNot BenefitedBenefitedA bad thingA good thingUnfairFairNothingquite a lotTotal
15912917130924692764138025321723350753007296029Unweighted Total
16222868131424572763137825531774346552617686029Weighted Total
125318775351264206455619561109226232974623759You are for it77%65%41%51%75%40%77%63%65%63%60%62%
297744682102255871247255598014962761772You are against it18%26%52%42%20%52%18%31%28%28%36%29%
722479717114011012511022446830498Don't know4%9%7%7%5%8%5%6%6%9%4%8%
Page 30
The UK & The European UnionAbsolutes/col percents
Q.8. What is your opinion on each of the following statements?Please tell me for each statement, whether you are for it or against it.
A common defence and security policy among the European Union member states
Base : All respondents
Prepared by EOS Gallup & ICM ResearchFieldwork Dates : 11th-26th November 2002

RegionNorthernYorks &IrelandScotlandWalesSouth WestSouth EastGreater LondonEasternWest MidlandsEast MidlandsHumbersideNorth WestNorthTotal
5005005005035025005015045075055035046029Unweighted Total
1645222995098267295465364285116962636029Weighted Total
1163221682754493822732842352804201533356You are for it71%62%56%54%54%52%50%53%55%55%60%58%56%
38147104201291287222209162186204862137You are against it23%28%35%39%35%39%41%39%38%36%29%33%35%
105327338660524331467225537Don't know6%10%9%6%10%8%9%8%7%9%10%9%9%
Page 31
The UK & The European UnionAbsolutes/col percents
Q.8. What is your opinion on each of the following statements?Please tell me for each statement, whether you are for it or against it.
The enlargement of the European Union to include new countries
Base : All respondents
Prepared by EOS Gallup & ICM ResearchFieldwork Dates : 11th-26th November 2002
LocalityAge left FT EducationAgeSexOtherTown/urbanMetropoli16 or
RuralcentretanNever hadStill in21+19-2017-18younger65+55 - 6445 - 5435 - 4425 - 3415 - 24FemaleMaleTotal
25922648789222671065308123830901078967112512431020596325627736029Unweighted Total
2349270098029376111632212302916116476797811211095905309629336029Weighted Total
12291553573222617112146871439455350535662730623167516803356You are for it52%58%58%75%69%64%66%56%49%39%46%55%59%67%69%54%57%56%
9119093167106312914291180573320356368267252108110552137You are against it39%34%32%23%28%28%28%35%40%49%42%36%33%24%28%35%36%35%
2082379111093171142981369786919730340197537Don't know9%9%9%3%3%8%5%9%10%12%13%9%8%9%3%11%7%9%
Page 32
The UK & The European UnionAbsolutes/col percents
Q.8. What is your opinion on each of the following statements?Please tell me for each statement, whether you are for it or against it.
The enlargement of the European Union to include new countries
Base : All respondents
Prepared by EOS Gallup & ICM ResearchFieldwork Dates : 11th-26th November 2002

EU ScrappedUK MembershipMedia CoverageKnowledgeof EUA little/Great deal/
Very sorryIndifferentVery pleasedNot BenefitedBenefitedA bad thingA good thingUnfairFairNothingquite a lotTotal
15912917130924692764138025321723350753007296029Unweighted Total
16222868131424572763137825531774346552617686029Weighted Total
1179176230892220023441884953204829304263356You are for it73%61%23%38%72%25%74%54%59%56%55%56%
3408468891324599900518693117118452912137You are against it21%30%68%54%22%65%20%39%34%35%38%35%
10225911721016113415012824748651537Don't know6%9%9%9%6%10%6%7%7%9%7%9%
Page 33
The UK & The European UnionAbsolutes/col percents
Q.8. What is your opinion on each of the following statements?Please tell me for each statement, whether you are for it or against it.
The enlargement of the European Union to include new countries
Base : All respondents
Prepared by EOS Gallup & ICM ResearchFieldwork Dates : 11th-26th November 2002

RegionNorthernYorks &IrelandScotlandWalesSouth WestSouth EastGreater LondonEasternWest MidlandsEast MidlandsHumbersideNorth WestNorthTotal
5005005005035025005015045075055035046029Unweighted Total
1645222995098267295465364285116962636029Weighted Total
942651462453424092392201972183221312827You are for it58%51%49%48%41%56%44%41%46%43%46%50%47%
552071232183982642552551872383021122613You are against it33%40%41%43%48%36%47%48%44%47%43%42%43%
155030478656536143557221589Don't know9%10%10%9%10%8%10%11%10%11%10%8%10%
Page 34
The UK & The European UnionAbsolutes/col percents
Q.8. What is your opinion on each of the following statements?Please tell me for each statement, whether you are for it or against it.
The European Union being responsible for matters that cannot be effectively handled by national, regional and local governments
Base : All respondents
Prepared by EOS Gallup & ICM ResearchFieldwork Dates : 11th-26th November 2002

LocalityAge left FT EducationAgeSexOtherTown/urbanMetropoli16 or
RuralcentretanNever hadStill in21+19-2017-18younger65+55 - 6445 - 5435 - 4425 - 3415 - 24FemaleMaleTotal
25922648789222671065308123830901078967112512431020596325627736029Unweighted Total
2349270098029376111632212302916116476797811211095905309629336029Weighted Total
10471211568192266921665701137356303423554629563141614112827You are for it45%45%58%66%60%62%51%46%39%31%39%43%49%57%62%46%48%47%
1064120934061263361275591441623390473477363286126413492613You are against it45%45%35%21%34%30%39%45%49%54%51%48%43%33%32%41%46%43%
23828071424873010133818574819110355415174589Don't know10%10%7%13%6%8%9%8%12%16%10%8%8%9%6%13%6%10%
Page 35
The UK & The European UnionAbsolutes/col percents
Q.8. What is your opinion on each of the following statements?Please tell me for each statement, whether you are for it or against it.
The European Union being responsible for matters that cannot be effectively handled by national, regional and local governments
Base : All respondents
Prepared by EOS Gallup & ICM ResearchFieldwork Dates : 11th-26th November 2002

EU ScrappedUK MembershipMedia CoverageKnowledgeof EUA little/Great deal/
Very sorryIndifferentVery pleasedNot BenefitedBenefitedA bad thingA good thingUnfairFairNothingquite a lotTotal
15912917130924692764138025321723350753007296029Unweighted Total
16222868131424572763137825531774346552617686029Weighted Total
1086141924072817562661648845170724493782827You are for it67%49%18%30%64%19%65%48%49%47%49%47%
42511559631527822990718786149022833302613You are against it26%40%73%62%30%72%28%44%43%43%43%43%
11129411120218512218714226952960589Don't know7%10%8%8%7%9%7%8%8%10%8%10%
Page 36
The UK & The European UnionAbsolutes/col percents
Q.8. What is your opinion on each of the following statements?Please tell me for each statement, whether you are for it or against it.
The European Union being responsible for matters that cannot be effectively handled by national, regional and local governments
Base : All respondents
Prepared by EOS Gallup & ICM ResearchFieldwork Dates : 11th-26th November 2002

RegionNorthernYorks &IrelandScotlandWalesSouth WestSouth EastGreater LondonEasternWest MidlandsEast MidlandsHumbersideNorth WestNorthTotal
5005005005035025005015045075055035046029Unweighted Total
1645222995098267295465364285116962636029Weighted Total
1133582073205345083833532673054651773990You are for it69%69%69%63%65%70%70%66%63%60%67%67%66%
3210953117168151104105107139143501279You are against it20%21%18%23%20%21%19%20%25%27%21%19%21%
1955397212570597853678837760Don't know12%10%13%14%15%10%11%15%12%13%13%14%13%
Page 37
The UK & The European UnionAbsolutes/col percents
Q.8. What is your opinion on each of the following statements?Please tell me for each statement, whether you are for it or against it.
The resignation of the President of the European Commission and the European Commissioners if they do not have the support of a majority in the European Parliament
Base : All respondents
Prepared by EOS Gallup & ICM ResearchFieldwork Dates : 11th-26th November 2002

LocalityAge left FT EducationAgeSexOtherTown/urbanMetropoli16 or
RuralcentretanNever hadStill in21+19-2017-18younger65+55 - 6445 - 5435 - 4425 - 3415 - 24FemaleMaleTotal
25922648789222671065308123830901078967112512431020596325627736029Unweighted Total
2349270098029376111632212302916116476797811211095905309629336029Weighted Total
15461775669152318612208511800699518673771768562193320573990You are for it66%66%68%51%61%77%68%69%62%60%68%69%69%70%62%62%70%66%
50058619211114149672276902761502021931962616456341279You are against it21%22%20%39%30%13%21%18%24%24%20%21%17%18%29%21%22%21%
303339119331105351514261899810415813081518243760Don't know13%13%12%10%8%9%11%12%15%16%13%11%14%12%9%17%8%13%
Page 38
The UK & The European UnionAbsolutes/col percents
Q.8. What is your opinion on each of the following statements?Please tell me for each statement, whether you are for it or against it.
The resignation of the President of the European Commission and the European Commissioners if they do not have the support of a majority in the European Parliament
Base : All respondents
Prepared by EOS Gallup & ICM ResearchFieldwork Dates : 11th-26th November 2002

EU ScrappedUK MembershipMedia CoverageKnowledgeof EUA little/Great deal/
Very sorryIndifferentVery pleasedNot BenefitedBenefitedA bad thingA good thingUnfairFairNothingquite a lotTotal
15912917130924692764138025321723350753007296029Unweighted Total
16222868131424572763137825531774346552617686029Weighted Total
120318738271587198586818211218235233975933990You are for it74%65%63%65%72%63%71%69%68%65%77%66%
29259933859753434649137676911491301279You are against it18%21%26%24%19%25%19%21%22%22%17%21%
12739614927324316324118034471546760Don't know8%14%11%11%9%12%9%10%10%14%6%13%
Page 39
The UK & The European UnionAbsolutes/col percents
Q.8. What is your opinion on each of the following statements?Please tell me for each statement, whether you are for it or against it.
The resignation of the President of the European Commission and the European Commissioners if they do not have the support of a majority in the European Parliament
Base : All respondents
Prepared by EOS Gallup & ICM ResearchFieldwork Dates : 11th-26th November 2002

RegionNorthernYorks &IrelandScotlandWalesSouth WestSouth EastGreater LondonEasternWest MidlandsEast MidlandsHumbersideNorth WestNorthTotal
5005005005035025005015045075055035046029Unweighted Total
1645222995098267295465364285116962636029Weighted Total
1514702624326796314634533604146152325161You are for it92%90%88%85%82%87%85%85%84%81%88%88%86%
1039306411676676251716924680You are against it6%8%10%13%14%10%12%12%12%14%10%9%11%
313713322316201725118188Don't know2%2%2%3%4%3%3%4%4%5%2%3%3%
Page 40
The UK & The European UnionAbsolutes/col percents
Q.8. What is your opinion on each of the following statements?Please tell me for each statement, whether you are for it or against it.
Teaching school children about the way European Union institutions work
Base : All respondents
Prepared by EOS Gallup & ICM ResearchFieldwork Dates : 11th-26th November 2002

LocalityAge left FT EducationAgeSexOtherTown/urbanMetropoli16 or
RuralcentretanNever hadStill in21+19-2017-18younger65+55 - 6445 - 5435 - 4425 - 3415 - 24FemaleMaleTotal
25922648789222671065308123830901078967112512431020596325627736029Unweighted Total
2349270098029376111632212302916116476797811211095905309629336029Weighted Total
1975233585128334102028710712388921640844965992799268824735161You are for it84%87%87%95%89%91%89%87%82%79%83%86%86%91%88%87%84%86%
28828810413375251304111801001021347490288392680You are against it12%11%11%3%9%7%8%11%14%15%13%10%12%7%10%9%13%11%
867626*102192911863273222291512068188Don't know4%3%3%2%3%2%3%2%4%5%4%3%2%3%2%4%2%3%
Page 41
The UK & The European UnionAbsolutes/col percents
Q.8. What is your opinion on each of the following statements?Please tell me for each statement, whether you are for it or against it.
Teaching school children about the way European Union institutions work
Base : All respondents
Prepared by EOS Gallup & ICM ResearchFieldwork Dates : 11th-26th November 2002

EU ScrappedUK MembershipMedia CoverageKnowledgeof EUA little/Great deal/
Very sorryIndifferentVery pleasedNot BenefitedBenefitedA bad thingA good thingUnfairFairNothingquite a lotTotal
15912917130924692764138025321723350753007296029Unweighted Total
16222868131424572763137825531774346552617686029Weighted Total
153025508991881259795123751498303045026595161You are for it94%89%68%77%94%69%93%84%87%86%86%86%
6923236048413336713623635758794680You are against it4%8%27%20%5%27%5%13%10%11%12%11%
22865491336042407817315188Don't know1%3%4%4%1%4%2%2%2%3%2%3%
Page 42
The UK & The European UnionAbsolutes/col percents
Q.8. What is your opinion on each of the following statements?Please tell me for each statement, whether you are for it or against it.
Teaching school children about the way European Union institutions work
Base : All respondents
Prepared by EOS Gallup & ICM ResearchFieldwork Dates : 11th-26th November 2002

Q.8. Summary TableThe resignation
of thePresident ofThe European
the EuropeanUnion beingCommission andresponsible for
the Europeanmatters thatCommissionerscannot beOne common
Teaching schoolif they do noteffectivelyA commonforeign policychildren abouthave thehandled byThe enlargementdefence andamong theA European
the waysupport of anational,of the Europeansecurity policymember statesMonetary UnionEuropean Unionmajority in theregional andUnion toamong theof the Europeanwith one single
institutionsEuropeanlocalinclude newEuropean UnionUnion, towardscurrency, theworkParliamentgovernmentscountriesmember statesother countrieseuro
6029602960296029602960296029Unweighted Total
6029602960296029602960296029Weighted Total
5161399028273356375926082261You are for it86%66%47%56%62%43%37%
680127926132137177228743506You are against it11%21%43%35%29%48%58%
188760589537498548262Don't know3%13%10%9%8%9%4%
Page 43
The UK & The European UnionAbsolutes/col percents
Q.8. What is your opinion on each of the following statements?Please tell me for each statement, whether you are for it or against it.
Base : All respondents
Prepared by EOS Gallup & ICM ResearchFieldwork Dates : 11th-26th November 2002

RegionNorthernYorks &IrelandScotlandWalesSouth WestSouth EastGreater LondonEasternWest MidlandsEast MidlandsHumbersideNorth WestNorthTotal
5005005005035025005015045075055035046029Unweighted Total
1645222995098267295465364285116962636029Weighted Total
29100566514318897918584132411110You tend to trust it18%19%19%13%17%26%18%17%20%16%19%16%18%
1274142364316525204304143324095362164717You tend not to trust77%79%79%85%79%71%79%77%78%80%77%82%78%it
88713312119311118277202Don't know5%2%2%3%4%3%3%6%3%4%4%3%3%
Page 44
The UK & The European UnionAbsolutes/col percents
Q.9 I would like to ask you a question about how much trust you have in certain institutions.For each of the following institutions, please tell me if you tend to trust it or tend not to trust it?
The press
Base : All respondents
Prepared by EOS Gallup & ICM ResearchFieldwork Dates : 11th-26th November 2002
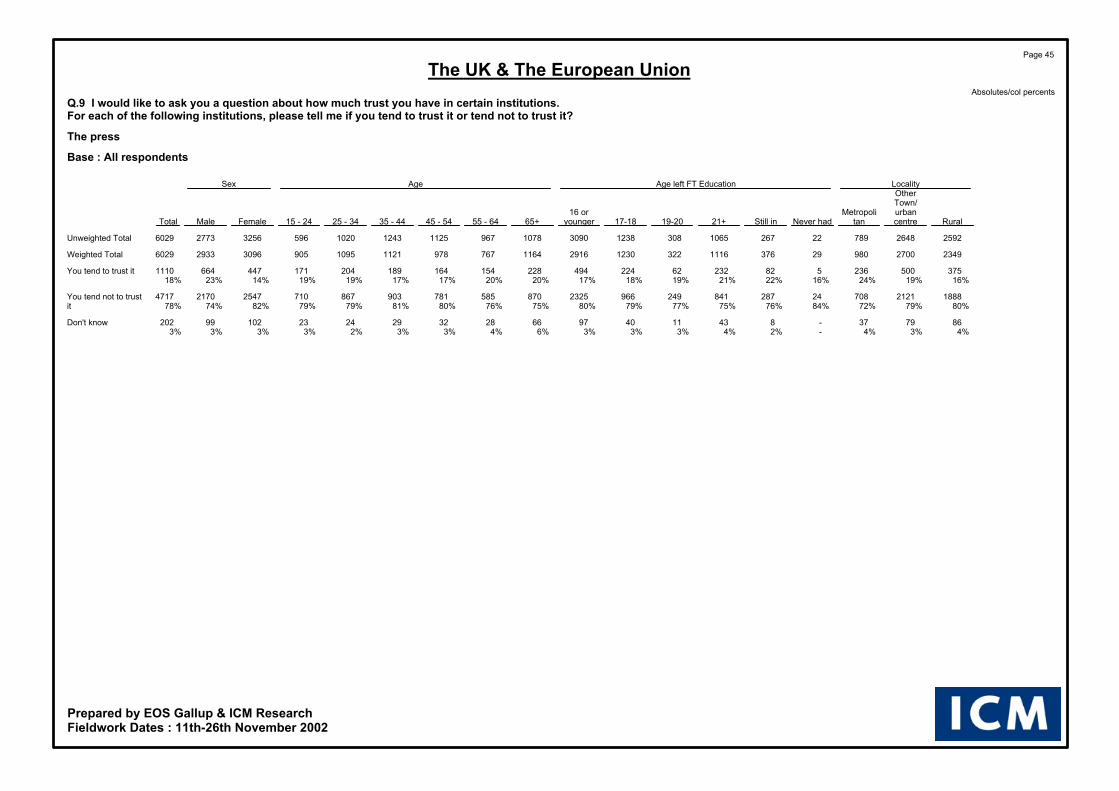
LocalityAge left FT EducationAgeSexOtherTown/urbanMetropoli16 or
RuralcentretanNever hadStill in21+19-2017-18younger65+55 - 6445 - 5435 - 4425 - 3415 - 24FemaleMaleTotal
25922648789222671065308123830901078967112512431020596325627736029Unweighted Total
2349270098029376111632212302916116476797811211095905309629336029Weighted Total
375500236582232622244942281541641892041714476641110You tend to trust it16%19%24%16%22%21%19%18%17%20%20%17%17%19%19%14%23%18%
18882121708242878412499662325870585781903867710254721704717You tend not to trust80%79%72%84%76%75%77%79%80%75%76%80%81%79%79%82%74%78%it
867937-84311409766283229242310299202Don't know4%3%4%-2%4%3%3%3%6%4%3%3%2%3%3%3%3%
Page 45
The UK & The European UnionAbsolutes/col percents
Q.9 I would like to ask you a question about how much trust you have in certain institutions.For each of the following institutions, please tell me if you tend to trust it or tend not to trust it?
The press
Base : All respondents
Prepared by EOS Gallup & ICM ResearchFieldwork Dates : 11th-26th November 2002

EU ScrappedUK MembershipMedia CoverageKnowledgeof EUA little/Great deal/
Very sorryIndifferentVery pleasedNot BenefitedBenefitedA bad thingA good thingUnfairFairNothingquite a lotTotal
15912917130924692764138025321723350753007296029Unweighted Total
16222868131424572763137825531774346552617686029Weighted Total
3464632564315572805022427749231871110You tend to trust it21%16%19%18%20%20%20%14%22%18%24%18%
12262328100219392130105119711489258041665514717You tend not to trust76%81%76%79%77%76%77%84%74%79%72%78%it
497756867648794311117131202Don't know3%3%4%4%3%3%3%2%3%3%4%3%
Page 46
The UK & The European UnionAbsolutes/col percents
Q.9 I would like to ask you a question about how much trust you have in certain institutions.For each of the following institutions, please tell me if you tend to trust it or tend not to trust it?
The press
Base : All respondents
Prepared by EOS Gallup & ICM ResearchFieldwork Dates : 11th-26th November 2002

RegionNorthernYorks &IrelandScotlandWalesSouth WestSouth EastGreater LondonEasternWest MidlandsEast MidlandsHumbersideNorth WestNorthTotal
5005005005035025005015045075055035046029Unweighted Total
1645222995098267295465364285116962636029Weighted Total
1103551923465254763553502763404361673927You tend to trust it67%68%64%68%64%65%65%65%64%66%63%63%65%
4512981124245208154133125126186711628You tend not to trust27%25%27%24%30%29%28%25%29%25%27%27%27%it
93826395645375327457425475Don't know5%7%9%8%7%6%7%10%6%9%11%10%8%
Page 47
The UK & The European UnionAbsolutes/col percents
Q.9 I would like to ask you a question about how much trust you have in certain institutions.For each of the following institutions, please tell me if you tend to trust it or tend not to trust it?
Radio
Base : All respondents
Prepared by EOS Gallup & ICM ResearchFieldwork Dates : 11th-26th November 2002

LocalityAge left FT EducationAgeSexOtherTown/urbanMetropoli16 or
RuralcentretanNever hadStill in21+19-2017-18younger65+55 - 6445 - 5435 - 4425 - 3415 - 24FemaleMaleTotal
25922648789222671065308123830901078967112512431020596325627736029Unweighted Total
2349270098029376111632212302916116476797811211095905309629336029Weighted Total
15371727662212557752368011812725520609760704608190720193927You tend to trust it65%64%68%72%68%69%73%65%62%62%68%62%68%64%67%62%69%65%
6157592537107276703408182861722882873312639087191628You tend not to trust26%28%26%23%29%25%22%28%28%25%22%29%26%30%29%29%25%27%it
197213651146516892861537480746034281194475Don't know8%8%7%4%4%6%5%7%10%13%10%8%7%5%4%9%7%8%
Page 48
The UK & The European UnionAbsolutes/col percents
Q.9 I would like to ask you a question about how much trust you have in certain institutions.For each of the following institutions, please tell me if you tend to trust it or tend not to trust it?
Radio
Base : All respondents
Prepared by EOS Gallup & ICM ResearchFieldwork Dates : 11th-26th November 2002

EU ScrappedUK MembershipMedia CoverageKnowledgeof EUA little/Great deal/
Very sorryIndifferentVery pleasedNot BenefitedBenefitedA bad thingA good thingUnfairFairNothingquite a lotTotal
15912917130924692764138025321723350753007296029Unweighted Total
16222868131424572763137825531774346552617686029Weighted Total
115818248081501195182317771102237833835443927You tend to trust it71%64%61%61%71%60%70%62%69%64%71%65%
35481739576564143360453886014521751628You tend not to trust22%28%30%31%23%31%24%30%25%28%23%27%it
10922711119017112317113422742649475Don't know7%8%8%8%6%9%7%8%7%8%6%8%
Page 49
The UK & The European UnionAbsolutes/col percents
Q.9 I would like to ask you a question about how much trust you have in certain institutions.For each of the following institutions, please tell me if you tend to trust it or tend not to trust it?
Radio
Base : All respondents
Prepared by EOS Gallup & ICM ResearchFieldwork Dates : 11th-26th November 2002

RegionNorthernYorks &IrelandScotlandWalesSouth WestSouth EastGreater LondonEasternWest MidlandsEast MidlandsHumbersideNorth WestNorthTotal
5005005005035025005015045075055035046029Unweighted Total
1645222995098267295465364285116962636029Weighted Total
1083622043314924653883652813514701814000You tend to trust it66%69%68%65%60%64%71%68%66%69%68%69%66%
4914783143292234141146125144190691762You tend not to trust30%28%28%28%35%32%26%27%29%28%27%26%29%it
71312364230182422163513268Don't know4%2%4%7%5%4%3%5%5%3%5%5%4%
Page 50
The UK & The European UnionAbsolutes/col percents
Q.9 I would like to ask you a question about how much trust you have in certain institutions.For each of the following institutions, please tell me if you tend to trust it or tend not to trust it?
Television
Base : All respondents
Prepared by EOS Gallup & ICM ResearchFieldwork Dates : 11th-26th November 2002

LocalityAge left FT EducationAgeSexOtherTown/urbanMetropoli16 or
RuralcentretanNever hadStill in21+19-2017-18younger65+55 - 6445 - 5435 - 4425 - 3415 - 24FemaleMaleTotal
25922648789222671065308123830901078967112512431020596325627736029Unweighted Total
2349270098029376111632212302916116476797811211095905309629336029Weighted Total
15881772640232716662278071980733512619753729654203119694000You tend to trust it68%66%65%81%72%60%70%66%68%63%67%63%67%67%72%66%67%66%
669789303695387853608183622183013173302339028601762You tend not to trust28%29%31%19%25%35%26%29%28%31%28%31%28%30%26%29%29%29%it
9213837-11631063119683758503518163105268Don't know4%5%4%-3%6%3%5%4%6%5%6%5%3%2%5%4%4%
Page 51
The UK & The European UnionAbsolutes/col percents
Q.9 I would like to ask you a question about how much trust you have in certain institutions.For each of the following institutions, please tell me if you tend to trust it or tend not to trust it?
Television
Base : All respondents
Prepared by EOS Gallup & ICM ResearchFieldwork Dates : 11th-26th November 2002
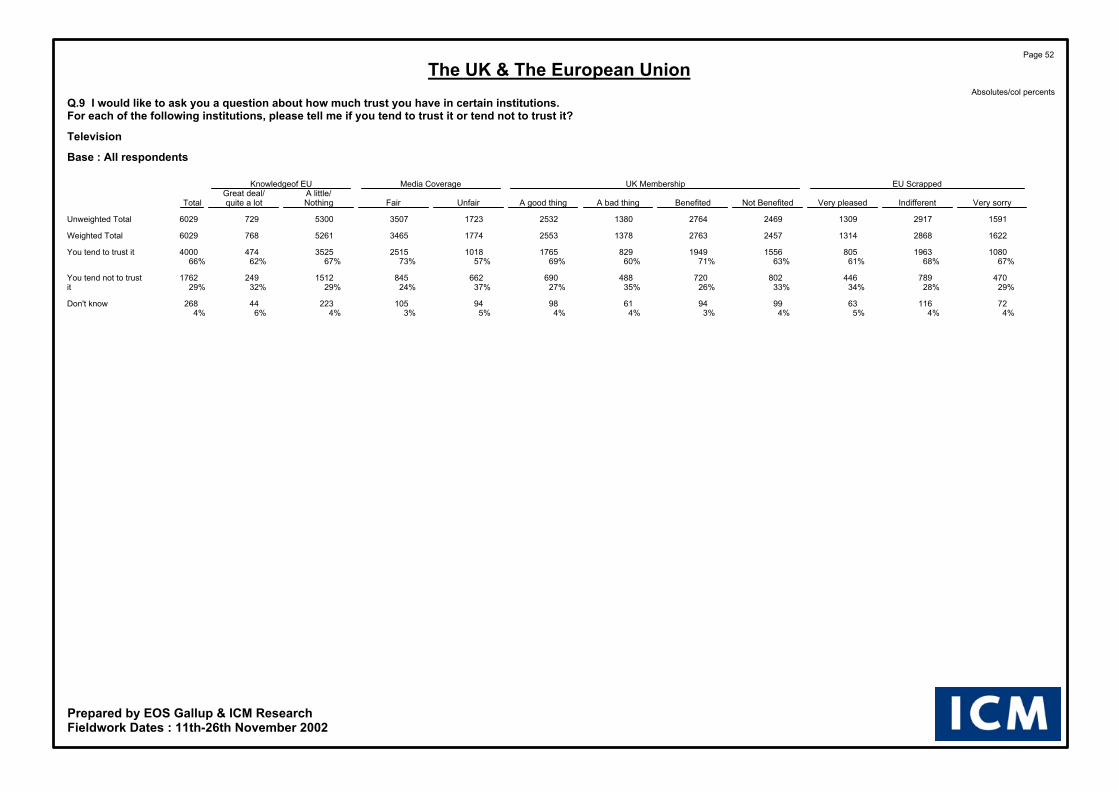
EU ScrappedUK MembershipMedia CoverageKnowledgeof EUA little/Great deal/
Very sorryIndifferentVery pleasedNot BenefitedBenefitedA bad thingA good thingUnfairFairNothingquite a lotTotal
15912917130924692764138025321723350753007296029Unweighted Total
16222868131424572763137825531774346552617686029Weighted Total
108019638051556194982917651018251535254744000You tend to trust it67%68%61%63%71%60%69%57%73%67%62%66%
47078944680272048869066284515122491762You tend not to trust29%28%34%33%26%35%27%37%24%29%32%29%it
7211663999461989410522344268Don't know4%4%5%4%3%4%4%5%3%4%6%4%
Page 52
The UK & The European UnionAbsolutes/col percents
Q.9 I would like to ask you a question about how much trust you have in certain institutions.For each of the following institutions, please tell me if you tend to trust it or tend not to trust it?
Television
Base : All respondents
Prepared by EOS Gallup & ICM ResearchFieldwork Dates : 11th-26th November 2002

RegionNorthernYorks &IrelandScotlandWalesSouth WestSouth EastGreater LondonEasternWest MidlandsEast MidlandsHumbersideNorth WestNorthTotal
5005005005035025005015045075055035046029Unweighted Total
1645222995098267295465364285116962636029Weighted Total
892201361692383051992071491983051202336You tend to trust it54%42%46%33%29%42%36%39%35%39%44%46%39%
612531392944933683012782342682991193107You tend not to trust37%48%46%58%60%51%55%52%55%52%43%45%52%it
145024479456475044449225587Don't know8%10%8%9%11%8%9%9%10%9%13%9%10%
Page 53
The UK & The European UnionAbsolutes/col percents
Q.9 I would like to ask you a question about how much trust you have in certain institutions.For each of the following institutions, please tell me if you tend to trust it or tend not to trust it?
Trade unions
Base : All respondents
Prepared by EOS Gallup & ICM ResearchFieldwork Dates : 11th-26th November 2002

LocalityAge left FT EducationAgeSexOtherTown/urbanMetropoli16 or
RuralcentretanNever hadStill in21+19-2017-18younger65+55 - 6445 - 5435 - 4425 - 3415 - 24FemaleMaleTotal
25922648789222671065308123830901078967112512431020596325627736029Unweighted Total
2349270098029376111632212302916116476797811211095905309629336029Weighted Total
8141133388132224231324701057297221343421504549123211032336You tend to trust it35%42%40%45%59%38%41%38%36%25%29%35%38%46%61%40%38%39%
1313129949481255941656531551708462552610489286148416233107You tend not to trust56%48%50%27%33%53%51%53%53%61%60%56%54%45%32%48%55%52%it
222267988301002510830915983829110270380207587Don't know9%10%10%28%8%9%8%9%11%14%11%8%8%9%8%12%7%10%
Page 54
The UK & The European UnionAbsolutes/col percents
Q.9 I would like to ask you a question about how much trust you have in certain institutions.For each of the following institutions, please tell me if you tend to trust it or tend not to trust it?
Trade unions
Base : All respondents
Prepared by EOS Gallup & ICM ResearchFieldwork Dates : 11th-26th November 2002

EU ScrappedUK MembershipMedia CoverageKnowledgeof EUA little/Great deal/
Very sorryIndifferentVery pleasedNot BenefitedBenefitedA bad thingA good thingUnfairFairNothingquite a lotTotal
15912917130924692764138025321723350753007296029Unweighted Total
16222868131424572763137825531774346552617686029Weighted Total
738120331472913083431163637145720562792336You tend to trust it45%42%24%30%47%25%46%36%42%39%36%39%
7451396881152712349191167992173326694373107You tend not to trust46%49%67%62%45%67%46%56%50%51%57%52%it
13926811920122111722314527553552587Don't know9%9%9%8%8%8%9%8%8%10%7%10%
Page 55
The UK & The European UnionAbsolutes/col percents
Q.9 I would like to ask you a question about how much trust you have in certain institutions.For each of the following institutions, please tell me if you tend to trust it or tend not to trust it?
Trade unions
Base : All respondents
Prepared by EOS Gallup & ICM ResearchFieldwork Dates : 11th-26th November 2002

RegionNorthernYorks &IrelandScotlandWalesSouth WestSouth EastGreater LondonEasternWest MidlandsEast MidlandsHumbersideNorth WestNorthTotal
5005005005035025005015045075055035046029Unweighted Total
1645222995098267295465364285116962636029Weighted Total
329058751181289079699011355996You tend to trust it19%17%19%15%14%18%16%15%16%18%16%21%17%
1244072254046675764264333413975381944732You tend not to trust76%78%75%79%81%79%78%81%80%78%77%74%78%it
82616304225302318244414301Don't know5%5%5%6%5%3%6%4%4%5%6%5%5%
Page 56
The UK & The European UnionAbsolutes/col percents
Q.9 I would like to ask you a question about how much trust you have in certain institutions.For each of the following institutions, please tell me if you tend to trust it or tend not to trust it?
Political parties
Base : All respondents
Prepared by EOS Gallup & ICM ResearchFieldwork Dates : 11th-26th November 2002

LocalityAge left FT EducationAgeSexOtherTown/urbanMetropoli16 or
RuralcentretanNever hadStill in21+19-2017-18younger65+55 - 6445 - 5435 - 4425 - 3415 - 24FemaleMaleTotal
25922648789222671065308123830901078967112512431020596325627736029Unweighted Total
2349270098029376111632212302916116476797811211095905309629336029Weighted Total
37644018071361584718145320493121117172291513483996You tend to trust it16%16%18%23%36%14%15%15%16%17%12%12%10%16%32%17%16%17%
18552114763202239112579922306883624815949875586239923334732You tend not to trust79%78%78%70%59%82%80%81%79%76%81%83%85%80%65%77%80%78%it
11814637217481756158775042564828183117301Don't know5%5%4%7%5%4%5%5%5%7%7%4%5%4%3%6%4%5%
Page 57
The UK & The European UnionAbsolutes/col percents
Q.9 I would like to ask you a question about how much trust you have in certain institutions.For each of the following institutions, please tell me if you tend to trust it or tend not to trust it?
Political parties
Base : All respondents
Prepared by EOS Gallup & ICM ResearchFieldwork Dates : 11th-26th November 2002

EU ScrappedUK MembershipMedia CoverageKnowledgeof EUA little/Great deal/
Very sorryIndifferentVery pleasedNot BenefitedBenefitedA bad thingA good thingUnfairFairNothingquite a lotTotal
15912917130924692764138025321723350753007296029Unweighted Total
16222868131424572763137825531774346552617686029Weighted Total
355467123279608136542233667882114996You tend to trust it22%16%9%11%22%10%21%13%19%17%15%17%
11902271114020912033119418861477263741126204732You tend not to trust73%79%87%85%74%87%74%83%76%78%81%78%it
761305087123491246416126635301Don't know5%5%4%4%4%4%5%4%5%5%5%5%
Page 58
The UK & The European UnionAbsolutes/col percents
Q.9 I would like to ask you a question about how much trust you have in certain institutions.For each of the following institutions, please tell me if you tend to trust it or tend not to trust it?
Political parties
Base : All respondents
Prepared by EOS Gallup & ICM ResearchFieldwork Dates : 11th-26th November 2002
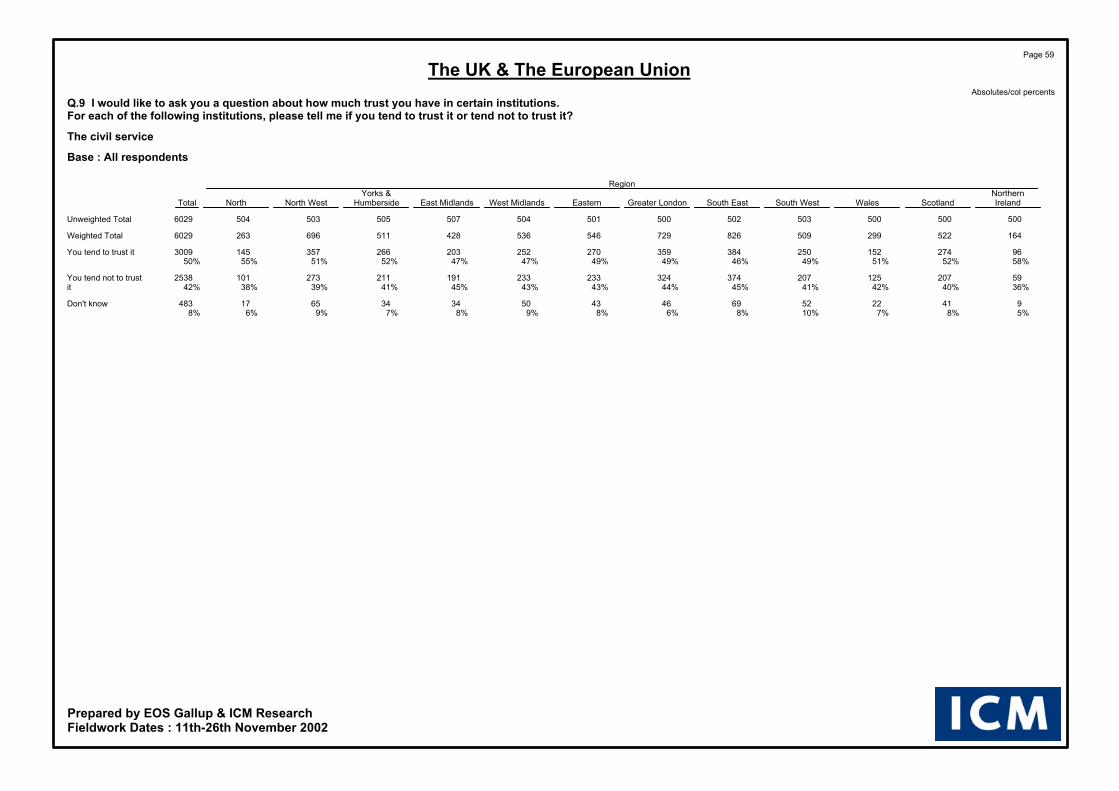
RegionNorthernYorks &IrelandScotlandWalesSouth WestSouth EastGreater LondonEasternWest MidlandsEast MidlandsHumbersideNorth WestNorthTotal
5005005005035025005015045075055035046029Unweighted Total
1645222995098267295465364285116962636029Weighted Total
962741522503843592702522032663571453009You tend to trust it58%52%51%49%46%49%49%47%47%52%51%55%50%
592071252073743242332331912112731012538You tend not to trust36%40%42%41%45%44%43%43%45%41%39%38%42%it
94122526946435034346517483Don't know5%8%7%10%8%6%8%9%8%7%9%6%8%
Page 59
The UK & The European UnionAbsolutes/col percents
Q.9 I would like to ask you a question about how much trust you have in certain institutions.For each of the following institutions, please tell me if you tend to trust it or tend not to trust it?
The civil service
Base : All respondents
Prepared by EOS Gallup & ICM ResearchFieldwork Dates : 11th-26th November 2002

LocalityAge left FT EducationAgeSexOtherTown/urbanMetropoli16 or
RuralcentretanNever hadStill in21+19-2017-18younger65+55 - 6445 - 5435 - 4425 - 3415 - 24FemaleMaleTotal
25922648789222671065308123830901078967112512431020596325627736029Unweighted Total
2349270098029376111632212302916116476797811211095905309629336029Weighted Total
11161374519192715631906461294512326414500605651158414253009You tend to trust it48%51%53%64%72%50%59%52%44%44%42%42%45%55%72%51%49%50%
104710933986754701064941379530380490536403199119513422538You tend not to trust45%40%41%20%20%42%33%40%47%46%50%50%48%37%22%39%46%42%it
186233645318326912431226173858754317166483Don't know8%9%7%16%8%7%8%7%8%10%8%8%8%8%6%10%6%8%
Page 60
The UK & The European UnionAbsolutes/col percents
Q.9 I would like to ask you a question about how much trust you have in certain institutions.For each of the following institutions, please tell me if you tend to trust it or tend not to trust it?
The civil service
Base : All respondents
Prepared by EOS Gallup & ICM ResearchFieldwork Dates : 11th-26th November 2002

EU ScrappedUK MembershipMedia CoverageKnowledgeof EUA little/Great deal/
Very sorryIndifferentVery pleasedNot BenefitedBenefitedA bad thingA good thingUnfairFairNothingquite a lotTotal
15912917130924692764138025321723350753007296029Unweighted Total
16222868131424572763137825531774346552617686029Weighted Total
9191541461101216325071458805191026293793009You tend to trust it57%54%35%41%59%37%57%45%55%50%49%50%
59511077551282962770923850133021953432538You tend not to trust37%39%57%52%35%56%36%48%38%42%45%42%it
1072199816316810117111922643646483Don't know7%8%7%7%6%7%7%7%7%8%6%8%
Page 61
The UK & The European UnionAbsolutes/col percents
Q.9 I would like to ask you a question about how much trust you have in certain institutions.For each of the following institutions, please tell me if you tend to trust it or tend not to trust it?
The civil service
Base : All respondents
Prepared by EOS Gallup & ICM ResearchFieldwork Dates : 11th-26th November 2002

RegionNorthernYorks &IrelandScotlandWalesSouth WestSouth EastGreater LondonEasternWest MidlandsEast MidlandsHumbersideNorth WestNorthTotal
5005005005035025005015045075055035046029Unweighted Total
1645222995098267295465364285116962636029Weighted Total
4214566112184155139147116144182651496You tend to trust it26%28%22%22%22%21%25%27%27%28%26%25%25%
1143432173605845313553502923304581804114You tend not to trust70%66%73%71%71%73%65%65%68%65%66%68%68%it
73416375943523820385618418Don't know4%7%5%7%7%6%10%7%5%7%8%7%7%
Page 62
The UK & The European UnionAbsolutes/col percents
Q.9 I would like to ask you a question about how much trust you have in certain institutions.For each of the following institutions, please tell me if you tend to trust it or tend not to trust it?
Big companies
Base : All respondents
Prepared by EOS Gallup & ICM ResearchFieldwork Dates : 11th-26th November 2002

LocalityAge left FT EducationAgeSexOtherTown/urbanMetropoli16 or
RuralcentretanNever hadStill in21+19-2017-18younger65+55 - 6445 - 5435 - 4425 - 3415 - 24FemaleMaleTotal
25922648789222671065308123830901078967112512431020596325627736029Unweighted Total
2349270098029376111632212302916116476797811211095905309629336029Weighted Total
61566122013126208853317222481712232592982987917061496You tend to trust it26%25%22%44%33%19%26%27%25%21%22%23%23%27%33%26%24%25%
15591851704152298442118191973797536697784740559203320814114You tend not to trust66%69%72%52%61%76%65%67%68%68%70%71%70%68%62%66%71%68%it
176187561216526802221186058785747272146418Don't know7%7%6%4%6%6%8%7%8%10%8%6%7%5%5%9%5%7%
Page 63
The UK & The European UnionAbsolutes/col percents
Q.9 I would like to ask you a question about how much trust you have in certain institutions.For each of the following institutions, please tell me if you tend to trust it or tend not to trust it?
Big companies
Base : All respondents
Prepared by EOS Gallup & ICM ResearchFieldwork Dates : 11th-26th November 2002

EU ScrappedUK MembershipMedia CoverageKnowledgeof EUA little/Great deal/
Very sorryIndifferentVery pleasedNot BenefitedBenefitedA bad thingA good thingUnfairFairNothingquite a lotTotal
15912917130924692764138025321723350753007296029Unweighted Total
16222868131424572763137825531774346552617686029Weighted Total
38179227555673727766834297313141821496You tend to trust it23%28%21%23%27%20%26%19%28%25%24%25%
1155187595617591874101117451326229735645504114You tend not to trust71%65%73%72%68%73%68%75%66%68%72%68%it
86200831421529114010519538236418Don't know5%7%6%6%5%7%5%6%6%7%5%7%
Page 64
The UK & The European UnionAbsolutes/col percents
Q.9 I would like to ask you a question about how much trust you have in certain institutions.For each of the following institutions, please tell me if you tend to trust it or tend not to trust it?
Big companies
Base : All respondents
Prepared by EOS Gallup & ICM ResearchFieldwork Dates : 11th-26th November 2002

RegionNorthernYorks &IrelandScotlandWalesSouth WestSouth EastGreater LondonEasternWest MidlandsEast MidlandsHumbersideNorth WestNorthTotal
5005005005035025005015045075055035046029Unweighted Total
1645222995098267295465364285116962636029Weighted Total
651981141763293162152131482102771212383You tend to trust it40%38%38%35%40%43%39%40%35%41%40%46%40%
892961723014503832942992542743811283321You tend not to trust55%57%57%59%54%53%54%56%59%54%55%49%55%it
92813334829382425263714325Don't know6%5%4%6%6%4%7%4%6%5%5%5%5%
Page 65
The UK & The European UnionAbsolutes/col percents
Q.9 I would like to ask you a question about how much trust you have in certain institutions.For each of the following institutions, please tell me if you tend to trust it or tend not to trust it?
The British government
Base : All respondents
Prepared by EOS Gallup & ICM ResearchFieldwork Dates : 11th-26th November 2002
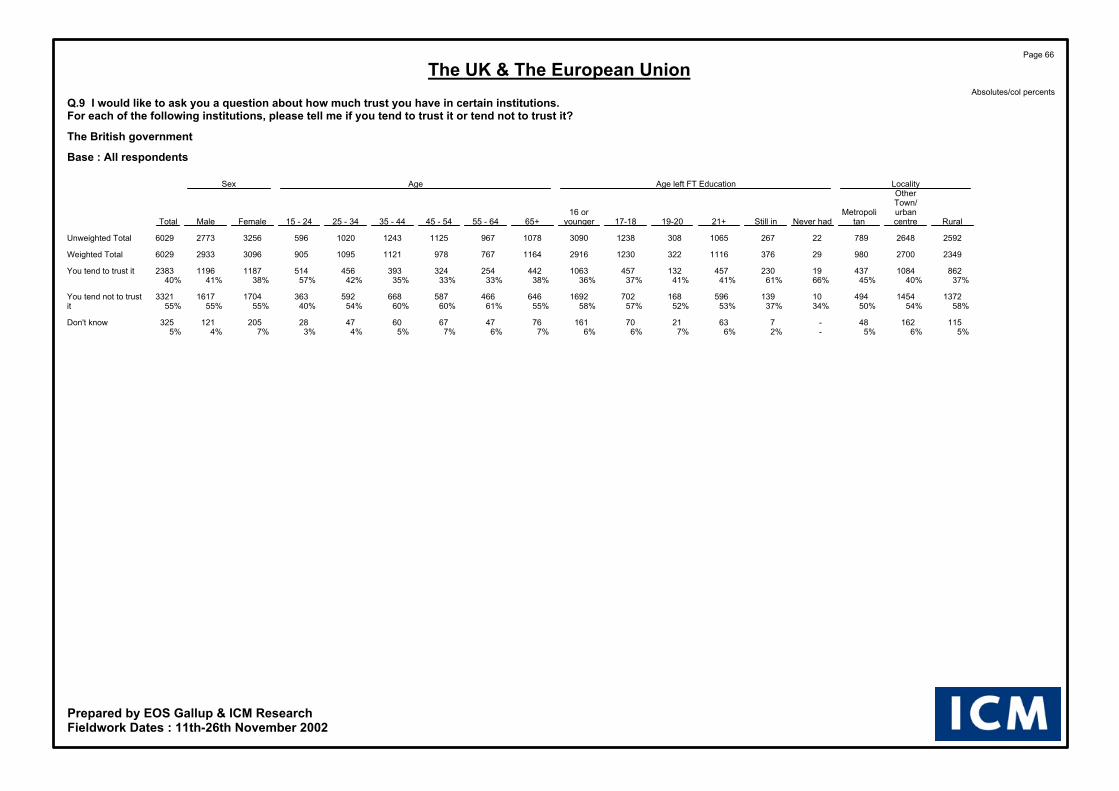
LocalityAge left FT EducationAgeSexOtherTown/urbanMetropoli16 or
RuralcentretanNever hadStill in21+19-2017-18younger65+55 - 6445 - 5435 - 4425 - 3415 - 24FemaleMaleTotal
25922648789222671065308123830901078967112512431020596325627736029Unweighted Total
2349270098029376111632212302916116476797811211095905309629336029Weighted Total
8621084437192304571324571063442254324393456514118711962383You tend to trust it37%40%45%66%61%41%41%37%36%38%33%33%35%42%57%38%41%40%
13721454494101395961687021692646466587668592363170416173321You tend not to trust58%54%50%34%37%53%52%57%58%55%61%60%60%54%40%55%55%55%it
11516248-7632170161764767604728205121325Don't know5%6%5%-2%6%7%6%6%7%6%7%5%4%3%7%4%5%
Page 66
The UK & The European UnionAbsolutes/col percents
Q.9 I would like to ask you a question about how much trust you have in certain institutions.For each of the following institutions, please tell me if you tend to trust it or tend not to trust it?
The British government
Base : All respondents
Prepared by EOS Gallup & ICM ResearchFieldwork Dates : 11th-26th November 2002

EU ScrappedUK MembershipMedia CoverageKnowledgeof EUA little/Great deal/
Very sorryIndifferentVery pleasedNot BenefitedBenefitedA bad thingA good thingUnfairFairNothingquite a lotTotal
15912917130924692764138025321723350753007296029Unweighted Total
16222868131424572763137825531774346552617686029Weighted Total
846114029367514183031288591153820872962383You tend to trust it52%40%22%27%51%22%50%33%44%40%39%40%
697157896016701223102411511100175928824393321You tend not to trust43%55%73%68%44%74%45%62%51%55%57%55%it
7915060111122521148316929233325Don't know5%5%5%5%4%4%4%5%5%6%4%5%
Page 67
The UK & The European UnionAbsolutes/col percents
Q.9 I would like to ask you a question about how much trust you have in certain institutions.For each of the following institutions, please tell me if you tend to trust it or tend not to trust it?
The British government
Base : All respondents
Prepared by EOS Gallup & ICM ResearchFieldwork Dates : 11th-26th November 2002

RegionNorthernYorks &IrelandScotlandWalesSouth WestSouth EastGreater LondonEasternWest MidlandsEast MidlandsHumbersideNorth WestNorthTotal
5005005005035025005015045075055035046029Unweighted Total
1645222995098267295465364285116962636029Weighted Total
782341332293813882562472032453561392888You tend to trust it47%45%45%45%46%53%47%46%47%48%51%53%48%
762611542463853132542632032333101142812You tend not to trust47%50%51%48%47%43%47%49%47%46%45%43%47%it
102612346129362622333011330Don't know6%5%4%7%7%4%7%5%5%7%4%4%5%
Page 68
The UK & The European UnionAbsolutes/col percents
Q.9 I would like to ask you a question about how much trust you have in certain institutions.For each of the following institutions, please tell me if you tend to trust it or tend not to trust it?
The British Parliament (House of Commons)
Base : All respondents
Prepared by EOS Gallup & ICM ResearchFieldwork Dates : 11th-26th November 2002

LocalityAge left FT EducationAgeSexOtherTown/urbanMetropoli16 or
RuralcentretanNever hadStill in21+19-2017-18younger65+55 - 6445 - 5435 - 4425 - 3415 - 24FemaleMaleTotal
25922648789222671065308123830901078967112512431020596325627736029Unweighted Total
2349270098029376111632212302916116476797811211095905309629336029Weighted Total
10831255550142316271665771246532348439511543514138515032888You tend to trust it46%46%56%50%61%56%52%47%43%46%45%45%46%50%57%45%51%48%
11471280384131314351375781507551378485549498351148313292812You tend not to trust49%47%39%44%35%39%42%47%52%47%49%50%49%45%39%48%45%47%it
12016545214541974163814153615439228101330Don't know5%6%5%6%4%5%6%6%6%7%5%5%5%5%4%7%3%5%
Page 69
The UK & The European UnionAbsolutes/col percents
Q.9 I would like to ask you a question about how much trust you have in certain institutions.For each of the following institutions, please tell me if you tend to trust it or tend not to trust it?
The British Parliament (House of Commons)
Base : All respondents
Prepared by EOS Gallup & ICM ResearchFieldwork Dates : 11th-26th November 2002

EU ScrappedUK MembershipMedia CoverageKnowledgeof EUA little/Great deal/
Very sorryIndifferentVery pleasedNot BenefitedBenefitedA bad thingA good thingUnfairFairNothingquite a lotTotal
15912917130924692764138025321723350753007296029Unweighted Total
16222868131424572763137825531774346552617686029Weighted Total
1040133041587517124401526784181624684202888You tend to trust it64%46%32%36%62%32%60%44%52%47%55%48%
52413618481485940893902907147924953162812You tend not to trust32%47%65%60%34%65%35%51%43%47%41%47%it
581775197112461258217029832330Don't know4%6%4%4%4%3%5%5%5%6%4%5%
Page 70
The UK & The European UnionAbsolutes/col percents
Q.9 I would like to ask you a question about how much trust you have in certain institutions.For each of the following institutions, please tell me if you tend to trust it or tend not to trust it?
The British Parliament (House of Commons)
Base : All respondents
Prepared by EOS Gallup & ICM ResearchFieldwork Dates : 11th-26th November 2002

RegionNorthernYorks &IrelandScotlandWalesSouth WestSouth EastGreater LondonEasternWest MidlandsEast MidlandsHumbersideNorth WestNorthTotal
5005005005035025005015045075055035046029Unweighted Total
1645222995098267295465364285116962636029Weighted Total
1012601292053013472122191832043061122579You tend to trust it62%50%43%40%36%48%39%41%43%40%44%43%43%
502061402444223242702502062582941222785You tend not to trust31%39%47%48%51%44%49%47%48%51%42%46%46%it
1356316110458646739499629666Don't know8%11%10%12%13%8%12%13%9%10%14%11%11%
Page 71
The UK & The European UnionAbsolutes/col percents
Q.9 I would like to ask you a question about how much trust you have in certain institutions.For each of the following institutions, please tell me if you tend to trust it or tend not to trust it?
The European Union
Base : All respondents
Prepared by EOS Gallup & ICM ResearchFieldwork Dates : 11th-26th November 2002

LocalityAge left FT EducationAgeSexOtherTown/urbanMetropoli16 or
RuralcentretanNever hadStill in21+19-2017-18younger65+55 - 6445 - 5435 - 4425 - 3415 - 24FemaleMaleTotal
25922648789222671065308123830901078967112512431020596325627736029Unweighted Total
2349270098029376111632212302916116476797811211095905309629336029Weighted Total
9311150498182655721665221012305238379444586626130412752579You tend to trust it40%43%51%63%70%51%52%42%35%26%31%39%40%54%69%42%43%43%
116812144038874521235751526705440499532387222134414412785You tend not to trust50%45%41%27%23%40%38%47%52%61%57%51%47%35%25%43%49%46%it
251336793259233133378154899914512256448218666Don't know11%12%8%10%7%8%10%11%13%13%12%10%13%11%6%14%7%11%
Page 72
The UK & The European UnionAbsolutes/col percents
Q.9 I would like to ask you a question about how much trust you have in certain institutions.For each of the following institutions, please tell me if you tend to trust it or tend not to trust it?
The European Union
Base : All respondents
Prepared by EOS Gallup & ICM ResearchFieldwork Dates : 11th-26th November 2002

EU ScrappedUK MembershipMedia CoverageKnowledgeof EUA little/Great deal/
Very sorryIndifferentVery pleasedNot BenefitedBenefitedA bad thingA good thingUnfairFairNothingquite a lotTotal
15912917130924692764138025321723350753007296029Unweighted Total
16222868131424572763137825531774346552617686029Weighted Total
1109126514553317921641657738164022413372579You tend to trust it68%44%11%22%65%12%65%42%47%43%44%43%
3911229108717227571126671878150823933912785You tend not to trust24%43%83%70%27%82%26%49%44%45%51%46%it
122374822022148822515731862639666Don't know8%13%6%8%8%6%9%9%9%12%5%11%
Page 73
The UK & The European UnionAbsolutes/col percents
Q.9 I would like to ask you a question about how much trust you have in certain institutions.For each of the following institutions, please tell me if you tend to trust it or tend not to trust it?
The European Union
Base : All respondents
Prepared by EOS Gallup & ICM ResearchFieldwork Dates : 11th-26th November 2002

RegionNorthernYorks &IrelandScotlandWalesSouth WestSouth EastGreater LondonEasternWest MidlandsEast MidlandsHumbersideNorth WestNorthTotal
5005005005035025005015045075055035046029Unweighted Total
1645222995098267295465364285116962636029Weighted Total
1273932203985685073903813123465171944354You tend to trust it78%75%74%78%69%70%71%71%73%68%74%74%72%
2697637919617711711289124122491250You tend not to trust16%19%21%15%24%24%21%21%21%24%17%19%21%it
103216326244394327405720424Don't know6%6%5%6%8%6%7%8%6%8%8%8%7%
Page 74
The UK & The European UnionAbsolutes/col percents
Q.9 I would like to ask you a question about how much trust you have in certain institutions.For each of the following institutions, please tell me if you tend to trust it or tend not to trust it?
The United Nations
Base : All respondents
Prepared by EOS Gallup & ICM ResearchFieldwork Dates : 11th-26th November 2002
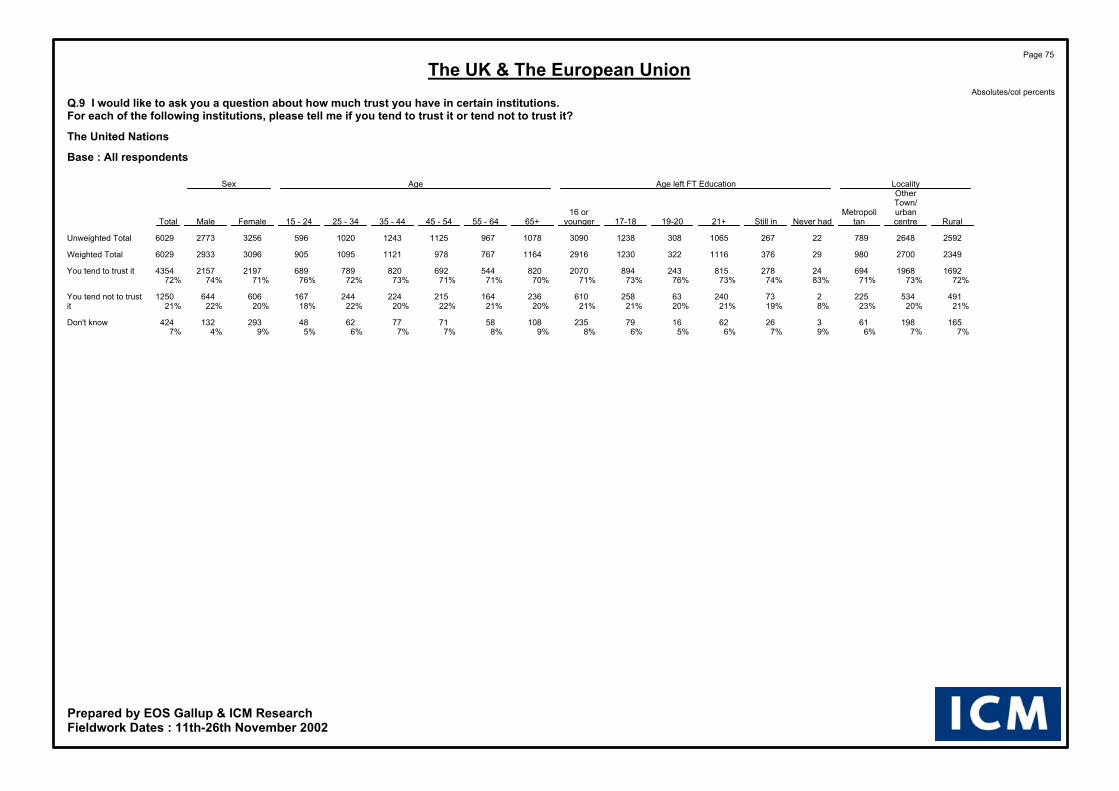
LocalityAge left FT EducationAgeSexOtherTown/urbanMetropoli16 or
RuralcentretanNever hadStill in21+19-2017-18younger65+55 - 6445 - 5435 - 4425 - 3415 - 24FemaleMaleTotal
25922648789222671065308123830901078967112512431020596325627736029Unweighted Total
2349270098029376111632212302916116476797811211095905309629336029Weighted Total
16921968694242788152438942070820544692820789689219721574354You tend to trust it72%73%71%83%74%73%76%73%71%70%71%71%73%72%76%71%74%72%
491534225273240632586102361642152242441676066441250You tend not to trust21%20%23%8%19%21%20%21%21%20%21%22%20%22%18%20%22%21%it
165198613266216792351085871776248293132424Don't know7%7%6%9%7%6%5%6%8%9%8%7%7%6%5%9%4%7%
Page 75
The UK & The European UnionAbsolutes/col percents
Q.9 I would like to ask you a question about how much trust you have in certain institutions.For each of the following institutions, please tell me if you tend to trust it or tend not to trust it?
The United Nations
Base : All respondents
Prepared by EOS Gallup & ICM ResearchFieldwork Dates : 11th-26th November 2002

EU ScrappedUK MembershipMedia CoverageKnowledgeof EUA little/Great deal/
Very sorryIndifferentVery pleasedNot BenefitedBenefitedA bad thingA good thingUnfairFairNothingquite a lotTotal
15912917130924692764138025321723350753007296029Unweighted Total
16222868131424572763137825531774346552617686029Weighted Total
129821118341611224386720591241263937935624354You tend to trust it80%74%63%66%81%63%81%70%76%72%73%72%
26553938267841341638443562510771731250You tend not to trust16%19%29%28%15%30%15%25%18%20%23%21%it
5921898168106951109720139133424Don't know4%8%7%7%4%7%4%5%6%7%4%7%
Page 76
The UK & The European UnionAbsolutes/col percents
Q.9 I would like to ask you a question about how much trust you have in certain institutions.For each of the following institutions, please tell me if you tend to trust it or tend not to trust it?
The United Nations
Base : All respondents
Prepared by EOS Gallup & ICM ResearchFieldwork Dates : 11th-26th November 2002

RegionNorthernYorks &IrelandScotlandWalesSouth WestSouth EastGreater LondonEasternWest MidlandsEast MidlandsHumbersideNorth WestNorthTotal
5005005005035025005015045075055035046029Unweighted Total
1645222995098267295465364285116962636029Weighted Total
68189109188322312211222152189227852272You tend to trust it41%36%36%37%39%43%39%41%35%37%33%32%38%
762481532073243142382232072303241332676You tend not to trust46%47%51%41%39%43%44%42%48%45%47%51%44%it
20853711418110397916992145461081Don't know12%16%12%22%22%14%18%17%16%18%21%17%18%
Page 77
The UK & The European UnionAbsolutes/col percents
Q.9 I would like to ask you a question about how much trust you have in certain institutions.For each of the following institutions, please tell me if you tend to trust it or tend not to trust it?
Non-Governmental Organisations (NGO)
Base : All respondents
Prepared by EOS Gallup & ICM ResearchFieldwork Dates : 11th-26th November 2002

LocalityAge left FT EducationAgeSexOtherTown/urbanMetropoli16 or
RuralcentretanNever hadStill in21+19-2017-18younger65+55 - 6445 - 5435 - 4425 - 3415 - 24FemaleMaleTotal
25922648789222671065308123830901078967112512431020596325627736029Unweighted Total
2349270098029376111632212302916116476797811211095905309629336029Weighted Total
830101542813178496134486949307244376455465426115111212272You tend to trust it35%38%44%45%47%44%42%40%33%26%32%38%41%42%47%37%38%38%
10881179409111604331285341393566358426473476377128013962676You tend not to trust46%44%42%39%43%39%40%43%48%49%47%44%42%43%42%41%48%44%it
432506143539187602105752901651761931541026654161081Don't know18%19%15%16%10%17%19%17%20%25%22%18%17%14%11%21%14%18%
Page 78
The UK & The European UnionAbsolutes/col percents
Q.9 I would like to ask you a question about how much trust you have in certain institutions.For each of the following institutions, please tell me if you tend to trust it or tend not to trust it?
Non-Governmental Organisations (NGO)
Base : All respondents
Prepared by EOS Gallup & ICM ResearchFieldwork Dates : 11th-26th November 2002

EU ScrappedUK MembershipMedia CoverageKnowledgeof EUA little/Great deal/
Very sorryIndifferentVery pleasedNot BenefitedBenefitedA bad thingA good thingUnfairFairNothingquite a lotTotal
15912917130924692764138025321723350753007296029Unweighted Total
16222868131424572763137825531774346552617686029Weighted Total
734104144287211704551093696134419533202272You tend to trust it45%36%34%35%42%33%43%39%39%37%42%38%
6431309639117011896731057802155823613152676You tend not to trust40%46%49%48%43%49%41%45%45%45%41%44%it
2455182334154042504032755639481331081Don't know15%18%18%17%15%18%16%16%16%18%17%18%
Page 79
The UK & The European UnionAbsolutes/col percents
Q.9 I would like to ask you a question about how much trust you have in certain institutions.For each of the following institutions, please tell me if you tend to trust it or tend not to trust it?
Non-Governmental Organisations (NGO)
Base : All respondents
Prepared by EOS Gallup & ICM ResearchFieldwork Dates : 11th-26th November 2002
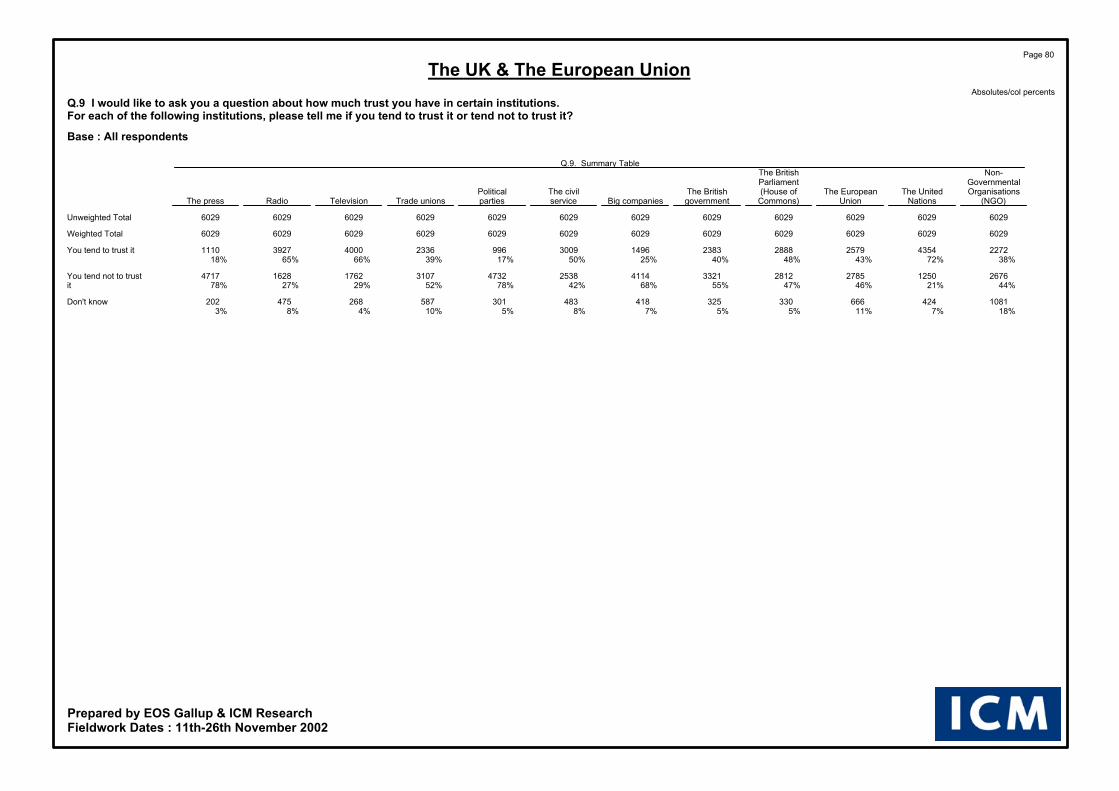
Q.9. Summary TableNon-The British
GovernmentalParliamentOrganisationsThe UnitedThe European(House ofThe BritishThe civilPolitical
(NGO)NationsUnionCommons)governmentBig companiesservicepartiesTrade unionsTelevisionRadioThe press
602960296029602960296029602960296029602960296029Unweighted Total
602960296029602960296029602960296029602960296029Weighted Total
22724354257928882383149630099962336400039271110You tend to trust it38%72%43%48%40%25%50%17%39%66%65%18%
267612502785281233214114253847323107176216284717You tend not to trust44%21%46%47%55%68%42%78%52%29%27%78%it
1081424666330325418483301587268475202Don't know18%7%11%5%5%7%8%5%10%4%8%3%
Page 80
The UK & The European UnionAbsolutes/col percents
Q.9 I would like to ask you a question about how much trust you have in certain institutions.For each of the following institutions, please tell me if you tend to trust it or tend not to trust it?
Base : All respondents
Prepared by EOS Gallup & ICM ResearchFieldwork Dates : 11th-26th November 2002
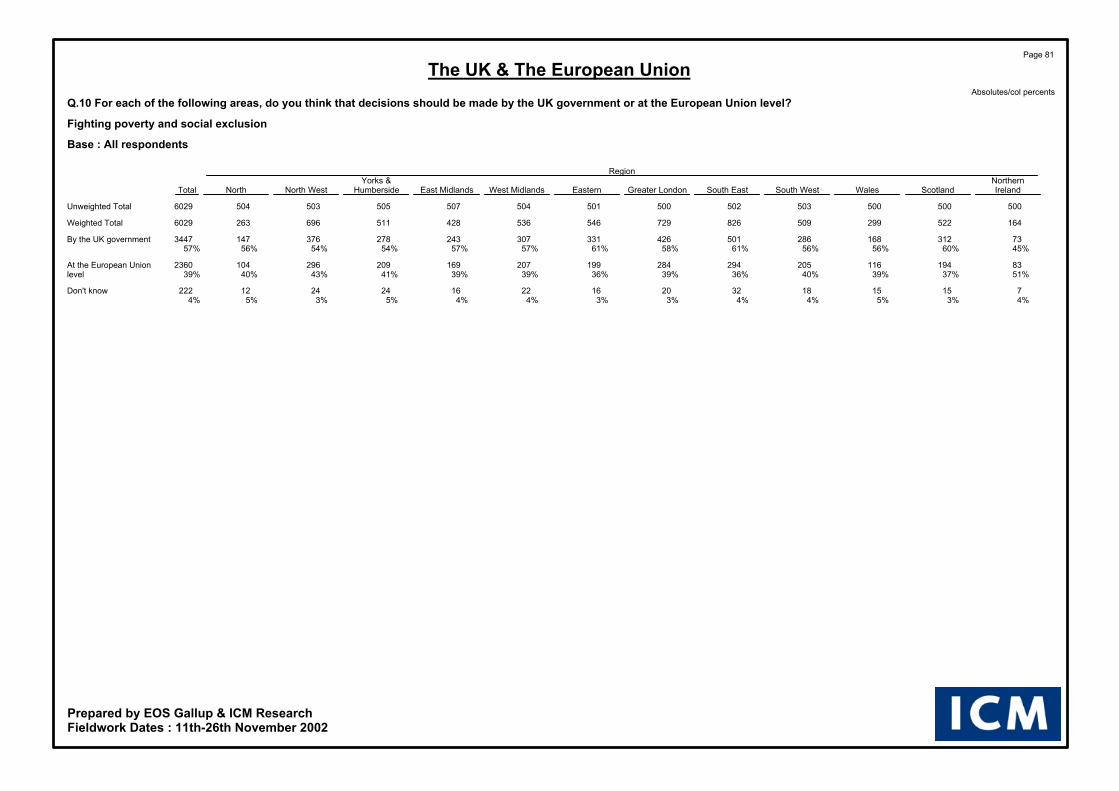
RegionNorthernYorks &IrelandScotlandWalesSouth WestSouth EastGreater LondonEasternWest MidlandsEast MidlandsHumbersideNorth WestNorthTotal
5005005005035025005015045075055035046029Unweighted Total
1645222995098267295465364285116962636029Weighted Total
733121682865014263313072432783761473447By the UK government45%60%56%56%61%58%61%57%57%54%54%56%57%
831941162052942841992071692092961042360At the European Union51%37%39%40%36%39%36%39%39%41%43%40%39%level
71515183220162216242412222Don't know4%3%5%4%4%3%3%4%4%5%3%5%4%
Page 81
The UK & The European UnionAbsolutes/col percents
Q.10 For each of the following areas, do you think that decisions should be made by the UK government or at the European Union level?
Fighting poverty and social exclusion
Base : All respondents
Prepared by EOS Gallup & ICM ResearchFieldwork Dates : 11th-26th November 2002

LocalityAge left FT EducationAgeSexOtherTown/urbanMetropoli16 or
RuralcentretanNever hadStill in21+19-2017-18younger65+55 - 6445 - 5435 - 4425 - 3415 - 24FemaleMaleTotal
25922648789222671065308123830901078967112512431020596325627736029Unweighted Total
2349270098029376111632212302916116476797811211095905309629336029Weighted Total
1365154154081736181657371725787466556651559427175816893447By the UK government58%57%55%26%46%55%51%60%59%68%61%57%58%51%47%57%58%57%
8861066407181934571434601073322267393435495450118611742360At the European Union38%39%42%61%51%41%44%37%37%28%35%40%39%45%50%38%40%39%level
97923341041143311855342936412815270222Don't know4%3%3%13%3%4%4%3%4%5%4%3%3%4%3%5%2%4%
Page 82
The UK & The European UnionAbsolutes/col percents
Q.10 For each of the following areas, do you think that decisions should be made by the UK government or at the European Union level?
Fighting poverty and social exclusion
Base : All respondents
Prepared by EOS Gallup & ICM ResearchFieldwork Dates : 11th-26th November 2002

EU ScrappedUK MembershipMedia CoverageKnowledgeof EUA little/Great deal/
Very sorryIndifferentVery pleasedNot BenefitedBenefitedA bad thingA good thingUnfairFairNothingquite a lotTotal
15912917130924692764138025321723350753007296029Unweighted Total
16222868131424572763137825531774346552617686029Weighted Total
711160210171709132210791187982201529654823447By the UK government44%56%77%70%48%78%46%55%58%56%63%57%
860116525969013592691291744134921002602360At the European Union53%41%20%28%49%20%51%42%39%40%34%39%level
5010138588230754810219626222Don't know3%4%3%2%3%2%3%3%3%4%3%4%
Page 83
The UK & The European UnionAbsolutes/col percents
Q.10 For each of the following areas, do you think that decisions should be made by the UK government or at the European Union level?
Fighting poverty and social exclusion
Base : All respondents
Prepared by EOS Gallup & ICM ResearchFieldwork Dates : 11th-26th November 2002

RegionNorthernYorks &IrelandScotlandWalesSouth WestSouth EastGreater LondonEasternWest MidlandsEast MidlandsHumbersideNorth WestNorthTotal
5005005005035025005015045075055035046029Unweighted Total
1645222995098267295465364285116962636029Weighted Total
642391632394063062602632192493441252879By the UK government39%46%55%47%49%42%48%49%51%49%49%47%48%
972721272554044122792592032483371293023At the European Union59%52%43%50%49%56%51%48%47%49%48%49%50%level
2118151611714613159126Don't know1%2%3%3%2%2%1%3%1%3%2%3%2%
Page 84
The UK & The European UnionAbsolutes/col percents
Q.10 For each of the following areas, do you think that decisions should be made by the UK government or at the European Union level?
Protecting the environment
Base : All respondents
Prepared by EOS Gallup & ICM ResearchFieldwork Dates : 11th-26th November 2002

LocalityAge left FT EducationAgeSexOtherTown/urbanMetropoli16 or
RuralcentretanNever hadStill in21+19-2017-18younger65+55 - 6445 - 5435 - 4425 - 3415 - 24FemaleMaleTotal
25922648789222671065308123830901078967112512431020596325627736029Unweighted Total
2349270098029376111632212302916116476797811211095905309629336029Weighted Total
1222127838071443661405831619713428476498395370156013202879By the UK government52%47%39%25%38%33%44%47%56%61%56%49%44%36%41%50%45%48%
10711373579202227301776271229416320483605680519146315603023At the European Union46%51%59%68%59%65%55%51%42%36%42%49%54%62%57%47%53%50%level
56492121121520693419191820167353126Don't know2%2%2%7%3%2%1%2%2%3%2%2%2%2%2%2%2%2%
Page 85
The UK & The European UnionAbsolutes/col percents
Q.10 For each of the following areas, do you think that decisions should be made by the UK government or at the European Union level?
Protecting the environment
Base : All respondents
Prepared by EOS Gallup & ICM ResearchFieldwork Dates : 11th-26th November 2002

EU ScrappedUK MembershipMedia CoverageKnowledgeof EUA little/Great deal/
Very sorryIndifferentVery pleasedNot BenefitedBenefitedA bad thingA good thingUnfairFairNothingquite a lotTotal
15912917130924692764138025321723350753007296029Unweighted Total
16222868131424572763137825531774346552617686029Weighted Total
49713329381496966966881784169125713082879By the UK government31%46%71%61%35%70%35%44%49%49%40%48%
1101147835191617673871643959172825784453023At the European Union68%52%27%37%64%28%64%54%50%49%58%50%level
23582545302628314711115126Don't know1%2%2%2%1%2%1%2%1%2%2%2%
Page 86
The UK & The European UnionAbsolutes/col percents
Q.10 For each of the following areas, do you think that decisions should be made by the UK government or at the European Union level?
Protecting the environment
Base : All respondents
Prepared by EOS Gallup & ICM ResearchFieldwork Dates : 11th-26th November 2002

RegionNorthernYorks &IrelandScotlandWalesSouth WestSouth EastGreater LondonEasternWest MidlandsEast MidlandsHumbersideNorth WestNorthTotal
5005005005035025005015045075055035046029Unweighted Total
1645222995098267295465364285116962636029Weighted Total
712651702784613493062992432823771433243By the UK government43%51%57%55%56%48%56%56%57%55%54%54%54%
872471202213463572302231782183061142648At the European Union53%47%40%43%42%49%42%42%42%43%44%43%44%level
51091119231014711136138Don't know3%2%3%2%2%3%2%3%2%2%2%2%2%
Page 87
The UK & The European UnionAbsolutes/col percents
Q.10 For each of the following areas, do you think that decisions should be made by the UK government or at the European Union level?
Guaranteeing the quality of food products
Base : All respondents
Prepared by EOS Gallup & ICM ResearchFieldwork Dates : 11th-26th November 2002

LocalityAge left FT EducationAgeSexOtherTown/urbanMetropoli16 or
RuralcentretanNever hadStill in21+19-2017-18younger65+55 - 6445 - 5435 - 4425 - 3415 - 24FemaleMaleTotal
25922648789222671065308123830901078967112512431020596325627736029Unweighted Total
2349270098029376111632212302916116476797811211095905309629336029Weighted Total
13271427489131474631656881748763452537599489403171115323243By the UK government57%53%50%45%39%41%51%56%60%66%59%55%53%45%45%55%52%54%
9561220472162276311465191090355293418504591486129613522648At the European Union41%45%48%55%60%57%45%42%37%31%38%43%45%54%54%42%46%44%level
655319-2221123784622221815158949138Don't know3%2%2%-1%2%3%2%3%4%3%2%2%1%2%3%2%2%
Page 88
The UK & The European UnionAbsolutes/col percents
Q.10 For each of the following areas, do you think that decisions should be made by the UK government or at the European Union level?
Guaranteeing the quality of food products
Base : All respondents
Prepared by EOS Gallup & ICM ResearchFieldwork Dates : 11th-26th November 2002

EU ScrappedUK MembershipMedia CoverageKnowledgeof EUA little/Great deal/
Very sorryIndifferentVery pleasedNot BenefitedBenefitedA bad thingA good thingUnfairFairNothingquite a lotTotal
15912917130924692764138025321723350753007296029Unweighted Total
16222868131424572763137825531774346552617686029Weighted Total
559153210371708110210631003899189528543883243By the UK government34%53%79%70%40%77%39%51%55%54%51%54%
1036128524769816292841514823153022773712648At the European Union64%45%19%28%59%21%59%46%44%43%48%44%level
2651305131313552401299138Don't know2%2%2%2%1%2%1%3%1%2%1%2%
Page 89
The UK & The European UnionAbsolutes/col percents
Q.10 For each of the following areas, do you think that decisions should be made by the UK government or at the European Union level?
Guaranteeing the quality of food products
Base : All respondents
Prepared by EOS Gallup & ICM ResearchFieldwork Dates : 11th-26th November 2002

RegionNorthernYorks &IrelandScotlandWalesSouth WestSouth EastGreater LondonEasternWest MidlandsEast MidlandsHumbersideNorth WestNorthTotal
5005005005035025005015045075055035046029Unweighted Total
1645222995098267295465364285116962636029Weighted Total
782911803194913883293162533033991543501By the UK government47%56%60%63%59%53%60%59%59%59%57%58%58%
802221131823113122072081631972771032374At the European Union49%43%38%36%38%43%38%39%38%39%40%39%39%level
6969242910121211207154Don't know4%2%2%2%3%4%2%2%3%2%3%3%3%
Page 90
The UK & The European UnionAbsolutes/col percents
Q.10 For each of the following areas, do you think that decisions should be made by the UK government or at the European Union level?
Protecting consumers and guaranteeing the quality of other products
Base : All respondents
Prepared by EOS Gallup & ICM ResearchFieldwork Dates : 11th-26th November 2002

LocalityAge left FT EducationAgeSexOtherTown/urbanMetropoli16 or
RuralcentretanNever hadStill in21+19-2017-18younger65+55 - 6445 - 5435 - 4425 - 3415 - 24FemaleMaleTotal
25922648789222671065308123830901078967112512431020596325627736029Unweighted Total
2349270098029376111632212302916116476797811211095905309629336029Weighted Total
14351546520131585411787321860819481583654527437185316483501By the UK government61%57%53%45%42%48%55%60%64%70%63%60%58%48%48%60%56%58%
853108743516211550133474974301264368449544447114012342374At the European Union36%40%44%55%56%49%41%39%33%26%34%38%40%50%49%37%42%39%level
626626-72511248244222718242010352154Don't know3%2%3%-2%2%4%2%3%4%3%3%2%2%2%3%2%3%
Page 91
The UK & The European UnionAbsolutes/col percents
Q.10 For each of the following areas, do you think that decisions should be made by the UK government or at the European Union level?
Protecting consumers and guaranteeing the quality of other products
Base : All respondents
Prepared by EOS Gallup & ICM ResearchFieldwork Dates : 11th-26th November 2002

EU ScrappedUK MembershipMedia CoverageKnowledgeof EUA little/Great deal/
Very sorryIndifferentVery pleasedNot BenefitedBenefitedA bad thingA good thingUnfairFairNothingquite a lotTotal
15912917130924692764138025321723350753007296029Unweighted Total
16222868131424572763137825531774346552617686029Weighted Total
660166010611778126510931144984203930584433501By the UK government41%58%81%72%46%79%45%55%59%58%58%58%
927114722462414572561363744137020643102374At the European Union57%40%17%25%53%19%53%42%40%39%40%39%level
35612955413045455613915154Don't know2%2%2%2%1%2%2%3%2%3%2%3%
Page 92
The UK & The European UnionAbsolutes/col percents
Q.10 For each of the following areas, do you think that decisions should be made by the UK government or at the European Union level?
Protecting consumers and guaranteeing the quality of other products
Base : All respondents
Prepared by EOS Gallup & ICM ResearchFieldwork Dates : 11th-26th November 2002

RegionNorthernYorks &IrelandScotlandWalesSouth WestSouth EastGreater LondonEasternWest MidlandsEast MidlandsHumbersideNorth WestNorthTotal
5005005005035025005015045075055035046029Unweighted Total
1645222995098267295465364285116962636029Weighted Total
1154282374146825554504263394095552144823By the UK government70%82%79%81%82%76%82%79%79%80%80%81%80%
4685529213015682977890128431079At the European Union28%16%17%18%16%21%15%18%18%18%18%16%18%level
39103151814141111136127Don't know2%2%3%1%2%2%3%3%3%2%2%2%2%
Page 93
The UK & The European UnionAbsolutes/col percents
Q.10 For each of the following areas, do you think that decisions should be made by the UK government or at the European Union level?
Fighting unemployment
Base : All respondents
Prepared by EOS Gallup & ICM ResearchFieldwork Dates : 11th-26th November 2002

LocalityAge left FT EducationAgeSexOtherTown/urbanMetropoli16 or
RuralcentretanNever hadStill in21+19-2017-18younger65+55 - 6445 - 5435 - 4425 - 3415 - 24FemaleMaleTotal
25922648789222671065308123830901078967112512431020596325627736029Unweighted Total
2349270098029376111632212302916116476797811211095905309629336029Weighted Total
189621557722427488225910112348929618777926889683251223114823By the UK government81%80%79%83%73%79%80%82%81%80%81%79%83%81%76%81%79%80%
398492189596205602064931881311831771922085065731079At the European Union17%18%19%17%25%18%19%17%17%16%17%19%16%18%23%16%20%18%level
555219-629312754718171913137849127Don't know2%2%2%-2%3%1%1%3%4%2%2%2%1%1%3%2%2%
Page 94
The UK & The European UnionAbsolutes/col percents
Q.10 For each of the following areas, do you think that decisions should be made by the UK government or at the European Union level?
Fighting unemployment
Base : All respondents
Prepared by EOS Gallup & ICM ResearchFieldwork Dates : 11th-26th November 2002

EU ScrappedUK MembershipMedia CoverageKnowledgeof EUA little/Great deal/
Very sorryIndifferentVery pleasedNot BenefitedBenefitedA bad thingA good thingUnfairFairNothingquite a lotTotal
15912917130924692764138025321723350753007296029Unweighted Total
16222868131424572763137825531774346552617686029Weighted Total
11172361117921352057124818611410278942016234823By the UK government69%82%90%87%74%91%73%80%80%80%81%80%
4694651062796651066483266239421361079At the European Union29%16%8%11%24%8%25%18%18%18%18%18%level
3643304341254337531189127Don't know2%1%2%2%1%2%2%2%2%2%1%2%
Page 95
The UK & The European UnionAbsolutes/col percents
Q.10 For each of the following areas, do you think that decisions should be made by the UK government or at the European Union level?
Fighting unemployment
Base : All respondents
Prepared by EOS Gallup & ICM ResearchFieldwork Dates : 11th-26th November 2002

RegionNorthernYorks &IrelandScotlandWalesSouth WestSouth EastGreater LondonEasternWest MidlandsEast MidlandsHumbersideNorth WestNorthTotal
5005005005035025005015045075055035046029Unweighted Total
1645222995098267295465364285116962636029Weighted Total
802561662453553472722882142773381262966By the UK government49%49%55%48%43%48%50%54%50%54%49%48%49%
792571262574523702672342032183431312938At the European Union48%49%42%50%55%51%49%44%47%43%49%50%49%level
487719128141115146126Don't know3%2%2%1%2%2%1%3%3%3%2%2%2%
Page 96
The UK & The European UnionAbsolutes/col percents
Q.10 For each of the following areas, do you think that decisions should be made by the UK government or at the European Union level?
Fighting organised crime and drug trafficking
Base : All respondents
Prepared by EOS Gallup & ICM ResearchFieldwork Dates : 11th-26th November 2002

LocalityAge left FT EducationAgeSexOtherTown/urbanMetropoli16 or
RuralcentretanNever hadStill in21+19-2017-18younger65+55 - 6445 - 5435 - 4425 - 3415 - 24FemaleMaleTotal
25922648789222671065308123830901078967112512431020596325627736029Unweighted Total
2349270098029376111632212302916116476797811211095905309629336029Weighted Total
12401296429141714031426241598681400451540484409168712792966By the UK government53%48%44%49%46%36%44%51%55%59%52%46%48%44%45%54%44%49%
10541351532141996891725881254445356499565592481134015972938At the European Union45%50%54%48%53%62%53%48%43%38%46%51%50%54%53%43%54%49%level
5552181624819643811281619146957126Don't know2%2%2%3%2%2%2%2%2%3%1%3%1%2%2%2%2%2%
Page 97
The UK & The European UnionAbsolutes/col percents
Q.10 For each of the following areas, do you think that decisions should be made by the UK government or at the European Union level?
Fighting organised crime and drug trafficking
Base : All respondents
Prepared by EOS Gallup & ICM ResearchFieldwork Dates : 11th-26th November 2002

EU ScrappedUK MembershipMedia CoverageKnowledgeof EUA little/Great deal/
Very sorryIndifferentVery pleasedNot BenefitedBenefitedA bad thingA good thingUnfairFairNothingquite a lotTotal
15912917130924692764138025321723350753007296029Unweighted Total
16222868131424572763137825531774346552617686029Weighted Total
5811457821144211208811007835170426483182966By the UK government36%51%62%59%41%64%39%47%49%50%41%49%
1014137145897216044641511908170625014372938At the European Union63%48%35%40%58%34%59%51%49%48%57%49%level
27403543393435315511213126Don't know2%1%3%2%1%2%1%2%2%2%2%2%
Page 98
The UK & The European UnionAbsolutes/col percents
Q.10 For each of the following areas, do you think that decisions should be made by the UK government or at the European Union level?
Fighting organised crime and drug trafficking
Base : All respondents
Prepared by EOS Gallup & ICM ResearchFieldwork Dates : 11th-26th November 2002

RegionNorthernYorks &IrelandScotlandWalesSouth WestSouth EastGreater LondonEasternWest MidlandsEast MidlandsHumbersideNorth WestNorthTotal
5005005005035025005015045075055035046029Unweighted Total
1645222995098267295465364285116962636029Weighted Total
652571622774473762902932142853581323158By the UK government40%49%54%54%54%52%53%55%50%56%52%50%52%
932501292153453202322201912023191192632At the European Union57%48%43%42%42%44%42%41%45%39%46%45%44%level
6158163533242223241813239Don't know4%3%3%3%4%5%4%4%5%5%3%5%4%
Page 99
The UK & The European UnionAbsolutes/col percents
Q.10 For each of the following areas, do you think that decisions should be made by the UK government or at the European Union level?
Guaranteeing the rights of the individual and respect for the principles of democracy
Base : All respondents
Prepared by EOS Gallup & ICM ResearchFieldwork Dates : 11th-26th November 2002

LocalityAge left FT EducationAgeSexOtherTown/urbanMetropoli16 or
RuralcentretanNever hadStill in21+19-2017-18younger65+55 - 6445 - 5435 - 4425 - 3415 - 24FemaleMaleTotal
25922648789222671065308123830901078967112512431020596325627736029Unweighted Total
2349270098029376111632212302916116476797811211095905309629336029Weighted Total
1282139048681444771446521717777463503577467373166514943158By the UK government55%51%50%27%38%43%45%53%59%67%60%51%51%43%41%54%51%52%
9741202456212216031715441056309277442514595496127213612632At the European Union41%45%47%73%59%54%53%44%36%27%36%45%46%54%55%41%46%44%level
9310738-123673414378273331333616079239Don't know4%4%4%-3%3%2%3%5%7%4%3%3%3%4%5%3%4%
Page 100
The UK & The European UnionAbsolutes/col percents
Q.10 For each of the following areas, do you think that decisions should be made by the UK government or at the European Union level?
Guaranteeing the rights of the individual and respect for the principles of democracy
Base : All respondents
Prepared by EOS Gallup & ICM ResearchFieldwork Dates : 11th-26th November 2002

EU ScrappedUK MembershipMedia CoverageKnowledgeof EUA little/Great deal/
Very sorryIndifferentVery pleasedNot BenefitedBenefitedA bad thingA good thingUnfairFairNothingquite a lotTotal
15912917130924692764138025321723350753007296029Unweighted Total
16222868131424572763137825531774346552617686029Weighted Total
55114711027170110551088949885183827643943158By the UK government34%51%78%69%38%79%37%50%53%53%51%52%
1029130122766616452451533832152422773552632At the European Union63%45%17%27%60%18%60%47%44%43%46%44%level
419559896445705610322019239Don't know3%3%5%4%2%3%3%3%3%4%2%4%
Page 101
The UK & The European UnionAbsolutes/col percents
Q.10 For each of the following areas, do you think that decisions should be made by the UK government or at the European Union level?
Guaranteeing the rights of the individual and respect for the principles of democracy
Base : All respondents
Prepared by EOS Gallup & ICM ResearchFieldwork Dates : 11th-26th November 2002

RegionNorthernYorks &IrelandScotlandWalesSouth WestSouth EastGreater LondonEasternWest MidlandsEast MidlandsHumbersideNorth WestNorthTotal
5005005005035025005015045075055035046029Unweighted Total
1645222995098267295465364285116962636029Weighted Total
6015596133203217154150114151205711710By the UK government37%30%32%26%25%30%28%28%27%30%30%27%28%
993521923645904923793693043434701844139At the European Union60%67%64%71%71%67%69%69%71%67%68%70%69%level
4161012332013161017208179Don't know3%3%4%2%4%3%2%3%2%3%3%3%3%
Page 102
The UK & The European UnionAbsolutes/col percents
Q.10 For each of the following areas, do you think that decisions should be made by the UK government or at the European Union level?
Fighting terrorism
Base : All respondents
Prepared by EOS Gallup & ICM ResearchFieldwork Dates : 11th-26th November 2002

LocalityAge left FT EducationAgeSexOtherTown/urbanMetropoli16 or
RuralcentretanNever hadStill in21+19-2017-18younger65+55 - 6445 - 5435 - 4425 - 3415 - 24FemaleMaleTotal
25922648789222671065308123830901078967112512431020596325627736029Unweighted Total
2349270098029376111632212302916116476797811211095905309629336029Weighted Total
742704264552255843489544592352803022561798898211710By the UK government32%26%27%16%14%23%26%28%33%39%31%29%27%23%20%29%28%28%
15411912686233208292298551860640509669791818712208420554139At the European Union66%71%70%81%85%74%71%69%64%55%66%68%71%75%79%67%70%69%level
6783301432102710365232928211412357179Don't know3%3%3%3%1%3%3%2%4%6%3%3%3%2%2%4%2%3%
Page 103
The UK & The European UnionAbsolutes/col percents
Q.10 For each of the following areas, do you think that decisions should be made by the UK government or at the European Union level?
Fighting terrorism
Base : All respondents
Prepared by EOS Gallup & ICM ResearchFieldwork Dates : 11th-26th November 2002

EU ScrappedUK MembershipMedia CoverageKnowledgeof EUA little/Great deal/
Very sorryIndifferentVery pleasedNot BenefitedBenefitedA bad thingA good thingUnfairFairNothingquite a lotTotal
15912917130924692764138025321723350753007296029Unweighted Total
16222868131424572763137825531774346552617686029Weighted Total
290731611934548636493466101114942171710By the UK government18%25%47%38%20%46%19%26%29%28%28%28%
129720696561440216969420161243239936075324139At the European Union80%72%50%59%79%50%79%70%69%69%69%69%level
35684782464943655616019179Don't know2%2%4%3%2%4%2%4%2%3%3%3%
Page 104
The UK & The European UnionAbsolutes/col percents
Q.10 For each of the following areas, do you think that decisions should be made by the UK government or at the European Union level?
Fighting terrorism
Base : All respondents
Prepared by EOS Gallup & ICM ResearchFieldwork Dates : 11th-26th November 2002

RegionNorthernYorks &IrelandScotlandWalesSouth WestSouth EastGreater LondonEasternWest MidlandsEast MidlandsHumbersideNorth WestNorthTotal
5005005005035025005015045075055035046029Unweighted Total
1645222995098267295465364285116962636029Weighted Total
813311923255384253483432753334211573768By the UK government49%63%64%64%65%58%64%64%64%65%60%59%62%
7517596170267274184178134150257982057At the European Union46%33%32%33%32%38%34%33%31%29%37%37%34%level
8171114213014141929189204Don't know5%3%4%3%3%4%3%3%4%6%3%3%3%
Page 105
The UK & The European UnionAbsolutes/col percents
Q.10 For each of the following areas, do you think that decisions should be made by the UK government or at the European Union level?
Tackling the challenges of an ageing population
Base : All respondents
Prepared by EOS Gallup & ICM ResearchFieldwork Dates : 11th-26th November 2002

LocalityAge left FT EducationAgeSexOtherTown/urbanMetropoli16 or
RuralcentretanNever hadStill in21+19-2017-18younger65+55 - 6445 - 5435 - 4425 - 3415 - 24FemaleMaleTotal
25922648789222671065308123830901078967112512431020596325627736029Unweighted Total
2349270098029376111632212302916116476797811211095905309629336029Weighted Total
14871687594151806942077911863789521643718638459197017983768By the UK government63%62%61%52%48%62%64%64%64%68%68%66%64%58%51%64%61%62%
7869233481019239410739693731021930338042442199710602057At the European Union33%34%35%35%51%35%33%32%32%27%29%31%34%39%47%32%36%34%level
778938442884311665273223332412876204Don't know3%3%4%13%1%2%3%3%4%6%4%3%2%3%3%4%3%3%
Page 106
The UK & The European UnionAbsolutes/col percents
Q.10 For each of the following areas, do you think that decisions should be made by the UK government or at the European Union level?
Tackling the challenges of an ageing population
Base : All respondents
Prepared by EOS Gallup & ICM ResearchFieldwork Dates : 11th-26th November 2002

EU ScrappedUK MembershipMedia CoverageKnowledgeof EUA little/Great deal/
Very sorryIndifferentVery pleasedNot BenefitedBenefitedA bad thingA good thingUnfairFairNothingquite a lotTotal
15912917130924692764138025321723350753007296029Unweighted Total
16222868131424572763137825531774346552617686029Weighted Total
8471766103717811530109513931081221332645053768By the UK government52%62%79%73%55%79%55%61%64%62%66%62%
731102523660711712441095636117118192382057At the European Union45%36%18%25%42%18%43%36%34%35%31%34%level
44764168623964568217826204Don't know3%3%3%3%2%3%2%3%2%3%3%3%
Page 107
The UK & The European UnionAbsolutes/col percents
Q.10 For each of the following areas, do you think that decisions should be made by the UK government or at the European Union level?
Tackling the challenges of an ageing population
Base : All respondents
Prepared by EOS Gallup & ICM ResearchFieldwork Dates : 11th-26th November 2002

Q.10. Summary TableGuaranteeingthe rights ofProtecting
Tackling thethe individualFightingconsumers andFightingchallenges ofand respect fororganised crimeguaranteeingGuaranteeingpoverty and
an ageingFightingthe principlesand drugFightingthe quality ofthe quality ofProtecting thesocialpopulationterrorismof democracytraffickingunemploymentother productsfood productsenvironmentexclusion
602960296029602960296029602960296029Unweighted Total
602960296029602960296029602960296029Weighted Total
376817103158296648233501324328793447By the UK government62%28%52%49%80%58%54%48%57%
205741392632293810792374264830232360At the European Union34%69%44%49%18%39%44%50%39%level
204179239126127154138126222Don't know3%3%4%2%2%3%2%2%4%
Page 108
The UK & The European UnionAbsolutes/col percents
Q.10 For each of the following areas, do you think that decisions should be made by the UK government or at the European Union level?
Base : All respondents
Prepared by EOS Gallup & ICM ResearchFieldwork Dates : 11th-26th November 2002

RegionNorthernYorks &IrelandScotlandWalesSouth WestSouth EastGreater LondonEasternWest MidlandsEast MidlandsHumbersideNorth WestNorthTotal
5005005005035025005015045075055035046029Unweighted Total
1645222995098267295465364285116962636029Weighted Total
792501462464043572652622102493381272933Male48%48%49%48%49%49%48%49%49%49%49%48%49%
852721532634223722812732182623571373096Female52%52%51%52%51%51%52%51%51%51%51%52%51%
Page 109
The UK & The European UnionAbsolutes/col percents
D.1. SexBase : All respondents
Prepared by EOS Gallup & ICM ResearchFieldwork Dates : 11th-26th November 2002

LocalityAge left FT EducationAgeSexOtherTown/urbanMetropoli16 or
RuralcentretanNever hadStill in21+19-2017-18younger65+55 - 6445 - 5435 - 4425 - 3415 - 24FemaleMaleTotal
25922648789222671065308123830901078967112512431020596325627736029Unweighted Total
2349270098029376111632212302916116476797811211095905309629336029Weighted Total
1086127357591875891685221439556372463551534457-29332933Male46%47%59%31%50%53%52%42%49%48%49%47%49%49%51%-100%49%
126314274052018952715470814786083955155705614483096-3096Female54%53%41%69%50%47%48%58%51%52%51%53%51%51%49%100%-51%
Page 110
The UK & The European UnionAbsolutes/col percents
D.1. SexBase : All respondents
Prepared by EOS Gallup & ICM ResearchFieldwork Dates : 11th-26th November 2002

EU ScrappedUK MembershipMedia CoverageKnowledgeof EUA little/Great deal/
Very sorryIndifferentVery pleasedNot BenefitedBenefitedA bad thingA good thingUnfairFairNothingquite a lotTotal
15912917130924692764138025321723350753007296029Unweighted Total
16222868131424572763137825531774346552617686029Weighted Total
9291270630117814587141394961165124085252933Male57%44%48%48%53%52%55%54%48%46%68%49%
6921598683127813046641159813181528532433096Female43%56%52%52%47%48%45%46%52%54%32%51%
Page 111
The UK & The European UnionAbsolutes/col percents
D.1. SexBase : All respondents
Prepared by EOS Gallup & ICM ResearchFieldwork Dates : 11th-26th November 2002

RegionNorthernYorks &IrelandScotlandWalesSouth WestSouth EastGreater LondonEasternWest MidlandsEast MidlandsHumbersideNorth WestNorthTotal
5005005005035025005015045075055035046029Unweighted Total
1645222995098267295465364285116962636029Weighted Total
29764772117129778153791044090515 - 2418%15%16%14%14%18%14%15%13%15%15%15%15%
329550781471709996778811944109525 - 3420%18%17%15%18%23%18%18%18%17%17%17%18%
3099579415913710695719412850112135 - 4419%19%19%18%19%19%19%18%17%18%18%19%19%
25834887137116918377831074197845 - 5415%16%16%17%17%16%17%15%18%16%15%16%16%
207038681107567755763913276755 - 6412%13%13%13%13%10%12%14%13%12%13%12%13%
2899591101551021061069310314656116465+17%19%20%22%19%14%19%20%22%20%21%21%19%
Page 112
The UK & The European UnionAbsolutes/col percents
AgeBase : All respondents
Prepared by EOS Gallup & ICM ResearchFieldwork Dates : 11th-26th November 2002

LocalityAge left FT EducationAgeSexOtherTown/urbanMetropoli16 or
RuralcentretanNever hadStill in21+19-2017-18younger65+55 - 6445 - 5435 - 4425 - 3415 - 24FemaleMaleTotal
25922648789222671065308123830901078967112512431020596325627736029Unweighted Total
2349270098029376111632212302916116476797811211095905309629336029Weighted Total
2864461721933311148193186-----90544845790515 - 2412%17%18%67%88%10%15%16%6%-----100%14%16%15%
319532243530335107258356----1095-561534109525 - 3414%20%25%16%8%30%33%21%12%----100%-18%18%18%
376555191*823569299505---1121--570551112135 - 4416%21%19%2%2%21%21%24%17%---100%--18%19%19%
4194081513119049210519--978---51546397845 - 5418%15%15%10%*17%15%17%18%--100%---17%16%16%
384299831311924112506-767----39537276755 - 6416%11%9%3%1%11%8%9%17%-100%----13%13%13%
56445914011127251588451164-----608556116465+24%17%14%2%*11%8%13%29%100%-----20%19%19%
Page 113
The UK & The European UnionAbsolutes/col percents
AgeBase : All respondents
Prepared by EOS Gallup & ICM ResearchFieldwork Dates : 11th-26th November 2002

EU ScrappedUK MembershipMedia CoverageKnowledgeof EUA little/Great deal/
Very sorryIndifferentVery pleasedNot BenefitedBenefitedA bad thingA good thingUnfairFairNothingquite a lotTotal
15912917130924692764138025321723350753007296029Unweighted Total
16222868131424572763137825531774346552617686029Weighted Total
25055955220541724712266018228390515 - 2415%19%4%9%20%5%18%13%17%16%11%15%
313619112331562132526312634988106109525 - 3419%22%9%13%20%10%21%18%18%19%14%18%
301601181427541212483321652980141112135 - 4419%21%14%17%20%15%19%18%19%19%18%19%
26843524043944325341327956584513397845 - 5416%15%18%18%16%18%16%16%16%16%17%16%
20328425237730524029424042864312476755 - 6413%10%19%15%11%17%12%14%12%12%16%13%
287371473662371470365397586982181116465+18%13%36%27%13%34%14%22%17%19%24%19%
Page 114
The UK & The European UnionAbsolutes/col percents
AgeBase : All respondents
Prepared by EOS Gallup & ICM ResearchFieldwork Dates : 11th-26th November 2002

RegionNorthernYorks &IrelandScotlandWalesSouth WestSouth EastGreater LondonEasternWest MidlandsEast MidlandsHumbersideNorth WestNorthTotal
5005005005035025005015045075055035046029Unweighted Total
1645222995098267295465364285116962636029Weighted Total
32116601191709513113612413118773137415 or younger20%22%20%23%21%13%24%25%29%26%27%28%23%
44159891441991171301481171421708215421627%31%30%28%24%16%24%28%27%28%24%31%26%
146134468056563526474417515179%12%12%9%10%8%10%7%6%9%6%6%9%
24393062110897255526093287151815%7%10%12%13%12%13%10%12%12%13%10%12%
514922352026141111255197193%3%3%4%4%3%5%3%3%2%4%2%3%
3126141317111464195125202%2%2%3%2%2%2%3%1%1%3%2%2%
73117344076373623293612379215%6%6%7%5%10%7%7%5%6%5%5%6%
5171018345921211318199244223%3%3%4%4%8%4%4%3%3%3%3%4%
4165522331217910102145232%3%2%1%3%5%2%3%2%2%1%1%2%
38452615853-8488242%1%1%1%3%2%1%1%1%-1%2%1%
51961320491113141715318525-303%4%2%3%2%7%2%3%3%3%2%1%3%
1342162041341727431 or over1%1%1%*2%3%1%*1%1%2%1%1%
142420184774263122354918376Still in full time8%5%7%4%6%10%5%6%5%7%7%7%6%education
*31-9124522129Never had a full time*1%*-1%**1%1%****education
11556814133339Refused1%*2%1%1%1%*1%*1%*1%1%
Page 115
The UK & The European UnionAbsolutes/col percents
D.3. At what age did you leave full time education?Base : All respondents
Prepared by EOS Gallup & ICM ResearchFieldwork Dates : 11th-26th November 2002

LocalityAge left FT EducationAgeSexOtherTown/urbanMetropoli16 or
RuralcentretanNever hadStill in21+19-2017-18younger65+55 - 6445 - 5435 - 4425 - 3415 - 24FemaleMaleTotal
25922648789222671065308123830901078967112512431020596325627736029Unweighted Total
2349270098029376111632212302916116476797811211095905309629336029Weighted Total
667575133-----1374637332267614631700675137415 or younger28%21%14%-----47%55%43%27%5%4%3%23%23%23%
597738208-----154220817525144430915577876415421625%27%21%-----53%18%23%26%40%28%17%25%26%26%
21723762----515-75519812311156285230515179%9%6%----42%-6%7%10%11%10%6%9%8%9%
269322124----715-83611121761461364232927151811%12%13%----58%-7%8%11%16%13%15%14%10%12%
699930---197--15112941693310394197193%4%3%---61%--1%1%3%4%6%4%3%3%3%
465524---125--1113202837155174125202%2%2%---39%--1%2%2%3%3%2%2%3%2%
12816190--379---283673779866208171379215%6%9%--34%---2%5%8%7%9%7%7%6%6%
709578--244---232136488234107137244223%4%8%--22%---2%3%4%4%8%4%3%5%4%
436141--145---192422185496581145232%2%4%--13%---2%3%2%2%5%1%2%3%2%
254419--88---1281119353325788241%2%2%--8%---1%1%1%2%3%*1%2%1%
586958--185---2718314861-6811718525-302%3%6%--17%---2%2%3%4%6%-2%4%3%
203619--74---181215245-48277431 or over1%1%2%--7%---2%2%2%2%*-2%1%1%
12118075-376----131830333189187376Still in full time5%7%8%-100%----***1%3%37%6%6%6%education
1310629-----113*51920929Never had a full time1%*1%100%-----*****2%1%**education
81813------7256514211939Refused*1%1%------1%*1%1%*2%1%1%1%
Page 116
The UK & The European UnionAbsolutes/col percents
D.3. At what age did you leave full time education?Base : All respondents
Prepared by EOS Gallup & ICM ResearchFieldwork Dates : 11th-26th November 2002

EU ScrappedUK MembershipMedia CoverageKnowledgeof EUA little/Great deal/
Very sorryIndifferentVery pleasedNot BenefitedBenefitedA bad thingA good thingUnfairFairNothingquite a lotTotal
15912917130924692764138025321723350753007296029Unweighted Total
16222868131424572763137825531774346552617686029Weighted Total
2655744827704344954173937521246129137415 or younger16%20%37%31%16%36%16%22%22%24%17%23%
257878344683608376536414874141113115421616%31%26%28%22%27%21%23%25%27%17%26%
11826511723620812119113531446352515177%9%9%10%8%9%7%8%9%9%7%9%
192349145266358142324221424627887151812%12%11%11%13%10%13%12%12%12%11%12%
6494336410842995112717325197194%3%2%3%4%3%4%3%4%3%3%3%
48561445661564437310223125203%2%1%2%2%1%2%2%2%2%3%2%
1701564410723639231130221311683792111%5%3%4%9%3%9%7%6%6%9%6%
120853360160311578112917866244227%3%3%2%6%2%6%5%4%3%9%4%
77567291041495459210936145235%2%1%1%4%1%4%3%3%2%5%2%
442910175811523345612788243%1%1%1%2%1%2%2%1%1%3%1%
866232481053910581871404518525-305%2%2%2%4%3%4%5%3%3%6%3%
37172027351337323354217431 or over2%1%2%1%1%1%1%2%1%1%3%1%
1212142392243342039425232749376Still in full time7%7%2%4%9%2%8%5%7%6%6%6%education
11152319316101627229Never had a full time1%1%**1%*1%1%*1%**education
1119892142592533639Refused1%1%1%*1%*1%*1%1%1%1%
Page 117
The UK & The European UnionAbsolutes/col percents
D.3. At what age did you leave full time education?Base : All respondents
Prepared by EOS Gallup & ICM ResearchFieldwork Dates : 11th-26th November 2002

RegionNorthernYorks &IrelandScotlandWalesSouth WestSouth EastGreater LondonEasternWest MidlandsEast MidlandsHumbersideNorth WestNorthTotal
5005005005035025005015045075055035046029Unweighted Total
1645222995098267295465364285116962636029Weighted Total
33574-43333*39Farmer, forester,2%1%2%1%1%-1%1%1%1%**1%fisherman
714922302630211515248220Owner of a shop,4%3%3%4%4%4%6%4%3%3%3%3%4%craftsman
3114184141149711114173Professional (lawyer,2%2%1%3%5%6%3%2%2%2%2%2%3%medical practitioner,
accountant, architect,)
29810152412757123113Manager of a company1%2%3%2%2%3%2%1%1%1%2%1%2%
2631061484544368Other self employed1%1%1%2%1%2%1%1%1%1%1%1%1%
1449173983106414021465320528Professional (employed9%9%6%8%10%15%7%7%5%9%8%7%9%doctor, lawyer,
accountant, architect)
41381340292113816245194General management,2%2%3%3%5%4%4%2%2%3%3%2%3%director or top
management
63011264656354118323912354Middle management4%6%4%5%6%8%6%8%4%6%6%5%6%
82212215142323025214012315Office clerk5%4%4%4%6%6%6%6%6%4%6%5%5%
82711153324241521231614231Civil Servant5%5%4%3%4%3%4%3%5%4%2%5%4%
103913334838273222485113374Other employee6%7%4%6%6%5%5%6%5%9%7%5%6%(salesman, nurse, etc)
172311869941362Other employee*1%1%1%1%1%1%2%2%1%*1%1%
5191214221122121710157167Supervisor / foreman3%4%4%3%3%2%4%2%4%2%2%3%3%(team manager, etc )
165526505532455544437330524Manual worker10%11%9%10%7%4%8%10%10%8%10%11%9%
53119192822192529244114276Unskilled manual worker3%6%6%4%3%3%3%5%7%5%6%5%5%
*3*14124233-23Other manual worker*1%*****1%*1%*-*
132625424237503029323120376Looking after the home8%5%8%8%5%5%9%6%7%6%4%8%6%
Page 118
The UK & The European UnionAbsolutes/col percents
D.4a. OccupationBase : All respondents
Prepared by EOS Gallup & ICM ResearchFieldwork Dates : 11th-26th November 2002

RegionNorthernYorks &IrelandScotlandWalesSouth WestSouth EastGreater LondonEasternWest MidlandsEast MidlandsHumbersideNorth WestNorthTotal
1645222995098267295465364285116962636029Weighted Total
122519274871172716244618350Student (full time)7%5%6%5%6%10%3%5%4%5%7%7%6%
3611673124178104112115116108174691325Retired22%22%24%24%22%14%21%21%27%21%25%26%22%
31283720816913152115Seeking a job2%2%3%1%1%3%1%3%2%2%2%1%2%
5612101611315712166121Other not working3%1%4%2%2%2%1%3%2%2%2%2%2%
*123161015122125179Refused**1%1%2%1%3%2%*2%1%1%1%
Page 119
The UK & The European UnionAbsolutes/col percents
D.4a. OccupationBase : All respondents
Prepared by EOS Gallup & ICM ResearchFieldwork Dates : 11th-26th November 2002

LocalityAge left FT EducationAgeSexOtherTown/urbanMetropoli16 or
RuralcentretanNever hadStill in21+19-2017-18younger65+55 - 6445 - 5435 - 4425 - 3415 - 24FemaleMaleTotal
25922648789222671065308123830901078967112512431020596325627736029Unweighted Total
2349270098029376111632212302916116476797811211095905309629336029Weighted Total
3441--4410217871252142539Farmer, forester,1%**--*1%1%1%1%1%1%1%***1%1%fisherman
919237-225124213815335260461447173220Owner of a shop,4%3%4%-1%2%4%3%5%1%4%5%5%4%1%2%6%4%craftsman
507548-3801338387274859221056117173Professional (lawyer,2%3%5%-1%7%4%3%1%1%4%5%5%2%1%2%4%3%medical practitioner,
accountant, architect,)
503627--226285651431352632985113Manager of a company2%1%3%--2%2%2%2%*2%3%3%2%*1%3%2%
272615-3244132451411141410274168Other self employed1%1%2%-1%2%1%1%1%*2%1%1%1%1%1%1%1%
167239123262704511390183812513615953246283528Professional (employed7%9%13%7%2%24%14%9%3%2%5%13%12%15%6%8%10%9%doctor, lawyer,
accountant, architect)
748040--731144645163863631073121194General management,3%3%4%--7%3%4%2%*2%4%6%6%1%2%4%3%director or top
management
9916689-11123398110*29798811147159195354Middle management4%6%9%-*10%10%8%4%*4%8%8%10%5%5%7%6%
11115648-538241021457337871705623877315Office clerk5%6%5%-1%3%8%8%5%1%4%8%6%6%6%8%3%5%
7112338*6731773624225060643113794231Civil Servant3%5%4%1%2%7%5%6%2%*3%5%5%6%3%4%3%4%
13318655518613210015563575828789260114374Other employee6%7%6%17%5%6%10%8%5%1%5%8%7%8%10%8%4%6%(salesman, nurse, etc)
15434-7134831387141713303262Other employee1%2%*-2%1%1%1%1%*1%1%1%2%1%1%1%1%
618619-411848956133550432152115167Supervisor / foreman3%3%2%-1%1%2%4%3%*2%4%4%4%2%2%4%3%(team manager, etc )
20925164116163498359227610913211175179345524Manual worker9%9%7%3%4%1%11%8%12%2%10%11%12%10%8%6%12%9%
1051403021815551181103558604469160116276Unskilled manual worker4%5%3%5%5%1%1%4%6%1%5%6%5%4%8%5%4%5%
9114-21231632547371723Other manual worker***-****1%****1%**1%*
Page 120
The UK & The European UnionAbsolutes/col percents
D.4a. OccupationBase : All respondents
Prepared by EOS Gallup & ICM ResearchFieldwork Dates : 11th-26th November 2002

LocalityAge left FT EducationAgeSexOtherTown/urbanMetropoli16 or
RuralcentretanNever hadStill in21+19-2017-18younger65+55 - 6445 - 5435 - 4425 - 3415 - 24FemaleMaleTotal
2349270098029376111632212302916116476797811211095905309629336029Weighted Total
16417933214219942172051581071033735521376Looking after the home7%7%3%8%*4%6%8%7%2%7%6%10%9%4%11%1%6%
100160901326913525151241033300181169350Student (full time)4%6%9%45%72%1%2%2%1%***1%3%33%6%6%6%
664507155-1170321829349882644914736976281325Retired28%19%16%-*15%10%15%32%85%34%5%1%1%*23%21%22%
325033222862452*9152239304471115Seeking a job1%2%3%5%1%2%2%2%2%*1%2%2%4%3%1%2%2%
4557181-1752177726352715106456121Other not working2%2%2%4%-2%1%2%3%1%3%4%2%1%1%2%2%2%
393282126-15372513931020413879Refused2%1%1%6%3%1%-1%1%2%2%1%*1%2%1%1%1%
Page 121
The UK & The European UnionAbsolutes/col percents
D.4a. OccupationBase : All respondents
Prepared by EOS Gallup & ICM ResearchFieldwork Dates : 11th-26th November 2002

EU ScrappedUK MembershipMedia CoverageKnowledgeof EUA little/Great deal/
Very sorryIndifferentVery pleasedNot BenefitedBenefitedA bad thingA good thingUnfairFairNothingquite a lotTotal
15912917130924692764138025321723350753007296029Unweighted Total
16222868131424572763137825531774346552617686029Weighted Total
617152511209181732739Farmer, forester,*1%1%1%*1%*1%*1%1%1%fisherman
47110559510153866312719723220Owner of a shop,3%4%4%4%4%4%3%4%4%4%3%4%craftsman
69574368844584659813142173Professional (lawyer,4%2%3%3%3%3%3%4%3%2%6%3%medical practitioner,
accountant, architect,)
3943254561305532679122113Manager of a company2%1%2%2%2%2%2%2%2%2%3%2%
203017302717342039571168Other self employed1%1%1%1%1%1%1%1%1%1%1%1%
2262216916031277304167304424104528Professional (employed14%8%5%6%11%6%12%9%9%8%14%9%doctor, lawyer,
accountant, architect)
66992459114321006410615539194General management,4%3%2%2%4%2%4%4%3%3%5%3%director or top
management
107185561242026018210221729361354Middle management7%6%4%5%7%4%7%6%6%6%8%6%
7218944119148461319217828926315Office clerk4%7%3%5%5%3%5%5%5%5%3%5%
701262867128311205915020131231Civil Servant4%4%2%3%5%2%5%3%4%4%4%4%
8422656141176551589722935124374Other employee5%8%4%6%6%4%6%5%7%7%3%6%(salesman, nurse, etc)
1637924271126282556662Other employee1%1%1%1%1%1%1%2%1%1%1%1%
3595257073305944931579167Supervisor / foreman2%3%2%3%3%2%2%2%3%3%1%3%(team manager, etc )
9829511024819911618713932148935524Manual worker6%10%8%10%7%8%7%8%9%9%5%9%
5215456111125631007215926510276Unskilled manual worker3%5%4%5%5%5%4%4%5%5%1%5%
513511126941622223Other manual worker************
6820481160142811307223135719376Looking after the home4%7%6%6%5%6%5%4%7%7%3%6%
Page 122
The UK & The European UnionAbsolutes/col percents
D.4a. OccupationBase : All respondents
Prepared by EOS Gallup & ICM ResearchFieldwork Dates : 11th-26th November 2002

EU ScrappedUK MembershipMedia CoverageKnowledgeof EUA little/Great deal/
Very sorryIndifferentVery pleasedNot BenefitedBenefitedA bad thingA good thingUnfairFairNothingquite a lotTotal
16222868131424572763137825531774346552617686029Weighted Total
1201902271232302028823430248350Student (full time)7%7%2%3%8%2%8%5%7%6%6%6%
35042251271645850344445567211142111325Retired22%15%39%29%17%36%17%26%19%21%28%22%
3553153648255534599818115Seeking a job2%2%1%1%2%2%2%2%2%2%2%2%
2663214846274334701129121Other not working2%2%2%2%2%2%2%2%2%2%1%2%
123927313720352350681179Refused1%1%2%1%1%1%1%1%1%1%1%1%
Page 123
The UK & The European UnionAbsolutes/col percents
D.4a. OccupationBase : All respondents
Prepared by EOS Gallup & ICM ResearchFieldwork Dates : 11th-26th November 2002

RegionNorthernYorks &IrelandScotlandWalesSouth WestSouth EastGreater LondonEasternWest MidlandsEast MidlandsHumbersideNorth WestNorthTotal
5005005005035025005015045075055035046029Unweighted Total
1645222995098267295465364285116962636029Weighted Total
-----------263263North-----------100%4%
----------696-696North West----------100%-12%
---------511--511Yorks & Humberside---------100%--8%
--------428---428East Midlands--------100%---7%
-------536----536West Midlands-------100%----9%
------546-----546Eastern------100%-----9%
-----729------729Greater London-----100%------12%
----826-------826South East----100%-------14%
---509--------509South West---100%--------8%
--299---------299Wales--100%---------5%
-522----------522Scotland-100%----------9%
164-----------164Northern Ireland100%-----------3%
Page 124
The UK & The European UnionAbsolutes/col percents
RegionBase : All respondents
Prepared by EOS Gallup & ICM ResearchFieldwork Dates : 11th-26th November 2002

LocalityAge left FT EducationAgeSexOtherTown/urbanMetropoli16 or
RuralcentretanNever hadStill in21+19-2017-18younger65+55 - 6445 - 5435 - 4425 - 3415 - 24FemaleMaleTotal
25922648789222671065308123830901078967112512431020596325627736029Unweighted Total
2349270098029376111632212302916116476797811211095905309629336029Weighted Total
9814718118321144155563241504440137127263North4%5%2%4%5%3%3%4%5%5%4%4%5%4%4%4%4%4%
2173741042491044413735814691107128119104357338696North West9%14%11%5%13%9%14%11%12%13%12%11%11%11%11%12%12%12%
2052258123577161072731036383948879262249511Yorks & Humberside9%8%8%5%9%7%5%9%9%9%8%9%8%8%9%8%8%8%
23017324522641678241935777717753218210428East Midlands10%6%2%16%6%6%5%6%8%8%7%8%6%7%6%7%7%7%
186252984319428902841067583959681273262536West Midlands8%9%10%13%8%8%9%7%10%9%10%8%8%9%9%9%9%9%
26924235226933612826110667911069977281265546Eastern11%9%4%6%7%8%11%10%9%9%9%9%9%9%9%9%9%9%
512584201742523714521210275116137170129372357729Greater London2%10%43%5%20%23%11%12%7%9%10%12%12%16%14%12%12%12%
27243711794715849190369155110137159147117422404826South East12%16%12%29%12%14%15%15%13%13%14%14%14%13%13%14%14%14%
31817913-1879361082641106887947872263246509South West14%7%1%-5%7%11%9%9%9%9%9%8%7%8%9%8%8%
17711210120451565148593848575047153146299Wales8%4%1%4%5%4%5%5%5%5%5%5%5%5%5%5%5%5%
24023349324932799275997083999576272250522Scotland10%9%5%12%6%8%8%8%9%9%9%8%9%9%8%9%9%9%
85699*1425838772820253032298579164Northern Ireland4%3%1%1%4%2%3%3%3%2%3%3%3%3%3%3%3%3%
Page 125
The UK & The European UnionAbsolutes/col percents
RegionBase : All respondents
Prepared by EOS Gallup & ICM ResearchFieldwork Dates : 11th-26th November 2002

EU ScrappedUK MembershipMedia CoverageKnowledgeof EUA little/Great deal/
Very sorryIndifferentVery pleasedNot BenefitedBenefitedA bad thingA good thingUnfairFairNothingquite a lotTotal
15912917130924692764138025321723350753007296029Unweighted Total
16222868131424572763137825531774346552617686029Weighted Total
581484910112358986216523826263North4%5%4%4%4%4%4%3%5%5%3%4%
19933413726832916231118740862669696North West12%12%10%11%12%12%12%11%12%12%9%12%
13523612023021413021315427145556511Yorks & Humberside8%8%9%9%8%9%8%9%8%9%7%8%
10120110318818210516612424737058428East Midlands6%7%8%8%7%8%7%7%7%7%8%7%
12626512123121813620314832347264536West Midlands8%9%9%9%8%10%8%8%9%9%8%9%
12625615025422314021014632947274546Eastern8%9%11%10%8%10%8%8%9%9%10%9%
258299139254389142361240417605124729Greater London16%10%11%10%14%10%14%14%12%12%16%12%
205363221362351191340280422705122826South East13%13%17%15%13%14%13%16%12%13%16%14%
12525311623122113719517127443772509South West8%9%9%9%8%10%8%10%8%8%9%8%
6516659119143581167818127128299Wales4%6%4%5%5%4%5%4%5%5%4%5%
171259821742709724514332445864522Scotland11%9%6%7%10%7%10%8%9%9%8%9%
538918469921944110415212164Northern Ireland3%3%1%2%4%2%4%2%3%3%2%3%
Page 126
The UK & The European UnionAbsolutes/col percents
RegionBase : All respondents
Prepared by EOS Gallup & ICM ResearchFieldwork Dates : 11th-26th November 2002

RegionNorthernYorks &IrelandScotlandWalesSouth WestSouth EastGreater LondonEasternWest MidlandsEast MidlandsHumbersideNorth WestNorthTotal
5005005005035025005015045075055035046029Unweighted Total
1645222995098267295465364285116962636029Weighted Total
94910131174203598248110418980Metropolitan6%9%3%3%14%58%6%18%6%16%15%7%16%
692331121794372582422521732253741472700Other Town/urban centre42%45%37%35%53%35%44%47%40%44%54%56%45%
8524017731827251269186230205217982349Rural52%46%59%62%33%7%49%35%54%40%31%37%39%
Page 127
The UK & The European UnionAbsolutes/col percents
D.6. LocalityBase : All respondents
Prepared by EOS Gallup & ICM ResearchFieldwork Dates : 11th-26th November 2002

LocalityAge left FT EducationAgeSexOtherTown/urbanMetropoli16 or
RuralcentretanNever hadStill in21+19-2017-18younger65+55 - 6445 - 5435 - 4425 - 3415 - 24FemaleMaleTotal
25922648789222671065308123830901078967112512431020596325627736029Unweighted Total
2349270098029376111632212302916116476797811211095905309629336029Weighted Total
--9806753065418634014083151191243172405575980Metropolitan--100%20%20%27%17%15%12%12%11%15%17%22%19%13%20%16%
-2700-101804661545591312459299408555532446142712732700Other Town/urban centre-100%-36%48%42%48%45%45%39%39%42%49%49%49%46%43%45%
2349--131213441144851264564384419376319286126310862349Rural100%--44%32%31%36%39%43%48%50%43%34%29%32%41%37%39%
Page 128
The UK & The European UnionAbsolutes/col percents
D.6. LocalityBase : All respondents
Prepared by EOS Gallup & ICM ResearchFieldwork Dates : 11th-26th November 2002
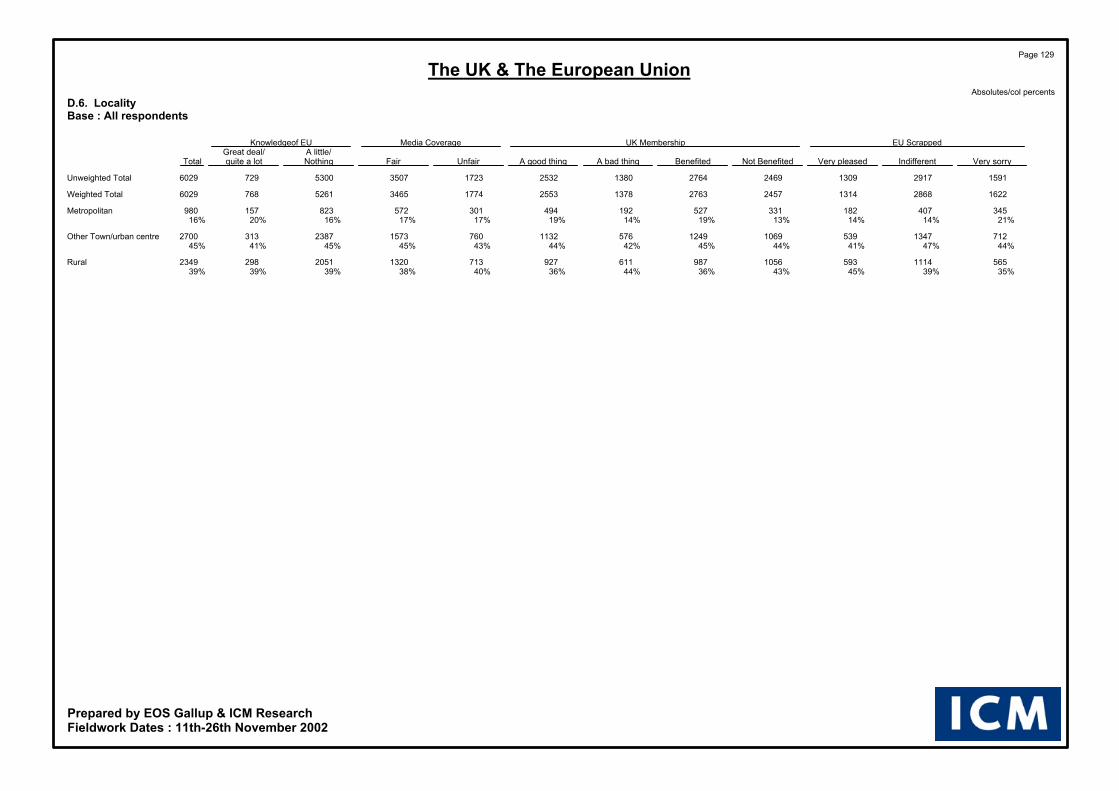
EU ScrappedUK MembershipMedia CoverageKnowledgeof EUA little/Great deal/
Very sorryIndifferentVery pleasedNot BenefitedBenefitedA bad thingA good thingUnfairFairNothingquite a lotTotal
15912917130924692764138025321723350753007296029Unweighted Total
16222868131424572763137825531774346552617686029Weighted Total
345407182331527192494301572823157980Metropolitan21%14%14%13%19%14%19%17%17%16%20%16%
7121347539106912495761132760157323873132700Other Town/urban centre44%47%41%44%45%42%44%43%45%45%41%45%
56511145931056987611927713132020512982349Rural35%39%45%43%36%44%36%40%38%39%39%39%
Page 129
The UK & The European UnionAbsolutes/col percents
D.6. LocalityBase : All respondents
Prepared by EOS Gallup & ICM ResearchFieldwork Dates : 11th-26th November 2002

Page 1flash137.wyp - Friday, November 29, 2002
Page Table Title Base Description Base�� 1 Q.1. How much do you feel you know about the European Union, its policies, its institutions? /
Would you say that ...?Base : All respondents 6029
�� 2 Q.1. How much do you feel you know about the European Union, its policies, its institutions? /Would you say that ...?
Base : All respondents 6029
�� 3 Q.1. How much do you feel you know about the European Union, its policies, its institutions? /Would you say that ...?
Base : All respondents 6029
�� 4 Q.2. When you are looking for information about the EU, its policies, its institutions, /which of the following sources do you use?
Base : All respondents 6029
�� 5 Q.2. When you are looking for information about the EU, its policies, its institutions, /which of the following sources do you use?
Base : All respondents 6029
�� 6 Q.2. When you are looking for information about the EU, its policies, its institutions, /which of the following sources do you use?
Base : All respondents 6029
�� 7 Q.3. In general, how would you prefer to get information about the EU? Base : All respondents 6029
�� 8 Q.3. In general, how would you prefer to get information about the EU? Base : All respondents 6029
�� 9 Q.3. In general, how would you prefer to get information about the EU? Base : All respondents 6029
�� 10 Q.4. How fairly do you think the media cover European Union Affairs? Base : All respondents 6029
�� 11 Q.4. How fairly do you think the media cover European Union Affairs? Base : All respondents 6029
�� 12 Q.4. How fairly do you think the media cover European Union Affairs? Base : All respondents 6029
�� 13 Q.5. Generally speaking do you think that the UK's membership of the EU is ...? Base : All respondents 6029
�� 14 Q.5. Generally speaking do you think that the UK's membership of the EU is ...? Base : All respondents 6029
�� 15 Q.5. Generally speaking do you think that the UK's membership of the EU is ...? Base : All respondents 6029
�� 16 Q.6. Taking everything into consideration, would you say that the UK has on balance benefited or not from being a member of the EU?
Base : All respondents 6029
�� 17 Q.6. Taking everything into consideration, would you say that the UK has on balance benefited or not from being a member of the EU?
Base : All respondents 6029
�� 18 Q.6. Taking everything into consideration, would you say that the UK has on balance benefited or not from being a member of the EU?
Base : All respondents 6029
�� 19 Q.7. If you were told tomorrow that the European Union had been scrapped, would you be very pleased, indifferent or very sorry?
Base : All respondents 6029
�� 20 Q.7. If you were told tomorrow that the European Union had been scrapped, would you be very pleased, indifferent or very sorry?
Base : All respondents 6029
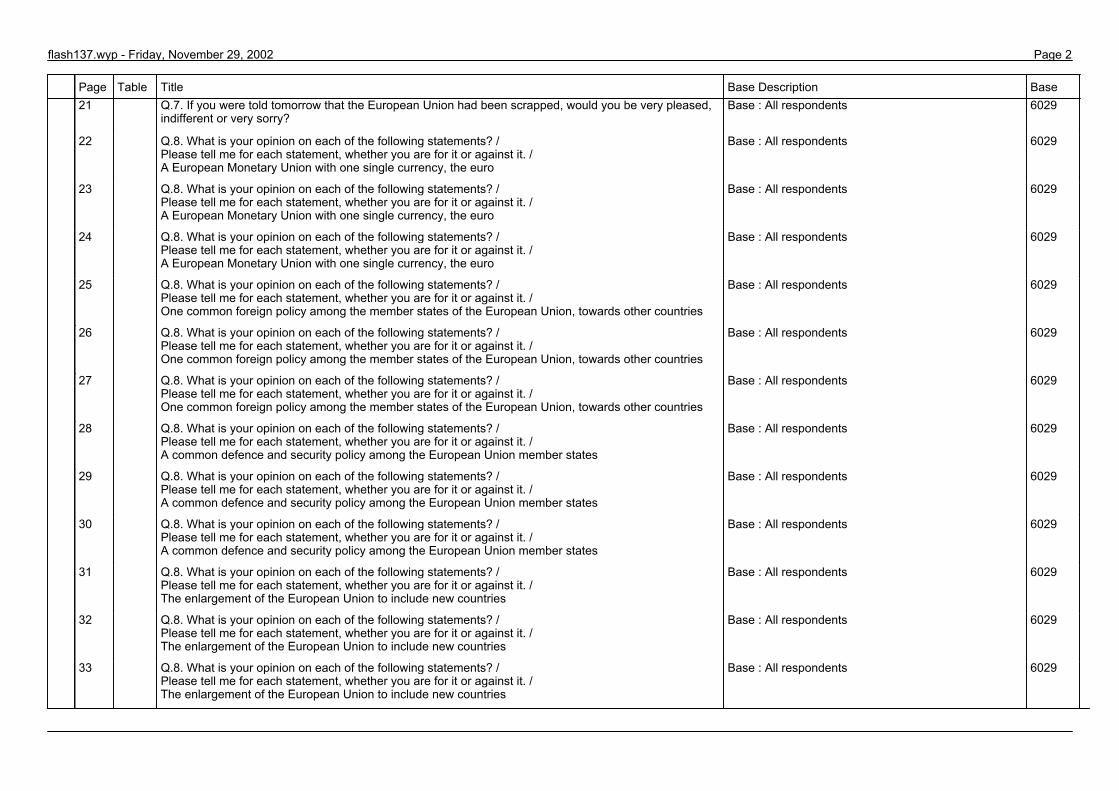
Page 2flash137.wyp - Friday, November 29, 2002
Page Table Title Base Description Base�� 21 Q.7. If you were told tomorrow that the European Union had been scrapped, would you be very pleased,
indifferent or very sorry?Base : All respondents 6029
�� 22 Q.8. What is your opinion on each of the following statements? /Please tell me for each statement, whether you are for it or against it. /A European Monetary Union with one single currency, the euro
Base : All respondents 6029
�� 23 Q.8. What is your opinion on each of the following statements? /Please tell me for each statement, whether you are for it or against it. /A European Monetary Union with one single currency, the euro
Base : All respondents 6029
�� 24 Q.8. What is your opinion on each of the following statements? /Please tell me for each statement, whether you are for it or against it. /A European Monetary Union with one single currency, the euro
Base : All respondents 6029
�� 25 Q.8. What is your opinion on each of the following statements? /Please tell me for each statement, whether you are for it or against it. /One common foreign policy among the member states of the European Union, towards other countries
Base : All respondents 6029
�� 26 Q.8. What is your opinion on each of the following statements? /Please tell me for each statement, whether you are for it or against it. /One common foreign policy among the member states of the European Union, towards other countries
Base : All respondents 6029
�� 27 Q.8. What is your opinion on each of the following statements? /Please tell me for each statement, whether you are for it or against it. /One common foreign policy among the member states of the European Union, towards other countries
Base : All respondents 6029
�� 28 Q.8. What is your opinion on each of the following statements? /Please tell me for each statement, whether you are for it or against it. /A common defence and security policy among the European Union member states
Base : All respondents 6029
�� 29 Q.8. What is your opinion on each of the following statements? /Please tell me for each statement, whether you are for it or against it. /A common defence and security policy among the European Union member states
Base : All respondents 6029
�� 30 Q.8. What is your opinion on each of the following statements? /Please tell me for each statement, whether you are for it or against it. /A common defence and security policy among the European Union member states
Base : All respondents 6029
�� 31 Q.8. What is your opinion on each of the following statements? /Please tell me for each statement, whether you are for it or against it. /The enlargement of the European Union to include new countries
Base : All respondents 6029
�� 32 Q.8. What is your opinion on each of the following statements? /Please tell me for each statement, whether you are for it or against it. /The enlargement of the European Union to include new countries
Base : All respondents 6029
�� 33 Q.8. What is your opinion on each of the following statements? /Please tell me for each statement, whether you are for it or against it. /The enlargement of the European Union to include new countries
Base : All respondents 6029

Page 3flash137.wyp - Friday, November 29, 2002
Page Table Title Base Description Base�� 34 Q.8. What is your opinion on each of the following statements? /
Please tell me for each statement, whether you are for it or against it. /The European Union being responsible for matters that cannot be effectively handled by national, regional and local governments
Base : All respondents 6029
�� 35 Q.8. What is your opinion on each of the following statements? /Please tell me for each statement, whether you are for it or against it. /The European Union being responsible for matters that cannot be effectively handled by national, regional and local governments
Base : All respondents 6029
�� 36 Q.8. What is your opinion on each of the following statements? /Please tell me for each statement, whether you are for it or against it. /The European Union being responsible for matters that cannot be effectively handled by national, regional and local governments
Base : All respondents 6029
�� 37 Q.8. What is your opinion on each of the following statements? /Please tell me for each statement, whether you are for it or against it. /The resignation of the President of the European Commission and the European Commissioners if they do not have the support of a majority in the European Parliament
Base : All respondents 6029
�� 38 Q.8. What is your opinion on each of the following statements? /Please tell me for each statement, whether you are for it or against it. /The resignation of the President of the European Commission and the European Commissioners if they do not have the support of a majority in the European Parliament
Base : All respondents 6029
�� 39 Q.8. What is your opinion on each of the following statements? /Please tell me for each statement, whether you are for it or against it. /The resignation of the President of the European Commission and the European Commissioners if they do not have the support of a majority in the European Parliament
Base : All respondents 6029
�� 40 Q.8. What is your opinion on each of the following statements? /Please tell me for each statement, whether you are for it or against it. /Teaching school children about the way European Union institutions work
Base : All respondents 6029
�� 41 Q.8. What is your opinion on each of the following statements? /Please tell me for each statement, whether you are for it or against it. /Teaching school children about the way European Union institutions work
Base : All respondents 6029
�� 42 Q.8. What is your opinion on each of the following statements? /Please tell me for each statement, whether you are for it or against it. /Teaching school children about the way European Union institutions work
Base : All respondents 6029
�� 43 Q.8. What is your opinion on each of the following statements? /Please tell me for each statement, whether you are for it or against it.
Base : All respondents 6029
�� 44 Q.9 I would like to ask you a question about how much trust you have in certain institutions. /For each of the following institutions, please tell me if you tend to trust it or tend not to trust it? /The press
Base : All respondents 6029
�� 45 Q.9 I would like to ask you a question about how much trust you have in certain institutions. /For each of the following institutions, please tell me if you tend to trust it or tend not to trust it? /The press
Base : All respondents 6029

Page 4flash137.wyp - Friday, November 29, 2002
Page Table Title Base Description Base�� 46 Q.9 I would like to ask you a question about how much trust you have in certain institutions. /
For each of the following institutions, please tell me if you tend to trust it or tend not to trust it? /The press
Base : All respondents 6029
�� 47 Q.9 I would like to ask you a question about how much trust you have in certain institutions. /For each of the following institutions, please tell me if you tend to trust it or tend not to trust it? /Radio
Base : All respondents 6029
�� 48 Q.9 I would like to ask you a question about how much trust you have in certain institutions. /For each of the following institutions, please tell me if you tend to trust it or tend not to trust it? /Radio
Base : All respondents 6029
�� 49 Q.9 I would like to ask you a question about how much trust you have in certain institutions. /For each of the following institutions, please tell me if you tend to trust it or tend not to trust it? /Radio
Base : All respondents 6029
�� 50 Q.9 I would like to ask you a question about how much trust you have in certain institutions. /For each of the following institutions, please tell me if you tend to trust it or tend not to trust it? /Television
Base : All respondents 6029
�� 51 Q.9 I would like to ask you a question about how much trust you have in certain institutions. /For each of the following institutions, please tell me if you tend to trust it or tend not to trust it? /Television
Base : All respondents 6029
�� 52 Q.9 I would like to ask you a question about how much trust you have in certain institutions. /For each of the following institutions, please tell me if you tend to trust it or tend not to trust it? /Television
Base : All respondents 6029
�� 53 Q.9 I would like to ask you a question about how much trust you have in certain institutions. /For each of the following institutions, please tell me if you tend to trust it or tend not to trust it? /Trade unions
Base : All respondents 6029
�� 54 Q.9 I would like to ask you a question about how much trust you have in certain institutions. /For each of the following institutions, please tell me if you tend to trust it or tend not to trust it? /Trade unions
Base : All respondents 6029
�� 55 Q.9 I would like to ask you a question about how much trust you have in certain institutions. /For each of the following institutions, please tell me if you tend to trust it or tend not to trust it? /Trade unions
Base : All respondents 6029
�� 56 Q.9 I would like to ask you a question about how much trust you have in certain institutions. /For each of the following institutions, please tell me if you tend to trust it or tend not to trust it? /Political parties
Base : All respondents 6029
�� 57 Q.9 I would like to ask you a question about how much trust you have in certain institutions. /For each of the following institutions, please tell me if you tend to trust it or tend not to trust it? /Political parties
Base : All respondents 6029
�� 58 Q.9 I would like to ask you a question about how much trust you have in certain institutions. /For each of the following institutions, please tell me if you tend to trust it or tend not to trust it? /Political parties
Base : All respondents 6029

Page 5flash137.wyp - Friday, November 29, 2002
Page Table Title Base Description Base�� 59 Q.9 I would like to ask you a question about how much trust you have in certain institutions. /
For each of the following institutions, please tell me if you tend to trust it or tend not to trust it? /The civil service
Base : All respondents 6029
�� 60 Q.9 I would like to ask you a question about how much trust you have in certain institutions. /For each of the following institutions, please tell me if you tend to trust it or tend not to trust it? /The civil service
Base : All respondents 6029
�� 61 Q.9 I would like to ask you a question about how much trust you have in certain institutions. /For each of the following institutions, please tell me if you tend to trust it or tend not to trust it? /The civil service
Base : All respondents 6029
�� 62 Q.9 I would like to ask you a question about how much trust you have in certain institutions. /For each of the following institutions, please tell me if you tend to trust it or tend not to trust it? /Big companies
Base : All respondents 6029
�� 63 Q.9 I would like to ask you a question about how much trust you have in certain institutions. /For each of the following institutions, please tell me if you tend to trust it or tend not to trust it? /Big companies
Base : All respondents 6029
�� 64 Q.9 I would like to ask you a question about how much trust you have in certain institutions. /For each of the following institutions, please tell me if you tend to trust it or tend not to trust it? /Big companies
Base : All respondents 6029
�� 65 Q.9 I would like to ask you a question about how much trust you have in certain institutions. /For each of the following institutions, please tell me if you tend to trust it or tend not to trust it? /The British government
Base : All respondents 6029
�� 66 Q.9 I would like to ask you a question about how much trust you have in certain institutions. /For each of the following institutions, please tell me if you tend to trust it or tend not to trust it? /The British government
Base : All respondents 6029
�� 67 Q.9 I would like to ask you a question about how much trust you have in certain institutions. /For each of the following institutions, please tell me if you tend to trust it or tend not to trust it? /The British government
Base : All respondents 6029
�� 68 Q.9 I would like to ask you a question about how much trust you have in certain institutions. /For each of the following institutions, please tell me if you tend to trust it or tend not to trust it? /The British Parliament (House of Commons)
Base : All respondents 6029
�� 69 Q.9 I would like to ask you a question about how much trust you have in certain institutions. /For each of the following institutions, please tell me if you tend to trust it or tend not to trust it? /The British Parliament (House of Commons)
Base : All respondents 6029
�� 70 Q.9 I would like to ask you a question about how much trust you have in certain institutions. /For each of the following institutions, please tell me if you tend to trust it or tend not to trust it? /The British Parliament (House of Commons)
Base : All respondents 6029
�� 71 Q.9 I would like to ask you a question about how much trust you have in certain institutions. /For each of the following institutions, please tell me if you tend to trust it or tend not to trust it? /The European Union
Base : All respondents 6029

Page 6flash137.wyp - Friday, November 29, 2002
Page Table Title Base Description Base�� 72 Q.9 I would like to ask you a question about how much trust you have in certain institutions. /
For each of the following institutions, please tell me if you tend to trust it or tend not to trust it? /The European Union
Base : All respondents 6029
�� 73 Q.9 I would like to ask you a question about how much trust you have in certain institutions. /For each of the following institutions, please tell me if you tend to trust it or tend not to trust it? /The European Union
Base : All respondents 6029
�� 74 Q.9 I would like to ask you a question about how much trust you have in certain institutions. /For each of the following institutions, please tell me if you tend to trust it or tend not to trust it? /The United Nations
Base : All respondents 6029
�� 75 Q.9 I would like to ask you a question about how much trust you have in certain institutions. /For each of the following institutions, please tell me if you tend to trust it or tend not to trust it? /The United Nations
Base : All respondents 6029
�� 76 Q.9 I would like to ask you a question about how much trust you have in certain institutions. /For each of the following institutions, please tell me if you tend to trust it or tend not to trust it? /The United Nations
Base : All respondents 6029
�� 77 Q.9 I would like to ask you a question about how much trust you have in certain institutions. /For each of the following institutions, please tell me if you tend to trust it or tend not to trust it? /Non-Governmental Organisations (NGO)
Base : All respondents 6029
�� 78 Q.9 I would like to ask you a question about how much trust you have in certain institutions. /For each of the following institutions, please tell me if you tend to trust it or tend not to trust it? /Non-Governmental Organisations (NGO)
Base : All respondents 6029
�� 79 Q.9 I would like to ask you a question about how much trust you have in certain institutions. /For each of the following institutions, please tell me if you tend to trust it or tend not to trust it? /Non-Governmental Organisations (NGO)
Base : All respondents 6029
�� 80 Q.9 I would like to ask you a question about how much trust you have in certain institutions. /For each of the following institutions, please tell me if you tend to trust it or tend not to trust it?
Base : All respondents 6029
�� 81 Q.10 For each of the following areas, do you think that decisions should be made by the UK government or at the European Union level? /Fighting poverty and social exclusion
Base : All respondents 6029
�� 82 Q.10 For each of the following areas, do you think that decisions should be made by the UK government or at the European Union level? /Fighting poverty and social exclusion
Base : All respondents 6029
�� 83 Q.10 For each of the following areas, do you think that decisions should be made by the UK government or at the European Union level? /Fighting poverty and social exclusion
Base : All respondents 6029
�� 84 Q.10 For each of the following areas, do you think that decisions should be made by the UK government or at the European Union level? /Protecting the environment
Base : All respondents 6029

Page 7flash137.wyp - Friday, November 29, 2002
Page Table Title Base Description Base�� 85 Q.10 For each of the following areas, do you think that decisions should be made by the UK government
or at the European Union level? /Protecting the environment
Base : All respondents 6029
�� 86 Q.10 For each of the following areas, do you think that decisions should be made by the UK government or at the European Union level? /Protecting the environment
Base : All respondents 6029
�� 87 Q.10 For each of the following areas, do you think that decisions should be made by the UK government or at the European Union level? /Guaranteeing the quality of food products
Base : All respondents 6029
�� 88 Q.10 For each of the following areas, do you think that decisions should be made by the UK government or at the European Union level? /Guaranteeing the quality of food products
Base : All respondents 6029
�� 89 Q.10 For each of the following areas, do you think that decisions should be made by the UK government or at the European Union level? /Guaranteeing the quality of food products
Base : All respondents 6029
�� 90 Q.10 For each of the following areas, do you think that decisions should be made by the UK government or at the European Union level? /Protecting consumers and guaranteeing the quality of other products
Base : All respondents 6029
�� 91 Q.10 For each of the following areas, do you think that decisions should be made by the UK government or at the European Union level? /Protecting consumers and guaranteeing the quality of other products
Base : All respondents 6029
�� 92 Q.10 For each of the following areas, do you think that decisions should be made by the UK government or at the European Union level? /Protecting consumers and guaranteeing the quality of other products
Base : All respondents 6029
�� 93 Q.10 For each of the following areas, do you think that decisions should be made by the UK government or at the European Union level? /Fighting unemployment
Base : All respondents 6029
�� 94 Q.10 For each of the following areas, do you think that decisions should be made by the UK government or at the European Union level? /Fighting unemployment
Base : All respondents 6029
�� 95 Q.10 For each of the following areas, do you think that decisions should be made by the UK government or at the European Union level? /Fighting unemployment
Base : All respondents 6029
�� 96 Q.10 For each of the following areas, do you think that decisions should be made by the UK government or at the European Union level? /Fighting organised crime and drug trafficking
Base : All respondents 6029
�� 97 Q.10 For each of the following areas, do you think that decisions should be made by the UK government or at the European Union level? /Fighting organised crime and drug trafficking
Base : All respondents 6029

Page 8flash137.wyp - Friday, November 29, 2002
Page Table Title Base Description Base�� 98 Q.10 For each of the following areas, do you think that decisions should be made by the UK government
or at the European Union level? /Fighting organised crime and drug trafficking
Base : All respondents 6029
�� 99 Q.10 For each of the following areas, do you think that decisions should be made by the UK government or at the European Union level? /Guaranteeing the rights of the individual and respect for the principles of democracy
Base : All respondents 6029
�� 100 Q.10 For each of the following areas, do you think that decisions should be made by the UK government or at the European Union level? /Guaranteeing the rights of the individual and respect for the principles of democracy
Base : All respondents 6029
�� 101 Q.10 For each of the following areas, do you think that decisions should be made by the UK government or at the European Union level? /Guaranteeing the rights of the individual and respect for the principles of democracy
Base : All respondents 6029
�� 102 Q.10 For each of the following areas, do you think that decisions should be made by the UK government or at the European Union level? /Fighting terrorism
Base : All respondents 6029
�� 103 Q.10 For each of the following areas, do you think that decisions should be made by the UK government or at the European Union level? /Fighting terrorism
Base : All respondents 6029
�� 104 Q.10 For each of the following areas, do you think that decisions should be made by the UK government or at the European Union level? /Fighting terrorism
Base : All respondents 6029
�� 105 Q.10 For each of the following areas, do you think that decisions should be made by the UK government or at the European Union level? /Tackling the challenges of an ageing population
Base : All respondents 6029
�� 106 Q.10 For each of the following areas, do you think that decisions should be made by the UK government or at the European Union level? /Tackling the challenges of an ageing population
Base : All respondents 6029
�� 107 Q.10 For each of the following areas, do you think that decisions should be made by the UK government or at the European Union level? /Tackling the challenges of an ageing population
Base : All respondents 6029
�� 108 Q.10 For each of the following areas, do you think that decisions should be made by the UK government or at the European Union level?
Base : All respondents 6029
�� 109 D.1. Sex Base : All respondents 6029
�� 110 D.1. Sex Base : All respondents 6029
�� 111 D.1. Sex Base : All respondents 6029
�� 112 Age Base : All respondents 6029
�� 113 Age Base : All respondents 6029

Page 9flash137.wyp - Friday, November 29, 2002
Page Table Title Base Description Base�� 114 Age Base : All respondents 6029
�� 115 D.3. At what age did you leave full time education? Base : All respondents 6029
�� 116 D.3. At what age did you leave full time education? Base : All respondents 6029
�� 117 D.3. At what age did you leave full time education? Base : All respondents 6029
�� 118 D.4a. Occupation Base : All respondents 6029
�� 119 D.4a. Occupation Base : All respondents 6029
�� 120 D.4a. Occupation Base : All respondents 6029
�� 121 D.4a. Occupation Base : All respondents 6029
�� 122 D.4a. Occupation Base : All respondents 6029
�� 123 D.4a. Occupation Base : All respondents 6029
�� 124 Region Base : All respondents 6029
�� 125 Region Base : All respondents 6029
�� 126 Region Base : All respondents 6029
�� 127 D.6. Locality Base : All respondents 6029
�� 128 D.6. Locality Base : All respondents 6029
�� 129 D.6. Locality Base : All respondents 6029