The UK R&D Landscape€¦ · Working Groups for their support and ... Dr. Hermann Hauser Partner...
44
The UK R&D Landscape Enhancing Value Task Force Reprinted and Revised March 2012 Alan Hughes and Andrea Mina
Transcript of The UK R&D Landscape€¦ · Working Groups for their support and ... Dr. Hermann Hauser Partner...

The UK R&D LandscapeEnhancing Value Task Force
Reprinted and Revised March 2012
Alan Hughes and Andrea Mina

Acknowledgements
This report has been produced as part of the work of the CIHE-UK~IRC Task Force on Enhancing Value: Getting the Most out of UK Research. The authors gratefully acknowledge the support of Anna Bullock and Isobel Milner of the CBR Database Unit and of Irmi Hahne in preparing this report as well as excellent research assistance provided by Alberto García Mogollón and Sara Grobbelaar. We are indebted to Simon Eddolls from the Office for National Statistics who provided invaluable help with UK sectoral innovation and output statistics. We are grateful for insightful and helpful comments from Professor Ben Martin of SPRU, Rosa Fernandez of BIS, Adrian Day, Davina Madden and Alice Frost of HEFCE, Alison Wall of EPSRC and participants in the seminar held at BIS on 31st January 2012. We thank members of the CIHE/UK~IRC ‘Enhancing Value’ Task Force Steering and Working Groups who each provided helpful feedback on preliminary versions of our findings. Full details of the Enhancing Value Task Force and its sponsors, whose support we gratefully acknowledge, can be found at
www.cihe.co.uk/enhancing-value-task-force.
Contact details for authors:
Alan Hughes
Andrea Mina
Centre for Business Research and UK~IRC
Judge Business School
University of Cambridge
Trumpington Street, CB2 1AG, UK

Reprinted and Revised March 2012
The UK R&D Landscsape
Enhancing Value Task Force
Alan Hughes and Andrea Mina


This is the first in a series of linked reports on gaining the most value from the UK innovation system, and in particular its university research. It highlights strongly the need to sustain the competitiveness of UK R&D in terms of both quantity and quality, and also the variability in the relationship between the UK research base and business, as a function of sector and size of company. Furthermore, it shows clearly that the openness and quality of UK R&D to non-UK domiciled businesses is a major strength. It is most important that the conditions that attract those businesses, in particular the quality of university research and talent, is not undermined.
We would like to thank Alan Hughes, Andrea Mina and the Task Force Steering and Working Groups for their support and insight.
David Eyton Professor Shirley Pearce
Group Head Technology Vice Chancellor
BP Loughborough University
Foreword

Task Force MembersTask Force Chairs
David Eyton Group Head of Technology BP
Prof. Shirley Pearce Vice Chancellor Loughborough University
Strategic PartnersDr. David Docherty Chief Executive CIHE
Prof. Alan Hughes Director CBR and UK~IRC
Steering GroupJames Baker Director BAE Systems
Prof. Genevieve Berger Chief R&D Officer Unilever
Prof. Sir Leszek Borysiewicz Vice Chancellor University of Cambridge
Prof. David Delpy CEO Champion for Impact RCUK
Prof. Peter Downes Vice Chancellor University of Dundee
Sir Tim Wilson Former Vice Chancellor University of Hertfordshire
Prof. Malcolm Grant President & Provost UCL
Iain Gray CEO TSB
Dr. Hermann Hauser Partner Amadeus Capital Partners
Prof. Julia King Vice Chancellor University of Aston
Pat Loughrey Warden Goldsmiths, University of London
Dr. Mene Pangalos EVP Innovative Medicines AstraZeneca
Prof. Ric Parker Director of Research & Technology Rolls-Royce
Lord Sainsbury of Turville Peer House of Lords
Phil Smith Chief Executive Cisco UK and Ireland
Dr. David Sweeney Director of Research, Innovation & Skills HEFCE
Mark Thompson Director General BBC
Prof. Patrick Vallance SVP Medicines Discovery & Development GSK
Working Group Chairs
Prof. Michael Caine Director, Olympic Park Development & Associate Dean, Enterprise Loughborough University
Dr. Robert M Sorrell VP Public Partnerships BP
Working GroupDr Aileen Allsop Previous VP Science Policy R&D AstraZeneca
Richard Biers Programme Leader, S&T Futures and Innovation DSTL
Sally Devine Task Force Coordinator CIHE
Alice Frost Head of Business and Community Policy HEFCE
Chris Ganje Policy Advisor BP
Dr. Andy Leonard Vice President BP Cambridge
Dr. Andrea Mina Senior Research Fellow CBR and UK~IRC
Dr. Declan Mulkeen Director Research Programmes MRC
Prof. Douglas Paul Director of the James Watt Nanofabrication Centre University of Glasgow
Dr. Jocelyn Probert Senior Researcher CBR and UK~IRC
Dr. Allyson Reed Strategy and Communications Director TSB
Dr. Douglas Robertson Director of Research and Enterprise Services, Chair of PraxisUnico Newcastle University
Dr. Malcolm Skingle Director Academic Liaison GSK R&D
Philip Ternouth Associate Director CIHE
Nigel Townley Engineering Director, Enhanced Customer Aligned Test Services Cisco
Dr. Alison Wall Associate Director, Impact ESPRC
Jackie Wilbraham Director R&D science policy AstraZeneca
Andy Wilson Head, Centre of Technology BBC
Contact details for Task Force: Sally Devine, [email protected] ,0207 383 7667

i
Executive summary This report provides an analysis, in an international comparative framework, of the conduct of R&D in the UK by the business, government and higher education sectors and of the funding of such R&D from public, private, charitable and overseas sources. It uses the most recent UK government and OECD statistics to analyse changes over time in the scale of R&D in the UK and its distribution across industrial sectors and size classes of firms. It also analyses the pattern of government policy support for R&D and the scale of R&D relative to investments in other intangible assets such as software, skills and training and design as well as investment in capital equipment and other tangible assets. The objective is to set the scene for further work that will focus on the impact of UK R&D on output and productivity and qualitative case study research on the main challenges faced in four UK sectors in enhancing the value to be gained from UK R&D. Key Findings 1. Business and government expenditures on R&D in the UK (BERD and GovERD) have been
decreasing as a percent of GDP since the 1990’s. In contrast to this there has been a considerable increase in higher education expenditure on R&D in the UK (HERD) as a percentage of GDP. The upshot, however, has been an overall fall of total gross expenditure on R&D in the UK (GERD) relative to GDP from the early 1990s to date despite a modest recovery at the beginning of this century. Moreover, in international comparative terms the overall spend on R&D in the UK relative to GDP seems to be weakening over time.
2. The business enterprise component of R&D expenditure in the UK is low by international
standards even after adjusting for structural difference between countries. It is also concentrated in the hands of a few very large firms and the small number of industrial sectors in which they are based. The official statistics reveal that the largest 10 business R&D spenders accounted for 34% of all UK R&D in 2009 and the largest 50 spenders accounted for 56%. The many thousands of independent small and medium sized businesses employing fewer than 250 people accounted for only around 3.5% of the total R&D spend.
3. The significance of business enterprise R&D as a form of innovation related expenditure
differs significantly across UK industrial and service sectors. Sectoral innovation systems in the UK thus vary in the significance to be attached to R&D per se and in their combination of investments in capital goods, software, skills and training, and expenditure on design and business organisation relative to R&D.
4. The UK has by comparative international standards a relatively high share (over 40%) of its
business enterprise R&D expenditure carried out by the subsidiaries of overseas firms. Moreover, the share of total business R&D expenditure in the UK funded from overseas sources (over 20% by 2009) increased substantially during the 1990s. It appears that the UK is a comparatively attractive location for funding and carrying out R&D activities. However, the share of overseas funding stopped rising after 2002. Moreover UK businesses have decreased the relative extent to which they fund R&D in the UK. In 2000 R&D expenditure funded in the UK by the UK business enterprise sector was approximately ten times as large as expenditure it funded overseas; by 2009 it was only five times as large. The ‘openness’ of UK R&D activity makes it relatively vulnerable to the strategic investment decisions of overseas funders of UK R&D and of the parent companies of subsidiaries based in the UK as well as the decisions of the major UK based multinationals.

ii
5. The positive trend in Higher Education R&D in the UK has been weakened in the aftermath of
the world financial crisis. Moreover since the crisis began the UK’s principal competitors have increased HERD at a faster rate than the UK. At the same time the relative contribution of business enterprise to the funding of R&D in the UK higher education system has declined significantly.
6. Government funding of business R&D in the UK is relatively high by international standards,
but the majority of other countries have been increasing their commitments since 1999 whilst the UK has marked time. The USA has an exceptionally high level of direct government funding for business R&D and a relatively low tax incentive contribution. In the UK the use of the two R&D funding support streams is more balanced. The domination of R&D expenditure in the UK by a handful of large firms is not surprisingly matched by the extent to which they dominate access to funding designed to support UK R&D. Of the sample of countries we have considered in this report the UK has the lowest share of total government financed support for business R&D going to small and medium sized firms.
These findings raise a number of questions for policies designed to support the performance of the UK innovation system in the context of global competition. These will be addressed in further quantitative analyses of aggregate data and in‐depth qualitative studies of 4 selected sectors (pharmaceuticals, energy, creative‐digital‐and IT, and construction).

1
Introduction The objective of this report is to describe the R&D landscape of the UK economy. This is the first of a series of incremental steps through which the CIHE‐UK~IRC Enhancing Value Task Force is addressing key issues in enhancing the innovation and the productivity impact of UK R&D. It is important to emphasise that R&D is only one of a number of intangible investments (such as training and software investment) supporting innovation and productivity, and that innovation is nurtured within a much broader system framework.i This system includes demand conditions, the degree of competition, the availability of high quality human resources and of finance, and infrastructure and services that facilitate flows of knowledge and people.ii R&D remains, however, a significant component of the UK innovation system. It is a major target for government policy initiatives and perceived as a potential source of competitive advantage for the UK economy through its impact on innovation and then productivity and output growth. It is therefore important to understand the scale and pattern of UK R&D, changes in that pattern over time and its characteristics compared to other competitor countries. This report focuses on UK R&D as an input. It is not concerned with the important, but different, questions of the relationship between expenditure on R&D and its effect on either innovation or productivity and output growth. That will be the subject of a later report. In this report we also focus on the UK economy in fairly broad, aggregate terms. We nevertheless provide some disaggregation of R&D activity by manufacturing and services as broad categories of activity and also some disaggregation by size of business and sector. We also provide some data on the comparative scale of R&D relative to investment in other tangible and intangible assets in the innovation process. A fuller, in‐depth analysis of the role of R&D in a sample of particular sectors will be the subject of a separate report combining quantitative and qualitative analysis. We analyse R&D conducted in the UK. Our focus on the UK includes an analysis of the conduct of R&D by the private, public and charitable sectors as well as the funding of R&D by those sectors. In the case of funding we include an analysis of the funding of R&D activity conducted in the UK but with resources provided by the sector. The overseas sector encompasses both private and charitable funders based overseas. Since our primary purpose is an analysis of the UK landscape we do not include an analysis of R&D conducted abroad by the UK public or private sector. A few comments on UK business enterprise investment overseas are nonetheless useful as a context against which our analysis of R&D in the UK is conducted. In 2009 the UK Business Enterprise sector funded £11,519 million of BERD in the UK. In addition it funded R&D abroad to the value of £2,228 million, a significant commitment. It is important also to note the extent to which the latter has increased in significance over time. Thus, in 2000 R&D funded in the UK by the Business Enterprise sector was approximately ten times as large as that funded overseas; by 2009 it was only five times as large. We consider trends over time in the conduct and funding of UK R&D and provide a comparison of the UK’s R&D landscape with a group of countries chosen to cover a wide range of relevant economies. This sample of countries is chosen to include the Nordic economies, some of the largest OECD economies (including the USA, Korea, Japan, Germany, and France) and China. We try to use a consistent set of comparators covering these countries, but data are not always available for all series for all of the economies concerned. We provide an analysis of changes over time and also where possible consider the impact of the most recent changes contingent upon or following the financial crisis. In this report we concentrate on four core components of R&D expenditure. These components are consistently used in the UK and OECD official statistics and provide a breakdown of R&D expenditure into four main categories. Overall R&D is captured by gross expenditure on R&D (GERD). GERD is

2
then broken down into three components. These are business expenditure on R&D (BERD), government expenditure on R&D (GovERD), and higher education sector spending on R&D (HERD). These categories used to analyse the conduct of R&D may also be used to categorise the funding of R&D. Each sector may fund expenditure out of its own resources, but typically there are major cross‐funding flows. Thus in the UK HERD is mainly funded by the public sector supported by smaller private and/or charitable sector funding. Similarly, BERD is primarily self‐funded by the business sector, but also obtains funding from the public sector. Each of the categories of expenditure may also be funded from overseas. It is important to consider patterns of both expenditure and funding, since expenditure itself may be contingent upon or influenced by the availability of different sources of funding. Moreover, much policy debate is concerned with the extent to which financing flows from the public sector should be used to support either business expenditure or higher education expenditure or particular patterns of expenditure within those sectors. Equally, the extent to which R&D carried out in the UK is funded from overseas sources is an important policy issue, since a heavy dependence on overseas sources of funding may either be regarded as a source of strength (a reflection of the attraction of the UK as an R&D source) or as a potential weakness (to the extent that R&D is increasingly footloose and may be susceptible to relocation, and/or costly to attract or maintain via public subsidies such as tax credits and grants).

3
R&D expenditure in the UK by funding and performance The latest figures available from the UK Office for National Statistics (ONS) show that UK GERD was approximately £25 billion in nominal terms in 2009. Exhibit 1 shows trends in GERD as a percentage of GDP as well as trends in BERD, HERD and GovERD. Expressing expenditures as a percentage of GDP allows us to see the relative importance of R&D to the economy and its trend over time. 1. UK R&D expenditure as a percentage of GDP
Data source: Office for National Statistics
The most striking feature of Exhibit 1 is that only HERD shows a sustained upward trend. Since the 1990s GERD has been trending downwards as have both BERD and GovERD with signs of a modest recovery after 2004. To the extent that R&D is regarded as a significant input into innovation and insofar as innovation is deemed to be an important determinant of productivity and output growth, these figures taken by themselves seem to suggest a weakening of the UK input effort into key components of the R&D process.iii It is of course possible that investment in other intangibles may have become more significant over this period and that the overall impact of shifts in R&D expenditure may be moderated or accentuated by trends in related investment in other intangible investment categories. There is a growing literature on these other intangible investments which include design, copyright development, market research and advertising, software development, training, skills development and broader organisational changes affecting the efficiency of businesses. These analyses show that while, as we have seen, BERD as a percentage of GDP has been falling, it has nonetheless maintained its share of total intangible investment. For instance, it has been estimated that in 2007 BERD was approximately £15 billion. In that year software development and design expenditure were £20 billion and £22 billion respectively while expenditure on training – the largest category of intangible investment – was £32 billion. Recent analyses of time series movements in these expenditures on intangible assets suggest that they were all declining in money terms from the early 2000s onwards having all increased in money terms in the previous 20 years (NESTA, 2009, pp. 25‐26; NESTA, 2010). There is no sign that weakening R&D is being offset by more investment in other intangibles.
0.0
0.5
1.0
1.5
2.0
2.5
1991
1992
1993
1994
1995
1996
1997
1998
1999
2000
2001
2002
2003
2004
2005
2006
2007
2008
% of G
DP
GERD
BERD
HERD
GovERD
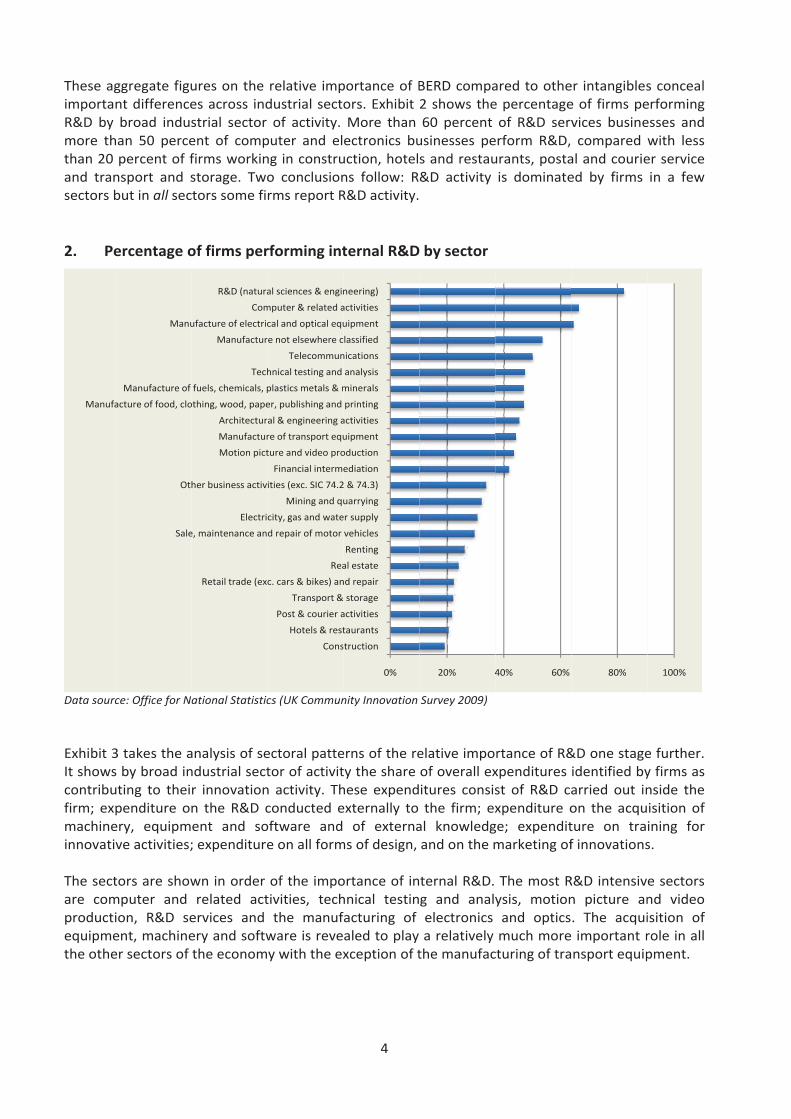
These agimportanR&D by more ththan 20 and transectors b 2. Pe
Data sourc Exhibit 3It showscontribufirm; expmachineinnovativ The sectare comproductiequipmethe othe
Manufa
ggregate figunt differencebroad indus
han 50 percepercent of fnsport and sbut in all sec
ercentage o
ce: Office for Na
3 takes the as by broad inuting to theipenditure onery, equipmve activities;
tors are showmputer and ion, R&D seent, machineer sectors of
Sale
Oth
acture of food, clo
Manufacture of
Manu
ures on the es across indstrial sector ent of compfirms workinstorage. Twotors some fi
of firms per
ational Statistic
analysis of sendustrial sectr innovationn the R&D cent and so; expenditure
wn in order related actervices and ery and softwthe econom
Retail trade (exc
e, maintenance an
Electri
her business activ
Motion pict
Manufactur
Architectur
othing, wood, pape
fuels, chemicals, p
Tech
Manufactur
ufacture of electric
Com
R&D (natura
relative impdustrial sectoof activity.
puter and elng in construo conclusionrms report R
rforming int
cs (UK Commun
ectoral pattetor of activitn activity. Thconducted eoftware and e on all form
of the impotivities, techthe manuf
ware is revey with the ex
Cons
Hotels & rest
Post & courier a
Transport &
c. cars & bikes) an
Rea
d repair of motor
city, gas and wate
Mining and qu
ities (exc. SIC 74.2
Financial interme
ture and video pro
re of transport equ
al & engineering a
er, publishing and
plastics metals & m
hnical testing and
Telecommun
e not elsewhere c
cal and optical equ
mputer & related a
al sciences & engin
4
portance of Bors. Exhibit More than ectronics buuction, hotelns follow: R&R&D activity.
ternal R&D
nity Innovation
erns of the rety the share hese expendexternally to of externa
ms of design,
ortance of inhnical testinacturing of aled to play xception of t
0%
truction
taurants
activities
storage
nd repair
al estate
Renting
vehicles
er supply
uarrying
2 & 74.3)
ediation
oduction
uipment
activities
printing
minerals
analysis
nications
lassified
uipment
activities
neering)
BERD compa2 shows the60 percent usinesses pes and restau&D activity
by sector
Survey 2009)
elative impoof overall exitures consisthe firm; ex
al knowledgand on the m
ternal R&D. g and analyelectronics a relatively the manufac
20% 4
ared to othee percentageof R&D serv
erform R&D, urants, postais dominate
rtance of R&xpenditures st of R&D caxpenditure oge; expenditmarketing of
The most Rysis, motionand opticsmuch more
cturing of tra
40% 60%
er intangiblese of firms pevices businecompared
al and courieed by firms
&D one stageidentified byarried out inon the acquture on traf innovations
R&D intensivn picture an. The acqui important rnsport equip
80%
s conceal erforming esses and with less er service in a few
e further. y firms as nside the isition of ining for s.
e sectors nd video isition of role in all pment.
100%

5
With the exception of real estate, hotels and restaurants, and transport, R&D plus capital equipment and software expenditures are the dominant form of activity in support of innovation. It is clear, however, that the relative importance of types of expenditure varies across sectors so that we should treat each as having different sectoral systems of innovation and differing relative roles for R&D. The UK sectoral R&D landscape is a differentiated one. 3. Shares of expenditure of UK firms’ innovation‐related activities by sector
Data source: Office for National Statistics (UK Community Innovation Survey 2009) Exhibit 4 returns to overall R&D (GERD) to focus on the split of R&D between defence expenditure and civil expenditure. It is clear that Defence R&D has been in decline.
0% 10% 20% 30% 40% 50% 60% 70% 80% 90% 100%
Transport & storage
Hotels & restaurants
Post & courier activities
Real estate
Electricity, gas and water supply
Mining and quarrying
Construction
Retail trade (exc. cars & bikes) and repair
Manufacture of food, clothing, wood, paper, publishing and printing
Renting
Manufacture not elsewhere classified
Sale, maintenance and repair of motor vehicles
Other business activities (exc. SIC 74.2 & 74.3)
Telecommunications
Architectural & engineering activities
Financial intermediation
Manufacture of transport equipment
Manufacture of fuels, chemicals, plastics metals & minerals
R&D (natural sciences & engineering)
Manufacture of electrical and optical equipment
R&D (social sciences & humanities)
Motion picture and video production
Technical testing and analysis
Computer & related activities
Internal R&D
Acquisition of external R&D
Acquisition of machinery, equipment and software
Acquisition of external knowledge
Training for innovative activities
All forms of design
Market introduction of innovations

4. Ex
Data sourc It is alsoavailable1995 ongovernmthe high 5. Ex
Data sourc
0%
10%
20%
30%
40%
50%
60%
70%
80%
90%
100%
0%
10%
20%
30%
40%
50%
60%
70%
80%
90%
100%
1981
xpenditure
ce: Office for Na
o possible toe at differenwards public
ment and thaer education
xpenditure
ce: Office for Na
1989
1990
1991
1992
1981
1982
1983
1984
1985
1986
on R&D in
ational Statistic
o examine bt levels of dc sector fundat which is inn funding cou
on R&D in
ational Statistic
1992
1993
1994
1995
1986
1987
1988
1989
1990
1991
the UK: De
cs
broad trenddisaggregatioding is shownndirectly supuncils.
the UK by f
cs
1996
1997
1998
1991
1992
1993
1994
1995
1996
6
fence and C
s in the funon for the pen as disaggreplied from t
funder (%)
1999
2000
2001
2002
1996
1997
1998
1999
2000
2001
Civil (%)
nding of experiod covereegated betwhe governm
2002
2003
2004
2005
2001
2002
2003
2004
2005
2006
penditure oned in Exhibit ween that direent via the r
2006
2007
2008
2006
2007
2008
2009
P
A
H
B
HCR
G
n R&D. The 5. In particuectly provideresearch cou
2009
Total
Total
Private non‐profit
Abroad
Higher education
Business enterpris
Higher Education CouncilsResearch Councils
Government
data are ular from ed by the uncils and
Defence
Civil
t
se
Funding
s

If we takhigher le2000. The shamost sig1980s thretrenchwas in 2UK as a share haR&D hasscience, Given thexaminerelation 6. Scie
impa
Source: h2
Dataset: S Exhibit 6allocatioresearchfor the
ke this groupevel of the s
re of fundingnificant feathrough to 2hment in this2002. To the location foras been fallins increased ssuch as the
he growth oe the distribto this.
nce and reseairment allo
http://www.bis2015.pdf (p.17)
Science and Res
6 shows the ons. It illusth is supportescience and
£
p as a whole,share of such
ng directly pture of the t2002 with a s position. Textent that
r R&D activitng in recentsubstantiallyWellcome T
of the impoution of the
earch fundinocations (tota
s.gov.uk/assets/)
search budget a
broad breakrates a divied in the UK. d research
£1,731,300 38%
£87,8322%
£4
, it appears th funding co
provided by table is the vparticularlyhe share of overseas inty, this sugget years. The y. This particrust.
rtance of R&e funding of
ng in the UK al: £4,575 m
/biscore/scienc
allocation 2011
kdown of funsion which Thus there abase is allo
2
43,6161% £163,805
3%
7
that in the laompared to a
UK businessvery large iny rapid expaR&D in the vestment is ests that it cexhibit also cularly reflec
&D in the hf that resear
2010‐2011, million)
ce/docs/a/10‐1
1‐12 to 2014‐15
nding for sciereflects theare two coreocated to th
£
5
ast decade tha downward
s enterprise ncrease in fuansion in thUK funded fseen as an could be a mshows that
cts the impac
higher educarch. Exhibits
excluding ca
356‐allocation‐
5.xlsx
ence and rese dual funde funding strehe Research
2,549,35356%
here has bee drift from t
itself has faunding from e 1990s. Thfrom abroadindicator of matter of soprivate not‐ct of major c
ation sector6, 7 and 8
apital and de
‐of‐science‐and
search in theing system eams. Arounh Councils fo
R
H
N
O
U
en a stabilisathe 1980s th
allen somewabroad betwhere has be is now lowethe attractiome concern‐for‐profit fucharitable fu
r, it is intereprovide evi
epreciation a
d‐research‐fund
e UK excludinby which u
nd 56% of theor funding
esearch Councils
HEFCE
National Academie
Other Programme
UK Space Agency
ation at a hrough to
what. The ween the en some er than it on of the that the unding of unders of
esting to idence in
and
ding‐2011‐
ng capital university e funding for their
s
es
es

8
embedded units, subscriptions to national and international research facilities and for award to academics through a competitive bidding process for grants, whilst 38% is provided through the other component of the dual support system by HEFCE. The latter is closely related to the allocations provided in relation to the last Research Assessment Exercise (RAE) evaluations. Relatively smaller amounts are accounted for by the UK space agency, funding of the national academies and a variety of other programmes. If we focus on the Research Council resource component and include capital allocations (Exhibit 7), then the major funding is seen to run through three of the Research Councils, namely the Engineering and Physical Sciences Research Council with 29% of the budget, the Medical Research Council which accounts for 21% of the budget and the Biotechnology and Biological Sciences Research Council which accounts for 14% of the budget. The rest is split amongst a variety of arts and humanities and social sciences and other technology councils with 11% going to the Natural Environment Research Council. 7. Science and research funding in England allocations by research council, 2010‐2011 (total:
£3,177 million)
Source: http://www.bis.gov.uk/assets/biscore/science/docs/a/10‐1356‐allocation‐of‐science‐and‐research‐funding‐2011‐
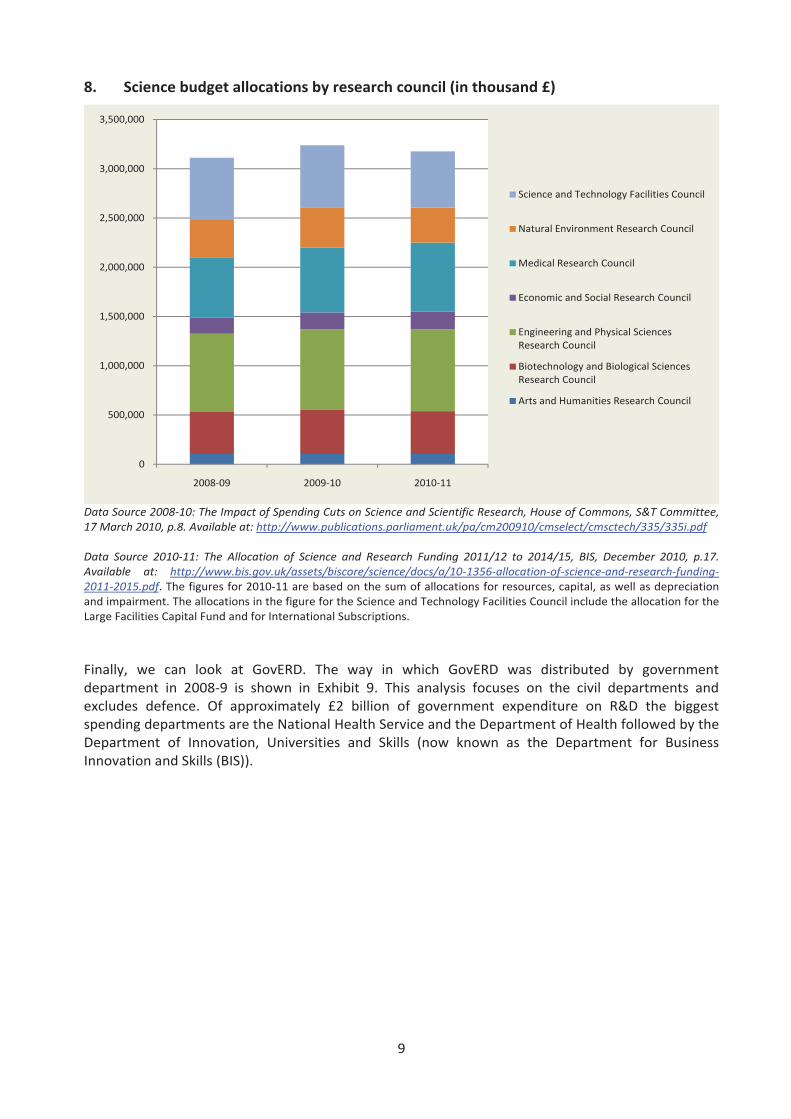
2015.pdf (p.17) Dataset: Science and Research budget allocation 2011‐12 to 2014‐15.xlsx. The figures are based on the sum of allocations for resources, capital, as well as depreciation and impairment. The allocations in the figure for the Science and Technology Facilities Council include the allocations for the Large Facilities Capital Fund and for International Subscriptions. Exhibit 8 shows levels and patterns of allocations across the individual Research Councils for England from 2008‐11. The allocations are reported in money terms unadjusted for price inflation. The chart thus implies a decline in real terms over the period shown. The pattern across councils is relatively stable.
103,867
435,737
829,306
179,048
702,229
355,450
571,240
Arts and Humanities Research Council
Biotechnology and Biological Sciences Research Council
Engineering and Physical Sciences Research Council
Economic and Social Research Council
Medical Research Council
Natural Environment Research Council
Science and Technology Facilities Council
9
8. Science budget allocations by research council (in thousand £)
Data Source 2008‐10: The Impact of Spending Cuts on Science and Scientific Research, House of Commons, S&T Committee, 17 March 2010, p.8. Available at: http://www.publications.parliament.uk/pa/cm200910/cmselect/cmsctech/335/335i.pdf Data Source 2010‐11: The Allocation of Science and Research Funding 2011/12 to 2014/15, BIS, December 2010, p.17. Available at: http://www.bis.gov.uk/assets/biscore/science/docs/a/10‐1356‐allocation‐of‐science‐and‐research‐funding‐2011‐2015.pdf. The figures for 2010‐11 are based on the sum of allocations for resources, capital, as well as depreciation and impairment. The allocations in the figure for the Science and Technology Facilities Council include the allocation for the Large Facilities Capital Fund and for International Subscriptions. Finally, we can look at GovERD. The way in which GovERD was distributed by government department in 2008‐9 is shown in Exhibit 9. This analysis focuses on the civil departments and excludes defence. Of approximately £2 billion of government expenditure on R&D the biggest spending departments are the National Health Service and the Department of Health followed by the Department of Innovation, Universities and Skills (now known as the Department for Business Innovation and Skills (BIS)).
0
500,000
1,000,000
1,500,000
2,000,000
2,500,000
3,000,000
3,500,000
2008‐09 2009‐10 2010‐11
Science and Technology Facilities Council
Natural Environment Research Council
Medical Research Council
Economic and Social Research Council
Engineering and Physical Sciences Research Council
Biotechnology and Biological Sciences Research Council
Arts and Humanities Research Council
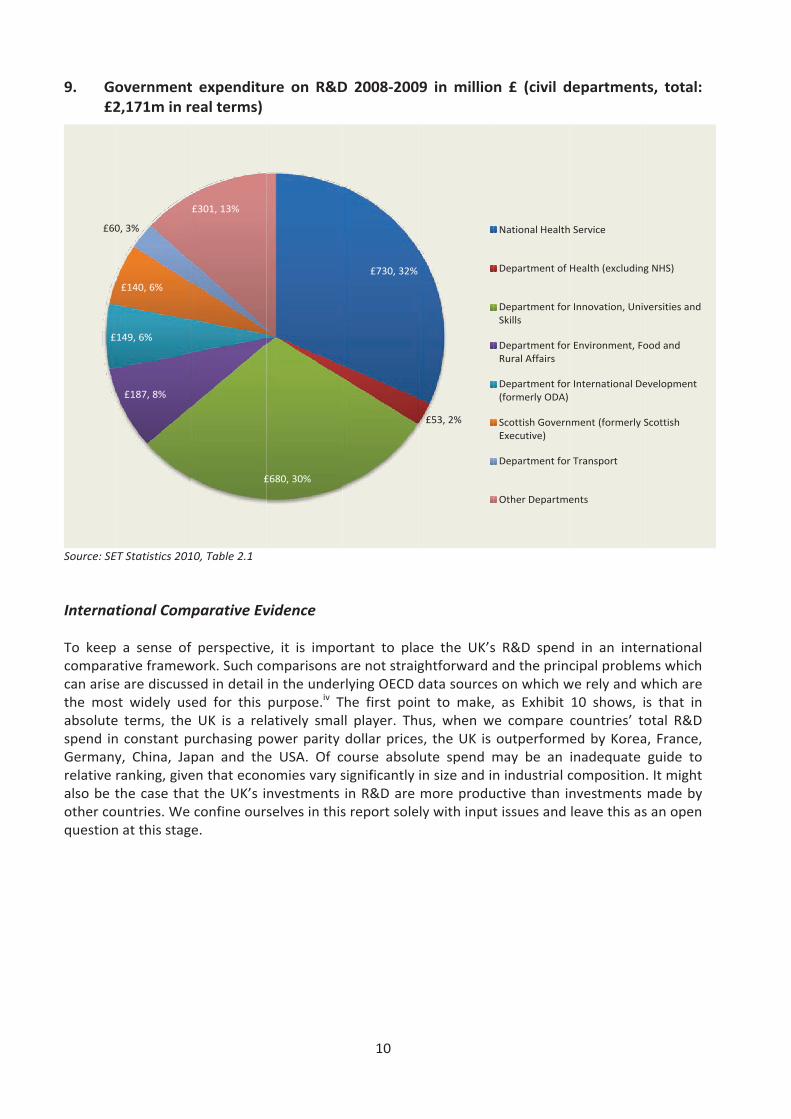
9. Go£2
Source: SE Interna To keepcomparacan arisethe mosabsolutespend inGermanyrelative also be tother coquestion
£
£60
overnment2,171m in r
ET Statistics 201
tional Comp
p a sense ofative framewe are discussst widely use terms, then constant py, China, Jaranking, givethe case thaountries. We n at this stag
£187, 8%
£149, 6%
£140, 6%
0, 3%
t expenditureal terms)
10, Table 2.1
parative Ev
f perspectivework. Such cosed in detail ed for this UK is a rel
purchasing popan and theen that econat the UK’s iconfine ourse.
£
£301, 13%
ure on R&D
vidence
e, it is impoomparisons ain the underpurpose.iv Tatively smalower parity e USA. Of comies vary snvestmentsselves in this
£680, 30%
10
D 2008‐200
ortant to plaare not straigrlying OECD The first poill player. Thdollar pricescourse absolsignificantly in R&D are s report sole
£730, 32%
09 in millio
ace the UK’sghtforward adata sourcesnt to make,us, when ws, the UK is ute spend min size and inmore produ
ely with input
£53, 2%
n £ (civil d
s R&D spendand the prins on which w, as Exhibit e compare outperformmay be an n industrial cuctive than int issues and
National Health
Department of
Department forSkills
Department forRural Affairs
Department for(formerly ODA)
Scottish GovernExecutive)
Department for
Other Departme
department
d in an intecipal problemwe rely and w10 shows, icountries’ toed by Koreainadequate compositionnvestments leave this as
h Service
Health (excluding
r Innovation, Univ
r Environment, Fo
r International De
nment (formerly S
r Transport
ents
ts, total:
rnational ms which which are s that in otal R&D a, France, guide to . It might made by s an open
g NHS)
versities and
ood and
evelopment
Scottish

11
10. GERD: US dollars in constant 2000 prices
Data source: OECD Exhibit 11 provides two normalised measures of research activity. The horizontal axis shows GERD as a percent of GDP, whilst the vertical axis shows researchers per 1,000 employees. 11. GERD: Gross domestic expenditures on R&D (as a % of GDP) and researchers per
1,000 employees, 2009 or latest available Year
Data source: OECD
0
50,000
100,000
150,000
200,000
250,000
300,000
350,000
400,000
450,000
USA
CHN
JPN
DEU
KORFRA
GBR
SWE
FIN
DNK
NOR
0.0
2.0
4.0
6.0
8.0
10.0
12.0
14.0
16.0
0.0 0.5 1.0 1.5 2.0 2.5 3.0 3.5 4.0
R&D Volumes in 2000 USD ‐ constant prices and PPP
1 Billion
10 Billion
100 Billion
Researchers per 1
,000
Employees
GERD as a % of GDP

12
The UK emerges from this normalised analysis of 2009 data as a distinctly lagging performer relatively to our selected countries (except for China). Naturally, it could be argued that R&D intensity is affected by the industrial composition of national economies: an economy may have a low R&D intensity because it is characterised by an industrial structure which has relatively low R&D spend, e.g. Services. Exhibit 12, based on OECD estimates, compares business enterprise R&D intensity (BERD) adjusted for these differences in industrial structure. 12. Business R&D intensity adjusted for industrial structure, 2008 (as a % of value added
in industry)
Data source: OECD Once these adjustments are made, the UK still appears to be an underperformer. Thus in relation to a figure of 2.5%, which has become a target figure in many past policy strategies at EU and national levels, the UK’s performance is inferior to those of France, the USA, Denmark, Japan, and Sweden. Its performance is marginally less good than Finland and Norway but it should be noted better than Germany or Korea. On this basis it does not appear that it is possible to account for the UK’s overall relatively poorer R&D performance by virtue of the particular industrial structure which it has. Moreover, the UK’s position seems to have been worsening. Exhibit 13 compares compound annual growth rates in GERD for the most recent periods for which data is available. Here the UK ranks behind all the sample countries apart from Sweden.
0.0
0.5
1.0
1.5
2.0
2.5
3.0
3.5
4.0
Norway
United Kingdo
m
France
United States
Germany
Den
mark
Japan
Korea
Finland
Swed
en
%

13
13. Compound annual growth rates in GERD (period in brackets)
Data source: OECD Exhibit 14 confirms this weakened position, although for a longer time period. That chart compares our sample countries over a period from 1999‐2008/11. The variation in end years means that some countries data may have been more affected by the post crisis recession than others in terms of GDP, R&D or both. The data suggests nonetheless that UK GERD as a percentage of GDP has been marking time at less than 2% whilst in the case of Finland, Korea, Japan, the USA, Germany and in particular China, there have been faster increases in the share of GERD in GDP.
14. GERD: gross domestic expenditure on R&D, 1999 and 2009 (as % of GDP)
Data source: OECD
0%
2%
4%
6%
8%
10%
12%
14%
16%
18%
0
1
2
3
4
5
Finland Sweden Korea (1999, 2008)
Japan United States
(1999, 2008)
Germany France United Kingdom
Norway China
%
1999 Bar 2009

14
As we pointed out earlier, R&D is one of only a number of intangible investments which an economy might make to improve its innovation, productivity and growth performance. It is therefore possible that the expenditure on R&D performance of the UK is compensated for or offset by a different mix of intangible investment activity. Exhibit 15, however, shows that the UK’s ranking remains low even when investments in tangible and other intangible assets are accounted for, although the gap between UK, France and Germany is narrowed. 15. Investments in tangible and intangible assets as a share of GDP, 2006
Data source: OECD Japan, Sweden, France, Denmark, Finland and the USA all outperform the UK in terms of the share of GDP spend on this full set of asset creation. The role of government funding of GERD is shown in Exhibit 16. The share is greatest in Norway, France and Denmark with the UK occupying an intermediate position. Industry funding is greatest as a share in Japan, Korea, Germany and the USA.v The most significant feature of the UK is that the increasing importance of overseas funding that we remarked on earlier in the report has produced a position in which the UK has the highest proportion of its R&D funded from overseas of the countries in our sample which report such data, followed closely by Sweden.vi If we look at a similar analysis in terms of who is performing GERD, Exhibit 17 shows that the UK has a relatively low government R&D expenditure share and has a relatively low share of business performed R&D with only Norway and France having lower business shares in total GERD.
0
5
10
15
20
25
30
%
Brand equity, firm‐specific human capital, organisational capital
R&D and other intellectual property products
Software and databases
Machinery and equipment

15
16. Funding of GERD (latest available year)
Data source: OECD 17. Performance of GERD (latest available year)
Data source: OECD Finally, in terms of GERD we may look at the type of R&D which is carried out. That is to say we can look at the extent to which the research is classified as basic, applied, experimental development or a miscellaneous not elsewhere classified activity, according to the conventions of the Frascati Manual. There is relatively less data available with which the UK’s experience can be compared, and international comparability is especially difficult because of influence of institutional policies on definitions. In any event Exhibit 18 suggests that the UK occupies a middling position in terms of the share which is basic in character, but has the highest share which may be classified as applied.
0%
10%
20%
30%
40%
50%
60%
70%
80%
90%
100%
Abroad
Other national
Government
Industry
0%
10%
20%
30%
40%
50%
60%
70%
80%
90%
100%
Private Non‐profit
Government
HES
Business Enterprise

16
18. GERD – Type of R&D (latest available year)
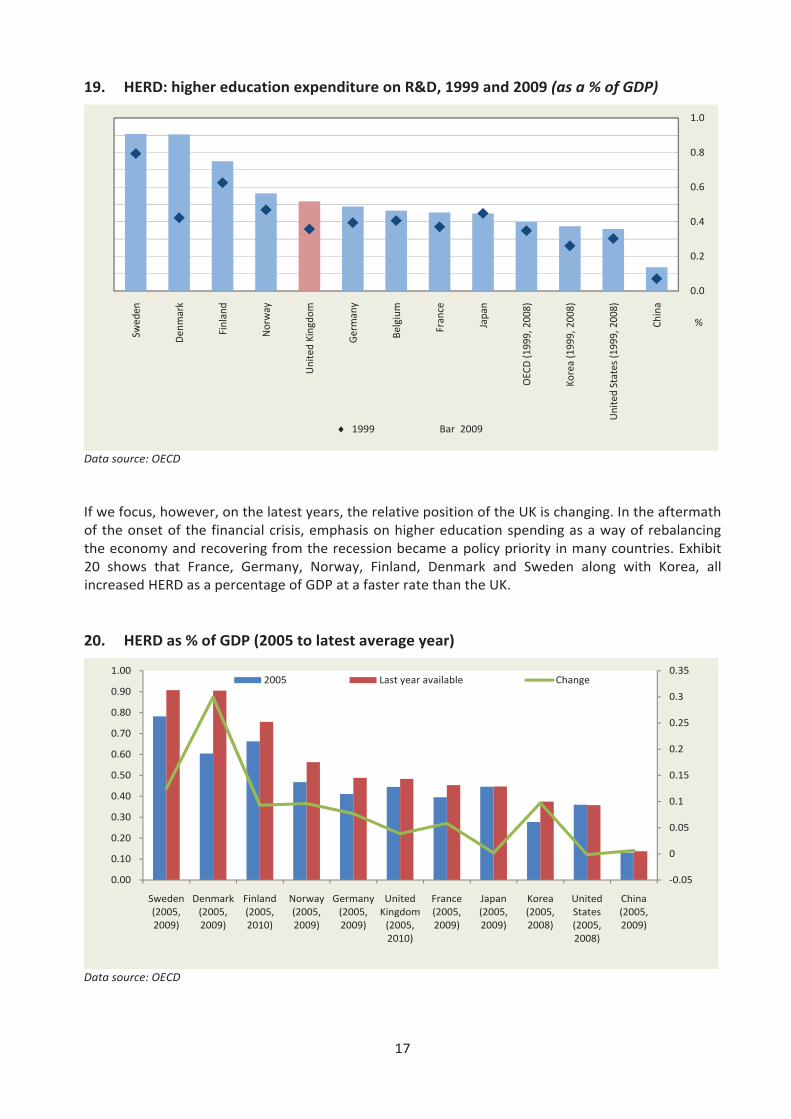
Data source: OECD Experimental development is much higher in Denmark, the USA and China than it is in the UK. If this data is reliable this could raise questions about the extent to which these types of expenditure may be related to the innovation process in the presence or absence of other types of complementary investments required to convert R&D into commercially viable innovative outputs. Higher Education Expenditure on R&D (HERD) In our analysis of the UK R&D landscape we identified the increasing share of HERD as a proportion of GDP in the UK. It is apparent from Exhibit 19 that the UK is not alone in experiencing an increase of this kind. With the exception of Japan, all of the countries shown and the OECD economies as a whole have an increasing share of higher education expenditure on R&D as a percentage of GDP. The increase was, however, somewhat greater in the case of the UK than it was in a number of its major international comparators, including Germany, Japan (where the share stagnated) and the USA. A remarkable increase occurred in the case of Denmark.
0%
10%
20%
30%
40%
50%
60%
70%
80%
90%
100%
Norway (2007) US (2008) UK (2008) Denmark (2007)
China (2008)
Not elsewhere classified (type of R&D)
Experimental development
Applied research
Basic research
17
19. HERD: higher education expenditure on R&D, 1999 and 2009 (as a % of GDP)
Data source: OECD
If we focus, however, on the latest years, the relative position of the UK is changing. In the aftermath of the onset of the financial crisis, emphasis on higher education spending as a way of rebalancing the economy and recovering from the recession became a policy priority in many countries. Exhibit 20 shows that France, Germany, Norway, Finland, Denmark and Sweden along with Korea, all increased HERD as a percentage of GDP at a faster rate than the UK. 20. HERD as % of GDP (2005 to latest average year)
Data source: OECD
0.0
0.2
0.4
0.6
0.8
1.0
Swed
en
Den
mark
Finland
Norway
United Kingdo
m
Germany
Belgium
France
Japan
OEC
D (1
999, 2008)
Korea (1999, 2008)
United States (1
999, 2008)
China
%
‐0.05
0
0.05
0.1
0.15
0.2
0.25
0.3
0.35
0.00
0.10
0.20
0.30
0.40
0.50
0.60
0.70
0.80
0.90
1.00
Sweden (2005, 2009)
Denmark (2005, 2009)
Finland (2005, 2010)
Norway (2005, 2009)
Germany (2005, 2009)
United Kingdom (2005, 2010)
France (2005, 2009)
Japan (2005, 2009)
Korea (2005, 2008)
United States (2005, 2008)
China (2005, 2009)
2005 Last year available Change
1999 Bar 2009

18
This suggests that in comparative terms the response of the UK after 2005 was less marked than in many other countries. On the other hand this may reflect the fact that the UK was starting from a higher relative position than it otherwise might have been, given its more sustained growth of expenditure in the higher education sector in the preceding half decade. An important question about HERD expenditure is its allocation between basic, applied and experimental development activity. Exhibit 21 allows us to compare Denmark, Norway, the UK, the US and China from this perspective. It appears from this comparison that the UK is already relatively heavily committed to applied research in its higher education sector. It has a somewhat lower share of experimental development than China or Norway, but it is not possible on the basis of Exhibit 21 to argue that the UK has an over‐commitment to basic research in its higher education sector. 21. HERD – type of R&D (latest available year)
Data source: OECD One feature which may encourage HERD expenditure towards the applied or experimental development end of the R&D spectrum could be the extent to which business funds the R&D performed in the higher education sector. It is not possible to get a direct comparison for higher education alone, but it is possible to compare the extent to which R&D performed in the higher education and government sectors is funded by business across countries. This is shown in Exhibit 22.
0%
10%
20%
30%
40%
50%
60%
70%
80%
90%
100%
US (2008) China (2007) UK (2008) Norway (2007) Denmark (2007)
Not elsewhere classified (type of R&D)
Experimental development
Applied research
Basic research

19
22. Business‐funded R&D in the higher education and government sectors, 1999 and 2009 (as a % of R&D performed in these sectors (combined))
Data source: OECD This chart reveals a remarkable picture. The UK, which in 1999 had a relatively high share of R&D in the higher education and government sectors funded by business, has declined to a middle position. In 1999 it was in the second rank amongst the sample countries in terms of business funded R&D in these sectors. By 2009 it ranked below the OECD average and the individual countries of Norway, Korea, Finland, Germany and China.vii The substantial increase in government funding for the science base over this period does not appear to have been matched by funding from the business sector in the UK. To the extent that the nature of R&D activity carried out in the higher education sector is influenced in more applied and experimental directions by the presence of business funding, this suggests a major weakening of an important complementary funding stream for the higher education sector in the UK. Moreover, to the extent that increased expenditure on HERD in the UK has moved such R&D activity towards the more experimental end, this may have been a substitution for activity formerly funded by the business sector. This is an important question to examine in more detail.
0
3
6
9
12
15
% 1999 Bar 2009

20
Business Enterprise R&D Expenditure (BERD) The UK has a relatively weak performance in terms of business enterprise expenditure on R&D measured as a percentage of GDP. We have already seen that this cannot be explained simply in terms of the UK’s industrial composition. Exhibit 23 shows that its position in this respect has weakened over time in a sense that the share of business enterprise expenditure on R&D has fallen as a percent of GDP whilst it has increased in a significant number of the sample countries with which we are comparing the UK’s performance. 23. BERD: Business enterprise expenditure on R&D, 1999 and 2009 (as a % of GDP)
Data source: OECD In the case of Finland, Korea, Japan, Denmark, Germany and China, there was a significant increase in business enterprise spend on R&D as a percent of GDP between 1999 and 2009. Only in the case of Sweden and Great Britain did this percentage fall. Thus, notwithstanding the large inflow of overseas funding for R&D, the overall business enterprise R&D effort stalled. Moreover, in the most recent periods from 2005 onwards, the UK’s position has remained at the bottom of the sample league table. The share of BERD in GDP recovered so that it was higher in 2009 than it had been in 2005. Exhibit 24, however, shows that the increase was less than in many other countries, including Finland, Korea, the USA, Denmark, Germany and Norway.
0.0
1.0
2.0
3.0
Finland Sweden Korea (1999, 2008)
Japan United States (1999, 2008)
Denmark Germany OECD (1999, 2008)
France China United Kingdom
Norway %
1999 Bar 2009

21
24. BERD as a % of GDP (2005 to latest year)
Data source: OECD In terms of the type of R&D carried out by business enterprise, Exhibit 25 reveals that the UK business spends less on the experimental development end than other rivals in Norway, Denmark, US and China and rather more on basic research. 25. BERD – Type of R&D (latest available year)
Data source: OECD
‐0.1
‐0.05
0
0.05
0.1
0.15
0.2
0.25
0.3
0.35
0.4
0.45
0.00
0.50
1.00
1.50
2.00
2.50
3.00
Finland (2005, 2010)
Sweden (2005, 2009)
Korea (2005, 2008)
Japan (2005, 2009)
United States (2005, 2008)
Denmark (2005, 2009)
Germany (2005, 2009)
France (2005, 2009)
China (2005, 2009)
United Kingdom (2005, 2010)
Norway (2005, 2009)
2005 Last year available Change
0%
10%
20%
30%
40%
50%
60%
70%
80%
90%
100%
Experimental development
Applied research
Basic research

22
As with our analysis of the breakdown of HERD expenditure, it would be interesting to examine the extent to which different types of R&D within overall R&D expenditures were related to innovative performance and economic growth. So far we have focused on business enterprise R&D taking the business sector as a whole. It is of course the case that the UK has a relatively high degree of activity located in its service sectors, as we have already remarked on. The debate over rebalancing the economy suggests that some believe that the UK has an over‐heavy weight in these sectors. It is interesting therefore to look at the distribution of R&D between the service and manufacturing sectors broadly defined. This is done in Exhibits 26 and 27. Exhibit 26 shows the share of services in business R&D in 1998 and 2008. 26. Percentage of Business R&D accounted for by services, 1998 and 2008
Data source: OECD All of the economies shown, with the exception of Denmark and Korea, have increased the percentage of their business R&D carried out in the services sector. The increase in the case of the UK is, however, greatest across all of the countries, although the percentage of its R&D carried out in services was still below that of Denmark and the USA in 2008. Exhibit 27 is the counterpart of Exhibit 26 and shows the percentage of manufacturing in business R&D. Here we find that the UK ranks behind Finland, France, China, Japan, Korea and Germany in terms of business enterprise R&D in manufacturing relative to services.
0
10
20
30
40
Denmark (1998, 2006)
United States
United Kingdom
Sweden (1998, 2007)
Finland (1998, 2007)
France (1998, 2007)
Japan (1998, 2009)
Germany Korea China (2000, 2009)
% 1998 Bar 2008

23
27. Percentage of business R&D accounted for by manufacturing (latest available year)
Data source: OECD If we look at business enterprise R&D in manufacturing as a percent of value added in manufacturing (rather than as a share of the economy as a whole), the UK’s relatively low R&D intensity in the manufacturing sector is starkly revealed (Exhibit 28). Only Norway has a lower share of R&D in value added in manufacturing. Moreover, that intensity fell between 2000 and 2008 whilst it increased in Korea, Japan, Germany and Finland. The growth in the share of service activity in GDP in recent years in the UK has been accompanied by a growth of the share of services in business R&D as a whole. This might be expected given the structural shifts that have occurred in the economy. However, it also appears that within manufacturing itself the share of resources committed to research and development has been falling. 28. BERD as a % of value added in manufacturing
Data source: OECD
0%
10%
20%
30%
40%
50%
60%
70%
80%
90%
100%
Germany (2005)
Korea (2008)
Japan (2008)
China (2000)
France (2007)
Finland (2008)
United Kingdom (2008)
Sweden (2007)
Denmark (2006)
United States (2001)
Norway (2008)
0.00%
0.50%
1.00%
1.50%
2.00%
2.50%
3.00%
3.50%
4.00%
4.50%
Finland (2000, 2008)
Korea (2000, 2008)
Japan (2000, 2005)
Sweden (2001, 2007)
Germany (2000, 2006)
France (2000, 2007)
United States (2000, 2001)
Denmark (2001, 2002)
United Kingdom (2000, 2008)
Norway (2001, 2008)
First year
Last year

24
A number of other aspects of business R&D are worth exploring. It is often argued that small and medium‐sized enterprises will play an important role in the rebalancing process in the UK. It is therefore essential to ask about the extent to which such enterprises are involved in R&D activity. Exhibit 29 shows that firms employing less than 50 employees count for less than 10% of all BERD whilst those employing between 50 and 249 employees counted for around 14%. Thus, these small and medium‐sized enterprises taken together accounted for over a fifth of all R&D. This contribution is higher than in a number of our major competitors, including France, Sweden, Finland, the USA, Germany and Japan. It is important to note, however, that this group of firms includes businesses that are the subsidiaries of larger businesses. The official R&D statistics for the UK shows that the vast majority of SME R&D is in fact carried out by these subsidiaries and not by independent small firms employing less than 250 employeesviii. Thus in 2009 the entire UK independent SME sector accounted for only 3.5% of R&D in the UK whilst the largest 10 R&D spenders alone accounted for 34% and the largest 50 spenders for 56%. (Business Enterprise Research and Development Expenditure 2009. Office for National Statistics, Tables 18 and 26.) 29. Business R&D by size class of firms, 2009 (as a % of total BERD)
Data source: OECD
In our earlier discussion of the UK’s business R&D, we emphasised the important role played by overseas funding. We can explore this in more detail in Exhibits 30 and 31 in a comparative context. Figure 30 looks not at R&D expenditures funded from abroad, but at R&D expenditures generated by foreign controlled affiliates located in the home nation. This is another aspect of internationalisation as opposed to R&D expenditure funded by inflows of finance from abroad. Expenditures generated by foreign controlled affiliates are the highest in the group of countries for which this analysis is available. Well over 40% of all R&D expenditure in the UK is generated by the affiliates of foreign controlled businesses located in the UK. Once again, this emphasises the importance of such investments to the UK economy and the extreme sensitivity of the UK’s economic performance to the investment decisions of such foreign controlled affiliates.
0
10
20
30
40
50
60
Norway Denmark (2005)
Korea (2008)
United Kingdom (2008)
France (2008)
Sweden (2007)
Finland United States (2007)
Germany (2007)
Japan
% Firms with 50 to 249 employees Firms with fewer than 50 employees

25
30. R&D expenditures generated by foreign‐controlled affiliates, 2008 (as a % of BERD)
Data source: OECD Exhibit 31 focuses on the inward flow of funds for investment from overseas. Once again, the UK occupies an extreme position with over 20% of business R&D in the UK funded with investment from abroad. 31. R&D funds from abroad, 2009 (as a % of business enterprise R&D)
Data source: OECD
0
20
40
60
United Kingdom
Sweden (2007) Norway (2007) Germany (2007)
France Finland (2006) United States Japan
%
0 5 10 15 20 25
Korea (2008)
Japan
China
Germany (2008)
Finland
Denmark
France (2008)
Norway
Sweden
United Kingdom
%

26
Exhibit 32 looks at government funding of BERD. Government funded R&D in the business sector is relatively high by international standards and stable over time. 32. Government‐financed R&D in business, 1999 and 2009 (as % of R&D performed in the
business sector)
Data source: OECD
Finally, Exhibit 33 looks at the role of government in funding BERD combining direct funding with tax breaks.
33. Direct government funding of business R&D and tax incentives for R&D, 2009 (as a % of GDP)
Data source: OECD
0
5
10
France (2006, 2008)
Norway United States (1999, 2008)
United Kingdom (2001, 2009)
OECD (1999, 2008)
Sweden (2005, 2009)
Korea (1999, 2006)
Germany (1999, 2008)
China (2000, 2009)
Finland Denmark (1999, 2005)
Japan
%
0.00 0.05 0.10 0.15 0.20 0.25 0.30 0.35 0.40
Japan (2008)
Denmark
Finland
Germany (2008)
Norway
United Kingdom
Korea (2008)
Sweden
France (2008)
United States (2008)
% of GDP
Direct government funding of BERD Indirect government support through R&D tax incentives
1999 Bar 2009

27
The analysis is for 2009 and reveals that the UK occupies a middling position in terms of the combination of both these forms of support. It is particularly noticeable that the USA has such an exceptionally high level of direct government funding for business R&D and relatively low tax incentive contribution. Its government support overall is exceeded only by France and Korea because of the very high levels of indirect support through R&D tax incentives in those countries. An interesting question to pursue is the extent to which the balance of support lies between direct and indirect government funding has an impact on the fruitfulness of such support in terms of innovation and the commercialisation process. Exhibit 34 returns to the question of the role of small firms. It looks at government financed BERD by firm size in 2009 as a percentage of total government financed BERD. This shows that the UK ranks last of the countries for which such data is available. Support for small business sector R&D has the lowest share of total government financed R&D of all the countries looked at. It is clear that other economies place a much higher percentage of their government support effort on smaller as opposed to larger businesses than is the case in the UK. 34. Government‐financed BERD by firm size, 2009 (as a % of total government‐financed
BERD)
Data source: OECD We can look at the distribution of business R&D in the manufacturing sector in terms of technological intensity. The analysis in Exhibit 35 reveals that the UK has a relatively small proportion of its activity in medium and low technology activities and a relatively high share in the high technology sector, lagging only behind Finland and Sweden. It does not appear that the UK’s effort is focused on the lower end of the technology scale.
0 10 20 30 40 50 60
United Kingdom (2008)
France (2008)
United States (2007)
Sweden (2007)
Germany (2007)
Denmark (2007)
Norway
Korea (2008)
Finland
%
Firms with fewer than 50 employees Firms with 50 to 249 employees

28
35. Business R&D in the manufacturing sector by technological intensity, 2008 (as a % of manufacturing business enterprise R&D)
Data source: OECD
Government Expenditure on R&D (GovERD) In addition to providing a substantial flow of funds to finance research in the business enterprise and higher education sectors, the government sector itself spends significant sums on funding its own R&D activity carried out in various government departments and agencies. We can see that this has been declining in the UK. Exhibit 36 places the UK’s experience in an international context and shows the shares of government expenditure as a percentage of GDP in 2005 and the latest year for which data is available. It also provides an indicator of the percentage change in that share between 2005 and the latest year for which data is available. 36. GOVERD as % of GDP (2005 to latest year)
Data source: OECD
0
10
20
30
40
50
60
70
80
90
100
% Medium‐low and low technology Medium‐high technology High‐technology
‐0.08
‐0.06
‐0.04
‐0.02
0
0.02
0.04
0.06
0.08
0.1
0.00
0.10
0.20
0.30
0.40
0.50
0.60
Germany (2005, 2009)
Korea (2005, 2008)
France (2005, 2009)
Finland (2005, 2010)
China (2005, 2009)
Japan (2005, 2009)
United States (2005, 2008)
Norway (2005, 2009)
United Kingdom (2005, 2010)
Sweden (2005, 2009)
Denmark (2005, 2009)
2005 Last year available Change

29
The majority of countries have seen a significant commitment of additional government R&D since 2005. This is particularly true in the case of Germany, Korea, Finland, China, Japan and Norway. The UK as well as having a relatively low share of government expenditure in R&D is also one of only five countries experiencing a fall in this share since 2009. An analysis of the kind of R&D carried out in the government sector is shown in Exhibit 37. 37. GOVERD – Type of R&D (latest available year)
Data source: OECD Compared to the other countries shown, Exhibit 37 reveals that the UK government is more likely to be conducting basic research, although as we have remarked earlier there are problems of international comparability of definitions or their operationalisation. The UK appears as more likely to be doing applied research than either China or the US, but has a significantly smaller proportion of applied research than is true in either Denmark or Norway. It will be important to investigate in more detail the definitions behind these data and the departmental patterns of expenditure in the UK beyond the aggregate statistics we have used so far in this paper.
0%
10%
20%
30%
40%
50%
60%
70%
80%
90%
100%
Denmark (2007) Norway (2008) UK (2008) US (2008) China (2008)
Not elsewhere classified (type of R&D)
Experimental development
Applied research
Basic research

30
Conclusions The objective of this report is to set the scene for the analytical work that will be developed in subsequent analyses of the impact of R&D via the analysis of aggregated data and via in‐depth studies of selected sectors. We will then move to policy recommendations. Our key findings and the questions for future investigation arising at this stage of our work are as follows: 1. The data reveal that since the 1990s business and government expenditure on R&D (BERD and
GERD) have been decreasing as a percent of GPD. In contrast to this there has been an increase in higher education expenditure (HERD) as a percentage of GDP. The upshot, however, has been an overall fall of total gross expenditure on R&D (GERD) relative to GDP from the early 1990s to date. The UK appears to be a lagging R&D performer. This remains true even when the figures are adjusted to account for the difference in the industrial composition of the UK economy, which has a high share of less R&D intensive services compared to other countries. Moreover, the UK position seems to be weakening over time. This remains the case when we look at investment in intangible innovation assets.
QUESTION: What are the implications of falling business and overall R&D relative to GDP for the performance of the UK innovation system?
2. Funding for Business R&D from abroad increased substantially during the 1990s, although it stabilised after 2002. The UK also has a relatively high share of business enterprise R&D carried out by the subsidiaries of overseas firms. The UK appears to be a comparatively attractive location for funding and carrying out R&D activities. This reliance on foreign funding and ownership sources might, however, be a cause for concern because of the dependence of UK R&D upon decisions taken outside the UK.
QUESTION: What are the implications for the performance of the UK innovation system of the extreme openness to globalisation of the UK R&D innovation landscape?
3. The conduct of business sector R&D in the UK is concentrated in the hands of a few very large firms and a small number of industrial sectors. The largest 10 business R&D spenders accounted for 34% of all UK R&D in 2009 and the largest 50 spenders accounted for 56%. Their activity is focussed on a small number of sectors. However, the role of R&D in innovation related expenditure also varies widely across sectors compared to other investments in tangible and intangible assets. QUESTION: What are the implications of the concentration of R&D in a few businesses and the different contribution of R&D across sectors for strategic policy intervention in the UK innovation system?
4. In the UK small and medium sized enterprises (SMEs), which are defined as firms with less than 250 employees, account for over a fifth of all business R&D expenditure. However, the vast majority of this SME R&D is carried out by the subsidiaries of UK and overseas firms and not by independent SMEs. The latter account for less than 4% of UK business sector R&D. QUESTION: What are the implications for the future role of independent SMEs in R&D given their currently small contribution?

31
5. Since the financial crisis the UK’s principal competitors have increased HERD at a much faster
rate than the UK. At the same time the relative contribution of business enterprise to the funding of R&D in the UK higher education and government sector has declined significantly. QUESTION: What are the implications of these changing patterns in the conduct and funding of higher education R&D for the performance of the UK innovation system?
6. Government funding of business R&D in the UK is relatively high by international standards, but the majority of other countries have been increasing their commitments since 1999 whilst the UK has marked time. The USA has an exceptionally high level of direct government funding for business R&D and a relatively low tax incentive contribution. In the UK the use of the two R&D funding streams is more balanced. In addition, analyses of the relative balance of government support to large vis‐à‐vis smaller firms reveal that support for small business sector R&D in the UK has the lowest share of total government financed R&D of all the countries we have considered in this report. QUESTION: What impact does the balance between direct and indirect government support and the balance of support between large and small firms have on innovation and the commercialisation process in the UK?
The next phase of the project will address these questions. We will review the evidence on the impact of UK R&D on innovation and productivity growth at the economy, sector and firm levels. We will also take forward in parallel with this review a set of case studies of four sectors to understand these links in more depth. These sectors are: pharmaceuticals, energy, creative‐digital‐and‐IT, and construction. This sample of sectors has been chosen because of their varying innovation ecosystems in terms of the public/private sector R&D mix, the relative role of large and small firms and of global investment flows and because of the differences in the balance of intangible and tangible investments in the innovation process.


References
32
i Haskel, J., Wallis, G. (2010), Public Support for Innovation, Intangible Investment and Productivity Growth in
the UK Market Sector, Imperial College London Business Discussion Paper 2010/01. Available at: http://spiral.imperial.ac.uk/bitstream/10044/1/5280/1/Haskel%202010‐01.pdf.
ii The National Innovation System literature provides a well‐known framework of analysis encompassing these elements and their interconnection. For a review of this literature, see Edquist, C. ‘Systems of Innovation: Perspective and Challenges’ (2005), in Fagerberg, J., Mowery, D.C., Nelson, R.R. (Eds.) The Oxford Handbook of Innovation, Oxford University Press, Oxford, pp. 181‐208. For recent empirical applications, see Dodgson, M., Foster, J., Hughes, A. and Metcalfe, J. S. (2011) ‘Systems thinking, market failure, and the development of innovation policy: The case of Australia’, Research Policy 40(9), pp. 1145‐1156, and also Allman, K., Edler, J., Georghiou, L., Jones, B., Miles, I., Omidvar, O., Ramlogan, R., Rigby, J. (2011), Measuring Wider Framework Conditions for Successful Innovation, Report for NESTA, London. Available at: http://www.nesta.org.uk/library/documents/Measuring_Framework_web_v2.pdf.
iii Trends in real R&D for the UK and elsewhere are not published because of the absence of an accepted price index for R&D. Hence the widespread use of scaling R&D by GDP in national and international comparisons. If a price index for R&D was available and if it rose less fast than the GDP deflator then there would be a tendency for R&D as a percentage of GDP to fall purely because of relative price effects. Whilst this could affect movements over time in a single country it would not affect comparison of trends between countries (based on R&D relative to GDP) unless there were significant differences in the relative movement of the R&D and GDP deflators across countries. For a recent attempt to address this issue in the UK, see Corrado, C., Goodridge, P., Haskel, J., 2011, ‘Constructing a price deflator for R&D: calculating the price of knowledge investments as a residual’ Imperial College Business School Discussion paper 2011/07.
iv International comparisons of the conduct and funding of R&D are fraught with problems. R&D data collection varies across countries so that some data e.g. on the extent of foreign funding of R&D is not available for some countries. Coverage of small firms R&D varies across countries and data for them are often difficult to obtain by current sample survey techniques. The definitions of R&D have been developed mainly in relation to manufacturing sectors so that the scale and nature of service sector R&D may not be well represented. Other problems arise when R&D is disaggregated into that carried out by the private and public sectors and by higher education. Here variations occur across countries because of differences in the scale of their public and private sectors and in the extent to which universities are a part of the state or private sectors. Within countries changes can occur over time, say, in the share of public sector R&D because of privatization programmes, or the switching of public sector research organisations into either the university or public sector. All of these issues must be borne in mind when drawing conclusions for the currently published data on which we draw in this report. For a thorough discussion of these and other related issues see for example the detailed notes in OECD Main Science and Technology Indicators Database, June 2011. One particular issue is worth commenting further on here. Business sector R&D is typically heavily concentrated in a small number of technology based mainly manufacturing sectors. As a result countries dominated by such sectors will tend to show high ratios of business R&D to GDP. When we compare business R&D across countries we therefore use an OECD correction which calculates the R&D to GDP ratio as if each country had the average OECD sectoral structure. Other such corrections are possible (e.g. for the size distribution of firms within sectors because large firms are typically R&D intensive) which go beyond the remit of this paper.
v The OECD (Main Science and Technology Indicators Database, June 2011) do not present a figure for US funding of R&D from abroad.
vi As we have seen earlier it is possible to look at the extent to which UK R&D is internationalised by examining the extent to which UK businesses invest abroad. It appears, as we have shown that this too was increasing in significance through the 1990s and the first decade of the current century. (For a similar conclusion focussing on the 1990s alone see Bloom, N. and R. Griffith, 2001, The Internationalisation of UK R&D, Fiscal Studies 22(3): pp. 337–355).
vii The independent computation of the UK figures made by the authors on the basis of ONS statistics revealed a minor discrepancy for the year 1999 relative to the figure presented by the OECD. This was 9.63 percent instead of 11.08, while the 2009 percentage was exactly the same (4.88). This only improves rather

33
marginally the size of the percentage reduction of Business‐funded R&D performed by the Higher Education and Government sectors between 1999 and 2009.
viii There are problems in identifying from sample surveys the extent of R&D in smaller firms and in identifying subsidiary and independent status. These statistics may therefore have a substantial margin of error. However, the relative position of large and independent small and medium sized enterprises would appear dramatic even given large underestimation errors for the latter.

The UK Innovation Research Centre (UK~ IRC) is a joint venture between the Centre for Business Research at the University of Cambridge and Imperial College Business School to further research and knowledge exchange on innovation policy and practice. The UK~IRC is global in scope and involves a large-scale, multi-year research programme and a Knowledge Hub to engage with and inform policy-makers and practitioners about innovation research. The research programme explores open innovation, service innovation, online communities and innovation policy-making. A further stream of research focuses on the nature of university-industry links and role of higher education in innovation systems. Through the Hub, our aim is to maximise the effect of the research on policy and practice, so as to help the UK face its social, environmental and economic challenges.
The Centre is co-funded by Department for Business, Innovation and Skills (BIS), the Economic and Social Research Council (ESRC), the National Endowment for Science, Technology and the Arts (NESTA) and the Technology Strategy Board (TSB). This support is gratefully acknowledged.
• Ensure that new research on innovation in both the public and private sectors has the greatest effect on policy and practice.
• Explore the relationship between innovation and business performance and how this affects the national economy and the individual organisation.
• Actively disseminating its work through a ‘Knowledge Exchange Hub’, this will include activities ranging from seminars to innovation podcasts.
The Council for Industry and Higher Education (CIHE) is a strategic leadership network of blue-chip companies working with Vice Chancellors and universities to develop the UK's knowledge-based economy.
The CIHE Task Force on Creative, Digital and Information Technology produced a widely-received and influential report, The Fuse. This resulted in the development of the Brighton Fuse, which brings together researchers, universities and SMEs with the aim of driving innovation and growth within the digital and creative industries around Brighton and Hove. Brighton Fuse is funded by the Arts & Humanities Research Council and involves the Universities of Brighton and Sussex as well as Wired Sussex.
The CIHE Engineering and Manufacturing Task Force recently published Powering Up, which called on the Government to give greater incentives to universities and industry to work closer together. Phase two focuses on the talent 2030 pipeline and will be launched in October 2012.
Financial Support from

Council for Industry and Higher Education (CIHE)
Studio 11, Tiger House, Burton Street,
London, WC1H 9BY
w. www.cihe.co.uk
t. +44 (0)207 383 7667
f. +44 (0)207 383 3433
© CIHE March 2012
Photo Credits: i-stockphoto.com ISBN 1 874223 95 5
UK Innovation Research Centre
Top Floor, Judge Business School Building
University of Cambridge
Trumpington Street
Cambridge, CB2 1AG
t. +44 (0)1223 746575
f. +44 (0)1223 765338