The UK Biodiversity Action Plan: Highlights from the 2008...
32
The UK Biodiversity Action Plan: Highlights from the 2008 reporting round Published by JNCC . More information on the UKBAP process can be found on the UKBAP website , or the Biodiversity Action Reporting System .
-
Upload
duongthuan -
Category
Documents
-
view
217 -
download
0
Transcript of The UK Biodiversity Action Plan: Highlights from the 2008...

The UK Biodiversity Action Plan: Highlights from the 2008 reporting round
Published by JNCC. More information on the UKBAP process can be found on the UKBAP website, or the Biodiversity Action Reporting System.

Contents
Main results Page 1
Introduction Page 2
UK trends for priority species and habitats Page 3
State of knowledge Page 13
Progress on targets for UK BAP species and habitats Page 16
Current and emerging threats to species and habitats Page 20
Constraints to delivering action plans Page 23
Solutions Page 26
Successes: A positive note to finish on Page 28

2
Main results This report contains an update on progress to conserve species and habitats identified as requiring priority action under the UK Biodiversity Action Plan. To allow comparison with the last report in 2005, it examines the 45 habitats and 475 species (covered by 391 Species Action Plans) on the UK list prior to a review in 20071. It was considered too early to report on the species and habitats that were added to the UK list in 2007. The main results are: • Biodiversity Action Plan partnerships at UK and local levels continue to deliver gains for some priority species and habitats, with the rate of decline slowing and in some cases halted or reversed. Nevertheless there is a lot more to do. • 8 priority habitats (18%) and 40 priority species (11%) were increasing or probably increasing. • 9 priority habitats (20%) and 144 priority species (39%) were stable or probably stable. • 19 priority habitats (42%) and 88 priority species (24%) were declining or probably declining but the rate of decline is slowing for 9 habitats (20%) and 28 species (8%). • 8 species were reported to have been lost since the publication of the UK Biodiversity Action Plan in 1994 and 11 were thought to have been lost before this date. • The state of our knowledge of the conservation requirements for priority habitats and species was reported as increased compared with 2002, but gaps still existed in our monitoring. Beyond 2010, the main gaps were likely to be for marine, coastal and grassland habitats and for groups of invertebrates and plants. • Progress on targets was mixed. For those aimed at maintaining biodiversity (the timescale for these is 2010), 52% of species targets were met and 17% were not achieved, whilst on habitats, 26% were met and 30% were not achieved. The remainder were either not known or not reported. For targets aimed at making improvements, progress was behind schedule on the majority, but for some species, such as the Ladybird spider, Large Blue butterfly and Bittern, the progress was impressive. • Habitat loss/degradation (particularly owing to agriculture, changes in management practice or infrastructure development) and global warming continued to be the key threats reported for the highest proportion of priority species and habitats.
1A review of the priority species and habitats’ list, published in August 2007, led to several changes. The list now contains 1,150 species and 65 habitats. Details can be found at http://www.ukbap.org.uk/NewPriorityList.aspx

3
Introduction The UK Biodiversity Action Plan (UK BAP), published in 1994, was the Government’s response to the Convention on Biological Diversity (CBD) at the Rio Earth Summit in 1992. It sets out a programme for the conservation of the UK’s biodiversity and has led to the production of action plans to achieve the recovery of many of our most threatened species and habitats. Between 1995 and 1999, 391 Species Action Plans (covering 475 separate species) and 45 Habitat Action Plans were produced, each with specific biological targets and a Lead Partner to co-ordinate their implementation2. Over 170 Local Biodiversity Action Plans (LBAP) have also been developed by local partnerships to engage local communities and help deliver conservation action. The UK Government joined other EU countries in making a commitment in 2002 to halt biodiversity loss, with the aim of doing so by 20103
. The status of UK BAP species and habitats are among the UK indicators used to help assess progress towards this target. They were included in the UK’s fourth national report to the CBD in May 2009 and the indicators will be updated in 2010. Reporting has followed a three-year cycle, with previous reporting rounds taking place in 1999, 2002 and 2005. The set of data underpinning this report is available from the UK BAP (www.ukbap.org.uk/) and the Biodiversity Action Reporting System (BARS) (www.ukbap-reporting.org.uk) websites. In this round, Lead Partners and LBAP Co-ordinators provided reports for 44 Habitat Plans (98%), 364 Species Action Plans (94%) and 126 Local Biodiversity Action Plans (73%). Two companies submitted reports on their biodiversity actions. The reports are based, in part, on the considered opinions of species, habitat or local biodiversity experts and, whilst this may not be as robust as independent systematic survey, it does provide a detailed, very helpful and cost effective guide. A review of priority habitats and species was published in August 2007. The revised list contains 1,150 species and 65 habitats. To allow comparison with previous reports and because limited trend data would have been available for many of the new listings, the species and habitats on the UK list prior to the 2007 review were the subject of this reporting round. Seventy-two species were not placed on the revised list as they no longer met selection criteria. Lead Partners were requested to answer questions only on status, trends, progress on targets, threats and successes for these species. This “Highlights Report” draws together the key messages from the 2008 UK BAP reporting round. It is important that reporting information is used to further biodiversity conservation and it should have benefits for biodiversity practitioners and decision makers. The 2005 report, for example, was used by the Heritage Lottery Fund to provide funding for UK BAP species and habitats and could do so in the future. 2 In addition, species statements were produced for a further 104 priority species. However, Lead Partners were not identified
3 As part of the EU Sustainable Development Strategy agreed at the Gothenburg Summit, June 2001

4
UK trends for priority species and habitats The fundamental measure of progress on the UK BAP is whether or not the trend for priority species and habitats is improving4. This will normally be measured in terms of population for species and extent for habitats but in some circumstances, the trend relates to a species’ range or the condition of a habitat. The 2008 reporting indicates that: • 8 habitats (18%) and 40 species (11%) were thought to be increasing or probably increasing5 (compared with 10 (22%) and 42 (11%) respectively in 2005); • 9 habitats (20%) and 144 species (39%) were thought to be stable or probably stable6, which compares with 6 habitats (13%) and 134 species (36%) in 2005; • 19 habitats (42%) were assessed as declining or probably declining7, but the decline is slowing for 9 (20%) habitats. In 2005, the corresponding figures were 17 habitats (39%) in decline with 11 (25%) where the rate of decline was slowing; • 88 species (24%) were assessed as declining, but the decline is slowing for 28 (8%) species. For 2005, the figures were 102 species (27%) in decline with 36 (10%) where the decline was slowing; • 8 species were reported as lost since BAP publication and a further 11 were reported to have been lost prior to its publication; and • UK trend was unknown for 4 habitats (9%) and 37 species (10%). This compares with 11 habitats (24%) and 47 species (13%) in 2005. No reports were received for 1 habitat (2%) and 24 species (6%). In 2005 reports were received for all species and habitats. The charts at Figures 1a to 2b show the trends for habitats and species in 2008 and 2005 to allow comparison.
4 These figures exclude species covered by grouped species plans, the trends for these species are summarised separately on page 9.
5 In 2008, 2 habitats and 12 species were assessed as ‘fluctuating – probably increasing’
6 In 2008, 5 habitats and 55 species were assessed as ‘fluctuating – probably stable’
7 In 2008, 4 habitats and 29 species were assessed as ‘fluctuating – probably declining’

5
Figure 1a. 2008 UK Single species action plan trends (N=371) 8 Figure 1b. 2005 UK Single species action plan trends (N=373) 9 10 8 The ‘fluctuating – probably increasing’ category and ‘fluctuating – probably stable’ category have been combined with the ‘increasing’ and ‘stable’ categories respectively to keep down the number of segments in the charts for Figures 1a to 2b.
9 The extra 2 species in 2005 were Cochlearia micacea and Lecanographa grumulosa which were excluded from the 2008 reporting round as they are no longer considered true species owing to doubts about their taxonomic status.
10 The “lost (since BAP publication)”segment has been rounded up to 1%. In 2005 it had been erroneously recorded as 0.3%. It should have been 0.8%.

6
Figure 2a. 2008 UK habitat trends (N=45) Figure 2b. 2005 UK habitat action plans (N = 45)

7
Silver spotted skipper is one of the species that was not re-selected for inclusion in the revised BAP list in 2007 because its conservation targets had been met.
Species In 2008, reports were not received for 24 species (6%) whereas reports were received for all species in 2005 and this may mask or influence changes in the percentage figures for the other categories. However, there has been a slight fall in the number of species trends reported as decreasing and an increase in the number reported as stable or probably stable. The number of species reported to be increasing has fallen slightly. Forty species (11%) were reported to be increasing compared with 42 (11%) in 2005 and 26 (7%) in 2002. Eight of the 40 were removed from the revised UK BAP list in 2007, mostly because their targets had been met or their population status had improved.
Picture of Silver spotted skipper by Michael Hammett, Natural England ©.
Eighty-eight species were declining in 2008 compared with 102 in 2005. Examples include Skylark, Pearl-bordered fritillary, Common skate, Red squirrel and Juniper. Of the 144 species categorised as stable, the status of 55, including Vendace and Tree sparrow, was fluctuating but the underlying trend was thought to be stable. Species that have moved from declining to increasing or stable in 2008 include Shrill Carder bee, Reed bunting, Aspen hoverfly and Water vole. It is important to note that some species recorded as ‘stable’ may still be below target or sustainable levels. Three species have moved from increasing to declining – Slender naiad, Shepherd’s needle and Knothole moss. Eight species were recorded as being lost from the UK since the UK BAP was published in 1994 and a further 11 were thought to have been lost before publication (see below)11. This represents a loss of 5% of the 371 priority species covered by this report. The increase in losses compared with 2005 result from additional survey work conducted in the triennium and the informed opinion of Lead Partners. 11 The number of losses differs from that in ‘UK Biodiversity Indicators’ because more information became available - http://www.jncc.gov.uk/pdf/Biyp_2009.pdf

8
Species reported as lost since UK BAP publication in 1994. Scientific name Common name
Buellia asterella Starry Breck lichen
Chaenotheca phaeocephala a lichen
Cryptocephalus exiguous Pashford Pot beetle
Heliophobus reticulata marginosa Bordered Gothic moth
Jodia croceago Orange Upperwing moth
Jynx torquilla Wryneck
Laccophilus poecilus a diving beetle
Oria musculosa Brighton Wainscot moth
Species reported in 2008 as lost prior to UK BAP publication in 1994.
Scientific name Common name
Bembidion (Bracteon) argenteolum a ground beetle
Bombus (Subterraneobombus) subterraneus Short Haired Bumble bee
Chara muscosa Mossy stonewort
Cicadetta montana New Forest cicada
Edwardsia ivelli Ivell’s Sea anemone
Formica pratensis Black-backed Meadow ant
Lota lota Burbot
Lycaena dispar Large Copper Butterfly
Myotis myotis Greater Mouse-eared bat
Nomada errans a cuckoo bee
Stenus palposus a rove beetle

9
The reasons for loss of these species vary from possible water pollution (the diving beetle - Laccophilus poecilus) to changes in traditional construction materials (the lichen - Chaenotheca phaeocephala) but most cases are not well understood. For some the loss may be reversible. It is possible that the Wryneck will re-colonise as a breeding species if migrants appear in sufficient numbers and find suitable nesting habitat; and the Short Haired Bumble bee is the subject of a re-introduction project. However, Ivell’s Sea anemone is thought to be globally extinct. Changes in trends over all four reporting rounds (from 1999 where possible) have been used to compile the UKBAP species trend indicator (see UK biodiversity indicators in your pocket - http://www.jncc.gov.uk/page-4238 for details). An assessment of trend is available for 339 species from at least one of the four reporting rounds. Comparison of the earliest available and most recent assessment shows that the number of species thought to be ‘stable’ or ‘increasing’ has risen from 202 to 214 and the number decreasing or lost fell from 137 to 125. Taken together this indicates an underlying positive trend. Habitats
Nineteen (42%) priority habitats were reported to be declining. This is an increase from 2002 and 2005 when 17 (39%) reported a negative trend. Within the declining category the number reported as ‘declining – continuing/accelerating’ has doubled from 3 to 6 since 2005. In both 2005 and 2008, 52% of the habitats for which a clear trend assessment was available were in one of the declining categories.
Most of the change has been due to trend assessments changing from ‘unknown’ in 2005 to one of the declining categories in 2008. However, the assessment for sub-littoral sands and gravels has changed from ‘stable’ in 2005 to declining in 2008. This has been due to the impact of dredging, mineral extraction, wind-farm developments and mobile seabed fishing gear. As in 2005, the coastal and marine habitats generally have more negative assessments than the terrestrial ones. All six of the habitats that were assessed as ‘declining continuing/accelerating’ in 2008 were coastal or marine.

10
On the positive side, two habitats showed an upturn in trend. Limestone pavement and Lowland parkland/woodland pasture changed from ‘declining-slowing’ to ‘stable’ or ‘fluctuating – probably stable’. Picture of Limestone Pavement by Lorne Gill, Scottish Natural Heritage ©
Over the four reporting rounds, data used to compile the UK BAP indicator for habitat trends (see http://www.jncc.gov.uk/page-4239) suggests little change. A comparison of the earliest available and most recent assessments shows the number of habitats that are ‘stable’ or ‘increasing’ has declined from 21 to 20 (a 2.5% decrease).
As in 2005, separate status assessments were available for each species covered by grouped plans. These cover widely dispersed marine species such as whales, dolphins, commercial and deep-water fish, and groups of very similar or taxonomically difficult species such as eyebrights and sea lavenders. The results are similar to those for 2005: trends were unknown for 51 (64%) of these species, 5 (6%) were increasing, a further 5 (6%) were declining and 14 (17%) were reported to be stable. Different species from the commercial marine fish grouped plan provided most of the increasing and declining species. The 14 hawkweeds were assessed as one group as “declining (slowing)”. Overall, the status and trends in the priority species and habitats, including those in the grouped plans, show that the long-term decline in populations of key species and habitats have tended to slow in recent years and in some cases have halted or been reversed since the Biodiversity Action Plan was published. However, following the 2007 review of UK BAP Priority List, which led to the addition of more species and habitats, it is clear that there is still much to do to improve the status of our priority species and habitats and we should not underestimate the amount of time and effort that it takes to reverse adverse trends.
Grouped Species

11
Positive trends…. The area of cereal field margins increased more than threefold in the UK between 2005 and 2008 because of support through agri-environment schemes. On the strength of partial surveys or informed opinion, Lead Partners in 2008 believed the extent of reedbeds, lowland heathland and some of our native woodlands (including pinewoods) is increasing. Turning to species, the Pool frog was reported as lost in 2002. Building on re-introductions undertaken up to 2005, the pool frog BAP steering group organised further releases of this species from Swedish stock in each of the four years 2005-8. A small breeding colony has been established at the re-introduction site and an appropriate grazing regime has been introduced. The species is now ‘increasing’, and whilst it has a long way to go before it can be successfully re-established, its status as a BAP priority species has been important in catalysing this work. The Wild asparagus is found in a small number of sites in England and Wales. In 2005, it was reported to be ‘declining – slowing’. In 2008, its assessment was ‘stable’. This is the result of one population being established and one being reinforced in England; and improved survey data in Wales.
The Aspen hoverfly is dependent on the amount of dead wood in aspen woods in Scotland. In 2005, a decline in range was reported but the 2008 report suggests that populations at the core sites are increasing. Techniques for supplementing the supply of dead wood have been developed and research into the species ecology has been carried out. Picture of Aspen hoverfly by Iain MacGowan, Scottish Natural Heritage ©
The Dormouse had been lost at several sites in England. By 2008, it had been re-introduced at 15 sites and of these 12 have retained viable populations.

12
Areas of concern… The trends for some species and habitats continue to be a cause for concern. The six habitats for which Lead Partners reported continuing/accelerating declines (mudflats, saltmarsh, coastal vegetated shingle, maritime cliff and slopes, sheltered muddy gravels and sublittoral sands and gravels) in 2008 are largely coastal and partly reflect the pressure on the coast, including coastal squeeze. Our knowledge of the extent and condition of these habitats in the UK needs to improve. Estimates of the extent of saltmarsh in the UK pre-date the BAP although separate regional studies suggest that significant areas of saltmarsh have been lost. However the Environment Agency will be publishing a new inventory of saltmarsh in England and Wales later in 2010 which it is hoped can be used as a more reliable baseline against which to monitor country and regional level changes.
Picture of mudflats by Peter Wakely, Natural England ©
The numbers of the Fiery Clearwing moth were reported to have fallen. The poor summers in 2007 and 2008 have not helped but habitat deterioration at all sites is underpinning the downward trend.
A lichen (Calicium corynellum) was reported in 2008 as likely to be lost from one of its English sites within the year and declining at its only known Scottish site.

13
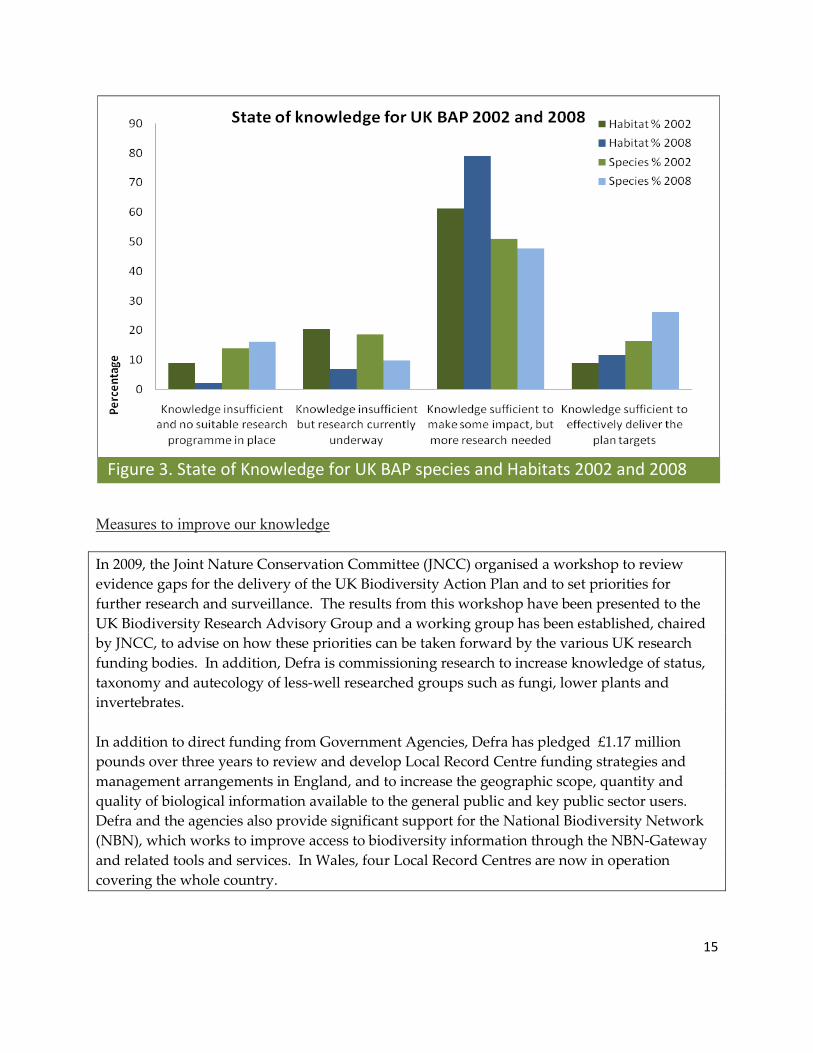
State of knowledge Our knowledge can never be complete on a subject as broad as biodiversity, and with the myriad of influences upon it, the knowledge that we have needs to be kept under review. As in 2005, the 2008 reporting round captured information on two aspects of the state of knowledge on priority species and habitats. First, whether we had adequate monitoring data to assess the status and trends of the species or habitats and whether this was likely to be available in three years time. Second, whether we had sufficient information to deliver the targets for the species or habitats. For example, whether the habitat requirements for a species, or restoration techniques for a habitat, are fully understood. Monitoring It is clear that in 2008 Lead Partners identified, as they did in 2005, inadequate research and survey information as a constraint to delivering the targets set out in their respective plans. Lead Partners reported that adequate monitoring data to assess the status and trends of the priority habitats and species were available for six habitats (13%) and 163 species (44%) in 2008. This is an improvement on 2005 for habitats where adequate data were available for just three habitats (7%) but no significant change for species – 161 (44%). Progress has been slower than anticipated in 2005 when Lead Partners expected to have adequate monitoring data for 40% of habitats and 62% of species by 2008. Looking forward, some Lead Partners reported that they expect to see an improvement in monitoring by 2011, and whilst this will not result in coverage of all UK BAP species and habitats, their expectations show a positive direction of travel. The main gaps are likely to be for marine, coastal and grassland habitats, invertebrates and some plants. Knowledge for Conservation Delivery Despite the gaps in monitoring data, Lead Partners reported that our knowledge on the biology of species and the management of the species and habitats has increased compared with 2002. The chart at Figure 3 shows that in 2008 they considered we had sufficient knowledge at least to make a positive impact on 90% of our priority habitats and 75% of our priority species. This compares with 70% for habitats and 68% for species in 2002.

14
A coordinated research project during 2008, funded by the GB conservation agencies, was carried out to determine the genetic diversity of different Freshwater Pearl mussel populations across Great Britain. This research will prove invaluable for evaluating future conservation management and re-introduction proposals. Initial findings have identified two distinct groupings showing a divergence between populations in Scotland and Northern England from those further south in Southern England and Wales. In Northern Ireland, a captive-breeding project that aims to secure Freshwater Pearl mussels for re-introduction to candidate rivers will, amongst other things, gather information on the taxonomic status of local stocks to ensure the genetic integrity Picture of Freshwater Pearl mussels by of re-stocked populations and thereby avoid Sue Scott, Scottish Natural Heritage © in-breeding; investigate the best re- introduction techniques and sites; and identify the points of a mussel’s lifecycle that would benefit most from conservation measures. Considerable work has gone into improving our knowledge on the status and conservation needs of the Water vole. The collation of widespread Water vole data records into a single database has given us the best ever picture of the range and density of water vole populations in the UK. This has highlighted where populations continue to be fragmented by infrastructure development and mink predation but also the beneficial impacts where these issues have been addressed.
Improving knowledge The Dark-bordered beauty is a rare moth found at three sites in Scotland and one site in England. Work co-ordinated by the UK Lead Partner has helped to improve knowledge of the species distribution (new satellite sites have been found) and improved regular monitoring has been initiated. In Scotland, adults have been found in habitat that has been created around existing populations. Knowledge of the species needs has improved but more information on its mobility is needed.
15
Figure 3. State of Knowledge for UK BAP species and Habitats 2002 and 2008
Measures to improve our knowledge In 2009, the Joint Nature Conservation Committee (JNCC) organised a workshop to review evidence gaps for the delivery of the UK Biodiversity Action Plan and to set priorities for further research and surveillance. The results from this workshop have been presented to the UK Biodiversity Research Advisory Group and a working group has been established, chaired by JNCC, to advise on how these priorities can be taken forward by the various UK research funding bodies. In addition, Defra is commissioning research to increase knowledge of status, taxonomy and autecology of less-well researched groups such as fungi, lower plants and invertebrates. In addition to direct funding from Government Agencies, Defra has pledged £1.17 million pounds over three years to review and develop Local Record Centre funding strategies and management arrangements in England, and to increase the geographic scope, quantity and quality of biological information available to the general public and key public sector users. Defra and the agencies also provide significant support for the National Biodiversity Network (NBN), which works to improve access to biodiversity information through the NBN-Gateway and related tools and services. In Wales, four Local Record Centres are now in operation covering the whole country.

16
Progress on targets for UK BAP species and habitats Targets were included in the 45 habitat and 391 species plans that were produced between 1995 and 1998. These targets were reported on in the 2005 report. In 2006, revised targets were produced for most of the species and habitats. As such, it is not easy to make direct comparisons with 2005 and it is still quite early to assess progress on the new targets. However some useful information is already available and the 2008 reporting round is the first opportunity to report on these new targets (for those without new targets the original targets were retained and were reported on).
The targets can usefully be divided into those that aim to maintain the population or range of a species, or the extent or condition of a habitat (maintenance targets); and those that aim to increase the population or range of a species, or to improve the condition or recreate habitats (enhancement targets). Simply, maintenance targets are about holding the line and enhancement targets are about improving things for biodiversity.
Maintenance targets • 52% of the 385 species maintenance targets were met, 17% were not achieved and progress on the remaining 31% was either not known or was not reported. • 26% of the 88 habitat maintenance targets were achieved, e.g. for reedbeds, limestone pavement and native pinewoods. However, 30% of the maintenance targets for habitats were not achieved and the status was unknown or not reported for the remaining 44%.
Picture of Native Pinewoods by Lorne Gill, Scottish Natural Heritage ©

17
Enhancement targets The majority (73%) of species enhancement targets were set in 2006. From the information available at this early stage, progress reported has been mixed on enhancement targets (Figure 4). There was no progress on 97 targets (30%) and a further 58 (18%) were ‘behind schedule’. However, delivery was on schedule for 46 targets (14%) and 50 (15%) of the targets were achieved or exceeded.
Figure 4. Progress on species enhancement targets 2008 (N=326)
Reported successes include: the Natterjack toad, Holly-leaved naiad, Black-veined moth and Woodlark, all of which have expanded their range above 2010 targets. For some species, such as the Large Blue butterfly, Ladybird spider and Corncrake, success is down to the implementation of species recovery action. For others, for example, Water vole and Southern damselfly, it has been attributed in part to new survey work revealing the extent of the populations.
The Large Blue butterfly is the largest and rarest of our blue butterflies. It is our only globally threatened butterfly and has always been rare in Britain but declined rapidly during the last century and became extinct in 1979. In 1984, a successful re-introduction programme started, which resulted in over 20 colonies being established in four landscapes by 2008. The total population is now estimated at over 40,000 adults, the largest in Western Europe. Environmental Stewardship schemes have contributed to several sites coming back
Picture of Large Blue butterfly, into favourable grazing management. Jeremy Thomas, Natural England ©
0
20
40
60
80
100
120
No dataentered
No progress Progressunknown
Someprogress (behind
schedule)
Someprogress
(on schedule)
Someprogress(ahead ofschedule)
Targetachieved
Targetexceeded
(due to newsurvey data)
Targetexceeded
(due to planaction)
Num
ber
of ta
rget
s
Progress on species enhancement targets 2008

18
There are 87 habitat targets covering 37 priority habitats aimed at achieving or improving habitat condition or restoring existing habitat (Figure 5).
Figure 5. Progress on condition and restoration targets for habitats (N = 87) Ninety-one percent of these targets were set in 2006. Some progress has been made on most of the habitats but delivery was reported as behind schedule for 39 targets (45%). For example, only 22km out of 534 km of SSSI quality chalk rivers were in favourable or recovering condition. However, progress was either on schedule, ahead of schedule or had been achieved for 19 targets (22%). This includes reported improvements in hedgerow management and restoration projects being initiated for limestone pavement sites.

19
There are 31 targets for 21 habitats aimed at expanding the area of habitat (Figure 6). All but one of these targets were set in 2006.
Figure 6. Progress on habitat expansion targets for habitats (N = 31) Eighteen of these targets (58%) were reported to be behind schedule with ‘no progress’ reported against habitat re-creation targets for saltmarsh and upland hay meadows. However, even where progress was behind schedule some important areas of semi-natural habitat have been created, for example, over 800 ha of reedbeds have been created against a target of 1700 ha by 2010. Reported progress is ahead of schedule or better for four targets (13%), for example over 15,500 ha of cultivated low input field margins have been created against a target of 16,300 ha.
It is recognised that progress on habitat expansion under the BAP has fallen below target levels. More progress has been achieved against targets such as those for field margins and native pinewoods that can be funded through forestry grant or agri-environment schemes. Picture of reedbeds by Lorne Gill, Scottish Natural Heritage ©
0
2
4
6
8
10
12
14
16
No dataentered
No progress Progressunknown
Someprogress(behind
schedule)
Someprogress (on
schedule)
Someprogress(ahead ofschedule)
Targetachieved
Targetexceeded
(due to newsurvey data)
Num
ber
of ta
rget
s
Progress on habitat expansion targets

20
Current and emerging threats to species and habitats
As in 2005, Lead Partners were asked in 2008 to list the issues that were currently posing, or likely to pose, a significant threat to the priority species and habitats over the next five years. Figures 7a and 7b show the 10 most significant threats reported for 2005 and 2008 for priority habitats and priority species.
Figure 7a. The ten most significant current and emerging threats for priority habitats (by proportion of habitats)

21
Figure 7b. The ten most significant current and emerging threats for priority species (by proportion of species) Key findings were: • The key threats reported in 2008 were broadly similar to those identified in 2005. • Habitat loss/degradation (particularly owing to agriculture, changes in management practice or infrastructure development) was recorded as continuing to be a significant threat for a high proportion of species and habitats. • Global warming was recorded as a threat for more habitats (mainly grasslands) in 2008 than in 2005; and invasive non-native species was recorded as the fourth highest threat for habitats. • Pollution was also identified as a continuing key threat, again particularly for habitats.

22
Picture of cereal field margins by Peter Wakely, Natural England © On infrastructure development, a new on-line portal was launched by the UK Green Building Council in March 2009 to provide guidance to the construction industry on how to take account of biodiversity when developing land with the objective of increasing the ecological value of a site. Research is underway to compile information about the colonisation and spread of non-native species, so that those posing an invasive threat can be intercepted, eradicated or controlled before they become widely established. An indicator using the 49 species with the greatest impact on native biodiversity has been developed and was announced in April 2009 as part of the set of UK biodiversity indicators which measure the state of the UK’s biodiversity. The extent to which these “most invasive” non-native species has been established has increased since 1960 in the freshwater, terrestrial and marine environment, increasing the likely pressure on native biodiversity. Research is also examining the observed changes in abundance and distribution of species and habitats to determine the degree to which changes can be attributed to climate change. The findings will help inform adaptation measures and provide an early warning of climate change impacts. For pollution, there is an ongoing programme of research examining the impacts of air pollution on sensitive habitats. The results of this programme feed into a UK indicator which is showing that progress is being made in the long term.
Examples of action underway to tackle threats or better understand how to tackle them Agri-environment schemes help address the threats from agriculture. Through these schemes advice and grants are provided to farmers to help them take actions to conserve biodiversity. These schemes have helped increase the area of cereal field margins in the UK from 29,675 hectares in 2005 to 105,217 hectares in 2008.

23
Constraints to delivering action plans Lead Partners and LBAP co-ordinators were asked to identify and rank the main constraints to delivering the targets contained in their respective action plans. Figures 8a and 8b show the proportion of species and habitats affected by the main constraints in the view of Lead Partners in 2008 and 2005. Figure 8c provides the responses from LBAP co-ordinators. Problems with funding and incentives, inadequate management approaches, an absence of adequate research, surveys or information and problems with policy, legislation or designation were the top four constraints identified by Lead Partners in delivering their plans for both species and habitats.
Figure 8a. Constraints to meeting action plan targets for habitats Specifically on habitat action plans, problems with lack of funding and incentives were reported as the constraint affecting delivery of most of these plans. This has overtaken problems with policy, legislation, legislation or designation, which had been identified as the main constraint in 2005.
0
10
20
30
40
50
60
70
80
Lack
of f
undi
ngor
ince
ntiv
es
Inad
equa
te
rese
arch
or
surv
eyin
form
atio
n
Prob
lem
s with
ac
tion
plan
pr
oces
s
Prob
lem
s with
po
licy,
legi
slat
ion
or d
esig
natio
n
Inad
equa
te
com
mun
icat
ion
Inad
equa
te
spec
ies o
rha
bita
t m
anag
emen
t
Prob
lem
s with
pa
rtne
rshi
p
Perc
etna
ge o
f pla
ns
Constraints to delivering habitat action plans 2005 & 2008 as seen by Lead Partners Habitat
2005 %
Habitat 2008 %

24
For species action plans, insufficient research, surveys or information were reported as the main constraint for them. This was the same situation in 2005. Problems over funding and incentives joined inadequate management approaches as the next most regularly occurring constraint to delivery identified by Lead Partners.
Figure 8b. Constraints to meeting action plan targets for species The LBAP coordinators identified lack of funding or incentives as their top constraint. The chart at 8c records that this constraint affects more plans than it did in 2005. However, it is not easy to make this direct comparison, as the number of LBAPs has changed since 2005. There are now 174 LBAPs compared with124 in 2005, although a report was not received for every plan. The top constraints identified by Lead Partners for habitat and species action plans are also the top two constraints identified by LBAP coordinators. Two companies – United Utilities and Northumbrian Water – also reported on the progress within their company BAPs.
0
10
20
30
40
50
60
70
80
Lack
of f
undi
ngor
ince
ntiv
es
Inad
equa
te
rese
arch
or
surv
eyin
form
atio
n
Prob
lem
s with
ac
tion
plan
pr
oces
s
Prob
lem
s with
po
licy,
le
gisl
atio
nor
des
igna
tion
Inad
equa
te
com
mun
icat
ion
Inad
equa
te
spec
ies o
rha
bita
t m
anag
emen
t
Prob
lem
s with
pa
rtne
rshi
p
Perc
etna
ge o
f pla
ns
Constraints to delivering species action plans 2005 & 2008 as seen by Lead Partners Species
2005 %
Species 2008 %

25
Figure 8c: Constraints on meeting Local Biodiversity Action Plans
0%
10%
20%
30%
40%
50%
60%
70%
80%
90%
100%
Lack
of f
undi
ng
or in
cent
ives
Inad
equa
te r
esea
rch
or su
rvey
info
rmat
ion
Prob
lem
s with
actio
n pl
an p
roce
ss
Prob
lem
s with
pol
icy,
legi
slat
ion
or
desi
gnat
ion
Inad
equa
teco
mm
unic
atio
n
Inad
equa
te s
peci
esor
hab
itat
man
agem
ent
Prob
lem
s with
part
ners
hip
Perc
enta
ge o
f pla
ns
Constraints to delivering LBAPs 2005 & 2008 as seen by LBAP coordinators 2005 data
2008 data
Constraints to delivering LBAPs 2005 & 2008

26
Solutions Lead Partners were asked to suggest possible solutions to the constraints they had identified. Figures 9a and 9b record the main categories of solutions suggested, and the proportion of species and habitats to which they applied. To allow a comparison with 2005, the corresponding details are also provided. This shows that enhanced funding or incentive schemes remain the solution likely to address the majority of constraints for both priority habitats and species. Increased survey and monitoring also feature as a solution that will benefit many species and habitats, although not to the same extent as in 2005.
Figure 9a: Types of solutions required to overcome constraints to meeting BAP habitats targets 2005 & 2008

27
Figure 9b. Types of solutions required to overcome constraints to meeting BAP species targets 2005 & 2008

28
Successes : A positive note to finish on Across the UK, action plans and the partnerships they have generated have been making a difference. In some cases, progress has been slow. In others, the ground work has been put in place for future recovery, or real tangible success has been achieved. All Lead Partners and LBAP co-ordinators were asked to list successes for their plans. Some 651 successes were reported by LBAPs and 896 successes were reported by Lead Partners. With so many, it is impossible to summarise them effectively but the examples below give some indication of the range of activity. • In Northern Ireland: Pollan, the only member of the whitefish family found in Ireland, was successfully bred in captivity for the first time over the winter of 2007/08. Up to 1,500 Pollan fry were hatched. This is the first step towards perfecting the hatchery techniques so that in time young fish can be produced for re-introduction into Lough Erne, where Pollan numbers are extremely low. A habitat improvement programme for the Marsh fritillary is being undertaken at five sites co-ordinated by the NI Marsh Fritillary Species Action Plan Steering Group. Agri-environment schemes (DARD) also appear to be having a positive impact on local populations, particularly in County Fermanagh. • In England: The 2015 target of 350 pairs of Stone-curlews was reached in 2008 – seven years ahead of schedule; Bittern numbers continue to increase; Great Water parsnip has been successfully re-introduced in Norfolk, Lincolnshire and Somerset; and the Ladybird spider, following a successful captive breeding programme, has been re-introduced into three Dorset sites, with heathland management resulting in significantly increased areas of potential habitat. On habitats, improved management of existing reedbed sites coupled with restoration has played a key part in the Bittern successes with 800 hectares being created.
The Bittern, a shy heron, was formerly extinct in Great Britain. 2008 was its best breeding season with 75 male Bitterns recorded in English reedbeds. This is a 75% increase on 2007 figures and 581% on those for 1997. Large–scale recreation and management of reedbeds has played a key part in these increases. The number of English counties hosting bitterns has also increased to 10 from 8 in 2007 and 4 in 1997. East Anglia
remains the stronghold, but they can now be found much further afield - in Somerset, Lancashire, East Yorkshire and Kent.
Picture by Michael Hammett, Natural England ©

29
• In Scotland: The Corncrake, Otter, Dark Bordered beauty and Vendace continue to show increases in their numbers. The Reed bunting and Marsh fritillary are examples of species that have started to increase with the Northern Colletes bee, Linnet and Lunar Yellow underwing being examples of species with populations that were declining but are now stable. The Chequered skipper, lowland raised bog (see below) and blanket bog are examples where the rate of loss is slowing. Funding support from Scottish Natural Heritage’s (SNH) Species Action Framework has helped many of the species listed here. The rate of loss of lowland raised bog has slowed thanks to a number of measures. Several best-practice leaflets and action days have been provided for land managers to help improve their management skills and techniques. This has also provided opportunities to raise awareness and understanding of lowland raised bogs and their requirements in Scotland. Scottish Natural Heritage’s “Natural Care Bogs” scheme has also been very successful in securing farmers’ engagement in positive management agreements. The changes in stock regimes, damming of drainage channels and tree removal that has ensued has enabled restoration of significant areas of this habitat. It is estimated that over 1800 ha are in active management in the South Scotland Bog Scheme and the Grampian Bogs scheme. • In Wales: the Sand lizard numbers have increased as a result of successful re-introduction programmes at sites where it was previously extinct. The Lesser-horseshoe bat is the subject of a landscape-scale project in Wales aimed at creating roost sites, flight lines and foraging sites. There has been a 41% increase in counts of this bat at colonies since 1999. Improvements in survey work have revealed more sites of the Deptford pink and Petalwort. Cereal-field margins are also increasing because of agri-environment schemes. The Gwynedd Local Biodiversity Action Plan (Natur Gwynedd) is proving very successful. It has funded 92 local projects in north-west Wales, bringing 234 hectares of habitats under sustainable management, protecting and restoring 35km of stonewall and hedgerow boundaries and holding workshops. More details can be found at http://www.gwynedd.gov.uk/gwy_doc.asp?doc=9532&cat=3421&Language=1 In several areas of England, Scotland and Wales, the Water vole is benefitting from targeted
habitat management, creation or enhancement and mink control. Picture of Water vole by Hugh Clark, Environment Agency ©

30
Photo credits
Page 8 Silver-spotted skipper butterfly - Michael Hammett, NE
Page 10 Limestone pavement - Lorne Gill, SNH
Page 11 Aspen hoverfly - Iain MacGowan, SNH
Page 12 Mudflats - Peter Wakely, NE
Page 14 Freshwater Pearl mussels - Sue Scott, SNH
Page 16 Native pinewood - Lorne Gill, SNH
Page 17 Large Blue butterfly - Jeremy Thomas, NE
Page 19 Reedbeds - Lorne Gill, SNH
Page 22 Cereal field margins - Peter Wakely, NE
Page 28 Bittern - Michael Hammett, NE
Page 29 Water vole - Hugh Clark, EA
Case Study Credits
Page 14 Dark Boarder Beauty moth - Natural England
Page 14 Freshwater Pearl mussel - Natural England
Page 14 Freshwater Pearl mussel - NI Environment Agency
Page 14 Water vole - Environment Agency
Page 17 Large Blue butterfly - Butterfly Conservation
Page 28 Bittern - Natural England
Page 29 Lowland Raised Bog - Scottish Natural Heritage

31