The UCLA Medical Center: Kidney...
28
9-711-410 REV: MARCH 16, 2012 ________________________________________________________________________________________________________________ Professor Michael E. Porter, Senior Researcher Jennifer F. Baron, Jacob M. Chacko (MBA 2008), and Robin Tang (MBA 2010) prepared this case with the assistance of Research Fellow Sachin H. Jain and Vivek Garg (MBA 2009). HBS cases are developed solely as the basis for class discussion. Cases are not intended to serve as endorsements, sources of primary data, or illustrations of effective or ineffective management. Copyright © 2010, 2012 President and Fellows of Harvard College. To order copies or request permission to reproduce materials, call 1-800-545- 7685, write Harvard Business School Publishing, Boston, MA 02163, or go to www.hbsp.harvard.edu/educators. This publication may not be digitized, photocopied, or otherwise reproduced, posted, or transmitted, without the permission of Harvard Business School. MICHAEL E. PORTER JENNIFER F. BARON JACOB M. CHACKO ROBIN TANG The UCLA Medical Center: Kidney Transplantation Amir Dan Rubin, Chief Operating Officer of the UCLA Hospital System, and Dr. J. Thomas Rosenthal, Chief Medical Officer, were considering the future of UCLA’s Kidney Transplant Program in 2010. UCLA had been among the first US providers to perform kidney transplants, and performed more solid-organ transplants (kidney, kidney/pancreas, heart, liver, lung, heart/lung and intestine) annually than any other US provider in 2010. Its team-based delivery approach in kidney transplantation had produced superior clinical outcomes over two decades. UCLA had entered into an innovative bundled pricing arrangement in the mid-1980s under which payers issued a single packaged price for most services involved in kidney transplantation. Rubin and Rosenthal were considering how to improve the reimbursement approach going forward, and ways to continue improving the kidney care delivery model even further. The UCLA Health System Founded in 1955, the UCLA Health System had a tripartite mission of providing high-quality patient care, teaching medical students and residents, and conducting world-class medical research. The System generated approximately $1.5 billion in net revenues and $100 million in net earnings in 2009, with about 71% of revenues coming from inpatient services. In 2009, U.S. News & World Report ranked UCLA Medical Center, UCLA’s flagship hospital, as one of the top three hospitals in the nation, and in the top 20 for 15 of the 16 medical specialties included in the survey. 1 The UCLA Health System consisted of two major campuses, in Westwood and Santa Monica, which together served over one million patients annually. Tertiary and intensive care services were concentrated on the Westwood campus. The new 600-bed Ronald Reagan UCLA Medical Center, opened in 2008, combined the main hospital, the Resnick Neuropsychiatric Hospital and the Mattel Children’s Hospital UCLA under one roof. 2 The 271-bed Santa Monica campus, located four miles away, housed UCLA’s orthopedics program, geriatrics, solid tumor oncology, general medicine, and some pediatric and obstetrics services. Outpatient care was delivered at the Medical Plaza facilities on the Westwood campus, and through a network of 12 primary care and specialty care offices located in communities throughout the western Los Angeles region.
Transcript of The UCLA Medical Center: Kidney...

9-711-410
R E V : M A R C H 1 6 , 2 0 1 2
________________________________________________________________________________________________________________
Professor Michael E. Porter, Senior Researcher Jennifer F. Baron, Jacob M. Chacko (MBA 2008), and Robin Tang (MBA 2010) prepared this case with the assistance of Research Fellow Sachin H. Jain and Vivek Garg (MBA 2009). HBS cases are developed solely as the basis for class discussion. Cases are not intended to serve as endorsements, sources of primary data, or illustrations of effective or ineffective management. Copyright © 2010, 2012 President and Fellows of Harvard College. To order copies or request permission to reproduce materials, call 1-800-545-7685, write Harvard Business School Publishing, Boston, MA 02163, or go to www.hbsp.harvard.edu/educators. This publication may not be digitized, photocopied, or otherwise reproduced, posted, or transmitted, without the permission of Harvard Business School.
M I C H A E L E . P O R T E R
J E N N I F E R F . B A R O N
J A C O B M . C H A C K O
R O B I N T A N G
The UCLA Medical Center: Kidney Transplantation
Amir Dan Rubin, Chief Operating Officer of the UCLA Hospital System, and Dr. J. Thomas Rosenthal, Chief Medical Officer, were considering the future of UCLA’s Kidney Transplant Program in 2010. UCLA had been among the first US providers to perform kidney transplants, and performed more solid-organ transplants (kidney, kidney/pancreas, heart, liver, lung, heart/lung and intestine) annually than any other US provider in 2010. Its team-based delivery approach in kidney transplantation had produced superior clinical outcomes over two decades.
UCLA had entered into an innovative bundled pricing arrangement in the mid-1980s under which payers issued a single packaged price for most services involved in kidney transplantation. Rubin and Rosenthal were considering how to improve the reimbursement approach going forward, and ways to continue improving the kidney care delivery model even further.
The UCLA Health System
Founded in 1955, the UCLA Health System had a tripartite mission of providing high-quality patient care, teaching medical students and residents, and conducting world-class medical research. The System generated approximately $1.5 billion in net revenues and $100 million in net earnings in 2009, with about 71% of revenues coming from inpatient services. In 2009, U.S. News & World Report ranked UCLA Medical Center, UCLA’s flagship hospital, as one of the top three hospitals in the nation, and in the top 20 for 15 of the 16 medical specialties included in the survey.1
The UCLA Health System consisted of two major campuses, in Westwood and Santa Monica, which together served over one million patients annually. Tertiary and intensive care services were concentrated on the Westwood campus. The new 600-bed Ronald Reagan UCLA Medical Center, opened in 2008, combined the main hospital, the Resnick Neuropsychiatric Hospital and the Mattel Children’s Hospital UCLA under one roof.2 The 271-bed Santa Monica campus, located four miles away, housed UCLA’s orthopedics program, geriatrics, solid tumor oncology, general medicine, and some pediatric and obstetrics services. Outpatient care was delivered at the Medical Plaza facilities on the Westwood campus, and through a network of 12 primary care and specialty care offices located in communities throughout the western Los Angeles region.

711-410 The UCLA Medical Center: Kidney Transplantation
2
Most of UCLA’s patients were California residents. Nearly 45% of the patients seen at UCLA Medical Center lived within 10 miles of the facility, another 45% in the five surrounding counties, 8% lived elsewhere in the US, and 2% international.
The Regents of the University of California acted as the UCLA Health System’s Board of Directors. The Vice-Chancellor of UCLA for Medical Sciences, who also served as Dean of the Medical School, oversaw the Health System. As long as the System was financially self-sufficient, it enjoyed considerable autonomy. Capital needs were met primarily through debt financing and philanthropic fundraising, with a smaller amount provided by retained earnings.
The Health System had nearly 2,400 physicians, including about 1,800 at the Westwood campus and 600 at Santa Monica. About 70% of UCLA physicians belonged to the UCLA Medical Group, owned and operated by UCLA, that provided physician contracting and billing services for a small fee charged to physicians’ departments. The Medical Group worked with the hospital’s contracting department to negotiate with payers as one entity for hospital and professional services. Most members of the Medical Group were full-time faculty and employees of the University of California.
The medical staff at UCLA were organized into 22 clinical departments that corresponded to departments at the School of Medicine. Departments were divided by major medical specialties, and further delineated into divisions. The Departments of Medicine and Surgery were the largest, each with more than 10 specialty divisions. Departments spanned the entire Health System, meaning there was one Department of Medicine, Surgery, etc. common to all provider sites. Most departments placed sub-heads at each UCLA hospital or location where they had a major care delivery presence. Organization of care delivery tended to follow traditional departments and divisions, and inpatient and outpatient care for most conditions was delivered in separate locations. However, some service lines had developed overlaying clinical structures to better integrate care. For example, Neurology and Neurosurgery shared an outpatient care facility and had also co-located their inpatient services.
Although the Medical Group handled billing and administration, the department was the unit of profit and loss. Decisions about hiring, promotion, and compensation were made largely at the department and division level, although the Dean had final approval. Each department and division developed its own compensation mechanism, but compensation typically had a fixed and variable component comprising varying weightings for research, teaching, and clinical activities.
The Health System utilized an internally developed electronic medical record (EMR) that included physician and nursing notes, peri-operative documentation, laboratory results, and online imaging. In 2010, the system had yet to completely integrate ambulatory records and provider order entry, and UCLA was in the process of selecting and transitioning to a commercial EMR system. Most referring physicians outside of the Health System did not have access to UCLA’s EMR, but could receive permission to view portions of their patients’ records through a web-based interface.
Payers
The proportion of uninsured in California was 18.5%, versus 15.4% in the United States. In the greater Los Angeles area, approximately 30% of residents were uninsured. Another 20% to 25% of the Los Angeles area population was covered by Medi-Cal, the California Medicaid program for lower-income residents. UCLA derived roughly 55% of its revenue from private payer contracts, through a mixture of case rates and per diems. The balance came 25% from Medicare, 15% from Medi-Cal, and 5% from self-pay patients. UCLA’s uncompensated care totaled approximately 3% of revenues.
The UCLA Medical Center: Kidney Transplantation 711-410
3
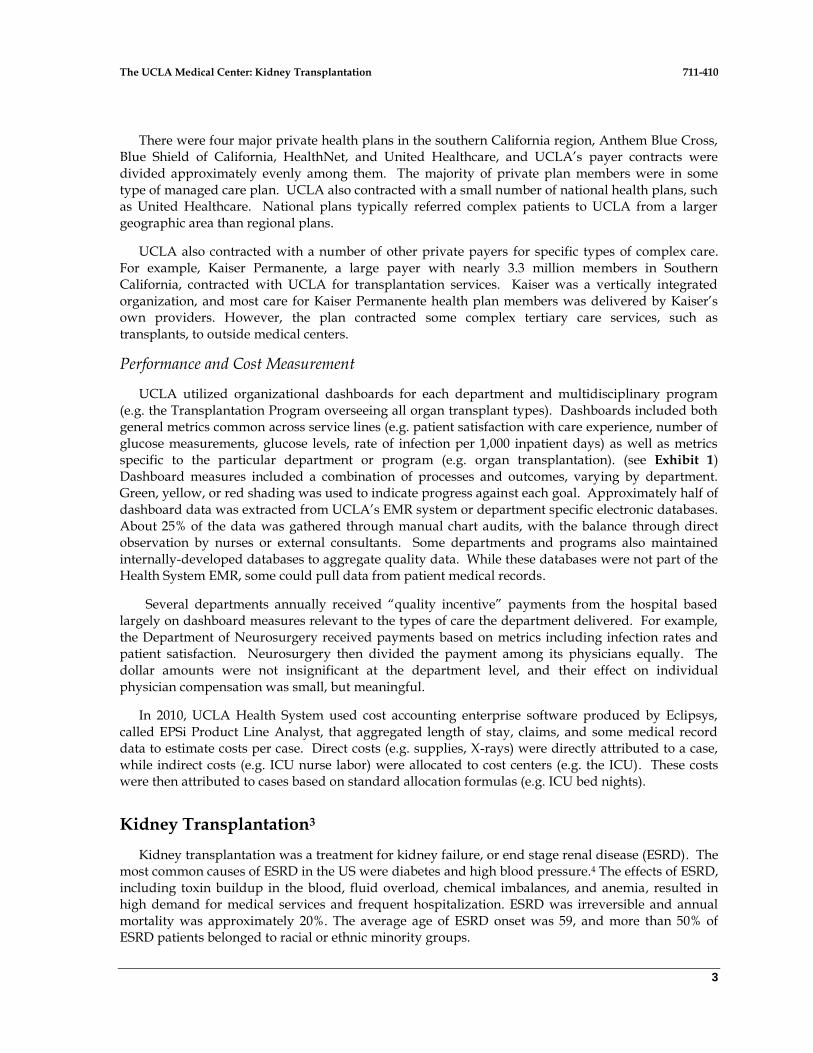
There were four major private health plans in the southern California region, Anthem Blue Cross, Blue Shield of California, HealthNet, and United Healthcare, and UCLA’s payer contracts were divided approximately evenly among them. The majority of private plan members were in some type of managed care plan. UCLA also contracted with a small number of national health plans, such as United Healthcare. National plans typically referred complex patients to UCLA from a larger geographic area than regional plans.
UCLA also contracted with a number of other private payers for specific types of complex care. For example, Kaiser Permanente, a large payer with nearly 3.3 million members in Southern California, contracted with UCLA for transplantation services. Kaiser was a vertically integrated organization, and most care for Kaiser Permanente health plan members was delivered by Kaiser’s own providers. However, the plan contracted some complex tertiary care services, such as transplants, to outside medical centers.
Performance and Cost Measurement
UCLA utilized organizational dashboards for each department and multidisciplinary program (e.g. the Transplantation Program overseeing all organ transplant types). Dashboards included both general metrics common across service lines (e.g. patient satisfaction with care experience, number of glucose measurements, glucose levels, rate of infection per 1,000 inpatient days) as well as metrics specific to the particular department or program (e.g. organ transplantation). (see Exhibit 1) Dashboard measures included a combination of processes and outcomes, varying by department. Green, yellow, or red shading was used to indicate progress against each goal. Approximately half of dashboard data was extracted from UCLA’s EMR system or department specific electronic databases. About 25% of the data was gathered through manual chart audits, with the balance through direct observation by nurses or external consultants. Some departments and programs also maintained internally-developed databases to aggregate quality data. While these databases were not part of the Health System EMR, some could pull data from patient medical records.
Several departments annually received “quality incentive” payments from the hospital based largely on dashboard measures relevant to the types of care the department delivered. For example, the Department of Neurosurgery received payments based on metrics including infection rates and patient satisfaction. Neurosurgery then divided the payment among its physicians equally. The dollar amounts were not insignificant at the department level, and their effect on individual physician compensation was small, but meaningful.
In 2010, UCLA Health System used cost accounting enterprise software produced by Eclipsys, called EPSi Product Line Analyst, that aggregated length of stay, claims, and some medical record data to estimate costs per case. Direct costs (e.g. supplies, X-rays) were directly attributed to a case, while indirect costs (e.g. ICU nurse labor) were allocated to cost centers (e.g. the ICU). These costs were then attributed to cases based on standard allocation formulas (e.g. ICU bed nights).
Kidney Transplantation3
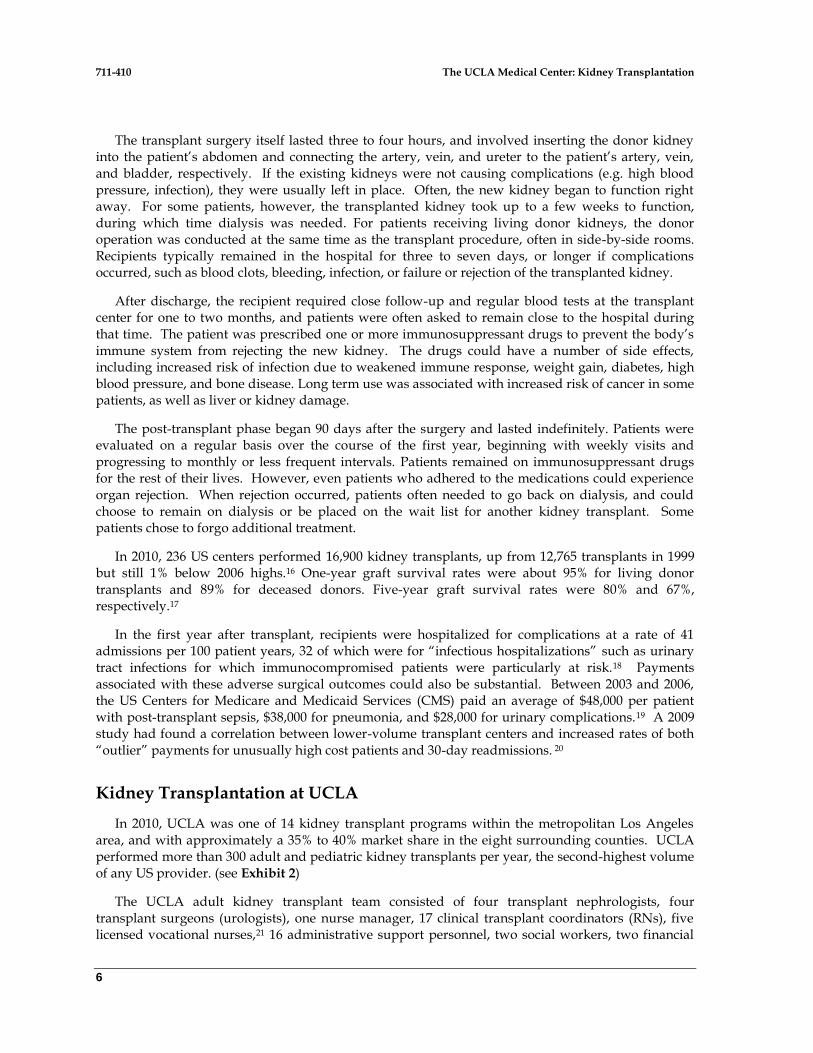
Kidney transplantation was a treatment for kidney failure, or end stage renal disease (ESRD). The most common causes of ESRD in the US were diabetes and high blood pressure.4 The effects of ESRD, including toxin buildup in the blood, fluid overload, chemical imbalances, and anemia, resulted in high demand for medical services and frequent hospitalization. ESRD was irreversible and annual mortality was approximately 20%. The average age of ESRD onset was 59, and more than 50% of ESRD patients belonged to racial or ethnic minority groups.

711-410 The UCLA Medical Center: Kidney Transplantation
4
Due to the complexity of their conditions, most ESRD patients were actively managed by a nephrologist, a physician specializing in kidney diseases. There were two treatment options for ESRD: dialysis or kidney transplantation. Dialysis was the most common treatment, and involved filtering a patient’s blood to remove wastes and excess fluid. Of the more than 500,000 patients living with ESRD in the US, approximately 70% were on dialysis while 30% lived with a transplanted kidney. On an annual basis, of more than 100,000 newly diagnosed ESRD patients each year, nearly 98% started dialysis while 2% underwent a kidney transplant.
Since 1972, when the federal government had classified ESRD as a chronic disability, ESRD patients had been eligible for Medicare coverage for dialysis and kidney transplantation regardless of age, subject to certain conditions.5 In 2009, ESRD patients comprised 1.3% of Medicare beneficiaries but over 8% of spending at $29 billion.6 Spending on kidney transplantation was $2.4 billion. A 1998 study estimated that transplantation was more cost effective than providing dialysis after 2.7 years, with the break-even point falling to 1.7 years for patients not readmitted to the hospital during the first year after transplantation.7
History of Kidney Transplantation
Kidney transplantation involved surgically replacing a patient’s non-functioning kidneys with a donated kidney from a living or cadaveric donor. One donated kidney could take over for two failed kidneys, making living donation possible. In 2001, the number of living organ donors across all transplant types had exceeded the number of deceased organ donors for the first time. Amid rising demand, use of organs donated after cardiac death was also increasing, although these organs were often damaged due to lack of oxygen which could lead to inferior outcomes.
In 1954, Drs. Joseph Murray and David Hume performed the first successful kidney transplant at the Peter Bent Brigham Hospital in Boston. The living donor and recipient were identical twins. No adverse immune response occurred because the donor and recipient had identical blood and tissue types. In the early 1960s, powerful immunosuppressive drugs became available, enabling kidney transplantation among individuals who were not genetically identical.8 Better techniques for matching donor and recipient blood and tissue types, as well as improvements in preserving kidneys from recently deceased donors, were also developed in the 1960s. The immunosuppressive drug cyclosporine was discovered around 1970 and was routinely used in transplantation by 1980, raising one-year graft (i.e. organ) survival rates from approximately 50% to 85%.
In 1984, amid concerns about the rise of buying and selling of organs and inequitable distribution, Congress passed the National Organ Transplant Act prohibiting the sale of organs for transplantation. The legislation called for a national Organ Procurement and Transplantation Network (OPTN) to develop equitable policies for organ distribution and serve as a national system for allocating organs.9 All five subsequent contracts to administer the OPTN had been awarded to the non-profit United Network for Organ Sharing (UNOS). UNOS maintained a national registry of potential organ recipients and allocated organs based on a combination of patient need and tenure on the waiting list. Regional organ procurement organizations (OPOs), federally designated nonprofits independent from UNOS, facilitated the logistics of organ and tissue recovery throughout the US.10
The National Organ Transplant Act required each transplant center, OPO, and tissue typing lab to collect and report data on donors, recipients, and waiting lists, including transplant outcomes. Data was reported to, analyzed, and publicly reported by the Scientific Registry of Transplant Recipients (SRTR), founded in 1987 to support ongoing evaluation of the scientific and clinical status of organ transplantation.11 SRTR was funded and overseen by a division of the US Department of Health and Human Services. Database administration was initially handled by UNOS, but later contracted to the

The UCLA Medical Center: Kidney Transplantation 711-410
5
Arbor Research Collaborative, a Michigan nonprofit with expertise in biostatistics which subcontracted some statistical analysis to a multidisciplinary University of Michigan team.
In 1991 UNOS published its first report featuring center-specific transplant survival rates for all solid organ transplants. Many providers, particularly those serving especially complex patients, were concerned about biases due to patient mix. According to a UNOS official:
We addressed this concern in two ways. First, we risk-adjusted the outcomes by calculating statistical weights for a variety of donor and recipient factors known to affect post-transplant survival. Then we used those weights for the specific donors and patients at each center to calculate an “expected” survival rate. This was reported along with the actual rate in every instance, and the report stated whether the actual rate was statistically higher, lower, or not statistically different. Second, we allowed each transplant program to preview its results and, if desired, to supply a brief narrative that UNOS did not edit. This allowed programs that disagreed with the report’s findings to provide other data or note factors they believe affected their results. For instance, some may have changed key staff members [while] others shared more recent statistics not incorporated in the reporting period.
Kidney Transplantation in 201012
There were nearly 55 kidney transplants per one million population in the US in 2009, up from 46 in 1998.13 The demand for transplantable organs far outweighed the supply, and most ESRD patients were placed on a waiting list. In recent years, a new and expensive therapy known as intravenous gammaglobulin (IVIG) had further expanded transplant eligibility to nearly 30% of transplant candidates with high levels of antibodies that would attack the foreign organ.14 By lowering the level of these antibodies, IVIG allowed these previously “untransplantable” patients to achieve nearly the same survival rates as conventional transplant recipients.15
The process of kidney transplantation could be divided into pre-transplant, transplant, and post-transplant phases. The pre-transplant phase lasted from the time of initial evaluation for transplant eligibility until the day of surgery. The patient was evaluated by both medical and surgical teams at the transplant center to determine suitability and to address any health problems that could increase the risk of surgical mortality, such as respiratory difficulties and bleeding disorders. The evaluation process could require multiple visits over several weeks or months. Patients and their families were also assessed for psychological, social, and financial preparedness because the transplantation process lasted for several years and could represent a significant financial and emotional burden.
The transplant phase was generally defined as lasting from the day of the transplant until 90 days post-operatively, the time during which the chance of organ rejection was highest. Patients receiving kidneys from living donors could schedule their transplant procedures in advance. For patients awaiting an organ from a deceased donor, the transplant phase began with the availability of a kidney. When a hospital identified a potential deceased organ donor, a procurement coordinator from the local OPO offered the next-of-kin the option of organ donation. If the family agreed, the OPO coordinator contacted the national computerized UNOS registry in order to match medically and physically the organ donor with a waiting transplant recipient, preferably at a hospital in the same region in order to minimize organ transport time. When a suitable recipient was found, the transplant surgeon at the recipient hospital was asked to accept the kidney, and the OPO coordinator scheduled an operating room for its recovery. The OPO coordinator notified the recipient, worked with the donor hospital to ensure that facilities and staff were available for the surgery, and coordinated an organ procurement team to transport the harvested kidney.
711-410 The UCLA Medical Center: Kidney Transplantation
6
The transplant surgery itself lasted three to four hours, and involved inserting the donor kidney into the patient’s abdomen and connecting the artery, vein, and ureter to the patient’s artery, vein, and bladder, respectively. If the existing kidneys were not causing complications (e.g. high blood pressure, infection), they were usually left in place. Often, the new kidney began to function right away. For some patients, however, the transplanted kidney took up to a few weeks to function, during which time dialysis was needed. For patients receiving living donor kidneys, the donor operation was conducted at the same time as the transplant procedure, often in side-by-side rooms. Recipients typically remained in the hospital for three to seven days, or longer if complications occurred, such as blood clots, bleeding, infection, or failure or rejection of the transplanted kidney.
After discharge, the recipient required close follow-up and regular blood tests at the transplant center for one to two months, and patients were often asked to remain close to the hospital during that time. The patient was prescribed one or more immunosuppressant drugs to prevent the body’s immune system from rejecting the new kidney. The drugs could have a number of side effects, including increased risk of infection due to weakened immune response, weight gain, diabetes, high blood pressure, and bone disease. Long term use was associated with increased risk of cancer in some patients, as well as liver or kidney damage.
The post-transplant phase began 90 days after the surgery and lasted indefinitely. Patients were evaluated on a regular basis over the course of the first year, beginning with weekly visits and progressing to monthly or less frequent intervals. Patients remained on immunosuppressant drugs for the rest of their lives. However, even patients who adhered to the medications could experience organ rejection. When rejection occurred, patients often needed to go back on dialysis, and could choose to remain on dialysis or be placed on the wait list for another kidney transplant. Some patients chose to forgo additional treatment.
In 2010, 236 US centers performed 16,900 kidney transplants, up from 12,765 transplants in 1999 but still 1% below 2006 highs.16 One-year graft survival rates were about 95% for living donor transplants and 89% for deceased donors. Five-year graft survival rates were 80% and 67%, respectively.17
In the first year after transplant, recipients were hospitalized for complications at a rate of 41 admissions per 100 patient years, 32 of which were for “infectious hospitalizations” such as urinary tract infections for which immunocompromised patients were particularly at risk.18 Payments associated with these adverse surgical outcomes could also be substantial. Between 2003 and 2006, the US Centers for Medicare and Medicaid Services (CMS) paid an average of $48,000 per patient with post-transplant sepsis, $38,000 for pneumonia, and $28,000 for urinary complications.19 A 2009 study had found a correlation between lower-volume transplant centers and increased rates of both “outlier” payments for unusually high cost patients and 30-day readmissions. 20
Kidney Transplantation at UCLA
In 2010, UCLA was one of 14 kidney transplant programs within the metropolitan Los Angeles area, and with approximately a 35% to 40% market share in the eight surrounding counties. UCLA performed more than 300 adult and pediatric kidney transplants per year, the second-highest volume of any US provider. (see Exhibit 2)
The UCLA adult kidney transplant team consisted of four transplant nephrologists, four transplant surgeons (urologists), one nurse manager, 17 clinical transplant coordinators (RNs), five licensed vocational nurses,21 16 administrative support personnel, two social workers, two financial

The UCLA Medical Center: Kidney Transplantation 711-410
7
counselors, one dietician, and one pharmacist. There were also four pediatric transplant nephrologists affiliated with the group.
The team’s nephrologists belonged to the Department of Medicine and its urologists to the Department of Urology. All core kidney team physicians spent more than 90% of their time caring for kidney transplant patients. Anesthesiologists and other physicians frequently involved in kidney transplant care, including cardiologists, psychiatrists, pulmonologists, hepatologists, gastroenterologists, interventional radiologists, and infectious disease specialists who treated common comorbidities or complications, were not formally part of the kidney team. However, the kidney team consistently called on the same one to four physicians from each of these divisions, who also saw non-kidney patients.
The non-physician members of the kidney team reported to the Kidney Transplant Program within the Office of Transplant Services (OTS), and were dedicated exclusively to kidney transplant patients. (see Exhibit 3) The UCLA Office of Transplant Services had been established in the 1990s to centralize certain functions for all transplant services, including patient financial screening, administration of nursing coordinators, data collection, interaction with UNOS, and process improvement. OTS also was responsible for strategic and space planning, coordinating the purchasing of capital equipment, and providing information on UCLA’s transplant services to referring physicians.
OTS was run by Administrative Director of Transplant Services Nanci Flores, and consisted of three nurse managers, over 50 transplant coordinators, and various staff members in finance, accounting, information technology, and human resources roles. OTS had introduced some areas for collaboration among UCLA’s transplant programs, such as a shared night call system for receiving organs, and organized shared tissue typing labs. OTS also coordinated the sharing of specialists among the transplant Programs. For example, if a liver transplant patient required a nephrology consultation, all efforts would be made for that patient to see a transplant nephrologist rather than a general nephrologist.
Funding for OTS and for each individual Transplant Program came directly from the hospital. OTS oversaw four transplant programs, most of which combined a larger transplant service line with a small, related one. For example, the high-volume Kidney Program was combined with the very low-volume Pancreas Program which conducted around 10 procedures per year. These transplants were closely related clinically, as dual kidney-pancreas transplants were conducted on patients with kidney failure due to diabetes.
Each of the 17 kidney transplant coordinators worked on one phase of the kidney transplant care cycle: pre-listing, pre-transplant for patients on the wait list, inpatient admission, or post-transplant. Historically, each coordinator had followed a patient through the entire transplant process, but the model had proved inefficient. Flores recalled, “The expertise a coordinator needs to care for patients during each transplant phase is very specialized and we didn’t want to dilute it, especially with such complex patients. Yet it is very important to achieve continuity across the care cycle, and we carefully manage coordinator transitions according to detailed protocols.”
Inpatient and outpatient care for kidney transplant patients were located separately on the Westwood campus, with most kidney team members seeing patients in both settings. Inpatient care was delivered in operating rooms and inpatient wards in the UCLA Medical Center building. Outpatient care was delivered at “Medical Specialties C,” a facility with eight exam rooms on the third floor of Medical Plaza At least 80% of outpatient sessions (“clinics”) held in the Medical Specialties C space involved kidney transplantation, and clinics corresponded with portions of the

711-410 The UCLA Medical Center: Kidney Transplantation
8
kidney transplant care cycle. Clinics were staffed by kidney team nephrologists and nephrology fellows (post-residency physicians in training to be nephrologists) on a rotating basis. Kidney transplant social workers and transplant coordinators for the pre- and post-transplant phases met their patients at the outpatient clinics. The Medical Specialties C facility also had its own nursing and administrative staff who were based full-time at Med Plaza and were not part of the kidney team.
The Kidney Transplant Care Cycle at UCLA
Most of UCLA’s kidney transplant patients were referred by community nephrologists unaffiliated with UCLA. The core group of four adult transplant nephrologists jointly managed each patient throughout the care cycle to ensure that the patient felt comfortable with the entire team. Patients were not assigned to particular physicians, as nephrologists’ schedules were subject to constant change.
Upon referral to UCLA, each new patient was asked to attend a small group education session and evaluation appointment, held on the same day whenever possible. The education session was led by a nurse transplant coordinator and social worker for a group of 10 to 12 potential kidney transplant patients. The 60- to 90-minute sessions were held weekly at Med Plaza, and included information about the evaluation and transplantation process, patient and provider roles, and expected waiting times. Patients’ families and living kidney donors were also encouraged to attend.
Immediately after the group education session, the patient attended an evaluation appointment in the same Med Plaza building to determine transplant eligibility. Patients were encouraged to invite their families and living donors to join them. Both the education and evaluation were scheduled by kidney team administrative staff whose time was dedicated largely to arranging these appointments as well as any specialty consultations. Kidney team clinicians and specialists blocked time on their calendars following the weekly group education sessions to ensure that all initial consultations occurred on the same day whenever possible. Administrative staff also sent the schedule for the day and any other relevant information to patients in advance.
The medical evaluation was performed by a kidney team nephrologist, sometimes assisted by a nephrology fellow. About half of patients, including those with more complex conditions and all living donor cases, met with the nephrologist and a transplant surgeon simultaneously. Other patients met with the surgeon closer to the time of surgery. During the same appointment, patients were seen by a kidney team social worker who assessed their emotional well-being and transportation and housing circumstances. A kidney team financial counselor was consulted if the patient’s ability to pay for care was in question. The patient was also assigned to one of the kidney team’s pre-transplant phase coordinators. The coordinator would serve as the patient’s principal point of contact during this period, educating the patient about the transplant process, and facilitating communication between the patient’s referring physician and the UCLA kidney transplant team. When needed, radiology and laboratory testing as well as specialty consultations also occurred at Med Plaza.
After the initial evaluation, each patient’s case was presented at the weekly meeting of the UCLA Kidney Transplant Selection Committee. At least one kidney team nephrologist and urologist attended every Committee meeting, as well as the coordinators whose patients were being presented. Other specialist physicians caring for the patients under review were included as well, such as psychiatrists, anesthesiologists, and cardiologists.
The Committee placed each patient on one of four paths. The first category was listed as “active” on the waiting list. The second category were those not found to be transplant candidates due to

The UCLA Medical Center: Kidney Transplantation 711-410
9
factors like non-compliance with medications, impaired cognitive ability, limited physical mobility, or significant co-morbidities. A third group needed to undergo further testing, such as cancer survivors who required imaging to verify that the malignancy had been eliminated. The fourth group was placed on the waiting list as “inactive,” most often due to a previous malignancy requiring evidence of five-year disease free survival. Overall, roughly 75% of patients were deemed suitable candidates at some point in the evaluation process.
If the patient required a deceased donor organ, the waiting process would begin. In Los Angeles, average wait times for a deceased donor kidney ranged from five years for blood type A to seven years for type O. While on the wait list, most patients continued to receive regular care from their referring physicians, although UCLA required patients with complex cardiac or liver disease to also be seen by UCLA specialists. At least once every year or two, patients were seen at a UCLA outpatient “Active Clinic” at Med Plaza to reevaluate transplant suitability. Nurse coordinators rotated responsibility for 24-hour on-call shifts, during which they addressed inquiries regarding possible kidney donors, questions from patients, and physician referrals. Patients and their referring physicians were responsible for notifying UCLA of any hospitalizations, surgeries, tests, blood transfusions, or changes in contact information that occurred while awaiting a kidney.
Once a deceased donor kidney became available, the transplant nephrologist reviewed the patient’s current clinical information and would occasionally also consult the transplant surgeon. At many other transplant centers, the surgeon alone reviewed this information. UCLA kept blood samples for each wait listed patient on hand to test for organ compatibility when a potential donor kidney became available. If the kidney was a good match, the on-call donor team, shared by all UCLA transplant programs, would harvest and transport the kidney to UCLA. The on-call nurse coordinator handled the logistics. The patient had one hour to respond to initial contact regarding an available organ, plus additional time to arrive at UCLA. If the patient did not respond within one hour, the kidney was offered to someone else.
Patients with living organ donors could be evaluated and transplanted as soon as the organ became available. As living donor procedures could be planned in advance, two adjacent operating rooms were blocked only for living donor and recipient kidney transplant surgeries on Tuesday and Wednesdays. With minimally invasive removal of the donor’s kidney through a procedure called laproscopic donor nephrectomy, UCLA had reduced the donor’s hospital stay to one day. Deceased donor kidney transplants were typically performed in the same operating rooms as living donor kidney transplants but could be conducted in any of the Medical Center’s 23 operating rooms, as the procedures did not require any specialized equipment or adjacent room availability. The operating room nurses and other staff assisting a living or deceased donor transplant were assembled based on availability. They belonged to a general pool cross-trained in a number of relatively common surgeries, including kidney transplantation. For both living and deceased donor transplants, urologists conducted the transplant surgeries. At many lower-volume centers, the procedures were performed by general surgeons.
After surgery, patients were admitted to the “eight west” inpatient ward used for all types of post-surgical transplant patients and staffed by nurses with expertise in various forms of transplantation. Patients were jointly managed by the transplant nephrologist and the urologist, who together conducted daily rounds with a pharmacist, transplant coordinator, and social worker from the kidney team. The transplant coordinator for the inpatient admission phase delivered patient education in the hospital and worked with the social worker to manage discharge planning, which began at the time of admission to ensure that the patient had made arrangements for care at home, transportation to clinic visits, and housing near UCLA for out-of-town patients. For patients with

711-410 The UCLA Medical Center: Kidney Transplantation
10
living donors, the transplant coordinator also managed the admission process. At discharge, post-transplant coordinators presented patients with a written schedule for follow-up outpatient visits for the next month (pre-scheduled by kidney team administrative assistants during the admission), renewed post-transplant medications, delivered ongoing patient education, and communicated with referring physicians.
The patient reported for outpatient care at the Post-Kidney Transplant Clinic at the Medical Plaza every other day for the first three weeks. Patients were seen by a nephrology fellow and then by one of two nephrologists who rotated through the clinic. A surgeon was present at the clinic in case of any “surgical issues,” such as signs of rejection including infection and elevated blood sugar. If a major complication arose, the patient was re-admitted to a general medical or surgical ward. Social worker or nutritionist evaluations were conducted as needed, but were not standard components of post-transplant visits.
At the three week mark, the patient was seen at Urology clinic for outpatient removal of the ureter stent, surgical staples and dialysis catheter. Visits to the post-transplant clinic slowed to twice weekly, and then weekly. Scheduling for appointments after the initial one-month schedule was conducted in person by the clinic administrative assistant at the end of each visit. After three months, responsibility for most patient care reverted to the referring physician, though patients reported for follow-up at UCLA every three months and then annually beginning at the one year mark, except for Kaiser patients who were rarely seen at UCLA after three months.
UCLA’s post-transplant coordinators informally followed their patients for life, but did not systematically collect long-term follow-up data. UCLA was developing a web-based patient portal to improve long-term follow-up as well as data collection throughout the care cycle. Throughout the transplant process the portal was planned to be accessible to UCLA patients’ referring and community physicians, who could upload lab results or other clinical updates. Patients would be able to submit their own health status updates and access educational materials from the site. The system would also periodically send follow-up surveys to patients, allowing coordinators to easily identify and contact non-responders. In 2010, UCLA had piloted the portal for recipients of living, related donor kidneys with near-term plans to roll it out more broadly.
Reimbursement
Historically, kidney transplant services had been reimbursed on a fee-for-service basis both by Medicare and private payers. With the introduction of diagnosis-related group (DRG) payment for inpatient care in 1983, Medicare began to reimburse the hospital admission for transplant surgery using the kidney transplant DRG. Private payers soon followed suit.
In 1986, as Dr. Rosenthal took over as Surgical Director of Kidney Transplantation, Kaiser Permanente approached UCLA about contracting for kidney transplant services. Kaiser would send UCLA enough patients to increase its transplant volume by 30%. In the interest of controlling costs and aligning incentives between payers and providers, Kaiser asked UCLA to develop a packaged price encompassing all the costs related to a transplant. At the time, the inpatient DRG, organ acquisition (including certain pre-transplant costs, such as evaluation for compatibility), physician services (including separate payments for organ retrieval, surgery-related charges, and follow-up care), and outpatient drugs were each reimbursed separately.22
Rosenthal agreed to work with Kaiser to create the first bundled reimbursement model for kidney transplantation. He believed that the packaged pricing concept had promise, and wanted to arrive at

The UCLA Medical Center: Kidney Transplantation 711-410
11
a fair price for Kaiser that also would not lose money for UCLA. Rosenthal discovered that UCLA had a computerized cost accounting system capable of estimating patient-level costs, but that no physician had ever attempted to access or analyze cost information. Over a three-month period, Rosenthal and his team sorted through the data to better understand the costs involved with a full cycle of care for a kidney transplant patient. Hospital costs were analyzed by examining UCLA’s past Medicare DRG billing information, and physician costs were examined by looking at UCLA’s recent Medicare resource-based relative value scale (RBRVS) billings. DRGs and RBRVS were Medicare’s payment schedule for hospitals and physicians, respectively.
The initial packaged pricing model for kidney transplantation covered the transplant phase beginning with the inpatient admission, and the post-transplant phase until 90 days after surgery, with the exception of outpatient prescription medications. All hospital readmissions within 90 days were covered, regardless of cause. By examining historical readmission data, Rosenthal found that the vast majority of readmissions were likely related to the transplant. It was decided that it would be administratively simpler and less costly to cover an occasional unrelated admission than to determine and manage which DRGs were to be included in the bundle. This decision also meant Kaiser would not have to develop a sophisticated set of rules for claims adjudication; the few disputes that arose could be settled individually.
Most of the services in the full care cycle that were excluded from the bundle occurred before the transplant surgery. The initial evaluation for transplant eligibility was not included because UCLA evaluated a large number of patients who did not ultimately receive transplants. The pre-transplant phase was also excluded, as it could span multiple years and involve minimal outpatient care at UCLA as patients continued to obtain regular care from their referring providers. The organ acquisition cost was separate, as the price was set annually by the Los Angeles OPO based on average kidney acquisition costs in the region over the previous year. Under the packaged pricing agreement UCLA continued to receive separate payments for physician and hospital fees.
Overall, Rosenthal considered the process of determining what was in the bundle relatively uncontroversial, particularly compared to certain other conditions. He noted:
With something like hip replacement, you would need to examine the reason behind every readmission. If a patient were readmitted with a stroke, it would probably be unrelated. You would also likely want to include the implant to encourage proper and efficient use. The underlying diagnosis might also impact expected costs. For most patients, however, the transplant at least modestly increases their risk for virtually all readmissions within six weeks or so. Because so few readmissions are truly unrelated, we can handle including an occasional broken leg. Organ acquisition costs should really be out, since UCLA has no control over what the OPO charges.
UCLA negotiated different packaged reimbursement amounts for living versus cadaveric transplants, the factor most responsible for cost variability. Rosenthal and his team also considered adjusting the payments for primary and repeat transplants, but determined that the variability was not enough to warrant the distinction. UCLA also arranged for “outlier provisions” that involved additional payment for unusually costly patients once an expense threshold was reached, though the provider did not recover the full cost of outlier patients.
Upon securing the Kaiser contract, Rosenthal worked with a representative of the Medical Center and the Director of the Medical Group to determine how the total amount would be split between the hospital and physicians. They agreed after relatively uncomplicated discussions that the hospital would receive approximately 80% of the bundled price and physicians would receive 20%. Rosenthal
711-410 The UCLA Medical Center: Kidney Transplantation
12
then worked with all of the relevant physician groups to determine how the physician portion of reimbursement would be divided, a relatively lengthy process that Rubin likened to “UN negotiations.” The physicians involved in transplantation represented a number of different departments and divisions. The kidney transplant program was co-run by Urology and Nephrology, specialties within the Departments of Urology and Medicine, respectively. Urology and Nephrology opted to receive a fixed fee per patient for the entire care cycle and, thus, bear revenue risk. It was agreed that all other services—e.g., Anesthesia, Pediatrics, Pathology, Radiology—would bill internally on a per service basis for services provided to a kidney transplant patient. Internal billing amounts corresponded to Medicare fee-for-service rates.
For auxiliary physician services, like Infectious Disease or Pulmonology, there was uncertainty over frequency. Approximately 50 to 60% of the global physician fee was allocated to a risk pool used to pay for all physician services other than Urology and Nephrology, including services like Anesthesia that were needed by all transplant patients. Because Nephrology and Urology agreed to a fixed fee per patient, these groups received whatever funds remained in the risk pool on a quarterly basis after all other specialists had been paid.
A similar approach was developed next for heart transplant and then other solid organ transplants performed at UCLA for Kaiser Permanente beneficiaries. UCLA received 95% of Kaiser’s transplant referrals because of proximity, capacity, and quality. Kaiser patients represented 30% of UCLA’s kidney volume, 15% of its heart volume, and 20% of its liver volume. Kaiser Permanente’s request for kidney transplant packaged pricing in 1986 had led UCLA to become one of the first transplant centers to offer such an arrangement to payers. By the early 1990s UCLA offered this arrangement to all its payers, and by the mid-1990s most large US transplant centers offered packaged pricing. One payer had decided to revert to its original reimbursement system for transplants because its computer systems were tailored to traditional (e.g. fee-for-service, per diem) payments rather than packaged pricing. For most payers, however, bundled payment remained UCLA’s principal means of reimbursement for kidney transplantation.
Reimbursement in 2010
Typical first-year charges for a kidney transplant in the US, including organ procurement, were estimated at $259,000 in 2008. (see Exhibit 4) Reimbursement amounts for transplantation could vary widely across providers according to the payor contract, patient population and length of hospital stay. Reimbursement methods also varied by payer. Many private health plans issued bundled payments for kidney and other types of organ transplantation, while other private plans and fee-for-service Medicare (i.e. not including Medicare Advantage)23 reimbursed the inpatient surgical admission via a diagnosis related group (DRG) payment, and outpatient care on a fee-for-service basis. For both bundled and DRG/fee-for-service reimbursement, payers reimbursed physician and hospital fees separately, as was customary for US hospital care.
In 2010, UCLA had bundled reimbursement contracts for its kidney transplant services with virtually all of its commercial payers, including Medicare Advantage plans. UCLA’s accounts receivable from payers was 30 days longer for packaged pricing than traditional transplant reimbursement. Rosenthal recalled:
The worst problem UCLA had at the outset was that we lacked a system to collect a bundled payment or to give payers a single bill. It took longer to get that system running than anything else. For years we were cleaning up fee-for-service bills that should have been part of the bundles. But when 95% of [Department of] Anesthesia payments, for example, are fee-for-

The UCLA Medical Center: Kidney Transplantation 711-410
13
service, it takes some time to get used to sending 5% of their bills internally to the bundled payment shop for inclusion in the single bill.
Package prices for kidney transplantation were renegotiated every three years. Bundled prices were set with most regional payers at the same time as they negotiated other types of care, meaning that transplant rates could be affected by negotiations for other services. For example, a payer might offer UCLA a slightly lower kidney transplant rate in exchange for more favorable obstetrics and gynecology reimbursement. UCLA contracts with national health plans, such as United Healthcare, typically covered only transplantation services. Negotiations were conducted by the payer’s transplant team, which often included members with relevant clinical as well as administrative expertise.
UCLA conducted cost analysis and projections in advance of each negotiation, but the general structure and approach had been largely unchanged since inception. To isolate costs of care related to kidney transplantation, the kidney team’s two financial counselors were responsible for electronically coding every care encounter for each UCLA kidney transplant patient on an ongoing basis. For example, when a kidney transplant patient reported to the ER, a counselor would indicate in the EPSi accounting system whether that visit was related to the transplant, consulting a transplant coordinator familiar with the case if needed. Whether a visit was considered “related” depended upon the terms of the agreement between that patient’s health plan and UCLA, and financial counselors had to be familiar with the detailed terms of each contract. The EPSi system would then aggregate only the transplant-related encounters for an individual patient to estimate the cost of care.
The scope of the bundle had changed somewhat since 1986. Although individual contracts varied in terms of which services were included, many bundles covered organ procurement, which had been carved out of most earlier contracts. Kidney procurement charges were roughly $30,000 in 2010, up from $10,000 15 years earlier. To minimize its risk, UCLA normally did not include readmissions, in contrast to the initial Kaiser bundle. Re-transplants were also not included, as they were not conducted within the timeframe of the bundle, but were reimbursed according to a discounted case rate versus the initial transplant price. Contracts also varied in terms of timeframe covered, however most began with the admission for transplant surgery and ended six to eight weeks post-operatively. Over the years, UCLA had agreed to longer post-transplant periods of up to six months, but believed that eight weeks included the bulk of related care and covered the right amount of time.
The hospital continued to retain roughly 80% of the overall payment and physicians received 20%. As the hospital and physician payments were still issued separately and split up front, physicians did not directly benefit from lowering hospital costs, which was in compliance with gainsharing restrictions that prohibited hospital payments to physicians for reducing or limiting services. The physician risk model was also unchanged, with Urology and Nephrology receiving a fixed per patient amount while other services were paid internally on a fee-for-service basis. The risk pool had consistently remained solvent and issued quarterly payouts ranging from roughly five to 10% of physicians’ base salaries to the two at-risk specialties.
UCLA continued to stratify pricing only by donor type (living versus cadaveric), rather than having multiple risk-adjusted prices. UCLA was considering whether to develop a separate price for the growing number of patients requiring IVIG treatment, often costing tens of thousands of dollars. Contracted health plans preferred fewer pricing tiers to increase the predictability of their payments.
Contracts continued to include stop-loss provisions to address outlier patients who required significantly more resources than typical cases. Outliers tended to be patients with extraordinarily complicated pre-transplant morbidities or those who experienced unanticipated post-surgical

711-410 The UCLA Medical Center: Kidney Transplantation
14
complications. Stop-loss coverage was triggered when certain dollar amount or length-of-stay benchmarks were reached, with dollar amount provisions becoming more common. In outlier cases, comprising roughly 5-10% of patients, UCLA was paid based on an agreed-upon proportion of fee-for-service charges or on a fixed per diem charge, depending on the individual payer contract. The extra costs to UCLA for outlier patients often ranged from 50% to 100% more than standard patients, with especially costly cases costing $1 million or more. The stop loss provisions often did not fully cover the cost of excess care, and cases that resulted in serious complications were still very costly to UCLA.
Rubin and Rosenthal believed that the bundled pricing model had helped UCLA improve the care delivery process by increasing the focus on cost effective care. The average length of inpatient stay had fallen from roughly 15 to seven days since the start of package pricing, and clinicians sought new ways to reduce serious complications and improve patient outcomes. For example, surgeons aimed to lower cold ischemia time (i.e. chilling of the donor kidney when its blood supply was cut off prior to transplantation), allowing the transplanted kidney to begin working more quickly. Shorter ischemia time was believed to lower the average length of hospital stay and reduce the probability that the patient would require dialysis as the new kidney “warmed up.”
The clinical pathway for patients had also become more consistent and streamlined. For example, one surgeon historically aimed to see each potential kidney transplant patient in person before agreeing to perform the procedure, which extended the pre-transplant phase by weeks or months. By 2010, the surgeon had agreed to skip that appointment for less complex patients, based on the nephrologist’s recommendation and evaluating the patient in person closer to the procedure date. After studying the relationship between patients’ initial clinical characteristics and normal test results, UCLA had also changed its guidelines for elderly or diabetic patients to undergo investigational cardiac catheterization prior to transplant listing, cutting the number of tests approximately in half.
Nephrologists, urologists, and anesthesiologists had also formed teams within the Transplant Program with whom they shared the large majority of their patients. Rosenthal commented:
The greatest benefit of bundled pricing has been that the payment mechanism encourages physicians to work together in groups, which is essential to effective care delivery. The whole field has also improved since 1986. There have been major advances in management of immune suppression and we probably would have worked to reduce cold ischemia time anyway, though it’s hard to know whether it would have happened as quickly.
UCLA’s kidney transplant margins were modest under packaged pricing, although they had become more predictable over time as payers’ contracts became increasingly similar. While UCLA had not directly compared its margins for package pricing and fee-for-service patients, Rubin believed that the bundled pricing approach had been cost effective for the Health System, “When UCLA first developed the bundled price with Kaiser, we were looking to increase patient volume and probably made a price-volume tradeoff. It was the age of managed care. Today, I doubt we get lower reimbursement with the bundle than under fee-for-service.”
Measurement and Reporting
The Transplant Service managed tracking and analyzing quality data for all of UCLA’s transplant programs. Measurement of kidney transplant fell into three main categories: data required by UNOS, data required by CMS, and data tracked internally by UCLA and the Kidney Program.

The UCLA Medical Center: Kidney Transplantation 711-410
15
UNOS For transplant recipients, UNOS reporting was required at wait list placement, after hospital discharge, six months post-transplant, and on every transplant anniversary as long as the graft functioned. UCLA submitted data to UNOS online via a web-based interface that generated electronic forms. Dedicated administrative assistants from the kidney team manually entered data into the online forms. Recipient measures included basic demographic and background information; pre- and post-transplant lab results, functional status, and comorbidities; and 3-month, 1-year, 3-year and 5-year graft survival and patient survival rates. The recipient’s provider and surgeon were recorded, as well as details about the transplant admission such as the type of procedure, methods by which the donor organ was preserved and received, and the organ’s functioning post-transplant (e.g. urine production, need for post-surgical dialysis, signs of rejection). (see Exhibit 5)
In addition to recipient data, UNOS collected information about living and deceased donors, including living donor follow-up at six months and one year post-transplant. In addition to basic background details, donor clinical information included lab results and current and historical health status (e.g. certain comorbidities, risk factors such as tobacco use). For deceased donors, information was collected about the cause of death and organ recovery process, while for living donors, post-operative information such as discharge date and complications were measured. UNOS also required tissue typing labs to submit data on the degree of tissue compatibility between the donor and recipient. Recommendations for changes to data collection could be made by one or more of the 22 UNOS committees organized around transplant type (e.g. kidney transplantation) or function (e.g. operations and safety, finance). Final approval came from the UNOS Board of Directors.24
UNOS issued public annual reports containing risk-adjusted patient and graft survival data for each center, along with a sub-set of other, mainly process measures. UNOS often provided additional data not included in public reports to researchers and others upon request. The Scientific Registry of Transplant Recipients was responsible for stratifying and separately evaluating outcomes for meaningfully different populations for which different factors were likely to influence results (e.g. pediatric and adult transplant recipients, living and deceased kidney donors). For the same reason, certain results were also stratified according to time periods (e.g. one- and three-year patient and graft survival), as different sets of factors could impact results at those intervals.
SRTR then compiled lists of factors, or covariates, believed to influence results based on SRTR analysis and the medical literature. Ultimately, a regression model that included each factor expected to impact results was created to “fit” the aggregate national data. The SRTR used this information to calculate actual versus “expected” graft and patient survival for each transplant center. Models were reviewed continuously and updated as needed based on new information from clinicians, statisticians, and UNOS committees.
CMS CMS certified each kidney transplant program every three years based on compliance with CMS “conditions of participation.” CMS also examined SRTR data comparing expected and observed patient and graft survival for each transplant center, and could conduct unplanned audits if unexpected variation was found. The certification process required UCLA to submit extensive descriptive information about the program, such as its patient education policy, transplant selection criteria, and adverse event policy. CMS also required all kidney programs to identify six multidisciplinary team members, including a nephrologist or other Department of Medicine physician, surgeon, transplant coordinator, pharmacist, nutritionist, and social worker. CMS required documentation demonstrating that all relevant team members were in communication throughout the care process. To satisfy this requirement, UCLA provided evidence of interdisciplinary inpatient rounds and notes from outpatient charts stating that the patients had been
seen by various team members. UCLA UCLA tracked a number of measures for its hospital-wide

711-410 The UCLA Medical Center: Kidney Transplantation
16
dashboard as well as items identified internally by the Kidney Program. General, hospital-wide metrics often included standards of care established by quality organizations such as the Joint Commission,25such as measures specific to kidney transplantation were derived from kidney team expertise and the transplant literature, such as the volume of patients evaluated and listed for transplant; waiting times at each stage of the process; length of stay for the surgical admission; and statistics on readmission for complications. Internal dashboard results were presented at the Program level, not for individual clinicians. UCLA did not conduct risk adjustment on its own internal measures, but did review risk-adjusted UNOS data.
All of UCLA’s kidney transplant measurements for internal and external reporting were accumulated in a 10-year-old electronic clinical database developed internally by OTS for all transplant types, segmented by transplant Program, and maintained by three full-time programmers. Nurses and administrative assistants manually entered most patient information into the transplant database. The database automatically pulled lab results from the Health System EMR, but could not submit information to the EMR. Nurses and physicians could call up both systems on their computer screens to simultaneously view the EMR and transplant database. OTS planned to reconcile the two systems sometime in the future.
Performance data was shared internally on a monthly basis via a kidney transplant-specific dashboard. (See Exhibit 6) The measures tracked had undergone major changes since the kidney dashboard was introduced around 2003, and were continuously being adjusted. Review and addition of new measures was managed by the Kidney Program’s Executive Committee, which oversaw all of the Program’s quality improvement initiatives. The Committee met monthly and was comprised of the clinical team as well as representatives from OTS. Occasionally, hospital finance or payer contracting staff also attended Committee meetings. All kidney team members were welcome to propose new measures, or new means of analyzing existing data. The Director of OTS also held monthly meetings with representatives of each Transplant Program to discuss progress against performance metrics, compliance with Medicare and UNOS mandatory reporting, and any other quality concerns.
UCLA did not separately publish its kidney transplant results, although SRTR publicly reported the UNOS data collected from UCLA at the provider level. UCLA shared its dashboards with payers during contract negotiations if desired, along with the SRTR reports. Kaiser regularly reviewed provider data, and had a regional kidney transplant team of physicians that examined SRTR and internal reports for UCLA and other contracted transplant centers in Southern California. During its quarterly meetings, the Kaiser team identified poorly performing centers and determined whether to place those providers on probation, giving them time to improve their results.
Results
From 1991 to 2008, UCLA was the only adult kidney transplant program in the US to achieve statistically better one year graft survival than predicted every year. During that time, the average one-year graft survival for all centers improved from 79.5% to 93.2% (see Exhibit 7). From 2008 to 2010, UCLA’s adult kidney transplant program achieved 96.1% one year graft survival compared with an expected rate of 94.8%, but the difference was not statistically significant (see Exhibit 8).
In 2010, UCLA’s most recently reported three year graft survival rate was 91.3% compared to an expected rate of 87.0%, placing UCLA among the 16 of 252 transplant programs with statistically significant better results (see Exhibit 9). UCLA had also achieved 94.58% three year adult kidney

The UCLA Medical Center: Kidney Transplantation 711-410
17
transplant patient survival, exceeding the expected rate of 92.78% but the difference was not statistically significant.
Cold ischemic time for donor kidneys transplanted at UCLA were distributed differently than the national averages. In 2010, 31% of “local” kidneys that were both recovered and transplanted at UCLA were from donors that had been deceased 11 hours or fewer, versus 37% nationally. Donors of 49% of UCLA’s locally transplanted kidneys had been deceased between 11 and 21 hours, compared to 44% nationally (see Exhibit 10).
For the year beginning July 1, 2009, SRTR reported UCLA’s transplant rate for wait listed patients to be .14 procedures per wait listed year, slightly higher than the previous year at .13 and below the statistically expected rate of .20. Mortality for wait listed patients at UCLA was .05 deaths per year, lower than the expected rate of .06.
Overall hospital satisfaction rates had jumped to the 96th percentile of national benchmark levels, according to external surveys. UCLA patient satisfaction surveys showed that 97% of kidney transplant patients were satisfied with their overall care, and 98% would recommend UCLA to prospective patients. Nearly 90% of patients were satisfied with their transplant coordinators, and almost three quarters were satisfied with their care during the wait list period.
Future
Rubin and Rosenthal were committed to continuously improving the kidney transplant care delivery model and using the program’s scale to UCLA’s advantage. Under discussion were ways to improve the organization of care delivery itself, and how to best coordinate care with community providers as UCLA saw increasing numbers of patients from outside the Los Angeles area.
OTS provided a high level of coordination via its nurse coordinators, and efforts to utilize a common donor team and share auxiliary services like infectious disease specialists and tissue typing labs had proven successful. In 2010, OTS was considering cross-training coordinators so that staff would be capable of working with multiple different services.
With payer contract negotiations regularly approaching, Rubin and Rosenthal were also looking for ways to further align reimbursement with the current state of kidney transplant care delivery and improve incentives for excellent and efficient patient care. They were also exploring whether the bundled pricing model might work for other medical conditions. For example, UCLA was a participant in the Integrated Healthcare Association’s fledgling demonstration of bundled pricing for total knee replacement and coronary artery bypass graft (CABG), and had entered into bundled pricing arrangements for bariatric surgery. Still, the different claims administration for bundled pricing continued to make it a challenge to find payers willing to experiment.

711-410 The UCLA Medical Center: Kidney Transplantation
18
Exhibit 1 UCLA Hospital-Wide Clinical Dashboard Excerpts
Note: Some dashboard components were edited for ease of understanding medical terminology
Source: UCLA Health System

The UCLA Medical Center: Kidney Transplantation 711-410
19
Exhibit 2 Top Providers by Adult Kidney Transplant Volume, 1987 - 2010
Jan 2008 – June 2010
July 1998 – June 2000
Oct 1987 – Dec 1989
University of California, San Francisco (UCSF)
735 378 521
University of California, Los Angeles (UCLA)
611 371 218
University of Wisconsin 608 465 433
NY Presbyterian/ Columbia University
607 156 103
Northwestern Memorial Hospital
591 194 91
University of Alabama, Birmingham
576 514 522
Source: Organ Procurement and Transplantation Network.
Exhibit 3a Transplant Services Organizational Chart
Chief Operating
Officer,
Amir Dan Rubin
Associate Director of
Operations,
Shannon O’Kelley
Administrative
Director,
Transplant Services,
Nanci Flores
Office of Transplant
Services
Kidney and Pancreas
Transplant Program
Liver and Small Bowel
Transplant Program
Heart and Lung
Transplant Program
Bone Marrow
Transplant Program
Cardiomyopathy Stem Cell Lab
Source: UCLA Health System.

711-410 The UCLA Medical Center: Kidney Transplantation
20
Exhibit 3b Kidney Transplant Program Organizational Chart
Source: UCLA Health System.

The UCLA Medical Center: Kidney Transplantation 711-410
21
Exhibit 4a Estimated Average Charges for Organ and Tissue Transplantation, US
Exhibit 4b Estimated Average First-Year Transplantation Charges by Treatment Phase, US (2008)
Note: US health plans typically contracted with providers to pay a percentage of the billed charges (i.e. <100%), so that few if any payers or patients actually reimbursed the full billed charge amount.
Source: Hauboldt, Richard H. and Nickolas J. Ortner, “2002 Organ and Tissue Transplant Costs and Discussion,” Milliman USA, 2002; Ortner, Nickolas J., “2005 Organ and Tissue Transplant Cost Estimates and Discussion,” Milliman Consultants and Actuaries, 2005; Hauboldt, Richard H., “2007 U.S. Organ and Tissue Transplant Cost Estimates,” Milliman, 2007; Hauboldt, Richard H. and Steven G. Hanson, “2008 U.S. Organ and Tissue Transplant Cost Estimates,” Milliman, 2008.
TransplantEstimated #
in 2008CAGR
2002 2005 2007 2008
Heart 2,247 $391,800 $478,900 $658,800 $787,700 11%
Single Lung 802 $343,000 $299,900 $399,500 $450,400 3%
Double Lung 764 N/A $508,200 $557,400 $657,800 2%
Liver 6,550 $313,600 $392,800 $519,600 $523,400 11%
Pancreas 399 $148,900 $270,800 $297,300 $275,500 15%
Kidney 17,447 $143,300 $210,000 $246,400 $259,000 11%
Kidney-Pancreas 955 $195,500 $293,100 $368,600 $439,000 14%
Bone Marrow, Self-Donation 11,583 $243,800 $219,300 $273,100 $300,400 2%
Bone Marrow, Donor 7,944 $809,400 $868,200 $1,080,800 $676,800 6%
Intestine 70 $814,500 $813,600 $908,600 $1,121,800 2%
Cornea 34,898 $14,200 $19,100 $23,300 $20,700 10%
Estimated First-Year Billed Charges
Transplant
30 Days Pre-
Transplant Procurement Hospital Physician
180 Days
Post-
Transplant
Admission
Outpatient
Immuno-
suppressants
& Other Rx Total
Heart $34,200 $94,300 $486,400 $50,800 $99,700 $22,300 $787,700
Single Lung $7,500 $53,600 $256,600 $27,900 $84,300 $20,500 $450,400
Double Lung $20,700 $96,500 $344,700 $59,300 $113,800 $22,800 $657,800
Liver $21,200 $73,600 $286,100 $44,100 $77,800 $20,600 $523,400
Pancreas $16,500 $68,400 $93,400 $16,300 $58,700 $22,200 $275,500
Kidney $16,700 $67,500 $92,700 $17,500 $47,400 $17,200 $259,000
Kidney-Pancreas $18,400 $122,300 $171,100 $32,000 $73,800 $21,400 $439,000
Bone Marrow, Self-
Donation $31,300 $21,200 $169,900 $10,600 $62,100 $5,300 $300,400
Bone Marrow,
Donor $30,400 $29,400 $380,700 $19,600 $197,100 $19,600 $676,800
Intestine $48,400 $77,200 $743,800 $100,600 $124,300 $27,500 $1,121,800
Cornea $0 $0 $13,200 $7,500 $0 $0 $20,700

711-410 The UCLA Medical Center: Kidney Transplantation
22
Exhibit 5 Summary of UNOS Measures for Adult Kidney Transplant Recipients, 2010
Source: United Network for Organ Sharing, http://www.unos.org/data/about/collection.asp, accessed May 2010.
Adult Kidney Transplant Wait List Registration
Highest education level
Hospitalization status at listing (e.g. ICU, hospitalized, not
hospitalized)
Functional status
Physical capacity (e.g. no limitations, wheelchair bound)
Employment or academic status
Previous transplant(s) and graft failure date
Clinical information at listing
BMI
Blood type
Primary diagnosis
Common "medical factors" (e.g. diabetes, dialysis, angina)
Common co-morbidities (e.g. hypertension, COPD, cancer)
Lab results (e.g. serum creatinine and albumin levels)
Kidney medical factors (e.g. exhausted vascular or
peritoneal access, etc.)
Adult Kidney Transplant Recipient Records (Post-discharge)
Transplant date and provider information
Donor type and ID#
Patient status
Dates last seen, of admission, and/or discharge
Living or dead, and causes of death if applicable
Hospitalization status at admission
Functional status, physical capacity, employment or
academic status
Sources of payment
Pre-transplant clinical information
Lab results (e.g. serum creatinine and albumin levels)
Blood transfusion
Previous pregnancies, or malignancies since listing
Transplant procedure clinical information
Multiple organ recipient
Procedure type
Kidney preservation (e.g. cold/warm ischemia time)
Kidney received on ice or pump
Tumor found at time of transplant; if yes, type
Post-transplant clinical information
Graft status (functioning or failed; if failed, date)
Resumed maintenance dialysis; if yes, date
Lab results (e.g. serum creatinine)
Kidney produced >40ml urine in first 24 hours
Acute rejection episodes prior to discharge; if yes, biopsy
BMI
Biological/anti-viral or other therapies; if yes, specify
Immunosuppressive medications and type/duration of use
Adult Kidney Transplant Follow-Up
(6 mos. post-transplant, every transplant anniversary)
Recipient background and provider information
Transplant and previous follow-up date
Provider information (recipient, follow-up center)
Donor information (type, UNOS ID#)
Patient status
Date last seen, transplanted, or death
Patient status (living, dead, re-transplanted)
Primary/contributory causes of death
Has the patient been hospitalized since last status
If yes, number of hospitalizations
TRR diagnosis
Was there evidence of noncompliance with
immunosuppression medication during
this follow0up period that compromised
recovery
Functional status
Physical capacity
Employment or academic status
Primary insurance at follow-up
Clinical information
BMI
Urine protein found by any method
Diabetes onset during follow-up; if yes,
insulin dependent
Graft status (functioning or failed)
If functioning, most recent creatinine
If failed, date and causes of failure
Dialysis since last follow-up
Date maintenance dialysis resumed
Dialysis provider
Did patient have any acute rejection episodes
during follow-up period; if yes, biopsy
Viral detection
Post-transplant malignancy
Treatment
Biological or anti-viral therapy; if yes, list
Treatment for polyoma virus; if yes, list
Other therapies; if yes, list
Immunosuppressive information
Were any medications given during the follow-up
Did patient participate in any clinical research
for immunosuppressives; if yes, specify
Immunosuppressive information
List all medications and type/duration of use

The UCLA Medical Center: Kidney Transplantation 711-410
23
Exhibit 6 UCLA Adult Kidney Transplant Performance Dashboard, 2010
*UNOS requirement **CMS requirement ***UNOS and CMS requirement
Source: UCLA Health System.
PRE TRANSPLANT - Adult
Volumes
Recipient Referrals
Scheduled Evals
Completed Evals
No Show Evals
Cancelled Evals
Total Wait List
Active
Hold - Status 7
Hold - Workup In Progress (WIP)
WIP - not listed yet
Total # of Patients Listed
Quality
2 blood types @ list***
Informed consent signed @ list**
List letter within 10 days of list date***
Social work consult before list (any)***
Social work consult before list (UCLA)
Selection committee before list
Selection criteria before list**
Delisted (non-transplant, non-death)***
Delist letter within 10 days of delisting***
Delisted, reason = death
Delisted w/in 24 hours of notification of death***
Turn-Around Times (Average & Median)
Referral to List
Referral to 1st Appt
WIP (Eval Date to final SelComm)
Insurance Company Auth (AA to TFC)
Financial Clearance (SelComm or TFC to Clear)
Fin Clear (or Sel Comm) to List Date
POST TRANSPLANT - Adult
Volumes
Total Transplants (Adult + Ped, CAD + Living)
Total Transplants (Adult + Ped, CAD)
Total Foreign National Transplants*
Foreign National Percentage*
Total # of Patients Transplanted
CAD Transplants
L/R Transplants
L/U Transplants
Transplant Admission Length of Stay
Transplant admission Number (excludes inhouse)
Total # of Patients Expired
Total # of Graft Failures
Total # of Readmissions (to UCLA)
Readmission Length of Stay
Readmission Number (excludes inhouse)
Readmissions within 90 days of Transplant Discharge
Quality
delisted within 24 hours of transplant

711-410 The UCLA Medical Center: Kidney Transplantation
24
Exhibit 7 UCLA Performance on Graft Survival Rates vs. US Centers, 1987-1989 and 2006-2008
Note: Expected graft survival rates were calculated based on transplant center’s risk adjusted patient population Source: Scientific Registry of Transplant Recipients (SRTR).
1987-1989 Number of programs included: 207 Number of transplants: 19,588 Average 1-year graft survival: 79.5%
Maximum transplants/center: 522 Minimum transplants/center: 2 Average transplants/center: 95.7
2006-2008 Number of programs included: 239 Number of transplants: 38,457 Average 1-year graft survival: 93.2%
Maximum transplants/center: 788 Minimum transplants/center: 1 Average transplants/center: 160.9

The UCLA Medical Center: Kidney Transplantation 711-410
25
1 Month 1 Year 3 Years 1 Month 1 Year 3 Years
Transplants (n=number) 645 645 641 39,063 39,063 38,602
Percent of Grafts Surviving at End of
Period
Observed at this Center1 98.76% 96.12% 91.26% 97.69% 93.60% 85.37%
Expected, based on national
experience 2 98.12% 94.80% 86.98%
Graft Failures During Follow-up Period
Observed at this center 8 22 56 903 2,343 5,646
Expected, based on national
experience 3 12.18 30.99 86.28 903 2,343 5,646
Ratio: Observed to Expected (O/E) 0.66 0.71 0.65 1 1 1
(95% Confidence Interval )4
(0.28-1.29) (0.44-1.07) (0.49-0.84)
P-va lue (2-s ided), observed v.
expected5 0.287 0.116 <0.01
How does this center's survival compare
to what is expected for similar patients?
Not
Signi ficantly
Di fferent (a)
Not
Signi ficantly
Di fferent (a)
Statis tica l ly
Higher (b)
% of total patient follow-up days for the
time period reported by the center (%)6 99.8 96.2 88.8 99.9 97.6 95.8
Maximum Days of Fol low-up (n) 30 365 1,095 30 365 1,095
Transplant Time Period
7/1/2008-
12/31/2010
7/1/2008-
12/31/2010
1/1/2006-
6/30/2008
7/1/2008-
12/31/2010
7/1/2008-
12/31/2010
1/1/2006-
6/30/2008
UCLA United States
Exhibit 8 UCLA Adult Graft Survival by Time Since Transplant, 2006 – 2010
The above data were prepared by SRTR under contract with the Health Resources and Services Administration (HRSA).
1 Observed graft survival rates used the Kaplan-Meier method to estimate outcomes for patients for whom complete follow-up is not expected. This statistic represented graft failure rates among patients still being followed by the facility. If the follow-up percent was low, this statistic may not have been representative of outcomes for all patients at the facility. Because different cohorts were followed for each time period, it was possible for reported 3-year survival to exceed 1-year survival.
2 The graft survival rate that would be expected for the patients served by this center, given the characteristic mix of the recipient and donor (age, disease, blood type, etc.) and the experience of similar patients in the entire country. 3 The number of graft failures that would be expected during the follow-up time, as described in footnote 1. Unlike the expected survival percent, the expected count of graft failures reflected the expected number of graft failures only during the time the patient was alive with a functioning graft and actually followed; therefore, it accounted for differences in the time that elapsed from transplant until graft failure.
4 The 95% confidence interval gave a range of values for the true ratio of failures at the facility to those expected based on the national experience. The true ratio would be between this lower and upper bound 95% of the time. 5 A p-value less than or equal to 0.05 indicated that the difference between the actual and expected graft survival was probably real and not due to random chance, while a p-value greater than 0.05 indicated that the difference could possibly be due to random chance.
(a) This difference could plausibly be just a chance occurrence. (b) This difference is unlikely due to random chance and probably represents a real difference from the expected survival.
6 Of days expected to be included in the follow-up period for a particular center based on the number of patients and transplant dates, the percentage of days actually covered by follow-up reporting This measured the possibility that events such as failure had occurred without being reported, and it was not a measure of compliance.
Source: SRTR, Program and OPO Specific Reports, January 2012

711-410 The UCLA Medical Center: Kidney Transplantation
26
Exhibit 9 UCLA Performance on 3-Year Graft Survival Rates vs. US Centers, 2006-2008
Note: Expected graft survival rates were calculated based on transplant center’s risk adjusted patient population
Source: Scientific Registry of Transplant Recipients (SRTR)
Exhibit 10 UCLA Distribution of Cold Ischemic Time vs. Region and Nation, 2010
a
aHarvested at a location other than UCLA
Source: Scientific Registry of Transplant Recipients (SRTR).
2006-2008 Number of programs included: 239 Number of transplants: 38,602 Average 3-year graft survival: 85.37%
Maximum transplants/center: 736 Minimum transplants/center: 1 Average transplants/center: 160.8

The UCLA Medical Center: Kidney Transplantation 711-410
27
1 U.S. News rankings were based on reputation among physicians, risk-adjusted mortality for each service and care-related factors (e.g. patient volume, nurse availability). http://health.usnews.com/best-hospitals
2 UCLA Medical Center, Resnick, and Santa Monica were separately licensed hospitals. Mattel was classified as a "hospital within a hospital," meaning a large, multidisciplinary pediatric service within UCLA Medical Center.
3 The description of ESRD draws heavily from Porter, Michael E. and Vivek Garg, “DaVita: Integrating End-Stage Renal Disease Care,” unpublished draft, November 2009
4 American Kidney Fund, “ESRD,” http://www.kidneyfund.org/kidney-health/kidney-failure/end-stage-renal-disease.html
5 Medicare eligibility for ESRD patients was contingent upon having worked long enough to earn a minimum amount of credits toward retirement under Social Security, or being the spouse or dependent of someone who had.
6 US Renal Data System, 2009 Annual Data Report, http://www.usrds.org/2009/view/v2_11_econ.asp
7 U. of Maryland Medical Center, http://www.umm.edu/news/releases/kidcost.htm, Accessed June 8, 2010
8 “Kidney Transplantation: Past, Present, and Future,” http://www.stanford.edu/dept/HPS/transplant/html/history.html
9 UNOS Facts and Figures, http://www.unos.org/inTheNews/factsheets.asp?fs=5
10 Chabalewski, Franki, et al, “UNOS,” Organ Transplan, 2002 http://www.medscape.com/viewarticle/436539_6
11 SRTR website, “About SRTR,” http://www.ustransplant.org/who.aspx
12 This section draws heavily from National Kidney and Urologic Diseases Information Clearinghouse (NKUDIC), “Treatment Methods for Kidney Failure: Kidney Transplantation,” http://kidney.niddk.nih.gov/kudiseases/pubs/pdf/transplant.pdf; and MayoClinic.com, “Kidney Transplant,” http://www.mayoclinic.com/health/kidney-transplant/my00792
13 2008 OPTN/SRTR Annual Report, Transplant Data, http://www.ustransplant.org/annual_reports/current/505_ki.htm
14 Jordan, S. C., A. A. Vo, A. Peng, M. Toyoda, and D. Tyan “Intravenous Gammaglobulin (IVIG): Clinical Use of IVIG in Kidney Transplantation,” American Journal of Transplantation, Vol. 6, No. 3, 2006, http://www.medscape.com/viewarticle/523523_2
15 Tuller, David, “Advances Expand Kidney Transplants,” The New York Times, April 27, 2009, http://www.nytimes.com/2009/04/28/health/28kidn.html, Accessed May 24, 2010
16 Organ Procurement and Transplantation Network. Kidney Transplants by Donor Type. 1988-2011 http://optn.transplant.hrsa.gov/latestData/rptStrat.asp. Accessed December 7, 2011.
17 Organ Procurement and Transplantation Network. Kidney Kaplan-Meier Graft Survival Rates For Transplants Performed: 1997-2004. http://optn.transplant.hrsa.gov/latestData/rptData.asp. Accessed December 7, 2011.
18 US Renal Data System, 2009 Annual Data Report, http://www.usrds.org/adr.htm
19 Englesbe, M.J., J.B. Dimick, Z. Fan, O. Baser, and J.D. Birkmeyer, “Case Mix, Quality, and High-Cost Kidney Transplant Patients,” American Journal of Transplantation, Vol. 9, No. 5, 2009
20 Englesbe, M.J., J.B. Dimick, Z. Fan, O. Baser, and J.D. Birkmeyer, “Case Mix, Quality, and High-Cost Kidney Transplant Patients,” American Journal of Transplantation, Vol. 9, No. 5, 2009
21 Registered nurses or “RNs” received from two to five years of training to achieve an Associate’s or Bachelor’s degree. RNs were responsible for delivering, planning, and managing care for patients in various acute or specialty areas. Licensed vocational nurses or “LVNs” trained for 18 to 36 months and worked under RN supervision to give medications, start and check IVs, take patient vital signs, update patient records, and

711-410 The UCLA Medical Center: Kidney Transplantation
28
collect blood and urine samples for testing. (http://www.ehow.com/about_4597472_what-difference-between-rn-lvn.html)
22 Institute of Medicine, Kidney Failure and the Federal Government, 1991
23 The Medicare Advantage program allowed Medicare beneficiaries to receive their benefits through private health plans, mainly health maintenance organizations (HMOs), as an alternative to the federally administered fee-for-service (FFS) Medicare program. (for additional information, see http://www.kff.org/medicare/upload/2052-13.pdf)
24 UNOS website, “History of the UNOS Database,” http://www.unos.org/data/about/history.asp
25 The Joint Commission (formerly the Joint Commission on Accreditation of Healthcare Organizations) was an independent, non-profit organization that accredited and certified US hospitals and other provider organizations.