The UAE Cement Industry Outlook: Business Opportunities ... · The UAE Cement Industry Outlook:...
17
www.bricdata.com The UAE Cement Industry Outlook: Business Opportunities and Future Growth Potential to 2016 Industry Forecast Report Reference code: CN0513MR Published: August 2012 BRICdata John Carpenter House 7 Carmelite Street London EC4Y 0BS United Kingdom Tel: +44 (0) 20 7936 6400 Fax: +44 (0) 20 7336 6813 www.bricdata.com
Transcript of The UAE Cement Industry Outlook: Business Opportunities ... · The UAE Cement Industry Outlook:...

www.bricdata.com
The UAE Cement Industry
Outlook: Business Opportunities
and Future Growth Potential to
2016
Industry Forecast Report
Reference code: CN0513MR
Published: August 2012
BRICdata
John Carpenter House
7 Carmelite Street
London EC4Y 0BS
United Kingdom
Tel: +44 (0) 20 7936 6400
Fax: +44 (0) 20 7336 6813
www.bricdata.com
TABLE OF CONTENTS
The UAE Cement Industry Outlook: Business Opportunities and Future Growth Potential to 2016 Page 2
© BRICdata. This product is licensed and is not to be photocopied Published: August 2012
1 Executive Summary
Market size and growth potential
The UAE cement industry is expected to value AEDX billion (US$X billion) in 2012, after recording an annual
growth rate of X%. The industry increased in value at a compound annual growth rate (CAGR) of X% during the
review period and is projected to grow at a CAGR of X% over the forecast period to reach AEDXX billion (US$X
billion) in 2016. The long-term prospects of the UAE cement industry are lucrative and the country is set to
become a leading provider of cement in the Middle East and North Africa (MENA) region. The UAE cement
industry is expected to reap the benefits of growing investments in infrastructure in the country, GCC and other
key foreign markets.
Cement clinker is expected to remain the largest product category in the cement industry over the forecast
period. The category accounted for XX% of cement industry sales in 2011. Portland cement and ready-mixed
concrete are the other key categories in terms of market value. These three segments together accounted for
more than XX% of the cement industry market value in 2011.
Refractory cements, mortars and concretes was noted as the fastest-growing category with a CAGR of XX%
during the review period, while factory-made mortars is projected to be the fastest-growing category over the
forecast period with an anticipated CAGR of X%.
Trends
The continued slowdown in the UAE property and construction sector continues to haunt cement companies in
the country. This led to an under utilization of capacity and a fall in prices. Production capacity is more than two
times the domestic demand and the companies are observing export markets in the MENA region. Margins are
shrinking further as operation costs soar and tight operating conditions are prompting companies to look for unfair
business practices.
The number of firms engaged in the manufacturing of products using cement and cement products trading
increased significantly during 2008−2012. However, the number of producers of cement remained stable during
the same period.
Prices of various kinds of cement were relatively stable in 2011. Prices of white cement started to slightly
increase from the third quarter of the year, while prices of Portland cement and sulfate resistance cement
demonstrated a slight downward trend in 2011.
The UAE recorded a robust growth in exports of all cement products, except for aluminous cement, during
2008−2010. Oman, Nigeria, Bahrain, Saudi Arabia, Iraq and Ghana were the key export markets for the UAE
cement market in 2010.
Growth drivers
Although the UAE residential and commercial construction market is searching for a balance due to funding being
tight and many projects being kept on hold, the country still tops the GCC real estate and construction market.
The value of the top 100 real estate and construction projects in 2011 was over US$XXX billion and the UAE
alone accounted for more than XX% of the value. The UAE exports a significant amount of the cement produced
to GCC countries and large investments in GCC’s real estate and construction sector reflect a positive outlook for
the UAE cement industry.
Abu Dhabi, the capital of the UAE, alone accounted for XX% of the total US$XX billion worth of contracts
awarded in the UAE between the first and third quarters of 2011. Abu Dhabi is expected to invest significantly on
social infrastructure, transport and utilities. The Abu Dhabi government also allocated US$X billion for an
integrated housing project on the outskirts of the capital in order to reduce imbalances within the residential
market.
Competitive landscape
The UAE cement industry is fragmented with the presence of several companies. At present, the industry has
surplus production capacity. RAK White Cement Co. is the only company offering white cement. In terms of
production capacity, Union Cement Company (UCC) stood as the market leader with a market share of X% in
2011, followed by Lafarge Emirates Cement with X%, Gulf Cement Company with X% and Sharjah Cement
Factory with X%.
TABLE OF CONTENTS
The UAE Cement Industry Outlook: Business Opportunities and Future Growth Potential to 2016 Page 3
© BRICdata. This product is licensed and is not to be photocopied Published: August 2012
TABLE OF CONTENTS
1 Executive Summary .................................................................................................................................. 2 2 Analyst Opinion and Future Outlook ...................................................................................................... 7 3 Cement Industry Market Dynamics ......................................................................................................... 8
3.1 Key Trends and Emerging Areas ................................................................................................................ 8
3.2 Imports/Exports ......................................................................................................................................... 10
3.2.1 Total cement industry................................................................................................................................ 10
3.2.2 Cement clinker .......................................................................................................................................... 11
3.2.3 Factory-made mortars............................................................................................................................... 12
3.2.4 Portland cement ........................................................................................................................................ 13
3.2.5 Refractory cements, mortars & concretes ................................................................................................ 14
3.2.6 Other hydraulic cements ........................................................................................................................... 15
3.2.7 Ready-mixed concrete .............................................................................................................................. 16
3.2.8 Prefabricated structural components ........................................................................................................ 17
4 Analysis of Market Drivers ..................................................................................................................... 18
4.1 Economic Drivers ...................................................................................................................................... 18
4.2 Business Drivers ....................................................................................................................................... 19
5 Cement Industry Opportunity and Future Potential ............................................................................ 20
5.1 Cement Industry Market Size and Forecast ............................................................................................. 20
5.2 Breakdown by Category............................................................................................................................ 23
5.2.1 Cement clinker .......................................................................................................................................... 23
5.2.2 Factory-made mortars............................................................................................................................... 25
5.2.3 Portland cement ........................................................................................................................................ 27
5.2.4 Refractory cements, mortars and concrete .............................................................................................. 29
5.2.5 Other hydraulic cements ........................................................................................................................... 31
5.2.6 Ready-mixed concrete .............................................................................................................................. 33
5.2.7 Prefabricated structural components ........................................................................................................ 35
5.3 Capacity Utilization ................................................................................................................................... 37
5.3.1 Existing capacity ....................................................................................................................................... 37
5.3.2 Capacity addition in future ........................................................................................................................ 37
6 Industry Structure and Competitive Landscape .................................................................................. 38
6.1 Industry Structure ...................................................................................................................................... 38
6.2 Major Players ............................................................................................................................................ 39
6.3 Porter Five Forces Analysis ...................................................................................................................... 40
7 Business and Operational Strategy ...................................................................................................... 42
7.1 Regulation ................................................................................................................................................. 42
7.2 Market Entry Strategy ............................................................................................................................... 42
7.3 Growth Strategy ........................................................................................................................................ 43
7.4 Operational Strategy ................................................................................................................................. 43
8 Appendix .................................................................................................................................................. 45

TABLE OF CONTENTS
The UAE Cement Industry Outlook: Business Opportunities and Future Growth Potential to 2016 Page 4
© BRICdata. This product is licensed and is not to be photocopied Published: August 2012
8.1 About BRICdata ........................................................................................................................................ 45
8.1.1 Areas of expertise ..................................................................................................................................... 45
8.2 Methodology ............................................................................................................................................. 46
8.3 Definitions ................................................................................................................................................. 47
8.4 Disclaimer ................................................................................................................................................. 48

TABLE OF CONTENTS
The UAE Cement Industry Outlook: Business Opportunities and Future Growth Potential to 2016 Page 5
© BRICdata. This product is licensed and is not to be photocopied Published: August 2012
LIST OF FIGURES
Figure 1: UAE Cement Industry Outlook, 2011–2016 .............................................................................................................................. 7 Figure 2: UAE Cement Industry Imports and Exports (AED Million), 2007–2011 ................................................................................. 10 Figure 3: UAE Cement Clinker Imports and Exports (AED Million), 2007–2011................................................................................... 11 Figure 4: UAE Factory-Made Mortars Imports and Exports (AED Million), 2007–2011 ........................................................................ 12 Figure 5: UAE Portland Cement Imports and Exports (AED Million), 2007–2011 ................................................................................ 13 Figure 6: UAE Refractory Cements, Mortars and Concrete Imports and Exports (AED Million), 2007–2011 ..................................... 14 Figure 7: UAE Other Hydraulic Cements Imports and Exports (AED Million), 2007–2011 .................................................................. 15 Figure 8: UAE Ready-Mixed Concrete Imports and Exports (AED Million), 2007–2011 ...................................................................... 16 Figure 9: UAE Prefabricated Structural Components Imports and Exports (AED Million), 2007–2011 .............................................. 17 Figure 10: UAE GDP at Constant Prices (US$ Billion), 2007–2016 ....................................................................................................... 18 Figure 11: UAE Urban and Rural Populations (%), 2007–2016 ............................................................................................................. 18 Figure 12: Split of Real Estate and Construction Projects in GCC by Country (%), 2011 ................................................................... 19 Figure 13: UAE Cement Industry Market Size by Category (AED Million), 2007–2011 ........................................................................ 21 Figure 14: UAE Cement Industry Market Size by Category (AED Million), 2012–2016 ........................................................................ 22 Figure 15: UAE Cement Industry – Cement Clinker (AED Million), 2007–2011 .................................................................................... 23 Figure 16: UAE Cement Industry – Cement Clinker (AED Million), 2012–2016 .................................................................................... 24 Figure 17: UAE Cement Industry – Factory-Made Mortars (AED Million), 2007–2011 ......................................................................... 25 Figure 18: UAE Cement Industry – Factory-Made Mortars (AED Million), 2012–2016 ......................................................................... 26 Figure 19: UAE Cement Industry – Portland Cement (AED Million), 2007–2011 .................................................................................. 27 Figure 20: UAE Cement Industry – Portland Cement (AED Million), 2012–2016 .................................................................................. 28 Figure 21: UAE Cement Industry – Refractory Cements, Mortars and Concrete (AED Million), 2007–2011 ...................................... 29 Figure 22: UAE Cement Industry – Refractory Cements, Mortars and Concrete (AED Million), 2012–2016 ...................................... 30 Figure 23: UAE Cement Industry – Other Hydraulic Cements (AED Million), 2007–2011 .................................................................... 31 Figure 24: UAE Cement Industry – Other Hydraulic Cements (AED Million), 2012–2016 .................................................................... 32 Figure 25: UAE Cement Industry – Ready-Mixed Concrete (AED Million), 2007–2011 ........................................................................ 33 Figure 26: UAE Cement Industry – Ready-Mixed Concrete (AED Million), 2012–2016 ........................................................................ 34 Figure 27: UAE Cement Industry – Prefabricated Structural Components (AED Million), 2007–2011 ............................................... 35 Figure 28: UAE Cement Industry – Prefabricated Structural Components (AED Million), 2012–2016 ............................................... 36 Figure 29: The UAE Cement Production Capacity Split by Key Companies (%), 2011 ....................................................................... 38 Figure 30: UAE Cement Industry Dynamics .......................................................................................................................................... 40

TABLE OF CONTENTS
The UAE Cement Industry Outlook: Business Opportunities and Future Growth Potential to 2016 Page 6
© BRICdata. This product is licensed and is not to be photocopied Published: August 2012
LIST OF TABLES
Table 1: Cement and Related Companies Registered with Dubai Chamber, 2008−2012 ...................................................................... 8 Table 2: Dubai Chamber Construction Material Price Index (CMPI) ....................................................................................................... 8 Table 3: UAE Cement Sub-product Exports (US$ Million), 2008−2010 ................................................................................................... 9 Table 4: UAE Cement Industry Imports and Exports (US$ Million), 2007–2011 ................................................................................... 10 Table 5: UAE Cement Industry Imports and Exports (AED Million), 2007–2011 .................................................................................. 10 Table 6: UAE Cement Clinker Imports and Exports (US$ Million), 2007–2011 ..................................................................................... 11 Table 7: UAE Cement Clinker Imports and Exports (AED Million), 2007–2011 ................................................................................... 11 Table 8: UAE Factory-Made Mortars Imports and Exports (US$ Million), 2007–2011 .......................................................................... 12 Table 9: UAE Factory-Made Mortars Imports and Exports (AED Million), 2007–2011 ......................................................................... 12 Table 10: UAE Portland Cement Imports and Exports (US$ Million), 2007–2011 ................................................................................ 13 Table 11: UAE Portland Cement Imports and Exports (AED Million), 2007–2011 ................................................................................ 13 Table 12: UAE Refractory Cements, Mortars and Concrete Imports and Exports (US$ Million), 2007–2011 ..................................... 14 Table 13: UAE Refractory Cements, Mortars and Concrete Imports and Exports (AED Million), 2007–2011 .................................... 14 Table 14: UAE Other Hydraulic Cements Imports and Exports (US$ Million), 2007–2011 .................................................................. 15 Table 15: UAE Other Hydraulic Cements Imports and Exports (AED Million), 2007–2011 .................................................................. 15 Table 16: UAE Ready-Mixed Concrete Imports and Exports (US$ Million), 2007–2011 ....................................................................... 16 Table 17: UAE Ready-Mixed Concrete Imports and Exports (AED Million), 2007–2011 ...................................................................... 16 Table 18: UAE Prefabricated Structural Components Imports and Exports (US$ Million), 2007–2011 .............................................. 17 Table 19: UAE Prefabricated Structural Components Imports and Exports (AED Million), 2007–2011 ............................................. 17 Table 20: UAE Cement Industry Market Size by Category (US$ Million), 2007–2011 .......................................................................... 20 Table 21: UAE Cement Industry Market Size by Category (AED Million), 2007–2011 .......................................................................... 20 Table 22: UAE Cement Industry Market Size by Category (US$ Million), 2012–2016 .......................................................................... 22 Table 23: UAE Cement Industry Market Size by Category (AED Million), 2012–2016 .......................................................................... 22 Table 24: UAE Cement Industry – Cement Clinker (US$ Million), 2007–2011 ...................................................................................... 23 Table 25: UAE Cement Industry – Cement Clinker (AED Million), 2007–2011 ...................................................................................... 23 Table 26: UAE Cement Industry – Cement Clinker (US$ Million), 2012–2016 ...................................................................................... 24 Table 27: UAE Cement Industry – Cement Clinker (AED Million), 2012–2016 ...................................................................................... 24 Table 28: UAE Cement Industry – Factory-Made Mortars (US$ Million), 2007–2011 ........................................................................... 25 Table 29: UAE Cement Industry – Factory-Made Mortars (AED Million), 2007–2011 ........................................................................... 25 Table 30: UAE Cement Industry – Factory-Made Mortars (US$ Million), 2012–2016 ........................................................................... 26 Table 31: UAE Cement Industry – Factory-Made Mortars (AED Million), 2012–2016 ........................................................................... 26 Table 32: UAE Cement Industry – Portland Cement (US$ Million), 2007–2011 .................................................................................... 27 Table 33: UAE Cement Industry – Portland Cement (AED Million), 2007–2011 ................................................................................... 27 Table 34: UAE Cement Industry – Portland Cement (US$ Million), 2012–2016 .................................................................................... 28 Table 35: UAE Cement Industry – Portland Cement (AED Million), 2012–2016 ................................................................................... 28 Table 36: UAE Cement Industry – Refractory Cements, Mortars and Concrete (US$ Million), 2007–2011 ........................................ 29 Table 37: UAE Cement Industry – Refractory Cements, Mortars and Concrete (AED Million), 2007–2011 ........................................ 29 Table 38: UAE Cement Industry – Refractory Cements, Mortars and Concrete (US$ Million), 2012–2016 ........................................ 30 Table 39: UAE Cement Industry – Refractory Cements, Mortars and Concrete (AED Million), 2012–2016 ........................................ 30 Table 40: UAE Cement Industry – Other Hydraulic Cements (US$ Million), 2007–2011 ...................................................................... 31 Table 41: UAE Cement Industry – Other Hydraulic Cements (AED Million), 2007–2011 ..................................................................... 31 Table 42: UAE Cement Industry – Other Hydraulic Cements (US$ Million), 2012–2016 ...................................................................... 32 Table 43: UAE Cement Industry – Other Hydraulic Cements (AED Million), 2012–2016 ..................................................................... 32 Table 44: UAE Cement Industry – Ready-Mixed Concrete (US$ Million), 2007–2011 .......................................................................... 33 Table 45: UAE Cement Industry – Ready-Mixed Concrete (AED Million), 2007–2011 .......................................................................... 33 Table 46: UAE Cement Industry – Ready-Mixed Concrete (US$ Million), 2012–2016 .......................................................................... 34 Table 47: UAE Cement Industry – Ready-Mixed Concrete (AED Million), 2012–2016 .......................................................................... 34 Table 48: UAE Cement Industry – Prefabricated Structural Components (US$ Million), 2007–2011.................................................. 35 Table 49: UAE Cement Industry – Prefabricated Structural Components (AED Million), 2007–2011 ................................................. 35 Table 50: UAE Cement Industry – Prefabricated Structural Components (US$ Million), 2012–2016.................................................. 36 Table 51: UAE Cement Industry – Prefabricated Structural Components (AED Million), 2012–2016 ................................................. 36 Table 52: UAE Cement and Related Companies Registered with Dubai Chamber, 2008−2012 .......................................................... 42 Table 53: Definitions................................................................................................................................................................................ 47

ANALYST OPINION AND FUTURE OUTLOOK
The UAE Cement Industry Outlook: Business Opportunities and Future Growth Potential to 2016 Page 7
© BRICdata. This product is licensed and is not to be photocopied Published: August 2012
2 Analyst Opinion and Future Outlook
UAE cement industry to record modest growth over the forecast period
The UAE cement industry is expected to record a modest growth over the forecast period. The industry is expected to
increase in value from AEDXX billion (US$X billion) in 2012 to AEDXX billion (US$X billion) in 2016, at a CAGR of X%
over the forecast period. This growth will be primarily driven by cement clinker, Portland cement and ready-mixed concrete
categories, which together account for over X% of the UAE’s cement industry value. Cement clinker is expected to remain
the largest product category in the cement industry over the forecast period, while factory-made mortars is projected to be
the fastest-growing category over the forecast period with an anticipated CAGR of X%.
Long-term prospects optimistic
Despite being the worst affected by the subprime mortgage crisis in the US, the UAE continues to be the second-largest
market in terms of cement production capacity in the GCC, behind Saudi Arabia. Although a number of key construction
projects were kept on hold, the country largely dominated the GCC region in terms of value of top xxx real estate and
construction projects in 2011. The long-term prospects of the UAE cement industry are lucrative and the country is set to
become a leading provider of cement in the MENA region. The UAE cement industry is expected to reap the benefits of
growing investments in infrastructure in the country, GCC and other key foreign markets.
Surplus production capacity to continue
Surplus production capacity is expected to continue to negatively impact the UAE cement industry over the forecast
period. However, the intensity is expected to lessen towards the end of forecast period as domestic demand is expected to
pick up. No significant capacity addition is expected over this period.
No sharp fall in cement prices expected over the forecast period
Cement prices are expected to be stable for the next two years and no sharp fall in prices is expected as a negative
consequence of over capacity. However, companies will struggle to declare good profits as operating costs soar and will
not be in a position to noticeably increase prices due to an expected continued slowdown in domestic demand and surplus
capacity. UAE cement companies are expected to continue their focus on exporting cement products to the MENA region.
Figure 1: UAE Cement Industry Outlook, 2011–2016
Source: BRICdata analysis © BRICdata
2011Market size 2016 Market size Growth Drivers
• Dubai and Abu
Dhabi, together, to
add 76,000 units of
residential stock in
2012-2013
• Dubai and Abu
Dhabi, together, to
add 2.6 million sq
mts of commercial
office stock in 2012-
2013
AEDx Billion
AEDx Billion
AEDx Million
AEDx Million
AEDx Million
AEDx Billion
AEDx Billion
AEDx Million
AEDx Billion
AEDx Billion
AEDx Million
AEDx Billion
AEDx Million
AEDx Million
AEDx Billion
AEDx Million
Cement
Factory-Made Mortars
Cement Clinker
Other Hydraulic
Cements
Refractory Cements,
Mortars & Concretes
Ready-Mixed
Concretes
Portland Cement
Prefabricated
structural components
CEMENT INDUSTRY MARKET DYNAMICS
The UAE Cement Industry Outlook: Business Opportunities and Future Growth Potential to 2016 Page 8
© BRICdata. This product is licensed and is not to be photocopied Published: August 2012
3 Cement Industry Market Dynamics
3.1 Imports/Exports
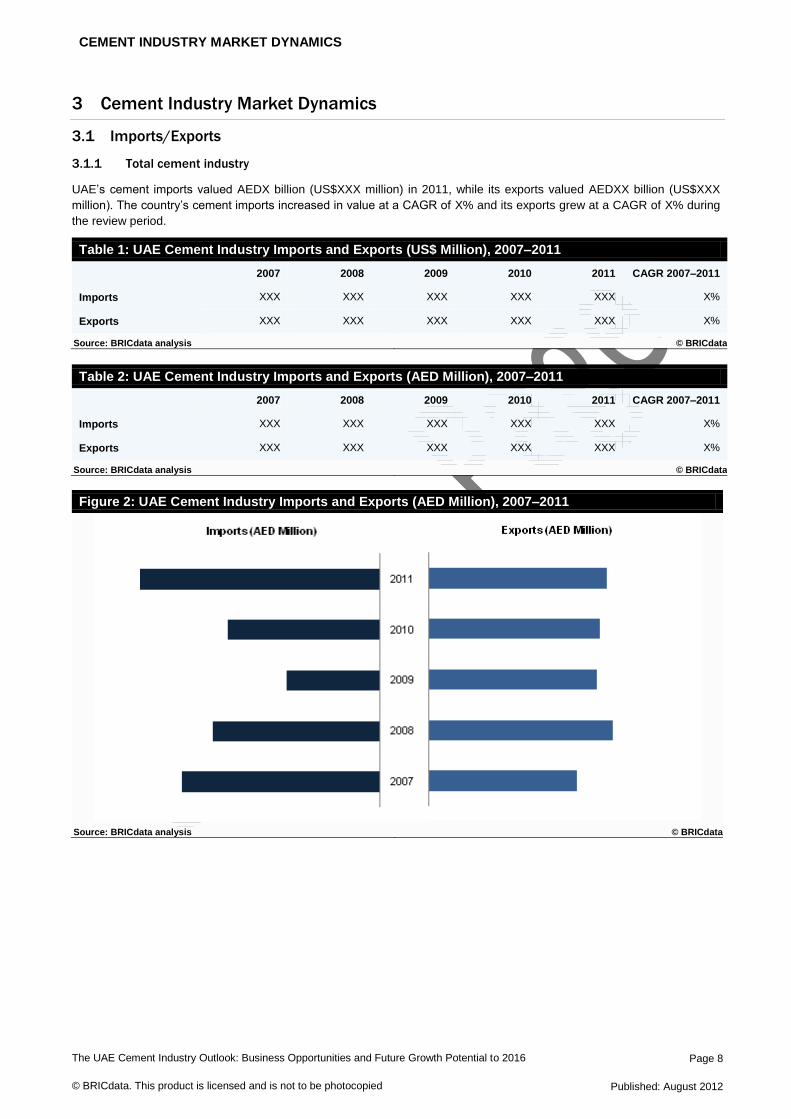
3.1.1 Total cement industry
UAE’s cement imports valued AEDX billion (US$XXX million) in 2011, while its exports valued AEDXX billion (US$XXX
million). The country’s cement imports increased in value at a CAGR of X% and its exports grew at a CAGR of X% during
the review period.
Table 1: UAE Cement Industry Imports and Exports (US$ Million), 2007–2011
2007 2008 2009 2010 2011 CAGR 2007–2011
Imports XXX XXX XXX XXX XXX X%
Exports XXX XXX XXX XXX XXX X%
Source: BRICdata analysis © BRICdata
Table 2: UAE Cement Industry Imports and Exports (AED Million), 2007–2011
2007 2008 2009 2010 2011 CAGR 2007–2011
Imports XXX XXX XXX XXX XXX X%
Exports XXX XXX XXX XXX XXX X%
Source: BRICdata analysis © BRICdata
Figure 2: UAE Cement Industry Imports and Exports (AED Million), 2007–2011
Source: BRICdata analysis © BRICdata

CEMENT INDUSTRY OPPORTUNITY AND FUTURE POTENTIAL
The UAE Cement Industry Outlook: Business Opportunities and Future Growth Potential to 2016 Page 9
© BRICdata. This product is licensed and is not to be photocopied Published: August 2012
4 Cement Industry Opportunity and Future Potential
4.1 Cement Industry Market Size and Forecast
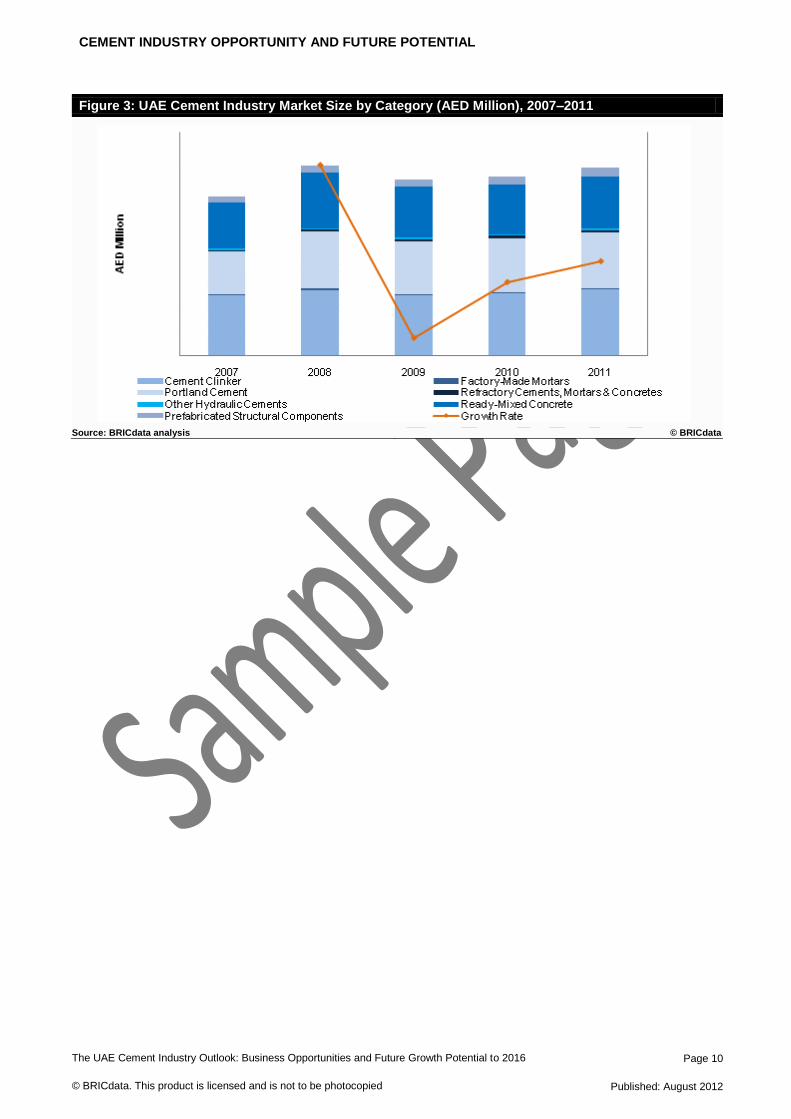
The UAE cement industry market size increased from AEDX billion (US$X billion) in 2007 to AEDXX billion (US$X2 billion)
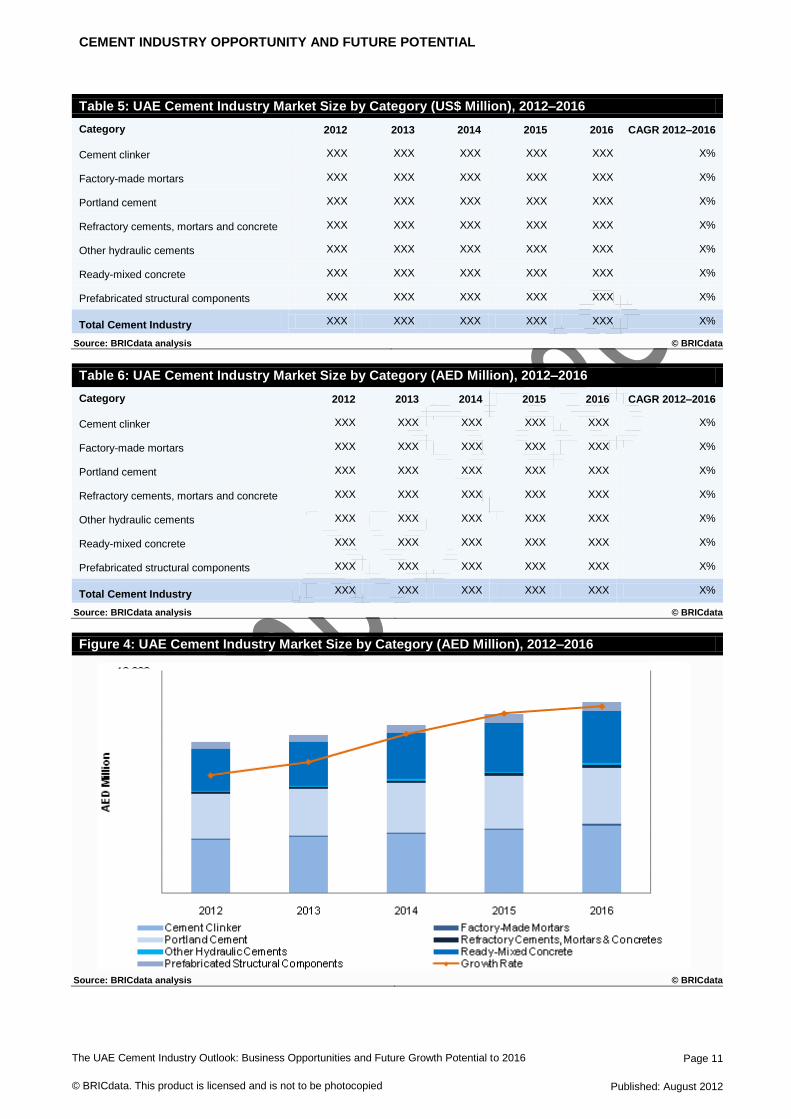
in 2011, at a CAGR of X% during the review period. Furthermore, the industry is expected to increase in value from
AEDXXbillion (US$X billion) in 2012 to AEDXX billion (US$X billion) in 2016, at a CAGR of X% over the forecast period. The long-term prospects of the UAE cement industry are lucrative and the country is set to become a leading provider of
cement in the MENA region. The UAE cement industry is expected to reap the benefits of growing investments in
infrastructure in the country, GCC and other key foreign markets.
Cement clinker is expected to remain the largest product category in the cement industry over the forecast period.
Refractory cements, mortars and concretes was noted as the fastest-growing category with a CAGR of XX% during the
review period while factory-made mortars is projected to be the fastest-growing category over the forecast period with an
anticipated CAGR of X%.
Table 3: UAE Cement Industry Market Size by Category (US$ Million), 2007–2011
Category 2007 2008 2009 2010 2011 CAGR 2007–2011
Cement clinker XXX XXX XXX XXX XXX X%
Factory-made mortars XXX XXX XXX XXX XXX X%
Portland cement XXX XXX XXX XXX XXX X%
Refractory cements, mortars and concrete XXX XXX XXX XXX XXX X%
Other hydraulic cements XXX XXX XXX XXX XXX X%
Ready-mixed concrete XXX XXX XXX XXX XXX X%
Prefabricated structural components XXX XXX XXX XXX XXX X%
Total Cement Industry XXX XXX XXX XXX XXX X%
Source: BRICdata analysis © BRICdata
Table 4: UAE Cement Industry Market Size by Category (AED Million), 2007–2011
Category 2007 2008 2009 2010 2011 CAGR 2007–2011
Cement clinker XXX XXX XXX XXX XXX X%
Factory-made mortars XXX XXX XXX XXX XXX X%
Portland cement XXX XXX XXX XXX XXX X%
Refractory cements, mortars and concretes XXX XXX XXX XXX XXX X%
Other hydraulic cements XXX XXX XXX XXX XXX X%
Ready-mixed concrete XXX XXX XXX XXX XXX X%
Prefabricated structural components XXX XXX XXX XXX XXX X%
Total Cement Industry XXX XXX XXX XXX XXX X%
Source: BRICdata analysis © BRICdata
CEMENT INDUSTRY OPPORTUNITY AND FUTURE POTENTIAL
The UAE Cement Industry Outlook: Business Opportunities and Future Growth Potential to 2016 Page 10
© BRICdata. This product is licensed and is not to be photocopied Published: August 2012
Figure 3: UAE Cement Industry Market Size by Category (AED Million), 2007–2011
Source: BRICdata analysis © BRICdata
CEMENT INDUSTRY OPPORTUNITY AND FUTURE POTENTIAL
The UAE Cement Industry Outlook: Business Opportunities and Future Growth Potential to 2016 Page 11
© BRICdata. This product is licensed and is not to be photocopied Published: August 2012
Table 5: UAE Cement Industry Market Size by Category (US$ Million), 2012–2016
Category 2012 2013 2014 2015 2016 CAGR 2012–2016
Cement clinker XXX XXX XXX XXX XXX X%
Factory-made mortars XXX XXX XXX XXX XXX X%
Portland cement XXX XXX XXX XXX XXX X%
Refractory cements, mortars and concrete XXX XXX XXX XXX XXX X%
Other hydraulic cements XXX XXX XXX XXX XXX X%
Ready-mixed concrete XXX XXX XXX XXX XXX X%
Prefabricated structural components XXX XXX XXX XXX XXX X%
Total Cement Industry XXX XXX XXX XXX XXX X%
Source: BRICdata analysis © BRICdata
Table 6: UAE Cement Industry Market Size by Category (AED Million), 2012–2016
Category 2012 2013 2014 2015 2016 CAGR 2012–2016
Cement clinker XXX XXX XXX XXX XXX X%
Factory-made mortars XXX XXX XXX XXX XXX X%
Portland cement XXX XXX XXX XXX XXX X%
Refractory cements, mortars and concrete XXX XXX XXX XXX XXX X%
Other hydraulic cements XXX XXX XXX XXX XXX X%
Ready-mixed concrete XXX XXX XXX XXX XXX X%
Prefabricated structural components XXX XXX XXX XXX XXX X%
Total Cement Industry XXX XXX XXX XXX XXX X%
Source: BRICdata analysis © BRICdata
Figure 4: UAE Cement Industry Market Size by Category (AED Million), 2012–2016
Source: BRICdata analysis © BRICdata

CEMENT INDUSTRY OPPORTUNITY AND FUTURE POTENTIAL
The UAE Cement Industry Outlook: Business Opportunities and Future Growth Potential to 2016 Page 12
© BRICdata. This product is licensed and is not to be photocopied Published: August 2012
4.2 Capacity Utilization
4.2.1 Existing capacity
The UAE cement production capacity is significantly higher than the domestic demand. At present, the country’s cement
capacity is more than xx million tons per annum while the market demand is just xx million tons. As a result, cement
producers are exporting excess production to countries in the MENA region.
The huge mismatch between supply and demand took place as the previously successful construction sector went
bankrupt in late 2008. 10 years ago, annual demand for cement was x million tons and the per capita consumption of
cement stood at xxxxkg. By 2008, per capita consumption reached its peak to xxxxkg. During the construction growth,
cement producers were able to demand higher prices as the expanding market was undersupplied. Increasing profit
margins and easily-available credit attracted companies to capitalize the opportunity by expanding production.
In 10 years, the size of the cement industry quadrupled, adding xx million tons to new cement capacity. There are
currently xx production facilities, including two xxxxxtpd lines, xx grinding plants and one dedicated clinker plant. Cement
capacity stands at xxMta and domestic clinker capacity reached xxMta. Dedicated grinding capacity is calculated at xxMta.

BUSINESS AND OPERATIONAL STRATEGY
The UAE Cement Industry Outlook: Business Opportunities and Future Growth Potential to 2016 Page 13
© BRICdata. This product is licensed and is not to be photocopied Published: August 2012
5 Industry Structure and Competitive Landscape
5.1 Industry Structure
The UAE cement industry is fragmented with the presence of several companies. At present, the industry has surplus
production capacity. RAK White Cement Co. is the only company offering white cement. In terms of production capacity,
Union Cement Company (UCC) stood as the market leader with a market share of x% in 2011, followed by Lafarge
Emirates Cement with x%, Gulf Cement Company with x% and Sharjah Cement Factory with x%.
Figure 5: The UAE Cement Production Capacity Split by Key Companies (%), 2011
Source: BRICdata analysis © BRICdata

APPENDIX
The UAE Cement Industry Outlook: Business Opportunities and Future Growth Potential to 2016 Page 14
© BRICdata. This product is licensed and is not to be photocopied Published: August 2012
6 Appendix
6.1 About BRICdata
BRICdata publishes in-depth strategic intelligence reports that help its customers better understand opportunities in
emerging markets and industry sectors. Its reports provide an independent, expert view supported by primary research
and access to leading data and intelligence sources.
BRICdata is a comprehensive source of insights and analysis, and publishes a broad range of reports across a number of
different industry sectors, including consumer, retail, financial services, technology, telecoms and construction.
BRICdata is headquartered in London with research, analysis and account management teams based across Europe, the
US and Asia-Pacific. Its global research footprint is supported by a network of external associates, data partners and
industry experts to give the clearest possible perspective on emerging markets.
6.1.1 Areas of expertise
BRICdata operates a dedicated, multilingual team of in-house industry analysts with significant experience of global and
country-level research. BRICdata also maintains data and research partnerships with other research companies, industry
experts and trade associations, along with a network of independent industry consultants and former industry participants
contributing research and reports to bring additional insight and expertise in more specialist areas.
BRICdata’s research offering spans the following industry areas:
Construction
BRICdata publishes reports covering the entire construction value chain: construction materials, equipment, construction
services, architectural services and interior design. It also covers the main value sectors of construction activity:
commercial, infrastructure, industrial, institutional and residential.
This comprehensive view of the market enables BRICdata to detail key growth sectors and countries and identify the most
attractive industry opportunities.
Consumer goods
Covering a broad range of areas across the consumer goods market, from interior products to fast-moving consumer
goods (FMCG), ingredients, and packaging, BRICdata offers a comprehensive insight into key consumer sectors across
fast-growing markets, identifying key trends, future innovations and growth opportunities.
Comprehensive data sets including unique primary survey-driven research creates accurate market forecasts and
understanding of the factors driving consumption behavior.
Financial services Providing detailed insights into insurance and banking markets, BRICdata’s financial services reports identify key market
opportunities, emerging technologies and channel strategies. The reports provide unique data combined with local
examples of best practice and expert insights into the market.
Retail BRICdata maintains a comprehensive database of forecasts of retail spending, along with a series of unique indicators
enabling a forward view of retailers’ prospects in emerging markets. The reports identify emerging concepts in retail,
including the nascent online and mobile retail sectors in the BRIC countries and other emerging markets.
Technology
BRICdata tracks key trends and innovations, emerging technologies and markets, and the key operators in both emerging
markets and technologies. Covering a range of emerging and disruptive technologies including telecoms, social media,
online and mobile retailing, and telemedicine, BRICdata examines strategies for success, the state of the competitive
landscape and the inherent threats and opportunities in the emerging technological economy.
APPENDIX
The UAE Cement Industry Outlook: Business Opportunities and Future Growth Potential to 2016 Page 15
© BRICdata. This product is licensed and is not to be photocopied Published: August 2012
6.2 Methodology
All BRICdata reports are rigorously sourced and created according to a comprehensive, two-stage methodology. This
includes internal audit and primary research.
A) Internal audit
Review of in-house databases to gather existing data:
o Historic market databases and reports
o Company database
o projects database
B) Primary research
Review of the latest company strategy and asset management trends
1) Research
A. Sources
Collection of the latest market-specific data from a wide variety of industry sources:
o Government statistics
o Industry associations
o Company filings
o Broker reports
o International organizations
B. Expert opinion
Collation of opinion taken from leading industry experts
Analysis of third-party opinion and forecasts:
o Broker reports
o Industry associations
o Official government sources
C. Data consolidation and verification
Consolidation of data and opinion to create historical datasets
Creation of models to benchmark data across sectors and geographies
2) Research Analysis
Market forecasts
Feed of forecast data into market models:
o Macroeconomic indicators
o Industry-specific drivers
Analysis of Market Databases to identify trends by sector:
o Latest trends
o Key drivers of the market
3) Report Writing
Analysis of market data
Discussion of company and industry trends and issues
Integration of survey results
Annual review of trends
Standardization of market definitions using recognized industry classifications

APPENDIX
The UAE Cement Industry Outlook: Business Opportunities and Future Growth Potential to 2016 Page 16
© BRICdata. This product is licensed and is not to be photocopied Published: August 2012
4) Quality Control
A. Templates
Detailed process manuals
Standardized report templates and accompanying style guides
Complex forecasting tool used to ensure forecast methodologies are consistently applied
QC checklists
B. QC process
Peer review
Senior-level QC
Random spot checks on data integrity
Benchmark checks across databases
Market data cross-checked for consistency with accumulated data from company filings
6.3 Definitions
Table 7: Definitions
Terms Definition
Cement clinker
A type of concrete and cement which is generally in the form of lumps or granules between 2mm and 30mm in size. For reporting purposes, cement clinker of any size is categorized under this category.
Factory-made mortars
Any type of mortar that is produced within the factory rather than on construction sites is assessed under this category. Depending on countries and regions, various types of mortars are produced within this category.
Portland cement
The most common type of cement category used in the construction industry. For reporting purposes, any variant of Portland cement is included in this category, ignoring the differences in constituents and standards.
Refractory cements, mortars and concretes
Includes refractory cements, refractory mortars and refractory concretes in any compositions. Refractory plastics, ramming mixes and gunning mixes are also included within this category. Any kind of carbonaceous pastes are excluded from this category.
Other hydraulic cements
Any type of cement within the hydraulic category, with the exception of Portland cements, is categorized under other hydraulic cements.
Ready-mixed concrete
A type of concrete that is prepared in the factory rather than the construction sites. Compositions of ready-mixed concrete can vary according to requirements and locations.
Prefabricated structural components Includes all ready-to-use construction components made up of cements, concretes or stones.
Source: BRICdata analysis © BRICdata
For the purposes of this report, the following timeframes apply:
Review period: 2007–2011
Forecast period: 2012–2016
All data is collected in local currency. To avoid distortions due to currency fluctuations, all conversions into US dollars of
current, historical and forecast data are made with a yearly average exchange rate. All values in tables, with the
exception of compound annual growth rates (CAGR), are displayed to one decimal place. Growth rates may, therefore,
appear inconsistent with absolute values due to this rounding method.

APPENDIX
The UAE Cement Industry Outlook: Business Opportunities and Future Growth Potential to 2016 Page 17
© BRICdata. This product is licensed and is not to be photocopied Published: August 2012
6.4 Disclaimer
All rights reserved.
No part of this publication may be reproduced, stored in a retrieval system or transmitted in any form by any means,
electronic, mechanical, photocopying, recording or otherwise, without the prior permission of the publisher, BRICdata.
The facts of this report are believed to be correct at the time of publication but cannot be guaranteed. Please note that the
findings, conclusions and recommendations that BRICdata delivers will be based on information gathered in good faith
from both primary and secondary sources, whose accuracy BRICdata is not always in a position to guarantee. BRICdata
can, therefore, accept no liability whatsoever for actions taken based on any information that may subsequently prove to
be incorrect.