THE TREATMENT OF THE RISK/RETURN TRADE- · PDF fileTHE TREATMENT OF THE RISK/RETURN TRADE-OFF...
27
THE TREATMENT OF THE RISK/RETURN TRADE-OFF IN THE VALUATION OF SUBDIVISION DEVELOPMENT LAND USING ADJUSTED DISCOUNTED CASHFLOW METHODOLOGY EVAN GAMBY & PAUL BENDALL Massey University & ANZ Banking Group (New Zealand) Ltd ABSTRACT The total return required to compensate an investor for undertaking land development involves risk/return trade-off analysis. The problem is that in the absence of a volume of comparable sales, existing methods-- particularly the hypothetical subdivisional budget formula method or hyposub-- concentrate on the determination of residual land value, utilising subjectively derived single figure profit and risk and/or discount rates. The investor/developer determines price based on expected return, both total and equity; whereas the valuer frequently attempts to determine price based on a pro forma hypothetical analysis utilising a predetermined unproven profit and risk or discount rate. The authors have used case study analysis of land subdivisions to highlight the potential inappropriateness of the hypothetical subdivisional budget formula method for subdivision analysis. Similarly, discount rates assumed by valuers for DCF analysis do not accurately model the risk/return trade-off as it is adopted by valuers on a rule-of-thumb basis. The authors postulate that a DCF model incorporating scenario analysis should provide more useful results for investors, valuers and financiers. DCF should better reflect the perceived risk exposure at various stages of the development process. Multiple scenario analysis forms the basis of risk assessment and focuses attention back on the risk adjusted return being the driving determinant of land value. Key Words: Discounted cash flow, land development, subdivision, hypothetical subdivisional budget formula, risk/return trade-off, scenario analysis, heuristics.
Transcript of THE TREATMENT OF THE RISK/RETURN TRADE- · PDF fileTHE TREATMENT OF THE RISK/RETURN TRADE-OFF...

THE TREATMENT OF THE RISK/RETURN TRADE-OFFIN THE VALUATION OF SUBDIVISION DEVELOPMENT LAND
USING ADJUSTED DISCOUNTED CASHFLOW METHODOLOGY
EVAN GAMBY & PAUL BENDALLMassey University & ANZ Banking Group (New Zealand) Ltd
ABSTRACT
The total return required to compensate an investor for undertaking land development
involves risk/return trade-off analysis. The problem is that in the absence of a volume of
comparable sales, existing methods-- particularly the hypothetical subdivisional budget
formula method or hyposub-- concentrate on the determination of residual land value,
utilising subjectively derived single figure profit and risk and/or discount rates. The
investor/developer determines price based on expected return, both total and equity;
whereas the valuer frequently attempts to determine price based on a pro forma
hypothetical analysis utilising a predetermined unproven profit and risk or discount rate.
The authors have used case study analysis of land subdivisions to highlight the potential
inappropriateness of the hypothetical subdivisional budget formula method for subdivision
analysis. Similarly, discount rates assumed by valuers for DCF analysis do not accurately
model the risk/return trade-off as it is adopted by valuers on a rule-of-thumb basis. The
authors postulate that a DCF model incorporating scenario analysis should provide more
useful results for investors, valuers and financiers. DCF should better reflect the
perceived risk exposure at various stages of the development process. Multiple scenario
analysis forms the basis of risk assessment and focuses attention back on the risk adjusted
return being the driving determinant of land value.
Key Words:Discounted cash flow, land development, subdivision, hypothetical subdivisional budget
formula, risk/return trade-off, scenario analysis, heuristics.

2
INTRODUCTIONThis paper concentrates on the practical problems that arise in the determination of value
for subdivision land where there is little evidence of comparable sales transactions. The
principles of valuation and investor decision making (Jefferies) (Rost & Collins) (Court
precedent) recognise a hierarchy of evidence being the determination of value by direct
comparison with sales, followed by hypothetical methodology as being traditionally the
hypothetical budget subdivisional budget formula (hyposub), and since the 1970’s
Discounted Cash Flow (DCF) analysis. Investors, financiers, and valuers are forced to
make decisions on price where there is little or no comparable sales evidence. Inexorably
this decision process involves the hyposub and DCF methods. Research of case law,
arbitrations, and valuations proposed for lending purposes has identified that the profit and
risk allowance under the hyposub and the discount rate for DCF analysis are invariably
heurisitically derived, unsupported by an analysis of market transactions. Valuers and
lenders have traditionally focussed on the residual value arising from the hypothetical
process.
The development of land is recognised as a high risk activity subject to an unpredictable
outcome. Unlike income producing property, the subdivision of land is a manufacturing
business with no income during the manufacturing process and no residual asset value. The
subdivision of land involves the production of sites that have a sale value when subdivided
that are non income producing to the developer. The profit derived from the process is
dependent on maximising price, minimising costs and meeting market expectations of
absorption. Investors expect a high return as a reward for an unpredictable outcome. The
hyposub method is a static exercise incorporating a profit to the developer and a return for
the opportunity cost of alternative funds investment. The profit for risk is variously treated
as a residual or as a return on the total cost outlay. The hyposub method is unable to cope
with potential variability in return, as it does not reflect the timing of cash flows for a
development that may take many years to complete, and involves a very substantial capital
outlay for which no return is received until sales transactions have been completed.
It is accepted that the hyposub is appropriate for a small, single stage subdivision, with
development and sales completed over a short time frame. Even under this limited time

3
and cost scenario there are substantial risks if market conditions change, sales do not
eventuate as predicted and holding costs balloon out.
Financiers/lenders focus on the risk/return trade-off. Conversely, developers do not
necessarily carry out detailed analysis, often relying on judgement and simplified
calculations. This may be a function of the unpredictability of the returns, with outcomes
strongly influenced by market events over which a developer has no control.
In the context of land subdivision in New Zealand it was observed that successful
developers may hold, develop and sell land in a manner that reflects the unpredictability of
the market. A number of the more successful developers hold land for substantial periods
of time. The significance of holding land over prolonged periods of time (land banking),
affects the risk/return trade-off prediction differently for such developers. Apart from pre-
commitment to expenditure on design, consultation with experts, and authority approvals;
this could transpire to be either the low or high risk phase of the subdivision process,
dependent on market conditions that can be either adverse or beneficial to a developer.
The holding period risk is invariability ignored in the traditional hyposub exercise,
although it can be adjusted for by a separate calculation for the land component at the end
of the exercise-- a quasi-DCF exercise. DCF can mirror market expectations by allocating
a separate discount rate return to the holding period.
Modifications to the hyposub approach such as split profit and risk/interest calculations
and staged calculations have been attempted by practitioners to overcome methodological
deficiencies. However, all modifications suffer from the disadvantage of attempting to deal
with the time value of money (TVM) without addressing the deficiencies inherent in the
static hyposub model methodology.
This study attempts to highlight deficiencies in existing hyposub methodology by
comparing the analysis of nine residential subdivisions as case studies using both methods.
The results are inconclusive, but form the basis of future research of a more sophisticated
nature. It is suggested that the preliminary findings are not an unexpected outcome because
the study focuses on the anticipated results of Total Capital TC rather than on a developer’s
equity gearing model. Four of the nine subdivisions were also analysed on post sales
results, presented as simple derived profit and risk returns and derived discount rates.

4
Expectations and actual results were widely disparate. They suggest that reliance on the
hyposub approach in isolation would be unwise. “Valuer logic” suggests that there is likely
to be a closer correlation using the actual results analysed under DCF rather than hyposub.
An important component of any property decision is a qualitative assessment, where risk is
assessed on a judgement or “gut feel” basis. This is often the primary approach utilised by
developer investors, relying more on judgement that on quantitative analysis.
Scenario analysis was selected as the approach to adjust for risk, completed on a single
variable basis, indicating which individual variable in the selection provides the greatest
source of risk under both hyposub and DCF. The magnitude of this change was measured
by standard deviation; variance; the co-efficient of variation; and the risk index, all
identified as acceptable measures of risk. The rate of sale was the most prominent
variable, identified under DCF, but partially masked under the hyposub basis as it allows
for only half of the extended period and hence its impact is not as great.
The final part of the analysis exercise was to compare the return ranking and the risk
ranking to get an overall picture of the risk/return profile. One method was to adopt a
“scoring approach”, where DCF was expected to provide a more accurate guide to
predicting the risk/return trade-off. On the Total Capital TC basis there was no significant
variation.
A second method involved a comparison of the risk/return trade-off graphically through a
scatter graph by plotting return (IRR or profit and risk rate) on the Y axis and risk (co-
efficient of variation) on the X axis. The purpose of that approach was to determine if
additional risk on a subdivision could be compensated for by way of a higher return. The
trend line should be upward sloping from left to right to demonstrate that return increases
as risk increases, with the R2 value being the numerical representation of the slope of the
trend line. A result of “1.0” would indicate perfect correlation. DCF indicated a weak
relationship at around 0.103. The hyposub indicated almost zero correlation, 0.0098. It
was noted that by removing just one notable result being subdivision “B” these results
could be brought into line. Subdivision “B” is notable because it is an outlier under either
methodology.

5
LITERATURE REVIEW
The difficulty in predicting return on residential subdivisions may lie in the valuation
methodology, invariably undertaken by valuers on a Total Capital TC basis, which is not in
line with the demands of the market and takes its guidance from legal precedent (Bendall).
Most subdivisions are undertaken on a limited developer equity/borrowing basis. Valuers
assume problems away. Market value of Total Capital TC is treated as the central issue
whereas in practice market value is not the central issue (Pyhrr et al). Lenders and
developers are more interested in the expected return or profit generated from the capital
investment or the equity committed to the project. To achieve this outcome there must be
an assessment of risk and return, a determination that is assumed away by valuers, without
undertaking a detailed analysis of the market. There is no evidence that valuers undertake
an assessment of the return on equity that an investor would require, either by an analysis
of market transactions or by comparison with alternative investments.
Legal precedent in both Australia and New Zealand confirms that a prudent subdivider
should be compensated for risk by way of an adequate profit margin, usually referred to as
a “profit and risk” allowance under the hyposub method in the event that comparable sales
evidence is inconclusive as a method of determining value.
It is axiomatic for the purpose of determining land value, that analysis and the adoption of
hyposub or DCF methodology is only required in the event that there is insufficient
comparable market evidence to determine value. However, comparable sales evidence
does not address the anticipated risk/return of the developer contemplating a land
subdivision as it completely disregards future market variables and, by definition, sales
evidence which is historic for an asset characterised by heterogeneity. The variables that
are of particular interest would include, in addition to the land purchase price; the
anticipated gross realisation from sales; the rate of sales (absorption); growth expectations;
construction costs and the holding period time frame. It is therefore essential that a robust
methodology is presented by a property adviser to enable both a developer and a financier
to determine the risks inherent in a subdivision proposal, as well as the suitability of the
property development project for both investing and lending. It is accepted that most
subdivision developers are heavily dependent on a high (over 50%) debt to equity ratio.
The risk/return trade-off is therefore of great importance.

6
The history of case law in New Zealand, taken over a forty year time period, traverses the
adoption of the hyposub method. Notable cases in New Zealand having been settled
predominantly in the 1960s. Case law cautioned the use of specific profit and risk
allowances in the hyposub method (Green & McCahill 1965) (Barwick, 1968).
Nevertheless a range of 25 percent – 30 percent has tended to be the adopted norm, with
little analysis justification. In addition, under the hyposub method the developer is entitled
to interest as a reasonable return on capital in addition to the profits on the development
(Prestige Homes Corporation 1968).
Although DCF analysis has been used from 1977, the Courts have been reluctant to adopt
it as a method. It was held to be merely a sophisticated way of setting out the hyposub
calculations, relied on the same assumptions and could only be as accurate as those which
it makes. (Neill Construction Limited 1977).
Further reluctance to adopt DCF emerged as recently as 1993, where the Courts in
Australia held that basing a value on projections was dangerous without allowing a wide
margin of error by means of a heavy discount factor. In that case, the plaintiff’s valuer
adopted a discount rate of 25 percent, without analysis or support, the likely cause of the
rejection as opposed to a deficiency in the methodology. However, the judgement
highlighted the potential for a wide variance in values if assumptions are changed. This
highlights the requirement for risk measurement. A soundly based DCF with
accompanying risk analysis provides the most accurate guide to value and hence risk and
return (Bendall).
A further refinement in the determination of profit and risk involved discounting the land
value over the holding period (Tauhara Properties Limited v The Minister of Works &
Development, 1969). This, however, is a quasi-DCF approach to account for land held
prior to subdivision.
DCF has been an integral component of subdivision appraisal in the United States of
America since the 1980’s but the application of what might be considered “correct
methodology” has been the subject of debate, with no apparent agreement between
practitioners. Financiers consider the valuation of subdivisions based on the evaluations of
discounted cash flows (Munson, October 1994). The valuation of undeveloped land
7
requires a reconciliation of methods (Guntermann, Spring 1994). There is a requirement to
bridge theory and practice (Owens, July 1998). There is an acceptance that speculative
subdivision valuations for loan purposes required a reconsideration of methodology and
the adoption of DCF, notwithstanding that this is not necessarily the approach adopted by
developers (Ditchkus & Baidasz, July 1996).
Notwithstanding the above references historically, there have been few publications that
deal with the methods to be adopted in the determination of appropriate discount rates.
Articles stress that the discount rate or profit return should be derived from the market but
with little evidence or reference to applied case study analysis (Owens), (Ditchkus and
Biadasz). Publications tend to be historically focussed and rely on the hyposub or gross
realisation method of assessments – (Jefferies), (Rost & Robins). Methods of undertaking
subdivision analysis for valuation appear from time to time on the Web. (Heron, Todd
White) (Appraisal.bertrodgers). They outline a simplified hyposub methodology adopting
a “retired developer’s profitable/margin”.
With respect to market acceptance of DCF methodology, recent arbitration decisions are
apposite. (North Shore City Council v Landco Long Bay Limited (2002)) and (Auckland
Regional Council v Landco Long Bay Limited (2002)). These hearings are private
determinations and are therefore essentially confidential documents. However, the results
were publicised in the press. The methods adopted for determining value were not
publicised as they were of little interest other than to the valuer experts. DCF featured
prominently in the determination of value, with all four valuers adopting DCF as their
primary method of calculation, supported to a lesser degree by the hyposub method and
with only passing reference to comparable sales transactions. Significantly, a capital asset
pricing model (CAPM) was utilised by one economist, disregarded by the arbitrator as a
method that could be utilised with any degree of reliance. No other reference to CAPM for
subdivision analysis has been identified as being reliable in publicised research. The
application of CAPM is dismissed as a reliable basis for determining the risk/return trade-
off. (Bendall).
The DCF model outlined is based on the work of Gamby and Bendall and reflects the
outcome of research based on the expectations of developers, with regard to nine future
subdivisions and four of the same subdivisions analysed on their resultant outcomes.

8
RESEARCH METHODS
The determination of methodolgy for research of this nature might follow the pattern of
social research (Crotty 1998). The aim of research is objectivity, validity and
generalisability. Inevitably, quantitative research and analysis of subdivisions under a post
positivist framework will not uncover all there is to be known about the subject, not the
least being the motivations and aspirations of developers. Hypothesis verification or
falsification under a positivist or post positivist framework is only the beginning of the
process of understanding (Guba and Lincoln 1994). Subdivision analysis in practice
embraces the epistemological objectivist and subjectivist dimensions. There is an observed
reliance on hyposub and DCF analysis to satisfy the valuer/financier relationship but little
importance is placed on that process by developers. (Owens 1998).
For subdivisions it is impossible to address research and analysis in terms of the scientific
method of enquiry advocated by post positivist adherents. The analyst/researcher cannot
control or hold constant extraneous variables in any market sense (Dunnette 1990).
Conversely, it is likely that case study research would add significantly to an understanding
of developers aspirations and motivations principally through interviews, and theory
building through triangulation (Eisenhardt 1989).
This research study concentrates almost exclusively on the quantitative comparisons of
Hyposub and DCF methods, but it inescapable that there may be as much or more to be
learnt through qualitative research. Two papers sourced for this study have identified that
developers may place little or no reliance on DCF methodology in the purchasing process
(Owens 1998 p7) and (Ditchkus and Biadasz). Alternatively, after the purchaser decision
has been made Hyposub and DCF exercises are performed, by valuers and financiers to
satisfy debt borrowings. This raises the issues of “rule-of-thumb” methods and
heuristically derived values by developers.
An example of heuristics in the New Zealand context is the one-third profit/one-third
cost/one-third land price rule, the price per hectare of raw land being anecdotally one third
of the estimated gross realisation of the subdivided sites after deducting Goods and
Services Tax (GST).

9
A more intriguing heuristic has evolved from the value of a raw land per acre being equal
to the average sale price of a section in the proposed subdivision. This has been modified
by a conversion to hectares, (multiplier of 2.4699), an adjustment for higher densities
under modern subdivision practice (division by 0.8) and the removal of the GST
component from the section sale price. (Borich).
DATA COLLECTION AND RESEARCH METHOD PROCESS
The hyposub approach is also known as the residual approach. It has as its goal the
determination of the price a prudent developer would pay for a block of subdivisible land
(Bendall). There are variations in method, but they have a common theme, being the
determination of raw land price.
The raw land product value is determined by assessing the gross realisation or the
collective value of the sites, being an aggregation of potential land prices for individual
allotments from which development costs, selling expenses and legal costs are deducted,
and an allowance is made for profit and risk (Rost & Collins, 1978), (Jefferies, 1990). This
approach dates back to at least the early 1970s in Australia (Murray, 1973), in New
Zealand since the late 1950’s (Urban Valuation in New Zealand, 1959) and the USA since
the early 1950’s (Guntermann 1994).
The method advocates that after deduction of profit to include an allowance for risk, plus
all development costs, the residual “value” is the amount a developer could afford to pay
for the land. Key variables are the gross realisation for all the sites, profit and risk
allowances, and subdivision costs.
Data collection for the purpose of modelling and analysis involves a determination of the
price paid for the block of land, a static value/cost expectation of key variables, and from
there the determination of the expected profit and risk allowance. A second procedure
involves the reverse-- on completion of the subdivision process. When all sales, costs and
the length of the time frame over which the subdivision was developed from purchase to
last sale are known, the unknown factor being the derived profit and risk allowance.

10
The gross realisation is the total of section sale prices based upon the expectation of the
developer or analyst at the time of land purchase, not the expectation at a later date (Rost &
Collins, 1978). However, the issue should also be addressed in reverse on completion and
sale to assess whether or not expectations were realised. Analysis indicates that there is a
marked discrepancy between expectation and realisation.
The same data were utilised for the purpose of DCF analysis, adopting both a single and
multiple discount rate not unlike the process referred to by US writers (Guntermann 1993).
No attempt has been made in this study to consider the weighted IRR selection process
involving debt/equity ratios (Munson 1994). This approach is an area of further study.
(Bendall).
In the context of the subject paper, a single discount rate refers to a discount rate for all
cash flows from the time of land purchase through to the date of last sale, allocating costs
and revenues on a monthly basis where they fall. A multiple discount rate refers to the
adoption of a land investor holding cost discount rate applied to the period prior to
subdivision activity, equivalent to a WACC and a discount rate derived for all costs and
revenue allocated to the month of payment or receipt. This discount rate is applied over
the full term of the development from land purchase to last sale. Exercises were completed
on an expectation basis. For the purpose of comparative analysis, a full equity position was
adopted in this study, noting that this does not mirror the approach of many developers
who rely on extensive debt funding. A Total CapitalTC approach was considered as an
initial study to minimise inequalities that might otherwise have arisen between an analysis
of the two methods.
Data were analysed utilising the model developed, scenario analysis completed and the
research results compared using ranking of return, a qualitative assessment, scenario
analysis on a single variable, and a risk/return profile by Bendall/Gamby scoring and
regression analysis.
The hyposub calculation, relying on a point in time assessment, was expected to give rise
to potentially greater variations in results as the develop/sell time frame extends and the
number of stages in the subdivision increases. The profit and risk allowance was expected
to be influenced by the holding period time frame. These predicted inadequacies can be

11
summed up in the perceived inability of the hyposub method to deal with the TVM
concept, noting that the key variables for each of the hyposub and DCF analysis are the
same at the static level.
Rate of return analysis is recognised as a superior approach because it models investor
behaviour and thinking (Pyrrh et al, 1989). Inevitably, the hyposub method is an historic
approach, focusing on value from the perspective of historic returns, linked to current
market data.
DCF DISCUSSION
The investor, the valuer and the financier should be focusing on the expected return for the
capital invested. DCF is forward looking. It requires a greater focus on the time frame over
which the investment in subdivision land is held, developed and ultimately sold. The
historical and existing market position, while of interest, are not paramount to the
investment decision (Bendall). Capital investment decisions are made on the basis of
future benefits which are yet to be realised, or are a function of expected return (Jones,
1994). Value should be derived by simulating market activity and forecasting behaviour of
profitable purchases (Boyd, 1995).
The difference in basic theory of DCF is that the TVM concept presumes four essential
elements:
1. Initial cash flow(s).
2. Expected future cash flow(s).
3. Period of time between initial investment and future inflow(s).
4. A discount rate that reflects uncertainty/risk.
(Bendall)
Because all of the four elements are present in residential subdivisions, an analysis of
expectations utilising DCF is considered to be the ideal approach to determine the discount
rate. The net present value (NPV) of a project is the sum of its discounted future cash
flows, expressed in the formula:

12
n
ttr
At0 1
Where:
At = The project cash flow at time t
n = number of periods
r = Discount rate
The NPV decision rule is simple:
NPV > 0 = Accept
NPV = 0 = Indifferent
NPV < 0 = Reject
One criticism of the DCF approach applied to income producing property is that a
significant portion of NPV is derived from terminal value (Jefferies, 1995). This criticism
cannot be applied to DCF analysis for subdivisions that are manufacture oriented,
involving the discounting of all cash flows with a zero terminal value, assuming that all
stock is sold and no surplus land is held for disposal.
DCF is frequently criticised for the number of variables required in the model, any number
of which are subject to uncertainty. It is therefore important, if not critical, that the
discount rate(s) is/are determined from known sales where sufficient information is
available for a full analysis. This approach is confirmed (Toxward 1993), (Magree 1995),
(Boyd 1995) and (Jefferies 1995). Scenario analysis enables a consideration of both the
discount rate and a determination of key variables most likely to suffer uncertainty. The
analysed discount rate therefore forms a basis for determining the value of like subdivision
land in the same market with broadly similar characteristics.
It has long been accepted that the discount rate must reflect a required return for the asset
being assessed, the required return comprising three components in the Fisher model:

13
(a) Loss of liquidity.
(b) Return for anticipated inflation.
(c) Lost premium.
where R = L + I + P (Fisher, 1930), accepted by Pyhrr et al (1989), Wurtzbbach & Miles
(1994) and Miles et al (1996).
It is also widely acknowledged that risk is derived from the potential variance in income
and that the discount rate is concluded from:
R = Rf + Rp, where
R = the discount rate
Rf = a risk free rate of return (incorporating the L + I portion of the Fisher model)
Rp = risk premium
There are other criticisms of DCF methodology. Subdivisions are an example of DCF
where cash flows remain negative for a period of time. The adoption of a discount rate for
the investor holding period and a derived market discount rate over the develop/sell period
minimises the effect of negative cash flows. This partially overcomes the argument that it
is not realistic to assume a “borrowing rate” that is higher or lower than the prevailing
market rate.
CAPITAL ASSET PRICING MODEL (CAPM)
CAPM states that the expected return on an asset is equal to the risk free rate plus a market
risk premium. The capital asset pricing model (CAPM) has been attempted in
subdivisional analysis unsuccessfully (ARC v Landco, 2002). In modern portfolio theory it
is assumed that non-systematic risk can be diversified away and therefore the investor
should not receive a return for this component; but this is clearly inappropriate for a
residential subdivision, which is a stand alone one-off project with a high component of
non-systematic risk. CAPM is considered to have no demonstrable practical application
for determining discount rates for residential subdivisions, as no satisfactory market
determinants have been identified.

14
DISCUSSION OF RESEARCH RESULTS
Four measures of risk have been identified, variance and standard deviation being
statistical measures of dispersion around a mean and co-efficient of variation and risk
index, being measures of risk in relation to profitability. The greater the standard of
deviation or variance, the greater the risk. The co-efficient of variation and the risk index
are measures of a project’s risk absorption capacity. A co-efficient of variation and a risk
index are believed to be the better measures of risk, as they consider risk in relation to
return. Standard deviation or variance used in isolation could marginalise profitable
projects, despite returns being commensurate with risk. Conversely, a low risk project may
be accepted, despite having an unacceptably low profit margin.
The research study involved nine actual subdivisions for which sufficient data was
available for expectation analysis. Substantial risk/issues were faced by some developers,
including amalgamation of sites, delay in resource (planning) consent, substantial holding
period costs prior to construction, variations in sale programmes, multiple stages, and
reasonably extensive periods of absorption. Not all of these risks were known or identified
by the developers. For two of the subdivisions later analysed on actual results, sharp
changes in the market gave rise to widely divergent returns.
It might have been expected that though these subdivisions included actual market sales
transactions for the land, the returns derived would be within generally accepted market
parameters for a subdivision risk profile. Market return expectations are generally between
20 percent and 40 percent on both the DCF and hyposub approach. Generally, the lower
the risk the lower the return and vice versa. (Bendall). The intention was to determine
whether analysed returns fall within industry expectations and compare the hyposub and
the DCF methodology. Purchase price data is set out below as Table 1.ผิด พ ล าด! ไ มใ ชก า ร เ ชื่อ ม โ ย ง ที่ถูก ตอ ง
The returns analysed from each subdivision are summarised in Table 2.
ผิด พ ล าด! ไ มใ ชก า ร เ ชื่อ ม โ ย ง ที่ถูก ตอ ง
The hyposub calculations were completed in accordance with the methodology outlined by
Jefferies (1990). Separate analyses using a discounted investor land holding period cost

15
was completed for four subdivisions on completion but is not incorporated in the data.
DCF was undertaken on a single discount rate basis. The data incorporates only return on
Total CapitalTC (or full equity) for both DCF and hyposub. It is recognised that further
analysis should involve a return on equity with alternative debt/equity ratios, it being
common for substantial debt to apply in the subdivision development market.
On analysis the actual results after subdivision completion showed a greater dispersion of
discount/profit and risk rates. This data analysed for four of the subdivisions have not been
incorporated in the study. It is outside the scope of this paper. The volatility of returns is a
clear indication that high returns must be assumed to protect a developer against the
inevitability of high risk development.
Ranking or Return
The first attempt was to rank the return, with no attempt to measure risk. This ranking
under each approach is prepared from Table 2 as Table 3.ผิด พ ล าด! ไ มใ ชก า ร เ ชื่อ ม โ ย ง ที่ถูก ตอ ง
On a pure return basis, subdivision (B) would be selected first. Under DCFTC the order of
preference is: B, I ,G ,F, A, H, E, D, C.
On a pure hyposub basis (B) would also be selected first and the order of preference is
different being: B, E, A, H, G, I, F, C, D.
In isolation, this approach provides no risk analysis on the case study subdivisions.
Analysis of Risk – Qualitative Assessment
Utilising “valuer’s logic”, an attempt was made to assess the returns having regard to size
of the development, the development period, readiness for subdivision (ability to obtain a
planning consent with relative ease), and sale time frame.
Human judgement indicates that given the range of subdivisions, the most likely to be
ranked as desirable are (B) and (G). A true qualitative approach would have utilised case

16
study survey techniques to a greater extent, to uncover reasons that might influence key
variables, such as the impact on the planning decision process. The study was limited by
the lack of resources to undertake this task.
Quantitative Approaches
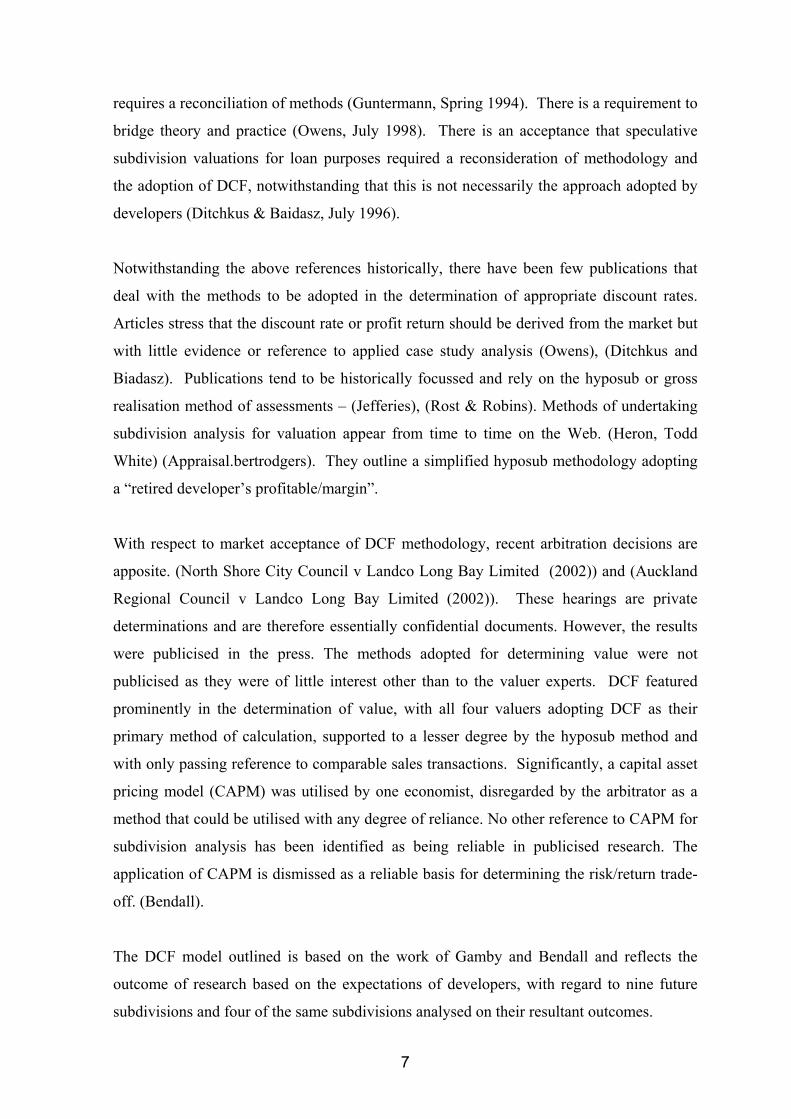
This involved scenario analysis as the approach to adjust for risk, completed on a single
variable basis. The results show both the impact of risk on return and the individual
variables providing the greatest sources of risk. This detail is set out in Table 4.
Variables chosen were changes to the gross realisation, rate of sale, construction costs and
holding period (i.e. period before development commences). The indicated value is
indicated for each variable, with the percentage value reduction from the purchase price
shown immediately below. The most prominent variable is generally the rate of sale. A
distinction was identified between DCF and the hyposub method, which allows for only
half the extended period and hence the impact was not as great.
The range and the returns from the expected outcome is the quantum of risk. Table 5 ranks
the individual projects by risk under each risk measure, with the riskiest project first and
the least risky project last. The results show a consistency in terms of the risk measure and
its application to the DCF and hyposub.
IRRTC
OverallPRTC IRRTC
OverallPRTC IRRTC
OverallPRTC IRRTC
OverallPRTC IRRTC
OverallPRTC IRRTC
OverallPRTC IRRTC
OverallPRTC IRRTC
OverallPRTC IRRTC
OverallPRTC
Expected 26.10% 48.19% 46.66% 101.95% 10.47% 16.76% 14.63% 12.49% 24.68% 48.44% 27.30% 18.57% 30.86% 29.69% 24.78% 30.38% 34.73% 20.16%Gross Realisation (-5%) 24.03% 40.74% 43.74% 91.76% 7.48% 10.79% 11.02% 6.82% 21.82% 40.93% 22.27% 12.61% 27.25% 23.15% 22.35% 23.81% 27.83% 14.13%Rate of Sale (-1 pcm) 22.34% 42.69% 24.69% 50.32% 5.47% -1.19% 8.50% 10.00% 13.63% 24.39% 24.49% 16.68% 24.43% 24.12% 22.28% 24.93% 22.62% 14.56%Construction Cost (+5%) 25.59% 45.21% 44.90% 94.71% 8.46% 12.62% 12.98% 9.70% 23.18% 44.03% 24.35% 14.88% 29.51% 26.65% 23.90% 27.47% 32.42% 17.84%Holding Period (+6 mths) 22.70% 44.36% 40.95% 96.26% 9.60% 13.99% 12.01% 9.74% 24.68% 44.92% 22.85% 15.94% 25.41% 26.64% 22.06% 27.06% 24.51% 17.57%
Average IRR 24.15% 44.24% 40.19% 87.00% 8.30% 10.59% 11.83% 9.75% 21.60% 40.54% 24.25% 15.74% 27.49% 26.05% 23.07% 26.73% 28.42% 16.85%Variance 0.03% 0.08% 0.79% 4.34% 0.04% 0.48% 0.05% 0.04% 0.21% 0.89% 0.04% 0.05% 0.07% 0.07% 0.01% 0.06% 0.26% 0.06%Standard Deviation 0.0168 0.0279 0.0891 0.2084 0.0194 0.0694 0.0229 0.0201 0.0461 0.0942 0.0195 0.0221 0.0270 0.0255 0.0120 0.0254 0.0513 0.0250
CV 6.43% 5.80% 19.09% 20.44% 18.56% 41.40% 15.64% 16.09% 18.68% 19.44% 7.15% 11.88% 8.75% 8.60% 4.85% 8.35% 14.76% 12.42%RI 15.55 17.25 5.24 4.89 5.39 2.42 6.39 6.21 5.35 5.14 13.98 8.42 11.42 11.62 20.62 11.97 6.78 8.05
Average IRR DCF HSGross Realisation (-5%) 23.09% 29.42%Rate of Sale (-1 pcm) 18.72% 22.94%Construction Cost (+5%) 25.03% 32.57%Holding Period (+6 mths) 22.75% 32.94%
A B C DTABLE 4
F G H IE

17
Table 5 shows that the hyposub approach analysis produced different results from DCF. It
was expected that DCF would be more stable and a more reliable means of predicting risk
and return for residential subdivisions, despite the hyposub method showing it can handle
risk as accurately as DCF. This result is not particularly apparent from an analysis of the
data at the Total CapitalTC level.
The co-efficient of variation is deemed to be the best measure, as it is independent of scale
and measures risk in relation to profitability, which has to be a key test. Accordingly, it
can be used as a method for comparison with projects of varying size.
A comparison has been made between the qualitative or subjective risk ranking with the
quantitative or objective risk ranking under variance and co-efficient of variation. The
results are included as Table 6.ผิด พ ล าด! ไ มใ ชก า ร เ ชื่อ ม โ ยง ที่ถูก ตอ ง
Analysis of risk and return combined.
Two approaches were considered, being the Bendall/Gamby scoring approach, and
regression analysis.
Scoring Approach
DCFB 0.79% B 0.0891 B 19.09% H 20.62I 0.26% I 0.0513 E 18.68% A 15.55E 0.21% E 0.0461 C 18.56% F 13.98G 0.07% G 0.0270 D 15.64% G 11.42D 0.05% D 0.0229 I 14.76% I 6.78F 0.04% F 0.0195 G 8.75% D 6.39C 0.04% C 0.0194 F 7.15% C 5.39A 0.03% A 0.0168 A 6.43% E 5.35H 0.01% H 0.0120 H 4.85% B 5.24
Hypothe tical Subdivis ion
B 4.34% B 0.2084 C 41.40% A 17.25E 0.89% E 0.0942 E 19.44% H 11.97C 0.48% C 0.0694 B 19.09% G 11.62A 0.08% A 0.0279 D 16.09% F 8.42G 0.07% G 0.0255 I 12.42% I 8.05H 0.06% H 0.0254 F 11.88% D 6.21I 0.06% I 0.0250 G 8.60% E 5.14
D 0.04% D 0.0201 H 8.35% B 4.89F 0.05% F 0.0221 A 5.80% C 2.42
RIRisk Ranking
Variance Standard Deviation CV
TABLE 5

18
One approach is to assign values to the risk ranking in relation to its return ranking. If the
return is zero, then the return adequately compensates for risk in relation to the other
projects available. The further the ranking is from zero then risk is either over or under-
compensated. Using the rankings approach, B would have a ranking of zero because risk
and return are ranked the same. G, on the other hand, would have the ranking of minus 3,
suggesting that return over-compensates for risk in relation to the other projects. E has a
ranking of plus 5, indicating that return does not adequately compensate for risk. The full
ranking is included as Table 7.
This is a very simple analysis and it shows the risk/return predicted when several projects
are being compared. The scoring approach showed no measurable difference between
risk/return prediction capability for DCF than for hyposub. The range produced on the
DCF was 9 whereas on the hyposub it was 8 suggesting that there is no apparent difference
in their variance. In a perfect scenario, all projects would achieve a score of zero,
indicating that their risk/return profiles are perfectly matched when compared with other
projects.
Regression Analysis
The second method to compare the risk/return trade-off is graphically -- through a scatter
graph -- plotting return (IRR or profit and risk rate) on the Y axis, and risk (co-efficient of
variation) on the X axis. A trend line has been added to the analysis using regression to
determine the relationship between risk and return. For DCF the trend is upwards, sloping
from left to right to demonstrate that return increases as risk increases. An R2 value has
been calculated at 0.103. The relationship is not strong. The same approach has been
applied to the hyposub exercise, showing a greater weakness in this approach for analysing
the risk/return profile for residential subdivisions. The results indicate an almost zero
Return Risk Return RiskB 0 B -2I -3 E 0
G -3 A -6F -3 H -4A -3 G -2H -3 I 1E 5 C 6D 4 F 2C 6 D 5
Range 9 8Var 15.25 15.75
DCF HSTABLE 7

19
correlation with an R2 value of 0.0098, indicating that there is virtually no relationship
between risk and return under the hyposub method. From this study it is hypothesised that
there may be greater validity in the DCF as a means of predicting risk and return for
residential subdivisions.
Lenders are vitally interested in actual results modelled to reflect predicted risk exposure.
Further studies should be completed on an IRRequity and Profit and Riskequity basis to
address situations where analysis of this type is likely to be required.
That the results of this research study are inconclusive may be a function of expectations
being within a “norm”. What was analysed to occur was what was expected to occur. A
comparison with actual results would have been of benefit, that compared the risk/return
trade-off for both DCF and Hyposub exercises under both expected and actual subdivision
results.
A preliminary analysis of actual results showed that sharp changes in the market as a result
of market timing of section sales gave rise to dramatic positive change in return,
irrespective of whichever method was adopted. Negative influences were the absorption
rate of section sales and subdivision delays.
CONCLUSION - RESEARCH OPPORTUNITIES AND LIMITATIONS
The Courts both in New Zealand and Australia have set a clear precedent that any prudent
developer needs to be compensated for risk by way of a high return and that this
compensation is a major determinant of land value (Bendall).
Case law recognised the applicability of DCF but had not been satisfied that it can be
correctly applied and has traditionally preferred the hyposub method and the selection of a
profit and risk allowance. Although the Courts have rejected DCF, recent decisions
indicate an acceptance of DCF as a methodology but with a greater degree of analysis
required. Recent decisions on land purchase have strongly favoured DCF analysis. The
flaws of the hyposub method are being progressively recognised by quasi-DCF “add-ons”
to the hyposub approach, in an effort to compensate for its deficiencies.

20
The adoption of a multi-period and dual discount model would demonstrate that DCF is
capable of handling virtually any cash flow situation and is a more elegant approach to a
highly speculative investment decision involving the unpredictability of key variables.
Criticisms of DCF are considered to be invalid, as the basic key variable data is identical
for the hyposub and DCF approaches. The hyposub is essentially a static model which does
not adequately reflect TVM and is historically focused rather than predictive.
Residential subdivision land markets are highly imperfect, with very little information
flow. Analysis within a relatively constrained geographical location can produce wide-
ranging discount rates and profit and risk rates that are more apparent from an analysis of
subdivisions on completion. The combination of investor/valuer/financier judgement
applied to detailed analysis in accordance with DCF is considered to be significantly
superior to arbitrarily selected discount rates and profit and risk rates, particularly when
scenario analysis is applied to the results and the risks identified.
Neither risk nor return can be viewed in isolation. To obtain an accurate picture, they must
be viewed together as the risk/return trade-off. A scoring system and regression analysis,
was hypothesised to be the superior tool for predicting the risk/return trade-off for
residential subdivisions. Further studies are required in this area to determine whether
these preliminary non-conclusive results are replicated or rejected.
Further investigation would be fruitful in the areas of probabilistic modelling for risk
analysis, focusing on the ability of the real estate decision-maker and analyst to accurately
predict likely outcomes and assign probability weightings to those outcomes. This work
was considered to be outside the scope of this paper.
Inevitably, the major limitation of this exercise is the limited population size for case study
analysis. Comprehensive data on residential subdivisions in a confined geographical
location and within a relatively constrained time frame are extremely difficult to locate
with sufficient accuracy in order to complete quantitative analysis.

21
Rigorous testing of the above approaches in other markets may well yield dissimilar
results. Conversely, the intuitive limitations of the hyposub method may be confirmed,
given its obvious flaws and limitations in handling TVM for staged developments.
An investigation of investor activity and expectations on a qualitative basis were not a part
of the paper. However, preliminary discussions with investor developers reveal that most
who have stayed the test of time have adopted a “win-lose” philosophy, with the
unpredictability of separating the potential winners from the potential losers. Preliminary
discussions indicate a strong reliance by investor developers on “gut-feel”, a collaborative
decision-making process and reliance on “rule-of-thumb” (heuristic) calculations.
Extensive qualitative analysis using survey techniques would enable greater use of
triangulation to determine the predictability of future returns.

22
BIBLIOGRAPHY
Akerson, C.B. (1976). The Internal Rate of Return in Real Estate Investments. American
Society of Real Estate Counsel, Research paper. 1976
Bendall, P.G (2002) An Investigation Into The Use Of Discounted Cash Flow Techniques For
Predicting The Risk/Return Trade-off For Residential Subdivisions A Dissertation, Master of
Property Studies Lincoln University New Zealand
Borich, S (2003) Unreported.
Boyd, T.P. (1995). DCFs: What, Why, When, How…But. The Valuer and Land Economist,
August 1995, 589-592.
Copeland, T.E. & Weston, J.F. (1988). Objects of Choice: Mean-Variance Uncertainty. In
T.E. Copeland & J.F. Weston, Financial Theory and Corporate Policy, 3rd ed. USA: Addison
Wesley Publishing Company Inc.
Crotty, M. (1998). Introduction: The Research Process. The Foundations of Social Research.
St Lenoards 2065, Australia: Allen & Unwin Pty Ltd.
Ditchkus, L. & Biadasz, S. (1996) Rethinking Speculative Subdivision Valuation For Loan
Purposes. Appraisal Journal, July 1996 v64 n3 p263(10)
In Dunette, M.D. (ed) (1990) Research Design: Meaning, Purpose and Principles. Handbook
of Industrial and Organisational Psychology 2nd Ed, Palo Alto, CA: Consulting Psychologists
Press.
Eisenhardt, K.M. (1989) Building Theories from Case Study Research, Academy of
Management Review. 1989, Vol. 14. No. 4, p 532-550.
Guntermann, K.L. (1994) The Valuation Of Undeveloped Land: A Reconciliation of Methods
American Journal of Real Estate Research 1994, Vol.9 No. 2, 169-177.

23
Guba, G. and Lincoln, Y. (1994). Competing Paradigms on Qualitative Research, Handbook of
Qualitative Research, (pp. 105-117). Thousand Oaks, CA: Sage Publications.
Jefferies, R.L. (1995). Discounted Cashflow Valuations – Pitfalls, Standards & Solutions:
Proceedings of the first International Real Estate Society Conference, Stockholm, Sweden, 28
June – 1 July, 1995.
Jones, C.P. (1994). A Background for Understanding Investment. In C.P. Jones, Investments,
4th ed. USA: John Wiley & Sons Inc.
Locke, Stuart M (1990). Choice of Interest Rate in Income Valuations. New Zealand Valuers
Journal, Dec 1990, 9-13.
Locke, Stuart M (1990). Property Investment Analysis Using Adjusted Present Values, The
Appraisal Journal, July 1990, 373-378.
Magree, D. (1995). DCF Analysis: A Reporting Format. The Valuer and Land Economist,
August 1995, 593-596.
Munson, C.(1994) Lender Residential Subdivision Evaluation Using Discounted Cash Flow
Analysis. , The Appraisal Journal Oct 1994 v62 n4 572(8)
Owen, R.W. (1998) Subdivision Development: Bridging Theory And Practice. . Appraisal
Journal, July 1998 v66 n3 p274(8)
Phyrr, Cooper, Wofford, Kapplin & Lapides (1989). Overview of the Investment Decision
Process. In Phyrr, Cooper, Wofford, Kapplin & Lapides, Real Estate Investment Strategy
Analysis Decisions, 2nd ed.
Phyrr, Cooper, Wofford, Kapplin & Lapides (1989). Decision-Making Approaches to Real
Estate Investment. In Phyrr, Cooper, Wofford, Kapplin & Lapides, Real Estate Investment
Strategy Analysis Decisions, 2nd ed.

24
Phyrr, Cooper, Wofford, Kapplin & Lapides (1989). Preliminary Financial Feasibility
Analysis. In Phyrr, Cooper, Wofford, Kapplin & Lapides, Real Estate Investment Strategy
Analysis Decisions, 2nd ed.
Phyrr, Cooper, Wofford, Kapplin & Lapides (1989). Discounted Cash- Flow and Ratio
Analysis. In Phyrr, Cooper, Wofford, Kapplin & Lapides, Real Estate Investment Strategy
Analysis Decisions, 2nd ed.
Phyrr, Cooper, Wofford, Kapplin & Lapides (1989). Risk Analysis and Risk Management:
Single Projects. In Phyrr, Cooper, Wofford, Kapplin & Lapides, Real Estate Investment
Strategy Analysis Decisions, 2nd ed.
Robinson, J.R.W. (1989). Cash Flows and Risk Analysis. In J.R.W. Robinson, Property
Valuation and Investment Analysis: A Cash Flow Approach. Sydney: The Law Book Co.
Robinson, J.R.W. (1989). The Mathematics of Capitalisation and Discounted Cash Flow. In
J.R.W. Robinson, Property Valuation and Investment Analysis: A Cash Flow Approach.
Sydney: The Law Book Co.
Rost, R.O. & Collins, H.G. (1978). Valuation of Land Suitable for Subdivision. In R.O. Rost
and H.G. Collins, Land Valuation and Compensation in Australia. Australia: Robert Burton
Printers PTY. LTD.
Rowland, P.J. (1993). Assessing the Risks of Property Investment. In P.J. Rowland, Property
Investments and Their Financing. Sydney: The Law Book Co.
Seitz, N. & Ellison, M. (1995). Alternate Measures of Capital Investment Desirability. In N.
Seitz & M. Ellison, Capital Budgeting and Long Term Financial Decisions, 2nd ed. USA: The
Dryden Press.
Shapiro, A.C. (1991). Other Dimensions To Capital Budgeting. In A.C. Shapiro, Modern
Corporate Finance. Republic of Singapore: Macmillan Publishing Company.

25
Sliwoski (1991). Understanding the IRR Used In Commercial Real Estate Transactions, The
Appraisal Journal,16(1), 43-45.
Toxward, W.F. (1993). An Explanation of Discounted Cash Flows, Their Use in the Valuation
and Investment Process and Selected Case Studies. AIVLE Resaerch Notes, Issue 9, 1-8.
Whipple, R.T.M. (1995). Introductory Financial Analysis. In R.T.M. Whipple, Property
Valuation and Analysis. Sydney: The Law Book Co.
Wurtzebach, C.H. & Miles, M. (1994). The Discounted Cash Flow Model. In C.H.
Wurtzebach & M. Miles, Modern Real Estate. USA: John Wiley and Sons Inc.

26
LEGAL CASES
Auckland Regional Council v Landco Long Bay Limited, June 2003, (Unreported)
Crown v L.M. Murray N.Z.V., Vol. 16, No. 3, Sept. 1958, p.34
D.F. Barwick and Others v The City of Gisborne N.Z.V., Vol. 20, No. 5, Mar. 1968, p.250
De Menech v Lower Hutt City L.V.C.B. 444, N.Z.V., Vol 18., No. 2, jun. 1962, p.73
Lower Hutt City Corporation v Dyke [1954] N.Z.L.R. 166; L.V.C.B. 165; N.Z.V., Vol. 11,
No. 4, Dec. 1953, p.9.
M.A.C. Thomson v The Levin Borough Council N.Z.V., Vol. 17, No. 4, Dec. 1954, p.154
Marshall v Minister of Works [1950] N.Z.L.R. 339; L.V.C.B. 127; N.Z.V., Vol. 8, No. 3, Sept.
1950, p.95
Minister of Works v Green & McCahill (Contractors) Ltd [1965] N.Z.L.R. 580; L.V.C.B. 384;
N.Z.V., Vol. 19, No. 6, Jun. 1965, p.226
Montgomery Investments Ltd v The Minister of Works L.V.C.B. 453; N.Z.V., Vol, 18, No. 3,
Sept. 1962, p.112
Neil Construction Ltd v City of Manukau N.Z.V., Vol. 23, No. 8, Dec. 1977, p.426
North Shore City Council v Landco Long Bay Limited, Dec. 2002, (Unreported)
N.H. Cook v The Queen L.V.C.B. 436; N.Z.V., Vol. 17, No. 2, Jun. 1959, p.70
Prestige Homes Corporation Ltd v The Minister of Works N.Z.V., Vol. 20, no. 8, Dec. 1968,
p.383

27
Re Objections: The Himatangi Beach Company Limited v The Valuer general N.Z.V., Vol. 11,
No.2, Jun. 1953, p.13
Re Whareroa 2E Block Maori Trustee v Ministry of Works [1959] N.Z.L.R. 7; (1957)
N.Z.L.R. 284; L.V.C.B. 272; N.Z.V., Vol.17, No.2, Jun 1959, p.45; and Vol.15, No.2, Jun.
1957, p.5
R.J. De Cleene v The Minister of Works N.Z.V., Vol. 18, No. 3, Sept. 1962, p.110
Tauhara Properties Ltd v The Minister of Works and Development N.Z.V., Vol. 24, No. 4,
Dec. 1969, p.283
Turner and Another v Minister of Public Instruction [1956] 95 C.L.R. 245