The Travel & Tourism Competitiveness Report 2009
525
The Travel & Tourism Competitiveness Report 2009 Managing in a Time of Turbulence Jennifer Blanke, World Economic Forum Thea Chiesa, World Economic Forum Editors World Economic Forum Geneva, Switzerland 2009 The Travel & Tourism Competitiveness Report 2009 © 2009 World Economic Forum
Transcript of The Travel & Tourism Competitiveness Report 2009

The Travel & TourismCompetitiveness Report 2009Managing in a Time of Turbulence
Jennifer Blanke, World Economic Forum
Thea Chiesa, World Economic Forum
Editors
World Economic ForumGeneva, Switzerland 2009
part1.r2 2/26/09 11:58 AM Page i
The Travel & Tourism Competitiveness Report 2009 © 2009 World Economic Forum

The Travel & Tourism CompetitivenessReport 2009 is published by the WorldEconomic Forum within the framework of theGlobal Competitiveness Network and theIndustry Partnership Programme for Aviation,Travel and Tourism.
Professor Klaus Schwab, Executive Chairman
EDITORS
Jennifer Blanke, Director, Senior Economist, Head of Global Competitiveness Network
Thea Chiesa, Associate Director, Head of Aviation, Travel and Tourism
GLOBAL COMPETITIVENESS NETWORK
Fiona Paua, Senior Director, Head of Strategic Insight Teams
Ciara Browne, Senior Community ManagerAgustina Ciocia, Community ManagerMargareta Drzeniek Hanouz, Director, Senior EconomistThierry Geiger, Economist, Global Leadership FellowIrene Mia, Director, Senior EconomistPearl Samandari, Team CoordinatorEva Trujillo Herrera, Research Assistant
We thank Hope Steele for her superb editingwork and Ha Nguyen for her excellent graph-ic design and layout.
The terms country and nation as used in this report do not in all cases refer to a territorial entity that is a state as understoodby international law and practice. The terms cover well-defined, geographically self-contained economic areas that may not be states but for which statistical data are maintained on a separate and independent basis.
World Economic ForumGeneva
Copyright © 2009by the World Economic Forum
Published by World Economic Forumwww.weforum.org
All rights reserved. No part of this publicationmay be reproduced, stored in a retrieval sys-tem, or transmitted, in any form or by anymeans, electronic, mechanical, photocopying,or otherwise without the prior permission ofthe World Economic Forum.
ISBN-13: 978-92-95044-18-0
part1.r2 2/26/09 11:58 AM Page ii
The Travel & Tourism Competitiveness Report 2009 © 2009 World Economic Forum

Contents
Partner Institutes v
Preface xiby Klaus Schwab, World Economic Forum
Executive Summary xiiiby Jennifer Blanke and Thea Chiesa, World Economic Forum
Part 1: Selected Issues of T&T Competitiveness 1
1.1 The Travel & Tourism Competitiveness Index 2009: 3Measuring Sectoral Drivers in a Downturnby Jennifer Blanke, Thea Chiesa, and Eva Trujillo Herrera, World Economic Forum
1.2 Endangered Growth: How the Price of Oil 39Challenges International Travel & Tourism Growthby Jürgen Ringbeck, Amit Gautam, and Timm Pietsch, Booz & Company
1.3 The Importance of Public-Private Partnership 49in the Current Downturnby Amir Girgis and Ufi Ibrahim, World Travel & Tourism Council (WTTC)
1.4 How Well Does the Travel & Tourism 55Competitiveness Index Explain Differences in Travel Intensity Among Countries?by Selim Ach and Brian Pearce, International Air TransportAssociation (IATA)
1.5 Capturing the Visitor Economy: 65A Framework for Successby Alex Kyriakidis, Heather Hancock, Simon Oaten, and Rashid Bashir, Deloitte
1.6 Tourism Price Competitiveness 77by Peter Forsyth, Monash University, and Larry Dwyer, University of New South Wales
1.7 National Competitiveness Council: 91Setting Up the Egyptian Travel & Tourism Competitiveness Councilby Ashraf Ibrahim, Egyptian Travel & Tourism Competitiveness Council (T&TCC) and Heba Ali Zayed, Egyptian National Competitiveness Council (ENCC)
1.8 Navigating Yet Another Perfect Storm: 97The Promise of Sustainable Travel & Tourismby Thea Chiesa, World Economic Forum
1.9 Strengthening the Travel & Tourism 107Competitiveness Indexby Geoffrey Lipman and John Kester, United Nations World Travel Organization (UNWTO)
Part 2: Country/Economy Profiles and Data 109Presentation
2.1 Country/Economy Profiles 111How to Read the Country/Economy Profiles .............................113List of Countries/Economies......................................................115Country/Economy Profiles..........................................................116
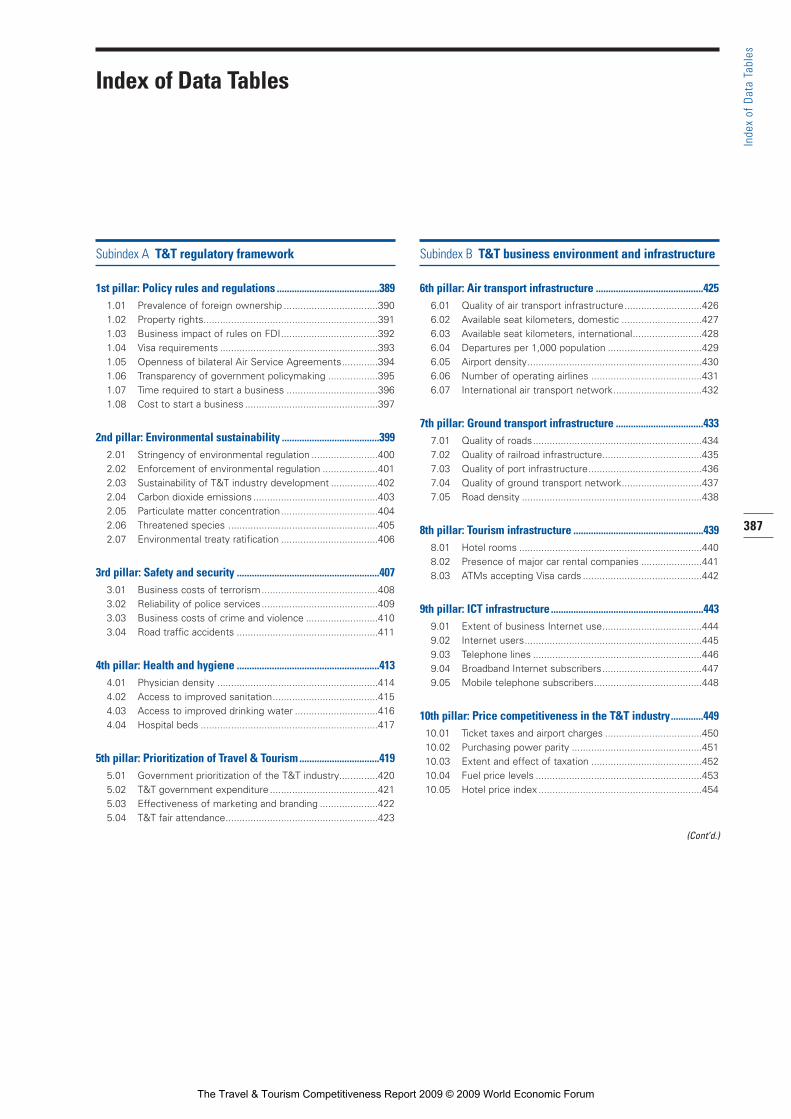
2.2 Data Tables 383How to Read the Data Tables ....................................................385Index of Data Tables...................................................................387Data Tables.................................................................................389
Technical Notes and Sources 483
About the Authors 489
Acknowledgments 493
iii
part1.r2 2/26/09 11:58 AM Page iii
The Travel & Tourism Competitiveness Report 2009 © 2009 World Economic Forum

part1.r2 2/26/09 11:58 AM Page iv
The Travel & Tourism Competitiveness Report 2009 © 2009 World Economic Forum

The World Economic Forum’s Global CompetitivenessNetwork is pleased to acknowledge and thank the following organizations as our valued Partner Institutes,without whom the realization of the Travel & TourismCompetitiveness Report 2009 would not have been feasible:
Albania
Institute for Contemporary Studies (ISB)Artan Hoxha, PresidentElira Jorgoni, Senior Expert and Project ManagerDenalada Kuzumi, Researcher
Algeria
Centre de Recherche en Economie Appliquée pour le Développement (CREAD)
Youcef Benabdallah, Assistant ProfessorYassine Ferfera, Director
Argentina
IAE—Universidad AustralMaría Elina Gigaglia, Project ManagerEduardo Luis Fracchia, Professor
Armenia
Economy and Values Research CenterManuk Hergnyan, ChairmanSevak Hovhannisyan, Board Member and Senior AssociateGohar Malumyan, Research Associate
Australia
Australian Industry GroupNicholas James, EconomistTony Pensabene, Associate Director, Economics & ResearchHeather Ridout, Chief Executive
Austria
Austrian Institute of Economic Research (WIFO)Karl Aiginger, DirectorGerhard Schwarz, Coordinator, Survey Department
Azerbaijan
Azerbaijan Marketing SocietyFuad Aliyev, Executive DirectorAshraf Hajiyev, Project CoordinatorSaida Talibova, Consultant
Bahrain
Bahrain Competitiveness Council, Bahrain Economic Development Board
Nada Azmi, Business Intelligence Specialist, Research Services Unit
Jawad Habib, Senior Partner, BDO Jawad HabibRima Al Kilani, Director, International Marketing
Bangladesh
Centre for Policy Dialogue (CPD)Khondaker Golam Moazzem, Senior Research FellowKazi Mahmudur Rahman, Senior Research AssociateMustafizur Rahman, Executive Director
Barbados
Arthur Lewis Institute for Social and Economic Studies, University of West Indies (UWI)
Andrew Downes, Director
Belgium
Vlerick Leuven Gent Management SchoolLutgart Van den Berghe, Professor, Executive Director
and Chairman, Competence Centre Entrepreneurship,Governance and Strategy
Bieke Dewulf, Associate, Competence Centre Entrepreneurship,Governance and Strategy
Wim Moesen, Professor
Benin
Micro Impacts of Macroeconomic Adjustment Policies (MIMAP)Benin
Epiphane Adjovi, Business CoordinatorMaria-Odile Attanasso, Deputy CoordinatorFructueux Deguenonvo, Researcher
Bosnia and Herzegovina
MIT Center, School of Economics and Business in Sarajevo,University of Sarajevo
Zlatko LagumdÏija, ProfessorZeljko Sain, Executive DirectorJasmina Selimovic, Assistant Director
Botswana
Botswana National Productivity CentreDabilani Buthali, Manager, Information and Research Services
DepartmentThembo Lebang, Executive DirectorOmphemetse David Matlhape, Research Consultant
Brazil
Fundação Dom CabralMarina Araújo, ResearcherCarlos Arruda, Professor and Coordinator of Competitiveness
and Innovation CenterJuan Rios, Research Assistant
Movimento Brasil Competitivo (MBC)Cláudio Leite Gastal, Director PresidentLucas Tadeu Melo Câmara, Director
Brunei Darussalam
Ministry of Industry and Primary ResourcesPehin Dato Dr. Hj Ahmad Hj Jumat, MinisterDato Paduka Hj Hamdillah Hj Abd Wahab, Deputy MinisterDato Paduka Hamid Hj Mohd Jaafar, Permanent Secretary
Bulgaria
Center for Economic DevelopmentAnelia Damianova, Senior Expert
Burkina Faso
Société d’Etudes et de Recherche Formation pour leDéveloppement (SERF)
Abdoulaye Tarnagda, Director General
Burundi
University Research Centre for Economic and Social Development (CURDES), National University of Burundi
Richard Ndereyahaga, Head of CURDESGilbert Niyongabo, Dean, Faculty of Economics & Management
v
Part
ner
Inst
itute
s
Partner Institutes
part1.r2 2/26/09 11:58 AM Page v
The Travel & Tourism Competitiveness Report 2009 © 2009 World Economic Forum

Cambodia
Economic Institute of CambodiaSok Hach, DirectorTuy Chak Riya, Research AssociateHang Sambopisith, Researcher
Cameroon
Comité de Compétitivité (Competitiveness Committee)Lucien Sanzouango, Permanent Secretary
Canada
Institute for Competitiveness and ProsperityLance Bialas, ResearcherRoger Martin, Chairman and Dean of the Rotman School
of Management, University of TorontoJames Milway, Executive Director
Chad
Groupe de Recherches Alternatives et de Monitoring du Projet Pétrole-Tchad-Cameroun (GRAMP-TC)
Antoine Doudjidingao, ResearcherGilbert Maoundonodji, DirectorCeline Nénodji Mbaipeur, Program Officer
Chile
Universidad Adolfo IbáñezIgnacio Briones, Associate Professor of Economics,
School of GovernmentLeonidas Montes, Dean, School of Government
China
Institute of Economic System and ManagementNational Development and Reform CommissionZhou Haichun, Deputy Director and ProfessorChen Wei, Research FellowDong Ying, Professor
China Center for Economic Statistics Research, Tianjin Universityof Finance and Economics
Lu Dong, ProfessorXiao Hongye, ProfessorJian Wang, Associate ProfessorBojuan Zhao, ProfessorHuazhang Zheng, Associate Professor
Colombia
National Planning DepartmentOrlando Gracia Fajardo, Entrepreneurial Development DirectorCarolina Rentería Rodríguez, General DirectorMauricio Torres Velásquez, Advisor
Côte d’Ivoire
Chambre de Commerce et d’Industrie de Côte d’IvoireMamadou Sarr, General Director
Croatia
National Competitiveness CouncilMartina Hatlak, Research AssistantMira Lenardic, General Secretary
Cyprus
European University CyprusBambos Papageorgiou, Head of Socioeconomic and
Academic Research
The Cyprus Development BankMaria Markidou-Georgiadou, Manager, International
Banking Services Unit and Business Development
Czech Republic
CMC Graduate School of BusinessDagmar Glückaufová, Academic DeanFilip Hrnãífi, President
Denmark
Copenhagen Business School, Department of InternationalEconomics and Management
Lise Peitersen, Administrative DirectorOle Risager, Professor
Ecuador
Escuela de Postgrado en Administración de Empresas (ESPAE)Escuela Superior Politécnica del Litoral (ESPOL)Elizabeth Arteaga, Project AssistantVirginia Lasio, Acting DirectorSara Wong, Professor
Egypt
The Egyptian Center for Economic StudiesHanaa Kheir-El-Din, Executive Director and Director of Research
Estonia
Estonian Institute of Economic ResearchEvelin Ahermaa, Head of Economic Research SectorMarje Josing, Director
Estonian Development FundKitty Kubo, Head of ForesightOtt Pärna, Chief Executive Officer
Ethiopia
African Institute of Management, Development and GovernanceTegegne Teka, General Manager
Finland
ETLA—The Research Institute of the Finnish EconomyPetri Rouvinen, Research DirectorPasi Sorjonen, Head of the Forecasting GroupPekka Ylä-Anttila, Managing Director
France
HEC School of Management, ParisBertrand Moingeon, Professor, Deputy DeanBernard Ramanantsoa, Professor, Dean of HEC School of
Management
Gambia, The
Gambia Economic and Social Development Research Institute(GESDRI)
Makaireh A. Njie, Director
Georgia
Business Initiative for Reforms in GeorgiaGiga Makharadze, Founding Member of the Board of DirectorsTamar Tchintcharauli, Executive DirectorMamuka Tsereteli, Founding Member of the Board of Directors
Germany
WHU—Otto Beisheim School of Management, VallendarRalf Fendel, Professor of Monetary EconomicsMichael Frenkel, Professor, Chair of Macroeconomics and
International Economics
Ghana
Association of Ghana Industries (AGI)Carlo Hey, Project ManagerCletus Kosiba, Executive DirectorTony Oteng-Gyasi, President
Greece
SEV Hellenic Federation of EnterprisesMichael Mitsopoulos, Coordinator, Research and AnalysisThanasis Printsipas, Economist, Research and Analysis
Guatemala
FUNDESAEdgar A. Heinemann, President of the Board of DirectorsPablo Schneider, Economic DirectorJuan Carlos Zapata, General Manager
Guyana
Institute of Development Studies, University of GuyanaKaren Pratt, Research AssociateClive Thomas, Director
vi
Part
ner
Inst
itute
s
part1.r2 2/26/09 11:58 AM Page vi
The Travel & Tourism Competitiveness Report 2009 © 2009 World Economic Forum

Hong Kong SAR
Hong Kong General Chamber of CommerceDavid O’Rear, Chief Economist
Federation of Hong Kong IndustriesAlexandra Poon, Director
Hungary
KOPINT-TÁRKI Economic Research Ltd.Ágnes Nagy, Project ManagerÉva Palócz, Chief Executive Officer
Iceland
Innovation Center IcelandKarl Fridriksson, Managing Director of Human Resources and
ServicesRosa Signy Gisladottir, Manager, Marketing and Media RelationsThorsteinn I. Sigfusson, Director
India
Confederation of Indian IndustryChandrajit Banerjee, Director-GeneralTarun Das, Chief MentorT S Vishwanath, Senior Director and Head, International
Trade Policy
Indonesia
Kadin IndonesiaM.S. Hidayat, ChairmanTulus Tambunan, Director
Ireland
Competitiveness Survey Group, Department of Economics,University College Cork
Eleanor Doyle, Professor, Department of EconomicsNiall O’SullivanBernadette Power
National Competitiveness CouncilAdrian Devitt, ManagerCaoimhe Gavin, Policy AdvisorGráinne Greehy, Graduate Trainee
Israel
Manufacturers’ Association of Israel (MAI)Shraga Brosh, PresidentDan Catarivas, DirectorYehuda Segev, Managing Director
Italy
SDA Bocconi School of ManagementSecchi Carlo, Full Professor of Economic Policy, Bocconi UniversityPaola Dubini, Associate Professor, Bocconi UniversityFrancesco A. Saviozzi, SDA Assistant Professor, Strategic and
Entrepreneurial Management Department
Jamaica
Mona School of Business (MSB), University of the West IndiesPatricia Douce, Survey CoordinatorMichelle Tomlinson, Survey CoordinatorNeville Ying, Executive Director and Professor
Japan
Hitotsubashi University, Graduate School of International Corporate Strategy (ICS)
in cooperation with Keizai Doyukai (Japan Association of Corporate Executives)
Yoko Ishikura, ProfessorKiyohiko Ito, Vice-President and General Manager for Policy
Studies, Keizai Doyukai
Jordan
Ministry of Planning & International CooperationJordan National Competitiveness TeamRafat Al-Rawabdeh, Senior Researcher
Kazakhstan
Corporation for Export Development and PromotionVakhit Mamatayev, ConsultantGaziz Myltykbayev, Deputy Chairman of the BoardKassen Pernebayev, Director, Analytical Department
Kenya
Institute for Development Studies, University of NairobiMohamud Jama, Director and Associate ProfessorPaul Kamau, Research FellowDorothy McCormick, Associate Professor
Korea, Republic of
Korea Advanced Institute of Science and Technology—KAISTMyungchul Shin, Head, School AdministrationBae Soonhoon, Vice President and Professor, Graduate School of
ManagementYoujin Sung, Manager, Exchange Program
Kuwait
Economics Department, Kuwait UniversityAbdullah Alsalman, Assistant ProfessorMohammed El-Sakka, ProfessorReyadh Faras, Assistant Professor
Kyrgyz Republic
Economic Policy Institute “Bishkek Consensus”Lola Abduhametova, Program CoordinatorMarat Tazabekov, Chairman
Latvia
Institute of Economics, Latvian Academy of Sciences, RigaRaita Karnite, Director
Lesotho
Mohloli Chamber of BusinessRefiloe Kepa, General Manager
Libya
National Economic Development BoardEntisar Elbahi, Executive Office Manager
Lithuania
Statistics LithuaniaOna Grigiene, Head, Economical Survey DivisionAlgirdas Semeta, Director General
Luxembourg
Chamber of Commerce of the Grand Duchy of LuxembourgFrançois-Xavier Borsi, Attaché, Economic DepartmentPhilippe Courtin, Attaché, Economic DepartmentCarlo Thelen, Chief Economist, Member of the Managing Board
Macedonia, FYR
National Entrepreneurship and Competitiveness Council (NECC)Dejan Janevski, Project CoordinatorZoran Stavreski, President of the Managing BoardSaso Trajkoski, Executive Director
Madagascar
Centre of Economic Studies, University of AntananarivoPépé Andrianomanana, DirectorRazato Raharijaona Simo, Executive Secretary
Malawi
Malawi Confederation of Chambers of Commerce and IndustryChancellor L. Kaferapanjira, Chief Executive Officer
Malaysia
Institute of Strategic and International Studies (ISIS)Tan Sri Mohamed Jawhar Hassan, Chairman and Chief Executive
OfficerMahani Zainal Abidin, Director-GeneralSteven C.M. Wong, Assistant Director-General
Malaysia Productivity Corporation (MPC)Dato’ Nik Zainiah Nik Abdul Rahman, Director GeneralChan Kum Siew, Director, International Competitiveness Division
vii
Part
ner
Inst
itute
s
part1.r2 2/26/09 11:58 AM Page vii
The Travel & Tourism Competitiveness Report 2009 © 2009 World Economic Forum
Mali
Groupe de Recherche en Economie Appliquée et Théorique(GREAT)
Massa Coulibaly, Coordinator
Malta
Competitive Malta—Foundation for National CompetitivenessMargrith Lutschg-Emmenegger, Vice PresidentAdrian Said, Chief CoordinatorCaroline Sciortino, Research Coordinator
Mauritania
Centre d’Information Mauritanien pour le DéveloppementEconomique et Technique (CIMDET/CCIAM)
Lô Abdoul, Consultant and AnalystKhira Mint Cheikhnani, DirectorHabib Sy, Analyst
Mauritius
Joint Economic Council of MauritiusRaj Makoond, Director
Board of Investment, InvestmauritiusDev Chamroo, Director, Planning & PolicyManisha Dookhony, Manager, Planning & PolicyRaju Jaddoo, Managing Director
Mexico
Center for Intellectual Capital and CompetitivenessErika Ruiz Manzur, Executive DirectorRené Villarreal Arrambide, President and Chief Executive OfficerJesús Zurita González, General Director
Instituto Mexicano Para la Competitividad (IMCO)Gabriela Alarcon Esteva, EconomistManuel J. Molano Ruiz, Deputy General DirectorRoberto Newell Garcia, General Director
PROMEXICO Trade & InvestmentJose Gustavo Hernandez Rodriguez, Business Intelligence UnitLisette Jimenez del Rio, Business Intelligence UnitBernardo von Raesfeld Porras, Business Intelligence Unit
Moldova
Center for Strategic Territorial DevelopmentRuslan Codreanu, Executive DirectorRoman Smolnitchi, Program Coordinator
Mongolia
Open Society Forum (OSF)Munkhsoyol Baatarjav, Manager of Economic PolicyErdenejargal Perenlei, Executive Director
Montenegro
Institute for Strategic Studies and Prognoses (ISSP)Maja Drakic, Project ManagerPetar Ivanovic, Chief Executive OfficerVeselin Vukotic, President
Morocco
Université Hassan IIFouzi Mourji, Professor of Economics
Mozambique
EconPolicy Research Group, Lda.Peter Coughlin, DirectorDonaldo Miguel Soares, ResearcherEma Marta Soares, Assistant
Namibia
Namibian Economic Policy Research Unit (NEPRU)Joel Hinaunye Eita, Senior ResearcherLameck Odada, Research AssistantKlaus Schade, Acting Director
Nepal
Centre for Economic Development and Administration (CEDA)Ramesh Chandra Chitrakar, Executive DirectorMenaka Rajbhandari Shrestha, ResearcherSantosh Kumar Upadhyaya, Researcher
Netherlands
Erasmus Strategic Renewal Center, Erasmus University RotterdamFrans A. J. Van den Bosch, ProfessorHenk W. Volberda, Professor
New Zealand
Business New ZealandMarcia Dunnett, Manager, Sector GroupsPhil O’Reilly, Chief Executive
The New Zealand InstituteDavid Skilling, Chief Executive Officer
Nigeria
Nigerian Economic Summit Group (NESG)Felix Ogbera, Associate Director, ResearchChris Okpoko, Senior Consultant, Research
Norway
BI Norwegian School of ManagementEskil Goldeng, ResearcherTorger Reve, Professor
HSH, The Federation of Norwegian Commercial and ServiceEnterprises
Vibeke H. Madsen, Chief Executive Officer
Oman
The International Research FoundationAzzan Al Busaidi, Chief Executive OfficerSalem Ben Nasser Al-Ismaily, Chairman
Pakistan
Competitiveness Support FundArthur Bayhan, Chief Executive OfficerAmir Jahangir, Manager, Communications
Paraguay
Centro de Análisis y Difusión de Economia Paraguaya (CADEP)Dionisio Borda, DirectorJaime Escobar, Research MemberFernando Masi, Research Member
Peru
Centro de Desarrollo Industrial (CDI), Sociedad Nacional deIndustrias
Néstor Asto, Project DirectorLuis Tenorio, Executive Director
Philippines
Makati Business ClubAlberto A. Lim, Executive DirectorMichael B. Mundo, Chief EconomistMark P. Opulencia, Deputy Director
Poland
Warsaw School of EconomicsBogdan Radomski, Associate Professor
Portugal
PROFORUM, Associação para o Desenvolvimento da EngenhariaIlídio António de Ayala Serôdio, Vice President of the Board of
Directors
Forum de Administradores de Empresas FAEPedro do Carmo Costa, Member of the Board of DirectorsAdilia Lisboa, General Director
Puerto Rico
Puerto Rico 2000, Inc.Suzette M. Jimenez, PresidentFrancisco Montalvo Fiol, Project Coordinator
Qatar
Qatari Businessmen Association (QBA)Issa Abdul Salam Abu Issa, Secretary-GeneralBassam Ramzi Massouh, General ManagerAhmed El-Shaffee, Economist
viii
Part
ner
Inst
itute
s
part1.r2 2/26/09 11:58 AM Page viii
The Travel & Tourism Competitiveness Report 2009 © 2009 World Economic Forum

Romania
Group of Applied Economics (GEA)Anca Rusu, Program CoordinatorLiviu Voinea, Executive Director
Russian Federation
Bauman Innovation, Academy of National Economy under the Government of the Russian Federation
Alexei Prazdnitchnykh, Principal, Associate Professor
Stockholm School of Economics, RussiaIgor Dukeov, Research FellowCarl F. Fey, Associate Dean of Research
Saudi Arabia
National Competitiveness Center (NCC)Awwad Al-Awwad, Deputy Governor for InvestmentKhaldon Mahasen, Manager, Investment Performance Assessment
Senegal
Centre de Recherches Economiques Appliquées (CREA),University of DakarAly Mbaye, Director
Serbia
Center for Advanced Economic Studies, CEVESVuk Dokovic, DirectorDusko Vasiljevic, Researcher
Singapore
Economic Development BoardLim Hong Khiang, Director Planning 2Chua Kia Chee, Head, Research and Statistics Unit
Slovak Republic
Business Alliance of Slovakia (PAS)Robert Kicina, Executive Director
Slovenia
Institute for Economic ResearchArt Kovacic, ResearcherPeter Stanovnik, Senior Researcher
University of Ljubljana, Faculty of EconomicsMateja Drnovsek, Assistant ProfessorAles Vahcic, Professor
South Africa
Business Leadership South AfricaConnie Motshumi, DirectorMichael Spicer, Chief Executive Officer
Business Unity South AfricaJerry Vilakazi, Chief Executive OfficerVic Van Vuuren, Chief Operating Officer
Spain
IESE Business School, International Center for Competitiveness,Anselmo Rubiralta Center for Globalization and StrategyEduardo Ballarín, ProfessorMaría Luisa Blázquez, Research AssociateAlmudena Clemente Tiemblo, Research Associate
Sri Lanka
Institute of Policy StudiesIndika Siriwardena, Database Manager
The Ceylon Chamber of CommercePrema Cooray, Secretary General
Suriname
Institute for Development Oriented Studies (IDOS)Ashok Hirschfeld, Qualitative ResearchJohn R. P. Krishnadath, President
Sweden
Center for Strategy and Competitiveness, Stockholm School of Economics
Christian Ketels, Senior Research FellowÖrjan Sölvell, Professor
Switzerland
University of St. Gallen, Executive School of Management,Technology and Law (ES-HSG)
Franz Jaeger, ProfessorBeat Bechtold, Project Manager
Syria
Ministry of Economy and TradeAmer Housni Louitfi, Minister of Economy and Trade
State Planning CommissionTayseer Al-Ridawi, Head of State Planning Commission
UNDP Damascus, “Towards Changing the Mindset forCompetitiveness”
Nuhad Dimashkiyyah, National Project Director
Taiwan, China
Council for Economic Planning and Development, Executive YuanTain-Jy Chen, ChairmanJ. B. Hung, Director, Economic Research DepartmentChung Chung Shieh, Researcher, Economic Research Department
Tajikistan
The Center for Sociological Research “Zerkalo”Qahramon Baqoev, DirectorOl’ga Es’kina, ResearcherAlikul Isoev, Sociologist and Economist
Tanzania
Economic and Social Research FoundationIrene Alenga, Commissioned Studies DepartmentHaidari Amani, Executive Director and ProfessorDennis Rweyemamu, Commissioned Studies Department
Thailand
Sasin Graduate Institute of Business Administration, Chulalongkorn University
Pongsak Hoontrakul, Senior Research FellowToemsakdi Krishnamra, Director of SasinPiyachart Phiromswad, Faculty of Economics
Thailand Development Research Institute (TDRI)Somchai Jitsuchon, Research DirectorChalongphob Sussangkarn, Distinguished FellowYos Vajragupta, Senior Researcher
Trinidad and Tobago
Arthur Lok Jack Graduate School of BusinessKeston Daniel, Research OfficerFaheem Mohammed, Engagement ManagerMark Oakley, Acting Executive Director
Tunisia
Institut Arabe des Chefs d’EntreprisesMajdi Hassen, Executive CounsellorChekib Nouira, President
Turkey
TUSIAD Sabanci University Competitiveness ForumA. Gunduz Ulusoy, Director and ProfessorHande Yegenoglu, Project Specialist
Uganda
Makerere Institute of Social Research, Makerere UniversityRobert Apunyo, Research AssociateDelius Asiimwe, Senior Research FellowCatherine Ssekimpi, Research Associate
Ukraine
CASE Ukraine, Center for Social and Economic ResearchDmytro Boyarchuk, Executive DirectorVladimir Dubrovskiy, Senior Economist
United Arab Emirates
Economic & Policy Research Unit (EPRU), Zayed UniversityJay Squalli, Assistant ProfessorNico Vellinga, Professor
Dubai Competitiveness CouncilAdel Alfalasi, Director
ix
Part
ner
Inst
itute
s
part1.r2 2/26/09 11:58 AM Page ix
The Travel & Tourism Competitiveness Report 2009 © 2009 World Economic Forum

United States
US Chamber of CommerceScott Eisner, Deputy Chief of StaffCecile Remington, Marketing ManagerJames Robinson, Senior Vice President and Counselor
to the President
Uruguay
Universidad ORTIsidoro Hodara, Professor
Venezuela
CONAPRI—Venezuelan Council for Investment PromotionAna Acosta, Economic AnalystAdolfo Castejón, Investor Services ManagerGiuseppe Rionero, Economic Affairs Manager
Vietnam
Central Institute for Economic Management (CIEM)Dinh Van An, PresidentPhan Thanh Ha, Deputy Director, Department of Macroeconomic
ManagementPham Hoang Ha, Senior Researcher, Department of
Macroeconomic Management
Institute for Economic Research of HCMCNguyen Van Quang, Vice DirectorDu Phuoc Tan, Head, Department of Urban Development StudiesTrieu Thanh Son, Research Fellow
Zambia
Institute of Economic and Social Research (INESOR), University of Zambia
Mutumba M. Bull, DirectorPatricia Funjika, Staff Development FellowJolly Kamwanga, Coordinator
Zimbabwe
Graduate School of Management, University of ZimbabweA. M. Hawkins, Professor
Bolivia, Costa Rica, Dominican Republic, Ecuador, El Salvador,
Honduras, Nicaragua, Panama
INCAE Business School, Latin American Center forCompetitiveness and Sustainable Development
Arturo Condo, RectorMarlene de Estrella, Director of External RelationsLuis Reyes, ManagerRoy Zuñiga, Dean
Latvia, Lithuania
Stockholm School of Economics in RigaKarlis Kreslins, Executive MBA Program DirectorAnders Paalzow, Rector
x
Part
ner
Inst
itute
s
part1.r2 2/26/09 11:58 AM Page x
The Travel & Tourism Competitiveness Report 2009 © 2009 World Economic Forum

The past year has been a difficult one for the Travel &Tourism (T&T) sector. High oil prices through thesummer of 2008, diminished tourism demand due tothe international economic crisis, and concerns aboutterrorism have raised many challenges for the industry.Yet, despite these difficulties, the T&T sector remains acritical one for the world economy, still accounting for asignificant share of global gross domestic product andemployment, and providing an important opportunityfor developing countries to move up the value chaintoward the production of higher value-added services.In this context, an analysis of the T&T competitivenessof individual countries around the world is particularlypertinent at this time.This is the fundamental objectiveof this third edition of The Travel & TourismCompetitiveness Report (TTCR).
For the past four years, the World Economic Forumhas engaged key industry and thought leaders throughits Aviation,Travel & Tourism Industry PartnershipProgramme to carry out an in-depth analysis of theT&T competitiveness of economies around the world.The goal is to construct a platform for multi-stakehold-er dialogue to ensure the development of strong andsustainable national T&T industries capable of con-tributing effectively to international economic develop-ment.The theme of this third edition of the TTCR,“Managing in a time of turbulence,” reflects the myriadof complexities facing the industry at this time, whichmust be overcome to ensure strong sectoral growthgoing into the future.
At the core of this year’s Report is the third editionof the Travel & Tourism Competitiveness Index (TTCI).The aim of the TTCI, which covers a record 133economies this year, is to provide a comprehensivestrategic tool for measuring “the factors and policies thatmake it attractive to develop the T&T sector in differentcountries.” By providing detailed assessments of theT&T environments in countries worldwide, the resultscan be used by all stakeholders to work together toimprove the industry’s competitiveness in their nationaleconomies, thereby contributing to national growth andprosperity.The same overall index structure used lastyear has been retained, making meaningful inter-yearcomparisons possible and allowing countries to tracktheir progress over time in the various areas measured.
The Report contains detailed profiles for each of the133 economies featured in the study, as well as anextensive section of data tables with global rankings
covering over 70 indicators included in the TTCI. Inaddition, the Report includes insightful contributionsfrom a number of industry experts.These chaptersexplore issues such as the impact of higher oil prices onthe tourism industry, the importance of price competi-tiveness for attracting tourists, and the extent to whichthe TTCI explains differences in travel intensity amongcountries.
The Travel & Tourism Competitiveness Report couldnot have been put together without the distinguishedthinkers who have shared with us their knowledge andexperience.We are grateful to our Strategic DesignPartner, Booz & Company, and our Data PartnersDeloitte, the International Air Transport Association(IATA), the International Union for Conservation ofNature (IUCN), the World Tourism Organization(UNWTO), and the World Travel & Tourism Council(WTTC) for helping us to design and develop theTTCI and for providing much of the industry-relevantdata used in its calculation.We thank our IndustryPartners in this Report—Abercrombie & Kent,Airbus,Bombardier, British Airways, Carlson, Emirates Group,Etihad Airways, Hertz, JetAirways, NetJets Europe,Silversea, Swiss International Airlines, and Rolls-Royce—for their support in this important venture.Our thanks also goes out to our academic advisors onthe Report, Larry Dwyer, Qantas Professor of Travel andTourism Economics in the Australian School of Businessat the University of New South Wales, and PeterForsyth, Professor of Economics at Monash University.
We also wish to thank the editors of the Report,Jennifer Blanke and Thea Chiesa, for their energy andtheir commitment to the project.Appreciation also goesto Fiona Paua, Head of Strategic Insight Teams, and theother members of the competitiveness team: CiaraBrowne,Agustina Ciocia, Margareta Drzeniek Hanouz,Thierry Geiger, Irene Mia, Pearl Samandari, and EvaTrujillo Herrera. Finally, we would like to convey oursincere gratitude to our network of 150 PartnerInstitutes worldwide, without whose enthusiasm andhard work the annual administration of the ExecutiveOpinion Survey and this Report would not be possible.
xi
Pref
ace
PrefaceKLAUS SCHWAB,
Executive Chairman, World Economic Forum
part1.r2 2/26/09 11:58 AM Page xi
The Travel & Tourism Competitiveness Report 2009 © 2009 World Economic Forum

part1.r2 2/26/09 11:58 AM Page xii
The Travel & Tourism Competitiveness Report 2009 © 2009 World Economic Forum

The past few years have witnessed many storms in theTravel & Tourism (T&T) industry.These have rangedfrom mounting concerns about terrorism in severalregions to the high cost of fuel and lower tourism-basedspending linked to the current economic downturn. Inthis context, this third edition of The Travel & TourismCompetitiveness Report is being released at a time whenthe industry finds itself at a crossroads with regard tohow to address these diverse and mounting challenges.
Yet, despite the current difficulties, the Travel &Tourism sector remains a critical economic sectorworldwide and one that provides significant potentialfor economic growth and development internationally.A growing national T&T sector contributes to employ-ment, raises national income, and can improve a country’sbalance of payments.The sector is thus an importantdriver of growth and prosperity and, particularly withindeveloping countries, it can play a leading role in povertyreduction.
Given the importance of the T&T sector, four yearsago the World Economic Forum, together with itsIndustry and Data Partners, embarked on a multi-yearresearch effort aimed at exploring various issues relatedto the T&T competitiveness of nations around the world.This year’s Report is published under the theme of“Managing in a time of turbulence,” reflecting the manydifficulties the industry presently faces, which must beovercome to ensure strong sectoral growth going intothe future.This is particularly captured by the topicscovered by the analytical chapters, which will bedescribed below.
The Travel & Tourism Competitiveness IndexDespite the overall importance of developing the T&Tsector, many obstacles at the national level continue tohinder its development. In this light,The Travel &Tourism Competitiveness Index (TTCI) has been devel-oped to measure the many different regulatory and busi-ness-related issues that have been identified as levers forimproving T&T competitiveness in countries around theworld.Through detailed analysis of each pillar and sub-pillar of the Index, businesses and governments canaddress the challenges to the sector’s growth.
The TTCI has been developed within the contextof the World Economic Forum’s Industry PartnershipProgramme for the Aviation,Travel and Tourism sector.
The Index was developed in close collaboration withour Strategic Design Partner Booz & Company and ourData Partners Deloitte, the International Air TransportAssociation (IATA), the International Union forConservation of Nature (IUCN), the World TourismOrganization (UNWTO), and the World Travel &Tourism Council (WTTC).We have also receivedimportant feedback from a number of key companiesthat are Industry Partners in the effort, namelyAbercrombie & Kent,Airbus, Bombardier, BritishAirways, Carlson, Emirates Group, Etihad Airways,Hertz, JetAirways, NetJets Europe, Silversea, SwissInternational Airlines, and Rolls-Royce. Several thoughtleaders from these organizations have also contributedinsightful papers addressing various aspects of T&Tcompetitiveness, which are described below.
The TTCI aims to measure the factors and policiesthat make it attractive to develop the T&T sector in differentcountries. It is based on three broad categories of variablesthat facilitate or drive T&T competitiveness.These categories are summarized into the three subindexes ofthe Index: (1) the T&T regulatory framework subindex;(2) the T&T business environment and infrastructuresubindex; and (3) the T&T human, cultural, and naturalresources subindex.
Each of these three subindexes is composed in turnby a number of pillars of T&T competitiveness, ofwhich there are 14 in all.These are:
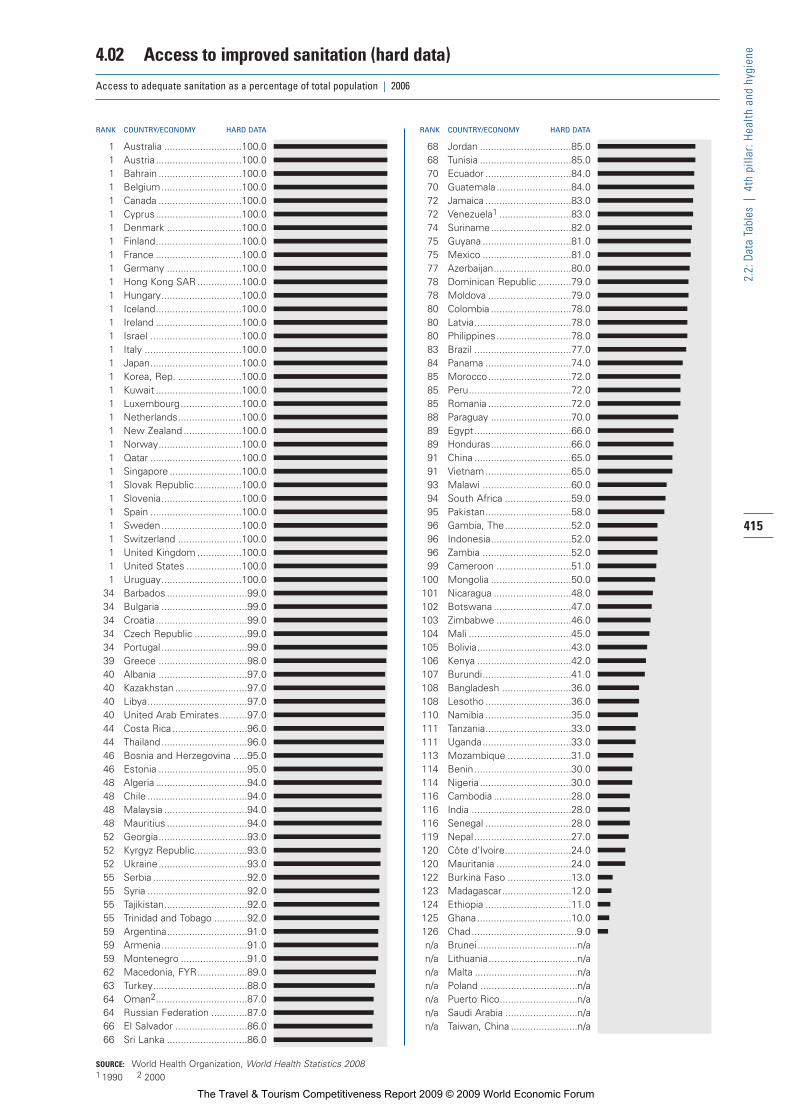
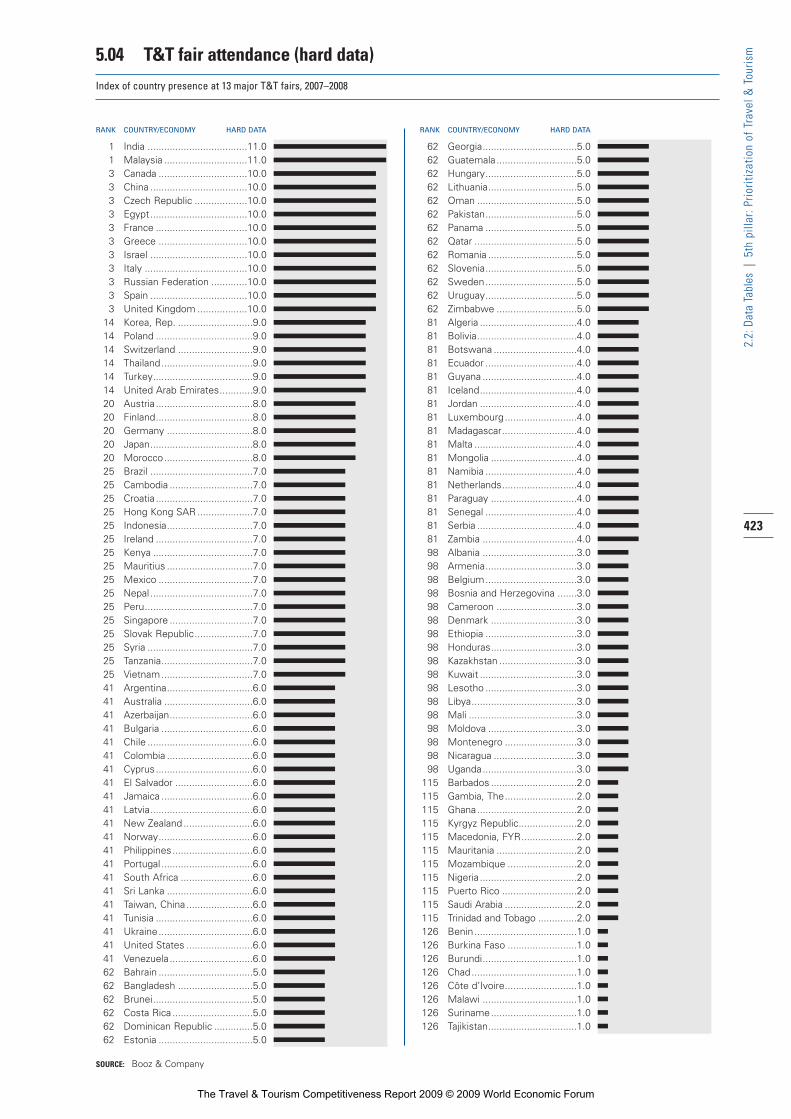
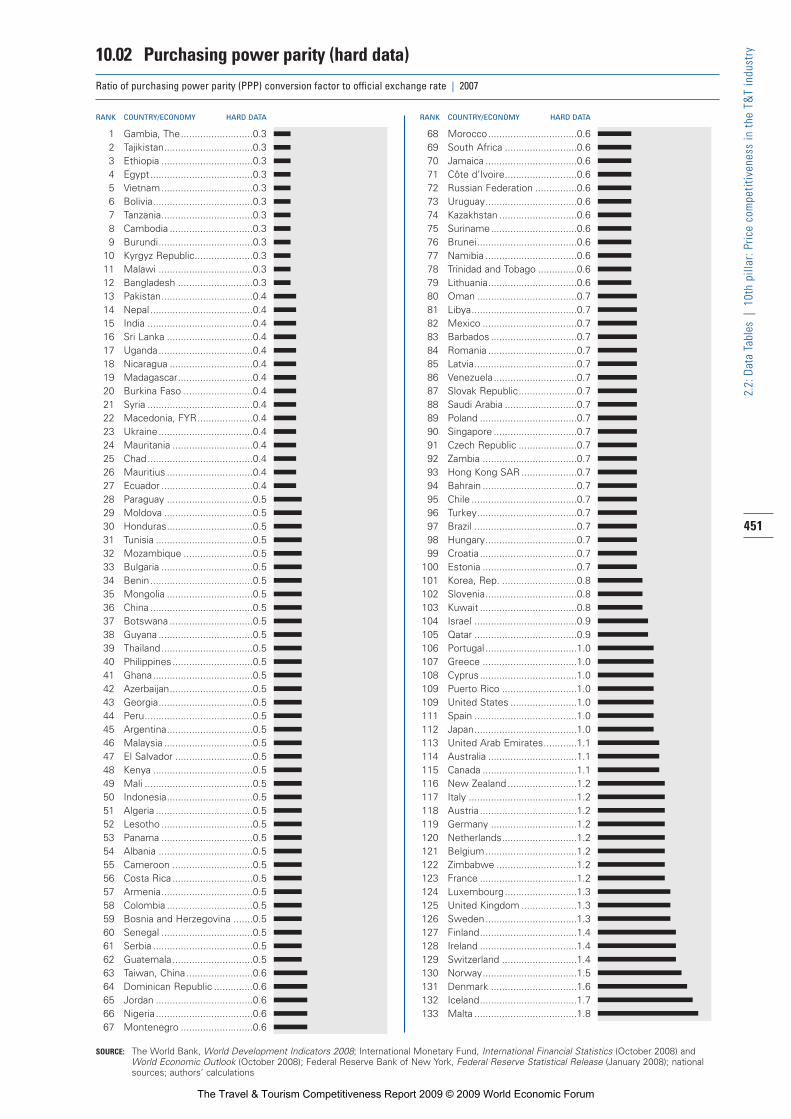
1. Policy rules and regulations2. Environmental sustainability3. Safety and security4. Health and hygiene5. Prioritization of Travel & Tourism6. Air transport infrastructure7. Ground transport infrastructure8. Tourism infrastructure9. ICT infrastructure
10. Price competitiveness in the T&T industry11. Human resources12. Affinity for Travel & Tourism13. Natural resources14. Cultural resources
Each of the pillars is, in turn, made up of a numberof individual variables.The dataset includes both harddata and Survey data from the World Economic Forum’s
xiii
Exec
utiv
e Su
mm
ary
Executive SummaryJENNIFER BLANKE
THEA CHIESA
World Economic Forum
part1.r2 2/26/09 11:58 AM Page xiii
The Travel & Tourism Competitiveness Report 2009 © 2009 World Economic Forum

annual Executive Opinion Survey.The hard data wereobtained from publicly available sources, internationalorganizations, and T&T institutions and experts (forexample, IATA, the IUCN, the UNWTO, the WTTC,UNCTAD, and UNESCO).The Survey is carried outamong CEOs and top business leaders in all economiescovered by our research; these are the people makingthe investment decisions in their respective economies.The Survey provides unique data on many qualitativeinstitutional and business environment issues, as well asspecific issues related to the T&T industry and the qual-ity of the natural environment.The exact methodologyunderlying the construction of the TTCI is described inChapter 1.1.
The Travel & Tourism Competitiveness Index rankings2009Table 1 shows the overall ranking for the 133 countriesincluded in this year’s TTCI, comparing this year’s ranking with that of last year, showing all countriesranked together.The table shows that the top threecountries in the overall ranking remain the same as last year, with three European countries—Switzerland,Austria, and Germany—continuing to lead the way inT&T competitiveness.
Tables 2–5 show the rankings in a regional context,grouping countries into the following four regionalgroups: the Americas, Europe, Middle East and Africa,and Asia Pacific (including Central Asia).We discuss aselection of countries from each region to provide asense of the results and how they are interpreted at thenational level. More countries are discussed in detail inChapter 1.1.
EuropeTable 2 shows the rankings for just European countries,with the first column showing the rank within theregion, and the second column showing the overall rankout of all 133 countries included in the index this year.As the table shows, Switzerland is ranked first out of allcountries in the 2009 TTCI, followed by Austria andGermany, the same top three countries for the past threeyears.
Switzerland is a country rich in cultural and natural resources, including an impressive number ofWorld Heritage cultural and natural sites for a countryof its size.A large percentage of the country’s land areais protected (ranked 16th), and the natural environmentis assessed as being among the most pristine in theworld (ranked 9th).This natural heritage is buttressed bya strong national focus on environmental sustainability:Switzerland is ranked 2nd overall on this pillar, based onstrong and well-enforced environmental legislation andwith a particular focus on developing the T&T sectorsustainably.
Switzerland is not only an attractive leisure tourismdestination but is also an important business travel hub,with many international fairs and exhibitions held in the country each year. Staffing of the industry is alsofacilitated by the availability of qualified labor to workin Travel & Tourism (ranked 3rd), perhaps not surprisingin a country with many of the best hotel managementschools.Added to these strengths is Switzerland’s excellentground transport infrastructure (ranked 1st worldwide),with top-quality roads and railroads and an excellentdomestic transport network.Also well assessed is thespecific tourism infrastructure (ranked 7th), with readilyavailable hotel rooms and automated teller machines(ATMs) for cash withdrawals. Such high-quality infra-structure makes a tourist’s stay in the country easy andcomfortable, an experience that is reinforced by thehigh level of general safety and security (ranked 8th).
Austria is ranked 2nd in Europe and out of allcountries in the TTCI, a ranking attributable to its richcultural resources, with eight World Heritage culturalsites and with many fairs and exhibitions catering tobusiness travelers.The natural environment is also wellassessed, along with the country’s focus on environmen-tal sustainability (ranked 9th). In addition,Austrians areperceived as open and welcoming to foreign travelers.Austria’s tourism infrastructure is assessed as second tonone, with abundant car rental facilities, hotel accom-modations, and ATMs. Other strengths include Austria’sassessment as one of the safest countries in the world(ranked 6th) and its excellent health and hygiene levels(ranked 5th).
Germany, ranked 3rd out of all countries, is alsocharacterized by abundant cultural resources, ranked 4thworldwide for its 32 World Heritage cultural sites and2nd for the number of international fairs and exhibitionsheld in the country.The country’s infrastructure isamong the best in the world, ranked 5th for the qualityof its ground transport infrastructure and 7th for its airtransport infrastructure. In addition, Germany getssomewhat better marks than Switzerland and Austria forthe policy rules and regulations affecting the T&Tindustry: it is ranked 17th in this area, with transparentpolicymaking, well-protected property rights, and bilat-eral Air Service Agreements that are assessed as open.
France moves up this year by six places, ranking4th out of all 133 countries. France attracts tourists withits rich cultural heritage (ranked 4th for the number ofWorld Heritage cultural sites and 7th for creative indus-tries).The country also hosts many international fairsand exhibitions (ranked 5th), thereby attracting businesstravelers as well. France’s ground transport infrastructureis among the best in the world (ranked 3rd), with thequality of roads and railroads particularly well assessed, aswell as its air transport infrastructure (ranked 5th).Thecountry’s improvement is in part attributable to astronger perceived prioritization by the government ofthe sector and increased marketing of the country
xiv
Exec
utiv
e Su
mm
ary
part1.r2 2/26/09 11:58 AM Page xiv
The Travel & Tourism Competitiveness Report 2009 © 2009 World Economic Forum

xv
Exec
utiv
e Su
mm
ary
2009 2008Country/Economy Rank/133 Score Rank/130
Switzerland 1 5.68 1Austria 2 5.46 2Germany 3 5.41 3France 4 5.34 10Canada 5 5.32 9Spain 6 5.29 5Sweden 7 5.28 8United States 8 5.28 7Australia 9 5.24 4Singapore 10 5.24 16United Kingdom 11 5.22 6Hong Kong SAR 12 5.18 14Netherlands 13 5.09 18Denmark 14 5.08 13Finland 15 5.07 12Iceland 16 5.07 11Portugal 17 5.01 15Ireland 18 4.99 21Norway 19 4.97 17New Zealand 20 4.94 19Cyprus 21 4.92 24Belgium 22 4.92 27Luxembourg 23 4.92 20Greece 24 4.91 22Japan 25 4.91 23Czech Republic 26 4.86 30Estonia 27 4.83 26Italy 28 4.78 28Malta 29 4.77 25Barbados 30 4.77 29Korea, Rep. 31 4.72 31Malaysia 32 4.71 32United Arab Emirates 33 4.57 40Croatia 34 4.54 34Slovenia 35 4.53 36Israel 36 4.50 35Qatar 37 4.49 37Hungary 38 4.45 33Thailand 39 4.45 42Mauritius 40 4.43 41Bahrain 41 4.42 48Costa Rica 42 4.42 44Taiwan, China 43 4.40 52Tunisia 44 4.37 39Brazil 45 4.35 49Slovak Republic 46 4.34 38China 47 4.33 62Latvia 48 4.31 45Lithuania 49 4.30 47Bulgaria 50 4.30 43Mexico 51 4.29 55Montenegro 52 4.29 59Puerto Rico 53 4.27 46Jordan 54 4.25 53Panama 55 4.23 50Turkey 56 4.20 54Chile 57 4.18 51Poland 58 4.18 56Russian Federation 59 4.14 64Jamaica 60 4.13 57South Africa 61 4.10 60India 62 4.09 65Uruguay 63 4.09 61Egypt 64 4.09 66Argentina 65 4.08 58Romania 66 4.04 69Dominican Republic 67 4.03 63
(Cont’d.)
2009 2008Country/Economy Rank/133 Score Rank/130
Oman 68 4.01 76Brunei Darussalam 69 3.99 n/aGuatemala 70 3.90 68Saudi Arabia 71 3.89 82Colombia 72 3.89 71Georgia 73 3.89 72Peru 74 3.88 70Morocco 75 3.86 67Azerbaijan 76 3.84 79Ukraine 77 3.84 77Sri Lanka 78 3.82 73Botswana 79 3.81 87Macedonia, FYR 80 3.81 83Indonesia 81 3.79 80Namibia 82 3.77 93Honduras 83 3.77 75Trinidad and Tobago 84 3.75 74Syria 85 3.73 94Philippines 86 3.73 81Gambia, The 87 3.72 84Serbia 88 3.71 78Vietnam 89 3.70 96Albania 90 3.68 92Armenia 91 3.65 89Kazakhstan 92 3.65 91Moldova 93 3.64 98El Salvador 94 3.63 97Kuwait 95 3.63 85Ecuador 96 3.62 86Kenya 97 3.60 101Tanzania 98 3.59 88Suriname 99 3.54 95Zambia 100 3.53 107Senegal 101 3.50 108Guyana 102 3.50 109Nicaragua 103 3.49 99Venezuela 104 3.46 103Mongolia 105 3.46 100Kyrgyz Republic 106 3.45 113Bosnia and Herzegovina 107 3.44 105Cambodia 108 3.43 112Tajikistan 109 3.41 114Ghana 110 3.40 n/aUganda 111 3.38 110Libya 112 3.38 104Pakistan 113 3.33 111Bolivia 114 3.33 106Algeria 115 3.31 102Madagascar 116 3.28 118Malawi 117 3.27 n/aNepal 118 3.25 116Mali 119 3.19 119Benin 120 3.18 120Zimbabwe 121 3.17 117Paraguay 122 3.16 115Ethiopia 123 3.15 121Mozambique 124 3.12 123Cameroon 125 3.09 126Burkina Faso 126 3.08 124Mauritania 127 3.07 122Nigeria 128 3.02 125Bangladesh 129 3.02 127Côte d’Ivoire 130 2.99 n/aBurundi 131 2.98 128Lesotho 132 2.92 129Chad 133 2.52 130
Note that one country covered last year, Uzbekistan, is not included this yearbecause of a lack of Survey data.
Table 1: Travel & Tourism Competitiveness Index 2009 and 2008 comparisons
part1.r2 2/26/09 11:58 AM Page xv
The Travel & Tourism Competitiveness Report 2009 © 2009 World Economic Forum

through participation in a larger number of internation-al tourism fairs. Ensuring the sustainable development ofthe sector is also a significant priority for the govern-ment, with France ranked a high 4th on this pillar, withstrong and well-enforced environmental legislation.
Spain is ranked just behind France within Europe,at 6th place overall. Spain is ranked 1st out of all coun-tries for the richness of its cultural resources, with manyWorld Heritage sites, a large number of internationalfairs and exhibitions, and significant sports stadium capac-ity. Spain’s tourism infrastructure is ranked 1st interna-tionally, with many hotel rooms, car rental facilities, and
ATMs; its air transport infrastructure also gets goodmarks (ranked 10th).The government prioritizes thesector significantly, and the country makes strong effortsto attract tourists through strong destination-marketingcampaigns and by ensuring Spain’s presence at manyinternational tourism fairs.
Greece is ranked 18th in Europe and 24th overall,with a stable performance compared with last year.The country benefits from rich cultural resources(ranked 23rd), excellent health and hygiene (ranked19th overall), and top-notch tourism infrastructure (5th).Greece is ranked a very high 3rd in terms of the
xvi
Exec
utiv
e Su
mm
ary
Table 2: The Travel & Tourism Competitiveness Index: Europe
SUBINDEXES
T&T business environment T&T human, cultural, OVERALL INDEX T&T regulatory framework and infrastructure and natural resources
Country/Economy Regional rank Overall rank Score Rank Score Rank Score Rank Score
Switzerland 1 1 5.68 1 6.01 1 5.49 2 5.54Austria 2 2 5.46 4 5.91 6 5.22 7 5.24Germany 3 3 5.41 13 5.56 3 5.44 9 5.22France 4 4 5.34 8 5.67 7 5.22 11 5.13Spain 5 6 5.29 29 5.29 8 5.21 5 5.36Sweden 6 7 5.28 12 5.57 14 5.04 8 5.23United Kingdom 7 11 5.22 28 5.29 11 5.07 6 5.30Netherlands 8 13 5.09 22 5.44 9 5.08 17 4.75Denmark 9 14 5.08 10 5.59 10 5.08 28 4.57Finland 10 15 5.07 5 5.82 25 4.69 21 4.71Iceland 11 16 5.07 3 5.92 17 4.93 39 4.37Portugal 12 17 5.01 15 5.52 24 4.74 16 4.78Ireland 13 18 4.99 7 5.73 22 4.79 32 4.45Norway 14 19 4.97 9 5.64 19 4.84 36 4.42Cyprus 15 21 4.92 25 5.35 13 5.05 37 4.38Belgium 16 22 4.92 21 5.45 32 4.56 20 4.73Luxembourg 17 23 4.92 20 5.47 16 4.97 42 4.30Greece 18 24 4.91 18 5.49 27 4.66 27 4.58Czech Republic 19 26 4.86 16 5.50 36 4.41 24 4.67Estonia 20 27 4.83 17 5.50 21 4.81 47 4.19Italy 21 28 4.78 46 4.96 26 4.68 22 4.71Malta 22 29 4.77 11 5.58 31 4.58 52 4.15Croatia 23 34 4.54 43 5.02 37 4.32 43 4.28Slovenia 24 35 4.53 38 5.13 33 4.53 61 3.94Hungary 25 38 4.45 26 5.35 42 4.06 59 3.95Slovak Republic 26 46 4.34 34 5.20 54 3.78 55 4.05Latvia 27 48 4.31 32 5.22 43 4.04 86 3.68Lithuania 28 49 4.30 30 5.27 46 3.98 89 3.65Bulgaria 29 50 4.30 56 4.74 48 3.96 46 4.20Montenegro 30 52 4.29 50 4.86 66 3.57 35 4.43Turkey 31 56 4.20 63 4.60 60 3.73 44 4.28Poland 32 58 4.18 72 4.44 68 3.53 29 4.56Russian Federation 33 59 4.14 79 4.35 61 3.70 38 4.37Romania 34 66 4.04 61 4.68 64 3.61 77 3.83Georgia 35 73 3.89 33 5.20 99 2.84 92 3.64Ukraine 36 77 3.84 62 4.66 72 3.37 103 3.50Macedonia, FYR 37 80 3.81 69 4.46 75 3.29 87 3.67Serbia 38 88 3.71 78 4.35 80 3.20 96 3.57Albania 39 90 3.68 77 4.38 104 2.76 66 3.89Armenia 40 91 3.65 58 4.70 105 2.75 102 3.51Moldova 41 93 3.64 67 4.53 95 2.95 110 3.43Bosnia and Herzegovina 42 107 3.44 96 4.11 93 2.96 124 3.25
part1.r2 2/26/09 11:58 AM Page xvi
The Travel & Tourism Competitiveness Report 2009 © 2009 World Economic Forum

country’s overall prioritization of Travel & Tourism.Further, there is a strong national affinity for tourismcompared with many other European countries, includ-ing a generally open and positive attitude towardtourists (16th).The country’s overall ranking is heldback, however, by its policy rules and regulations thatare not entirely supportive of the sector’s development(ranked 57th), with stringent rules governing foreigndirect investment (FDI), and with foreign ownershiprestrictions, as well as significant time and cost involvedin starting a new company.Another area of weakness isthe country’s ground transport infrastructure, which isless efficient than in many other European countries(the quality of railroads and ports being of particularconcern).
Italy, despite being endowed with the most WorldHeritage cultural sites in the world, ranks only 21stwithin Europe and 28th overall (the same rank as lastyear).As well as its cultural richness, Italy’s strengths liein areas such as the health and hygiene of the country(27th), its air transport infrastructure (27th), and espe-cially its excellent tourism infrastructure (3rd). However,it faces a number of challenges that bring its overall ratingdown.These include policy rules and regulations, whereItaly ranks 71st (even lower than last year) because of itsvery strong foreign ownership restrictions (ranked106th) and rules governing FDI (122nd). Further, thegovernment is not seen to be prioritizing this sector(107th), which is so important to the overall economy.In addition, ground transport infrastructure requiresupgrading, there is insufficient focus on developing thesector in an environmentally sustainable way, and thereare some safety and security concerns in the country(82nd).
The AmericasTable 3 shows the regional rankings for the countries inthe Americas.As the table shows, Canada is the high-est-ranked country in the region, ranked 5th out of all133 countries and with an improvement of four placesallowing it to overtake the United States this year forthe top regional spot. Canada’s natural resources consti-tute a key strength, with the country’s nine WorldHeritage natural sites placing it 4th internationally. Itscultural resources are also a strong point, with manyinternational fairs and exhibitions in the country andstrong creative industries in particular. Canada’s air trans-port infrastructure is ranked 1st out of all countries, andit also gets good marks for its tourism and ICT infra-structure, facilitating the online T&T environment.Canada’s policy environment is very conducive to thedevelopment of the sector (ranked 5th, up three placesfrom last year), and the government is seen to be morestrongly prioritizing the sector than last year. For moredetails on Canada’s T&T competitiveness see Box 2 inChapter 1.1.
The United States is ranked 2nd in the Americasand 8th out of all countries, down one position fromlast year.The country places 2nd for the overall businessenvironment and infrastructure and 1st for the country’shuman, cultural, and natural resources. In particular, theUnited States has an excellent air transport infrastructure(ranked 2nd) and high-quality tourism and ICT infra-structure. Its natural resources are ranked 1st out of allcountries, with many nationally protected areas and manyWorld Heritage natural sites, although a perception existsthat the environment is not being sufficiently protected(ranked 106th for environmental sustainability). Safetyand security, ranked 122nd, is also of concern: as well asworries about crime and violence, the country has oneof the highest death rates from road traffic accidents outof all countries covered (ranked 125th).
Barbados is ranked 3rd in the region, at 30thoverall, down one place from last year. Barbados isranked 2nd overall for the country’s affinity for Travel &Tourism, with a positive attitude toward tourists andtoward the value of tourism in the country.The govern-ment is prioritizing the sector to a very high degree(ranked 2nd), spending a high percentage of GDP onthe sector and ensuring effective destination-marketingcampaigns. Further, the country has a regulatory envi-ronment that is quite conducive to the development ofthe sector, requiring few visitors to have visas to enterthe country and with open bilateral Air ServiceAgreements.
Costa Rica is ranked 4th in the region and 42ndoverall, up two places from last year.The country getsexcellent marks for its natural resources (ranked 6th),with several World Heritage sites, a high percentage ofnationally protected areas, and its very diverse fauna.Given the importance of the natural environment forthe county’s tourism industry, it is notable that it ranks ahigh 27th overall for environmental sustainability, anarea of measurable improvement since last year.However, safety and security remains a concern (72nd).Further, although its tourism infrastructure is well devel-oped (33rd), with a strong presence of major car rentalcompanies and abundant hotel rooms, ground transportinfrastructure requires significant upgrading (103rd), par-ticularly roads and ports, making travel in the countrysomewhat difficult.
Brazil is ranked 5th in the Americas and 45thoverall, having seen an improvement of four places sincelast year.The country is ranked 2nd out of all countriesfor its natural resources and 14th for its cultural resources,with many World Heritage sites, a great proportion ofprotected land area, and the most diverse fauna in theworld.This is buttressed by a focus on environmentalsustainability (ranked 33rd). However, the ground trans-port network remains underdeveloped, with the qualityof roads, ports, and railroads ranked 110th, 123rd, and86th, respectively. Safety and security continues to be ofserious concern, ranked 130th overall, just behind South
xvii
Exec
utiv
e Su
mm
ary
part1.r2 2/26/09 11:58 AM Page xvii
The Travel & Tourism Competitiveness Report 2009 © 2009 World Economic Forum

Africa and Russia.The country also suffers greatly froma lack of price competitiveness (91st), attributable in partto high ticket taxes and airport charges in the country,as well as high prices and high taxation more generally.Further, the overall policy environment is not particular-ly conducive to the development of the sector (ranked95th), with discouraging rules on FDI and much timerequired for starting a business.
Mexico is ranked just behind Brazil in the regionalranking at 6th place and comes in at 51st place overall,an improvement of four places. Mexico gets quite highmarks for its natural resources (ranked 18th), and this isan area where it has shown an improvement since lastyear, with one more natural World Heritage site addedin the interval.The country’s cultural resources are alsovery rich (20th), with 26 World Heritage cultural sites,several international fairs and exhibitions, and strongcreative industries.These inherent strengths are rein-forced by the overall prioritization of the sector in thecountry (35th), with country-level participation at manyT&T fairs and effective marketing and branding cam-paigns for attracting tourists. Some areas requiring atten-tion are the tourism infrastructure (49th) and, especially,the ground transport infrastructure (84th). In addition,Mexico is ranked a low 77th for its price competitive-ness, due especially to very high ticket taxes and airport
charges (ranked 126th overall). Heath and hygiene issuesremain to be tackled (ranked 74th), and, in particular,safety and security continues to be a major concern,ranked 126th with high levels of crime and violence,a police force that cannot be relied on to provide pro-tection from crime, and many deaths from road trafficaccidents.
Asia PacificTable 4 displays the regional ranking and data for theAsia Pacific region.As the table shows, Australia is thehighest-ranked country from the region, ranked 9thoverall, down five places since last year.Australia isranked 4th for its natural resources, with the most WorldHeritage natural sites worldwide, many known speciesin the country, and a pristine natural environment.Given the importance of the environment for much ofits leisure tourism, it is notable that the stringency andenforcement of its environmental regulations are wellassessed. Given the country’s distance from other conti-nents and the related importance of domestic air travelto overcome the large distances between major sites,its competitiveness is also buttressed by excellent airtransport infrastructure (ranked 3rd) as well as goodgeneral tourism infrastructure (ranked 9th).Australia alsobenefits from the strong government prioritization of
xviii
Exec
utiv
e Su
mm
ary
Table 3: The Travel & Tourism Competitiveness Index: The Americas
SUBINDEXES
T&T business environment T&T human, cultural, OVERALL INDEX T&T regulatory framework and infrastructure and natural resources
Country/Economy Regional rank Overall rank Score Rank Score Rank Score Rank Score
Canada 1 5 5.32 23 5.41 4 5.36 10 5.19United States 2 8 5.28 57 4.70 2 5.47 1 5.67Barbados 3 30 4.77 19 5.47 29 4.62 45 4.21Costa Rica 4 42 4.42 48 4.94 55 3.77 31 4.54Brazil 5 45 4.35 95 4.12 69 3.53 4 5.40Mexico 6 51 4.29 80 4.34 62 3.66 13 4.87Puerto Rico 7 53 4.27 44 4.99 41 4.10 84 3.71Panama 8 55 4.23 53 4.80 56 3.77 53 4.14Chile 9 57 4.18 49 4.87 58 3.76 64 3.92Jamaica 10 60 4.13 51 4.85 57 3.76 80 3.76Uruguay 11 63 4.09 45 4.98 74 3.33 57 3.96Argentina 12 65 4.08 74 4.40 70 3.51 41 4.34Dominican Republic 13 67 4.03 54 4.75 71 3.46 68 3.88Guatemala 14 70 3.90 81 4.32 81 3.20 48 4.17Colombia 15 72 3.89 91 4.18 88 3.08 34 4.43Peru 16 74 3.88 89 4.24 92 2.96 33 4.43Honduras 17 83 3.77 83 4.31 87 3.08 63 3.92Trinidad and Tobago 18 84 3.75 100 4.04 51 3.82 112 3.38El Salvador 19 94 3.63 73 4.42 83 3.19 123 3.28Ecuador 20 96 3.62 103 4.01 97 2.91 62 3.93Suriname 21 99 3.54 110 3.86 91 3.01 79 3.76Guyana 22 102 3.50 94 4.14 111 2.68 88 3.66Nicaragua 23 103 3.49 98 4.05 101 2.79 93 3.63Venezuela 24 104 3.46 122 3.63 86 3.12 91 3.65Bolivia 25 114 3.33 127 3.33 110 2.70 58 3.96Paraguay 26 122 3.16 116 3.74 130 2.44 122 3.30
part1.r2 2/26/09 11:58 AM Page xviii
The Travel & Tourism Competitiveness Report 2009 © 2009 World Economic Forum

the tourism sector and effective destination-marketingcampaigns.The drop in rank since last year can betraced in large part to a perceived weakening of the prioritization of the sector in the country, a poorerassessment of the ground transport infrastructure, andweakening price competitiveness.
Australia is followed in the regional ranking bySingapore, which is ranked 10th overall, entering thetop 10 this year and up by six places since last year.Singapore benefits from excellent transport infrastructure,with ground transport infrastructure and air transportinfrastructure ranked 4th and 15th, respectively.Singapore also benefits from its top rank out of allcountries for the quality of its human resources to workin the country.With regard to the policy environment, italso ranks 1st, with rules and regulations that areextremely conducive to the development of its T&Tindustries (policies facilitating foreign ownership andFDI, well-protected property rights, few visa restric-tions). Further, it is among the safest countries of allassessed with regard to crime and security. Singapore isranked 2nd for the overall prioritization of Travel &Tourism, an area of improvement since last year.Thecountry’s tourism and ICT infrastructure has also seen ameasurable improvement since last year.
Hong Kong is ranked 3rd in the region and 12th overall, up two places since last year. Hong Kong’stransport infrastructure is even better assessed thanSingapore’s, with ground transport and air transportinfrastructures ranked 2nd and 13th, respectively. HongKong gets relatively good marks for cultural resources,with many international fairs and exhibitions held in thecountry and strong creative industries. Hong Kong’spolicy environment is rated second only to Singapore,and shows a strong prioritization of the tourism sector(ranked 8th). Like Singapore, Hong Kong is extremelysafe from crime and violence (ranked 5th), and thecountry is unsurpassed for its quality of health andhygiene, where it ranks first internationally.
New Zealand is ranked 4th in the region and20th overall.The country benefits from its rich naturalresources, with several World Heritage natural sites(ranked 16th) and a very pristine natural environment(ranked 3rd) protected by strong and well-enforcedenvironmental legislation.The overall policy rules andregulations in the country are conducive to the develop-ment of the sector (ranked 10th), with transparent policymaking and among the least time and lowest costrequired to start a business of all countries.Although thecountry’s ground transport network remains somewhatunderdeveloped, the air transport infrastructure gets
xix
Exec
utiv
e Su
mm
ary
Table 4: The Travel & Tourism Competitiveness Index: Asia Pacific
SUBINDEXES
T&T business environment T&T human, cultural, OVERALL INDEX T&T regulatory framework and infrastructure and natural resources
Country/Economy Regional rank Overall rank Score Rank Score Rank Score Rank Score
Australia 1 9 5.24 27 5.31 15 5.01 3 5.42Singapore 2 10 5.24 6 5.77 5 5.25 23 4.69Hong Kong SAR 3 12 5.18 2 5.93 12 5.05 30 4.55New Zealand 4 20 4.94 14 5.55 30 4.62 25 4.65Japan 5 25 4.91 40 5.10 20 4.83 15 4.81Korea, Rep. 6 31 4.72 41 5.06 35 4.45 26 4.64Malaysia 7 32 4.71 42 5.03 38 4.24 14 4.86Thailand 8 39 4.45 70 4.46 40 4.14 19 4.74Taiwan, China 9 43 4.40 75 4.40 18 4.87 65 3.92China 10 47 4.33 88 4.24 59 3.73 12 5.01India 11 62 4.09 107 3.88 63 3.65 18 4.74Brunei Darussalam 12 69 3.99 99 4.04 47 3.96 60 3.95Azerbaijan 13 76 3.84 47 4.95 84 3.19 111 3.40Sri Lanka 14 78 3.82 86 4.27 73 3.34 71 3.85Indonesia 15 81 3.79 113 3.77 79 3.24 40 4.36Philippines 16 86 3.73 85 4.27 89 3.07 70 3.86Vietnam 17 89 3.70 92 4.15 85 3.12 76 3.83Kazakhstan 18 92 3.65 60 4.69 96 2.93 121 3.32Mongolia 19 105 3.46 90 4.19 107 2.72 106 3.48Kyrgyz Republic 20 106 3.45 76 4.39 124 2.49 105 3.48Cambodia 21 108 3.43 111 3.80 113 2.64 74 3.84Tajikistan 22 109 3.41 84 4.30 117 2.58 117 3.37Pakistan 23 113 3.33 124 3.59 94 2.95 108 3.46Nepal 24 118 3.25 119 3.66 120 2.53 97 3.57Bangladesh 25 129 3.02 130 3.16 103 2.78 130 3.11
part1.r2 2/26/09 11:58 AM Page xix
The Travel & Tourism Competitiveness Report 2009 © 2009 World Economic Forum

excellent marks (ranked 11th), and both the tourism and ICT infrastructures are quite good by internationalstandards. New Zealand also benefits from high-qualityhuman capital (ranked 17th) and a very safe and secureenvironment overall (15th).
Japan is ranked 5th regionally and 25th out of allcountries in the TTCI, with excellent marks for its cul-tural resources (ranked 10th), attributable to its 14 WorldHeritage cultural sites, the many international fairs andexhibitions held in the country, and its rich creativeindustries.The ground transport infrastructure is amongthe best in the world (ranked 8th), especially railroads,and Japan continues to be a leader in the area of educa-tion and training (ranked 12th). However, Japan ranksthird from the bottom for the affinity of the county forTravel & Tourism (131st), and the sector is not perceivedto be a priority for the government (ranked 83rd).
Malaysia is ranked 7th regionally and 32nd overall,with its rich natural resources (ranked 21st) and goodground transport infrastructure (ranked 28th).Thecountry also benefits from excellent price competitive-ness (ranked 4th), with low comparative hotel and fuel prices, low ticket taxes and airport charges, verycompetitive hotel prices, and a favorable tax regime.Malaysia’s policy environment is assessed as highly con-ducive to the development of the sector (ranked 9th),and the country is prioritizing Travel & Tourism; it markets the country at many international tourism fairs(ranked 1st) and also has an excellent evaluation for itsdestination-marketing campaigns (ranked 12th).Withregard to weaknesses, health and hygiene indicators lagbehind those of many other countries in the region,with, in particular, a low physician density (placing thecountry 94th).
Thailand is ranked just behind Malaysia in theregion at 8th place and 39th overall, up three placessince last year. It is endowed with rich natural resourcesand a strong affinity for Travel & Tourism (ranked 24thand 22nd, respectively), with a very friendly attitude ofthe population toward tourists (ranked 13th).This isbuttressed by the sector’s strong prioritization by thegovernment (ranked 12th) with, similar to Malaysia,excellent destination-marketing campaigns and goodprice competitiveness. However, some weaknessesremain: despite the prioritization of the sector by thegovernment, some aspects of the regulatory environment—such as stringent foreign ownership restrictions, visarestrictions for many travelers, and the long timerequired for starting a business in the country—are notparticularly conducive to developing the sector (ranked62nd). In addition, given the importance of the naturalenvironment for the country’s tourism, environmentalsustainability should be a greater priority (ranked 99th).
China, ranked 10th regionally, has seen the largestrank improvement of all countries this year, moving upby a remarkable 15 places to 47th overall. China hasbeen building on a number of clear strengths: it is
ranked 7th for its natural resources, with many WorldHeritage natural sites and fauna that is among the rich-est in the world. It is ranked 15th for its culturalresources, with many World Heritage cultural sites, manyinternational fairs and exhibitions held in the country,and creative industries that are unsurpassed. Moreover,the country is ranked 20th in price competitiveness and28th for the overall prioritization of the sector. In addi-tion, China has a relatively good air transport infrastruc-ture (ranked 34th). However, there are some weaknessespulling the country’s ranking down. China has a policyenvironment that is not conducive for T&T develop-ment (ranked 87th), with strong foreign ownershiprestrictions and visa requirements for most visitors.Furthermore, policies related to environmental sustain-ability get low marks (105th).There are also some safetyand security concerns (116th), as well as issues related tohealth and hygiene (91st), with access to improved sani-tation and drinking water that is low by internationalstandards. Ground transport infrastructure gets middlingmarks (55th), and its tourism infrastructure remainsunderdeveloped (ranked 80th), with few hotel roomsavailable and few ATMs, although on a positive notetourism infrastructure has seen a marked improvementsince last year.
India is ranked 11th in the region and 62nd over-all, up three places since last year.As with China, India iswell assessed for its natural resources (ranked 14th) andcultural resources (24th), with many World Heritagesites, both natural and cultural, rich fauna, and strongcreative industries in the country. India also has quite agood air transport network (ranked 37th), particularlygiven the country’s stage of development, and a reason-able ground transport infrastructure (ranked 49th).However, some aspects of its tourism infrastructureremain somewhat underdeveloped (ranked 73rd), withvery few hotel rooms per capita by international com-parison and low ATM penetration. Further, despite gov-ernment and industry efforts to promote the countryabroad (India is ranked 1st with regard to tourism fairattendance) and the exposure given to recent promo-tional campaigns, the assessment of marketing andbranding to attract tourists remains average (ranked 53rd).Another area of concern is the policy environment,ranked 108th, with much time and cost for starting abusiness, bilateral Air Service Agreements that are notassessed as open, and visas required for most visitors.
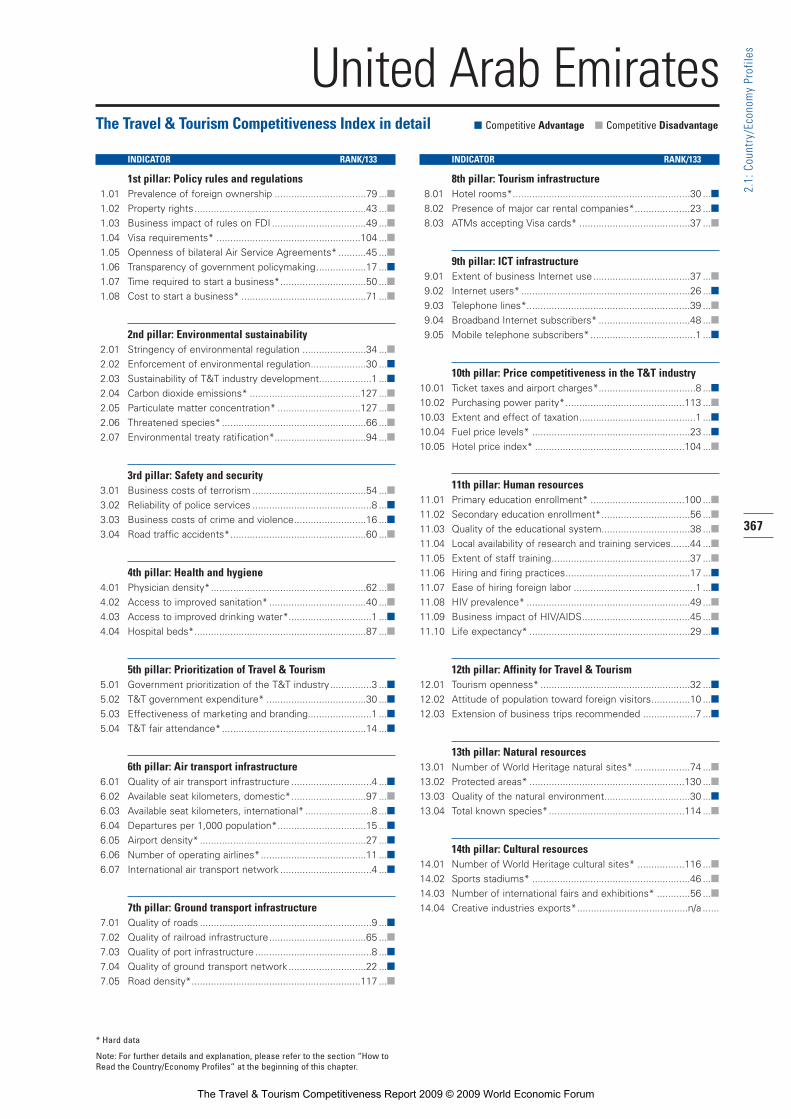
Middle East and AfricaTable 5 shows the regional ranking for the Middle Eastand Africa region.As the table shows, The UnitedArab Emirates (UAE) is ranked 1st in the region thisyear, 33rd overall, up seven places since last year, over-taking Israel and Tunisia.While the UAE is not endowedwith rich natural and cultural resources (117th and 84th,respectively), it does very well in several other areas captured by the Index. For example, the country is char-
xx
Exec
utiv
e Su
mm
ary
part1.r2 2/26/09 11:58 AM Page xx
The Travel & Tourism Competitiveness Report 2009 © 2009 World Economic Forum

acterized by a positive attitude toward foreign travelers(10th) and is also seen as very safe from crime and violence (ranked 14th).The UAE’s infrastructure alsogets good marks, particularly its air transport infrastruc-ture, which is ranked a very high 4th out of all countriesassessed (up one place since last year).The governmentis seen as prioritizing the sector strongly (ranked 3rd),carrying out very effective destination-marketing campaigns (ranked 1st) and ensuring the presence of thecountry at major T&T fairs internationally.An area ofclear improvement since last year is in the rules and regulations, which have been adjusted to better supportthe sector’s development, with the UAE moving upfrom 81st place last year to 53rd this year.
Israel is the second-ranked country in the region,at 36th overall, showing a stable performance since lastyear.The country’s human resources base is well evaluated(29th), providing healthy and well-trained people towork in the T&T sector. Further, its infrastructure isquite well developed compared with those of othercountries in the region, especially its ICT infrastructure.Israel’s rules and regulations, ranked 39th, are conduciveto the development of the sector, with low foreignownership restrictions and visas required from fewcountries, although it requires much time to set up abusiness in the country (ranked 91st). But althoughIsrael gets excellent marks related to health and hygiene(ranked 14th), safety and security continues to be a
xxi
Exec
utiv
e Su
mm
ary
Table 5: The Travel & Tourism Competitiveness Index: Middle East and Africa
SUBINDEXES
T&T business environment T&T human, cultural, OVERALL INDEX T&T regulatory framework and infrastructure and natural resources
Country/Economy Regional rank Overall rank Score Rank Score Rank Score Rank Score
United Arab Emirates 1 33 4.57 39 5.12 23 4.79 78 3.81Israel 2 36 4.50 37 5.13 39 4.21 51 4.16Qatar 3 37 4.49 35 5.16 34 4.48 75 3.83Mauritius 4 40 4.43 24 5.39 44 4.04 69 3.86Bahrain 5 41 4.42 55 4.75 28 4.64 67 3.88Tunisia 6 44 4.37 31 5.26 49 3.87 56 3.97Jordan 7 54 4.25 36 5.15 67 3.55 54 4.05South Africa 8 61 4.10 82 4.31 52 3.81 49 4.17Egypt 9 64 4.09 52 4.84 65 3.59 73 3.84Oman 10 68 4.01 59 4.69 53 3.80 99 3.54Saudi Arabia 11 71 3.89 104 4.01 45 4.02 90 3.65Morocco 12 75 3.86 64 4.59 78 3.27 83 3.73Botswana 13 79 3.81 66 4.55 76 3.29 95 3.60Namibia 14 82 3.77 71 4.45 77 3.27 94 3.60Syria 15 85 3.73 68 4.48 82 3.20 100 3.53Gambia, The 16 87 3.72 65 4.56 90 3.06 98 3.55Kuwait 17 95 3.63 109 3.87 50 3.85 128 3.16Kenya 18 97 3.60 93 4.15 100 2.81 72 3.84Tanzania 19 98 3.59 102 4.03 118 2.56 50 4.17Zambia 20 100 3.53 87 4.26 115 2.64 85 3.69Senegal 21 101 3.50 101 4.03 108 2.71 82 3.75Ghana 22 110 3.40 105 3.94 102 2.78 104 3.49Uganda 23 111 3.38 115 3.75 114 2.64 81 3.76Libya 24 112 3.38 97 4.07 109 2.71 114 3.37Algeria 25 115 3.31 108 3.88 98 2.84 127 3.22Madagascar 26 116 3.28 112 3.79 106 2.74 119 3.32Malawi 27 117 3.27 106 3.91 131 2.43 107 3.47Mali 28 119 3.19 114 3.76 126 2.48 120 3.32Benin 29 120 3.18 117 3.66 121 2.52 116 3.37Zimbabwe 30 121 3.17 125 3.57 125 2.49 109 3.43Ethiopia 31 123 3.15 128 3.27 112 2.65 101 3.52Mozambique 32 124 3.12 120 3.66 129 2.45 125 3.24Cameroon 33 125 3.09 126 3.54 132 2.36 115 3.37Burkina Faso 34 126 3.08 118 3.66 122 2.52 131 3.05Mauritania 35 127 3.07 123 3.61 127 2.47 129 3.14Nigeria 36 128 3.02 132 3.10 116 2.59 113 3.38Côte d’Ivoire 37 130 2.99 131 3.12 123 2.50 118 3.35Burundi 38 131 2.98 129 3.17 119 2.53 126 3.24Lesotho 39 132 2.92 121 3.64 128 2.45 133 2.66Chad 40 133 2.52 133 2.83 133 1.93 132 2.80
part1.r2 2/26/09 11:58 AM Page xxi
The Travel & Tourism Competitiveness Report 2009 © 2009 World Economic Forum

major concern, placing the country at 73rd, primarilyrelated to concerns about terrorism (ranked 129th).
Qatar is ranked 3rd in the region and 37th overall,directly following Israel in the full ranking. Qatar bene-fits from an extremely safe and secure environment(ranked 9th), high-quality human resources in the country (ranked 22nd for human capital), good tourisminfrastructure (28th), and excellent air transport infra-structure (20th), in line with its increasing role as an airtransportation hub. In order to further improve thecountry’s T&T competitiveness, efforts should be madeto upgrade its ground transport infrastructure (ranked59th), more focus should be placed on environmentalsustainability (69th), and further efforts should be madeto improve the policy and regulatory environment(ranked 47th)—in particular, by facilitating more foreigndirect investment and easing visa requirements for enter-ing the country.
Mauritius is the fourth highest ranked country inthe region, at 40th overall. Mauritius is ranked 1st out ofall countries for the overall prioritization of the sector,with high government spending on the tourism industry(ranked 3rd), ensuring excellent destination-marketingcampaigns to attract tourists (ranked 2nd), and ensuringthe country’s presence at many international tourismfairs.Along similar lines, Mauritius is ranked 3rd for itsoverall affinity for Travel & Tourism, with the sector representing an important part of the economy and thegeneral attitude of the population to foreign travelersbeing extremely welcoming.The country’s tourisminfrastructure is well developed by regional standards,and the policy environment is supportive of the devel-opment of the sector (ranked 13th). Mauritius also ben-efits from price competitiveness (ranked 26th), with rel-atively low prices overall and taxation that is not overlyburdensome, although this would be improved throughlower ticket taxes and airport charges, and more com-petitive hotel prices. Safety and security levels are alsogood by regional standards (ranked 40th), and are on apar with countries such as Germany and Hungary. Interms of challenges, although the government is seen tobe making an effort to develop the industry in a sustain-able way (ranked 13th), this effort could be backed upby more stringent environmental regulations (ranked61st).
Tunisia is ranked 6th among Middle East andAfrican countries and 44th overall, down five placessince last year.Tunisia benefits from a strong assessmentof the prioritization of Travel & Tourism (15th)—similarto top-10 ranked countries such as Austria and Canada—with high government spending on the sector, effec-tive destination-marketing campaigns, and attendance atseveral major international tourism fairs. Further, unlikesome other countries in the region,Tunisia is perceivedas relatively safe from crime and violence (ranked 31st).In addition, price competitiveness is a positive attribute,ranked 7th, with competitive hotel prices, low fuel lev-
els, reasonable taxation, and low prices more generally.On the other hand, health and hygiene remains an areaof concern (75th), with a relatively low physician density and a low concentration of hospital beds.Thecountry’s ICT infrastructure also remains underdevel-oped (ranked 77th).This is an area that has seen a deterioration since last year.
South Africa is ranked 8th in the region and 61stoverall, with a stable performance since last year. SouthAfrica, together with Mauritius, make up the two sub-Saharan African countries in the top half of the overallranking. South Africa is ranked a high 22nd for its natu-ral resources and 45th for its cultural resources, based onits many World Heritage sites, its rich fauna, its creativeindustries, and the many international fairs and exhibi-tions held in the country. South Africa also benefitsfrom price competitiveness, with reasonably priced hotelrooms and a favorable tax regime. Infrastructure inSouth Africa is also well developed for the region, withair transport infrastructure ranked 43rd and a particular-ly good assessment of railroad quality (37th) and roadquality (40th). Overall, policy rules and regulations areconducive to the sector’s development (ranked 36th),with well-protected property rights and few visarequirements for visitors. However, there are also someareas of weakness that have brought down the country’soverall ranking. Safety and security is of serious concern(ranked 128th), as is the level of health and hygiene,where South Africa is ranked 94th as a result of its lowphysician density and concerns about access to improvedsanitation in particular. Related to this, health indicatorsare extremely worrisome. South Africa’s life expectancyis low, at 51 years, placing the country 120th overall, aranking related in large part to the very high rates ofcommunicable diseases such as HIV/AIDS. Improvingthe health of the workforce is of urgent concern for thefuture of the T&T sector, as well as for all sectors in theeconomy.
Egypt directly follows South Africa in the regionalranking at 9th place, ranked 64th overall, up two placesfrom last year.The country is rich in cultural heritage,with seven World Heritage cultural sites and severalinternational fairs and exhibitions held in the country.In addition to its cultural attributes, it benefits fromexcellent price competitiveness, ranked 1st out of allcountries, with competitive hotel prices, low fuel costs,and low prices more generally. Further, there is a strongnational prioritization of the sector (ranked 9th), withthe government ensuring both relatively high spendingon Travel & Tourism and the country’s presence at majortourism fairs. On the other hand, Egypt’s infrastructureneeds improvement, particularly its tourism infrastructure(74th), its ground transport infrastructure (79th), and itsICT infrastructure (84th).A focus on improving educa-tion and training in the country, ranked 83rd, would alsoimprove the country’s overall T&T competitiveness.
xxii
Exec
utiv
e Su
mm
ary
part1.r2 2/26/09 11:58 AM Page xxii
The Travel & Tourism Competitiveness Report 2009 © 2009 World Economic Forum

Kenya, a country long famous for its tourismattributes, is ranked 18th regionally and 97th overall, upfour places since last year. Kenya is ranked 25th for itsnatural resources, with two World Heritage natural sitesand its rich diversity of fauna.Tourism is a strong priori-ty within the country (ranked 12th on this pillar), withhigh government spending on the sector, effective desti-nation-marketing campaigns, and country presence atseveral international fairs and exhibitions. In addition,there is a strong focus on environmental sustainability inthe country (ranked 16th), which is particularly impor-tant for Kenya given the sector’s dependence on thenatural environment. On the downside, the policy envi-ronment is not at present conducive to the developmentof the sector (ranked 90th), with bilateral Air ServiceAgreements that are not open, insufficiently protectedproperty rights, and much time and cost required forstarting a business. In addition, infrastructure remainsunderdeveloped and health and hygiene levels requireimprovement. Finally, the security situation in the coun-try remains a significant hindrance to further developingthe sector (ranked 121st).
The country profiles in Part 2 of this volume pro-vide details on the competitiveness of all 133 economiesincluded in this year’s TTCI.
Exploring issues of T&T competitivenessAs well as the TTCI analysis described above, the Reportalso features several excellent contributions from T&Tindustry experts that deal with issues directly related toT&T competitiveness. Several chapters focus on particu-lar aspects of the present challenges facing the industry,providing suggestions on how to overcome them.
In their chapter “Endangered Growth: How thePrice of Oil Challenges International Travel & TourismGrowth,” Jürgen Ringbeck,Amit Gautam, and TimmPietsch of Booz & Company describe how 2009 mightgo down in history as a “make or break” year for theAirline,Travel and Tourism sector.As the authors pointout, the historically high price of crude oil in the sum-mer of 2008, of US$147 per barrel, highlighted the vul-nerability of the sector to oil prices.As the authorspoint out, while an oil price of US$100 per barrel wasconsidered ruinous only a few years ago, the industryhas now suffered through much higher prices than pre-viously envisaged.And while prices have dropped signif-icantly from the summer 2008 high, the mid-termexpectation is for higher prices, requiring all players inthe sector to adapt their behavior accordingly.
The authors assume a high oil price scenario overthe long term in order to highlight the expectedchanges in consumer behavior and the competitivenessof several destinations under such a scenario. In thiscontext, the chapter discusses the dramatic structuralchanges a high oil price imposes on airlines, travelers,and destination countries, which in addition must be
navigated during a period of shifting or even decliningtravel demand. In providing a view on endangered T&Teconomies, the chapter also explores potential ways ofcoping with such a change.
As they explain, although each country mustaddress its particular challenges individually, it is possibleto identify some overarching methods of coping in aworld of fundamental change.These include improve-ments to the operational efficiency of facilities andinfrastructure within countries, the reduction of accesscosts, rebranding and repositioning of destinations, andleveraging funding from the international community toprepare for change.These improvement areas are intend-ed to help national policymakers to address some of thesevere challenges they are presently facing in theirefforts to harness Travel & Tourism as a lever forimproving general economic wellbeing.
In their chapter “The Importance of Public-PrivatePartnership in the Current Downturn,“ Amir Girgisand Ufi Ibrahim from the WTTC express confidence inthe long-term prospects of the T&T industry, despitethe present difficulties.They note that although there aremany uncertainties as to how long the current crisis willcontinue, and how deep its impact will be on disposableincomes and business and consumer confidence in dif-ferent markets, past experience has shown that Travel &Tourism always rebounds from cyclical downturns—sometimes even stronger than before.
However, the authors stress that in order to addressthe challenges as effectively as possible and to find solu-tions to overcome them, it is more critical than ever forthe public and private sectors to work together. In par-ticular, public-private sector dialogue and partnershipcan help to encourage a supportive policy frameworkfor Travel & Tourism, in turn helping to stimulatedemand at challenging times such as the present, therebyensuring that Travel & Tourism continues to generateemployment and stimulate economic growth, as well ascontributing to the alleviation of poverty in emergingeconomies.
The authors give some examples of successful pub-lic-private partnerships, highlighting the essential needfor such partnerships across the globe and the multiplebenefits associated with healthy ones—something thatwill be especially relevant as the T&T sector confrontsthe challenges ahead.The authors conclude by notingthat partnership and dialogue can lead to an improvedtourism product, promoting increased competitiveness,and that, in particular, the creation of national tourismorganizations can be important stepping stones in theright direction for improving these partnerships.
In “How Well Does the Travel & TourismCompetitiveness Index Explain Differences in TravelIntensity Among Countries?” Selim Ach and BrianPearce of IATA study the relationship between thenumber of passengers traveling to and from a givencountry and the results of the Travel & Tourism
xxiii
Exec
utiv
e Su
mm
ary
part1.r2 2/26/09 11:58 AM Page xxiii
The Travel & Tourism Competitiveness Report 2009 © 2009 World Economic Forum

Competitiveness Index (TTCI).Their aim is to under-stand how well the TTCI captures the key drivers ofTravel & Tourism, and therefore the contribution of thesector to the economic success of a country.
The authors begin by showing that highly rankedcountries in the TTCI tend to attract a higher numberof air passengers than lower ranked countries. Based onan analysis of the data and the theoretical relationshipsamong the various factors, the authors have developedan econometric model to assess these relationships.Thismodel provides an initial quantification of the linkbetween the number of passengers and a country’sTTCI score.
The results of their analysis show that the tourismcompetitiveness factors making up the TTCI are strong-ly related to the total number of passengers arriving atand departing from a given country.Taking into accountthe population by country, the econometric analysis alsodemonstrates that the GDP per capita of the destinationcountry, as well as the average distance required to reachthat particularly country, are the two other significantfactors.
The authors conclude that efforts dedicated toimproving the overall TTCI performance (by imple-menting an efficient regulatory framework; investing ininfrastructure; improving price competitiveness; orimproving its human, cultural, and natural resources) arelikely to increase the total number of passengers to andfrom a given country.This econometric model thus pro-vides a tool to simulate the effect of a particular policyon the number of air passengers by upgrading either theTTCI score or that of one of the subindexes or pillars.They note that, although further work is necessary torefine the analysis, it already provides a sense of thepotential impact of improving the provision of key driv-ers of air Travel & Tourism.And this, in turn, could beexpected to enhance the wider economic benefitsbrought about by the development of this importantsector.
In “Capturing the Visitor Economy:A Frameworkfor Success,”Alex Kyriakidis, Heather Hancock, SimonOaten, and Rashid Bashir of Deloitte describe how, inthe present global economic downturn, it is moreimportant than ever for countries to sustain and maxi-mize the benefits of tourism.They explain that to do so,policymakers must understand the economic impact oftourism and to design and implement policies that willenable them to realize its full benefits.To this end, theauthors analyze, from a public-sector perspective, theeconomic contribution of tourism to the wider societyand explore a framework for capturing what they callthe “visitor economy.”
As the authors explain, the visitor economy in eachcountry consists of two components: the direct contri-bution of tourism and the indirect contributions fromother sectors that rely on, or support, tourism.They ana-lyze these components and also consider the contribution
made by the visitor economy to broader public policyobjectives such as regeneration, social and economicinclusion, enhancing skills and employment, and attract-ing enterprise and investment as well as strengtheninginternational ties.
They explore how tourism interacts with and con-tributes to the wider economy and society, highlightingthe economic impacts (direct and indirect) of tourism aswell as the key drivers, policy barriers, and market failures.They highlight those factors that can be most effectivelyleveraged by the industry and by policymakers, as well asmore uncontrollable factors that represent specific andunusual pressures on the sector.
The authors conclude by noting that in these tur-bulent economic times the focus should be on longer-term, supply-oriented strategies over which policymakerscan exert greater influence and realize long-term value.Specifically, visitor economies demonstrating adaptability,developing deeper domestic tourism supply chains, andfocusing on higher-value “quality and skills” investmentswhile building diversity into the destination will benefitthe most.
In their chapter “Tourism Price Competitiveness,”Peter Forsyth of Monash University and Larry Dwyer ofthe University of New South Wales review the literatureon what they describe as “an essential component in theoverall tourism competitiveness of a country or a desti-nation.”The fact that price is one of the most importantfactors in decisions about whether, and where, to under-take trips is reflected in one of the key pillars of theTTCI. Indeed, measures of tourism price competitive-ness of countries or destinations (such as individualregions or cities) form part of more general work ondestination competitiveness.
The authors explain that, given its importance,many have developed or used indicators of tourismprice competitiveness, although the indicators vary con-siderably. Different indicators shed light on differentaspects of competitiveness, and the measures that aremost useful for a purpose depend on what questions arebeing explored.The authors explore several of the dif-ferent indicators aimed at measuring tourism pricecompetitiveness, describing the strengths and weaknessesof using each of them.
Specifically, some of the key aspects that influencewhich indicators should be used are the need for accu-racy and tourism-specific detail versus timeliness; theneed for cross-country (or cross-destination) compar-isons of the prices tourists are actually paying; the needfor estimates of changes in relative price competitivenessover time; and the need to provide overall summarymeasures of a country’s price competitiveness at a pointof time or changes in it over time.The specific measureused will therefore depend on the particular analyticaland practical need.
In their chapter “National CompetitivenessCouncil: Setting Up the Egyptian Travel & Tourism
xxiv
Exec
utiv
e Su
mm
ary
part1.r2 2/26/09 11:58 AM Page xxiv
The Travel & Tourism Competitiveness Report 2009 © 2009 World Economic Forum

Competitiveness Council,”Ashraf Ibrahim of theEgyptian Travel & Tourism Competitiveness Council(T&TCC) and Heba Ali Zayed of the EgyptianNational Competitiveness Council (ENCC) begin bydescribing the logic behind creating an EgyptianCompetitiveness Council five years ago, a private sector–led nongovernmental organization that aims toenhance Egypt’s competitiveness.The rest of the chapterthen explains how this infrastructure has been used toset up an Egyptian T&TCC, focused specifically onenhancing the competitiveness of the T&T industry, asector so crucial for Egypt’s economic development.
As the authors explain, the objective of theT&TCC is to bring together stakeholders from theT&T sector to review sector developments, discuss challenges, and propose solutions for enhancing theindustry’s international competitiveness.The Councilcarries out awareness raising (both within and outsidethe sector), advocacy, and mobilizing efforts in coopera-tion with other stakeholders. Specifically, the T&TCCplayed an important role in disseminating this informa-tion and bringing key issues from The Travel & TourismCompetitiveness Report 2008 into the spotlight withinEgypt over the past year.
The authors see the TTCI is an essential tool fortracking and monitoring national progress withinEgypt’s T&T sector by providing a closer look at specificdeficiencies and obstacles that must be overcome. Basedin part on the challenges identified within the TTCI,the T&TCC has developed an action plan for the coming year.The three main initiatives identified as toppriority are focused on human resource development,institution and capacity building for industry advocacy,and environmental sustainability.
The authors conclude by noting that the Egyptianexperience is not unique and similar efforts could bereplicated in other countries in order to improve theperformance of national T&T sectors with the goal ofboosting economic growth and prosperity.
In “Navigating Yet Another Perfect Storm:ThePromise of Sustainable Travel & Tourism,”Thea Chiesaof the World Economic Forum begins by describing themany challenges facing the T&T industry at the begin-ning of the 21st century.These range from the threat ofterrorism, pandemics, and natural disasters to volatilefuel prices and, more recently, the credit crunch andeconomic recession across much of the world.As shenotes, given the high correlation between businesscycles and tourism growth rates, it is understandable thatconsumers are presently reducing leisure travel and busi-nesses are scaling back their travel budgets.As a result ofthis contraction in consumer demand, the T&T industrywill likely face consolidation and an increase in thenumber of industry bankruptcies.
As the author explains, this is not all bad news.On the positive side, the current financial crisis couldencourage airlines to lobby governments to further
liberalize markets through the adoption of global OpenSkies agreements and the removal of current ownershipand control restrictions, which currently hinder the air-lines’ ability to consolidate on a truly global scale. Manyagree that airline industry consolidation would be bene-ficial by allowing for economies of scale and increasedfunctional synergies.
Chiesa goes on to discuss how, in order to thrive,or even survive, in this period of uncertainty andchange, both the T&T industry and destinations them-selves will need to approach the challenges in a holisticand systemic manner.This would allow innovative ideasto emerge, new directions to be taken, new alliances tobe forged, and profits to be reaped. Current events arereshaping the financial and industrial world, and the roleof institutions and government.Together with concur-rently evolving consumer behaviors toward climatechange, water consumption, and food production, thesefactors all provide ample opportunity for innovation.More specifically, the T&T industry can take advantageof this current period of uncertainty to form increasedcollaboration among all actors of the T&T value chainas well as innovative partnership across different indus-tries and create new ways of doing business. She discuss-es a number of promising innovative partnership ideasidentified by the Forum’s Aviation,Travel & Tourismcommunity in order to illustrate these opportunities.
The author concludes by noting that the Forumwill continue to engage the industry’s key stakeholdersin a collaborative dialogue on addressing the barriers toimplementing some promising new cross-industry part-nerships for carbon abatement that have been identifiedby the community.
In “Strengthening the Travel & Tourism Competi-tiveness Index,” Geoffrey Lipman and John Kester of theUNWTO discuss the characteristics they would like tosee integrated into the TTCI in the coming years.Theauthors welcome the initiatives to improve and broadenthe base data and particularly to incorporate new envi-ronmental criteria and information.They are also verysupportive of the new emphasis on presentation of databy regions.Yet they ask whether the Index remainsentirely relevant “in a world of short-term stimulusactions and parallel, longer-term shift to a green econo-my, coherent with global development and climateimperatives.”
The authors describe how ecotourism and greaterenvironmental sustainability of the T&T sector, moregenerally, will be important for tourism competitivenessgoing into the future.They therefore feel that greaterintegration of these concepts into the TTCI wouldreflect the realities of government, industry, and marketshifts.To this end, they note that the UNWTO willhold an open global discussion forum on these mattersin the second half of 2009.
xxv
Exec
utiv
e Su
mm
ary
part1.r2 2/26/09 11:58 AM Page xxv
The Travel & Tourism Competitiveness Report 2009 © 2009 World Economic Forum

ReferencesBlanke, J. and T. Chiesa. 2007. “The Travel & Tourism Competitiveness
Index: Assessing Key Factors Driving the Sector’s Development.”In The Travel & Tourism Competitiveness Report 2007: Furtheringthe Process of Economic Development. Geneva: World EconomicForum. 3–25.
Blanke, J. and T. Chiesa. 2008. “The Travel & Tourism CompetitivenessIndex: Measuring Key Elements Driving the Sector’s Development.”In The Travel & Tourism Competitiveness Report 2008: BalancingEconomic Development and Environmental Sustainability. Geneva:World Economic Forum. 3–26.
xxvi
Exec
utiv
e Su
mm
ary
part1.r2 2/26/09 11:58 AM Page xxvi
The Travel & Tourism Competitiveness Report 2009 © 2009 World Economic Forum

Part 1 Selected Issues of T&TCompetitiveness
part1.r2 2/26/09 11:58 AM Page 1
The Travel & Tourism Competitiveness Report 2009 © 2009 World Economic Forum

part1.r2 2/26/09 11:58 AM Page 2
The Travel & Tourism Competitiveness Report 2009 © 2009 World Economic Forum

CHAPTER 1.1
The Travel & TourismCompetitiveness Index 2009:Measuring Sectoral Drivers in a DownturnJENNIFER BLANKE
THEA CHIESA
EVA TRUJILLO HERRERA
World Economic Forum
The Travel & Tourism (T&T) industry has faced a seriesof challenges in recent years that range from concernsabout terrorism to the high cost of fuel and lower consumer spending linked to the current economicdownturn.Yet the T&T sector remains a critical economicsector worldwide and one that provides significantpotential for economic growth and development inter-nationally. It is in this context that, for the past four years,the World Economic Forum has been assessing the T&T competitiveness of nations around the world.This chapter presents the third edition of the Travel &Tourism Competitiveness Index (TTCI), launched forthe first time in early 2007.
The economic importance of the T&T sector shouldnot be underestimated.According to the World TourismOrganization (UNWTO), international tourist arrivalsreached 924 million in 2008, representing a growth of 2percent compared with 2007 (tourism demand slowedin the second half of 2008, however, attributable to thedeteriorating international economic situation).TheWorld Travel & Tourism Council (WTTC) estimatesthat, from direct and indirect activities combined, theT&T sector now accounts for 9.9 percent of global GDP,10.9 percent of world exports, and 9.4 percent of worldinvestment.
A growing national T&T sector contributes toemployment, raises national income, and can improve thebalance of payments.Thus the sector is an importantdriver of growth and prosperity, and, particularly withindeveloping countries, it can also play a role in povertyreduction.
Despite the overall importance of developing theT&T sector, many obstacles at the national level continueto hinder its development. In this light, the TTCI aimsto measure the many different regulatory and business-related issues that have been identified as levers forimproving T&T competitiveness in countries around the world.Through detailed analysis of each pillar andsubpillar of the Index, businesses and governments canaddress the challenges to the sector’s growth.
This analysis aims to serve two purposes. First, byproviding a cross-country analysis of the drivers ofT&T competitiveness, we intend to provide the industrywith useful comparative information and an importantbenchmarking tool for making decisions related to business and industry development. Second, and moreimportantly, the analysis provides an opportunity for theT&T industry to highlight to national policymakers theobstacles to T&T competitiveness that require policyattention, and to enable dialogue between the privateand public sectors for improving the environment fordeveloping the T&T industry at the national level.
The Forum is committed to publishing the Reportseries on a regular basis in an effort to ensure that itbecomes a leading strategic tool used by both businessand governments for creating blueprints for sustainableand viable Travel & Tourism development.
3
1.1:
The
Tra
vel &
Tou
rism
Com
petit
iven
ess
Inde
x 20
09
part1.r2 2/26/09 11:58 AM Page 3
The Travel & Tourism Competitiveness Report 2009 © 2009 World Economic Forum

The Travel & Tourism Competitiveness IndexThe Travel & Tourism Competitiveness Index (TTCI)has been developed within the context of the WorldEconomic Forum’s Industry Partnership Programme forthe Aviation,Travel and Tourism sector.The TTCI aimsto measure the factors and policies that make it attractive todevelop the T&T sector in different countries. The Index wasdeveloped in close collaboration with our StrategicDesign Partner Booz & Company and our Data PartnersDeloitte, the International Air Transport Association(IATA), the International Union for Conservation ofNature (IUCN), the World Tourism Organization(UNWTO), and the World Travel & Tourism Council(WTTC).We have also received important feedbackfrom a number of key companies that are industry part-ners in the effort, namely Abercrombie & Kent,Airbus,Bombardier, British Airways, Carlson, Emirates Group,Etihad Airways, Hertz, JetAirways, NetJets Europe,Silversea, Swiss International Airlines, and Rolls-Royce.
The TTCI is based on three broad categories ofvariables that facilitate or drive T&T competitiveness.These categories are summarized into the three subindex-es of the Index: (1) the T&T regulatory frameworksubindex; (2) the T&T business environment and infra-structure subindex; and (3) the T&T human, cultural, andnatural resources subindex.The first subindex capturesthose elements that are policy related and generallyunder the purview of the government; the secondsubindex captures elements of the business environmentand the “hard” infrastructure of each economy; and thethird subindex captures the “softer” human, cultural, andnatural elements of each country’s resource endowments.
Each of these three subindexes is composed in turnby a number of pillars of T&T competitiveness, ofwhich there are 14 in all.These are:
1. Policy rules and regulations2. Environmental sustainability3. Safety and security4. Health and hygiene5. Prioritization of Travel & Tourism6. Air transport infrastructure7. Ground transport infrastructure8. Tourism infrastructure9. ICT infrastructure
10. Price competitiveness in the T&T industry11. Human resources12. Affinity for Travel & Tourism13. Natural resources14. Cultural resources
Figure 1 summarizes the structure of the overall Index,showing how the 14 component pillars are allocatedwithin the three subindexes.
Each of the pillars is, in turn, made up of a numberof individual variables.The dataset includes both harddata and Survey data from the World Economic Forum’s
annual Executive Opinion Survey.The hard data wereobtained from publicly available sources, internationalorganizations, and T&T institutions and experts (forexample, IATA, the IUCN, the UNWTO, the WTTC,UNCTAD, and UNESCO).The Survey is carried outamong CEOs and top business leaders in all economiescovered by our research; these are the people makingthe investment decisions in their respective economies.The Survey provides unique data on many qualitativeinstitutional and business environment issues, as well asspecific issues related to the T&T industry and the qual-ity of the natural environment.
The policy rules and regulations pillar captures theextent to which the policy environment is conducive todeveloping the T&T sector in each country. Governmentscan have an important impact on the attractiveness ofdeveloping this sector, depending on whether the policiesthat they create and perpetuate support or hinder itsdevelopment. Sometimes well-intentioned policies canend up creating red tape or obstacles that have theopposite effect from that which was intended. In thispillar we take into account the extent to which foreignownership and foreign direct investment (FDI) are welcomed and facilitated by the country, how wellproperty rights are protected, the time and cost requiredfor setting up a business, the extent to which visarequirements make it complicated for visitors to enterthe country, and the openness of the bilateral AirService Agreements into which the government hasentered with other countries.
The importance of the natural environment forproviding an attractive location for tourism cannot beoverstated, and it is clear that policies and factorsenhancing environmental sustainability are crucial forensuring that a country will continue to be an attractivedestination going into the future. In this pillar we meas-ure the stringency of the government’s environmentalregulations in each country as well as the extent towhich they are actually enforced. Given the environ-mental impacts that tourism itself can sometimes bringabout, we also take into account the extent to whichgovernments prioritize the sustainable development ofthe T&T industry in their respective economies. Inaddition to policy inputs, this pillar includes some of therelated environmental outputs, including carbon dioxideemissions and the percentage of endangered species inthe country.
Safety and security is a critical factor determiningthe competitiveness of a country’s T&T industry.Touristsare likely to be deterred from traveling to dangerouscountries or regions, making it less attractive to developthe T&T sector in those places. Here we take into accountthe costliness of common crime and violence as well asterrorism, and the extent to which police services canbe relied upon to provide protection from crime as wellas the incidence of road traffic accidents in the country.
4
1.1:
The
Tra
vel &
Tou
rism
Com
petit
iven
ess
Inde
x 20
09
part1.r2 2/26/09 11:58 AM Page 4
The Travel & Tourism Competitiveness Report 2009 © 2009 World Economic Forum

Health and hygiene is also essential for T&T com-petitiveness.The access within the country to improveddrinking water and sanitation is important for the com-fort and health of travelers.And in the event that touristsdo become ill, the country’s health sector must be ableto ensure they are properly cared for, as measured by theavailability of physicians and hospital beds.
The extent to which the government prioritizes the T&T sector also has an important impact on T&Tcompetitiveness. By making clear that T&T is a sector of primary concern, and by reflecting this in its budgetpriorities, the government can channel needed funds toessential development projects. It also sends a signal ofits intentions, which can have positive spillover effectssuch as attracting further private investment into thesector. Prioritization of the sector can be reflected in avariety of other ways as well, such as ensuring the coun-try’s attendance at international T&T fairs and commis-sioning high-quality “destination-marketing” campaigns.
Quality air transport infrastructure provides ease ofaccess to and from countries, as well as movement todestinations within countries. In this pillar we measureboth the quantity of air transport, as measured by theavailable seat kilometers, the number of departures, air-port density, and the number of operating airlines, aswell as the quality of the air transport infrastructure bothfor domestic and international flights.
Vital for ease of movement within the country isthe extensiveness and quality of the country’s groundtransport infrastructure. This takes into account thequality of roads, railroads, and ports, as well as the extentto which the national transport network as a wholeoffers efficient, accessible transportation to key businesscenters and tourist attractions within the country.
We have also included a pillar that captures a numberof aspects of the general tourism infrastructure in eachcountry, as distinct from the general transport infrastruc-ture.This takes into account the accommodation infra-structure (the number of hotel rooms) and the presenceof major car rental companies in the country, as well as ameasure of the financial infrastructure for tourists in thecountry (the availability of automatic teller machines, orATMs).
Given the increasing importance of the onlineenvironment for the modern T&T industry, for planningitineraries and purchasing travel and accommodations,we also capture the quality of the ICT infrastructure ineach economy. Here we measure ICT penetration rates(Internet, telephone lines, and broadband), which providea sense of the society’s online activity.We also include aspecific measure of the extent to which the Internet isused by businesses in carrying out transactions in theeconomy, to get a sense of the extent to which thesetools are in fact being used for business (including T&T)transactions in the economy.
The price competitiveness in the T&T industry isclearly an important element to take into account, with
lower costs increasing the attractiveness of some countriesfor many travelers.To measure countries’ price competi-tiveness, we take into account factors such as the extentto which goods and services in the country are more orless expensive than elsewhere (purchasing power parity),airfare ticket taxes and airport charges (which can makeflight tickets much more expensive), fuel price levelscompared with those of other countries, and taxation inthe country (which can be passed through to travelers)as well as the relative cost of hotel accommodations.
Quality human resources in the economy ensurethat the industry has access to the collaborators it needsto develop and grow.This pillar takes into account thehealth and the education and training levels in eacheconomy, and is made up of two specific subpillars.Theeducation and training subpillar measures educationalattainment rates (primary and secondary), as well as theoverall quality of the educational system in each country,as assessed by the business community. Besides the formaleducational system, we also take into account privatesector involvement in upgrading human resources,including the availability of specialized training servicesand the extent of staff training by companies in thecountry.The subpillar measuring the availability ofqualified labor further takes into account the extent towhich hiring and firing is impeded by regulations, andwhether labor regulations make it easy or difficult tohire foreign labor.The health of the workforce is alsoincluded here, as measured by the overall life expectancyof the country as well as the specific costliness ofHIV/AIDS to businesses.
Also included is the affinity for Travel & Tourism,which measures the extent to which the country andsociety are open to tourism and foreign visitors. It isclear that the general openness of the population totravel and to foreign visitors has an important impact on T&T competitiveness. In particular, we provide ameasure of the national population’s attitude toward foreign travelers; a measure of the extent to which business leaders are willing to recommend leisure travelin their countries to important business contacts; and ameasure of tourism openness (tourism expenditures andreceipts as a percentage of GDP), which provides a senseof the importance of tourism relative to the country’soverall size.
It is also clear that natural resources are an importantfactor underlying national T&T competitiveness.Countries that are able to offer travelers access to naturalassets clearly have a competitive advantage. In this pillarwe include a number of environmental attractivenessmeasures, including the number of UNESCO naturalWorld Heritage sites, a measure of the quality of thenatural environment, the richness of the fauna in thecountry as measured by the total known species of ani-mals, and the percentage of nationally protected areas.
Finally, the cultural resources at each country’s dis-posal are also a critical driver of T&T competitiveness
5
1.1:
The
Tra
vel &
Tou
rism
Com
petit
iven
ess
Inde
x 20
09
part1.r2 2/26/09 11:58 AM Page 5
The Travel & Tourism Competitiveness Report 2009 © 2009 World Economic Forum

around the world. In this pillar we include the numberof UNESCO cultural World Heritage sites, sports stadi-um seat capacity, and the number of international fairsand exhibitions in the country. In addition, we haveadded this year a measure of creative industries exportsfrom the country, which provides an additional indica-tion of cultural richness.
These 14 pillars are regrouped into the threesubindexes described above, as shown in Figure 1, andthe overall score for each country is derived as anunweighted average of the three subindexes.The detailsof the composition of the TTCI are shown in AppendixA; detailed rankings and scores of this year’s Index arefound in Appendix B.
Country coverageFour new economies have been included in the analysisthis year: Brunei Darussalam, Côte d’Ivoire, Ghana, andMalawi (reintroduced after a one-year absence). On theother hand, one country covered last year, Uzbekistan, isnot covered this year because of a lack of Survey data.This has led to a net increase in country coverage, for atotal of 133 economies this year, covering all of theworld’s regions and accounting for approximately 90percent of the world’s population and 98 percent ofworld GDP.
The Travel & Tourism Competitiveness Index rankings2009Table 1 shows the overall rankings of the TTCI, com-paring this year’s rankings with those from last year,showing all countries ranked together.The results arepositively correlated with a number of T&T indicators.For example, Figures 2 and 3 show the correlationbetween the TTCI and tourist arrivals, and between theTTCI and tourism receipts, respectively (both shown inlog form) in 2007.As the figures show, the index isquite highly correlated with both the number of touristsactually traveling to various countries and the annualincome generated from Travel & Tourism, with fewnotable outliers.This supports the idea that the TTCIcaptures factors that are important for developing theT&T industry in countries.
Top three performers in each pillar of the TTCITable 2 shows the rankings of those economies demon-strating the top three performances in each of the 14 pillars of the TTCI.The table shows that fiveeconomies are among the top three performers in three pillars (Hong Kong, Iceland, Singapore, Sweden,and Switzerland). Four countries are among the bestperformers in two pillars (Denmark, Mauritius, Spain,and the United States).All other countries shown in the table demonstrate notable strengths in one areameasured by the Index.
Singapore, Hong Kong, and Ireland are top rankedfor policy rules and regulations.These economies haveput into place overarching policy environments that are
6
1.1:
The
Tra
vel &
Tou
rism
Com
petit
iven
ess
Inde
x 20
09
Figure 1: Composition of the three subindexes of the TTCI
Subindex A:T&T regulatory framework
Health and hygiene
Safety and security
Environmental sustainability
Policy rules and regulations
Prioritization of Travel & Tourism
Subindex B: T&T business environment
and infrastructure
ICT infrastructure
Tourism infrastructure
Ground transport infrastructure
Air transport infrastructure
Price competitiveness in the T&T industry
Subindex C: T&T human, cultural, and
natural resources
Human resources
Affinity for Travel & Tourism
Cultural resources
Natural resources
Travel & Tourism Competitiveness Index
part1.r2 2/26/09 11:58 AM Page 6
The Travel & Tourism Competitiveness Report 2009 © 2009 World Economic Forum

7
1.1:
The
Tra
vel &
Tou
rism
Com
petit
iven
ess
Inde
x 20
09
2009 2008Country/Economy Rank/133 Score Rank/130
Switzerland 1 5.68 1Austria 2 5.46 2Germany 3 5.41 3France 4 5.34 10Canada 5 5.32 9Spain 6 5.29 5Sweden 7 5.28 8United States 8 5.28 7Australia 9 5.24 4Singapore 10 5.24 16United Kingdom 11 5.22 6Hong Kong SAR 12 5.18 14Netherlands 13 5.09 18Denmark 14 5.08 13Finland 15 5.07 12Iceland 16 5.07 11Portugal 17 5.01 15Ireland 18 4.99 21Norway 19 4.97 17New Zealand 20 4.94 19Cyprus 21 4.92 24Belgium 22 4.92 27Luxembourg 23 4.92 20Greece 24 4.91 22Japan 25 4.91 23Czech Republic 26 4.86 30Estonia 27 4.83 26Italy 28 4.78 28Malta 29 4.77 25Barbados 30 4.77 29Korea, Rep. 31 4.72 31Malaysia 32 4.71 32United Arab Emirates 33 4.57 40Croatia 34 4.54 34Slovenia 35 4.53 36Israel 36 4.50 35Qatar 37 4.49 37Hungary 38 4.45 33Thailand 39 4.45 42Mauritius 40 4.43 41Bahrain 41 4.42 48Costa Rica 42 4.42 44Taiwan, China 43 4.40 52Tunisia 44 4.37 39Brazil 45 4.35 49Slovak Republic 46 4.34 38China 47 4.33 62Latvia 48 4.31 45Lithuania 49 4.30 47Bulgaria 50 4.30 43Mexico 51 4.29 55Montenegro 52 4.29 59Puerto Rico 53 4.27 46Jordan 54 4.25 53Panama 55 4.23 50Turkey 56 4.20 54Chile 57 4.18 51Poland 58 4.18 56Russian Federation 59 4.14 64Jamaica 60 4.13 57South Africa 61 4.10 60India 62 4.09 65Uruguay 63 4.09 61Egypt 64 4.09 66Argentina 65 4.08 58Romania 66 4.04 69Dominican Republic 67 4.03 63
(Cont’d.)
2009 2008Country/Economy Rank/133 Score Rank/130
Oman 68 4.01 76Brunei Darussalam 69 3.99 n/aGuatemala 70 3.90 68Saudi Arabia 71 3.89 82Colombia 72 3.89 71Georgia 73 3.89 72Peru 74 3.88 70Morocco 75 3.86 67Azerbaijan 76 3.84 79Ukraine 77 3.84 77Sri Lanka 78 3.82 73Botswana 79 3.81 87Macedonia, FYR 80 3.81 83Indonesia 81 3.79 80Namibia 82 3.77 93Honduras 83 3.77 75Trinidad and Tobago 84 3.75 74Syria 85 3.73 94Philippines 86 3.73 81Gambia, The 87 3.72 84Serbia 88 3.71 78Vietnam 89 3.70 96Albania 90 3.68 92Armenia 91 3.65 89Kazakhstan 92 3.65 91Moldova 93 3.64 98El Salvador 94 3.63 97Kuwait 95 3.63 85Ecuador 96 3.62 86Kenya 97 3.60 101Tanzania 98 3.59 88Suriname 99 3.54 95Zambia 100 3.53 107Senegal 101 3.50 108Guyana 102 3.50 109Nicaragua 103 3.49 99Venezuela 104 3.46 103Mongolia 105 3.46 100Kyrgyz Republic 106 3.45 113Bosnia and Herzegovina 107 3.44 105Cambodia 108 3.43 112Tajikistan 109 3.41 114Ghana 110 3.40 n/aUganda 111 3.38 110Libya 112 3.38 104Pakistan 113 3.33 111Bolivia 114 3.33 106Algeria 115 3.31 102Madagascar 116 3.28 118Malawi 117 3.27 n/aNepal 118 3.25 116Mali 119 3.19 119Benin 120 3.18 120Zimbabwe 121 3.17 117Paraguay 122 3.16 115Ethiopia 123 3.15 121Mozambique 124 3.12 123Cameroon 125 3.09 126Burkina Faso 126 3.08 124Mauritania 127 3.07 122Nigeria 128 3.02 125Bangladesh 129 3.02 127Côte d’Ivoire 130 2.99 n/aBurundi 131 2.98 128Lesotho 132 2.92 129Chad 133 2.52 130
Note that one country covered last year, Uzbekistan, is not included this yearbecause of a lack of Survey data.
Table 1: Travel & Tourism Competitiveness Index 2009 and 2008 comparisons
part1.r2 2/26/09 11:58 AM Page 7
The Travel & Tourism Competitiveness Report 2009 © 2009 World Economic Forum

8
1.1:
The
Tra
vel &
Tou
rism
Com
petit
iven
ess
Inde
x 20
09
1 2 3 4 5 6
0
1
2
3
4
5
6
Figure 2: T&T competitiveness and tourist arrivals
Log
of in
tern
atio
nal t
ouri
st a
rriv
als
(thou
sand
s), 2
007
Travel & Tourism Competitiveness Index score
1 2 3 4 5 6
0
1
2
3
4
5
6
Figure 3: T&T competitiveness and tourism receipts
Log
of in
tern
atio
nal t
ouri
sm re
ceip
ts
(US$
mill
ions
), 20
07
Travel & Tourism Competitiveness Index score
part1.r2 2/26/09 11:58 AM Page 8
The Travel & Tourism Competitiveness Report 2009 © 2009 World Economic Forum
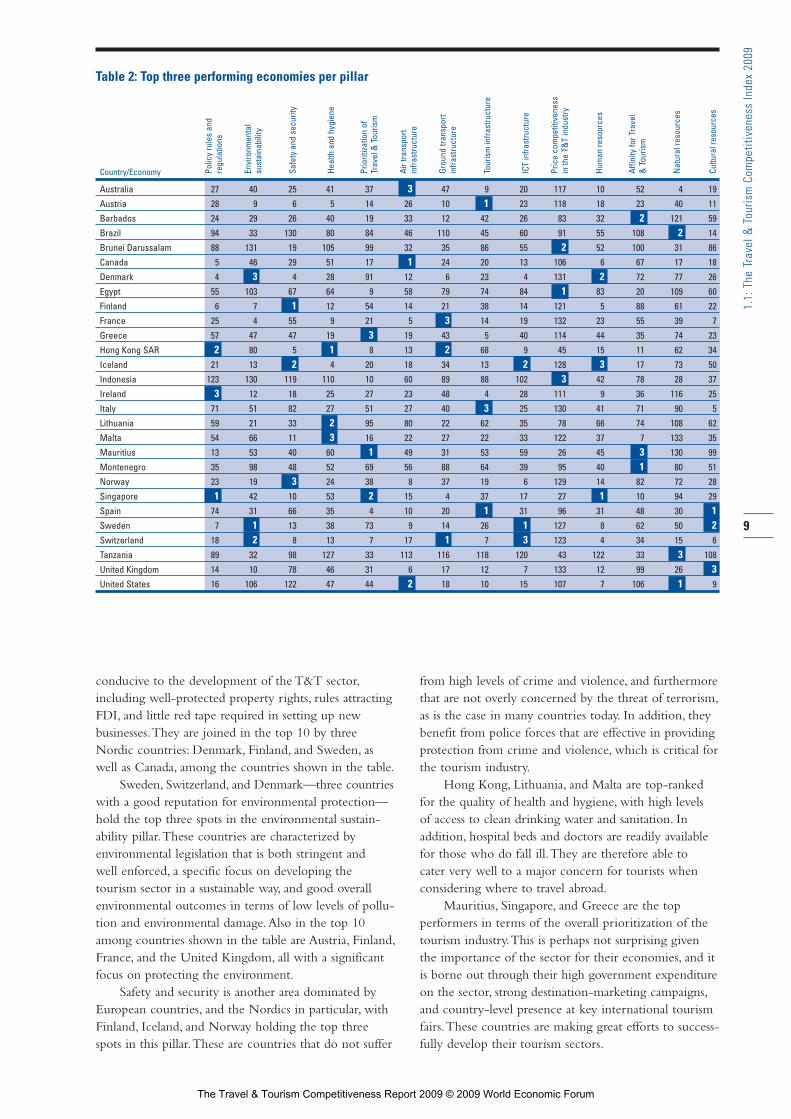
conducive to the development of the T&T sector,including well-protected property rights, rules attractingFDI, and little red tape required in setting up new businesses.They are joined in the top 10 by threeNordic countries: Denmark, Finland, and Sweden, aswell as Canada, among the countries shown in the table.
Sweden, Switzerland, and Denmark—three countrieswith a good reputation for environmental protection—hold the top three spots in the environmental sustain-ability pillar.These countries are characterized by environmental legislation that is both stringent and well enforced, a specific focus on developing thetourism sector in a sustainable way, and good overallenvironmental outcomes in terms of low levels of pollu-tion and environmental damage.Also in the top 10among countries shown in the table are Austria, Finland,France, and the United Kingdom, all with a significantfocus on protecting the environment.
Safety and security is another area dominated byEuropean countries, and the Nordics in particular, withFinland, Iceland, and Norway holding the top threespots in this pillar.These are countries that do not suffer
from high levels of crime and violence, and furthermorethat are not overly concerned by the threat of terrorism,as is the case in many countries today. In addition, theybenefit from police forces that are effective in providingprotection from crime and violence, which is critical forthe tourism industry.
Hong Kong, Lithuania, and Malta are top-rankedfor the quality of health and hygiene, with high levels of access to clean drinking water and sanitation. In addition, hospital beds and doctors are readily availablefor those who do fall ill.They are therefore able to cater very well to a major concern for tourists whenconsidering where to travel abroad.
Mauritius, Singapore, and Greece are the top performers in terms of the overall prioritization of thetourism industry.This is perhaps not surprising giventhe importance of the sector for their economies, and itis borne out through their high government expenditureon the sector, strong destination-marketing campaigns,and country-level presence at key international tourismfairs.These countries are making great efforts to success-fully develop their tourism sectors.
9
1.1:
The
Tra
vel &
Tou
rism
Com
petit
iven
ess
Inde
x 20
09
Table 2: Top three performing economies per pillar
Polic
y ru
les
and
regu
latio
ns
Envi
ronm
enta
l su
stai
nabi
lity
Safe
ty a
nd s
ecur
ity
Heal
th a
nd h
ygie
ne
Prio
ritiza
tion
of
Trav
el &
Tou
rism
Air t
rans
port
infra
stru
ctur
e
Grou
nd tr
ansp
ort
infra
stru
ctur
e
Tour
ism
infra
stru
ctur
e
ICT
infra
stru
ctur
e
Pric
e co
mpe
titiv
enes
s in
the
T&T
indu
stry
Hum
an re
sour
ces
Affin
ity fo
r Tra
vel
& T
ouris
m
Nat
ural
reso
urce
s
Cultu
ral r
esou
rces
Country/Economy
Australia 27 40 25 41 37 3 47 9 20 117 10 52 4 19
Austria 28 9 6 5 14 26 10 1 23 118 18 23 40 11
Barbados 24 29 26 40 19 33 12 42 26 83 32 2 121 59
Brazil 94 33 130 80 84 46 110 45 60 91 55 108 2 14
Brunei Darussalam 88 131 19 105 99 32 35 86 55 2 52 100 31 86
Canada 5 46 29 51 17 1 24 20 13 106 6 67 17 18
Denmark 4 3 4 28 91 12 6 23 4 131 2 72 77 26
Egypt 55 103 67 64 9 58 79 74 84 1 83 20 109 60
Finland 6 7 1 12 54 14 21 38 14 121 5 88 61 22
France 25 4 55 9 21 5 3 14 19 132 23 55 39 7
Greece 57 47 47 19 3 19 43 5 40 114 44 35 74 23
Hong Kong SAR 2 80 5 1 8 13 2 68 9 45 15 11 62 34
Iceland 21 13 2 4 20 18 34 13 2 128 3 17 73 50
Indonesia 123 130 119 110 10 60 89 88 102 3 42 78 28 37
Ireland 3 12 18 25 27 23 48 4 28 111 9 36 116 25
Italy 71 51 82 27 51 27 40 3 25 130 41 71 90 5
Lithuania 59 21 33 2 95 80 22 62 35 78 66 74 108 62
Malta 54 66 11 3 16 22 27 22 33 122 37 7 133 35
Mauritius 13 53 40 60 1 49 31 53 59 26 45 3 130 99
Montenegro 35 98 48 52 69 56 88 64 39 95 40 1 80 51
Norway 23 19 3 24 38 8 37 19 6 129 14 82 72 28
Singapore 1 42 10 53 2 15 4 37 17 27 1 10 94 29
Spain 74 31 66 35 4 10 20 1 31 96 31 48 30 1Sweden 7 1 13 38 73 9 14 26 1 127 8 62 50 2Switzerland 18 2 8 13 7 17 1 7 3 123 4 34 15 6
Tanzania 89 32 98 127 33 113 116 118 120 43 122 33 3 108
United Kingdom 14 10 78 46 31 6 17 12 7 133 12 99 26 3United States 16 106 122 47 44 2 18 10 15 107 7 106 1 9
part1.r2 2/26/09 11:58 AM Page 9
The Travel & Tourism Competitiveness Report 2009 © 2009 World Economic Forum
The air transport infrastructure pillar is dominatedby three predominantly English-speaking countries:Canada, the United States, and Australia.These are vastcountries that are highly dependent on air transport, andindeed they are home to many airports and operatingairlines, which are providing quality service and highlevels of air traffic.This makes air travel easy and com-fortable for tourists. Other countries shown in the tablethat are among the top 10 in this pillar are France,Norway, Sweden, and the United Kingdom, also coun-tries that are highly connected to international marketsthrough air transport.
The best ground transport infrastructure is found inSwitzerland, Hong Kong, and France.These countrieshave high-quality roads, railroads, and ports and also arecharacterized by ground transport networks that worktogether seamlessly.Travelers in these economies can getfrom one place to another without hassle and complica-tion, adding to their attractiveness as destinations.
The tourism infrastructure pillar is also dominatedat the very top by European countries, and is mosthighly rated in Austria and Spain (tied for 1st place), aswell as Italy.Visitors to these countries have many hotelsto choose from, excellent car rental facilities, and manyATMs for withdrawing cash. In other words, visitorshave choices in how they visit, travel, and move aroundin these countries, with the necessary facilities for acomfortable stay.
Middle Eastern and Asian countries dominate thetop of the price competitiveness pillar, with Egypt, Brunei,and Indonesia ranked 1st, 2nd, and 3rd, respectively.Brunei benefits from low ticket taxes and airport charges,and low taxation more generally. Egypt and Indonesiaare characterized by moderate-to-low taxes, low fuelprices, and highly competitive hotel prices.Whenchoosing a destination, these countries benefit frommany visitors’ interest in getting more for their money.
Singapore, Iceland, and Denmark, three countriesthat have placed a significant focus on education inrecent years, hold the top three spots in the humanresources pillar.These countries have excellent educa-tional systems as well as top-notch training facilities andvery healthy workforces. In addition, they are character-ized by flexible labor markets (for example, through themuch-discussed flexicurity system in Denmark), whichmakes it much easier to manage the seasonal hiring socritical for the T&T industry.
The countries with the top three assessments forthe affinity for Travel & Tourism are Montenegro,Barbados, and Mauritius.This is in line with the impor-tance of tourism for their economies, with all three displaying great openness to foreign travelers and withtheir business communities also expressing their sense ofthe great value of tourism on offer in their countries. Itgoes without saying that the friendliness and opennessto travelers is a key characteristic making destinationsmore appealing to tourists.
The top three countries in the natural resources pillar span three continents: the United States, Brazil,and Tanzania.These countries each have several WorldHeritage natural sites, much protected land area, andrich fauna as measured by the total known species livingin them.Within the table we see that Australia is ranked4th, also offering rich natural resources to visitors.Thesecountries have the great fortune to be endowed withsuch inherent attractions for tourists interested in naturetourism.
Finally, Spain, Sweden, and the United Kingdomare the top three ranked countries for their culturalresources.All three have a large number of WorldHeritage cultural sites, strong creative industries, manyinternational fairs and exhibitions held in the country,and significant sports stadium capacities.These attributescome together to provide a variety of cultural attractionsfor visitors, as is also the case in Switzerland, France,Italy, and the United States, the other countries shownin Table 2 that are among the top 10 in this pillar.
More details on the T&T competitiveness of specif-ic countries will be discussed in the section below.
Regional rankingsThis section will discuss some of the highlights of therankings in a regional context, grouping countries intothe following four regional groups: the Americas, Europe,Middle East and Africa, and Asia Pacific (includingCentral Asia). For further details for each of the 133economies included in this Index, we provide two-pageprofiles in Part 2 of the Report. The profiles show therankings on each subindex and pillar, as well on each ofthe 73 factors included in the Index.
EuropeTable 1 shows that many countries from Europe do verywell in the rankings, with all of the top four placestaken by European countries, and six of the top-10countries hailing from the region.Table 3 shows therankings just for European countries, with the first column showing the rank within the region, and thesecond column showing the overall rank out of all 133countries included in the Index this year.As the tableshows, Switzerland is ranked 1st out of all countries inthe 2009 TTCI, followed by Austria and Germany—the same top three countries for the past three years.
Switzerland is a country rich in cultural and natu-ral resources, including an impressive number of WorldHeritage cultural and natural sites for a country of itssize.A large percentage of the country’s land area is pro-tected (ranked 16th) and the natural environment isassessed as being among the most pristine in the world(ranked 9th).This natural heritage is buttressed by astrong national focus on environmental sustainability:Switzerland is ranked 2nd overall on this pillar, based onstrong and well-enforced environmental legislation and
10
1.1:
The
Tra
vel &
Tou
rism
Com
petit
iven
ess
Inde
x 20
09
part1.r2 2/26/09 11:58 AM Page 10
The Travel & Tourism Competitiveness Report 2009 © 2009 World Economic Forum

with a particular focus on developing the T&T sectorsustainably.
Switzerland is not only an attractive leisure tourismdestination, but is also an important business travel hub,with many international fairs and exhibitions held in the country each year. Staffing of the industry is alsofacilitated by the availability of qualified labor to workin Travel & Tourism (ranked 3rd), perhaps not surprisingin a country with many of the best hotel managementschools.Added to these strengths is Switzerland’s excellentground transport infrastructure (ranked 1st worldwide),with top-quality roads and railroads and an excellent
domestic transport network.Also well assessed is thespecific tourism infrastructure (ranked 7th), with readilyavailable hotel rooms and automated teller machines(ATMs) for cash withdrawals. Such high-quality infra-structure makes a tourist’s stay in the country easy andcomfortable, an experience that is reinforced by thehigh level of general safety and security (ranked 8th).
Austria is ranked 2nd in Europe and out of allcountries in the TTCI, a ranking attributable to its richcultural resources, with eight World Heritage culturalsites and with many fairs and exhibitions catering tobusiness travelers.The natural environment is also well
11
1.1:
The
Tra
vel &
Tou
rism
Com
petit
iven
ess
Inde
x 20
09
Table 3: The Travel & Tourism Competitiveness Index: Europe
SUBINDEXES
T&T business environment T&T human, cultural, OVERALL INDEX T&T regulatory framework and infrastructure and natural resources
Country/Economy Regional rank Overall rank Score Rank Score Rank Score Rank Score
Switzerland 1 1 5.68 1 6.01 1 5.49 2 5.54Austria 2 2 5.46 4 5.91 6 5.22 7 5.24Germany 3 3 5.41 13 5.56 3 5.44 9 5.22France 4 4 5.34 8 5.67 7 5.22 11 5.13Spain 5 6 5.29 29 5.29 8 5.21 5 5.36Sweden 6 7 5.28 12 5.57 14 5.04 8 5.23United Kingdom 7 11 5.22 28 5.29 11 5.07 6 5.30Netherlands 8 13 5.09 22 5.44 9 5.08 17 4.75Denmark 9 14 5.08 10 5.59 10 5.08 28 4.57Finland 10 15 5.07 5 5.82 25 4.69 21 4.71Iceland 11 16 5.07 3 5.92 17 4.93 39 4.37Portugal 12 17 5.01 15 5.52 24 4.74 16 4.78Ireland 13 18 4.99 7 5.73 22 4.79 32 4.45Norway 14 19 4.97 9 5.64 19 4.84 36 4.42Cyprus 15 21 4.92 25 5.35 13 5.05 37 4.38Belgium 16 22 4.92 21 5.45 32 4.56 20 4.73Luxembourg 17 23 4.92 20 5.47 16 4.97 42 4.30Greece 18 24 4.91 18 5.49 27 4.66 27 4.58Czech Republic 19 26 4.86 16 5.50 36 4.41 24 4.67Estonia 20 27 4.83 17 5.50 21 4.81 47 4.19Italy 21 28 4.78 46 4.96 26 4.68 22 4.71Malta 22 29 4.77 11 5.58 31 4.58 52 4.15Croatia 23 34 4.54 43 5.02 37 4.32 43 4.28Slovenia 24 35 4.53 38 5.13 33 4.53 61 3.94Hungary 25 38 4.45 26 5.35 42 4.06 59 3.95Slovak Republic 26 46 4.34 34 5.20 54 3.78 55 4.05Latvia 27 48 4.31 32 5.22 43 4.04 86 3.68Lithuania 28 49 4.30 30 5.27 46 3.98 89 3.65Bulgaria 29 50 4.30 56 4.74 48 3.96 46 4.20Montenegro 30 52 4.29 50 4.86 66 3.57 35 4.43Turkey 31 56 4.20 63 4.60 60 3.73 44 4.28Poland 32 58 4.18 72 4.44 68 3.53 29 4.56Russian Federation 33 59 4.14 79 4.35 61 3.70 38 4.37Romania 34 66 4.04 61 4.68 64 3.61 77 3.83Georgia 35 73 3.89 33 5.20 99 2.84 92 3.64Ukraine 36 77 3.84 62 4.66 72 3.37 103 3.50Macedonia, FYR 37 80 3.81 69 4.46 75 3.29 87 3.67Serbia 38 88 3.71 78 4.35 80 3.20 96 3.57Albania 39 90 3.68 77 4.38 104 2.76 66 3.89Armenia 40 91 3.65 58 4.70 105 2.75 102 3.51Moldova 41 93 3.64 67 4.53 95 2.95 110 3.43Bosnia and Herzegovina 42 107 3.44 96 4.11 93 2.96 124 3.25
part1.r2 2/26/09 11:58 AM Page 11
The Travel & Tourism Competitiveness Report 2009 © 2009 World Economic Forum
assessed, along with the country’s focus on environmen-tal sustainability (ranked 9th). In addition,Austrians areperceived as open and welcoming to foreign travelers.Austria’s tourism infrastructure is assessed as second tonone, with abundant car rental facilities, hotel accom-modations, and ATMs. Other strengths include Austria’sassessment as one of the safest countries in the world(ranked 6th) and its excellent health and hygiene levels(ranked 5th).
Germany, ranked 3rd out of all countries, is alsocharacterized by abundant cultural resources, ranked 4thworldwide for its 32 World Heritage cultural sites and2nd for the number of international fairs and exhibitionsheld in the country.The country’s infrastructure is amongthe best in the world, ranked 5th for the quality of itsground transport infrastructure and 7th for its air trans-port infrastructure. In addition, Germany gets somewhatbetter marks than Switzerland and Austria for the policyrules and regulations affecting the T&T industry: it isranked 17th in this area, with transparent policymaking,well-protected property rights, and bilateral Air ServiceAgreements that are assessed as open.
France moves up this year by six places, ranked 4thout of all 133 countries. France attracts tourists with itsrich cultural heritage (ranked 4th for the number ofWorld Heritage cultural sites and 7th for creative indus-tries).The country also hosts many international fairsand exhibitions (ranked 5th), thereby attracting businesstravelers as well. France’s ground transport infrastructureis among the best in the world (ranked 3rd), with thequality of roads and railroads particularly well assessed,as well as its air transport infrastructure (ranked 5th).The country’s improvement is in part attributable to a stronger perceived prioritization by the government of the sector and increased marketing of the countrythrough participation in a larger number of internation-al tourism fairs. Ensuring the sustainable development ofthe sector is also a significant priority for the government,with France ranked a high 4th on this pillar, with strongand well-enforced environmental legislation.
Spain is ranked just behind France within Europe,at 6th place overall. Spain is ranked 1st out of all coun-tries for the richness of its cultural resources, with manyWorld Heritage sites, a large number of internationalfairs and exhibitions, and significant sports stadiumcapacity. Spain’s tourism infrastructure is ranked 1stinternationally, with many hotel rooms, car rental facili-ties, and ATMs, and its air transport infrastructure alsogets good marks (ranked 10th).The government priori-tizes the sector significantly, and the country makes strongefforts to attract tourists through strong destination-marketing campaigns and by ensuring Spain’s presenceat many international tourism fairs. Spain’s T&T com-petitiveness is discussed in Box 1.
Greece is ranked 18th in Europe and 24th overall,with a stable performance compared with last year.Thecountry benefits from rich cultural resources (ranked
23rd), excellent health and hygiene (ranked 19th over-all), and top-notch tourism infrastructure (5th). Greeceis ranked a very high 3rd in terms of the country’s over-all prioritization of Travel & Tourism. Further, there is astrong national affinity for tourism compared with manyother European countries, including a generally openand positive attitude toward tourists (16th).The country’soverall ranking is held back, however, by its policy rulesand regulations that are not entirely supportive of thesector’s development (ranked 57th), with stringent rulesgoverning foreign direct investment (FDI), and with for-eign ownership restrictions as well as significant timeand cost involved in starting a new company.Anotherarea of weakness is the country’s ground transport infra-structure, which is less efficient than in many otherEuropean countries (the quality of railroads and portsbeing of particular concern).
Italy, despite being endowed with the most WorldHeritage cultural sites in the world, ranks only 21stwithin Europe and 28th overall (the same rank as lastyear).As well as its cultural richness, Italy’s strengths liein areas such as the health and hygiene of the country(27th), its air transport infrastructure (27th), and espe-cially its excellent tourism infrastructure (3rd). However,it faces a number of challenges that bring its overall rating down.These include policy rules and regulations,where Italy ranks 71st (even lower than last year)because of its very strong foreign ownership restrictions(ranked 106th) and rules governing FDI (122nd).Further, the government is not seen to be prioritizingthis sector (107th), which is so important to the overalleconomy. In addition, ground transport infrastructurerequires upgrading, there is insufficient focus on devel-oping the sector in an environmentally sustainable way,and there are some safety and security concerns in thecountry (82nd).
Croatia, a country well known for its tourismindustry and that is aiming to join the European Union(EU) in the coming years, is ranked 23rd in Europe and34th overall, on a par with countries such as Malaysiaand the United Arab Emirates and well ahead of severalEU members. Croatia’s performance has remained stablesince last year. It is endowed with six cultural and onenatural World Heritage sites, and is ranked a high 9th interms of its overall affinity for Travel & Tourism. Inaddition, the country’s tourism-specific infrastructure isranked 6th out of all 133 countries. On the other hand,in order to improve the sector’s competitiveness further,a goal will be to further upgrade ground transport infra-structure, particularly ports (ranked 90th) as well as airtransport infrastructure, and to bring policy rules andregulations in the country more in line with those thatare needed for developing the sector (presently ranked80th).
Turkey is ranked 31st in Europe and 56th in theTTCI, down two places since last year.The country certainly benefits from its rich cultural heritage, with 11
12
1.1:
The
Tra
vel &
Tou
rism
Com
petit
iven
ess
Inde
x 20
09
part1.r2 2/26/09 11:58 AM Page 12
The Travel & Tourism Competitiveness Report 2009 © 2009 World Economic Forum

13
1.1:
The
Tra
vel &
Tou
rism
Com
petit
iven
ess
Inde
x 20
09
Box 1: Will Spain’s Travel & Tourism miracle stand the test of time?
For many years, the tourism industry has been critical to Spain’seconomy, an importance that has increased over recent years,as shown in the figure. In 2008, the tourism industry—whichincludes the activities of traditional providers such as airlinesand hotels—accounted for US$102 billion and 7 percent of totalemployment. Overall the sector accounts for 23 percent of thecountry’s total export earnings, significantly affecting Spain’scurrent account.1 Largely as a result of the government’s con-tinuous efforts to promote the tourism sector, in 2007 Spainplaced as the second most important tourism destination world-wide according to the UNWTO, with nearly 60 million visitorarrivals, and raising nearly US$58 billion in tourism receipts.
Spain certainly is one of the countries with the strongestT&T competitiveness in the world, ranking 6th in the 2009 Travel& Tourism Competitiveness Index (TTCI). Given the importanceof the sector for Spain’s economy, it is perhaps not surprising tosee that the country strongly prioritizes the T&T sector (ranking4th in this pillar). In 2008, the Spanish government’s expenditureon tourism was among the highest internationally, accountingfor 6.4 percent of its overall budget. Spain was also present atmost of the main international tourism fairs (ranked 3rd) and haseffective destination-marketing and branding campaigns toattract tourists (ranked 16th). Madrid and Barcelona, Spain’stwo principal cities, were ranked 13th and 7th, respectively, outof 40 cities in the Anholt City Brand Index in 2007, which meas-ures the perceived attractiveness of the most important citiesworldwide.2
As a tourism leader, Spain has developed a strong T&Tbusiness environment and infrastructure, for which it is ranked8th overall. Spain is notably ranked 1st in the tourism infrastruc-ture pillar, being 1st overall for both the presence of car rental
companies and the number of ATMs accepting Visa cards in thecountry, and 7th for available hotel rooms. Yet it is important tonote that the build-up of the country’s accommodation infra-structure has in some regions come at the expense of creatingovercrowded tourist locations and damaging the quality of theenvironment.
In fact, with regard to environmental sustainability, Spaindemonstrates a more nuanced performance (ranked 31st in thispillar). On one hand, the government is making a statement ofits commitment to environmental protection by ratifying thegreat majority of the most important environmental treaties(ranked 2nd). However, the actual stringency and enforcementof the country’s environmental regulation is not as evident,ranking 36th and 37th, respectively. And indeed, in terms ofenvironmental indicators, the rankings are low: the percentageof threatened species is ranked 96th and carbon dioxide emis-sions is ranked 94th. Overall, Spain should consider enhancingits environmental performance in order to ensure that thegrowth of its T&T sector takes place in a sustainable manner,enabling the country to reap the long-term benefits of its devel-opment.
Regarding Spain’s transportation sector, the country hasvery good air transportation infrastructure (10th), with 134 air-lines operating in the country (ranked 6th) and a large airlinepassenger-carrying capacity, as measured by available seatkilometers (ranked 10th for domestic and 6th for internationalflights). The country also boasts good ground transport infra-structure, with an extensive network of roads and trains.However, despite this good assessment of the quantity of trans-port infrastructure, the Spanish Institute for Tourism Studies(Instituto de Estudios Turisticos) identifies improving its quality
Selected T&T indicators for Spain, 1995–2007
Source: International tourist receipts and arrivals, UNWTO; Workers on the payroll and registered for Social Security in characteristic tourism activities, Spanish Minister of Industry, Tourism and Trade.
0
500
1,000
1,500
2,000
2,500
0
10,000
20,000
30,000
40,000
50,000
60,000
70,000
1997 19991995 2001 2003 20051998 20001996 2002 2004 2006 2007
T&T
indu
stry
em
ploy
men
t (th
ousa
nds)
International tourist arrivals (thousands, left axis)International tourist receipts (US$ millions, left axis)T&T industry employment (thousands, right axis)
(Cont’d.)
part1.r2 2/26/09 11:58 AM Page 13
The Travel & Tourism Competitiveness Report 2009 © 2009 World Economic Forum

World Heritage cultural sites, several international fairsand exhibitions, and strong creative industries. However,its overall T&T competitiveness is held back by worriesabout safety and security (92nd), particularly related toterrorism and road safety, and by increasing concernsabout the ability of the police to provide protectionfrom crime and violence. Health and hygiene is also acomparative weakness (62nd), as well as ground transportinfrastructure inadequacies (especially railroads andports). In addition, further attention must be placed onprotecting the country’s natural resources (it is ranked104th for environmental sustainability).
Russia is ranked 33rd in Europe and 59th overall,up five places since last year.The country gets relativelyhigh marks for natural resources (23rd) and culturalresources (30th), due in particular to its many WorldHeritage sites. It also has a quite well developed airtransport infrastructure (30th), an assessment that hasimproved somewhat since last year. However, groundtransport infrastructure (81st) and tourism infrastructure
(60th) get lower marks, with few available hotel roomsin particular. Safety and security issues are also of seriousconcern (129th), with a high level of crime and violence,a lack of trust in the police to provide protection fromcrime, and a high mortality rate from road traffic accidents. Most strikingly, Russia is assessed as having avery unconducive policy environment (114th) due, forexample, to extremely high foreign ownership restric-tions, property rights that are not well protected, andvisa requirements for visitors from many countries.Alack of focus on environmental sustainability, ranked114th, is also an area of concern. More generally, thesector is not seen to be a priority of the government,ranked a low 127th overall.
At the bottom of the European rankings are anumber of Balkan countries (Macedonia, Serbia,Albania, and Bosnia and Herzegovina), as well asArmenia and Moldova. In line with their less-advanceddevelopment, these countries will require significant
14
1.1:
The
Tra
vel &
Tou
rism
Com
petit
iven
ess
Inde
x 20
09
Box 1: Will Spain’s Travel & Tourism miracle stand the test of time? (cont’d.)
through better international air connections and strongerground modes interconnectivity as areas for improvement.3 Thisis echoed by the national plan for the development of thetourism industry (Plan de Turismo 2020), which deplores theinsufficient international air connections (ranked 41st in theTTCI), particularly with important international markets such asAsia.4
Spain is ranked a high 5th for its T&T human, cultural, andnatural resources. Among its strengths to attract tourists, Spainhas a healthy and qualified labor force and a rich cultural offer-ing, with a remarkable 39 World Heritage cultural sites (ranked2nd on this indicator). As an example of Spain’s efforts to pre-serve its national heritage, the Ministry of Tourism has createda state-owned company called Paradores de España, which isin charge of the management and conservation of importantstate properties, many of which have been transformed intohotels. Furthermore, Spain is one of the largest exporters ofcreative products such as films, fashion, and literature and thecountry hosts a large number of international fairs and confer-ences every year. In addition, the Spanish soccer league isamong the most prestigious in the world, attracting many fans.All the autonomous governments have invested in building largecapacity sports stadiums in the main capitals (ranked 15thnationally) hosting internationally recognized teams such as FCBarcelona and Real Madrid.
As well as reinforcing the country’s environmental man-agement, Spain should also improve the policy rules and regula-tions affecting its tourism industry, an area where it ranks just74th. In particular, the country should focus on ensuring greater
openness through the bilateral Air Service Agreements intowhich it has entered (ranked 84th) and reducing the time need-ed to start a business in the country (ranked 109th).
Finally, as is the case for many European countries, pricecompetitiveness has become a challenge for Spain. This is apillar where the country is ranked 96th, due in part to an expen-sive euro and rising prices more generally. This is reflected inthe relatively high price of hotel rooms (Spain is ranked 63rd inthe hotel price index) and low purchasing power (111th). Fuelprices are also among the highest in the world (ranked 91st),increasing the price of travel in the country.
To summarize, Spain provides many examples of T&T bestpractices. The country’s Plan de Turismo 2020 clearly aims toaddress many of the challenges identified by the TTCI, notablythe creation of friendlier policies for the sector and a strongerfocus on environmental sustainability. Making these improve-ments will be critical for Spain in ensuring continued T&T com-petitiveness going into the future, in the context of ever-increasing competition among destinations.
Notes1 WTTC 2008b.
2 The Anholt City Brands Index 2007, How the World Views ItsCities, Third Edition, 2007. See http://www.simonanholt.com/for further information.
3 Turismo 2020 2008.
4 Turismo 2020 2008.
part1.r2 2/26/09 11:58 AM Page 14
The Travel & Tourism Competitiveness Report 2009 © 2009 World Economic Forum

15
1.1:
The
Tra
vel &
Tou
rism
Com
petit
iven
ess
Inde
x 20
09
investments in upgrading the infrastructure needed tosupport healthy and growing T&T sectors.
The AmericasTable 4 shows the regional rankings for the countries inthe Americas.As the table shows, Canada is the high-est-ranked country in the region, ranked 5th out of all133 countries and with an improvement of four placesallowing it to overtake the United States this year forthe top regional spot. Canada’s natural resources consti-tute a key strength, with the country’s nine WorldHeritage natural sites placing it 4th internationally. Itscultural resources are also a strong point, with manyinternational fairs and exhibitions in the country andstrong creative industries in particular. Canada’s air trans-port infrastructure is ranked 1st out of all countries, andit also gets good marks for its tourism and ICT infra-structure, facilitating the online T&T environment.Canada’s policy environment is very conducive to thedevelopment of the sector (ranked 5th, up three placesfrom last year), and the government is seen to be morestrongly prioritizing the sector than last year. For moredetails on Canada’s T&T competitiveness see Box 2.
The United States is ranked 2nd in the Americasand 8th out of all countries, down one position fromlast year.The country places 2nd for the overall business
environment and infrastructure and 1st for the country’shuman, cultural, and natural resources. In particular, theUnited States has an excellent air transport infrastructure(ranked 2nd) and high-quality tourism and ICT infra-structure. Its natural resources are ranked 1st out of allcountries, with many nationally protected areas andmany World Heritage natural sites, although a perceptionexists that the environment is not being sufficiently pro-tected (ranked 106th for environmental sustainability).Safety and security, ranked 122nd, is also of concern: aswell as worries about crime and violence, the countryhas one of the highest death rates from road traffic acci-dents out of all countries covered (ranked 125th).
Barbados is ranked 3rd in the region, at 30thoverall, down one place from last year. Barbados isranked 2nd overall for the country’s affinity for Travel &Tourism, with a positive attitude toward tourists andtoward the value of tourism in the country.The govern-ment is prioritizing the sector to a very high degree(ranked 2nd), spending a high percentage of GDP onthe sector and ensuring effective destination-marketingcampaigns. Further, the country has a regulatory envi-ronment that is quite conducive to the development ofthe sector, requiring few visitors to have visas to enterthe country and with open bilateral Air ServiceAgreements.
Table 4: The Travel & Tourism Competitiveness Index: The Americas
SUBINDEXES
T&T business environment T&T human, cultural, OVERALL INDEX T&T regulatory framework and infrastructure and natural resources
Country/Economy Regional rank Overall rank Score Rank Score Rank Score Rank Score
Canada 1 5 5.32 23 5.41 4 5.36 10 5.19United States 2 8 5.28 57 4.70 2 5.47 1 5.67Barbados 3 30 4.77 19 5.47 29 4.62 45 4.21Costa Rica 4 42 4.42 48 4.94 55 3.77 31 4.54Brazil 5 45 4.35 95 4.12 69 3.53 4 5.40Mexico 6 51 4.29 80 4.34 62 3.66 13 4.87Puerto Rico 7 53 4.27 44 4.99 41 4.10 84 3.71Panama 8 55 4.23 53 4.80 56 3.77 53 4.14Chile 9 57 4.18 49 4.87 58 3.76 64 3.92Jamaica 10 60 4.13 51 4.85 57 3.76 80 3.76Uruguay 11 63 4.09 45 4.98 74 3.33 57 3.96Argentina 12 65 4.08 74 4.40 70 3.51 41 4.34Dominican Republic 13 67 4.03 54 4.75 71 3.46 68 3.88Guatemala 14 70 3.90 81 4.32 81 3.20 48 4.17Colombia 15 72 3.89 91 4.18 88 3.08 34 4.43Peru 16 74 3.88 89 4.24 92 2.96 33 4.43Honduras 17 83 3.77 83 4.31 87 3.08 63 3.92Trinidad and Tobago 18 84 3.75 100 4.04 51 3.82 112 3.38El Salvador 19 94 3.63 73 4.42 83 3.19 123 3.28Ecuador 20 96 3.62 103 4.01 97 2.91 62 3.93Suriname 21 99 3.54 110 3.86 91 3.01 79 3.76Guyana 22 102 3.50 94 4.14 111 2.68 88 3.66Nicaragua 23 103 3.49 98 4.05 101 2.79 93 3.63Venezuela 24 104 3.46 122 3.63 86 3.12 91 3.65Bolivia 25 114 3.33 127 3.33 110 2.70 58 3.96Paraguay 26 122 3.16 116 3.74 130 2.44 122 3.30
part1.r2 2/26/09 11:58 AM Page 15
The Travel & Tourism Competitiveness Report 2009 © 2009 World Economic Forum

16
1.1:
The
Tra
vel &
Tou
rism
Com
petit
iven
ess
Inde
x 20
09
Box 2: Revitalizing Canadian tourism growth
With its rich cultural resources and diverse and beautiful land-scapes, Canada has become an internationally popular touristdestination. According to the UNWTO, in 2007 Canada earnedmore than US$15 billion in tourism receipts and was the world’s13th most important tourist destination, attracting almost 18 mil-lion tourists. In 2008, Canada’s tourism industry accounted for 3percent of GDP and 3.4 percent of the country’s total employ-ment.1 Canada places 5th in the 2009 Travel & TourismCompetitiveness Index (TTCI), the highest ranked country in theAmericas, with strong performances in many areas measured.
Canada’s natural attractions are plentiful. In terms of natu-ral resources, the country boasts nine World Heritage naturalsites, placing it a high 4th in this indicator. The country is alsohome to several World Heritage cultural sites and a significantshare of creative industry exports (8th), and hosts many interna-tional fairs and exhibitions. As an example of the government’sefforts to further promote cultural tourism, the Canada TourismCommission (CTC) has been working on a proposal forAboriginal Tourism, which has been identified as a potentialattraction for tourists.2
Canada has many positive attributes beyond the culturaland natural. The country is ranked 5th for policy rules and regu-lations related to the tourism sector, based on factors such asthe low cost (5th) and little time required (6th) to start a busi-ness in the country, as well as the openness of the bilateral AirService Agreements into which Canada has entered (10th). Itshuman resources are among the best in the world (6th), withhighly educated and well-trained workers, although the CTCdeplores the shortage of labor in the tourism sector.3
Canada’s transport infrastructure is also world class.Canada ranks 1st out of all countries for its air transport infra-structure, based in particular on the large number of airlinesoperating in the country and its well-functioning internationalair transport network. Canada also has an excellent groundtransport network, with high-quality roads, railroads, and ports,which are connected seamlessly, making it easy for travelers tomove around the country.
Canada also boasts good ICT infrastructure (ranked 13thoverall), with one of the highest rates of Internet users world-wide (4th) and extensive Internet use by businesses (8th). TheCanadian government has supported efforts toward creatingand promoting online tools that will help to attract a larger num-ber of potential travelers. During the last two years, Canadianshave invested in e-marketing and other online tools such as theprovision of relevant content in the sites telling stories aboutthe country, a toolkit available for stakeholders to help them useCanada’s brand and test the quality of their products, and onlinesurveys to learn about the different type of tourists to matchtheir needs. All these tools allow the various industry actors tointeract and create common strategies for promoting the differ-ent regions and ensuring a standard quality of services acrossthe country.4
Recent analysis by the CTC showed 81 percent of visitorsconsider Canada to be an environmentally friendly country.5 Yetsome areas for improvement do remain for boosting the coun-try’s T&T competitiveness further and ensuring its continuity
into the future. Canada’s results with regard to environmentalsustainability are mixed, resulting in a middling rank of 46 in this pillar. On one hand, business executives perceive that thegovernment has put into place relatively stringent and well-enforced environmental regulations, ranked 20th and 17th,respectively, although they are somewhat less positive aboutefforts to specifically ensure the sustainability of the T&T indus-try (31st). Some environmental indicators are worrisome, suchas high carbon dioxide emissions (121st) and the percentage ofthreatened species (50th). This is of particular concern giventhe importance of the natural environment for Canada’s tourism,coupled with the fact that, in recent years, sustainable tourismhas become a sensitive issue among consumers.
Finally, Canada appears near the bottom of the rankingwith regard to price competitiveness (ranked a low 106th). Theexchange rate has been identified as one of the main chal-lenges for the sector’s price competitiveness. In order to makethe country a more price attractive destination for tourists, in2006 the government reduced taxes on goods and services. Yet,despite efforts made in this area, the Canadian dollar is stillgenerally high against the yen and the US dollar, making travel-ers from the United States and Japan, two of Canada’s mainmarkets, less eager to visit the country.5
As a demonstration of its commitment to the sector, in 2006the Minister of Tourism developed a national strategy to pro-mote Canada as an even more accessible and appealing desti-nation through the facilitation of border crossing and trans-portation, the development of new tourism products, ensuringsufficient labor availability to meet the sector’s demand, andimprovement of the main tourism statistics.6 This has been cou-pled with efforts to improve destination marketing to attracttourists to the country: in 2007, the CTC launched the globaltourism campaign Canada: Keep Exploring in an effort toimprove and differentiate the Canada brand. In addition, the CTChas developed a marketing strategy targeted at the winterOlympic Games to be held in Vancouver in 2010.7 The CTC hasbeen targeting tourists from a wide range of markets, focusingon those from the Americas, Asia, and Europe in an effort toensure a regional diversification of revenues.8 With such con-certed efforts, the outlook overall seems quite positive forCanada’s T&T development going into the future.
Notes1 WTTC 2008c.
2 Canadian Tourism Commission 2008.
3 Canadian Tourism Commission 2008.
4 Canadian Tourism Commission 2008.
5 Canadian Tourism Commission 2008.
6 Canadian Tourism Commission. 2007a.
7 OECD 2008.
8 Canadian Tourism Commission. 2007b.
part1.r2 2/26/09 11:58 AM Page 16
The Travel & Tourism Competitiveness Report 2009 © 2009 World Economic Forum

Costa Rica is ranked 4th in the region and 42ndoverall, up two places from last year.The country getsexcellent marks for its natural resources (ranked 6th),with several World Heritage sites, a high percentage ofnationally protected areas, and its very diverse fauna.Given the importance of the natural environment forthe county’s tourism industry, it is notable that it ranks ahigh 27th overall for environmental sustainability, anarea of measurable improvement since last year. However,safety and security remains a concern (72nd). Further,although its tourism infrastructure is well developed(33rd), with a strong presence of major car rental com-panies and abundant hotel rooms, ground transportinfrastructure requires significant upgrading (103rd),particularly roads and ports, making travel in the country somewhat difficult.
Brazil is ranked 5th in the Americas and 45thoverall, having seen an improvement of four places sincelast year.The country is ranked 2nd out of all countriesfor its natural resources and 14th for its cultural resources,with many World Heritage sites, a great proportion ofprotected land area, and the most diverse fauna in theworld.This is buttressed by a focus on environmentalsustainability (ranked 33rd). However, the ground trans-port network remains underdeveloped, with the qualityof roads, ports, and railroads ranked 110th, 123rd, and86th, respectively. Safety and security continues to be ofserious concern, ranked 130th overall, just behind SouthAfrica and Russia.The country also suffers greatly froma lack of price competitiveness (91st), attributable in partto high ticket taxes and airport charges in the country,as well as high prices and high taxation more generally.Further, the overall policy environment is not particular-ly conducive to the development of the sector (ranked95th), with discouraging rules on FDI and much timerequired for starting a business.
Mexico is ranked just behind Brazil in the regionalranking at 6th place and comes in at 51st place overall,an improvement of four places. Mexico gets quite highmarks for its natural resources (ranked 18th), and this isan area where it has shown an improvement since lastyear, with one more natural World Heritage site addedin the interval.The country’s cultural resources are alsovery rich (20th), with 26 World Heritage cultural sites,several international fairs and exhibitions, and strongcreative industries.These inherent strengths are rein-forced by the overall prioritization of the sector in thecountry (35th), with country-level participation at manyT&T fairs and effective marketing and branding cam-paigns for attracting tourists. Some areas requiring atten-tion are the tourism infrastructure (49th) and, especially,the ground transport infrastructure (84th). In addition,Mexico is ranked a low 77th for its price competitive-ness, due especially to very high ticket taxes and airportcharges (ranked 126th overall). Health and hygieneissues remain to be tackled (ranked 74th), and, in partic-ular, safety and security continues to be a major concern,
ranked 126th with high levels of crime and violence,a police force that cannot be relied on to provide protection from crime, and many deaths from road traffic accidents.
Puerto Rico is ranked 7th in the region and 53rdoverall, down seven places since last year. Puerto Ricohas a number of strengths, which include a policy envi-ronment that is conducive to the development of thesector (15th) and efforts to ensure environmental sus-tainability (11th). Puerto Rico’s air and ground transportinfrastructure are also well assessed (ranked 29th and30th, respectively).The quality of human resources is acomparative strength as well, particularly by regionalstandards, with Puerto Rico ranked 35th on this pillar.On the other hand, its T&T competitiveness could bestrengthened by upgrading its tourism-specific infra-structure (48th) as well as its ICT infrastructure (52nd).Other areas of concern include safety and security inthe territory (65th) and health and hygiene issues (63rd).Further, an area of measurable weakening, in partexplaining the overall decline in rank, is in the prioriti-zation of the sector: Puerto Rico has slipped from 52ndto 71st place in this area, notably attending even fewerinternational tourism fairs than it had in the past.
Chile is ranked 9th in the region and 57th overall,slipping six places since last year.The country has notablecultural resources, with five World Heritage cultural sitesand several international fairs and exhibitions held inthe country. In addition, policy rules and regulations areconducive to the development of the T&T sector(19th), with few foreign ownership restrictions, a liberalvisa regime, and open bilateral Air Service Agreements,although the time and cost for starting new businessesremains relatively high.The country also benefits fromgood safety and security by regional standards (38th).However, Chile’s T&T competitiveness would bestrengthened by upgrading transport and tourism infra-structure and a greater focus on developing the industryin an environmentally sustainable way.The decline inrank can mainly be traced to a weaker assessment of thecountry’s prioritization of the sector, as well as the over-all affinity toward Travel & Tourism in the country.
Argentina is in the middle of the regional rankingand placed 65th overall, down seven ranks since lastyear.Argentina is among the highest-ranked countriesfor its natural resources (13th), with four World Heritagesites and very diverse fauna.The country also benefitsfrom a relatively high airport density, abundant seat kilo-meters, and a number of operating airlines, although thequality of air transport is highlighted as a problem area(ranked 123rd). Some aspects of the quality of humanresources are also strengths, such as the high primaryenrollment rate and the relative ease of hiring foreignlabor. However, a number of weaknesses are pulling the country’s overall score down. For example, severalgovernment policies—such as weak property rights(ranked 127th) and stringent rules on FDI (ranked
17
1.1:
The
Tra
vel &
Tou
rism
Com
petit
iven
ess
Inde
x 20
09
part1.r2 2/26/09 11:58 AM Page 17
The Travel & Tourism Competitiveness Report 2009 © 2009 World Economic Forum

125th)—are not supporting the development of the sec-tor. Further, environmental regulation is not sufficientlystringent (ranked 121st) or well enforced (ranked 123rd),which is of concern given the importance of naturalresources for the country’s tourism industry.The drop inrank overall is traced to a weakening across most areasmeasured by the Index, especially policy rules and regu-lations, environmental sustainability, price competitive-ness, and the country’s human resources.
Venezuela, despite its top-10 status for its endow-ment of natural resources (with much protected landarea and diverse fauna), is ranked third from last in theregion, at 104th overall, with a stable performance sincelast year.Among the significant weaknesses are a lack ofsafety and security (ranked 127th), a low prioritizationof the tourism industry (116th), and the lowest rank ofall countries regarding the overall national affinity forTravel & Tourism (133rd). In addition, infrastructure isin need of upgrading, particularly ground transportinfrastructure (ranked 127th).The policy environment isalso not very conducive to the development of the T&Tsector. Property rights are not well protected in thecountry, and FDI is also not encouraged (ranked 132ndfor both indicators).
Asia PacificTable 5 displays the regional ranking and data for theAsia Pacific region.As the table shows, Australia is thehighest-ranked country from the region, ranked 9thoverall, down five places since last year.Australia isranked 4th for its natural resources, with the most WorldHeritage natural sites worldwide, many known speciesin the country, and a pristine natural environment.Given the importance of the environment for much ofits leisure tourism, it is notable that the stringency andenforcement of its environmental regulations are wellassessed. Given the country’s distance from other conti-nents and the related importance of domestic air travelto overcome the large distances between major sites, itscompetitiveness is also buttressed by excellent air trans-port infrastructure (ranked 3rd) as well as good generaltourism infrastructure (ranked 9th).Australia also bene-fits from the strong government prioritization of thetourism sector and effective destination-marketing cam-paigns.The drop in rank since last year can be traced inlarge part to a perceived weakening of the prioritizationof the sector in the country, a poorer assessment of theground transport infrastructure, and weakening pricecompetitiveness.
Australia is followed in the regional ranking bySingapore, which is ranked 10th overall, entering thetop 10 this year and up by six places since last year.Singapore benefits from excellent transport infrastructure,with ground transport infrastructure and air transportinfrastructure ranked 4th and 15th, respectively.Singapore also benefits from its top rank out of allcountries for the quality of its human resources to work
in the country.With regard to the policy environment, italso ranks 1st, with rules and regulations that areextremely conducive to the development of its T&Tindustries (policies facilitating foreign ownership andFDI, well-protected property rights, few visa restrictions).Further, it is among the safest countries of all assessedwith regard to crime and security. Singapore is ranked2nd for the overall prioritization of Travel & Tourism, anarea of improvement since last year.The country’stourism and ICT infrastructure has also seen a measura-ble improvement since last year.
Hong Kong is ranked 3rd in the region and 12thoverall, up two places since last year. Hong Kong’s transport infrastructure is even better assessed thanSingapore’s, with ground transport and air transportinfrastructures ranked 2nd and 13th, respectively. HongKong gets relatively good marks for cultural resources,with many international fairs and exhibitions held in thecountry and strong creative industries. Hong Kong’spolicy environment is rated second only to Singapore,and shows a strong prioritization of the tourism sector(ranked 8th). Like Singapore, Hong Kong is extremelysafe from crime and violence (ranked 5th), and thecountry is unsurpassed for the quality of health andhygiene, where it ranks first internationally.
New Zealand is ranked 4th in the region and20th overall.The country benefits from its rich naturalresources, with several World Heritage natural sites(ranked 16th) and a very pristine natural environment(ranked 3rd) protected by strong and well-enforcedenvironmental legislation.The overall policy rules andregulations in the country are conducive to the develop-ment of the sector (ranked 10th), with transparent policymaking and among the least time and lowest costrequired to start a business of all countries.Although thecountry’s ground transport network remains somewhatunderdeveloped, the air transport infrastructure getsexcellent marks (ranked 11th), and both the tourism and ICT infrastructures are quite good by internationalstandards. New Zealand also benefits from high-qualityhuman resources (ranked 17th) and a very safe andsecure environment overall (15th).
Japan is ranked 5th regionally and 25th out of allcountries in the TTCI, with excellent marks for its cul-tural resources (ranked 10th) attributable to its 14 WorldHeritage cultural sites, the many international fairs andexhibitions held in the country, and its rich creativeindustries.The ground transport infrastructure is amongthe best in the world (ranked 8th), especially railroads,and Japan continues to be a leader in the area of educa-tion and training (ranked 12th). However, Japan ranksthird from the bottom for the affinity of the county forTravel & Tourism (131st), and the sector is not perceivedto be a priority for the government (ranked 83rd).
Korea is ranked 31st, just ahead of Malaysia in boththe regional and the overall rankings, as was the case lastyear. Korea’s strengths lie in the quality of its human
18
1.1:
The
Tra
vel &
Tou
rism
Com
petit
iven
ess
Inde
x 20
09
part1.r2 2/26/09 11:58 AM Page 18
The Travel & Tourism Competitiveness Report 2009 © 2009 World Economic Forum

resources (ranked 19th), its excellent ground transportand ICT infrastructure (ranked 15th and 8th, respective-ly), and its rich cultural resources (ranked 13th). On theother hand, its overall T&T competitiveness is held backby a weak affinity for Travel & Tourism (ranked a low114th), its relative costliness as a destination (ranked102nd), and its underdeveloped tourism infrastructure(ranked 71st).
Malaysia is ranked 7th regionally and 32nd overall,with its rich natural resources (ranked 21st) and goodground transport infrastructure (ranked 28th).Thecountry also benefits from excellent price competitive-ness (ranked 4th), with low comparative hotel and fuelprices, low ticket taxes and airport charges, very com-petitive hotel prices, and a favorable tax regime.Malaysia’s policy environment is assessed as highly con-ducive to the development of the sector (ranked 9th),and the country is prioritizing Travel & Tourism; it markets the country at many international tourism fairs(ranked 1st) and also has an excellent evaluation for itsdestination-marketing campaigns (ranked 12th).Withregard to weaknesses, health and hygiene indicators lagbehind those of many other countries in the region,with, in particular, a low physician density (placing thecountry 94th). For more on Malaysia’s T&T competi-tiveness, see Box 3.
19
1.1:
The
Tra
vel &
Tou
rism
Com
petit
iven
ess
Inde
x 20
09
Table 5: The Travel & Tourism Competitiveness Index: Asia Pacific
SUBINDEXES
T&T business environment T&T human, cultural, OVERALL INDEX T&T regulatory framework and infrastructure and natural resources
Country/Economy Regional rank Overall rank Score Rank Score Rank Score Rank Score
Australia 1 9 5.24 27 5.31 15 5.01 3 5.42Singapore 2 10 5.24 6 5.77 5 5.25 23 4.69Hong Kong SAR 3 12 5.18 2 5.93 12 5.05 30 4.55New Zealand 4 20 4.94 14 5.55 30 4.62 25 4.65Japan 5 25 4.91 40 5.10 20 4.83 15 4.81Korea, Rep. 6 31 4.72 41 5.06 35 4.45 26 4.64Malaysia 7 32 4.71 42 5.03 38 4.24 14 4.86Thailand 8 39 4.45 70 4.46 40 4.14 19 4.74Taiwan, China 9 43 4.40 75 4.40 18 4.87 65 3.92China 10 47 4.33 88 4.24 59 3.73 12 5.01India 11 62 4.09 107 3.88 63 3.65 18 4.74Brunei Darussalam 12 69 3.99 99 4.04 47 3.96 60 3.95Azerbaijan 13 76 3.84 47 4.95 84 3.19 111 3.40Sri Lanka 14 78 3.82 86 4.27 73 3.34 71 3.85Indonesia 15 81 3.79 113 3.77 79 3.24 40 4.36Philippines 16 86 3.73 85 4.27 89 3.07 70 3.86Vietnam 17 89 3.70 92 4.15 85 3.12 76 3.83Kazakhstan 18 92 3.65 60 4.69 96 2.93 121 3.32Mongolia 19 105 3.46 90 4.19 107 2.72 106 3.48Kyrgyz Republic 20 106 3.45 76 4.39 124 2.49 105 3.48Cambodia 21 108 3.43 111 3.80 113 2.64 74 3.84Tajikistan 22 109 3.41 84 4.30 117 2.58 117 3.37Pakistan 23 113 3.33 124 3.59 94 2.95 108 3.46Nepal 24 118 3.25 119 3.66 120 2.53 97 3.57Bangladesh 25 129 3.02 130 3.16 103 2.78 130 3.11
Malaysia is ranked 32nd in the 2009 Travel & TourismCompetitiveness Index (TTCI). According to the UNWTO, in2007, almost 21 million tourists visited Malaysia, earning thecountry US$14 billion in tourism receipts. In 2008, readers ofGlobal Traveler, a magazine aimed at US business execu-tives, acknowledged Malaysia as the “best international des-tination” for the third consecutive year.1 Among Malaysia’sassets and tourist attractions are its modern architecture,exotic jungles, lively historical ports, and ancient colonialheritage as well as the country’s intercultural Asian atmos-phere. The country’s capital, Kuala Lumpur, itself offers manyattractions, ranging from the most modern high rise architec-ture to traditional markets and religious monuments.2
The Malaysian Tourism Board was established in 1992,but it was not until 2004 that the government created theMinistry of Tourism. Malaysia strongly prioritizes the tourismsector (ranked 23rd in the related pillar), ensuring its pres-ence in all major international tourism fairs (ranked 1st).Furthermore, the country has effective destination-marketingand branding campaigns (ranked 12th), with, for example, theKuala Lumpur Convention Centre winning the 2008 BrandLaureate Award acknowledging “excellence in product
Box 3: Realizing the potential of Malaysia’s T&T sector
(Cont’d.)
part1.r2 2/26/09 11:58 AM Page 19
The Travel & Tourism Competitiveness Report 2009 © 2009 World Economic Forum

20
1.1:
The
Tra
vel &
Tou
rism
Com
petit
iven
ess
Inde
x 20
09
branding” granted by the Asia and Pacific Brands Foundation.3
Government efforts to ramp up its international promotionaleffort to new markets have included the development of a tar-geted television campaign aimed at attracting tourists from theMiddle East region,4 for which the country offers many attrac-tions, including the fact that it is a predominantly Muslim coun-try. Key source markets such as those of the United States arealso being targeted with promotional campaigns to attract con-sumers who are currently less familiar with Malaysia’s tourismoffering than they are with some other Southeast Asian tourismdestinations.5
Malaysia has a large offering of cultural resources, withits many religious and ethnic groups making Malaysia a cultur-ally diverse country.6 The government has made significantefforts to preserve its cultural heritage while at the same timesupporting the development of new hotels, convention centers,and tourist attractions. An example of the successful promotionof Malaysia’s historical and national heritage was the inclusionin 2008 of the historic cities of Mekala and Georgetown in theUNESCO World Heritage list.7 Malaysia also has rich naturalresources (ranked 21st), including the oldest rainforest in theworld and two World Heritage Natural sites, both located in theon the island of Borneo.8
Malaysia’s policies and regulations affecting the tourismindustry are conducive to the sector’s development, a pillarwhere it ranks 9th overall. Specifically, the country is character-ized by well-protected property rights, transparent governmentpolicymaking, and relatively little time required to start a busi-ness. Furthermore, Malaysia requires tourist visas from veryfew countries, making the country an accessible destination fortourists from almost all UN countries. In terms of price competi-tiveness in the T&T industry, Malaysia stands out as a highlyaffordable destination (ranked 4th in this pillar) with low tickettaxes and airport charges, low fuel price levels, and very com-petitive hotel prices (ranked 6th on the hotel price index).
Ranked 35th for its air transport infrastructure, Malaysiahas a large number of operating airlines, high-quality air trans-port infrastructure, and an international air transport networkthat provides connections to the country’s key internationaloverseas markets. In an effort by the Malaysian tourism minis-ter to connect with even more international destinations, AirMalaysia and Air Mauritius have enrolled in a partnership inwhich they share flights to different destinations withinMalaysia, thus increasing the importance of Kuala Lumpur as agateway to other important destinations such as Australia,Thailand, and China.9 Further, Malaysia is ranked 28th for thequality of its ground transport infrastructure, with its roads andrailroads particularly noted for their high quality.
Malaysia ranks a reasonable 36th for the availability ofqualified labor to work in the sector, although the Ministry ofTourism deplores the significant labor shortage in the T&T sec-tor; according to the WTTC, in 2008 this sector accounted forapproximately 5 percent of total employment in the country.Recent research has shown a low turnout of job applicants tonumerous vacancies. This situation can be in part explained bythe fact that many tourism professionals choose to work inneighboring countries such as Singapore, Hong Kong, Macau,
and China, where higher salaries and other benefits such as fullboard are often offered. In an effort to address the shortage ofnational qualified T&T professionals, the government has beeneasing the laws related to hiring foreign workers (ranked 50th).10
Malaysia has been working to improve the quality of hotelaccommodations in the country as well as to increase theircapacity (ranked 45th for the availability of hotel rooms). Anexample of efforts to address this shortcoming is found inKuching, the capital of the country’s largest state of Sarawak,where a project has been undertaken to double the number ofrooms to 10,000 in 2009.11 In addition, new five-star hotels havebeen built in the heart of Kuala Lumpur. Among these are theRoyale Chulan Kuapa Lumpur,12 and one sponsored by the prestigious St. Regis brand.13
MICE (meetings, incentive, conference and exhibition)strategies are also part of the government’s plan to enhance theT&T infrastructure. The goal is to provide adequate accommo-dation and meeting rooms with large capacities, equipped forbusiness meetings in different hotels and conference centers.14
Last year, the government created a program called MyCEB(Malaysian Convention and Exhibition Bureau) in order to pro-mote the country as a host for international conferences andexhibitions. Although visitors of this type tend to be lower innumber, they are an important potential source of revenue giventhat, on average, they spend more than leisure tourists.15 At themoment, Malaysia hosts an average of 82 international fairs andexhibitions every year, ranked 30th on this indicator.
Overall, Malaysia’s T&T industry would appear to havemuch growth potential. Improvement in areas highlightedabove, such as increasing the availability of professional laborfor the industry, carrying out better promotion to key markets,and further developing the tourism infrastructure will help toensure the healthy development of the sector going into thefuture.
Notes1 Global Traveler 2008.
2 See the Malaysia Ministry of Tourism, http://www.virtual-malaysia.com/visit_malaysia/ (accessed December 2008).
3 The Brand Laureate: The Grammy Awards for Branding.Available at http://www.thebrandlaureate.com/winners-tbl.asp?view=pb.
4 Sulaiman 2008a.
5 Alcantara 2008.
6 Sulaiman 2008a.
7 UNESCO, World Heritage Center. Seehttp://whc.unesco.org/en/list.
8 Malaysia Ministry of Tourism. virtualmalaysia.com. Available athttp://www.virtualmalaysia.com/visit_malaysia/ (accessedDecember 2008).
9 eTurboNews 2008a.
10 Sulaiman 2008b.
11 Payne 2008.
12 eTurboNews 2008b.
13 eTurboNews 2008c.
14 eTurboNews 2008b.
15 Sulaiman 2008c.
Box 3: Realizing the potential of Malaysia’s T&T sector (cont’d.)
part1.r2 2/26/09 11:58 AM Page 20
The Travel & Tourism Competitiveness Report 2009 © 2009 World Economic Forum

Thailand is ranked just behind Malaysia in theregion at 8th place and 39th overall, up three placessince last year. It is endowed with rich natural resourcesand a strong affinity for Travel & Tourism (ranked 24thand 22nd, respectively), with a very friendly attitude ofthe population toward tourists (ranked 13th).This isbuttressed by the sector’s strong prioritization by thegovernment (ranked 12th) with, similar to Malaysia,excellent destination-marketing campaigns and goodprice competitiveness. However, some weaknessesremain: despite the prioritization of the sector by thegovernment, some aspects of the regulatory environment—such as stringent foreign ownership restrictions, visarestrictions for many travelers, and the long timerequired for starting a business in the country—are notparticularly conducive to developing the sector (ranked62nd). In addition, given the importance of the naturalenvironment for the country’s tourism, environmentalsustainability should be a greater priority (ranked 99th).
China, ranked 10th regionally, has seen the largestrank improvement of all countries this year, moving upby a remarkable 15 places to 47th overall. China hasbeen building on a number of clear strengths: it isranked 7th for its natural resources, with many WorldHeritage natural sites and fauna that is among the rich-est in the world. It is ranked 15th for its culturalresources, with many World Heritage cultural sites, manyinternational fairs and exhibitions held in the country,and creative industries that are unsurpassed. Moreover,the country is ranked 20th in price competitiveness and28th for the overall prioritization of the sector. In addi-tion, China has a relatively good air transport infrastruc-ture (ranked 34th). However, there are some weaknessespulling the country’s ranking down. China has a policyenvironment that is not conducive for T&T development(ranked 87th), with strong foreign ownership restrictionsand visa requirements for most visitors. Furthermore,policies related to environmental sustainability get lowmarks (105th).There are also some safety and securityconcerns (116th), as well as issues related to health andhygiene (91st), with access to improved sanitation anddrinking water that is low by international standards.Ground transport infrastructure gets middling marks(55th), and its tourism infrastructure remains underde-veloped (ranked 80th), with few hotel rooms availableand few ATMs, although on a positive note tourisminfrastructure has seen a marked improvement since last year.
India is ranked 11th in the region and 62nd over-all, up three places since last year.As with China, India iswell assessed for its natural resources (ranked 14th) andcultural resources (24th), with many World Heritagesites, both natural and cultural, rich fauna, and strongcreative industries in the country. India also has quite agood air transport network (ranked 37th), particularlygiven the country’s stage of development, and a reason-able ground transport infrastructure (ranked 49th).
However, some aspects of its tourism infrastructureremain somewhat underdeveloped (ranked 73rd), withvery few hotel rooms per capita by international com-parison and low ATM penetration. Further, despite gov-ernment and industry efforts to promote the countryabroad (India is ranked 1st with regard to tourism fairattendance) and the exposure given to recent promo-tional campaigns, the assessment of marketing andbranding to attract tourists remains average (ranked 53rd).Another area of concern is the policy environment,ranked 108th, with much time and cost for starting abusiness, bilateral Air Service Agreements that are notassessed as open, and visas required for most visitors.
Indonesia is ranked 15th in the regional rankingand 81st overall. In terms of strengths, Indonesia places28th for its natural resources, with several WorldHeritage natural sites and the richness of its fauna asmeasured by the known species in the country.Indonesia also has rich cultural resources (ranked 37th),with five World Heritage cultural sites, a number ofinternational fairs and exhibitions held in the country,and strong creative industries. Further, the country isranked 3rd overall on price competitiveness in the T&Tindustry because of its competitive hotel prices (ranked7th), low ticket taxes and airport charges, and favorablefuel prices. In addition, it is ranked 10th for the nationalprioritization of Travel & Tourism. However, thesestrengths are held back by weaknesses such as underde-veloped infrastructure in the country, including to a certain extent air transport (60th) and especially groundtransport (89th), tourism infrastructure (88th), and ICTinfrastructure (102nd).There are also some concernsrelated to safety and security, particularly a lack of trustof police services and the prevalence of deaths fromroad traffic accidents. In addition, the country is not prioritizing the sustainable development of the tourismsector (ranked 130th), of particular concern given the sector’s dependence on the quality of the naturalenvironment in the country.
The Philippines is ranked just behind Indonesiaregionally and 86th overall, down five places since lastyear.Among the country’s strengths are its naturalresources: it is ranked 23rd for the number of WorldHeritage natural sites and 40th for the total knownspecies in the country.The Philippines also benefits fromexcellent price competitiveness (ranked 16th), with lowprices overall, particularly hotel prices, and low tickettaxes and airport charges.There are also some aspects of the policy rules and regulations regime that are conducive to the development of the sector, such as fewvisa requirements for foreign visitors (ranked 3rd) andbilateral Air Service Agreements that are assessed ascomparatively open (28th), although other areas—suchas the protection of property rights, rules related to for-eign investment, and the difficulty of starting a businessin the country—remain a challenge. Other matters ofconcern are safety and security (ranked 113th), health
21
1.1:
The
Tra
vel &
Tou
rism
Com
petit
iven
ess
Inde
x 20
09
part1.r2 2/26/09 11:58 AM Page 21
The Travel & Tourism Competitiveness Report 2009 © 2009 World Economic Forum

and hygiene levels (87th), and transport, tourism, andICT infrastructures that require upgrading.
Middle East and AfricaTable 6 shows the regional ranking for the Middle Eastand Africa region.As the table shows, The UnitedArab Emirates (UAE) is ranked 1st in the region thisyear, at 33rd overall, up seven places since last year, over-taking Israel and Tunisia.While the UAE is not endowedwith rich natural and cultural resources (117th and 84th,respectively), it does very well in several other areas captured by the Index. For example, the country is char-acterized by a positive attitude toward foreign travelers(10th) and is also seen as very safe from crime and vio-lence (ranked 14th).The UAE’s infrastructure also getsgood marks, particularly its air transport infrastructure,which is ranked a very high 4th out of all countriesassessed (up one place since last year).The governmentis seen as prioritizing the sector strongly (ranked 3rd),carrying out very effective destination-marketing cam-paigns (ranked 1st) and ensuring the presence of thecountry at major T&T fairs internationally.An area ofclear improvement since last year is in the rules and reg-ulations, which have been adjusted to better support thesector’s development, with the UAE moving up from81st place last year to 53rd this year.
Israel is the second-ranked country in the region,at 36th overall, showing a stable performance since lastyear.The country’s human resources base is well evaluat-ed (29th), providing healthy and well-trained people towork in the T&T sector. Further, its infrastructure isquite well developed compared with those of othercountries in the region, especially its ICT infrastructure.Israel’s rules and regulations, ranked 39th, are conduciveto the development of the sector, with low foreignownership restrictions and visas required from fewcountries, although it requires much time to set up abusiness in the country (ranked 91st). But althoughIsrael gets excellent marks related to health and hygiene(ranked 14th), safety and security continues to be amajor concern, placing the country at 73rd, primarilyrelated to concerns about terrorism (ranked 129th).
Qatar is ranked 3rd in the region and 37th overall,directly following Israel in the full ranking. Qatar bene-fits from an extremely safe and secure environment(ranked 9th), high quality human resources in the coun-try (ranked 22nd for human resources), good tourisminfrastructure (28th), and excellent air transport infra-structure (20th), in line with its increasing role as an airtransportation hub. In order to further improve thecountry’s T&T competitiveness, efforts should be madeto upgrade its ground transport infrastructure (ranked59th), more focus should be placed on environmentalsustainability (69th), and further efforts should be madeto improve the policy and regulatory environment(ranked 47th), in particular by facilitating more foreign
direct investment and easing visa requirements for entering the country.
Mauritius is the fourth highest ranked country inthe region, at 40th overall. Mauritius is ranked 1st out ofall countries for the overall prioritization of the sector,with high government spending on the tourism industry(ranked 3rd), ensuring excellent destination-marketingcampaigns to attract tourists (ranked 2nd), and ensuringthe country’s presence at many international tourismfairs.Along similar lines, Mauritius is ranked 3rd for thecountry’s overall affinity for Travel & Tourism, with thesector representing an important part of the economyand the general attitude of the population to foreigntravelers being extremely welcoming.The country’stourism infrastructure is well developed by regionalstandards, and the policy environment is supportive ofthe development of the sector (ranked 13th). Mauritiusalso benefits from price competitiveness (ranked 26th),with relatively low prices overall and taxation that is notoverly burdensome, although this would be improvedthrough lower ticket taxes and airport charges, and morecompetitive hotel prices. Safety and security levels arealso good by regional standards (ranked 40th), and areon a par with countries such as Germany and Hungary.In terms of challenges, although the government is seento be making an effort to develop the industry in a sus-tainable way (ranked 13th), this effort could be backedup by more stringent environmental regulations (ranked61st).
Tunisia is ranked 6th among Middle East andAfrican countries and 44th overall, down five placessince last year.Tunisia benefits from a strong assessmentof the prioritization of Travel & Tourism (15th)—similarto top-10 ranked countries such as Austria andCanada—with high government spending on the sector,effective destination-marketing campaigns, and attendanceat several major international tourism fairs. Further,unlike some other countries in the region,Tunisia isperceived as relatively safe from crime and violence(ranked 31st). In addition, price competitiveness is apositive attribute, ranked 7th, with competitive hotelprices, low fuel levels, reasonable taxation, and lowprices more generally. On the other hand, health andhygiene remains an area of concern (75th), with a relatively low physician density and a low concentrationof hospital beds.The country’s ICT infrastructure alsoremains underdeveloped (ranked 77th). This is an areathat has seen a deterioration since last year.
South Africa is ranked 8th in the region and 61stoverall, with a stable performance since last year. SouthAfrica, together with Mauritius, make up the two sub-Saharan African countries in the top half of the overallranking. South Africa is ranked a high 22nd for its natu-ral resources, and 45th for its cultural resources, based onits many World Heritage sites, its rich fauna, its creativeindustries, and the many international fairs and exhibi-tions held in the country. South Africa also benefits from
22
1.1:
The
Tra
vel &
Tou
rism
Com
petit
iven
ess
Inde
x 20
09
part1.r2 2/26/09 11:58 AM Page 22
The Travel & Tourism Competitiveness Report 2009 © 2009 World Economic Forum

price competitiveness, with reasonably priced hotelrooms and a favorable tax regime. Infrastructure in SouthAfrica is also well developed for the region, with airtransport infrastructure ranked 43rd and a particularlygood assessment of railroad quality (37th) and road quality (40th). Overall, policy rules and regulations areconducive to the sector’s development (ranked 36th),with well-protected property rights and few visarequirements for visitors. However, there are also someareas of weakness that have brought down the country’soverall ranking. Safety and security is of serious concern(ranked 128th), as is the level of health and hygiene,where South Africa is ranked 94th as a result of its lowphysician density and concerns about access to improved
sanitation in particular. Related to this, health indicatorsare extremely worrisome. South Africa’s life expectancyis low, at 51 years, placing the country 120th overall, aranking related in large part to the very high rates ofcommunicable diseases such as HIV/AIDS. Improvingthe health of the workforce is of urgent concern for thefuture of the T&T sector, as well as for all sectors in theeconomy.
Egypt directly follows South Africa in the regionalranking at 9th place, ranked 64th overall, up two placesfrom last year.The country is rich in cultural heritage,with seven World Heritage cultural sites and severalinternational fairs and exhibitions held in the country.In addition to its cultural attributes, it benefits from
23
1.1:
The
Tra
vel &
Tou
rism
Com
petit
iven
ess
Inde
x 20
09
Table 6: The Travel & Tourism Competitiveness Index: Middle East and Africa
SUBINDEXES
T&T business environment T&T human, cultural, OVERALL INDEX T&T regulatory framework and infrastructure and natural resources
Country/Economy Regional rank Overall rank Score Rank Score Rank Score Rank Score
United Arab Emirates 1 33 4.57 39 5.12 23 4.79 78 3.81Israel 2 36 4.50 37 5.13 39 4.21 51 4.16Qatar 3 37 4.49 35 5.16 34 4.48 75 3.83Mauritius 4 40 4.43 24 5.39 44 4.04 69 3.86Bahrain 5 41 4.42 55 4.75 28 4.64 67 3.88Tunisia 6 44 4.37 31 5.26 49 3.87 56 3.97Jordan 7 54 4.25 36 5.15 67 3.55 54 4.05South Africa 8 61 4.10 82 4.31 52 3.81 49 4.17Egypt 9 64 4.09 52 4.84 65 3.59 73 3.84Oman 10 68 4.01 59 4.69 53 3.80 99 3.54Saudi Arabia 11 71 3.89 104 4.01 45 4.02 90 3.65Morocco 12 75 3.86 64 4.59 78 3.27 83 3.73Botswana 13 79 3.81 66 4.55 76 3.29 95 3.60Namibia 14 82 3.77 71 4.45 77 3.27 94 3.60Syria 15 85 3.73 68 4.48 82 3.20 100 3.53Gambia, The 16 87 3.72 65 4.56 90 3.06 98 3.55Kuwait 17 95 3.63 109 3.87 50 3.85 128 3.16Kenya 18 97 3.60 93 4.15 100 2.81 72 3.84Tanzania 19 98 3.59 102 4.03 118 2.56 50 4.17Zambia 20 100 3.53 87 4.26 115 2.64 85 3.69Senegal 21 101 3.50 101 4.03 108 2.71 82 3.75Ghana 22 110 3.40 105 3.94 102 2.78 104 3.49Uganda 23 111 3.38 115 3.75 114 2.64 81 3.76Libya 24 112 3.38 97 4.07 109 2.71 114 3.37Algeria 25 115 3.31 108 3.88 98 2.84 127 3.22Madagascar 26 116 3.28 112 3.79 106 2.74 119 3.32Malawi 27 117 3.27 106 3.91 131 2.43 107 3.47Mali 28 119 3.19 114 3.76 126 2.48 120 3.32Benin 29 120 3.18 117 3.66 121 2.52 116 3.37Zimbabwe 30 121 3.17 125 3.57 125 2.49 109 3.43Ethiopia 31 123 3.15 128 3.27 112 2.65 101 3.52Mozambique 32 124 3.12 120 3.66 129 2.45 125 3.24Cameroon 33 125 3.09 126 3.54 132 2.36 115 3.37Burkina Faso 34 126 3.08 118 3.66 122 2.52 131 3.05Mauritania 35 127 3.07 123 3.61 127 2.47 129 3.14Nigeria 36 128 3.02 132 3.10 116 2.59 113 3.38Côte d’Ivoire 37 130 2.99 131 3.12 123 2.50 118 3.35Burundi 38 131 2.98 129 3.17 119 2.53 126 3.24Lesotho 39 132 2.92 121 3.64 128 2.45 133 2.66Chad 40 133 2.52 133 2.83 133 1.93 132 2.80
part1.r2 2/26/09 11:58 AM Page 23
The Travel & Tourism Competitiveness Report 2009 © 2009 World Economic Forum

excellent price competitiveness, ranked 1st out of allcountries, with competitive hotel prices, low fuel costs,and low prices more generally. Further, there is a strongnational prioritization of the sector (ranked 9th), withthe government ensuring both relatively high spendingon Travel & Tourism and the country’s presence at majortourism fairs. On the other hand, Egypt’s infrastructureneeds improvement, particularly its tourism infrastruc-ture (74th), its ground transport infrastructure (79th),and its ICT infrastructure (84th).A focus on improvingeducation and training in the country, ranked 83rd,would also improve the country’s overall T&T competi-tiveness.
Morocco is ranked 12th in the regional rankingand 75th overall, down eight places since last year.Morocco receives a good evaluation for aspects of itscultural resources, and is notably ranked 19th for thenumber of World Heritage cultural sites in the country.In addition, the country is seen to be prioritizing thedevelopment of the sector (ranked 30th), and the gov-ernment is making efforts to develop the T&T sector ina sustainable way, protecting the natural environment. Inorder to improve the industry’s competitiveness further,efforts should be made to improve health and hygienelevels in the country and upgrade the educational system, as well as make further improvements to thecountry’s transport and tourism infrastructure. Since lastyear, areas that have seen a marked deterioration areaspects of safety and security and the country’s pricecompetitiveness.
Botswana is ranked just behind Morocco in theregional ranking and 79th overall, showing an improve-ment of eight places since last year.The country, knownfor its beautiful natural parks, is ranked 34th out of allcountries for its natural resources, with much nationallyprotected land area (ranked 13th), rich fauna, and a lackof environmental damage.The country also benefitsfrom excellent price competitiveness, where it is ranked9th because of low ticket taxes and airport charges, afavorable tax regime in the country, and low pricesmore generally. In addition, the country has seen amarked improvement in the measured prioritization ofthe tourism sector over the past year, with significantlyhigher government expenditure on the sector and pres-ence at more international tourism fairs. However,Botswana does face some challenges that lead to itsrather low ranking overall.The policy regime is notextremely conducive to the development of the sector.The country’s bilateral Air Service Agreements are notevaluated as open (103rd), and much time is required forstarting a new business (78 days, placing the country123rd). Further, Botswana’s transport infrastructure issomewhat underdeveloped, as well as its tourism infra-structure, with a low hotel room concentration (72nd), alimited presence of international car rental companies(73rd), and relatively few ATMs (70th).There are alsosome concerns in the area of health and hygiene, attrib-
utable to a low physician density (103rd) and limitedaccess to improved sanitation (102nd).Associated withthis, the greatest comparative weakness relates to thehealth of the workforce, where life expectancy of just 52 years places the country 119th, although, on a posi-tive note, this has been improving significantly in recentyears.
Gambia is ranked 16th in the region and 87thoverall. Gambia’s government places great priority ontourism (ranked 11th), with nearly 10 percent of itsbudget devoted to the sector (ranking the country 9thon this indicator). Further, developing the industry sus-tainably to protect the natural environment is also seento be a priority for the government (ranked 3rd). Inaddition, Gambia benefits greatly from price competi-tiveness, ranked 1st out of all countries both for thehotel price index as well as for its overall low price levels (purchasing power parity).The country is alsoperceived to be safe from crime and violence (ranked27th), another important feature. On the other hand,there are a number of areas requiring attention toincrease Gambia’s competitiveness.Although the groundtransport infrastructure is somewhat developed byregional standards (ranked 58th), it could be upgraded.Efforts should be made to improve the air transportinfrastructure (85th) and general tourism infrastructure(124th).Attention should also be placed on improvingthe health of the workforce and upgrading the educa-tional system. Finally, policy rules and regulations arenot conducive to the industry’s development at present(ranked 85th), with visas required for many visitors andmuch time and cost required for starting a business inthe country.
Kenya, a country long famous for its tourismattributes, is ranked 18th regionally and 97th overall, upfour places since last year. Kenya is ranked 25th for itsnatural resources, with two World Heritage natural sitesand its rich diversity of fauna.Tourism is a strong priori-ty within the country (ranked 12th on this pillar), withhigh government spending on the sector, effective desti-nation-marketing campaigns, and country presence atseveral international fairs and exhibitions. In addition,there is a strong focus on environmental sustainability in the country (ranked 16th), which is particularlyimportant for Kenya given the sector’s dependence onthe natural environment. On the downside, the policyenvironment is not at present conducive to the develop-ment of the sector (ranked 90th), with bilateral AirService Agreements that are not open, insufficiently pro-tected property rights, and much time and cost requiredfor starting a business. In addition, infrastructure remainsunderdeveloped and health and hygiene levels requireimprovement. Finally, the security situation in the coun-try remains a significant hindrance to further developingthe sector (ranked 121st).
Tanzania is ranked just behind Kenya regionallyand 98th overall, down 10 places since last year.Tanzania
24
1.1:
The
Tra
vel &
Tou
rism
Com
petit
iven
ess
Inde
x 20
09
part1.r2 2/26/09 11:58 AM Page 24
The Travel & Tourism Competitiveness Report 2009 © 2009 World Economic Forum

is ranked 3rd worldwide for its natural environment,with several World Heritage natural sites, rich fauna, andso much protected land area as to place the country 5thon that indicator.This is buttressed by an importantfocus in the country on environmental sustainability(ranked 32nd), particularly as it pertains to the develop-ment of this industry.There is also a general affinity ofthe population to Travel & Tourism, and it is clearly seento be an overall national priority (ranked 33rd on bothpillars). On the other hand, its policy environment is notsufficiently supportive of the development of the sector,and is measurably less so than last year. Other issues ofconcern are security levels in the country, and a focusmust be placed on improving the health of the work-force, upgrading the educational system, and improvingall types of infrastructure on which the industry isdependent.
Zimbabwe is ranked further down in the rankings,at 121st place overall.This is a low ranking for a countrythat was until recently a popular tourist destination.Indeed, Zimbabwe is ranked 35th for natural resourcesoverall, with a number of World Heritage natural sites,much nationally protected land area, and rich fauna.Despite these strengths, which have attracted tourists toZimbabwe over the years, the Index mainly highlightsthe country’s weaknesses in all of the other areas.Afteryears of political mismanagement, the policy environ-ment is the worst in the world (ranked 133rd), withrock bottom assessments for laws related to FDI andproperty rights. Safety and security is also a major con-cern, with high crime and violence and a lack of trustin the reliability of police services to provide protectionfrom crime (130th), reflecting the general breakdown inlaw and order in the country in recent years.There arealso concerns related to human resources, with lowenrollment rates in primary and secondary education byinternational standards, and among the worst healthindicators in the world: life expectancy is just 43 yearsnow in the country, placing it 131st. Better governancewill be imperative to get the country back on track forimproved T&T competitiveness.
ConclusionsThis chapter has assessed the T&T competitiveness of133 economies, spanning all regions of the world, basedon the World Economic Forum’s Travel & TourismCompetitiveness Index (TTCI).The TTCI representsour best efforts to capture the complex phenomenon ofT&T competitiveness, demonstrating that a whole arrayof reforms and improvements in different areas arerequired for improving the T&T competitiveness ofnations.
By highlighting success factors and obstacles toT&T competitiveness in economies around the world,the TTCI is a tool that can be used to identify the com-petitive strengths of individual countries as well as the
barriers that impede the development of the sector. Forthe first time this year it is possible to make inter-yearcomparisons of each country’s performance, as thestructure of the Index has remained sufficiently constantsince last year.We plan to maintain the structure goinginto the future, which will allow countries to track theirprogress over time.
It is our hope that the TTCI will continue to beused as a platform for dialogue between the businesscommunity and national policymakers working togetherto improve the T&T competitiveness of their respectiveeconomies, and thus contribute to improving thegrowth prospects and prosperity of their citizens.
ReferencesAlcantara, N. 2008. “Malaysia Keen on Luring More US Travelers
Amid Challenges.” eTurboNews, July 14. Available athttp://www.eturbonews.com/3684/malaysia-keen-luring-more-us-travelers-amid-challenges.
The Anholt City Brands Index 2007, How the World Views Its Cities,Third Edition, 2007. See http://www.simonanholt.com/ for furtherinformation.
Blanke, J. and T. Chiesa. 2007. “The Travel & Tourism CompetitivenessIndex: Assessing Key Factors Driving the Sector’s Development.”In The Travel & Tourism Competitiveness Report 2007: Furtheringthe Process of Economic Development. Geneva: World EconomicForum. 3–25.
———. 2008. “The Travel & Tourism Competitiveness Index: MeasuringKey Elements Driving the Sector’s Development.” In The Travel &Tourism Competitiveness Report 2008: Balancing EconomicDevelopment and Environmental Sustainability. Geneva: WorldEconomic Forum. 3–26.
The Brand Laureate: The Grammy Awards for Branding. Available athttp://www.thebrandlaureate.com/winners-tbl.asp?view=pb.
Canadian Tourism Commission. 2007a. 2007 Annual Report: LeveragingCanada’s Tourism Brand. Vancouver: Canadian TourismCommission. Available at http://www.corporate.canada.travel/docs/about_ctc/2007_Annual_Report_en.pdf.
———. 2007b. Leveraging Canada’s Games: 2008–2012 OlympicGames Tourism Strategy. Vancouver: Canadian TourismCommission. Available at http://www.corporate.canada.travel/docs/about_ctc/2007_Annual_Report_en.pdf.
———. 2008. 2009–2013 Strategy. Seizing the Opportunity: Inspiringthe World to Explore Canada. Available at http://www.corporate.canada.travel/docs/about_ctc/strategy_eng.pdf.
eTurboNews. 2008a. “Malaysia Airlines and Air Mauritius Extend Code-Share Agreement.” eTurboNews, November 22. Available at http://www.eturbonews.com/6353/malaysia-airlines-and-air-mauritius-extend-code-share-agreement.
———. 2008b. “Royale Chulan Kuala Lumpur to Make Valuable MICEContribution to Malaysian Hospitality.” eTurboNews, July 29.Available at http://www.eturbonews.com/3999/royale-chulan-kuala-lumpur-make-valuable-mice-contribution-malays.
———. 2008c. “St. Regis Makes Landmark Entry into Malaysia.”eTurboNews, June 17. Available at http://www.eturbonews.com/3130/st-regis-makes-landmark-entry-malaysia.
Global Traveler. 2008. Available at http://globaltravelerusa.com/.
Malaysia Ministry of Tourism. virtualmalaysia.com. Available athttp://www.virtualmalaysia.com/visit_malaysia/.
OECD (Organisation for Economic Co-operation and Development).2008. Tourism in OECD Countries 2008: Trends and Policies.Paris: OECD.
Payne, R. 2008. “Sarawak Woos Tourists.” eTurboNews, October 22.Available at http://www.eturbonews.com/5741/sarawak-woos-tourists.
25
1.1:
The
Tra
vel &
Tou
rism
Com
petit
iven
ess
Inde
x 20
09
part1.r2 2/26/09 11:58 AM Page 25
The Travel & Tourism Competitiveness Report 2009 © 2009 World Economic Forum

Sulaiman, Y. 2008a. “Malaysia Tourism Cashing In on Its ‘IslamicHeritage.” eTurboNews, June 25. Available at http://www.eturbonews.com/3349/malaysian-tourism-cashing-its-islamic-heritag.
———. 2008b. “Malaysian Tourism: Plenty of Jobs, No Takers.”eTurboNews, June 10. Available at http://www.eturbonews.com/2968/malaysian-tourism-plenty-jobs-no-takers.
———. 2008c. “Malaysian Tourism Takes Firm Grip on MICE Marketwith Myceb.” eTurboNews, December 8. Available athttp://www.eturbonews.com/6608/malaysian-tourism-takes-firm-grip-mice-market-myceb.
Turismo 2020. 2008. Plan del Turismo Español Horizonte 2020,Documente ejecutivo. Available at http://www.turismo2020.es/index.php?/esp/documentacion.
UNESCO (United Nations Educational, Scientific and CulturalOrganization), World Heritage Centre. See http://whc.unesco.org/en/list.
UNWTO (World Tourism Organization). 2009. “International TourismChallenged by Deteriorating World Economy.” Press Release,January 27.Madrid: UNWTO. Available at http://www.unwto.org/media/news/en/press_det.php?id=3481&idioma=E.
WTTC (World Travel & Tourism Council), 2008a. TSA Research.
———. 2008b. The 2008 Travel & Tourism Economic Research, Spain.London: WTTC.
———. 2008c. The 2008 Travel & Tourism Economic Research, Canada.London: WTTC.
26
1.1:
The
Tra
vel &
Tou
rism
Com
petit
iven
ess
Inde
x 20
09
part1.r2 2/26/09 11:58 AM Page 26
The Travel & Tourism Competitiveness Report 2009 © 2009 World Economic Forum

27
1.1:
The
Tra
vel &
Tou
rism
Com
petit
iven
ess
Inde
x 20
09
This appendix provides details about the construction ofthe Travel & Tourism Competitiveness Index (TTCI).The TTCI is composed of three subindexes: the T&Tregulatory framework subindex; the T&T business envi-ronment and infrastructure subindex; and the T&Thuman, cultural, and natural resources subindex.Thesesubindexes are, in turn, composed of the 14 pillars ofT&T competitiveness shown below: namely, policy rulesand regulations, environmental sustainability, safety andsecurity, health and hygiene, prioritization of Travel &Tourism, air transport infrastructure, ground transportinfrastructure, tourism infrastructure, ICT infrastructure,price competitiveness in the T&T industry, humanresources, affinity for Travel & Tourism, naturalresources, and cultural resources.These pillars are calcu-lated on the basis of both “hard data” and “Survey data.”
The Survey data comprise the responses to theWorld Economic Forum’s Executive Opinion Surveyand range from 1 to 7; the hard data were collectedfrom various sources, which are described in theTechnical Notes and Sources section at the end of theReport.All of the data used in the calculation of theTTCI can be found in the Data Tables section of theReport.
The hard data indicators used in the TTCI are normalized to a 1-to-7 scale in order to align them with the Executive Opinion Survey’s results.1
Each of the pillars has been calculated as anunweighted average of the individual component vari-ables.The subindexes are then calculated as unweightedaverages of the included pillars. In the case of thehuman resources pillar, which is itself composed of twosubpillars (education and training and availability ofqualified labor), the overall pillar is the unweighted average of the two subpillars.The overall TTCI is thenthe unweighted average of the three subindexes.Thevariables of each pillar and subpillar are described below.If a variable is one of hard data, this is indicated inparentheses after the description.
Subindex A: T&T regulatory framework
Pillar 1: Policy rules and regulations
1.01 Prevalence of foreign ownership1.02 Property rights1.03 Business impact of rules on FDI1.04 Visa requirements (hard data)1.05 Openness of bilateral Air Service Agreements (hard
data)1.06 Transparency of government policymaking1.07 Time required to start a business (hard data) 1.08 Cost to start a business (hard data)
Pillar 2: Environmental sustainability
2.01 Stringency of environmental regulation2.02 Enforcement of environmental regulation2.03 Sustainability of T&T industry development2.04 Carbon dioxide emissions (hard data) 2.05 Particulate matter concentration (hard data) 2.06 Threatened species (hard data) 2.07 Environmental treaty ratification (hard data)
Pillar 3: Safety and security
3.01 Business costs of terrorism3.02 Reliability of police services3.03 Business costs of crime and violence3.04 Road traffic accidents (hard data)
Pillar 4: Health and hygiene
4.01 Physician density (hard data) 4.02 Access to improved sanitation (hard data) 4.03 Access to improved drinking water (hard data) 4.04 Hospital beds (hard data)
Pillar 5: Prioritization of Travel & Tourism
5.01 Government prioritization of the T&T industry5.02 T&T government expenditure (hard data) 5.03 Effectiveness of marketing and branding to attract
tourists5.04 T&T fair attendance (hard data)
Subindex B: T&T business environment and infrastructure
Pillar 6: Air transport infrastructure
6.01 Quality of air transport infrastructure6.02 Available seat kilometers, domestic (hard data)2
6.03 Available seat kilometers, international (hard data)2
6.04 Departures per 1,000 population (hard data) 6.05 Airport density (hard data)6.06 Number of operating airlines (hard data)6.07 International air transport network (hard data)
Pillar 7: Ground transport infrastructure
7.01 Quality of roads7.02 Quality of railroad infrastructure7.03 Quality of port infrastructure7.04 Quality of domestic transport network7.05 Road density (hard data)
Pillar 8: Tourism infrastructure
8.01 Hotel rooms (hard data)8.02 Presence of major car rental companies (hard data)8.03 ATMs accepting Visa cards (hard data)
Pillar 9: ICT infrastructure
9.01 Extent of business Internet use9.02 Internet users (hard data)9.03 Telephone lines (hard data)9.04 Broadband Internet subscribers (hard data)9.05 Mobile telephone subscribers (hard data)
Pillar 10: Price competitiveness in the T&T industry
10.01 Ticket taxes and airport charges (hard data)10.02 Purchasing power parity (hard data)10.03 Extent and effect of taxation10.04 Fuel price levels (hard data)10.05 Hotel price index (hard data)
(Cont’d.)
Appendix A: Composition of the Travel & Tourism Competitiveness Index
part1.r2 2/26/09 11:58 AM Page 27
The Travel & Tourism Competitiveness Report 2009 © 2009 World Economic Forum

28
1.1:
The
Tra
vel &
Tou
rism
Com
petit
iven
ess
Inde
x 20
09
Subindex C: T&T human, cultural, and naturalresources
Pillar 11: Human resources
Education and training
11.01 Primary education enrollment (hard data)11.02 Secondary education enrollment (hard data)11.03 Quality of the educational system11.04 Local availability of specialized research and training
services 11.05 Extent of staff training
Availability of qualified labor
11.06 Hiring and firing practices11.07 Ease of hiring foreign labor11.08 HIV prevalence (hard data)3
11.09 Business impact of HIV/AIDS3
11.10 Life expectancy (hard data)
Pillar 12: Affinity for Travel & Tourism
12.01 Tourism openness (hard data)12.02 Attitude of population toward foreign visitors12.03 Extension of business trips recommended
Pillar 13: Natural resources
13.01 Number of World Heritage natural sites (hard data)13.02 Protected areas (hard data)13.03 Quality of the natural environment13.04 Total known species (hard data)
Pillar 14: Cultural resources
14.01 Number of World Heritage cultural sites (hard data)14.02 Sports stadiums (hard data)14.03 Number of international fairs and exhibitions
(hard data)14.04 Creative industries exports (hard data)
Notes1 The standard formula for converting each hard data variable to the
1-to-7 scale is
6 x country score – sample minimum + 1( sample maximum – sample minimum )The sample minimum and sample maximum are the lowest andhighest scores of the overall sample, respectively. For those harddata variables for which a higher value indicates a worse outcome(e.g., road traffic accidents, fuel price levels), we rely on a normal-ization formula that, in addition to converting the series to a 1-to-7scale, reverses it, so that 1 and 7 still correspond to the worstand best possible outcomes, respectively:
–6 x country score – sample minimum + 7( sample maximum – sample minimum )In some instances, adjustments were made to account forextreme outliers in the data.
2 Variables 6.02 Available seat kilometers, domestic and 6.03Available seat kilometers, international combine to form one sin-gle variable.
3 The impact of HIV/AIDS on T&T competitiveness depends notonly on its respective incidence rate, but also on how costly it isfor business. Therefore, in order to estimate the impact ofHIV/AIDS, we combine its incidence rate with the Survey ques-tion on its perceived cost to businesses. To combine these datawe first take the ratio of each country’s incidence rate relative tothe highest incidence rate in the whole sample. The inverse ofthis ratio is then multiplied by each country’s score on the relatedSurvey question. This product is then normalized to a 1-to-7 scale.Note that countries with zero reported incidence receive a 7,regardless of their scores on the related Survey question.
Appendix A: Composition of the Travel & Tourism Competitiveness Index (cont’d.)
part1.r2 2/26/09 11:58 AM Page 28
The Travel & Tourism Competitiveness Report 2009 © 2009 World Economic Forum

29
1.1:
The
Tra
vel &
Tou
rism
Com
petit
iven
ess
Inde
x 20
09
In this appendix we present the detailed rankings and scores of the Travel & Tourism Competitiveness Index for 2009for all 133 countries covered this year.This complements the regional rankings shown in the chapter.
Table B1: The Travel & Tourism Competitiveness Index 2009
SUBINDEXES
T&T business environment T&T human, cultural, OVERALL INDEX T&T regulatory framework and infrastructure and natural resources
Country/Economy Rank Score Rank Score Rank Score Rank Score
Albania 90 3.68 77 4.38 104 2.76 66 3.89Algeria 115 3.31 108 3.88 98 2.84 127 3.22Argentina 65 4.08 74 4.40 70 3.51 41 4.34Armenia 91 3.65 58 4.70 105 2.75 102 3.51Australia 9 5.24 27 5.31 15 5.01 3 5.42Austria 2 5.46 4 5.91 6 5.22 7 5.24Azerbaijan 76 3.84 47 4.95 84 3.19 111 3.40Bahrain 41 4.42 55 4.75 28 4.64 67 3.88Bangladesh 129 3.02 130 3.16 103 2.78 130 3.11Barbados 30 4.77 19 5.47 29 4.62 45 4.21Belgium 22 4.92 21 5.45 32 4.56 20 4.73Benin 120 3.18 117 3.66 121 2.52 116 3.37Bolivia 114 3.33 127 3.33 110 2.70 58 3.96Bosnia and Herzegovina 107 3.44 96 4.11 93 2.96 124 3.25Botswana 79 3.81 66 4.55 76 3.29 95 3.60Brazil 45 4.35 95 4.12 69 3.53 4 5.40Brunei Darussalam 69 3.99 99 4.04 47 3.96 60 3.95Bulgaria 50 4.30 56 4.74 48 3.96 46 4.20Burkina Faso 126 3.08 118 3.66 122 2.52 131 3.05Burundi 131 2.98 129 3.17 119 2.53 126 3.24Cambodia 108 3.43 111 3.80 113 2.64 74 3.84Cameroon 125 3.09 126 3.54 132 2.36 115 3.37Canada 5 5.32 23 5.41 4 5.36 10 5.19Chad 133 2.52 133 2.83 133 1.93 132 2.80Chile 57 4.18 49 4.87 58 3.76 64 3.92China 47 4.33 88 4.24 59 3.73 12 5.01Colombia 72 3.89 91 4.18 88 3.08 34 4.43Costa Rica 42 4.42 48 4.94 55 3.77 31 4.54Côte d’Ivoire 130 2.99 131 3.12 123 2.50 118 3.35Croatia 34 4.54 43 5.02 37 4.32 43 4.28Cyprus 21 4.92 25 5.35 13 5.05 37 4.38Czech Republic 26 4.86 16 5.50 36 4.41 24 4.67Denmark 14 5.08 10 5.59 10 5.08 28 4.57Dominican Republic 67 4.03 54 4.75 71 3.46 68 3.88Ecuador 96 3.62 103 4.01 97 2.91 62 3.93Egypt 64 4.09 52 4.84 65 3.59 73 3.84El Salvador 94 3.63 73 4.42 83 3.19 123 3.28Estonia 27 4.83 17 5.50 21 4.81 47 4.19Ethiopia 123 3.15 128 3.27 112 2.65 101 3.52Finland 15 5.07 5 5.82 25 4.69 21 4.71France 4 5.34 8 5.67 7 5.22 11 5.13Gambia, The 87 3.72 65 4.56 90 3.06 98 3.55Georgia 73 3.89 33 5.20 99 2.84 92 3.64Germany 3 5.41 13 5.56 3 5.44 9 5.22Ghana 110 3.40 105 3.94 102 2.78 104 3.49Greece 24 4.91 18 5.49 27 4.66 27 4.58Guatemala 70 3.90 81 4.32 81 3.20 48 4.17Guyana 102 3.50 94 4.14 111 2.68 88 3.66Honduras 83 3.77 83 4.31 87 3.08 63 3.92Hong Kong SAR 12 5.18 2 5.93 12 5.05 30 4.55Hungary 38 4.45 26 5.35 42 4.06 59 3.95Iceland 16 5.07 3 5.92 17 4.93 39 4.37India 62 4.09 107 3.88 63 3.65 18 4.74Indonesia 81 3.79 113 3.77 79 3.24 40 4.36Ireland 18 4.99 7 5.73 22 4.79 32 4.45Israel 36 4.50 37 5.13 39 4.21 51 4.16Italy 28 4.78 46 4.96 26 4.68 22 4.71
(Cont’d.)
Appendix B: Travel & Tourism Competitiveness Index 2009 detailed rankings
part1.r2 2/26/09 11:58 AM Page 29
The Travel & Tourism Competitiveness Report 2009 © 2009 World Economic Forum
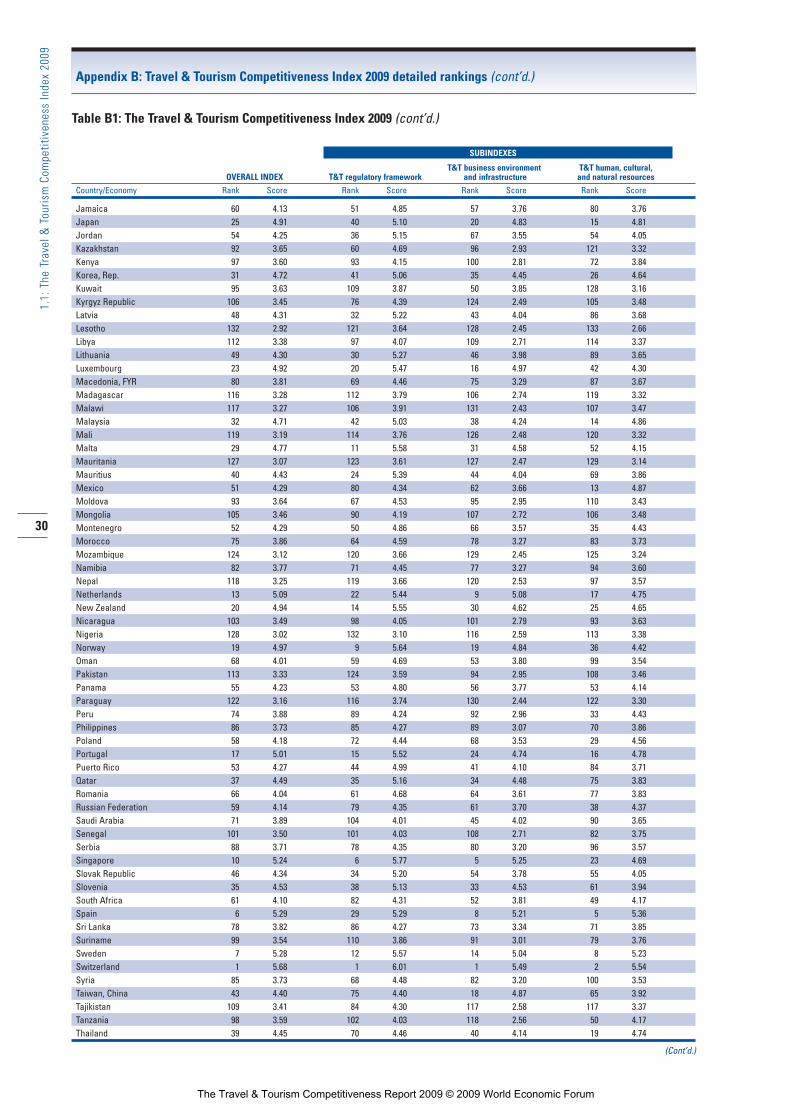
30
1.1:
The
Tra
vel &
Tou
rism
Com
petit
iven
ess
Inde
x 20
09
Table B1: The Travel & Tourism Competitiveness Index 2009 (cont’d.)
SUBINDEXES
T&T business environment T&T human, cultural, OVERALL INDEX T&T regulatory framework and infrastructure and natural resources
Country/Economy Rank Score Rank Score Rank Score Rank Score
Jamaica 60 4.13 51 4.85 57 3.76 80 3.76Japan 25 4.91 40 5.10 20 4.83 15 4.81Jordan 54 4.25 36 5.15 67 3.55 54 4.05Kazakhstan 92 3.65 60 4.69 96 2.93 121 3.32Kenya 97 3.60 93 4.15 100 2.81 72 3.84Korea, Rep. 31 4.72 41 5.06 35 4.45 26 4.64Kuwait 95 3.63 109 3.87 50 3.85 128 3.16Kyrgyz Republic 106 3.45 76 4.39 124 2.49 105 3.48Latvia 48 4.31 32 5.22 43 4.04 86 3.68Lesotho 132 2.92 121 3.64 128 2.45 133 2.66Libya 112 3.38 97 4.07 109 2.71 114 3.37Lithuania 49 4.30 30 5.27 46 3.98 89 3.65Luxembourg 23 4.92 20 5.47 16 4.97 42 4.30Macedonia, FYR 80 3.81 69 4.46 75 3.29 87 3.67Madagascar 116 3.28 112 3.79 106 2.74 119 3.32Malawi 117 3.27 106 3.91 131 2.43 107 3.47Malaysia 32 4.71 42 5.03 38 4.24 14 4.86Mali 119 3.19 114 3.76 126 2.48 120 3.32Malta 29 4.77 11 5.58 31 4.58 52 4.15Mauritania 127 3.07 123 3.61 127 2.47 129 3.14Mauritius 40 4.43 24 5.39 44 4.04 69 3.86Mexico 51 4.29 80 4.34 62 3.66 13 4.87Moldova 93 3.64 67 4.53 95 2.95 110 3.43Mongolia 105 3.46 90 4.19 107 2.72 106 3.48Montenegro 52 4.29 50 4.86 66 3.57 35 4.43Morocco 75 3.86 64 4.59 78 3.27 83 3.73Mozambique 124 3.12 120 3.66 129 2.45 125 3.24Namibia 82 3.77 71 4.45 77 3.27 94 3.60Nepal 118 3.25 119 3.66 120 2.53 97 3.57Netherlands 13 5.09 22 5.44 9 5.08 17 4.75New Zealand 20 4.94 14 5.55 30 4.62 25 4.65Nicaragua 103 3.49 98 4.05 101 2.79 93 3.63Nigeria 128 3.02 132 3.10 116 2.59 113 3.38Norway 19 4.97 9 5.64 19 4.84 36 4.42Oman 68 4.01 59 4.69 53 3.80 99 3.54Pakistan 113 3.33 124 3.59 94 2.95 108 3.46Panama 55 4.23 53 4.80 56 3.77 53 4.14Paraguay 122 3.16 116 3.74 130 2.44 122 3.30Peru 74 3.88 89 4.24 92 2.96 33 4.43Philippines 86 3.73 85 4.27 89 3.07 70 3.86Poland 58 4.18 72 4.44 68 3.53 29 4.56Portugal 17 5.01 15 5.52 24 4.74 16 4.78Puerto Rico 53 4.27 44 4.99 41 4.10 84 3.71Qatar 37 4.49 35 5.16 34 4.48 75 3.83Romania 66 4.04 61 4.68 64 3.61 77 3.83Russian Federation 59 4.14 79 4.35 61 3.70 38 4.37Saudi Arabia 71 3.89 104 4.01 45 4.02 90 3.65Senegal 101 3.50 101 4.03 108 2.71 82 3.75Serbia 88 3.71 78 4.35 80 3.20 96 3.57Singapore 10 5.24 6 5.77 5 5.25 23 4.69Slovak Republic 46 4.34 34 5.20 54 3.78 55 4.05Slovenia 35 4.53 38 5.13 33 4.53 61 3.94South Africa 61 4.10 82 4.31 52 3.81 49 4.17Spain 6 5.29 29 5.29 8 5.21 5 5.36Sri Lanka 78 3.82 86 4.27 73 3.34 71 3.85Suriname 99 3.54 110 3.86 91 3.01 79 3.76Sweden 7 5.28 12 5.57 14 5.04 8 5.23Switzerland 1 5.68 1 6.01 1 5.49 2 5.54Syria 85 3.73 68 4.48 82 3.20 100 3.53Taiwan, China 43 4.40 75 4.40 18 4.87 65 3.92Tajikistan 109 3.41 84 4.30 117 2.58 117 3.37Tanzania 98 3.59 102 4.03 118 2.56 50 4.17Thailand 39 4.45 70 4.46 40 4.14 19 4.74
(Cont’d.)
Appendix B: Travel & Tourism Competitiveness Index 2009 detailed rankings (cont’d.)
part1.r2 2/26/09 11:58 AM Page 30
The Travel & Tourism Competitiveness Report 2009 © 2009 World Economic Forum

31
1.1:
The
Tra
vel &
Tou
rism
Com
petit
iven
ess
Inde
x 20
09
Table B1: The Travel & Tourism Competitiveness Index 2009 (cont’d.)
SUBINDEXES
T&T business environment T&T human, cultural, OVERALL INDEX T&T regulatory framework and infrastructure and natural resources
Country/Economy Rank Score Rank Score Rank Score Rank Score
Trinidad and Tobago 84 3.75 100 4.04 51 3.82 112 3.38Tunisia 44 4.37 31 5.26 49 3.87 56 3.97Turkey 56 4.20 63 4.60 60 3.73 44 4.28Uganda 111 3.38 115 3.75 114 2.64 81 3.76Ukraine 77 3.84 62 4.66 72 3.37 103 3.50United Arab Emirates 33 4.57 39 5.12 23 4.79 78 3.81United Kingdom 11 5.22 28 5.29 11 5.07 6 5.30United States 8 5.28 57 4.70 2 5.47 1 5.67Uruguay 63 4.09 45 4.98 74 3.33 57 3.96Venezuela 104 3.46 122 3.63 86 3.12 91 3.65Vietnam 89 3.70 92 4.15 85 3.12 76 3.83Zambia 100 3.53 87 4.26 115 2.64 85 3.69Zimbabwe 121 3.17 125 3.57 125 2.49 109 3.43
Appendix B: Travel & Tourism Competitiveness Index 2009 detailed rankings (cont’d.)
part1.r2 2/26/09 11:58 AM Page 31
The Travel & Tourism Competitiveness Report 2009 © 2009 World Economic Forum

32
1.1:
The
Tra
vel &
Tou
rism
Com
petit
iven
ess
Inde
x 20
09
Table B2: The Travel & Tourism Competitiveness Index: Regulatory framework
PILLARS
T&T REGULATORY 1. Policy rules 2. Environmental 3. Safety 4. Health 5. Prioritization ofFRAMEWORK and regulations sustainability and security and hygiene Travel & Tourism
Country/Economy Rank Score Rank Score Rank Score Rank Score Rank Score Rank Score
Albania 77 4.38 92 3.99 88 4.24 63 5.21 59 4.86 107 3.62Algeria 108 3.88 111 3.69 116 3.90 97 4.60 81 4.17 124 3.04Argentina 74 4.40 98 3.91 119 3.85 102 4.45 43 5.64 79 4.15Armenia 58 4.70 77 4.27 113 3.93 45 5.60 30 6.02 104 3.67Australia 27 5.31 27 5.09 40 4.88 25 5.94 41 5.71 37 4.91Austria 4 5.91 28 5.09 9 5.56 6 6.47 5 6.87 14 5.55Azerbaijan 47 4.95 65 4.44 72 4.39 37 5.81 39 5.80 66 4.31Bahrain 55 4.75 32 5.04 129 3.42 30 5.87 55 5.06 63 4.37Bangladesh 130 3.16 117 3.45 125 3.64 131 3.10 115 2.27 117 3.33Barbados 19 5.47 24 5.14 29 5.08 26 5.94 40 5.77 19 5.43Belgium 21 5.45 20 5.23 8 5.59 21 6.01 16 6.55 92 3.88Benin 117 3.66 124 3.24 38 4.88 68 5.12 125 1.64 115 3.42Bolivia 127 3.33 131 2.62 126 3.62 104 4.40 104 3.09 128 2.94Bosnia and Herzegovina 96 4.11 119 3.40 115 3.92 57 5.30 56 4.99 126 2.95Botswana 66 4.55 70 4.36 62 4.60 49 5.52 97 3.43 43 4.82Brazil 95 4.12 94 3.97 33 4.96 130 3.36 80 4.20 84 4.11Brunei Darussalam 99 4.04 88 4.04 131 3.32 19 6.08 105 3.02 99 3.76Bulgaria 56 4.74 95 3.95 76 4.35 87 4.71 15 6.56 78 4.15Burkina Faso 118 3.66 110 3.72 71 4.41 83 4.83 122 1.83 110 3.51Burundi 129 3.17 128 2.83 75 4.36 106 4.35 118 2.08 133 2.23Cambodia 111 3.80 122 3.33 107 4.00 88 4.68 126 1.56 18 5.44Cameroon 126 3.54 120 3.37 110 3.98 80 4.88 112 2.47 125 3.00Canada 23 5.41 5 5.50 46 4.81 29 5.89 51 5.38 17 5.47Chad 133 2.83 132 2.52 128 3.58 115 4.03 132 1.07 127 2.95Chile 49 4.87 19 5.24 64 4.56 38 5.79 66 4.58 77 4.15China 88 4.24 87 4.08 105 4.03 116 4.02 91 3.89 28 5.19Colombia 91 4.18 60 4.53 84 4.26 125 3.72 86 4.07 67 4.30Costa Rica 48 4.94 48 4.75 27 5.13 72 5.08 65 4.59 29 5.16Côte d’Ivoire 131 3.12 115 3.51 102 4.10 124 3.74 119 2.03 132 2.24Croatia 43 5.02 80 4.21 39 4.88 42 5.70 33 5.97 64 4.35Cyprus 25 5.35 69 4.38 43 4.83 12 6.25 45 5.61 11 5.69Czech Republic 16 5.50 46 4.76 23 5.18 44 5.63 6 6.82 32 5.10Denmark 10 5.59 4 5.58 3 5.83 4 6.50 28 6.10 91 3.95Dominican Republic 54 4.75 26 5.10 108 4.00 101 4.50 68 4.52 13 5.63Ecuador 103 4.01 126 3.20 86 4.24 99 4.54 73 4.40 106 3.65Egypt 52 4.84 55 4.60 103 4.08 67 5.13 64 4.59 9 5.81El Salvador 73 4.42 40 4.89 58 4.63 112 4.14 92 3.86 56 4.56Estonia 17 5.50 31 5.06 30 5.08 20 6.02 23 6.26 34 5.05Ethiopia 128 3.27 100 3.86 109 3.98 117 3.99 133 1.02 111 3.50Finland 5 5.82 6 5.45 7 5.62 1 6.75 12 6.63 54 4.64France 8 5.67 25 5.12 4 5.76 55 5.32 9 6.74 21 5.40Gambia, The 65 4.56 85 4.11 52 4.71 27 5.92 107 2.80 25 5.25Georgia 33 5.20 56 4.58 56 4.65 32 5.86 29 6.06 40 4.85Germany 13 5.56 17 5.26 6 5.68 39 5.77 7 6.79 65 4.33Ghana 105 3.94 84 4.13 48 4.76 69 5.12 117 2.11 108 3.59Greece 18 5.49 57 4.55 47 4.77 47 5.59 19 6.39 3 6.14Guatemala 81 4.32 45 4.76 95 4.19 114 4.09 88 4.01 55 4.56Guyana 94 4.14 118 3.43 50 4.74 111 4.16 84 4.13 72 4.25Honduras 83 4.31 41 4.87 59 4.63 89 4.68 103 3.23 83 4.13Hong Kong SAR 2 5.93 2 6.03 80 4.30 5 6.48 1 7.00 8 5.84Hungary 26 5.35 37 4.92 24 5.14 41 5.75 11 6.64 68 4.30Iceland 3 5.92 21 5.19 13 5.37 2 6.71 4 6.91 20 5.41India 107 3.88 108 3.73 74 4.37 120 3.91 111 2.57 42 4.84Indonesia 113 3.77 123 3.27 130 3.40 119 3.91 110 2.58 10 5.70Ireland 7 5.73 3 5.68 12 5.47 18 6.10 25 6.22 27 5.20Israel 37 5.13 39 4.89 81 4.30 73 5.06 14 6.57 41 4.85Italy 46 4.96 71 4.36 51 4.73 82 4.88 27 6.18 51 4.68Jamaica 51 4.85 8 5.40 93 4.21 96 4.60 85 4.09 5 5.98Japan 40 5.10 38 4.91 49 4.74 84 4.83 21 6.29 49 4.73Jordan 36 5.15 61 4.52 35 4.93 17 6.13 58 4.89 24 5.28Kazakhstan 60 4.69 86 4.10 117 3.89 76 4.98 8 6.77 101 3.73Kenya 93 4.15 90 4.00 16 5.34 121 3.88 121 1.86 12 5.68Korea, Rep. 41 5.06 34 5.03 55 4.67 71 5.10 37 5.84 52 4.67Kuwait 109 3.87 101 3.82 133 2.79 28 5.92 76 4.38 131 2.44Kyrgyz Republic 76 4.39 102 3.82 89 4.24 90 4.67 50 5.44 97 3.77Latvia 32 5.22 51 4.71 14 5.34 35 5.82 26 6.21 88 4.00
(Cont’d.)
Appendix B: Travel & Tourism Competitiveness Index 2009 detailed rankings (cont’d.)
part1.r2 2/26/09 11:58 AM Page 32
The Travel & Tourism Competitiveness Report 2009 © 2009 World Economic Forum

33
1.1:
The
Tra
vel &
Tou
rism
Com
petit
iven
ess
Inde
x 20
09
Table B2: The Travel & Tourism Competitiveness Index: Regulatory framework (cont’d.)
PILLARS
T&T REGULATORY 1. Policy rules 2. Environmental 3. Safety 4. Health 5. Prioritization ofFRAMEWORK and regulations sustainability and security and hygiene Travel & Tourism
Country/Economy Rank Score Rank Score Rank Score Rank Score Rank Score Rank Score
Lesotho 121 3.64 112 3.64 90 4.23 95 4.61 113 2.31 114 3.42Libya 97 4.07 125 3.23 122 3.75 34 5.82 77 4.26 120 3.28Lithuania 30 5.27 59 4.53 21 5.25 33 5.84 2 6.96 95 3.78Luxembourg 20 5.47 12 5.33 15 5.34 7 6.43 22 6.28 89 3.98Macedonia, FYR 69 4.46 76 4.28 83 4.27 64 5.19 42 5.65 129 2.93Madagascar 112 3.79 83 4.13 65 4.53 93 4.62 131 1.14 57 4.54Malawi 106 3.91 106 3.79 60 4.62 53 5.34 108 2.68 123 3.11Malaysia 42 5.03 9 5.38 54 4.69 59 5.29 69 4.47 23 5.31Mali 114 3.76 116 3.50 70 4.46 77 4.93 124 1.76 76 4.17Malta 11 5.58 54 4.64 66 4.52 11 6.31 3 6.94 16 5.48Mauritania 123 3.61 107 3.79 96 4.17 75 4.98 128 1.39 100 3.74Mauritius 24 5.39 13 5.30 53 4.70 40 5.75 60 4.86 1 6.34Mexico 80 4.34 58 4.54 101 4.11 126 3.60 74 4.39 35 5.03Moldova 67 4.53 82 4.16 82 4.29 52 5.36 48 5.53 118 3.30Mongolia 90 4.19 91 3.99 124 3.68 74 5.03 72 4.42 94 3.80Montenegro 50 4.86 35 4.96 98 4.15 48 5.53 52 5.35 69 4.30Morocco 64 4.59 50 4.73 36 4.90 79 4.89 100 3.28 30 5.14Mozambique 120 3.66 99 3.89 57 4.65 103 4.43 130 1.27 85 4.05Namibia 71 4.45 79 4.22 26 5.13 60 5.26 102 3.24 62 4.41Nepal 119 3.66 127 3.06 87 4.24 123 3.81 114 2.30 39 4.87Netherlands 22 5.44 11 5.37 5 5.68 36 5.82 20 6.38 90 3.96New Zealand 14 5.55 10 5.37 22 5.20 15 6.19 31 5.99 36 5.00Nicaragua 98 4.05 97 3.92 41 4.87 56 5.31 109 2.62 109 3.51Nigeria 132 3.10 113 3.64 61 4.61 133 2.85 129 1.28 122 3.13Norway 9 5.64 23 5.16 19 5.30 3 6.63 24 6.22 38 4.90Oman 59 4.69 49 4.73 78 4.33 16 6.14 78 4.23 86 4.05Pakistan 124 3.59 81 4.19 118 3.88 132 3.06 98 3.38 113 3.45Panama 53 4.80 30 5.06 34 4.94 70 5.11 83 4.14 48 4.73Paraguay 116 3.74 121 3.35 121 3.84 105 4.39 99 3.36 98 3.76Peru 89 4.24 63 4.47 85 4.26 108 4.26 96 3.56 53 4.64Philippines 85 4.27 72 4.34 73 4.38 113 4.12 87 4.02 59 4.51Poland 72 4.44 75 4.30 63 4.58 91 4.65 67 4.54 82 4.13Portugal 15 5.52 29 5.09 18 5.33 22 6.01 32 5.97 26 5.20Puerto Rico 44 4.99 15 5.28 11 5.49 65 5.16 63 4.74 71 4.25Qatar 35 5.16 47 4.75 69 4.48 9 6.37 49 5.47 45 4.75Romania 61 4.68 64 4.46 37 4.89 62 5.26 54 5.09 102 3.72Russian Federation 79 4.35 114 3.52 114 3.93 129 3.45 10 6.65 75 4.17Saudi Arabia 104 4.01 73 4.34 123 3.71 81 4.88 93 3.83 121 3.26Senegal 101 4.03 103 3.82 67 4.52 43 5.67 120 1.89 70 4.28Serbia 78 4.35 67 4.42 127 3.61 85 4.81 44 5.63 119 3.29Singapore 6 5.77 1 6.24 42 4.85 10 6.33 53 5.19 2 6.26Slovak Republic 34 5.20 33 5.03 25 5.14 46 5.59 17 6.53 103 3.70Slovenia 38 5.13 66 4.44 20 5.27 24 5.95 36 5.85 80 4.14South Africa 82 4.31 36 4.96 44 4.83 128 3.51 94 3.80 60 4.45Spain 29 5.29 74 4.32 31 5.04 66 5.16 35 5.91 4 6.04Sri Lanka 86 4.27 68 4.39 112 3.94 107 4.35 90 3.95 47 4.74Suriname 110 3.86 129 2.78 77 4.35 61 5.26 82 4.17 130 2.74Sweden 12 5.57 7 5.42 1 6.22 13 6.22 38 5.82 73 4.19Switzerland 1 6.01 18 5.25 2 5.89 8 6.40 13 6.62 7 5.88Syria 68 4.48 93 3.98 111 3.97 23 5.95 89 3.97 58 4.52Taiwan, China 75 4.40 42 4.85 92 4.21 51 5.47 101 3.28 74 4.18Tajikistan 84 4.30 109 3.72 97 4.15 54 5.33 61 4.82 112 3.49Tanzania 102 4.03 89 4.00 32 4.99 98 4.59 127 1.51 33 5.06Thailand 70 4.46 62 4.48 99 4.13 118 3.94 71 4.42 22 5.34Trinidad and Tobago 100 4.04 52 4.69 132 3.18 110 4.20 70 4.46 105 3.67Tunisia 31 5.26 22 5.19 17 5.34 31 5.86 75 4.38 15 5.52Turkey 63 4.60 44 4.79 104 4.08 92 4.63 62 4.78 46 4.75Uganda 115 3.75 105 3.79 28 5.09 109 4.25 123 1.81 93 3.83Ukraine 62 4.66 104 3.80 79 4.31 86 4.74 18 6.44 87 4.03United Arab Emirates 39 5.12 53 4.68 120 3.84 14 6.22 57 4.91 6 5.97United Kingdom 28 5.29 14 5.30 10 5.55 78 4.93 46 5.59 31 5.10United States 57 4.70 16 5.27 106 4.01 122 3.85 47 5.56 44 4.80Uruguay 45 4.98 78 4.24 68 4.52 50 5.51 34 5.94 50 4.69Venezuela 122 3.63 130 2.72 91 4.23 127 3.58 79 4.22 116 3.39Vietnam 92 4.15 96 3.92 100 4.13 100 4.53 95 3.77 61 4.42Zambia 87 4.26 43 4.80 45 4.82 58 5.29 116 2.24 81 4.14Zimbabwe 125 3.57 133 2.29 94 4.20 94 4.62 106 2.99 96 3.77
Appendix B: Travel & Tourism Competitiveness Index 2009 detailed rankings (cont’d.)
part1.r2 2/26/09 11:58 AM Page 33
The Travel & Tourism Competitiveness Report 2009 © 2009 World Economic Forum

34
1.1:
The
Tra
vel &
Tou
rism
Com
petit
iven
ess
Inde
x 20
09
Table B3: The Travel & Tourism Competitiveness Index: Business environment and infrastructure
PILLARS
T&T BUSINESS ENVIRONMENT 6. Air transport 7. Ground transport 8. Tourism 9. ICT 10. Price competitiveness AND INFRASTRUCTURE infrastructure infrastructure infrastructure infrastructure in T&T industry
Country/Economy Rank Score Rank Score Rank Score Rank Score Rank Score Rank Score
Albania 104 2.76 104 2.40 113 2.53 85 2.17 89 2.33 84 4.35Algeria 98 2.84 110 2.29 101 2.74 95 1.95 97 2.11 32 5.11Argentina 70 3.51 72 2.87 105 2.71 52 3.82 53 3.28 52 4.87Armenia 105 2.75 96 2.53 95 2.86 106 1.67 107 1.93 63 4.76Australia 15 5.01 3 5.86 47 4.08 9 6.35 20 4.90 117 3.85Austria 6 5.22 26 4.52 10 6.02 1 7.00 23 4.76 118 3.81Azerbaijan 84 3.19 78 2.75 45 4.10 99 1.92 87 2.40 62 4.76Bahrain 28 4.64 28 4.38 16 5.48 47 3.93 44 3.76 6 5.62Bangladesh 103 2.78 111 2.26 60 3.72 132 1.01 125 1.56 18 5.36Barbados 29 4.62 33 4.23 12 5.68 42 4.16 26 4.63 83 4.41Belgium 32 4.56 31 4.27 7 6.10 41 4.18 22 4.81 126 3.46Benin 121 2.52 121 2.11 104 2.71 116 1.54 118 1.67 74 4.56Bolivia 110 2.70 114 2.23 124 2.25 104 1.76 109 1.87 13 5.40Bosnia and Herzegovina 93 2.96 130 1.86 126 2.23 57 3.66 66 2.87 100 4.16Botswana 76 3.29 83 2.69 66 3.48 79 2.50 93 2.19 9 5.57Brazil 69 3.53 46 3.76 110 2.59 45 4.00 60 3.06 91 4.24Brunei Darussalam 47 3.96 32 4.24 35 4.30 86 2.17 55 3.24 2 5.88Bulgaria 48 3.96 90 2.60 75 3.23 18 5.84 47 3.59 73 4.57Burkina Faso 122 2.52 124 2.03 82 3.15 110 1.62 128 1.50 87 4.28Burundi 119 2.53 120 2.13 86 3.04 123 1.40 131 1.46 71 4.64Cambodia 113 2.64 106 2.39 107 2.67 125 1.27 122 1.60 21 5.30Cameroon 132 2.36 126 2.01 114 2.52 114 1.56 124 1.56 104 4.13Canada 4 5.36 1 6.74 24 4.91 20 5.72 13 5.30 106 4.11Chad 133 1.93 131 1.69 131 2.09 131 1.01 133 1.36 125 3.52Chile 58 3.76 51 3.51 57 3.80 69 3.21 49 3.41 53 4.86China 59 3.73 34 4.21 55 3.85 80 2.46 68 2.81 20 5.33Colombia 88 3.08 65 3.06 108 2.66 93 2.03 65 2.90 66 4.74Costa Rica 55 3.77 42 3.88 103 2.72 33 4.48 61 2.96 57 4.82Côte d’Ivoire 123 2.50 88 2.65 71 3.34 133 1.00 113 1.77 120 3.76Croatia 37 4.32 69 3.00 54 3.87 6 6.64 38 3.97 103 4.13Cyprus 13 5.05 21 4.70 19 5.27 8 6.55 32 4.29 82 4.42Czech Republic 36 4.41 50 3.51 25 4.88 24 5.11 29 4.39 97 4.18Denmark 10 5.08 12 5.10 6 6.27 23 5.21 4 5.77 131 3.04Dominican Republic 71 3.46 47 3.72 99 2.83 51 3.83 83 2.44 81 4.49Ecuador 97 2.91 86 2.67 119 2.36 89 2.10 85 2.41 40 5.03Egypt 65 3.59 58 3.32 79 3.19 74 2.97 84 2.43 1 6.02El Salvador 83 3.19 74 2.81 78 3.20 87 2.10 74 2.69 31 5.13Estonia 21 4.81 59 3.27 29 4.77 15 6.10 16 5.16 64 4.75Ethiopia 112 2.65 97 2.51 117 2.47 122 1.42 132 1.45 15 5.39Finland 25 4.69 14 5.03 21 5.25 38 4.31 14 5.25 121 3.62France 7 5.22 5 5.54 3 6.55 14 6.19 19 4.95 132 2.86Gambia, The 90 3.06 85 2.69 58 3.80 124 1.37 100 2.07 14 5.40Georgia 99 2.84 100 2.48 67 3.48 115 1.54 96 2.12 72 4.57Germany 3 5.44 7 5.48 5 6.50 17 5.99 11 5.43 119 3.79Ghana 102 2.78 101 2.47 96 2.85 105 1.76 114 1.77 36 5.06Greece 27 4.66 19 4.75 43 4.14 5 6.67 40 3.85 114 3.91Guatemala 81 3.20 71 2.92 92 2.89 82 2.33 78 2.60 23 5.26Guyana 111 2.68 112 2.26 109 2.63 128 1.08 82 2.44 41 5.00Honduras 87 3.08 66 3.05 77 3.20 103 1.82 95 2.12 30 5.22Hong Kong SAR 12 5.05 13 5.08 2 6.58 68 3.21 9 5.44 45 4.97Hungary 42 4.06 68 3.00 33 4.41 27 4.88 36 4.05 112 3.94Iceland 17 4.93 18 4.83 34 4.40 13 6.20 2 5.86 128 3.36India 63 3.65 37 4.17 49 4.06 73 3.07 104 2.00 46 4.96Indonesia 79 3.24 60 3.22 89 2.97 88 2.10 102 2.06 3 5.86Ireland 22 4.79 23 4.63 48 4.07 4 6.78 28 4.51 111 3.95Israel 39 4.21 52 3.45 36 4.28 32 4.49 24 4.69 101 4.15Italy 26 4.68 27 4.39 40 4.21 3 6.88 25 4.66 130 3.25Jamaica 57 3.76 55 3.35 41 4.17 70 3.20 48 3.42 68 4.68Japan 20 4.83 24 4.62 8 6.09 40 4.23 21 4.89 86 4.29Jordan 67 3.55 63 3.16 69 3.47 65 3.36 70 2.75 42 4.99Kazakhstan 96 2.93 89 2.61 87 3.01 91 2.05 72 2.73 93 4.22Kenya 100 2.81 77 2.77 98 2.85 98 1.93 110 1.87 70 4.65Korea, Rep. 35 4.45 39 3.98 15 5.49 71 3.17 8 5.47 102 4.14Kuwait 50 3.85 64 3.08 52 3.96 50 3.86 58 3.09 24 5.25Kyrgyz Republic 124 2.49 127 2.01 112 2.55 129 1.06 98 2.11 65 4.74Latvia 43 4.04 53 3.38 44 4.12 36 4.38 43 3.77 76 4.55
(Cont’d.)
Appendix B: Travel & Tourism Competitiveness Index 2009 detailed rankings (cont’d.)
part1.r2 2/26/09 11:58 AM Page 34
The Travel & Tourism Competitiveness Report 2009 © 2009 World Economic Forum

35
1.1:
The
Tra
vel &
Tou
rism
Com
petit
iven
ess
Inde
x 20
09
Table B3: The Travel & Tourism Competitiveness Index: Business environment and infrastructure (cont’d.)
PILLARS
T&T BUSINESS ENVIRONMENT 6. Air transport 7. Ground transport 8. Tourism 9. ICT 10. Price competitiveness AND INFRASTRUCTURE infrastructure infrastructure infrastructure infrastructure in T&T industry
Country/Economy Rank Score Rank Score Rank Score Rank Score Rank Score Rank Score
Lesotho 128 2.45 132 1.65 121 2.34 113 1.59 117 1.69 44 4.97Libya 109 2.71 102 2.46 122 2.29 107 1.67 91 2.21 48 4.93Lithuania 46 3.98 80 2.75 22 4.95 62 3.49 35 4.18 78 4.54Luxembourg 16 4.97 41 3.92 13 5.62 21 5.68 10 5.43 92 4.22Macedonia, FYR 75 3.29 119 2.15 76 3.20 63 3.44 67 2.86 59 4.80Madagascar 106 2.74 93 2.58 115 2.48 84 2.28 127 1.50 55 4.85Malawi 131 2.43 129 1.90 106 2.70 126 1.20 126 1.55 60 4.79Malaysia 38 4.24 35 4.19 28 4.80 77 2.74 46 3.63 4 5.85Mali 126 2.48 118 2.16 100 2.83 119 1.46 116 1.72 89 4.26Malta 31 4.58 22 4.66 27 4.82 22 5.57 33 4.26 122 3.59Mauritania 127 2.47 128 1.97 128 2.16 112 1.60 115 1.75 54 4.86Mauritius 44 4.04 49 3.53 31 4.55 53 3.79 59 3.07 26 5.24Mexico 62 3.66 40 3.98 84 3.06 49 3.91 69 2.80 77 4.55Moldova 95 2.95 122 2.10 111 2.57 90 2.09 73 2.70 22 5.27Mongolia 107 2.72 76 2.79 130 2.13 108 1.66 105 1.97 37 5.04Montenegro 66 3.57 56 3.35 88 3.00 64 3.37 39 3.95 95 4.21Morocco 78 3.27 67 3.01 70 3.36 72 3.07 88 2.36 79 4.53Mozambique 129 2.45 116 2.21 129 2.14 117 1.51 129 1.49 51 4.88Namibia 77 3.27 54 3.38 51 3.99 83 2.33 106 1.95 67 4.70Nepal 120 2.53 109 2.30 123 2.26 130 1.06 130 1.49 10 5.55Netherlands 9 5.08 16 4.99 9 6.05 25 5.00 5 5.76 124 3.59New Zealand 30 4.62 11 5.14 53 3.92 29 4.67 18 5.03 85 4.33Nicaragua 101 2.79 103 2.41 133 2.05 81 2.42 111 1.85 29 5.22Nigeria 116 2.59 95 2.53 118 2.39 121 1.42 108 1.93 69 4.68Norway 19 4.84 8 5.35 37 4.27 19 5.74 6 5.52 129 3.31Oman 53 3.80 57 3.33 46 4.10 61 3.50 75 2.67 17 5.37Pakistan 94 2.95 99 2.49 73 3.29 102 1.84 101 2.07 35 5.06Panama 56 3.77 36 4.18 74 3.25 56 3.67 76 2.66 33 5.09Paraguay 130 2.44 133 1.63 132 2.06 127 1.17 99 2.08 25 5.24Peru 92 2.96 92 2.58 125 2.24 78 2.50 81 2.52 47 4.94Philippines 89 3.07 73 2.87 90 2.95 96 1.94 92 2.20 16 5.37Poland 68 3.53 79 2.75 68 3.47 59 3.51 41 3.82 105 4.12Portugal 24 4.74 38 4.13 26 4.86 11 6.31 34 4.24 99 4.16Puerto Rico 41 4.10 29 4.37 30 4.70 48 3.93 52 3.33 98 4.17Qatar 34 4.48 20 4.74 59 3.75 28 4.86 37 4.05 39 5.03Romania 64 3.61 81 2.74 83 3.11 34 4.46 42 3.78 110 3.98Russian Federation 61 3.70 30 4.37 81 3.17 60 3.51 50 3.39 108 4.05Saudi Arabia 45 4.02 48 3.56 61 3.68 43 4.13 56 3.17 8 5.58Senegal 108 2.71 82 2.73 93 2.88 94 2.00 103 2.06 115 3.90Serbia 80 3.20 105 2.40 91 2.91 58 3.53 63 2.91 90 4.25Singapore 5 5.25 15 5.03 4 6.50 37 4.37 17 5.11 27 5.23Slovak Republic 54 3.78 108 2.34 50 4.02 31 4.59 45 3.67 88 4.27Slovenia 33 4.53 70 2.92 23 4.94 16 6.01 27 4.59 94 4.22South Africa 52 3.81 43 3.87 64 3.58 46 3.96 80 2.58 38 5.03Spain 8 5.21 10 5.23 20 5.26 1 7.00 31 4.34 96 4.20Sri Lanka 73 3.34 87 2.65 32 4.50 92 2.04 90 2.27 28 5.22Suriname 91 3.01 91 2.59 120 2.34 67 3.24 86 2.40 80 4.50Sweden 14 5.04 9 5.26 14 5.54 26 4.90 1 6.04 127 3.43Switzerland 1 5.49 17 4.90 1 6.58 7 6.60 3 5.78 123 3.59Syria 82 3.20 98 2.50 63 3.60 97 1.94 94 2.16 5 5.79Taiwan, China 18 4.87 45 3.79 11 5.71 35 4.44 12 5.34 34 5.08Tajikistan 117 2.58 117 2.18 102 2.73 120 1.45 121 1.62 49 4.89Tanzania 118 2.56 113 2.23 116 2.48 118 1.49 120 1.64 43 4.97Thailand 40 4.14 25 4.54 56 3.82 39 4.27 71 2.74 19 5.35Trinidad and Tobago 51 3.82 61 3.18 38 4.25 66 3.26 62 2.94 12 5.46Tunisia 49 3.87 62 3.18 42 4.16 54 3.79 77 2.62 7 5.60Turkey 60 3.73 44 3.83 62 3.63 44 4.02 57 3.13 109 4.03Uganda 114 2.64 125 2.01 94 2.86 101 1.88 119 1.65 61 4.78Ukraine 72 3.37 94 2.57 72 3.32 55 3.71 51 3.37 116 3.88United Arab Emirates 23 4.79 4 5.81 39 4.24 30 4.63 30 4.36 50 4.88United Kingdom 11 5.07 6 5.52 17 5.39 12 6.21 7 5.48 133 2.76United States 2 5.47 2 6.35 18 5.31 10 6.35 15 5.23 107 4.10Uruguay 74 3.33 115 2.23 65 3.55 76 2.80 54 3.27 58 4.81Venezuela 86 3.12 75 2.81 127 2.22 75 2.82 64 2.91 56 4.84Vietnam 85 3.12 84 2.69 80 3.19 109 1.65 79 2.59 11 5.49Zambia 115 2.64 107 2.38 97 2.85 111 1.62 112 1.78 75 4.56Zimbabwe 125 2.49 123 2.05 85 3.05 100 1.90 123 1.57 113 3.91
Appendix B: Travel & Tourism Competitiveness Index 2009 detailed rankings (cont’d.)
part1.r2 2/26/09 11:58 AM Page 35
The Travel & Tourism Competitiveness Report 2009 © 2009 World Economic Forum

36
1.1:
The
Tra
vel &
Tou
rism
Com
petit
iven
ess
Inde
x 20
09
Table B4: The Travel & Tourism Competitiveness Index: Human, cultural, and natural resources
PILLARS
T&T HUMAN, CULTURAL, 11. Human 12. Affinity for 13. Natural 14. CulturalAND NATURAL RESOURCES resources Travel & Tourism resources resources
Country/Economy Rank Score Rank Score Rank Score Rank Score Rank Score
Albania 66 3.89 62 5.10 4 6.44 129 2.06 79 1.96Algeria 127 3.22 101 4.52 132 3.62 105 2.54 69 2.19Argentina 41 4.34 73 5.02 94 4.52 13 4.91 43 2.92Armenia 102 3.51 81 4.91 46 4.97 118 2.25 82 1.91Australia 3 5.42 10 5.86 52 4.88 4 5.77 19 5.15Austria 7 5.24 18 5.68 23 5.40 40 4.05 11 5.83Azerbaijan 111 3.40 67 5.07 89 4.56 113 2.39 104 1.56Bahrain 67 3.88 39 5.32 45 4.98 104 2.57 55 2.66Bangladesh 130 3.11 110 4.30 126 4.06 102 2.60 110 1.46Barbados 45 4.21 32 5.45 2 6.64 121 2.20 59 2.54Belgium 20 4.73 13 5.80 42 5.00 120 2.20 8 5.93Benin 116 3.37 111 4.25 98 4.51 60 3.33 118 1.38Bolivia 58 3.96 103 4.48 125 4.08 12 4.97 66 2.32Bosnia and Herzegovina 124 3.25 109 4.36 92 4.54 123 2.19 81 1.92Botswana 95 3.60 120 3.96 49 4.92 34 4.24 126 1.25Brazil 4 5.40 55 5.17 108 4.41 2 6.37 14 5.64Brunei Darussalam 60 3.95 52 5.17 100 4.51 31 4.26 86 1.86Bulgaria 46 4.20 65 5.09 18 5.45 68 3.11 36 3.13Burkina Faso 131 3.05 129 3.60 101 4.47 71 3.06 131 1.09Burundi 126 3.24 127 3.75 16 5.49 97 2.70 133 1.02Cambodia 74 3.84 108 4.37 15 5.52 58 3.45 77 2.00Cameroon 115 3.37 123 3.88 97 4.51 42 3.92 129 1.17Canada 10 5.19 6 5.96 67 4.73 17 4.73 18 5.33Chad 132 2.80 132 3.33 120 4.16 99 2.67 132 1.02Chile 64 3.92 47 5.23 111 4.39 63 3.20 48 2.87China 12 5.01 43 5.25 127 4.00 7 5.26 15 5.51Colombia 34 4.43 64 5.09 104 4.44 5 5.51 56 2.66Costa Rica 31 4.54 24 5.63 27 5.36 6 5.42 89 1.77Côte d’Ivoire 118 3.35 126 3.76 116 4.26 32 4.26 130 1.12Croatia 43 4.28 53 5.17 9 5.84 69 3.11 41 2.99Cyprus 37 4.38 27 5.58 5 6.40 111 2.44 38 3.09Czech Republic 24 4.67 28 5.51 59 4.85 84 2.89 17 5.41Denmark 28 4.57 2 6.20 72 4.69 77 2.99 26 4.40Dominican Republic 68 3.88 92 4.78 14 5.55 55 3.53 95 1.66Ecuador 62 3.93 98 4.59 117 4.24 19 4.71 71 2.16Egypt 73 3.84 83 4.90 20 5.44 109 2.49 60 2.53El Salvador 123 3.28 75 5.01 84 4.60 127 2.13 117 1.38Estonia 47 4.19 38 5.36 31 5.29 45 3.83 67 2.26Ethiopia 101 3.52 124 3.86 121 4.16 36 4.17 83 1.91Finland 21 4.71 5 6.00 88 4.56 61 3.29 22 5.00France 11 5.13 23 5.64 55 4.87 39 4.06 7 5.98Gambia, The 98 3.55 102 4.51 13 5.58 101 2.62 107 1.48Georgia 92 3.64 51 5.17 37 5.07 115 2.31 76 2.01Germany 9 5.22 21 5.65 68 4.73 29 4.29 4 6.23Ghana 104 3.49 114 4.14 56 4.86 57 3.47 105 1.49Greece 27 4.58 44 5.25 35 5.10 74 3.02 23 4.96Guatemala 48 4.17 85 4.90 40 5.03 20 4.71 74 2.06Guyana 88 3.66 60 5.11 38 5.06 64 3.18 122 1.30Honduras 63 3.92 76 4.99 44 4.99 38 4.07 97 1.63Hong Kong SAR 30 4.55 15 5.74 11 5.64 62 3.25 34 3.55Hungary 59 3.95 77 4.99 115 4.30 103 2.60 31 3.92Iceland 39 4.37 3 6.16 17 5.45 73 3.03 50 2.84India 18 4.74 90 4.82 96 4.51 14 4.89 24 4.73Indonesia 40 4.36 42 5.26 78 4.63 28 4.43 37 3.12Ireland 32 4.45 9 5.88 36 5.10 116 2.30 25 4.51Israel 51 4.16 29 5.50 60 4.84 49 3.73 57 2.58Italy 22 4.71 41 5.28 71 4.69 90 2.79 5 6.08Jamaica 80 3.76 78 4.97 8 6.13 114 2.32 98 1.62Japan 15 4.81 20 5.67 131 3.78 41 3.94 10 5.83Jordan 54 4.05 59 5.13 6 6.39 87 2.84 87 1.85Kazakhstan 121 3.32 74 5.01 112 4.33 106 2.53 116 1.40Kenya 72 3.84 100 4.55 50 4.91 25 4.47 114 1.42Korea, Rep. 26 4.64 19 5.68 114 4.32 91 2.78 13 5.79Kuwait 128 3.16 61 5.11 128 3.97 131 1.97 100 1.58Kyrgyz Republic 105 3.48 94 4.76 28 5.36 107 2.49 121 1.30Latvia 86 3.68 79 4.95 73 4.66 75 3.00 73 2.11
(Cont’d.)
Appendix B: Travel & Tourism Competitiveness Index 2009 detailed rankings (cont’d.)
part1.r2 2/26/09 11:58 AM Page 36
The Travel & Tourism Competitiveness Report 2009 © 2009 World Economic Forum

37
1.1:
The
Tra
vel &
Tou
rism
Com
petit
iven
ess
Inde
x 20
09
Table B4: The Travel & Tourism Competitiveness Index: Human, cultural, and natural resources (cont’d.)
PILLARS
T&T HUMAN, CULTURAL, 11. Human 12. Affinity for 13. Natural 14. CulturalAND NATURAL RESOURCES resources Travel & Tourism resources resources
Country/Economy Rank Score Rank Score Rank Score Rank Score Rank Score
Lesotho 133 2.66 133 3.31 119 4.19 132 1.92 128 1.22Libya 114 3.37 104 4.45 110 4.39 124 2.17 61 2.45Lithuania 89 3.65 66 5.08 74 4.66 108 2.49 62 2.39Luxembourg 42 4.30 26 5.59 12 5.63 67 3.12 46 2.87Macedonia, FYR 87 3.67 70 5.03 69 4.71 92 2.76 70 2.19Madagascar 119 3.32 107 4.38 93 4.53 70 3.09 123 1.30Malawi 107 3.47 117 4.03 80 4.62 46 3.81 115 1.41Malaysia 14 4.86 30 5.50 21 5.43 21 4.62 32 3.89Mali 120 3.32 125 3.83 54 4.87 88 2.82 91 1.75Malta 52 4.15 37 5.37 7 6.22 133 1.84 35 3.16Mauritania 129 3.14 119 3.98 76 4.63 98 2.70 127 1.25Mauritius 69 3.86 45 5.25 3 6.59 130 2.01 99 1.60Mexico 13 4.87 63 5.10 90 4.55 18 4.73 20 5.10Moldova 110 3.43 80 4.93 30 5.30 122 2.19 120 1.32Mongolia 106 3.48 96 4.69 64 4.76 76 3.00 109 1.47Montenegro 35 4.43 40 5.28 1 6.68 80 2.97 51 2.77Morocco 83 3.73 95 4.75 29 5.30 125 2.17 52 2.70Mozambique 125 3.24 130 3.54 95 4.52 56 3.49 113 1.43Namibia 94 3.60 128 3.70 25 5.38 44 3.84 106 1.48Nepal 97 3.57 118 4.02 61 4.79 37 4.09 119 1.36Netherlands 17 4.75 11 5.81 63 4.79 81 2.93 16 5.45New Zealand 25 4.65 17 5.70 24 5.40 27 4.43 39 3.08Nicaragua 93 3.63 91 4.82 86 4.57 53 3.55 101 1.58Nigeria 113 3.38 113 4.22 124 4.10 51 3.61 103 1.57Norway 36 4.42 14 5.78 82 4.61 72 3.05 28 4.24Oman 99 3.54 84 4.90 107 4.41 82 2.91 80 1.96Pakistan 108 3.46 115 4.09 129 3.97 83 2.90 44 2.89Panama 53 4.14 87 4.89 58 4.86 9 5.16 96 1.63Paraguay 122 3.30 97 4.63 130 3.89 66 3.12 102 1.57Peru 33 4.43 71 5.03 85 4.57 8 5.21 42 2.92Philippines 70 3.86 69 5.05 53 4.87 65 3.14 63 2.38Poland 29 4.56 56 5.16 102 4.46 54 3.53 21 5.08Portugal 16 4.78 34 5.40 39 5.05 86 2.85 12 5.81Puerto Rico 84 3.71 35 5.39 41 5.01 96 2.71 92 1.73Qatar 75 3.83 22 5.64 51 4.90 119 2.23 58 2.54Romania 77 3.83 58 5.15 105 4.44 85 2.87 49 2.85Russian Federation 38 4.37 88 4.84 123 4.14 23 4.58 30 3.92Saudi Arabia 90 3.65 50 5.19 118 4.21 47 3.78 112 1.44Senegal 82 3.75 105 4.42 87 4.57 33 4.24 90 1.75Serbia 96 3.57 54 5.17 83 4.60 126 2.14 64 2.36Singapore 23 4.69 1 6.29 10 5.66 94 2.72 29 4.07Slovak Republic 55 4.05 48 5.22 91 4.54 48 3.73 53 2.69Slovenia 61 3.94 36 5.39 70 4.70 79 2.98 54 2.68South Africa 49 4.17 112 4.23 43 5.00 22 4.59 45 2.87Spain 5 5.36 31 5.45 48 4.95 30 4.26 1 6.77Sri Lanka 71 3.85 49 5.22 65 4.76 59 3.41 75 2.01Suriname 79 3.76 99 4.56 103 4.44 43 3.90 72 2.15Sweden 8 5.23 8 5.88 62 4.79 50 3.70 2 6.56Switzerland 2 5.54 4 6.15 34 5.12 15 4.88 6 6.02Syria 100 3.53 93 4.77 32 5.23 128 2.12 78 2.00Taiwan, China 65 3.92 16 5.71 77 4.63 110 2.45 47 2.87Tajikistan 117 3.37 86 4.89 113 4.33 78 2.98 125 1.26Tanzania 50 4.17 122 3.91 33 5.15 3 6.13 108 1.48Thailand 19 4.74 57 5.16 22 5.41 24 4.54 33 3.84Trinidad and Tobago 112 3.38 89 4.84 122 4.14 100 2.63 85 1.91Tunisia 56 3.97 33 5.44 26 5.38 95 2.71 65 2.34Turkey 44 4.28 72 5.02 47 4.96 89 2.82 27 4.32Uganda 81 3.76 116 4.06 79 4.62 11 5.05 124 1.29Ukraine 103 3.50 68 5.07 66 4.74 112 2.40 88 1.79United Arab Emirates 78 3.81 25 5.60 19 5.45 117 2.28 84 1.91United Kingdom 6 5.30 12 5.81 99 4.51 26 4.45 3 6.43United States 1 5.67 7 5.91 106 4.43 1 6.46 9 5.88Uruguay 57 3.96 46 5.24 57 4.86 93 2.76 40 2.99Venezuela 91 3.65 106 4.41 133 3.30 10 5.16 93 1.71Vietnam 76 3.83 82 4.91 81 4.61 52 3.60 68 2.19Zambia 85 3.69 121 3.92 75 4.64 16 4.74 111 1.45Zimbabwe 109 3.43 131 3.45 109 4.40 35 4.20 94 1.70
Appendix B: Travel & Tourism Competitiveness Index 2009 detailed rankings (cont’d.)
part1.r2 2/26/09 11:58 AM Page 37
The Travel & Tourism Competitiveness Report 2009 © 2009 World Economic Forum

part1.r2 2/26/09 11:58 AM Page 38
The Travel & Tourism Competitiveness Report 2009 © 2009 World Economic Forum

CHAPTER 1.2
Endangered Growth: How the Price of Oil ChallengesInternational Travel & TourismGrowthJÜRGEN RINGBECK
AMIT GAUTAM
TIMM PIETSCH
Booz & Company
The year 2009 may go down in history as the year of“make or break” for the Airline and the Travel & Tourism(T&T) sector as a whole.The historically high price ofcrude oil—of US$147 per barrel—in the summer of2008 clearly highlighted the vulnerability of the sectorto mid- and long-term oil prices.An oil price ofUS$100 per barrel was considered ruinous only a fewyears ago; now this has emerged as a realistic scenario towhich all players in the T&T sector have to adapt.Atsuch a high level, the price of oil will become evenmore critical to almost every part of the tourism valuechain.
Although weak global demand, caused by globaleconomic recession, resulted in a steep oil price declineto US$45 per barrel by the fourth quarter of 2008, thiswill not change the mid- to long-term oil forecast.Several economic analysts predict an end to the recessionin the next one to two years.The International EnergyAgency (IEA) estimates that oil prices will recover tomore than US$100 per barrel as soon as the economiesaround the world recover from recession.According tothat agency, strong growth in the emerging economiesof China and India, along with the maturing of severaloil fields, will soon rally the oil price again.
This chapter discusses the dramatic structuralchange a high oil price imposes on airlines, travelers, anddestination countries, all of which will have to navigatethrough times of shifting or even declining traveldemand. In providing a view of endangered T&Teconomies, the chapter also draws attention to potentialways of coping with change.A high oil price scenario isassumed in the long term in order to highlight thechanges such a scenario would mean for consumerbehavior and the competitiveness of several destinations.
US$100 per barrel: A critical challenge for the air travel growth?Since the inception of the air transport (jet-enginebased) industry in the 1950s, passenger traffic has grownsteadily at 7.8 percent per annum (compound annualgrowth rate, CAGR, 1950–2007) driven by rising levelsof disposable income, the opening of international bor-ders, higher consumer awareness about tourism, andsteady economic growth in Europe and North America.This has led to the creation of a global T&T economicsector, one of the first fully integrated economic sectorsin which destination countries compete for incomingtourists on an international basis.
Oil price spikes in the 1970s and early 1980s didnot hinder the growth of international air travel, but itsgrowth has been strongest between 1980 and 2004—aperiod with stable and relatively moderate oil prices.The emergence of the low-cost carrier business modelin the 1990s further fueled air travel growth by captur-ing untapped demand such as weekend leisure travel tocities using mostly secondary airports.
39
1.2:
End
ange
red
Grow
th
part1.r2 2/26/09 11:58 AM Page 39
The Travel & Tourism Competitiveness Report 2009 © 2009 World Economic Forum

However, the “tourism growth party” is now beingspoiled by high oil prices.Although oil prices havedropped drastically from their momentous high in thesummer of 2008, they are still at levels above the histori-cal average. Several key trends—such as the emergenceof China and India as large energy consumers, theongoing geopolitical tensions in the oil exportingregions, and long-term “peak oil” supply-side effects(i.e., saturation and maturing of major oil fields)—willconspire to keep oil prices high in the mid to long term(see Figure 1).Additionally, a potential carbon tax oremission trading scheme penalty on CO2 emissions mayadd a further item to fuel costs. In the European Union,commercial aviation will be included in the EmissionTrading Scheme (ETS) from 2012 onward. Forecastsfrom leading air transport organizations such as Airbus,Boeing, IATA, and ICAO suggest a constant increase ininternational air travel demand broadly in line with pastgrowth.This growth aspiration is challenged both becauseoil price levels are expected to remain high rather thangoing back to earlier lows, and because carbon offsettingcosts are being introduced.
Given various mega trends, it is reasonable to assumea high oil price scenario with prices in the region ofUS$100 per barrel in the medium to long term; thiswill have a structural impact on the T&T sector in theforeseeable future.The scenario analysis is not an exerciseto forecast the actual oil price but rather a framework tounderstand how the T&T sector will respond if the oilprice remains at peak level in the medium to long term.
Oil is assumed to be the main energy source for the aviation sector for the next 30 years.Although second-generation biofuels seem to be on the horizon, the economics as well as the production scalability andinfrastructure requirements for aviation biofuels stillremain a major challenge.
Until recently, the only factors to have affected airtravel growth negatively in the last half century weresingular external shocks such as 9/11, the severe acuterespiratory syndrome (SARS) crisis, or regional geopo-litical conflicts.Airlines have just barely managed, untilnow, to adapt to higher fuel bills without passing addition-al costs to their customers. However, this is changing andthe industry has already seen steep ticket price hikes thatwill have an impact on the travel behavior of consumers.
No more cheap airline tickets: Travel behavior affectedThe obvious impact of a high oil price is an increase inthe operating costs of airlines. Fuel costs were only anaverage 18 percent of airlines’ operating costs between2000 and 2007, according to IATA estimates.1 Withprices of more than US$100 per barrel, as seen during2008, fuel accounts for more than a third of the totaloperating cost for an average airline, thus representingthe single most important cost item in expenditures(Figure 2). Low-cost carriers are even more exposed tofuel prices than their higher-cost counterparts, askerosene expenditures represent more than 50 percentof their total cost base.
40
1.2:
End
ange
red
Grow
th
0
1,000
2,000
3,000
4,000
5,000
6,000
0
20
40
60
80
100
120
140
160
US$100/barrel
1950 1960 1970 1980 1990 2000 2007 2010 2020 2025
Figure 1: Historical development and future outlook for oil price and air passenger transport
Source: ICAO, 2007; BP, 2008; Bloomberg.Note: 2008 oil price value represents average January to end November 2008.
EIA high price caseHistoric PAX (millions)
Oil price (dated Brent, nominal US$)
ICAO outlook (CAGR 2005–2025 = 5.2%)
Airbus outlook (CAGR 2007–2026 = 4.9%
Boeing outlook (CAGR 2007–2026 = 4.9%)
EIA low price case
Pass
enge
rs (m
illio
ns)
US$
/ ba
rrel
High oil pricescenario
part1.r2 2/26/09 11:58 AM Page 40
The Travel & Tourism Competitiveness Report 2009 © 2009 World Economic Forum

Fuel costs as a percentage of airline operating costsvary significantly based on the length of the flight.Thelonger the flight, the higher the fuel costs as a percentageof the airline operating cost (see Figure 3). For example,fuel is 16.5 percent of the operating costs for intraEurope trips (flights of less than 1,500 kilometers) and29.6 percent for North America to Asia-Pacific trips(flights of more than 7,500 kilometers), according toanalysis from ICAO.2 From an airline’s perspective,long-haul flights represent the most critical challenge toprofitable operations because the share of fuel on theseflights, compared with other cost items, is largest.Alreadytoday ultra long haul services—those above 10,000 kilometers per stage length, which were introduced onlya couple of years ago—have been significantly reducedbecause of the unfavorable fuel economics due to fuelcosts even at high-load factors. For instance,ThaiAirways dropped its non-stop Bangkok–US flights inthe summer of 2008 for commercial reasons, becausefuel reached operating cost levels of 55 percent on thisroute—a cost burden that could not be passed on totheir customers.3
Under normal conditions with short-term oil pricehikes, airlines have responded to high oil prices byimproving their operational efficiency and driving downnon-fuel costs. However, given the chronically low margins of 3–5 percent in this industry along with along-term structural shift in oil price, the airlines arenow facing the choice of either passing the costs to theconsumers or suffering more losses.Already, the airline
industry is very much in the red. Net losses are expectedto be US$5.2 billion dollars in 2008 and anticipated tobe US$4.1 billion in 2009.4 So, except for capacityreductions, the only remaining option for the industry is to pass costs on to the customers.
Indeed, ticket prices have become more expensiveduring 2008 as airlines have imposed significant fuel sur-charges on airfares to compensate for higher operatingcosts, especially on long-haul routes. For example, fuelsurcharges per roundtrip to most European countries(except Germany) from the United States increased fromUS$150 in 2007 to US$350 in the summer of 2008,representing an astonishing increase of 133 percent inless than a year.5
The airlines are already resorting to desperate measures to control their costs.The imposition ofcheck-in baggage fees by North American airlines andthe decision by major Indian airlines to charge travelagent commission fees of 5 percent per ticket price tothe consumers are just two examples of how seriouslyairlines are struggling to keep afloat.
Higher ticket prices do not necessarily translate tolower volumes—it depends on the price sensitivity (elasticity) of the passengers. Even the consumer pricesensitivity is not static and changes with new marketconditions.Tourists are more price sensitive now thanever before for several reasons. First, more options fornear-shore or domestic travel are available, especially inthe well-established European or US markets. Forexample, replacing a long-haul trip with several shorter
41
1.2:
End
ange
red
Grow
th
2008F(IATA)
20072006200520042003200220012000
14 141313
16
22
26
29
36
120
110
100
90
80
70
60
50
40
30
20
10
0
40
35
30
25
20
15
10
5
0
Figure 2: Historical and estimated impact of oil prices on airlines
Source: IATA, 2008a.Note: Oil price refers to crude oil price (Brent oil) according to IATA Economic Briefing (September 2008).
Oil
pric
e pe
r bar
rel (
Nom
inal
US$
)
Fuel
cos
t as
perc
ent o
f ope
ratin
g ex
pens
es
Fuel cost as percent of operating expenses
Oil price per barrel
part1.r2 2/26/09 11:58 AM Page 41
The Travel & Tourism Competitiveness Report 2009 © 2009 World Economic Forum

“local” trips has been a common way for many con-sumers to adapt to changing market conditions.As anexample, domestic travel is already today by far the largestsegment in the German travel market. Second, increasedcompetition among tour operators, online travel agencies,and destination countries has driven down prices andcreated a “value-for-money” mindset among travelersinstead of seeing tourism as a pure luxury. Finally, eco-nomic uncertainties and recession have an impact onindividuals’ travel budgets. In tough economic situations,the first things consumers cut back on are nonessentialluxury items such as exclusive holiday trips. Past growththat has been fueled by the emerging low-cost segmentalso drops away as airline tickets rise. For example, onhighly competitive transatlantic routes, a price increaseof 10 percent would imply a reduction in air traveldemand by 17 percent (see Figure 4).
Given the evidence that airlines will increase ticketfares to reflect the new cost structure, it is crucial tounderstand the marginal effect of this increase on theconsumer’s travel budget. In order to appreciate the mag-nitude of the effect, a typical vacation package, includinga long-haul air trip from Frankfurt to Miami, is analyzed.Two cost scenarios are created: a base scenario with oil
prices of US$40 per barrel and a high oil scenario withprices of US$100 per barrel (Figure 5).
In the base scenario, air travel represents only a 17percent share of the total travel budget. However, airtravel costs increase to 24 percent of the total under thehigh oil scenario, assuming additional fuel costs are fullypassed on to the consumer.This implies an overallincrease of 20 percent in the total travel budget. Price-sensitive leisure consumers on the transatlantic routewill surely cut back on their travel if faced with such asteep price rise. Lower passenger yield, in turn, increasesthe operating cost per passenger, building cost pressureon the airlines. Higher energy costs also raise the oper-ating cost across other elements of the tourism valuechain (hotels, resorts, rental cars), although the effectthere is marginal.
Because of the significant effect of a high oil priceon air travel costs and the total travel budget, consumersare likely to cut back on expensive long-haul holidaydestinations and decide for a near-shore destination during their well-deserved holiday season. In the UnitedStates, domestic travel spending accounts for more than80 percent of total tourism expenditures, according tothe Travel Industry Association of America,6 while
42
1.2:
End
ange
red
Grow
th
0 500 1000 1500 2000 2500 3000 3500 4000 4500 5000 5500 6000 6500 7000 7500 8000
0
10
20
30
40
50
60
US$100/barrelscenario
US$54/barrel:Past oil price
situation (2005)
R2 = 0.5869
R2 = 0.5869
Figure 3: Average stage length vs. fuel cost relative to operating costs
Source: ICAO, 2008; Booz & Company analysis.
North America–Carribbean North America–Latin America Intra Latin America Intra Europe Europe–Middle East
Europe/Middle East–Africa North America–Europe/Middle East Carribbean–Europe/Middle East Latin America–Europe/Middle East Intra Asia–Pacific and Oceania
Europe/Middle East–Asia-Pacific North America/Americas–Asia-Pacific North America/Americas–Oceania
Average stage length (km)
Fuel
as
perc
ent o
f ope
ratin
g ex
pens
es
part1.r2 2/26/09 11:58 AM Page 42
The Travel & Tourism Competitiveness Report 2009 © 2009 World Economic Forum

43
1.2:
End
ange
red
Grow
th
100
P + 0% P + 10%
Europe-Asia –1.3
Transpacific –0.8
Transatlantic –1.7
92
87
83
Figure 4: Estimated price elasticity of passenger demand at route/market level
Source: Pearce, 2008.
Price
Dem
and
(per
cent
)
+20%
At US$100/barrel
5,563 142 556
176
24%
50%
Other costincrease
Rental carincrease
Accomodationcost increase
Ticket price increase
13%
At US$40/barrel
4,646
15%
12%
57%
17%
42
13%
Figure 5: Estimated price increase of a typical long-haul travel package
Source: Booz & Company analysis.Note: Price refers to the cost per person of a two-week trip from Germany to Miami in March, 2009 (if booked in October, 2008). Exchange rate: €1 = US$1.504.
Assumption: oil price increases are passed on to consumers.
■ Flight tickets
■ Accommodation (3 stars)
■ Rental car (with fuel)
■ Other cost
part1.r2 2/26/09 11:58 AM Page 43
The Travel & Tourism Competitiveness Report 2009 © 2009 World Economic Forum

travelers tend to make more, shorter trips to nearby destinations. In Europe, short-haul travel to near-shorecountries, such as Croatia, plays an ever-increasing role.
Another crucial impact of high oil price is the sub-stitution effect it has on transportation choice. In largetourism destinations such as Western Europe,Australia,or India, rail tourism begins to develop, moving from aniche segment for enthusiasts to a viable transport alter-native to short-haul flights.
Winners and losers of changing travel patternsThe vast majority of international tourism traffic origi-nates in the key source markets of North America andWestern Europe.Travelers from these source marketstravel to near-shore as well as distant destinations.As dis-cussed earlier, long-haul travelers may face a steep priceincrease in airline ticket price, resulting in an increase ofas much as 15 to 20 percent in their overall travel costs.The effect of such an increase on long-haul destinationswould be a critical structural change of tourism flows.
More importantly, the effect would be acute for destina-tions that have a large percentage of their inboundtourism arriving by long-haul air travel.
Geographical exclusivity may turn from an important value proposition into a liability that will cutfar-off destination countries from major source markets.Naturally, this will affect small island states such as theDominican Republic, Puerto Rico, the Maldives,Seychelles, and Mauritius, but it will also affect inlanddestinations such as Morocco or Egypt that are servedby medium- to long-haul flights from their key sourcemarkets (see Figure 6).
Simultaneously, destinations with key source mar-kets in their backyards will benefit from the potential“re-regionalization” of global tourism flows. Emergingtourism destinations such as Montenegro, Croatia, orCambodia have profited from their geographic proximityto major source markets that are within the reach ofland-based transport to facilitate access of tourists. Severalof these “local” destinations have actively promotedthemselves as high-class alternatives to established
44
1.2:
End
ange
red
Grow
th
0 20 40 60 80 100
South Africa
Bahrain
Hungary
Netherlands
Poland
Hong Kong SAR
Greece
Vietnam
Thailand
Portugal
Turkey
Indonesia
Singapore
Bulgaria
Brazil
United Arab Emirates
Czech Republic
Morocco
Egypt
Puerto Rico
Dominican Republic
51
50
50
49
47
47
43
40
40
38
37
32
30
30
25
24
22
22
15
14
5
3
49
50
50
51
53
53
57
60
60
62
63
68
70
70
75
76
78
85
78
86
95
97
Tunisia
Figure 6: Countries most dependent on long-haul inbound air traffic (percent)
Source: IATA, 2008c: UNWTO, 2008; Booz & Company analysis.Note: Short haul is defined as < 1,000 kilometers; medium haul is 1,000–3,000 kilometers; long haul is > 3,000 kilometers.
■ Medium- and long-haul inbound
■ Short-haul inbound
Percent of inbound air traffic
part1.r2 2/26/09 11:58 AM Page 44
The Travel & Tourism Competitiveness Report 2009 © 2009 World Economic Forum

destination countries. In addition, the long-haulinbound traffic to classic destinations such as Spain,Switzerland, or the United States accounts for less than30 percent of all inbound air traffic.
The worst-affected destinations in the high oil scenario are those that not only depend heavily onlong-haul air travel for inbound tourism flow, but thatalso have a greater dependency on the T&T sector fortheir economic growth (see Figure 7).These nations,such as Aruba, Cape Verde, and the Maldives, can bebroadly defined as critical economies, and the internationalcommunity must pay special attention to proactivelysupporting these economies during the upcoming chal-lenging times.
How can nations manage the change proactively?The affected destination countries have several strategicoptions to prepare for the potential decline of traveldemand, or even develop new opportunities for growth,in a high oil price world. Each nation should carefullystudy its own situation and external factors beforedeciding on a future course of action.The options are:
1. Transform cost structure of destinationspecific operations (hotels, resorts, touroperators, restaurants). The critical destina-tion countries need to take a more proactive,and leading role in high oil price scenarios.
These nations should engage the key destinationoperators in the T&T value chain—hotels,resorts, restaurants, theme parks—to structurallytransform their operating costs.Their governmentsshould systematically analyze key cost levers—the energy efficiency of buildings, hotel opera-tions, the sourcing of consumables, infrastructure,and technology use—to lower the destinationcosts for the travelers so as to compensate forthe high air travel costs.Thus, the increase of anairline ticket could be compensated for by othertourist expenditures to some extent. Focusingon energy-efficient operations and using “green”technologies may cushion these destinationsfrom the worst effects of a high oil price scenario.Some innovative ways to reduce costs could bejoint sourcing of consumables by various hotelchains, local sourcing of foods and beverages,and greater use of information and communica-tion technologies (ICT) to improve operationalefficiency.
2. Reduce destination access cost. Besidestransforming destination-related costs, the criti-cal economies also need to address the “access”cost of the destinations.This implies removingrestrictions to allow major international airlinesto fly to destinations, considering internationalalliances of the local carrier with international
45
1.2:
End
ange
red
Grow
th
0 10 20 40 6030 50 70 80 90 1000
2
4
6
8
10
12
14
16
18
34
Jordan
Malta
Barbados
Belize Fiji
Cape Verde
St. Lucia
Antigua and Barbuda
Vanuatu
Maldives
Aruba
Mauritius
Morocco
Tunisia Egypt
Syria Lebanon
United Arab Emirates Portugal Thailand
Greece
Cyprus
Macao SAR
Bahamas
Montenegro
Jamaica Cayman Islands
Spain
Grenada
Croatia
Cambodia
New Zealand Switzerland Dominican Republic 5% of GDP
Critical T&T Economies
Figure 7: Long- and medium-haul inbound air travel dependency vs. economic importance of the T&T sector, 2008
Source: IATA, 2008c; WTTC, Booz & Company analysis.Note: Share of all inbound air transport passengers in 2008 on medium- and long-haul connections, including domestic traffic, is based on IATA data.
Short haul is defined as < 1,000 kilometers; medium haul is 1,000–3,000 kilometers; long haul is > 3,000 kilometers.
Long-haul inbound share
T&T
as p
erce
nt o
f GD
P
part1.r2 2/26/09 11:58 AM Page 45
The Travel & Tourism Competitiveness Report 2009 © 2009 World Economic Forum

carriers to provide better customer service, andencouraging the use of more fuel-efficientplanes and operational improvements of thelocal carrier. Several of these destinationsdepend on international airlines for access,especially for touristic traffic.
3. Target premium customers (re-positioningof location as sustainable high-end destination). In a difficult economic situation,price-sensitive customers are the first to cuttheir travel budgets.An important strategy tocushion against increasing travel costs is to re-brand and upgrade the destinations to high-quality vacation spots and target more premiumcustomers. It may be beneficial for certain desti-nations to cater to high-yield customers withrelatively low price sensitivity rather than themass market. In addition, the destination shouldproactively monitor changing consumer prefer-ences and trends to tailor their destinations tothe new needs. For example, increasing numbersof consumers are looking for greener ways oftraveling or ecotourism, underpinning their con-cern for sustainability of resources. Destinationswill need to “upgrade” their infrastructure andoperations before authentically re-positioningthemselves as luxury and sustainable destinations.
4. Engage the international community toseek mitigation and adaptation fundingfor major infrastructure projects. Most ofthe critical destinations are small island states or least-developed countries and will be mostvulnerable to the effects of changing or evendeclining travel demand.These nations shouldaim to leverage development funds provided byinstitutions such as the World Bank or theOrganisation for Economic Co-operation andDevelopment (OECD) to support the develop-ment of their respective tourism sectors. Goingforward, it will become increasingly importantto adhere to environmental sustainability criteriawhen asking for support from the internationalcommunity.Thus, demonstrating a clear strategyintended to balance ecological sustainabilitywith tourism development will be key for countries to gain access to development funds.
Destination countries should proactively engage withthe international community to secure adaptation andmitigation climate funding for infrastructure projects.This will require identifying adaptation and mitigationprojects, developing political consensus around them,and showcasing them to international organizations tosecure funding. In order to address both issues adequately,
infrastructure projects will have to be sustainable (e.g.,fulfilling future CO2 emission requirements) as well ascater to the needs of a changed demand structure.
ConclusionDespite the recent economic downturn and a significantdrop in oil prices, oil market fundamentals suggest amid- to long-term oil price of US$100 per barrel ormore, which will impose a fundamental structural changeon the T&T sector—especially the airline industry.Already struggling with eroded profit margins, airlinesclearly need to pass oil price increases on to their cus-tomers in order to stay in business. Increased “access”costs endanger destinations that are costly to reach andthat largely depend on Travel & Tourism as a key sectorin their economies.
In these markets, policymakers face severe challengesin using Travel & Tourism as a lever to improve generaleconomic well-being.Although each country has toaddress its challenges individually, some overarchingways to cope in a world of fundamental change havebeen laid out in this chapter.Among them are improv-ing operational efficiency of facilities and infrastructurewithin the country, reducing access costs, rebranding andrepositioning the destination, and leveraging fundingfrom the international community to prepare for change.
Notes1 IATA 2008a.
2 ICAO 2008.
3 Bangkok Post 2008.
4 IATA 2008a.
5 Bestfares.com 2008.
6 TIA 2004.
ReferencesAirbus. 2008. “Global Market Forecast 2007–2026.” Toulouse, February.
Bangkok Post. 2008. “THAI Ends Hong-Haul Flights.” July 7. Availableat http://www.bangkokpost.com/070708_Business/07Jul2008_biz38.php.
Bestfares.com. 2008. “International Fuel Surcharge Chart.” August.Available at http://www.bestfares.com/news-newsID643-International_Fuel_Surcharge_Chart.html, accessed November2008.
Boeing. 2008. “Current Market Outlook 2008–2027: The Transformationof Air Transport.” July. Available at http://www.boeing.com/commercial/cmo/index.html.
BP (British Petroleum). 2008. Statistical Review of World Energy 2008.June, London. Available at http://www.bp.com/productlanding.do?categoryId=6929&contentId=7044622.
EIA (Energy Information Administration). International Energy Outlook2008. June. Report #:DOE/EIA-0484(2008). Washington, DC:Energy Information Administration. Available at http://www.eia.doe.gov/oiaf/ieo/.
46
1.2:
End
ange
red
Grow
th
part1.r2 2/26/09 11:58 AM Page 46
The Travel & Tourism Competitiveness Report 2009 © 2009 World Economic Forum

IATA (International Air Transport Association). 2008a. “EconomicBriefing: Financial Forecast. Significant Losses Continue into2009.” September 2008. Geneva: International Air TransportAssociation. Available at http://www.iata.org/NR/rdonlyres/25AF6DD6-A677-4C7F-86FB-7ECE56DA702C/0/IATAEconomicBriefingFinancialForecastAugust08.pdf
———. 2008b. “Outlook for the Airline Industry: 2008Q3 Update.”September. Geneva: International Air Transport Association.
———. 2008c. Passenger Forecast 2008–2012. October. Geneva:International Air Transport Association.
ICAO (International Civil Aviation Organization). 2007, Montreal,“Outlook for Air Transport to the Year 2025.” October. Montreal:International Civil Aviation Organization.
———. 2008. ICAOData Database. Montreal: International Civil AviationOrganization. Accessed October.
Pearce, B. 2008. “What Is Driving Travel Demand? Managing Travel’sClimate Impact.” In The Travel & Tourism Competitiveness Report2008: Balancing Economic Development and EnvironmentalSustainability. Geneva: World Economic Forum. 83–90.
TIA (Travel Industry Association of America). 2004. Economic Research:Economic Impact of Travel and Tourism, December 2004.Available at http://www.tia.org/Travel/econimpact.asp.
UNWTO (World Tourism Organization). 2008. UNWTO World TourismBarometer. June. Available at http://www.unwto.org/facts/eng/barometer.htm.
WTTC (World Travel & Tourism Council). 2008. Tourism SatelliteAccounting Tool. Available at http://www.wttc.org/eng/Tourism_Research/Tourism_Satellite_Accounting_Tool/. Accessed October 2008.
47
1.2:
End
ange
red
Grow
th
part1.r2 2/26/09 11:58 AM Page 47
The Travel & Tourism Competitiveness Report 2009 © 2009 World Economic Forum

part1.r2 2/26/09 11:58 AM Page 48
The Travel & Tourism Competitiveness Report 2009 © 2009 World Economic Forum

CHAPTER 1.3
The Importance of Public-Private Partnership in theCurrent DownturnAMIR GIRGIS
UFI IBRAHIM
World Travel & Tourism Council (WTTC)
Following the spread of the US credit crunch to manykey tourism source markets around the world in 2008,not to mention the turmoil in financial markets and thevolatility in commodity prices and exchange rates, theoutlook for the world economy has become very uncer-tain.The crucial question is no longer whether there willbe a recession, but how widespread, how deep, and howprolonged it will be.And the answer will clearly have asignificant impact on Travel & Tourism demand.
Over the last 25 years, international tourist arrivalshave tended to grow about one percentage point fasterthan world real GDP. However, they have also tended tofluctuate more than GDP, with higher peaks in the“good” years and deeper troughs in the “bad” years.Arrivals may well, therefore, have increased by less thanthe 2 percent forecast by the World Tourism Organization(UNWTO) in 2008, especially since economic growthis currently concentrated in emerging and developingcountries with relatively low propensities to travel.Asfor 2009, it is almost anybody’s guess at the moment.
Sailing in uncharted watersToday’s Travel & Tourism industry is sailing in unchartedwaters. It has no experience of financial systems on thebrink of collapse, nor of currencies (and assets and inputsnecessary to the industry) fluctuating in value by 25percent over the course of a few days. On the other hand,the boom in tourism, based on low-cost travel, global-ization, higher disposable incomes in emerging markets,and higher propensities to travel in developed markets,has been very resilient in the past. Under these circum-stances, forecasts can be only very tentative, especiallyregarding the depth and length of the current downturn.
A number of powerful factors have been affecting,and will continue to affect, world tourism—not leastinternational oil prices (which have fallen back fromtheir historic peaks since July 2008 to little more thanUS$40 in January 2009) and relative exchange rates(which have seen massive changes in the past fewmonths).
According to WTTC’s latest research—conductedin association with its partner, Oxford Economics—thedeterioration in the macroeconomic environment andthe marked slowdown in the monthly indicators oftourism activity in the last months of 2008 resulted in amuch more pronounced cycle in Travel & Tourismeconomy GDP than envisaged in January 2008, asshown in Figure 1.
The relatively resilient first-half 2008 performance,plus the lead time between holiday bookings and actualvacations, meant that the impact on growth in 2008 waslimited, but provisional estimates point to an increase ofjust 1 percent in Travel & Tourism economy GDP lastyear—two percentage points below WTTC’s January2008 forecast.
49
1.3:
The
Impo
rtan
ce o
f Pu
blic
-Priv
ate
Part
ners
hip
in t
he C
urre
nt D
ownt
urn
part1.r2 2/26/09 11:58 AM Page 49
The Travel & Tourism Competitiveness Report 2009 © 2009 World Economic Forum

WTTC’s research suggests that the impact on Travel& Tourism will nevertheless be much greater in 2009. Infact,Travel & Tourism economy GDP is now expectedto contract this year, by around 3.5 percent—a muchweaker performance than initially expected. Moreover,even this forecast—like macroeconomic prospects generally—carries downside risks if the economicdownturn and intensified credit crunch extend throughthe whole of 2009.
Helping to ensure a rapid recoveryHowever,WTTC remains confident in the long-termprospects of the Travel & Tourism industry, thanks to thecontinued rapid expansion of emerging destinationsalong with the global increase in per capita income andthe rising propensity for foreign travel.
Although there are many uncertainties as to howlong the current crisis will continue, and how deep itsimpact will be on disposable incomes as well as businessand consumer confidence in different markets, pastexperience has shown that Travel & Tourism alwaysrebounds from cyclical downturns—sometimes evenstronger than before. Moreover, although severe, this cri-sis cannot be compared with past crises due to eventssuch as 9/11, SARS, or even the Gulf War.Today, peoplestill want to travel and, once the economic recoverystarts, there is likely to be huge pent-up demand.
In the meantime, the industry is by no means at astandstill as some would lead us to believe.Today’s leaders
of Travel & Tourism have been confronted by manychallenging periods in the past, and they are used tomaking the most of downturns to plan for the future. Itwill take some time to re-establish the balance betweensupply and demand, and it is going to be a very differentworld out there when we do see the end of the currentcrisis. But there is no doubt that it will come and thatthe long-term future of Travel & Tourism will be assured.
However, in order to address the challenges aseffectively as possible, and to try to find solutions, it ismore critical than ever for the public and private sectorsto work together.This is one major reason why WTTCis taking its annual Global Travel & Tourism Summit toSanta Catarina in Brazil this year.As one of the largeemerging-market BRIC countries, Brazil has hugepotential for development, and it is clear that there isgrowing interest from foreign private investors in Brazil’stourism industry.
But, most importantly, public-private dialogue andpartnership can help to encourage a supportive policyframework for Travel & Tourism generally, in turn helping to stimulate demand at challenging times suchas the one we are now facing, thereby ensuring thatTravel & Tourism continues to generate employmentand stimulate economic growth, as well as contributingto the alleviation of poverty in emerging economies.Encouraging such public-private dialogue is one of thekey goals of the present Report.
50
1.3:
The
Impo
rtan
ce o
f Pu
blic
-Priv
ate
Part
ners
hip
in t
he C
urre
nt D
ownt
urn
– 4
– 3
– 2
– 1
0
1
2
3
4
5
6
2009: –3.5%
2010: 1%
2011: 4.5%
1999 2003 2007 20112001 2005 2009 20132000 2004 2008 20122002 2006 2010 2014
Jan 2008 forecastAug 2008 forecastNov 2008 forecastPreliminary Jan 2009 forecast
Figure 1: World Travel & Tourism economy (percent change)
Source: WTTC and Oxford Economics.
Perc
ent
part1.r2 2/26/09 11:58 AM Page 50
The Travel & Tourism Competitiveness Report 2009 © 2009 World Economic Forum

The rationale for public-private partnershipAlthough the level and success of public-private part-nerships (PPPs) in different countries varies sharply,their role and importance in Travel & Tourism hasincreasingly been recognized by industry and govern-ments.To a large degree, this is due to the changingroles and responsibilities of the different sectors: govern-ments, business, and society in general.To quote theWorld Bank speaking a few years ago about its BusinessPartners for Development initiative:
With the advent of globalisation, the reduction in thecost of telecommunications, expansion of marketeconomies throughout the world, and the enduranceof democracy, the roles of the three sectors havebecome increasingly interdependent.
“We have moved from a world where the statehad sole responsibility for the public good and busi-ness maximised profits independent of the interestsof society at large, to a world where successdepends on the close synergy of interests amongbusiness, (civil) society and government.1
Today, most companies accept that their long-terminvestment goals can be achieved only within stable socialand financial environments.They are therefore supportinga range of activities—that is, in the area of communitydevelopment, environmental protection and enhance-ment, and culture and heritage preservation.While nottheir core businesses, the success of these activities isessential to the success of their overall business.
Society’s role and influence are also expanding.Local communities have a growing influence on thebehavior of governments, businesses, and individuals.Aspointed out by the World Bank, society is playing anincreasingly key role in assessing the business communi-ty’s contribution to community development and well-being, rewarding community-friendly behavior and criticizing the opposite.
The public sector, meanwhile, has had to reinventitself. It is withdrawing from the production of goodsand the provision of services, and is taking a morestrategic approach to its role in society. Government’srole is increasingly to foster the trust that creates socialcapital and mobilizes social forces and energy from all itsstakeholders.
Travel & Tourism has not been immune to thischange in stakeholders’ roles and responsibilities, whichis affecting all sectors of the economy. Governmentshave traditionally played a key role in the developmentof tourism and in the promotion of their countries astourism destinations.Their role is clearly more impor-tant in developing countries, or in countries in whichtourism is in a transition stage—where its support canbe crucial to kick-starting growth.
In countries at high levels of economic development,there is arguably less need for public-sector support ofthe tourism industry. Nevertheless, it is generally recog-
nized that, for tourism to develop in a sustainable man-ner, an appropriate physical, regulatory, fiscal, and socialframework is required—something that can, of course,be provided only by governments or public-sector localauthorities.These entities also usually provide the basicphysical infrastructure necessary for tourism—such asroads, airports, and communications—and create thelegal framework within which the industry operates.
This helps to explain why few national governmentsor central administrations have any serious doubts as tothe rationale for their continued involvement in tourismgenerally, although there have been increasing signs ofstates’ disengagement from tourism over the last decade.
Different forms of PPPsIn order to gain a better understanding of current trendsand to identify different forms of PPPs, the UNWTOcommissioned a study on the subject in 2000.Thisincluded a survey that was widely distributed to repre-sentatives of both the public and private sectors.A totalof 234 completed questionnaires were received fromrespondents in over 90 countries worldwide.2
A breakdown of the completed questionnairesreceived showed that they came from the followingTravel & Tourism segments: ministries of tourism (14percent), national tourism organizations (20.9 percent),state tourism offices (6.8 percent), educators (20.9 per-cent), consultants (9.8 percent), international organiza-tions (9.8 percent), transport companies (3.8 percent),hoteliers (5.6 percent), and tour operators (8.1 percent)—in other words, a good balance in terms of sector anddemographic split.An overwhelming 98 percent ofrespondents rated PPPs as “very important” or “impor-tant” in enhancing tourism industry competitiveness.
According to the respondents, the most criticalareas for PPPs within the Travel & Tourism industry areimproving destination image and preserving cultural andheritage resources.Also high up the ranking are educa-tion and training, safety and security, and environmentalprotection.These variables, considered influential byeffective PPPs, are included in the Travel & TourismCompetitiveness Index (TTCI) described in Chapter1.1 of this volume.
Public-private partnership helps ensure a supportiveframework in challenging timesExperience has shown that, when times have beentough,Travel & Tourism has often been seen as a cashcow by governments to help fill their treasuries’ emptycoffers. Policymakers need to be wary about placingextra burdens on this dynamic sector, particularly atsuch crucial periods.
As an example, the UK government’s decision in2008 to increase the air passenger duty (APD) from UKairports shows that it continues to underestimate the
51
1.3:
The
Impo
rtan
ce o
f Pu
blic
-Priv
ate
Part
ners
hip
in t
he C
urre
nt D
ownt
urn
part1.r2 2/26/09 11:58 AM Page 51
The Travel & Tourism Competitiveness Report 2009 © 2009 World Economic Forum
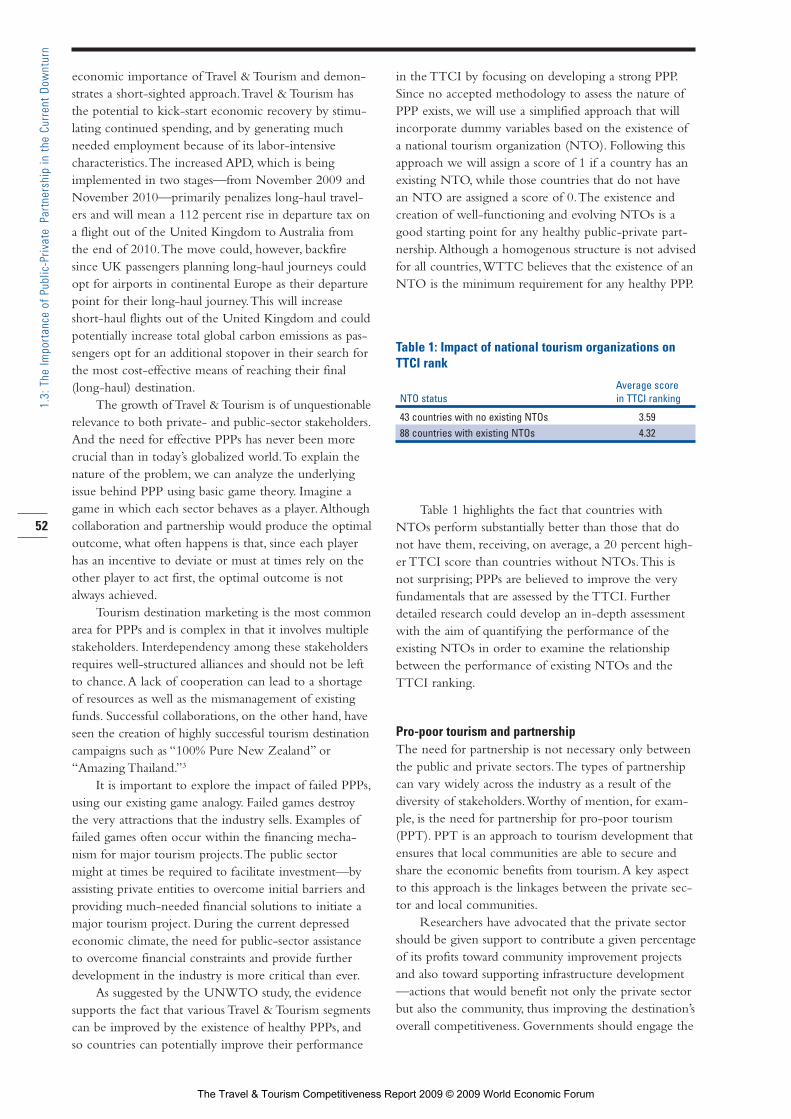
economic importance of Travel & Tourism and demon-strates a short-sighted approach.Travel & Tourism hasthe potential to kick-start economic recovery by stimu-lating continued spending, and by generating muchneeded employment because of its labor-intensive characteristics.The increased APD, which is beingimplemented in two stages—from November 2009 andNovember 2010—primarily penalizes long-haul travel-ers and will mean a 112 percent rise in departure tax ona flight out of the United Kingdom to Australia fromthe end of 2010.The move could, however, backfiresince UK passengers planning long-haul journeys couldopt for airports in continental Europe as their departurepoint for their long-haul journey.This will increaseshort-haul flights out of the United Kingdom and couldpotentially increase total global carbon emissions as pas-sengers opt for an additional stopover in their search forthe most cost-effective means of reaching their final(long-haul) destination.
The growth of Travel & Tourism is of unquestionablerelevance to both private- and public-sector stakeholders.And the need for effective PPPs has never been morecrucial than in today’s globalized world.To explain thenature of the problem, we can analyze the underlyingissue behind PPP using basic game theory. Imagine agame in which each sector behaves as a player.Althoughcollaboration and partnership would produce the optimaloutcome, what often happens is that, since each playerhas an incentive to deviate or must at times rely on theother player to act first, the optimal outcome is notalways achieved.
Tourism destination marketing is the most commonarea for PPPs and is complex in that it involves multiplestakeholders. Interdependency among these stakeholdersrequires well-structured alliances and should not be leftto chance.A lack of cooperation can lead to a shortageof resources as well as the mismanagement of existingfunds. Successful collaborations, on the other hand, haveseen the creation of highly successful tourism destinationcampaigns such as “100% Pure New Zealand” or“Amazing Thailand.”3
It is important to explore the impact of failed PPPs,using our existing game analogy. Failed games destroythe very attractions that the industry sells. Examples offailed games often occur within the financing mecha-nism for major tourism projects.The public sectormight at times be required to facilitate investment—byassisting private entities to overcome initial barriers andproviding much-needed financial solutions to initiate amajor tourism project. During the current depressedeconomic climate, the need for public-sector assistanceto overcome financial constraints and provide furtherdevelopment in the industry is more critical than ever.
As suggested by the UNWTO study, the evidencesupports the fact that various Travel & Tourism segmentscan be improved by the existence of healthy PPPs, andso countries can potentially improve their performance
in the TTCI by focusing on developing a strong PPP.Since no accepted methodology to assess the nature ofPPP exists, we will use a simplified approach that willincorporate dummy variables based on the existence ofa national tourism organization (NTO). Following thisapproach we will assign a score of 1 if a country has anexisting NTO, while those countries that do not havean NTO are assigned a score of 0.The existence andcreation of well-functioning and evolving NTOs is agood starting point for any healthy public-private part-nership.Although a homogenous structure is not advisedfor all countries,WTTC believes that the existence of anNTO is the minimum requirement for any healthy PPP.
Table 1: Impact of national tourism organizations onTTCI rank
Average scoreNTO status in TTCI ranking
43 countries with no existing NTOs 3.5988 countries with existing NTOs 4.32
Table 1 highlights the fact that countries withNTOs perform substantially better than those that donot have them, receiving, on average, a 20 percent high-er TTCI score than countries without NTOs.This isnot surprising; PPPs are believed to improve the veryfundamentals that are assessed by the TTCI. Furtherdetailed research could develop an in-depth assessmentwith the aim of quantifying the performance of theexisting NTOs in order to examine the relationshipbetween the performance of existing NTOs and theTTCI ranking.
Pro-poor tourism and partnershipThe need for partnership is not necessary only betweenthe public and private sectors.The types of partnershipcan vary widely across the industry as a result of thediversity of stakeholders.Worthy of mention, for exam-ple, is the need for partnership for pro-poor tourism(PPT). PPT is an approach to tourism development thatensures that local communities are able to secure andshare the economic benefits from tourism.A key aspectto this approach is the linkages between the private sec-tor and local communities.
Researchers have advocated that the private sectorshould be given support to contribute a given percentageof its profits toward community improvement projectsand also toward supporting infrastructure development—actions that would benefit not only the private sectorbut also the community, thus improving the destination’soverall competitiveness. Governments should engage the
52
1.3:
The
Impo
rtan
ce o
f Pu
blic
-Priv
ate
Part
ners
hip
in t
he C
urre
nt D
ownt
urn
part1.r2 2/26/09 11:58 AM Page 52
The Travel & Tourism Competitiveness Report 2009 © 2009 World Economic Forum

private sector to do this through schemes such as build-operate-transfer (BOT) and foreign direct investment.
Foreign enterprises operating in local communitiesshould also play a critical role in the development ofPPT because their objectives and behavior have implica-tions for the economic development of their destination.These enterprises should ensure that their investments,employment, operating, and other business decisionstake full account of the long-term development andeconomic sustainability of the destinations in whichthey operate.
ConclusionsThe importance of involving public and private stake-holders and creating a platform for dialogue is undoubt-edly receiving growing recognition.The purpose of thischapter is not to showcase successful partnerships butrather to highlight the essential need for partnershipacross the globe and the multiple benefits associatedwith healthy public-private partnerships—somethingthat will be especially relevant as we address the chal-lenges ahead.
Partnership and dialogue can lead to an improvedtourism product, promoting increased competitiveness.And our findings illustrate that the existence of anNTO is a stepping-stone in the right direction forimproving public-private partnership.
WTTC will continue to play its part by buildingawareness of the industry and by consistently advocatingthe need for partnerships throughout the industry.
Notes1 Quoted by the World Tourism Organization Business Council
report on Public-Private Sector Co-operation in Tourism. SeeUNWTO 2001.
2 UNWTO 2001.
3 Indeed, in the indicator measuring the effectiveness of marketingand branding campaigns, New Zealand is ranked 7th and Thailand14th out of 133 countries. The results for all countries are shownin Table 5.03 of section 2.2 of this Report.
ReferencesUNWTO (United Nations World Tourism Organization). 2001. Public-
Private Sector Cooperation: Enhancing Tourism Competitiveness.Madrid: UNWTO.
53
1.3:
The
Impo
rtan
ce o
f Pu
blic
-Priv
ate
Part
ners
hip
in t
he C
urre
nt D
ownt
urn
part1.r2 2/26/09 11:58 AM Page 53
The Travel & Tourism Competitiveness Report 2009 © 2009 World Economic Forum

part1.r2 2/26/09 11:58 AM Page 54
The Travel & Tourism Competitiveness Report 2009 © 2009 World Economic Forum

CHAPTER 1.4
How Well Does the Travel &Tourism Competitiveness IndexExplain Differences in TravelIntensity Among Countries?SELIM ACH
BRIAN PEARCE
International Air Transport Association (IATA)
The Travel & Tourism (T&T) industry is a significantcontributor to the development of many sectors of theeconomy.According to the UNWTO,1 all countries’receipts for international tourism arrivals were estimatedto be around US$856 billion in 2007, and in the sameperiod international tourists’ arrivals were about 903million, up 6.6 percent compared with 2006.
Scope of the researchResearch by IATA has shown the importance of high-quality international air connections in underpinninginward investment and business productivity.2 The year2008 saw weak growth in the T&T industry, the resultof the uncertainties posed by the global economy affect-ing consumers’ confidence and constraining their dis-posable income.Tourist numbers are likely to be fallingin 2009 because of widespread recession in many majoreconomies. From a long-term perspective, however,once recession is past, total tourists arrivals are stillexpected to grow robustly. By 2010, internationalarrivals are expected to reach 1 billion, and 1.6 billionby 2020.The Asia Pacific region,Africa, and the MiddleEast are expected to grow at rates of over 5 percent peryear, above the world average of 4 percent. Europe andthe Americas are forecast to slow down, growing at alower rate, below the world average. Europe will main-tain the highest share of world arrivals, but will declinefrom 60 percent in 1995 to 46 percent in 2020.
This chapter reports on a study of the relationshipbetween the number of passengers to/from a givencountry and the Travel & Tourism CompetitivenessIndex (TTCI) score.The objective is to understand how well the TTCI indicates the key drivers ofTravel & Tourism, and therefore how well it indicatesthe contribution of the sector to the economic successof a country.
The TTCI score, which is composed of three dif-ferent subindexes, captures the ease of developing theT&T sector of a given country based on characteristicsof its business environment and infrastructure and itsregulatory framework as well as its human, cultural, andnatural resources. In addition to the factors covered bythe TTCI, travel is driven by incomes and factors suchas distance or travel costs. Based on an analysis of thedata and the theoretical relationships among the factors,an econometric model was developed to assess theserelationships.3 This model is used in the last section ofthe chapter to provide an initial quantification of thelink between the number of passengers and improving acountry’s TTCI score by improving its performance onkey travel drivers such as infrastructure, taxation, andregulations.
55
1.4:
Diff
eren
ces
in T
rave
l Int
ensi
ty A
mon
g Co
untr
ies
part1.r2 2/26/09 11:58 AM Page 55
The Travel & Tourism Competitiveness Report 2009 © 2009 World Economic Forum

What are the drivers of the air passenger travel?This research is motivated by the need to provide somequantification of the observation that the total numberof air passengers arriving at and leaving a country islinked to the ‘’attractiveness” of the country—that is, tothe value of the TTCI score, as well as to factors such asincomes and travel distance.
Figure 1 confirms that highly ranked countries arelikely to attract a higher number of air passengers thanothers. During the 2008 exercise, the average TTCIscore recorded for all the countries under study was4.08, shown by the average line in Figure 1. Countriesto the right of the line were ranked above average, whilethose to the left were below average.
Figure 1 also suggests that countries might be classified into three main groups:
• The first group is composed of countries with a high TTCI score and a high number of air passengers.
• The second one includes countries with a highTTCI score and a relatively small number of airpassengers.
• The third group of countries, to the left of the figure’s average line, has low TTCI scores and fewair travelers—below 10 million passengers for theyear 2007.
The United Kingdom and the United States are the twocountries with the greatest number of travelers, followedby Germany, Spain, and France. China is located just atthe average line with around 50 million air travelers,but appears to enjoy a relatively high travel intensitygiven its TTCI score. Switzerland, which is the best performer on the Index, records a TTCI score of 5.63with around 25 million arrivals and departures duringthe full year 2007.Another group of countries—Iceland,Luxembourg, and Malta—enjoys quite high TTCIscores, respectively 5.16, 4.95, and 4.86, but with lessthan 5 million passengers.
One observation from Figure 1 is that high-incomecountries such as the United Kingdom, the United States,and other European countries are located in the topright of the graph. Low- or medium-income countriesare located in the bottom left of the graph.We knowfrom previous studies of travel demand that incomes arethe principal driver of travel.4 Incomes are not one ofthe indicators that make up the TTCI, but this analysismay suggest that high-income countries have been better able to invest in measures to attract tourists.
It appears also that there is a ‘’hub’’ effect. Somecountries show a high number of travelers but a relativelow TTCI score level compared with other countries.For instance, the United Kingdom shows a higher num-ber of travelers than France, which has a similar totalIndex value (5.28 against 5.23) and a comparable coun-try size in terms of population and GDP.The UnitedKingdom is a major hub in Europe and a major gateway
56
1.4:
Diff
eren
ces
in T
rave
l Int
ensi
ty A
mon
g Co
untr
ies
0 1 2 3 4 5 6
0
30
60
90
120
150
Chad
United KingdomUnited States
Germany
Spain
France
Italy
Japan
SwitzerlandSweden
Portugal
Korea
BrazilIsrael
China
RussiaPoland
United ArabEmirates
Average score
Figure 1: Total TTCI score and number of passengers, 2007
Source: IATA; World Economic Forum, 2008.
TTCI score
Pass
enge
rs (m
illio
ns)
part1.r2 2/26/09 11:58 AM Page 56
The Travel & Tourism Competitiveness Report 2009 © 2009 World Economic Forum

for the United States, which could explain this differ-ence in number of passengers.
Another major factor that may account for the dif-ferences in the relationship between passenger numbersand the TTCI score shown in Figure 1 is the cost.Because of the difficulties in obtaining consistent andcomprehensive price data, we proxy travel costs by dis-tance between origin and destination. It is expected thatair passenger traffic between two countries decreases thefarther away the countries are from each other, and sothe cost to reach distant countries is expected to behigher than to reach closer destinations.
Figure 1 suggests also that the size of the countriesthat might be approximated by the population is anoth-er important parameter to consider. It is likely that thelarger the population of a country, the higher theexpected number of travelers from and to this country(everything else considered equal). For example, this isthe case for Albania, which is about seven times smallerthan Australia in terms of population, and for which thetotal number of air travelers is about fifteen times lowerthan Australia.
A country’s travel intensity and its TTCI scoreFocusing more specifically on travel intensity, defined asthe number of air passengers (arrivals and departures)divided by the population of the country, we analyzedthe relationship between travel intensity and the TTCIscore, GDP per capita, and distance.
The analysis of Figures 2, 3, and 4 supports thepoints outlined above.
It is clear in Figure 2 that, once the size of a coun-try’s population is allowed for, its air passenger numbershave a clearer and more consistent relationship with itsTTCI score.The high levels of passenger numbersshown for the United Kingdom and the United Statesin Figure 1, relative to their TTCI score, are shown tobe the result of their population size.As expected, theTTCI score has a positive relationship with travel inten-sity; this is confirmed by Figure 2.There is also a clearand positive relationship between GDP per capita andtravel intensity. On the other hand, distance has a nega-tive effect for almost all countries. Countries such asNew Zealand or Japan, which are more distant fromother destinations than European countries, such asSwitzerland, show lower levels of travel intensity.Thedistance—and hence, the cost—of travel is a part of theexplanation for differences in travel intensity relative toa country’s TTCI score.
Interestingly, these three figures also suggest thatthere are several countries for which the TTCI score,GDP per capita, and distance are not the only variablesthat are related to the total number of passengers.Thisgroup of outliers is composed of several countries fromthe Middle East—the United Arab Emirates, Qatar, andBahrain—and also by Barbados and Cyprus as well as
Malta.These countries are attracting a high number ofpassengers with respect to their population and they areranked in the first quartile of the best performer countries:
• The United Arab Emirates, Qatar, and Bahrainrecord a TTCI score of 4.39, 4.44, and 4.29, respec-tively, which is above the TTCI average of 4.08.These three countries are very strongly rated interms of price competitiveness in the T&T industryand human resources, and also in terms of safetyand security.These countries, and the Middle Eastin general, have been investing intensively in airtransport infrastructure in the last few years, and airtransport has been growing strongly in double dig-its.The United Arab Emirates is a perfect example,with Dubai international airport, being a major hubin the region, enjoying more than 34 million airpassengers during the full year 2007.
• Barbados, Cyprus, and Malta represent a major des-tination for tourism and record a TTCI score abovethe average, equal to 4.77, 4.87, and 4.86, respec-tively. In addition, these countries enjoy a very highvalue of the “affinity for Travel & Tourism” pillar,with scores of 6.57, 6.35, and 6.22, respectively, outof 7.This pillar is captured in the subindex ofhuman, cultural, and natural resources, which assess-es the tourism openness and the attitude of popula-tion toward foreign visitors, as well as whether ornot an extension of business trips is recommended.
For other countries, such as Hong Kong SAR andSingapore, the distance to destination seems not to berelated to the intensity to travel.A part of the explanationis that travel intensity for these countries is likely to bedriven mostly by their historic positions as key tradehubs and their TTCI scores. Compared with that ofNew Zealand, for example, which is of similar size interms of population and average distance flown, HongKong SAR and Singapore enjoy a quite high TTCI—5.09 and 5.06, respectively, while that of New Zealand is4.96.
Of course it is impossible to disentangle the separateeffects on travel intensity of the TTCI score and otherfactors through casual graphic analysis. In order to assessthe weight of each of these drivers—that is, their rela-tionship with the intensity of travel—an econometricmodel was developed.
The results of the analysis with this model arebroadly in line with our expectations.The modelexplains a large proportion of the variation of the data(77 percent of the overall variance).5 The total Indexscore and GDP per capita have a positive impact on theintensity to travel.The distance from destination, whichis used as a proxy of the cost to travel to a given coun-try, has a negative effect on the intensity to travel.
57
1.4:
Diff
eren
ces
in T
rave
l Int
ensi
ty A
mon
g Co
untr
ies
part1.r2 2/26/09 11:58 AM Page 57
The Travel & Tourism Competitiveness Report 2009 © 2009 World Economic Forum

58
1.4:
Diff
eren
ces
in T
rave
l Int
ensi
ty A
mon
g Co
untr
ies
0 1 2 3 4 5 6
0
1
2
3
4
5
6
7Cyprus
IrelandMalta
SpainAustria
Sweden
GermanyAustralia
Iceland
Hong Kong SARBahrain
Switzerland
Denmark
United Kingdom
SingaporeQatar
Luxembourg
Norway
Canada
France
United StatesJapan
New ZealandKuwait
Chad
Barbados
Average scoreUnited Arab
Emirates
Figure 2: Travel intensity and TTCI score, 2007
Source: IATA; World Economic Forum, 2008.
TTCI score
Num
ber o
f pas
seng
ers/
Popu
latio
n
0 20,000 40,000 60,000 80,000 100,000 120,000
0
1
2
3
4
5
6
7Cyprus
Barbados
Malta
SpainMauritius
LatviaJamaica
Hong Kong SAR
Singapore
Ireland
Qatar
Norway
Luxembourg
United States
CanadaGermany
SwedenNetherlands
Finland
Iceland
Switzerland
Denmark
Kuwait United KingdomNew Zealand
PortugalGreece
Japan
ItalyAustralia
Austria
United ArabEmirates
Bahrain
Figure 3: Travel intensity and GDP per capita, 2007
Source: IATA; World Economic Forum, 2008.
GDP per capita (US dollars)
Num
ber o
f pas
seng
ers/
Popu
latio
n
part1.r2 2/26/09 11:58 AM Page 58
The Travel & Tourism Competitiveness Report 2009 © 2009 World Economic Forum

The TTCI score appears to be the most importantfactor explaining variations in travel intensity betweencountries. GDP per capita counts for a larger weightthan distance, which is consistent with other researchshowing that travel has a higher elasticity with respect toincome than price.6 Considering all else being equal, themodel suggests that improving the total Index score by10 percent would lead to an increase in travel intensityby 33 percent.
We used results of this model to simulate the out-come of improving the value of the TTCI score for sev-eral countries, through raising the performance of keydrivers such as infrastructure, airport costs, and regula-tion. Because the TTCI score is calculated as anunweighted average of the three subindexes, theimprovement might be achieved by upgrading the scoreof the subindexes and associated pillars. Obviously, theresults that will be obtained with this simulation dependon the particular situation of each country in terms ofthe population, GDP per capita, distance to destinations,and the current value of the TTCI. Indeed, subindexesand associated pillars are affecting the T&T industry ofeach country differently.
India, for example, might increase the total numberof its passengers in the model by 2 percent if it wereable to upgrade its TTCI score to the regional averagescore of 4.02, which represents an improvement of 0.8percent.This in theory might be achieved by upgradingthe business environment and infrastructure performancefrom 3.70 to 3.78, through more competitive ticket
taxes and airport charges, or by increasing the numberof “available seat kilometers.”
Mauritius, ranked 41st last year, enjoys a TTCIscore of 4.38, which is above the African average.Themodel suggests that this country could increase its num-ber of air passengers by 14 percent if it could reach theEuropean average TTCI score (4.60), representing anupgrade of just 5 percent.This is might correspond toan upgrade of the ICT infrastructure, which is, accord-ing to last year’s evaluation, at the bottom of the table(2.73 out of 7).
China is also an interesting example to investigatebecause it records a TTCI of 4.06, which is just belowthe TTCI average score for all countries of our sample.This country is rated relatively low on the overall T&Tbusiness environment and infrastructure (scoring 3.45out of 7), where the tourism infrastructure and the ICTinfrastructure pillars are particularly weak, with scores of1.53 and 2.62 out of 7, respectively.All else being con-sidered equal, if it were possible to raise this particularsubindex to reach the TTCI European average, themodel suggests that China might see an increase of thenumber of arriving and departing passengers of about44 percent. Overall TTCI score averages, by region, areprovided in Table 1 for comparison.
0 1000 2,000 3,000 4,000 5,000 6,000 7,000
0
2
4
6
8
,
Ireland
Cyprus
MaltaIceland
Bahrain
Qatar
Denmark
Switzerland
Kuwait
Portugal Netherlands
FranceTaiwan, China
Spain United Kingdom
New Zealand
Japan
KoreaCanada
United StatesArgentina
Thailand
Barbados
Singapore
Hong Kong SAR
Luxembourg
Norway
Lesotho
AustriaSweden
Greece
OmanIsrael
Italy
Brazil
Mauritius
Australia
Malaysia
Germany
United ArabEmirates
Figure 4: Travel intensity and distance, 2007
Source: IATA; World Economic Forum, 2008.
Average distance (kilometers)
Num
ber o
f pas
seng
ers/
Popu
latio
n
59
1.4:
Diff
eren
ces
in T
rave
l Int
ensi
ty A
mon
g Co
untr
ies
part1.r2 2/26/09 11:58 AM Page 59
The Travel & Tourism Competitiveness Report 2009 © 2009 World Economic Forum

Table 1: Average overall TTCI score, by region
Region Number of countries Average TTCI score
Africa 27 3.40Americas 23 4.03Asia Pacific 25 4.02Europe 41 4.60Middle East 10 4.04
Total average 126 4.08
Source: TTCI 2008.
The next section will focus on analyzing the relationshipbetween upgrading particular subindexes and associatedpillars or indicators with the total number of passengers.
Policy implicationsThe main aim of this research is to provide a quantitativetool to measure the extent to which policies dedicatedto improving the business environment and infrastructure;the regulatory framework; or the human, cultural, andnatural resources component of a country might beexpected to increase the number of air passengers andtravel intensity by a country.
The results of last year’s Report show that the scoresrecorded for the three subindexes are markedly differentacross regions (Table 2). For the sample under study,Africa has the lowest score in terms of business environ-ment and infrastructures, while the Asia Pacific region,which is similar in terms of number of countries, ismore highly ranked.
Europe, the larger sample with 41 countries, recordsthe highest score for each of the three subindexes.
Table 2: Average T&T subindex scores, by region
Average TTCI score
Subindex A: Subindex B: Subindex C:T&T T&T business Human, cultural,
Number of regulatory environment and natural Region countries framework and infrastructure resources
Africa 27 3.88 2.87 3.44Americas 23 4.32 3.60 4.18Asia Pacific 25 4.41 3.62 4.02Europe 41 5.08 4.36 4.37Middle East 10 4.43 3.98 3.70
Total average 126 4.50 3.73 4.01
Source: TTCI 2008.
Air transport infrastructureHigh-quality air transport infrastructure is a key driverof competitiveness for the tourism industry and also forthe whole economy of a country.7 It allows for thereduction of the distance barrier between countries andconnects national markets to the rest of the world.
Air transport infrastructure is a component of theTTCI score and is captured in the 6th pillar.This pillaris made of six different indicators, including both quan-titative and qualitative measurements: the quality of theair transport infrastructure, the number of available seatkilometers, the number of departures per 1,000 popula-tion, airport density, the number of operating airlines,and the quality of the international air transport network.
Results of last year’s Report indicate that the scorefor this particular indicator varies widely across countriesand regions.
African countries are suffering from a lack of airtransport infrastructure, with the lowest regional averagescore of just 2.43 for this pillar, while the Asia Pacificregion, which is of comparable sample size, enjoys anaverage score level of 3.41 (Table 3).
Table 3: Average score for the air transport infrastructure pillar
Region Number of countries Average score
Africa 27 2.43Americas 23 3.34Asia Pacific 25 3.41Europe 41 3.75Middle East 10 3.63
Total average 126 2.43
Source: TTCI 2008.
We used our econometric model to simulate theresults of hypothetical programs to upgrade the airtransport infrastructure pillar for two African countries.This improvement might be achieved by upgrading oneor several of the six indicators. It should be noted thatthe objective of this exercise is to indicate the scale ofincreased activity that such an improvement in air transport infrastructure might bring. Governments willneed to assess the costs and benefits of investing in airtransport against other public works. However, thisanalysis does provide important data that could be usedto help measure the benefits of such investment in acost-benefit assessment.
Mali, according to the value of the 6th pillar, showsa deficit of air infrastructure with a score equal to 2.10out of 7.Among the lowest country performances inthis pillar are the number of available seats offered andthe airport density, with scores of 1.05 and 1.03, respec-tively. Our model suggests that the number of passengersarriving and departing could be raised if it were possibleto invest in creating new airport capacity and/or createthe necessary regulatory conditions for airlines toincrease air transport capacity.Assuming that all otherpillars remain unchanged, this country might see anincrease of 2 percent (representing a total of about635,132 passengers) of the number of passengers if it
60
1.4:
Diff
eren
ces
in T
rave
l Int
ensi
ty A
mon
g Co
untr
ies
part1.r2 2/26/09 11:58 AM Page 60
The Travel & Tourism Competitiveness Report 2009 © 2009 World Economic Forum
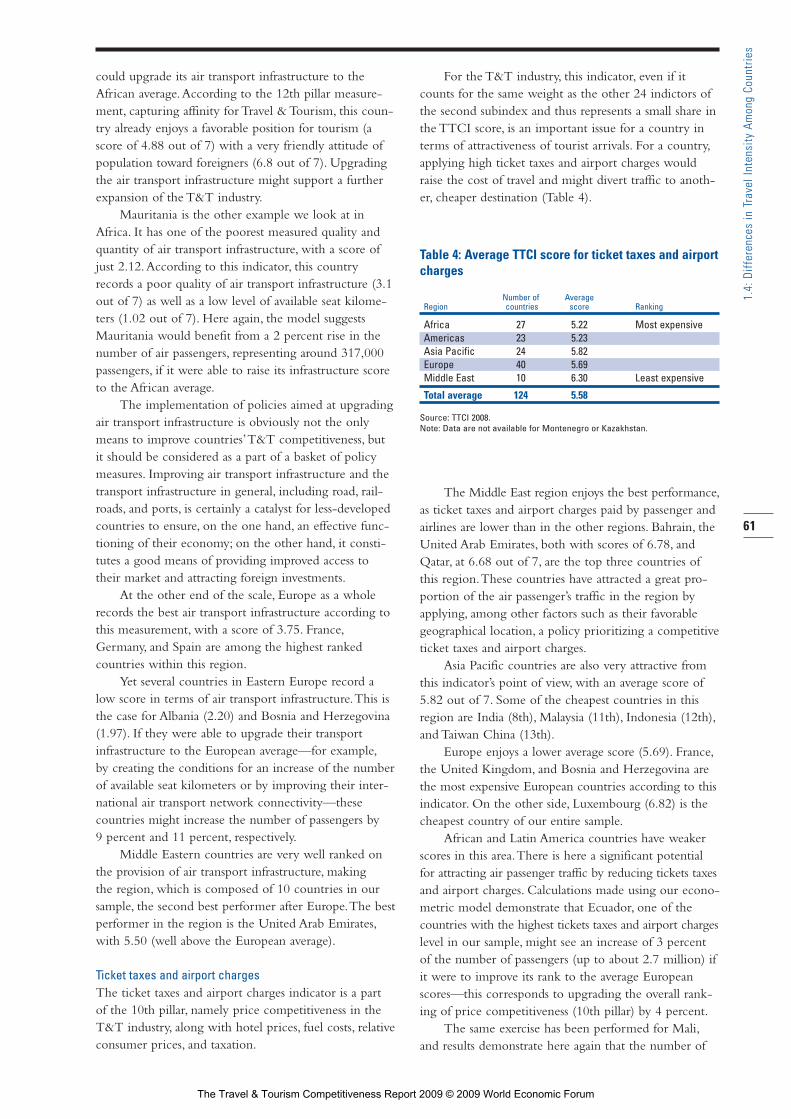
could upgrade its air transport infrastructure to theAfrican average.According to the 12th pillar measure-ment, capturing affinity for Travel & Tourism, this coun-try already enjoys a favorable position for tourism (ascore of 4.88 out of 7) with a very friendly attitude ofpopulation toward foreigners (6.8 out of 7). Upgradingthe air transport infrastructure might support a furtherexpansion of the T&T industry.
Mauritania is the other example we look at inAfrica. It has one of the poorest measured quality andquantity of air transport infrastructure, with a score ofjust 2.12.According to this indicator, this countryrecords a poor quality of air transport infrastructure (3.1out of 7) as well as a low level of available seat kilome-ters (1.02 out of 7). Here again, the model suggestsMauritania would benefit from a 2 percent rise in thenumber of air passengers, representing around 317,000passengers, if it were able to raise its infrastructure scoreto the African average.
The implementation of policies aimed at upgradingair transport infrastructure is obviously not the onlymeans to improve countries’T&T competitiveness, butit should be considered as a part of a basket of policymeasures. Improving air transport infrastructure and thetransport infrastructure in general, including road, rail-roads, and ports, is certainly a catalyst for less-developedcountries to ensure, on the one hand, an effective func-tioning of their economy; on the other hand, it consti-tutes a good means of providing improved access totheir market and attracting foreign investments.
At the other end of the scale, Europe as a wholerecords the best air transport infrastructure according tothis measurement, with a score of 3.75. France,Germany, and Spain are among the highest rankedcountries within this region.
Yet several countries in Eastern Europe record alow score in terms of air transport infrastructure.This isthe case for Albania (2.20) and Bosnia and Herzegovina(1.97). If they were able to upgrade their transport infrastructure to the European average—for example,by creating the conditions for an increase of the numberof available seat kilometers or by improving their inter-national air transport network connectivity—thesecountries might increase the number of passengers by 9 percent and 11 percent, respectively.
Middle Eastern countries are very well ranked onthe provision of air transport infrastructure, making the region, which is composed of 10 countries in oursample, the second best performer after Europe.The bestperformer in the region is the United Arab Emirates,with 5.50 (well above the European average).
Ticket taxes and airport chargesThe ticket taxes and airport charges indicator is a part of the 10th pillar, namely price competitiveness in theT&T industry, along with hotel prices, fuel costs, relativeconsumer prices, and taxation.
For the T&T industry, this indicator, even if itcounts for the same weight as the other 24 indictors ofthe second subindex and thus represents a small share inthe TTCI score, is an important issue for a country interms of attractiveness of tourist arrivals. For a country,applying high ticket taxes and airport charges wouldraise the cost of travel and might divert traffic to anoth-er, cheaper destination (Table 4).
Table 4: Average TTCI score for ticket taxes and airportcharges
Number of AverageRegion countries score Ranking
Africa 27 5.22 Most expensiveAmericas 23 5.23Asia Pacific 24 5.82Europe 40 5.69Middle East 10 6.30 Least expensive
Total average 124 5.58
Source: TTCI 2008.Note: Data are not available for Montenegro or Kazakhstan.
The Middle East region enjoys the best performance,as ticket taxes and airport charges paid by passenger andairlines are lower than in the other regions. Bahrain, theUnited Arab Emirates, both with scores of 6.78, andQatar, at 6.68 out of 7, are the top three countries ofthis region.These countries have attracted a great pro-portion of the air passenger’s traffic in the region byapplying, among other factors such as their favorablegeographical location, a policy prioritizing a competitiveticket taxes and airport charges.
Asia Pacific countries are also very attractive fromthis indicator’s point of view, with an average score of5.82 out of 7. Some of the cheapest countries in thisregion are India (8th), Malaysia (11th), Indonesia (12th),and Taiwan China (13th).
Europe enjoys a lower average score (5.69). France,the United Kingdom, and Bosnia and Herzegovina arethe most expensive European countries according to thisindicator. On the other side, Luxembourg (6.82) is thecheapest country of our entire sample.
African and Latin America countries have weakerscores in this area.There is here a significant potentialfor attracting air passenger traffic by reducing tickets taxesand airport charges. Calculations made using our econo-metric model demonstrate that Ecuador, one of thecountries with the highest tickets taxes and airport chargeslevel in our sample, might see an increase of 3 percentof the number of passengers (up to about 2.7 million) ifit were to improve its rank to the average Europeanscores—this corresponds to upgrading the overall rank-ing of price competitiveness (10th pillar) by 4 percent.
The same exercise has been performed for Mali,and results demonstrate here again that the number of
61
1.4:
Diff
eren
ces
in T
rave
l Int
ensi
ty A
mon
g Co
untr
ies
part1.r2 2/26/09 11:58 AM Page 61
The Travel & Tourism Competitiveness Report 2009 © 2009 World Economic Forum

passengers might be increased by 5 percent if this coun-try were able to raise its price competitiveness by 18percent.This would need to take place on a number offronts since, if it were to be achieved by reducing tickettaxes and airport charges alone, it would correspond totaxes and charges about seven times lower than is thecurrent situation.
Regulatory frameworkThe regulatory framework, which is the first subindexof the TTCI, is made of five pillars capturing many ele-ments related to government policies.Those elementsinclude the openness of bilateral Air ServiceAgreements, policy rules and regulations, environmentalsustainability, safety and security, health and hygiene, andalso the prioritization of Travel & Tourism.This is themost complex subindex of the TTCI, as it is constructedon a basis of 27 individual indicators (against 24 for thesecond subindex and 20 for the third).
In the 2008 TTCI, Europe enjoys the most favor-able regulatory framework, with the top four countriesin this region being Switzerland, Germany, Spain, andthe United Kingdom. However, several EasternEuropean countries are ranked at a lower level than theEuropean average: Bosnia and Herzegovina, Macedonia,Albania, and Russia are at the bottom of the ranking forthis particular subindex.
One part of the explanation is that these countriesseem not to implement policies aimed at prioritizingthe T&T industry. Indeed, the 5th pillar, which capturesthis element, shows a relatively low score for thesecountries. Looking in more detail—at the indicator ofgovernment prioritization of the T&T industry—wenotice also that the score is quite low for these fourcountries, below 4 out of 7 for Bosnia and Herzegovina,Macedonia, and Russia, and 4.7 for Albania.
Using our model, we simulate for these countriesthe impact of upgrading their overall regulatory frame-work scores to the European average that could beachieved through the improvement of one or severalpillars of subindex B (Table 5). Bosnia and Herzegovinashows the greatest potential to improve to its overallTTCI ranking and attract an estimated additional 34percent air travel passengers if it were able to implementregulatory policies that result in an improvement ofabout 26 percent of the subindex A score.
Table 5: Impact of upgrading the TTCI score, EasternEuropean countries
Percent increase
Country TTCI score Number of Passengers
Albania 10 33Bosnia and Herzegovina 10 34Macedonia, FYR 4 11Russian Federation 7 23
Source: TTCI 2008.
African countries are most hampered from a regula-tory point of view, with an average subindex score of3.88. Burundi, Cameroon, Chad, and Lesotho are thecountries that record the lowest subindex A. For thesecountries we also simulate the impact of improving theranking by improving the policy rules and regulationspillar (See Table 6).
Table 6: Impact of upgrading the TTCI score, Africancountries
Percent increase
Country TTCI score Number of passengers
Burundi 8 27Chad 14 51Cameroon 7 21Lesotho 6 18
Source: TTCI 2008.
We did a similar exercise for the Asia Pacific region.Several countries within this region are suffering froman inefficient regulatory framework, according to thefirst subindex ranking.Among the countries that wouldbe the most affected is India, with a score of just 3.78,below the regional average score of 4.41.This countryhas the potential to increase the number of air passengerby 17 percent if it could upgrade its regulatory policiesto the regional average.
The other important indicator that facilitates airtransport connections between two countries is theopenness of bilateral Air Service Agreements (see Table7).This is captured in the policy rules and regulationspillar.
Table 7: Average score for openness of bilateral AirService Agreements
Region Number of countries Average score
Africa 27 2.31Americas 23 4.02Asia Pacific 23 2.67Europe 39 2.79Middle East 10 2.64
Total average 122 2.88
Source: TTCI 2008.Note: Data are not available for Montenegro, Serbia, Tajikistan, or Taiwan,
China.
Latin American countries, such as El Salvador,Honduras, and the Dominican Republic, enjoy thehighest scores for this indicator, creating positive incen-tives to facilitate air transport connections with other
62
1.4:
Diff
eren
ces
in T
rave
l Int
ensi
ty A
mon
g Co
untr
ies
part1.r2 2/26/09 11:58 AM Page 62
The Travel & Tourism Competitiveness Report 2009 © 2009 World Economic Forum

countries. Last year’s results indicate that all otherregions benefit from a comparable level of opennesswith similar scores, although it is mainly African andEastern European countries that are at the bottom theTTCI table—for example, Estonia and Algeria, amongothers. For these two countries, our simulation showsthat the number of passengers might be raised by 4 percent and 9 percent, respectively, through an improve-ment of all the policy rules and regulation measures totheir regional averages.
ConclusionThis modeling demonstrates that the tourism competi-tiveness factors making up the TTCI are strongly relatedto the total number of passengers arriving and departingfor a given country.Taking into account the populationby country, the econometric analysis demonstrates alsothat the GDP per capita of the destination country andthe average distance traveled to reach that particularcountry are two other significant factors. Efforts dedicat-ed to improving the overall TTCI ranking (by imple-menting an efficient regulatory framework; investing ininfrastructure; improving price competitiveness; orimproving human, cultural, and natural resources) arelikely to increase the total number of passengers arrivingand departing for a given country, according to themodel estimation.The econometric model developedprovides a tool to simulate the effect of a particular poli-cy on the number of air passengers either by upgradingthe overall TTCI score or the score of one of thesubindexes and pillars.
Further work is necessary to refine the analysis, butalready it provides some quantification of the effects thatgovernments and other stakeholders might expect ifthey improve the provision of key drivers of Travel &Tourism.These drivers could be used to help improvethe wider economic benefits brought through the devel-opment of this important sector.
Notes1 UNWTO 2008.
2 IATA 2007.
3 The econometric model is based on the data collected during the2008 edition of the Travel &Tourism Competitiveness Reportusing a sample of 126 countries (the following countries are notincluded in the analysis: Guatemala, Kyrgyz Republic, Puerto Rico,and Nicaragua. International passengers data for the full year 2007were not available for these countries). The total number of airtravelers for a country is calculated on an origin and destinationbasis for each country and is extracted from IATA’s PassengerIntelligence Services (PaxIS) database (2007). All data sources arelisted in the appendix.
4 See IATA 2008.
5 See Appendix A: Description of the Model.
6 IATA 2008.
7 Please note that this pillar is comprised of six indicators in TheTravel &Tourism Competitiveness Report 2008; this year, thenumber of available seat kilometers has been divided into twoseparate indicators, domestic and international, so that there arenow seven indicators that make up the pillar. This section citesresults and scores listed in the 2008 Report.
ReferencesGreen, W. H. 2000.Econometric Analysis, 4th edition. Upper Saddle
River, NJ: Prentice Hall.
IATA (International Air Transport Association). 2007. Aviation EconomicBenefits: Measuring the Economic Rate of Return on Investmenton the Aviation Industry. IATA Economics Briefing No. 8, July.Switzerland: IATA. Available at http://www.iata.org/whatwedo/eco-nomics/issue_briefing_new.htm.
———. 2008. Air Travel Demand: Measuring the Responsiveness of AirTravel Demand to Changes in Prices and Incomes. IATAEconomics Briefing No. 9, April. Switzerland: IATA. Available athttp://www.iata.org/whatwedo/economics/issue_briefing_new.htm.
Halicioglu, F. 2005. “An ARDL Model of Aggregate Tourism Demand forTurkey.” International Trade 0503005, EconWPA. Seehttp://ideas.repec.org/p/wpa/wuwpit/0503005.html
Piermartini, R. and L. Rousova. 2008. “Liberalization of Air TransportServices and Passenger Traffic (December).” WTO Staff WorkingPaper ERSD-2008-06.
UNWTO (United Nations World Tourism Organization). 2006.Compendium of Tourism Statistics: Data 2000–2004. Madrid:UNWTO.
———. 2008. Tourism Highlights: 2008 Edition. Available atwww.unwto.org.
World Economic Forum. 2008. The Travel & Tourism CompetitivenessReport 2008: Balancing Economic Development andEnvironmental Sustainability. Geneva: World Economic Forum.
63
1.4:
Diff
eren
ces
in T
rave
l Int
ensi
ty A
mon
g Co
untr
ies
part1.r2 2/26/09 11:58 AM Page 63
The Travel & Tourism Competitiveness Report 2009 © 2009 World Economic Forum
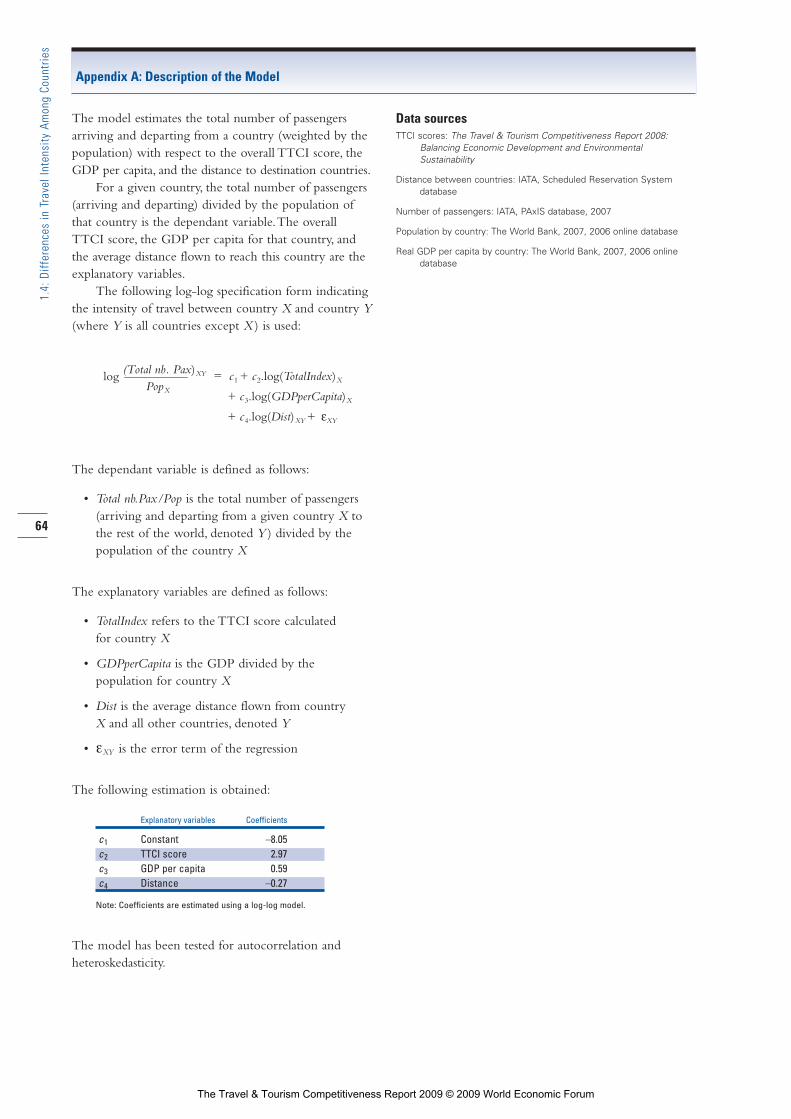
64
1.4:
Diff
eren
ces
in T
rave
l Int
ensi
ty A
mon
g Co
untr
ies
The model estimates the total number of passengersarriving and departing from a country (weighted by thepopulation) with respect to the overall TTCI score, theGDP per capita, and the distance to destination countries.
For a given country, the total number of passengers(arriving and departing) divided by the population ofthat country is the dependant variable.The overall TTCI score, the GDP per capita for that country, andthe average distance flown to reach this country are theexplanatory variables.
The following log-log specification form indicatingthe intensity of travel between country X and country Y(where Y is all countries except X ) is used:
The dependant variable is defined as follows:
• Total nb.Pax/Pop is the total number of passengers(arriving and departing from a given country X tothe rest of the world, denoted Y ) divided by thepopulation of the country X
The explanatory variables are defined as follows:
• TotalIndex refers to the TTCI score calculated for country X
• GDPperCapita is the GDP divided by the population for country X
• Dist is the average distance flown from country X and all other countries, denoted Y
• εXY is the error term of the regression
The following estimation is obtained:
Explanatory variables Coefficients
c1 Constant –8.05c2 TTCI score 2.97c3 GDP per capita 0.59c4 Distance –0.27
Note: Coefficients are estimated using a log-log model.
The model has been tested for autocorrelation and heteroskedasticity.
Data sourcesTTCI scores: The Travel & Tourism Competitiveness Report 2008:
Balancing Economic Development and EnvironmentalSustainability
Distance between countries: IATA, Scheduled Reservation System database
Number of passengers: IATA, PAxIS database, 2007
Population by country: The World Bank, 2007, 2006 online database
Real GDP per capita by country: The World Bank, 2007, 2006 onlinedatabase
PopX
(Total nb. Pax)XY = c1 + c2.log(TotalIndex)X
+ c3.log(GDPperCapita)X
+ c4.log(Dist)XY + εXY
log
Appendix A: Description of the Model
part1.r2 2/26/09 11:58 AM Page 64
The Travel & Tourism Competitiveness Report 2009 © 2009 World Economic Forum
CHAPTER 1.5
Capturing the Visitor Economy:A Framework for SuccessALEX KYRIAKIDIS
HEATHER HANCOCK
SIMON OATEN
RASHID BASHIR
Deloitte
Tourism is one of the largest industries in the globaleconomy and has been both a key driver and a benefici-ary of the prolonged period of economic growth seenin recent years. It also has significant social and culturalbenefits because of its potential to promote understandingand international relationships.These socioeconomicdimensions make tourism a vital component of global-ization.
The importance of the sector worldwide is demon-strated by the liberal business environment that exists inmost countries, with more than 130 WTO membershaving made commitments to open up their touristindustry—more than any other service sector.1
International tourist volumes increased by 6 percentin 2007, reaching almost 900 million arrivals and deliv-ering the fourth year of uninterrupted expansion.Thefirst half of 2008 saw a further volume increase of 4 percent, but a sharp slowdown in the second half led toan estimated growth of 2–3 percent for the year as awhole.2
As the global economy enters deeper into a climateof uncertainty in 2009 with reduced investment anddeclining consumer spending, coupled with an increasingfocus on fiscal policy to stimulate economic activity, itbecomes more important than ever for countries to sustain and maximize the benefits of tourism.
It is vital for policymakers to understand the eco-nomic impact of tourism and to design and implementpolicies that will enable them to realize its full benefits.In this chapter, we analyze, from a public sector perspec-tive, the economic contribution of tourism to the widersociety and explores a framework for capturing the “vis-itor economy.”
What is the visitor economy?The visitor economy in each country consists of twokey components.3 The core element is formed by thedirect contribution of tourism: the value generated bythe provision of tourism-related goods and services.Thismeasure is in line with the concept used by the UnitedNations World Tourism Organization (UNWTO)Tourism Satellite Accounts (TSA).
A second, broader component takes into accountindirect contributions from other sectors that rely on,or support, tourism (for example, through the supplychain).This component also includes the impact of capi-tal investment and collective government expenditureon behalf of the tourism industry.
In this chapter we analyze these components of thevisitor economy and also consider its contribution tobroader public policy objectives such as regeneration,social and economic inclusion, enhancing skills andemployment, and attracting enterprise and investment aswell as strengthening international ties.
Deloitte has developed the “visitor economy analy-sis framework” to describe and understand how tourism
65
1.5:
Cap
turin
g th
e Vi
sito
r Ec
onom
y: A
Fra
mew
ork
for
Succ
ess
part1.r2 2/26/09 11:58 AM Page 65
The Travel & Tourism Competitiveness Report 2009 © 2009 World Economic Forum

66
1.5:
Cap
turin
g th
e Vi
sito
r Ec
onom
y: A
Fra
mew
ork
for
Succ
ess
DirectIndirect
(supply-chain) Broader
Output (GVA)Import“leakage”
Critical massfor business
& culturalheritage sites
Social welfare(quality of life,
place, &environment)
Improvedchoice forconsumers
Nuisancefactor &
congestion
Further economic effects & externalities
Regional/local
Urban/rural
National
Spatial dimension
Initial economic effects
Exte
nt o
f tra
ditio
nal m
easu
re
Informal/grey market
Lost to otherinternationaldestinations
Domestictourists &
travel agentactivities,
etc.
Retainees
Potential domestictourist pool
Employment
Earnings
Tax
Governmentspending
Domesticinvestment
FDI
Market/policyfailures
Physicalinfra-
structure& capacity
Free-riderproblem precludes
individual provision
Skills gaps Wider policy barriers
Entry costs
& borderpolicy
Reactivenationalpolicy
(crisis-led)
Restrictionson movement(e.g., national
parks)
Lack oftourism
focusin regions
Sensitivity to exchange
ratefluctuation
Seasonality
Short-termism
Marketinfluencers
Disconnect &lack of synergy
among agencies
Climatechange
legislation
Potential international
tourist pool
In-boundinternational
tourists
Lost to otherinternationaldestinations
DOMESTIC FLOW
INTERNATIONAL FLOW
Figure 1: Visitor economy analysis framework
Source: Deloitte.
Note: Framework outline:
Domestic and international tourists: The economic impact of tourism isdriven by the number of tourists and the amount they spend. Bothdomestic and international tourists add value to an economy.
However, domestic visitors contribute in an economic sense only if theiralternative choice would be to travel abroad; otherwise they represent aredistribution of expenditure within the domestic economy.
Market influencers and market failures: These have an impact on economic outcomes by affecting the number of tourists visiting orremaining in a given country.
Key market influences include exchange rate fluctuations affecting the relative cost of a trip, and seasonality affecting the attractiveness of adestination—for example, there are significant variations in visitor numbers during summer and winter seasons, or for special events.
Market failures affect the level of information available to prospective visitors and thus their behavior, as well as the ability of the industry toundertake coordinated and effective marketing; this in turn influencesthe number and type of visits. Market failures can also affect the abilityof visitors to fulfill their (spending) expectations once in the country—for example, through accessibility to varied locations.
Wider policy barriers: These also have external effects on the economicimpact of tourism, influencing both visitor numbers and expenditure.These include physical infrastructure and capacity, entry costs and border policy, and climate change legislation.
Narrow effectsBroad effects
interacts with and contributes to the wider economyand society.This framework highlights the economicimpacts (direct and indirect) of tourism as well as its keydrivers, policy barriers, and market failures. It identifiesthose factors that can be most effectively leveraged bythe industry and by policymakers, along with moreuncontrollable factors that represent specific and unusual
pressures on the sector.The key elements of the frame-work are outlined in Figure 1 and explored in moredetail throughout the rest of the chapter.
To varying extents in different countries, thesedrivers influence both the number of in-bound visitorsand the extent to which domestic residents are retained
part1.r2 2/26/09 11:58 AM Page 66
The Travel & Tourism Competitiveness Report 2009 © 2009 World Economic Forum

as tourists.This determines the extent of the economiccontribution of the sector.
The challenge for policymakers is to concentrateresources on those drivers that can be influenced andthat will deliver the greatest economic benefits to thesector itself and to the wider economy.An example ofthe way this economy works in a particular country isseen in Box 1.
Economic impactAs identified at the beginning of this chapter, the eco-nomic impact of tourism is wide ranging and falls intodistinct classifications.Taking the example of tourism-related activity in restaurants, the figure in Box 2 illus-trates the different categories of impact on the overalleconomy in terms of quantifiable effects.
In addition, tourism has a number of non-quantifi-able effects on the wider policy agenda. Examplesinclude global image, culture, and heritage, as well astourism’s contribution to enhancing the attractiveness ofa place for inward investment.
Understanding the supply chainThe example in Figure 2 illustrates that through direct,secondary, and induced effects, any change in touristexpenditure can have consequences for many sectors of
the economy. Understanding the tourism supply chain isthe key to grasping these consequences.
There are numerous stakeholders involved in thetourism industry.Any single transaction extends beyondits direct effects, creating ripples throughout the lengthysupply chain.Tourism is therefore an important compo-nent of sustaining a healthy, diversified economy, and asan industry sector it should be a primary considerationfor policymakers. Countries need to understand the rel-ative importance of the visitor economy and how tomaximize the benefits of tourism for the supply chain asa whole, in addition to generating wider public goodand the economic benefits derived from tourism.
Leakage threatThere is a significant missed opportunity in the eco-nomic impact of tourism where a country lacks anindigenous supply chain for the sector. Examples ofmissed opportunities include tourism establishments thatimport food from outside the country, a sector thatemploys large transient expatriate populations who repa-triate the majority of their earnings, and a destinationwhere the majority of services are provided “withinresort” by foreign-owned entities.
In such examples, the economic benefits of tourismcan be surprisingly low because of the high degree of 67
1.5:
Cap
turin
g th
e Vi
sito
r Ec
onom
y: A
Fra
mew
ork
for
Succ
ess
The Deloitte framework can be applied to any country. It was recently used in the United Kingdom as part of a studycommissioned by VisitBritain and the Tourism Alliance.
The UK visitor economy delivers a significant direct contri-bution to the economy—currently £52 billion or 3.7 percent ofGDP.1 This takes into account the value added that is generatedby the provision of tourism-related goods and services.Moreover, the visitor economy directly supported over 1.36 million jobs in 2007. Total spending in the visitor economy hasrisen, in nominal terms, from £85 billion in 2005 to £86 billion in 2007.
The UK visitor economy also has significant indirectimpact through its interaction with other businesses in the supply chain. The total (direct and indirect) impact of the visitoreconomy was 8.2 percent of national GDP in 2007—equivalentto around £114 billion. These indirect impacts arise becauseactivity and output in the visitor economy create jobs andgrowth in the wider economy as other sectors sell to or pur-chase from it. There is also further impact through interactionswith suppliers of investment goods to the visitor economy. All of these other sectors, to some extent, benefit from the visitor
economy. The United Kingdom has a strong domestic supplychain and, as a result, its capacity to absorb indirect economicbenefits is high.
While the sector has the potential for continued stronggrowth, it faces a series of short-term and longer-term challengesas international competition increases and the world economydeteriorates. In the longer term, the sector’s economic impactcould grow to £188 billion by 2018, although still accounting foraround 8 percent of GDP. The London Olympics in 2012 isexpected to provide a particularly significant boost to tourismrevenues.
Although the longevity and depth of the current recessionremain unclear, it is expected that, as a result of the global economic downturn, gross value added for the visitor economycould be £11 billion lower over the next three years, with114,000 fewer jobs created than would otherwise have been the case.
Notes
1 Deloitte 2008; see the financial forecasting model in Annex B ofthat report.
Box 1: The visitor economy framework applied to the United Kingdom
part1.r2 2/26/09 11:58 AM Page 67
The Travel & Tourism Competitiveness Report 2009 © 2009 World Economic Forum

68
1.5:
Cap
turin
g th
e Vi
sito
r Ec
onom
y: A
Fra
mew
ork
for
Succ
ess
Direct effects are those changes in production that are con-nected with immediate effects of changes in tourism expendi-ture. Tourists spending money in restaurants directly result inincreased sales in the hospitality sector. The additional salesand consequent changes in salaries, taxes, supplies, and so onare direct effects of tourist expenditure.
Indirect (secondary) effects are those changes in productionresulting from spending of the restaurant’s receipts in otherlinked parts of the supply chain—that is, goods and servicesused by the restaurant. Changes in sales, jobs, and so on in thefood and beverage supply industry represent the indirect effectof changes in the restaurant industry. Additionally, there are amultitude of suppliers to the food and beverage industry thatrepresent another stratum of indirect effects.
Induced effects describe those changes in economic activitythat result from the spending of employee income earnedthrough participation in the tourism industry. Restaurantemployees supported by tourist expenditure subsequentlyspend their income in the region in which they live on goodssuch as utilities, food, accommodation, and so on. The rev-enues, salaries, and jobs that are a consequence of householdspending of additional income arising from tourism are knownas induced effects.
Box 2: Understanding the economic effects of tourism
Indirect Induced
Direct
Directnon-quantifiable
Secondarynon-quantifiable
Directquantifiable
Secondaryquantifiable
Figure 2: Tourism supply chain
TOURIST
Transport todestinations
Ground transport
Excursions /attractions
Restaurants LodgingFurniture /
craftsTour
operating
Wastemanagement
CateringFood
productionLaundry
Energysupplies
Infrastructure(including real estate)
Marketing/sales
part1.r2 2/26/09 11:58 AM Page 68
The Travel & Tourism Competitiveness Report 2009 © 2009 World Economic Forum

“leakage” outside the domestic market.The lack of adomestic tourism supply chain significantly dilutes thevalue of the visitor economy, but offers clear opportuni-ties for increasing the capture of these benefits if correc-tive action is taken.
Figure 3 illustrates the interaction of the supplychain with the levels of tourism in a given country.
Spillover benefitsBeyond the supply chain, tourism has close links withother parts of the economy, creating spillover benefitsfor a number of diverse sectors. Examples of sectors thatgain include retail, manufacturing, and health and lifesciences.
Retailers who are not directly associated with thetourism industry may develop targeted strategies fortourist areas to maximize sales of goods and servicesspecific to visitors. For example, in the UnitedKingdom, although only 1 percent of overseas visitorscome to London for shopping, they represent around aquarter of all shoppers in central London and accountfor £1.0–1.7 billion of retail spending annually.
While the contribution of the visitor economy tothe manufacturing sector is not immediately obvious,Deloitte research reveals crucial links through the supplychain.These links are particularly strong for manufactur-ing in the transport sector, food and beverages, and hotelequipment.
Well-developed health-care systems and improve-ments in technology have also supported the growth ofmedical tourism, with consumers traveling specifically toreceive treatments such as surgery, dentistry, cosmeticsurgery, and infertility treatment.
Deloitte has also found evidence of a “critical massviability” effect, whereby tourism and its associatedexpenditure create further benefits for local businessesand consumers (Figure 4.) For example, some businessservices are aimed specifically at tourists, but there isoften significant cross-over and in some cases evencross-subsidization, benefiting local residents.
This effect is partly tangible through additionalchoices made available to residents or through theinvestment in conservation efforts to enhance a coun-try’s heritage, as can be seen in the United Kingdom. Itis also partly intangible in terms of its contribution tothe “vibe” of a place such as Dubai.
Figure 3: Supply chain and tourism volume
Source: Deloitte analysis.
• High absorptive capacity for indirect andinduced benefits
• Well-developed supply chains
• Available domestic skills and labor force
• Effective tourism strategies focusing on enhanc-ing value and volume of visitors would contributegreatly to wider economic development
• Low levels of tourism
• Supply chains in the sector not fully developed
• Tourism strategy in this scenario must work alongside supply chain development tocapture and maximize economic benefits
Supp
ly c
hain
Lim
ited
Exte
nsiv
e
Value and volume of tourismLow High
• Well-developed supply chain and tourism sector
• Focus here needs to be enhancing value generated through segmentation and focus on high value added markets
• Sustain competitiveness and respond to emerging markets
• High levels of tourism activity
• Significant leakage of value due to limited supply chain links
• Any growth in tourism is unlikely to deliver netbenefits, after taking into account infrastructurecosts and implications for congestion
• Focus must be to use vibrant tourism sector tostrengthen supply chains and capture value forthe local economy
69
1.5:
Cap
turin
g th
e Vi
sito
r Ec
onom
y: A
Fra
mew
ork
for
Succ
ess
part1.r2 2/26/09 11:58 AM Page 69
The Travel & Tourism Competitiveness Report 2009 © 2009 World Economic Forum

Wider contributionThe visitor economy can also contribute to the widersocioeconomic policy agenda.Tourism can promoteeconomic and social inclusion by providing a point ofentry to the labor market for those with low or noskills, those who can only work part-time, or those whomight not otherwise engage with the labor market.Once employed, these workers can be “up-skilled” andmoved further up the value chain.
The visitor economy supports strong entrepreneur-ial activity and new business formation in many coun-tries.This is helped by the comparatively limited barriersto entry in most areas of the tourism industry; this isparticularly the case for small- and medium-sized enterprises.
The visitor economy contributes significantly to thesustainable development of many rural areas in terms ofdirect tourism-related activity.Anecdotal evidence alsosuggests that local supply chain links are likely to bestronger in these areas. For both these points, though,it is important not to overstate the case for the contri-bution made by ”lifestyle businesses,” where normalbusiness drivers toward growth and higher value may beat odds with more personal motivations for the style andscale of tourism business being created.
Tourism has also been a catalyst for wider regenera-tion and development in a number of urban areas acrossthe world, from the Las Vegas Strip to Singapore’s ClarkeQuay.
In assessing the economic impact of the visitoreconomy, it is important to understand not just the ben-efits of the sector but also the costs, both to the tourismindustry itself and to the wider economy. For example, ifthe government chooses to develop an airport to betterserve tourists, this represents a fiscal cost as well as anasset.
Society may bear the cost and negative consequenceof increased congestion resulting from higher volumesof tourism.“Joined-up” thinking to connect policy atthe local, regional, and national levels is therefore ofgreat importance in ensuring that the positive economicbenefits are maximized while negative impacts are dealtwith effectively.
And finally, tourism can be a powerful tool to facilitate international understanding and enable broadercultural horizons.This will help in building cosmopolitanand globally aware communities.
Five key areas for policymakersTourism must clearly be seen from the perspective ofthe broader economy.The framework focuses on fivekey areas to assist countries in developing a strategy that will maximize the value of the visitor economywithin this broader context: macro factors, internationalcompetition, market failures, policy barriers, and policyconsiderations.
Macro factorsThe economic impact of the visitor economy is prima-rily driven by tourist numbers and associated spending.These are likely to be influenced by a number of factors:
• The cost of visiting or remaining in a destination—for example, as determined by exchange rates—is akey influence on both domestic and internationaltravelers.
• Consumer spending is a main driver for bothdomestic and inbound tourism.
• The health of the domestic economy as measuredby the gross domestic product (GPD) is a maindeterminant of activity in the tourism industry.This is particularly relevant in relation to businesstravel spending.
• The “brand image” and attractiveness of a destina-tion, and the impact of any improvements made intourism policy and infrastructure, are a large part ofthe reason for the viability of the destination as atourism destination.This includes less tangibleaspects such as the cultural offerings, vitality, andvibe of a destination; the mix of visitor opportuni-ties, and the overall quality of the environment onoffer as a place to visit.This is likely to have a
70
1.5:
Cap
turin
g th
e Vi
sito
r Ec
onom
y: A
Fra
mew
ork
for
Succ
ess
Figure 4: The critical mass viability
Source: Deloitte analysis.
Corebusiness
Touristuse
Critical massgeneration
Tourist-specificbusiness
part1.r2 2/26/09 11:58 AM Page 70
The Travel & Tourism Competitiveness Report 2009 © 2009 World Economic Forum

medium- to long-term effect. (The Travel &Tourism Competitiveness Index discussed inChapter 1.1 offers the most useful indicator here.Although not designed as a measure of destinationattractiveness, there is a direct correlation betweenthis Index and visitor numbers).
• Consideration should also be given to investment in tourism infrastructure (e.g., hotels, airplanes,recreation sites) as well as public investment in areassupporting tourism (e.g., transport infrastructure).
The relationship between these macro factors iscomplex and interdependent. It is useful to distinguishbetween typically short- to medium-term drivers andlonger-term drivers of the visitor economy.
In the short to medium term, those drivers influ-encing demand are likely to dominate. Exchange ratefluctuations, consumer sentiment, and prospects for economic activity in the domestic market and the mainsource markets will drive outcomes for tourism.
In the longer term, the development of the tourismindustry largely depends on supply side factors such asthe effective delivery of infrastructure and the relativeattractiveness of the destination.These factors will alsoinfluence overall economic activity and GDP over thelong term.
The long-term drivers can be addressed throughpolicy interventions. However, short-term drivers—suchas cyclical fluctuations in output, consumer spending,and exchange rates—are less easy for policymakers toinfluence directly.
International competitionThe intensification of international competition throwsdown a challenge to all countries to sustain and enhancetheir status as tourism destinations.
Success is not always about increasing the volumeof visitors. In a country whose popular tourist venuesare close to capacity, the same number of visitors spend-ing more on a per capita basis may yield better overalloutcomes than more visitors spending the same amount.In other words, extracting higher value from existingvisitors and retaining it within the local economy isoften more important than pursuing absolute growth invisitor numbers.
Emerging markets such as the Gulf States andSingapore, as well as many traditional destinations suchas Greece and Turkey, are differentiating their productsand pursuing expansionary tourism policies. For eachindividual country there is a need to assess the positionof their visitor economy in terms of the wider policycontext.
As illustrated in Figure 5, investment in tourismremains strong and does not correlate with a country’scompetitive ranking. International benchmark compar-
isons of countries’ tourism offerings, government expen-diture on Travel & Tourism (T&T), and the size of theT&T sector highlight some key challenges with respectto the activities of other countries. Figures 5a and 5bshow the linkages (or otherwise) between these factors.
Figure 5a shows that there is a strong positive rela-tionship between the size of a country’s T&T industry(relative to GDP) and the relative expenditure by thatcountry’s government on T&T support (relative toGDP).The direction of causality is not clear: this couldbe a case either of governments backing winners or ofgovernments attempting to create winners. Figure 5bshows that the quality of the tourism offering (measuredby competitiveness rank) in a country is not particularlyrelated to the level of government expenditure, whichsuggests that this is related more closely to the endow-ment of visitor economy capital (not natural assets andlong-term investment) and that throwing expenditure ata country’s visitor economy offer does not necessarilyresult in relative success, particularly in the short term.
Market failuresIn many countries, tourism is a large industry with sig-nificant scope to grow further given appropriate levelsof investment. However, there are also a number of mar-ket failures in the sector that, if not addressed, couldprevent the visitor economy from optimizing its fullpotential (see Box 3).
71
1.5:
Cap
turin
g th
e Vi
sito
r Ec
onom
y: A
Fra
mew
ork
for
Succ
ess
Market failure occurs when a market, left to itself, does notallocate resources efficiently. Economists have identifiedfour main sorts or causes of market failure:
• market power,• lack of provision (public goods),• externalities, and• asymmetric information (uncertainty).*
Policy intervention occurs where market failure is deemedserious enough to warrant expenditure to improve (alloca-tive) efficiency. Thus, if the net benefits of intervention out-weigh the costs associated with market failure and costs ofintervention, there is a case for intervention.
*Adapted from economist.com.
Box 3: What is market failure?
part1.r2 2/26/09 11:58 AM Page 71
The Travel & Tourism Competitiveness Report 2009 © 2009 World Economic Forum

72
1.5:
Cap
turin
g th
e Vi
sito
r Ec
onom
y: A
Fra
mew
ork
for
Succ
ess
0 5 10 15 20 25 30 35 400
5
10
15
20
25
Dominican Republic
United States
IcelandJordan
Malta
Barbados
GambiaGreece
Hong Kong SAR
SingaporeIndonesia
Paraguay
NorwayGuyana Kenya
Switzerland
Burkina FasoUnited Arab Emirates
MontenegroMorocco
GermanyUnited Kingdom
FranceCanada China
New Zealand
TurkeyNigeria
Trinidad and Tobago
Cyprus
JamaicaMauritius
EstoniaEgyptSpain
Portugal
Figure 5: Relative government expenditure vs. visitor economy contribution and tourism offering, selected countries, 2008
a. Government expenditure vs. T&T percent of GDP
Tourism &Travel (percent of GDP)
Gov
ernm
ent b
udge
t ded
icat
ed to
tour
ism
(p
erce
nt to
tal)
140 120 100 80 60 40 20 0
0
5
10
15
20
25
Lesotho Zambia
Jamaica
Malta
United States
Italy
Dominican Republic
Malta
GreeceHong Kong SAR
Spain
Japan CanadaUnited Kingdom
FranceGermany
SwedenUnited Arab Emirates
SwitzerlandPortugalAustria
b. Government expenditure vs. TTCI competitiveness rank
Source: The Travel &Tourism Competitiveness Index 2009; World Travel & Tourism Council; Deloitte analysis.
TTCI rank (in reverse order)
Gov
ernm
ent b
udge
t ded
icat
ed to
tour
ism
(p
erce
nt to
tal)
part1.r2 2/26/09 11:58 AM Page 72
The Travel & Tourism Competitiveness Report 2009 © 2009 World Economic Forum

FreeridersThe freerider problem is a major market failure withinmany visitor economies. Because of the fragmentednature of the industry, marketing is often uncoordinatedand insufficient. Individual operators or groups of busi-nesses are unlikely to market a destination (country, city,or region) to international or domestic tourists. Manytourism providers also see themselves as being in directcompetition with their immediate neighbors rather thanwith other destinations and products (Box 4).
Information gapOther market failures occur when both consumers andbusinesses in the visitor economy suffer from informa-tion gaps (called asymmetries), and potential visitors (bothoverseas and domestic) do not have the relevant infor-mation to use in making their decisions.
Although information is unlikely to ever be perfect,there are significant failures where both consumers andbusinesses in the visitor economy suffer from informationgaps. From the business perspective, firms know whattheir offering is and how attractive it is for tourists.What they do not know is the tourist’s willingness tovisit and pay. Businesses are therefore operating in anenvironment where they have incomplete information.From the visitor perspective, tourists know broadlyabout a destination but have incomplete informationabout the range of offerings and why exactly theyshould visit a particular destination relative to competi-tor destinations.Therefore, without some degree ofinformation provision and coordination, bringing thetwo together is difficult; a failure exists as there is noincentive to provide information.
ExternalitiesThe visitor economy also generates positive and negativeexternalities (benefits and costs for those not directlyengaged in market-based tourist activity).
There are significant positive externalities arisingfrom the visitor economy—where other businesses andconsumers benefit from tourism activity. For instance,from a British residents perspective, the “critical mass”
provided by tourist expenditure leads to increasedleisure choice—for options such as theater, restaurants,and heritage.The positive externalities are the increasedchoice for domestic residents and preservation of theUnited Kingdom’s heritage.
The existence of positive externalities can lead totoo little of the good or service being produced, as thereis a lack of incentive for private-sector firms to producethese goods and services. Consequently, the lack ofincentives to invest in the activity without governmentsupport would lead to a level of provision that is belowthe optimal level for society.
However, there are also significant negative exter-nalities that are likely to exist.The first example is thatof congestion, particularly where transport infrastructureis unable to support the visitor traffic in popular destinations.
In addition, the activities in the visitor economycan generate negative externalities in the form of envi-ronmental costs (Box 5). For instance, open access tospaces can lead to both economic and environmentaloverexploitation of the natural environment.This can, inturn, affect the overall visitor economy because demandcan be affected by accommodation and environmentalquality.
The visitor economy gives rise to both positive andnegative externalities. Positive externalities exist whereother businesses and consumers benefit from tourismactivity. Negative externalities occur where other busi-nesses and consumers are adversely affected by tourism.
Skills gapThe skills gap is a further market failure.The provisionof skills in the hospitality industry is critical to the suc-cess of a competitive visitor economy. Large businessesprovide training for specialized skills, but the majority of
This form of market failure may have spatial dimensions. Thehoneypot effect sees tourists flocking to a limited number ofincreasingly congested destinations. Although in the shortterm this is beneficial for economic growth, it can createnegative externalities such as congestion and environmentalerosion.
It is uncertain how far demand can be distributed tocounter this honeypot effect. Tourists may not visit alterna-tive areas because of information failure, or because theytruly cannot compete with the attractions of the honeypotareas.
Box 5: The honeypot effect
“If the number of people willing to pay for a service is notenough to cover the cost of providing it, the service mightnot be produced at all or in sufficient quantity, even though itwould be beneficial for the economy as a whole to have it.” *
*Adapted from economist.com.
Box 4: The freerider problem
73
1.5:
Cap
turin
g th
e Vi
sito
r Ec
onom
y: A
Fra
mew
ork
for
Succ
ess
part1.r2 2/26/09 11:58 AM Page 73
The Travel & Tourism Competitiveness Report 2009 © 2009 World Economic Forum

small businesses in the sector are not able to support thedevelopment of necessary skills.
Because of labor mobility and the seasonality oftourism employment, businesses have few incentives toinvest in skills where employee turnover is high, andwhere skill development opportunities are a limited factor in decisions to leave employment.This is a keycontributor to the quality of a destination.
The above market failures are specific to the tourismsector and corrective policies need to be tailoredaccordingly. However, the required policy response tothese failures would include interventions across thepublic sector and would not be specific to the visitoreconomy alone.
Policy barriersPolicy barriers occur when policy interventions in eco-nomic spheres other than tourism impinge on outcomesin the visitor economy. For example, policies affectingthe capacity and quality of transport infrastructure,including airport, port, road, and rail networks as well asservice provision, have significant impacts on the visitoreconomy.
The cost and ease of accessing a destination havealso been identified as key barriers for international visitors to countries such as the United Kingdom, theUnited States, and the United Arab Emirates.International visits are, in effect,“pure exports” and rep-resent a substantial economic contribution to the host.Recent research has singled out taxes and visas as coststhat prevent higher levels of inbound tourism and limitthis contribution.
Environmental and climate change considerationsare now a major factor for providers and consumers oftourism services and thus for the sustainability of thevisitor economy.The tourism industry will have to workwithin the context of new climate change legislation,which will vary considerably across the globe.
The impact of environmental and climate changeconsiderations differ with different perspectives.Thisimpact could be considered positive (for example, anincreased number of people choosing local destinationsinstead of flying abroad), or the same impact could beconsidered negative (for example, a decline in foreignvisitors). It may also change the nature of the productbeing offered in response to consumer demand; exam-ples are more environmentally friendly tourism services.Whether such services can continue to command aprice premium in the face of challenging economic circumstances, however, remains to be seen.
Government policies in many countries often focuson higher productivity industries, and gross value added(GVA) growth targets create incentives for investment in more productive sectors.As a relatively low per-worker-productivity sector, the visitor economy hastended to receive lower priority in economic develop-ment than many other sectors.
Policy considerationsThe above policy areas are clearly driven by widersocioeconomic objectives and highlight the importanceof considering tourism within the wider context of theeconomy.Tourism implications should be factored intothe process of policy impact analysis before changes areimplemented in these areas.
A key consideration for the future is how countriescan retain and develop their individual visitoreconomies.Any policy agenda and intervention strategymust be informed by the key factors influencing visitorbehaviour. Figure 6 highlights some of the pre-trip andpost-trip factors that affect the decision making of visitors.
Effecting change: Leverage pointsWhen formulating policy, the most important factors toconsider are those that will have the most significant—and sustainable—impact on the future performance ofthe tourist sector. Figure 7 identifies those factors likelyto have the largest potential impact, balanced against thecapacity of stakeholders to influence them in the future.This enables policymakers to identify a number of keyleverage points, where their interventions are most likely to maximize the economic benefits of the visitoreconomy.
The two quadrants at the top of Figure 7 containfactors where the potential impact is likely to be high,while the quadrants on the right hand-side contain factors that have a higher potential to influence.
The initial policy focus should therefore be on factors in the top right-hand side quadrant, whichinclude the leverage points that may offer some quickwins for the tourism supply chain.
The factors in the top left-hand quadrant are harderfor stakeholders to influence. Nevertheless, these factorswill have a significant impact and they should be moni-tored by the tourism industry to ensure that it is able toadapt to future changes and respond as required.
Future agendaSome of the factors noted in this chapter are easier toinfluence through policy interventions than others.However, the following policy considerations should beat the heart of any future agenda for the development ofthe visitor economy:
Focus on volume, value, or bothA successful future for the visitor economy involves targeting both the volume and the value of visitors.
Targeting value will increase economic benefitswithout contributing to congestion in a crowded coun-try. However, it can be difficult to rely on artificial bar-riers in an attempt to discriminate against lower-valuetourists.There are also social equity implications whenapplying this to domestic visitors.
74
1.5:
Cap
turin
g th
e Vi
sito
r Ec
onom
y: A
Fra
mew
ork
for
Succ
ess
part1.r2 2/26/09 11:58 AM Page 74
The Travel & Tourism Competitiveness Report 2009 © 2009 World Economic Forum

75
1.5:
Cap
turin
g th
e Vi
sito
r Ec
onom
y: A
Fra
mew
ork
for
Succ
ess
Figure 6: Factors influencing visitor behavior
Source: Deloitte analysis.
PRE-TRIP FACTORS
• Perceptions about safety and security • Globalization• Capacity (airports, water, sanitation)• Marketing of country• Open Skies agreements
• Incomes• Inflation• Exchange rates• Migration • Taxation
• Socio-environmental awareness/consciousness • Family composition• Tastes—e.g., holiday type: historic vs. beach• Reputation for extreme weather—e.g., rain,
flooding, wildfires
• Internet• Low cost airlines • Digital information/mobile technology as a
substitute for business travel/online shopping• Natural environment/landscape
FACTOR POST-TRIP FACTORS
• Experience with safety and security• Taxation on goods and services
• Competitive prices for good and services• Impact of taxation• Impact of inflation
• Available choice of goods and services• General experience on trip—e.g., quality• Experience with weather/seasonality—
e.g., rain, flooding, wildfires• Culture clash/agreement
• Ease of travel during trip• Integrated systems—e.g., fast-tracking
POLITICAL
ECONOMIC
SOCIAL
INFRASTRUCTURE/ASSETS
Potential to influence
Pote
ntia
l im
pact
High
High Low
Low
Information provision
Globalization
Weather / seasonality
Quality
Alternatives (relative cost)
Alternatives (availability)
Access
Choice of goods and services
Security / safety
Incomes
Taxation
Tastes / attitudes
Adaptability
Population
Skills
Inflation
Place-making
Welcome
Landscape and environment
Infrastructure
Demographic factors
Destination attractiveness
Spending power
Investment
Relative cost
Figure 7: Tourism leverage points
Source: Deloitte analysis.
Note: Destination attractiveness is the relative attractiveness of a tourist destination
over time and attempts to quantify the impact of any improvements made inpolicy, tourism infrastructure, and so on.
Investment refers to tourism infrastructure (hotels, airplanes, recreation sites,etc.) as well as public investment in areas supporting tourism (e.g., transportinfrastructure) and the development of the tourism supply chain.
Relative cost is a key factor influencing decisions of both domestic and interna-tional travelers. The recent significant appreciation of the dollar is a clearexample of this at play.
Spending power is a significant driver of tourism amongst both domestic andsource market residents.
Demographic factors comprise overall population growth, the dynamics of spe-cific socioeconomic segments, and trends such as the aging of the popula-tion in many developed economies.
part1.r2 2/26/09 11:58 AM Page 75
The Travel & Tourism Competitiveness Report 2009 © 2009 World Economic Forum

If the supply is not constrained, then targeting volume may be the most effective method of drivingthe visitor economy. Prioritizing volume also meansmaximizing the chances that new markets will adoptsocial norms that would increase the likelihood of visitsto the country. It may also be possible to leapfrog thesenew target markets into a high-value category from thevery beginning. It is essential to recognize that a tippingpoint exists for any destination, where volume of visitorsdirectly and negatively affects the attractiveness of thedestination.
Targeting these early adapters from emergingeconomies may help to maximize those economies’future economic contribution, while also deliveringshorter-term volume.
Adapt to surviveGlobalization, climate change, and emerging markets(both as destinations and as export markets) offer majorchallenges to countries’ tourist industries.The scale andpace of change means that current contributions cannotbe assumed to be an accurate indicator of future contri-butions.The ability to adapt to these changes is critical.
Invest for long-term gainFactors that affect long-term productivity such as infra-structure, innovation, and skills will need to be majorpriorities for the sector. Higher skill levels in particularare associated with higher productivity and higher ratesof labor force utilization, leading to stronger economicoutcomes for the economy as a whole.
Enhance the tourism supply chainIn economies with underdeveloped tourism supplychains, policies that extend the domestic supply chainshould be adopted where feasible.
Focusing on the higher-value components of thesupply chain will significantly enhance the economicvalue of the visitor economy through reduced leakage.This should be high on the agenda for emergingeconomies, and it highlights the importance of consid-ering the impact of tourism within the context of thewider society.
Coordinate policiesJoined-up thinking and coordinated action are keys topromoting all of the above aims.The use of such a connected approach to policymaking also applies to the structures that coordinate the activities of industryoperators.
True valueIn these turbulent economic times, the focus should beon longer-term, supply-oriented strategies over whichpolicymakers can exert greater influence and realizelong-term value.Visitor economies demonstrating
adaptability, developing deeper domestic tourism supplychains, and focusing on higher-value quality and skillinvestments while building diversity into the destinationwill benefit the most.
Capturing the visitor economy takes time.Policymakers should not lose sight of their long-termfocus in this challenging economic climate but shouldbring greater resolve to bear on the task ahead.Ultimately true value is sustainable value.
Notes1 OECD 2008.
2 UNWTO.2008.
3 There is no official definition for the visitor economy, althoughthere are a number of sectors that are directly related to it butclassified separately in statistical definitions. Estimates presentedare based on an extension of the methodology used under theUnited Nations World Tourism Organization (UNWTO) TourismSatellite Accounts (TSA) definition, which includes governmentspending related to tourism. For comparative purposes, calcula-tions made using the definition of tourism adopted by theUNWTO’s TSA valued the industry at 3.4 percent of the UnitedKingdom’s gross domestic product (GDP) in 2007.
ReferencesDeloitte. 2008. The Economic Case for the Visitor Economy. Final
Report. September. London: Deloitte, for VisitBritain.
OECD (Organisation for Economic Co-operation and Development).2008. “Opening Up Trade in Services: Key for Tourism Growth.”Policy Brief, February. Paris: OECD.
UNWTO (United Nations World Tourism Organization). 2008. UNWTOWorld Tourism Barometer, October. Madrid: UNWTO.
76
1.5:
Cap
turin
g th
e Vi
sito
r Ec
onom
y: A
Fra
mew
ork
for
Succ
ess
part1.r2 2/26/09 11:58 AM Page 76
The Travel & Tourism Competitiveness Report 2009 © 2009 World Economic Forum

CHAPTER 1.6
Tourism Price CompetitivenessPETER FORSYTH, Monash University
LARRY DWYER, Australian School of Business, University of
New South Wales
Price competitiveness is an essential component in theoverall tourism competitiveness of a country or a desti-nation.There is widely accepted evidence that prices areone of the most important factors in decisions aboutwhether, and where, to undertake trips.This is reflectedin the Travel &Tourism Competitiveness Index (TTCI),where, in pillar 10, price competitiveness is assessedusing four sets of hard data—on ticket taxes and airportcharges (indicator 10.01), national purchasing powerparity prices (10.03), fuel price levels (10.04), and thehotel price index (10.05).
Not surprisingly given its importance, many havedeveloped or used indicators of tourism price competi-tiveness.These indicators vary considerably. It is possibleto find indicators based on detailed prices that touristspay in different countries, along with some highlyaggregated and proxy measures. Different indicators shedlight on different aspects of competitiveness, and themeasures that are most useful for a purpose depend onwhat questions are being explored.
Some of the key aspects that affect which indicatorsshould be used are:
• The need for accuracy and tourism-specific detailversus timeliness. More detailed and accurate meas-ures involve more data collection and processing,and thus they take longer to produce. If timelinessis of essence, it may be necessary to rely on broaderproxies that can be obtained readily for price com-petitiveness.
• The need for cross-country (or cross-destination)comparisons of the prices tourists are actually paying. If cross-country comparisons of tourismcompetitiveness at a particular point of time arerequired, it is necessary to obtain data on the pricesof tourism goods and services in different countries.There are relatively few sources of these data, andthey tend to appear with a lag.
• The need for estimates of changes in relative pricecompetitiveness over time. For some purposes, onlythe change in relative price competitiveness ofcountries is needed. If so, changes in the patterns ofcompetitiveness can be estimated using pricechange data (often obtained from countries’ con-sumer price index, or CPI, statistics) and exchangerate data.These are much more easily obtained thanactual cross-country price comparisons.
• The need to provide overall summary measures of acountry’s price competitiveness at a point of timeor changes in it over time. It may be useful to havesummary measures that can tell whether, overall, acountry’s price competitiveness in tourism has risen
77
1.6:
Tou
rism
Pric
e Co
mpe
titiv
enes
s
part1.r2 2/26/09 11:58 AM Page 77
The Travel & Tourism Competitiveness Report 2009 © 2009 World Economic Forum

or fallen. Such measures require that the detailedmeasures of price competitiveness be aggregated insome way.
Measures of tourism price competitiveness of coun-tries or specific destinations (such as individual regionsor cities) form part of more general work on destinationcompetitiveness. Destination competitiveness is a generalconcept that encompasses price differentials coupled withexchange rate movements, productivity levels of variouscomponents of the tourist industry, and qualitative factorsaffecting the attractiveness or otherwise of a destination.The development of the TTCI allows tourism stake-holders in both the private and public sector to identifykey strengths and weaknesses of their destination fromthe visitor perspective, highlight opportunities fortourism development, and develop strategies to counterpossible threats to future visitation.The focus of thisreview is country or destination price competitiveness.
In this chapter we outline a range of tourism pricecompetitiveness indicators that have been developed andused. Some are more useful and valuable than others; allhave their advantages and disadvantages.We begin bymotivating the review with a discussion of the impor-tance of price as a factor determining competitiveness.We then explore some comprehensive measures ofcross-country price competitiveness.After this, we notesome measures that can be used for examining changesin patterns of competitiveness over time, and in patternsof competitiveness in specific sectors. Next we outlinesome summary measures that can be used to track acountry’s or sector’s competitiveness over time.Thedeterminants of price competitiveness are then brieflyreviewed, and its effects on government policy andmacroeconomic conditions are briefly discussed.Weconclude by putting the measures into perspective witha review of the properties and potential uses of the dif-ferent measures.
The importance of price competitivenessIn their destination choice decision, tourists consider theprice (cost of living) at the destination relative to thecosts of living at the origin and substitute destinations.Thus, two types of prices have to be considered in esti-mating the price competitiveness of a destination.Thefirst one is relative price between the receiving and theorigin country; the second is relative price between dif-ferent competing destinations, which generates the sub-stitution price effect.
Tourists incur costs within the destination that theyvisit that include accommodation, food, tours, and shop-ping.They compare prices at the destination with thosein their home country or region, deciding whether ornot to visit that destination depending on the relativecosts of living between the two areas.Although prices do
change between cities and regions within a country, theydiffer more obviously and markedly between countries.
Tourism demand is relatively responsive to pricefactors.1 Several other research findings are of interest.One is that price elasticity varies as a function of thecountry of origin and the destination.The residents oflarge countries, offering a wider diversity of travel expe-riences within their own borders, are likely to be moreprice sensitive in their international travel behavior thantourists from geographically small countries whosechoice is much more limited.2 The rarer the qualities ofthe destination, the less price elastic is its demand.3 Alower price elasticity is to be expected also for more dif-ferentiated destinations.4 It also appears that tourists havebecome less price sensitive over time.This may be aresult of an increased emphasis on destination differenti-ation strategies.5 Destinations that compete closely withothers, however, are associated with higher price elastici-ties of tourism demand.6
The relative price variable that is normally used inthe demand for tourism function is the ratio of the con-sumer price indexes between the receiving and the ori-gin countries, adjusted by the bilateral exchange rate.Ahigher exchange rate in favor of the origin country’scurrency can result in more tourists visiting the destina-tion from the origin country.When the exchangerate–adjusted CPI ratio is used to measure the changesin relative prices of goods and services in the destina-tion, the impacts of inflation and exchange rate move-ments are measured through one “relative price” vari-able, referred to as the real exchange rate.7 It has beenargued, however, that tourists are reasonably wellinformed of changes in exchange rates, whereas infor-mation on price levels and price changes in destinationsis generally not known in advance.8 With imperfectknowledge, tourists may respond to exchange ratemovements but not to changes in relative inflation rateswhen they make their decision to travel.Thus, exchangerates are sometimes introduced into tourism demandmodels in addition to, and separately from, the relativeprice variable. Since the exchange rate is most importantin costing tours and accommodation, and is a maincomponent of price fluctuations, it may be an importantproxy for the relative price of tourism in smaller openeconomies with floating exchange rates.9 Note that thisinvolves a measure of changes in price competitiveness,but it does not measure the actual level of price competi-tiveness.
The impact of competing destinations has a positiveinfluence on the demand for international tourism,meaning that a rise in price to one destination willboost visitor numbers to substitute destinations.10
Tourists may consider a range of competing destinationsbefore choosing any particular one.They may comparethe cost of living in the choice destination with thecosts of living in the competing destinations. Some des-tinations may be complements rather than substitutes,
78
1.6:
Tou
rism
Pric
e Co
mpe
titiv
enes
s
part1.r2 2/26/09 11:58 AM Page 78
The Travel & Tourism Competitiveness Report 2009 © 2009 World Economic Forum
and so may gain visitors if the cost of living in the otherdestination is low.
Researchers model this consumer thinking in eitherof two ways. One way to allow for the substitutionbetween the destination and, separately, a number ofpossible competing destinations is to specify the tourists’cost of a visit variable in the form of the possible desti-nation value relative to the origin value.11 This allowsfor substitution between tourist visits to the foreign des-tination under consideration and domestic tourism,therein acknowledging that domestic tourism is themost important substitute for foreign tourism.
The other way is to calculate the cost of a visit atany substitute destination relative to a weighted averagecost of visits in the different competing destinations,adjusted by the relevant exchange rates.The weightassigned reflects the relative market share (arrivals orexpenditures) in each competing destination.Thisapproach allows for the impact of price changes in com-peting foreign destinations.This is the approach usedmore often in empirical studies, as fewer variables areincorporated into the model, and therefore more degreesof freedom are available for the model estimation.12
Whatever method is adopted, the problem remainsthat the CPI is an imperfect measure of the changes inprices faced by tourists. Existing studies use too aggrega-tive a measure, whereas a more disaggregative measure isrequired.We must therefore consider what an ideal pricecompetitiveness measure might look like.
Comprehensive tourism price competitiveness measuresIt is useful to start by setting out what the most com-prehensive and detailed indicator of tourism price com-petitiveness would involve, and then to examine actualindicators in the light of such a measure or group ofmeasures. For a given origin country, the ideal indicatorwould show just how much a trip to a range of differentdestination countries would cost in the origin country’scurrency. Ideally, the cost of the trip would include boththe travel costs, such as airfare, and the various elementsof the ground component.This type of competitivenessindicator could be calculated for different countries at apoint of time, and also for the same countries over time.Thus, a “typical” trip from the United States might costUS$4,000 to Japan and US$2,000 to Thailand at a pointof time—clearly,Thailand is more price competitivethan Japan for US tourists. Five years later, the cost ofthe same trip might have changed to be US$4,500 toJapan and US$3,000 to Thailand—while Thailand is stillmore competitive than Japan, its relative competitivenesshas slumped.
Any index or indicator essentially involves two ele-ments: the basic price data and a weighting structure.
Conceptually, price data do not pose many prob-lems.What we would like is information on the pricesactually paid by tourists for the goods and services they
buy. Cross-country price data were originally difficult tocome by, but in recent years, comprehensive data sourceshave become available. In particular, there is the WorldBank International Comparison Program, (ICP), whichcollects the prices of a comprehensive range of com-modities for most developed and many developingcountries for various selected base years.13 This informa-tion is used, among other things, for the estimation ofpurchasing power parity (PPP) exchange rates, such asthat used in the TTCI.Thus, the price paid for a unit offood or motor fuel in different countries is collected,and thus it is possible to determine how much a bundleof goods and services will cost in each country, convert-ed to the currency of a base country, such as the USdollar. One limitation of the data for our purposes isthat the prices collected may not be the same as thosepaid by tourists—thus the price of accommodation totourists (who may use higher-quality accommodationthan local residents) may not be accurately captured bythe ICP data.This could be more of a limitation withdeveloping countries. Nevertheless, the ICP provides avery extensive and useful data source on prices indiffer-ent countries.
The ICP produces data only for selected base years.However, it is possible to update the data and produceestimates of prices in non base years, if price changedata are available for a country. For most developedcountries, CPI data are produced for a detailed range ofcommodities. Using the CPI, it is possible to estimateprices to be used in competitiveness indicators for nonbase years and to update competitiveness indicators toalmost the present time.
The weighting problem is more difficult, both con-ceptually and from the practical perspective of obtainingdata.The weights for an indicator of competitivenesswill be based on tourists’ patterns of expenditure.Thesediffer markedly from origin to origin and from type oftourist to type of tourist.There is no single tourismproduct the price of which can be compared fromcountry to country, or over time.The patterns of spend-ing of a US visitor to any country or destination willdiffer from those of Japanese visitors. Further, the pat-terns of spending of a US visitor may be different inThailand than in Japan.A Swiss traveler to France maysee the sights of Paris, while a Swiss visitor to Australiamay be a backpacker, with a very different pattern ofspending. Indicators of competitiveness need to reflectthis—for example, different indicators might be devel-oped for different origins or types of visitor. Given theheterogeneous nature of tourism, it is not possible todevelop some general overall measure of competitivenessthat is accurate for all purposes.
Another limitation is that data on tourists’ expendi-ture patterns are available in detail only for a few coun-tries. Some countries collect detailed information on aregular basis about how much, and on what, their inboundtourists spend. However, most countries do not collect
79
1.6:
Tou
rism
Pric
e Co
mpe
titiv
enes
s
part1.r2 2/26/09 11:58 AM Page 79
The Travel & Tourism Competitiveness Report 2009 © 2009 World Economic Forum
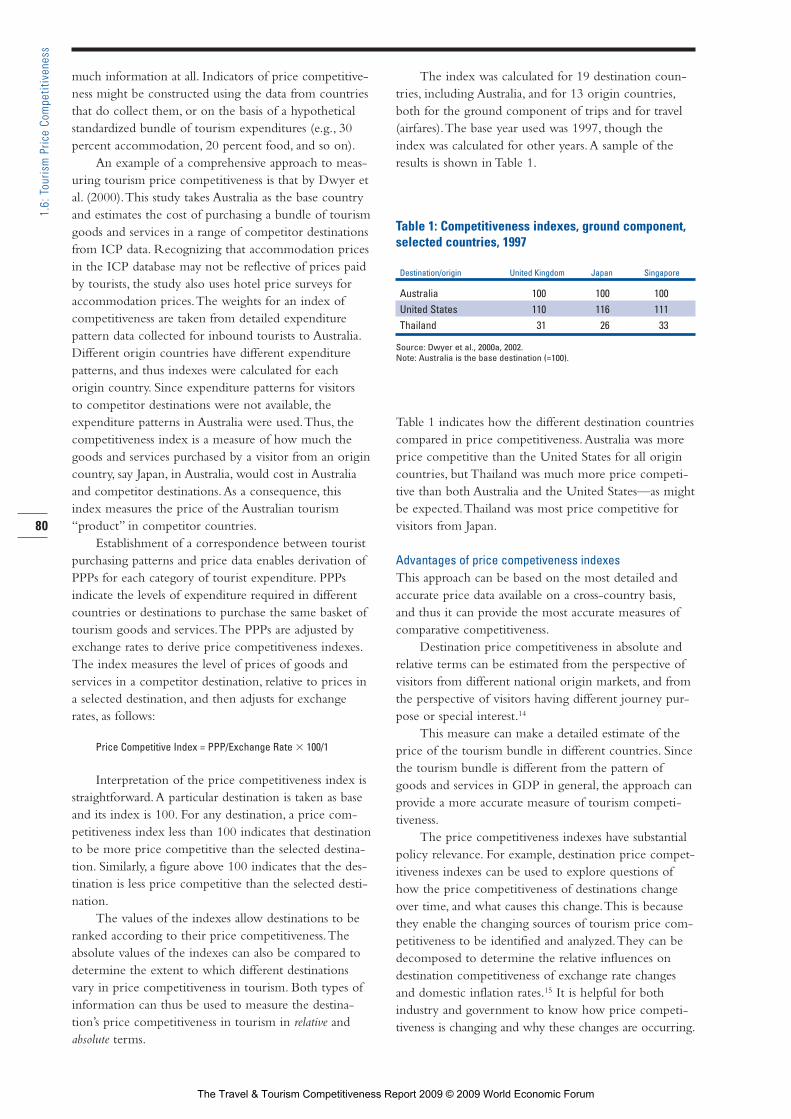
much information at all. Indicators of price competitive-ness might be constructed using the data from countriesthat do collect them, or on the basis of a hypotheticalstandardized bundle of tourism expenditures (e.g., 30percent accommodation, 20 percent food, and so on).
An example of a comprehensive approach to meas-uring tourism price competitiveness is that by Dwyer etal. (2000).This study takes Australia as the base countryand estimates the cost of purchasing a bundle of tourismgoods and services in a range of competitor destinationsfrom ICP data. Recognizing that accommodation pricesin the ICP database may not be reflective of prices paidby tourists, the study also uses hotel price surveys foraccommodation prices.The weights for an index ofcompetitiveness are taken from detailed expenditure pattern data collected for inbound tourists to Australia.Different origin countries have different expenditurepatterns, and thus indexes were calculated for each origin country. Since expenditure patterns for visitors to competitor destinations were not available, theexpenditure patterns in Australia were used.Thus, thecompetitiveness index is a measure of how much thegoods and services purchased by a visitor from an origincountry, say Japan, in Australia, would cost in Australiaand competitor destinations.As a consequence, thisindex measures the price of the Australian tourism“product” in competitor countries.
Establishment of a correspondence between touristpurchasing patterns and price data enables derivation ofPPPs for each category of tourist expenditure. PPPsindicate the levels of expenditure required in differentcountries or destinations to purchase the same basket oftourism goods and services.The PPPs are adjusted byexchange rates to derive price competitiveness indexes.The index measures the level of prices of goods andservices in a competitor destination, relative to prices ina selected destination, and then adjusts for exchangerates, as follows:
Price Competitive Index = PPP/Exchange Rate � 100/1
Interpretation of the price competitiveness index isstraightforward.A particular destination is taken as baseand its index is 100. For any destination, a price com-petitiveness index less than 100 indicates that destinationto be more price competitive than the selected destina-tion. Similarly, a figure above 100 indicates that the des-tination is less price competitive than the selected desti-nation.
The values of the indexes allow destinations to beranked according to their price competitiveness.Theabsolute values of the indexes can also be compared todetermine the extent to which different destinationsvary in price competitiveness in tourism. Both types ofinformation can thus be used to measure the destina-tion’s price competitiveness in tourism in relative andabsolute terms.
The index was calculated for 19 destination coun-tries, including Australia, and for 13 origin countries,both for the ground component of trips and for travel(airfares).The base year used was 1997, though theindex was calculated for other years.A sample of theresults is shown in Table 1.
Table 1: Competitiveness indexes, ground component,selected countries, 1997
Destination/origin United Kingdom Japan Singapore
Australia 100 100 100United States 110 116 111Thailand 31 26 33
Source: Dwyer et al., 2000a, 2002.Note: Australia is the base destination (=100).
Table 1 indicates how the different destination countriescompared in price competitiveness.Australia was moreprice competitive than the United States for all origincountries, but Thailand was much more price competi-tive than both Australia and the United States—as mightbe expected.Thailand was most price competitive forvisitors from Japan.
Advantages of price competiveness indexesThis approach can be based on the most detailed andaccurate price data available on a cross-country basis,and thus it can provide the most accurate measures ofcomparative competitiveness.
Destination price competitiveness in absolute andrelative terms can be estimated from the perspective ofvisitors from different national origin markets, and fromthe perspective of visitors having different journey pur-pose or special interest.14
This measure can make a detailed estimate of theprice of the tourism bundle in different countries. Sincethe tourism bundle is different from the pattern ofgoods and services in GDP in general, the approach canprovide a more accurate measure of tourism competi-tiveness.
The price competitiveness indexes have substantialpolicy relevance. For example, destination price compet-itiveness indexes can be used to explore questions ofhow the price competitiveness of destinations changeover time, and what causes this change.This is becausethey enable the changing sources of tourism price com-petitiveness to be identified and analyzed.They can bedecomposed to determine the relative influences ondestination competitiveness of exchange rate changesand domestic inflation rates.15 It is helpful for bothindustry and government to know how price competi-tiveness is changing and why these changes are occurring.
80
1.6:
Tou
rism
Pric
e Co
mpe
titiv
enes
s
part1.r2 2/26/09 11:58 AM Page 80
The Travel & Tourism Competitiveness Report 2009 © 2009 World Economic Forum

Industry stakeholders can employ these results tohelp assess the impacts of alternative government policieson destination price competitiveness—for example,impacts of tourist taxes or climate change adaptation poli-cies on the prices of tourism-related goods and services.
The price competitiveness indexes also have partic-ular relevance for destination marketing.They indicatethat a destination may be price competitive from theperspective of some tourists but not for others, depend-ing on the purpose of the visit and associated purchasingpatterns.
Disadvantages of price competitiveness indexesThe data requirements of this approach are extensive.Destinations vary considerably in the comprehensivenessand accuracy of the visitor expenditure data that theycollect.The more comprehensive the visitor expendituredata, the more detailed and accurate the price competi-tiveness indexes that can be constructed for that destina-tion.Very few countries publish detailed tourism expen-diture data.
Where the data used are economy-wide data, theremay well be significant variations in tourism pricesacross regions within a country. For example, the pricescharged to tourists in Bali may differ substantially fromthose charged elsewhere in Indonesia, or prices alongthe coast may vary from those of another destinationthat is located inland. But all aggregate, economy-widestatistics have this problem.The methodology for con-structing price competitiveness indexes allows suchindexes to be completed for different regions within atourist destination.
There is no single, all-encompassing measure oftourism price competitiveness—however, this reflects thereality that the tourism product is quite heterogeneous.
Time series and sectoral price competitiveness
Changes in competitiveness-CPI measuresThe majority of researchers have used CPI as a measureof the change in destination price competitiveness.16
The two limitations of this measures are that it is exces-sively aggregate (and need not reflect the prices thattourists pay), and that it can capture only changes inprice levels, not the levels themselves.
On the first point, this price competitiveness meas-ure, however, is only as good as its implicit assumptionthat the goods and services purchased by tourists aresimilar to those purchased by the representative house-hold on which the CPI is constructed. However, theCPIs of the origin country and the destination may notreflect the prices of goods that tourists actually purchase,because the expenditure pattern of a tourist is quite dif-ferent from that of the average household.17 Indeed, thebasket of goods and services included in the priceindexes of a given country could differ significantlyfrom the one consumed by its short-term tourists.
Another assumption underlying the use of the CPI isthat prices of tourism goods and services tend to movein the same direction as overall consumer prices.However, as Divisekera (2003) points out, trends in gen-eral price levels as implied by CPI measures may notnecessarily coincide with that of tourism. Moreover,there is no uniformity among countries in the coverage,weights, and/or the components included in the rele-vant price indexes, depending as they do on the particu-lar socioeconomic characteristics and consumptionhabits of the residents of the destination in question.
The second limitation is that CPI statistics provideno information on the levels of prices in a differentcountry or destination—it is not possible to use them todetermine whether a country is more or less price com-petitive than another.
While the CPI can serve as a proxy for the changein cost of tourism at a destination, given the lack ofmore suitable data, it would be more appropriate to usedata relating to the price of the basket of goods andservices that tourists actually purchase if these are available.
Price indexes of tourism bundlesA preferable measure of destination price competitive-ness involves estimating the costs of the specific goodsand services that tourists purchase.As Lim (2006) notes,since there are likely to be substantial measurementerrors associated with the use of the CPI as a proxy forrelative tourism prices, some researchers have preferredto use a specific tourist cost-of-living variable—such asdrink and tobacco price indexes; shopping/meals/enter-tainment and hotel price indexes; or weighted prices offood, accommodation, transport, entertainment, andother variables—as proxies, or the average spending ontravel goods and services as the composite tourismprice. Kwack (1972) and Kliman (1981) use the implicitconsumer expenditure deflator to measure the disparitybetween the origin, destination, and competing destina-tions’ prices.
Although the tourism price index approach ispreferable to the use of the CPI, in that it more accu-rately reflects the ways tourism prices are changing, itstill faces that limitation that it can be used to measureonly changes in price competitiveness between differentcountries or destinations over time, and cannot measurewhether prices in one country are higher or lower thanin another country.This limitation can be addressedusing comprehensive tourism price competitivenessindexes, as described above, or by using various proxymeasures.
Package tour price studiesThe costs of package tours have been used in somestudies as proxies for tourism prices.18 This does, howev-er, involve a major data-gathering exercise, since pricesare not readily obtainable from comprehensive sources.
81
1.6:
Tou
rism
Pric
e Co
mpe
titiv
enes
s
part1.r2 2/26/09 11:58 AM Page 81
The Travel & Tourism Competitiveness Report 2009 © 2009 World Economic Forum

Rather, they must be obtained from brochures andadvertisements for tours. Once collated, it must be rec-ognized that package tours are not a standardized prod-uct—they differ in duration, accommodation standard,tours included, and amount of internal travel.Withinformation about the costs of package tours, it wouldbe possible to regress price on these factors and estimatethe price of a standardized package.
It is also possible to use a synthetic approach, usingactual price data (e.g., from the ICP) to estimate howmuch a package tourist of particular characteristicswould cost in different countries.19 In Dwyer et al.(2000c), the authors used a “bottom up” approach,which involved getting information about the costshares of the various components that make up a tourpackage.
Big Mac IndexThe most frequently quoted index of price competitive-ness of different countries is the “Big Mac Index.” TheEconomist magazine regularly publishes the price of “BigMac” hamburgers in about 60 different countries.Theseprices are converted into a single currency and give anindication of the cost of buying a standardized productin different countries.
It is tempting to read more into the Big Mac Indexthan there is really there—to see it as an indicator of thegeneral price competitiveness of the country. In fact, thisindex tells us little more than the price of a particularbrand of hamburger in the different countries.The BigMac is a simple product with ingredients in fixed pro-portions, whereas the tourism product is a very complexone comprising different components depending ontourist expenditure patterns.There is no equivalenttourism product offered across countries, as the natureof the product is tailored to the origin market, expendi-ture levels, and the length of the trip involved.The keyissue is that of how to standardize the products beingcompared so as to determine their relative price com-petitiveness.
Purchasing power parityAnother indicator of relativities in general prices acrosscountries (which is used in the TTCI) is the ratio of thePPP conversion factor to the official exchange rate.Thesimplest way to calculate PPP between two countries isto compare the price of a “standard” good that is, infact, identical across countries. If a “representative” con-sumption basket costs US$1,200 in the United Statesand £800 in the United Kingdom, the PPP exchangerate would be US$1.50/£1. If the actual nominal ratewas US$1.80/£1, this would indicate that the pound isovervalued by 20 percent, or, equivalently, the dollar isundervalued by 16.7 percent. PPPs can be used to esti-mate the amount of adjustment needed on theexchange rate between countries in order for theexchange to be equivalent to each currency’s purchas-
ing power. In other words, it provides a measure of theoverall price level in different countries.
The purchasing power parity theory of exchangerates is based on the assumption that, in ideally efficientmarkets, identical goods should have only one price. Inthe absence of transportation and other transactioncosts, competitive markets will equalize the price of anidentical good in two countries when the prices areexpressed in the same currency.The main reasons thatdifferent measures do not perfectly reflect destinationprice competitiveness are that PPP numbers can varywith the specific basket of goods used, making it arough estimate. One of the key problems is that peoplein different countries consume very different sets ofgoods and services, making it difficult to compare thepurchasing power between countries.Also differences inthe quality of goods between countries are not suffi-ciently reflected in PPP measures.
Sectoral price indicatorsIt is feasible to collect price data across countries forspecific sectors that are important for tourism, such asfuel for transport and hotel prices.These data can beuseful directly, and they can be used to adapt more gen-eral indicators, such as PPP measures, to make themmore relevant for tourism. General price competitive-ness indexes, such as those described above in the sec-tion on comprehensive tourism price competitivenessmeasures, can be disaggregated in respect of key tourismproducts and services so as to provide information on adestination’s price competitiveness in different sectors ofits tourism industry.This is to recognize that a tourismdestination’s overall price competitiveness depends onthe price competitiveness of each of the sectors thatdeliver goods and services to visitors (accommodation,entertainment, conventions, and so on).These subindex-es can provide the basis for tourist industry policy toenhance destination price competitiveness through stud-ies of the productivity and efficiency of differenttourism industry sectors.20
Two useful sectoral price indicators involve fuelprices and hotel prices.
Fuel price levelsFuel prices impact the price of transport, which is amajor component of tourism expenditure.They alsoaffect general price levels of all other goods and servicesin an economy. Fuel prices are readily available fromgeneral world statistical sources, such as the World BankWorld Development Indicators (various years).
Hotel price indexGiven that accommodation is a very important compo-nent of tourism expenditure, it is necessary to compileaccommodation prices from sources in the touristindustry to enable greater accuracy in estimating desti-nation price competitiveness.Average room rates can
82
1.6:
Tou
rism
Pric
e Co
mpe
titiv
enes
s
part1.r2 2/26/09 11:58 AM Page 82
The Travel & Tourism Competitiveness Report 2009 © 2009 World Economic Forum

serve as a useful guide to accommodation price relativi-ties and are likely to be more accurate the ICP pricerelativities for accommodation.This index measures theaverage room rates calculated for first-class brandedhotels in each country.
There are a number of issues that make the collec-tion of accommodation prices very challenging. Dataused are economy-wide data, and there are significantvariations in tourism prices across countries.Thus, hotelprices in Marseilles differ from hotel prices in Paris. It isnot the case that rates for every hotel in every region inThailand are lower than for every hotel in every regionin Australia. Nevertheless, rates in Thailand are, on aver-age, lower than in Australia (and for similar types ofaccommodation,Thai rates will be lower than Australianones).All aggregate, economy-wide statistics have thisproblem. Other key stumbling blocks include: differenthotels use different grading systems in different coun-tries; prices paid for hotel rooms vary depending uponthe country of purchase; prices paid vary dependingupon the classification of the booking (group, corporate,individual, etc.); prices obtained vary depending uponwhich booking source is used (e.g., ComputerReservations Systems, Dawsons, Internet, via Airline ordirect); prices vary depending upon seasonal factors bothfrom the perspective of the hotel’s season and the seasonof the origin market; although negotiated rates may bethe same, different bonus systems may apply; and differ-ent rooms attract different rates (e.g., rates depend uponsize, view, etc).
Overall measures of changes in price competitivenessWhat is often needed is a simpler—and easier andquicker to calculate—measure of how changes inexchange rates are impacting a country’s overall tourismprice competitiveness.
Tourism Trade Weighted Index (TTWI)The best known international measure of the competi-tiveness of a country’s industries is the trade weightedindex of exchange rates (TWI).The TWI is a generalindex of the competitiveness of the country, weightingdifferent countries’ exchange rates according to theirrelative importance in trade, both in terms of exportsand imports.This index uses data on a large number ofexchange rates (and for real TWIs, price changes) andaggregates them into a single indicator of a country’scompetitiveness position.A simple and easy way toupdate measure of a country’s tourism competitivenesscan be obtained by developing a tourism-specific TWI:the Tourism Trade Weighted Index (TTWI).The TTWIis an index of exchange rates with the weights deter-mined by the importance of the different countries intourism inbound and outbound expenditures.
The TTWI can be calculated for inbound and out-bound tourism, and an overall index can be calculatedreflecting both directions of tourism.
• The Inbound TTWI consists of exchange rates forthose countries or currency areas, representing themain sources of visitors to a destination, weightedby the total expenditure in that destination fromeach of the source countries.
• The Outbound TTWI reflects patterns of expendi-ture by a country’s outbound travelers in differentdestinations.
• The Overall TTWI averages these two, but it doesnot provide as much information as the separateinbound and outbound TTWI.
The TTWI is similar in structure to the TWI, which is areadily available and well-understood indicator of thetrading position of a country. It is a simple, aggregatemeasure of the change in the home country’s generalprice level relative to those in a group of source coun-tries or destination countries.The TTWI can be calcu-lated in either real or nominal terms, just as the standardTWI can.As an indicator of how a country compares inprice terms with its source or destination markets, a realTTWI will be more useful since it provides policymak-ers with an ongoing monitor of the home country’sprice competitiveness.
The authors have developed a TTWI for Australiacovering the years 1990–2004.Table 2 contains estimatesfor selected years.
Table 2: Nominal and real Tourism Trade WeightedIndexes of exchange rates for Australia, selected periods 2000–08
Nominal TTWI Real TTWI
Period Inbound Outbound Inbound Outbound
2000 (June) 111.814 115.550 106.325 103.7822005 (December) 128.086 132.102 129.325 119.2682006 (December) 130.607 132.821 134.397 121.2802007 (December) 139.483 143.109 142.392 127.9932008 (March) 140.031 153.657 142.493 129.8032008 (June) 149.151 133.853 154.401 141.2752008 (September) 130.303 123.798 135.515 124.2522008 (December) 116.598 126.778 118.122 111.942
Source: Author estimates.Note: 1995 = 100.00; December 2008 figures are preliminary.
Interpretation of the TTWI is straightforward.TheTTWI is a weighted average of exchange rates. If theinbound TTWI increases by 10 percent, this means thatprices in the home country have risen by 10 percent
83
1.6:
Tou
rism
Pric
e Co
mpe
titiv
enes
s
part1.r2 2/26/09 11:59 AM Page 83
The Travel & Tourism Competitiveness Report 2009 © 2009 World Economic Forum

relative to those of a weighted average of source countryprices. On average, the home country has become 10percent more expensive to visit.To this extent, theTTWI, and especially the real TTWI, is a measure ofcompetitiveness in tourism markets.
When the inbound TTWI rises, this can be taken asa leading indicator of a fall in inbound tourism.Whenthe outbound TTWI increases, the cost of overseas travelfalls and more residents of a country will make overseastrips; these overseas trips are made to some extent at theexpense of domestic tourism.As Table 2 indicates, boththe nominal and real TTWI for inbound travel rosefrom June 2005 until the first quarter of 2008.The risein the TTWI indicates a significant loss in competitive-ness by the Australian tourism industry.This was verymuch associated with the appreciation of the Australiandollar, particularly relative to the US dollar. In the thirdand fourth quarters of 2008, the TTWI fell substantially.This was associated with a dramatic fall in the value ofthe Australian dollar, particularly against the US dollar.This indicates a substantial gain in the competitivenessof Australian tourism. In real terms, the cost of visitingAustralia, excluding airfares, fell by 21.8 percent overthis period. During the same six-month period in late2008, the real outbound TTWI fell by 20.8 percent,indicating the increased competitiveness of an overseasholiday for residents compared with a domestic tourismexperience.
The TTWI indicates that, during the period investi-gated,Australia lost and then regained its price competi-tiveness as a tourism destination, while outboundtourism also lost and then rapidly regained its competi-tiveness relative to domestic tourism.
One of the key properties of the TTWI is that itcan be calculated very quickly—in fact, almost instanta-neously for the nominal index.The real index dependson data on prices that are only published with a lag, butgood estimates of price indexes can be projected for aquarter or two using recent inflation rates.The result isthat the TTWI provides an up-to-the-minute summarymeasure of the international competitive position of acountry’s tourism industry.
The TWI is normally quoted only in nominalterms—an advantage of the TTWI is that the moreaccurate real TTWI can be calculated very easily.TheTTWI can be calculated both on a nominal basis andon a real basis—the latter allows for different price risesin different countries, and is to be preferred as a meas-ure of the underlying change in the international priceof a destination.
Aviation Trade Weighted Index (ATWI)The authors have developed an Aviation Trade WeightedIndex of exchange rates (ATWI).21 The ATWI seeks toprovide an indicator of the change in the internationalcompetitive pressure on a country’s aviation sectorresulting from exchange rate changes. It weights differ-
ent currencies according to how important differentcountries’ airlines are as competitors in markets operatedin by home country airlines.
The ATWI is a measure of the changes in relativecost competitiveness that come about as a result ofchanges in nominal and real exchange rates.A rise inthe exchange rate will make the airlines less cost com-petitive—if their competitiveness position is to berestored, they will have to improve their efficiency orlower the input cost they face (perhaps by sourcinginputs offshore).
The authors have developed an ATWI for Australiacovering the years 1990–2008.Table 3 contains estimatesfor selected quarters in selected years, providing a meas-ure of how the real exchange rates of Australia and the16 most important competitor countries on Australia’sinternational air routes have varied over this decade.
Table 3: Aviation Trade Weighted Index for Australia,selected periods 2000–08
Period Real ATWI Nominal ATWI
2000 (June) 101.83 105.282005 (December) 128.28 124.442006 (December) 132.36 127.322007 (December) 140.35 136.702008 (March) 140.05 138.662008 (June) 149.40 147.012008 (September) 130.35 127.362008 (December) 111.27 110.23
Source: Forsyth and Dwyer 2007, updated.Note: 1995 = 100.00; December 2008 figures are preliminary.
The ATWI is calculated for Australian internationalairlines, and it reveals that there has been a significantloss of competitiveness in recent years—the result of theappreciation of the Australian dollar relative to curren-cies of key airline competitor countries.The results indi-cate that, from June 2000 to June 2008, the Australiandollar appreciated relative to those countries whose air-lines the home airlines are in close competition.Thismade Australia-based airlines progressively less competi-tive relative to airlines based elsewhere. Since June 2008,the situation has reversed, with Australia’s internationalairlines becoming more competitive than rival airlines.Between June and December 2008, the competitivenessof Australian-owned airlines increased by 25.5 percent,an increase that can be expected to boost inbound travel.
The ATWI indicates that, except for the Decemberquarter of 2008, the change in the real index over theperiod is slightly higher than the nominal index, imply-ing that the nominal index understates the competitivepressure.
84
1.6:
Tou
rism
Pric
e Co
mpe
titiv
enes
s
part1.r2 2/26/09 11:59 AM Page 84
The Travel & Tourism Competitiveness Report 2009 © 2009 World Economic Forum

These indexes are simple and quick to calculate,and provide ready information on one of the criticaldeterminants of a country’s airlines’ cost competitive-ness.They indicate how an airline’s input costs havechanged relative to those of its competitors as a result ofexchange rate changes.
The ATWI picks up only the exchange rateeffect—if it is necessary to examine all determinants ofcost competitiveness, a full cost competitiveness index isrequired.22 This is often not necessary, however. If acountry’s exchange rate is changing, it may be importantto determine how this is affecting its airlines’ cost com-petitiveness.A rise in the exchange rate will make theairlines less cost competitive—if their competitivenessposition is to be restored, they will have to improvetheir efficiency or lower the input cost they face (per-haps by sourcing inputs offshore).The ATWI sums upthe size of the immediate problem or opportunity fac-ing airlines as a result of recent exchange rate changes.Exchange rates change instantaneously; airlines dorespond, though their responses take considerabletime—generally the response is spread out over morethan a year.
The ATWI is a relative measure that gives an over-all measure of competitiveness by weighting all thecountry’s airlines’ competitiveness by their market sharesin the country’s routes.An airline’s relative cost compet-itiveness may have changed, but how significant animpact on its competitive position this has will dependon how its cost competitiveness has altered relative tothose of the airlines with which it competes closely.Cost competitiveness indexes can be aggregated in thesame way as the ATWI components are aggregated; thiscould be a useful exercise.
Determinants of tourism price competitivenessTourism price competitiveness is essentially a matter ofthe prices of the goods and services that tourists buy,expressed in some common currency. Several factorsimpinge in different ways on tourism price competitive-ness.
Exchange rates: Exchange rates are the first andmost obvious factor influencing tourism competitive-ness. Other things being equal, if a country’s exchangerate rises, its tourism competitiveness falls. Exchangerates do tend to reflect relative price levels at home andin other countries: when a country’s prices rise relativeto those of competitors, its exchange rate tends to fall.However, many other factors influence exchange rates,especially in the short term. Exchange rates can be quitevolatile, even for industrial countries with stable tradingpatterns, as recent experience shows.The result is thatpatterns of tourism price competitiveness would havechanged quite significantly over the six-month periodfrom June through December 2008.
Inflation and overall price levels: As notedabove, higher general price levels in a country tend tobe canceled out by exchange rate depreciations—butonly up to a point. General prices—and the prices thattourists are paying—may be rising, but export pricesmay not be increasing to the same extent. In such a sit-uation, a country’s exchange rate may not move much,and it may lose price competitiveness in tourism.
Labor prices: These prices are a key determinantof long-term price competitiveness in tourism.Countries with low wages tend to have low prices forgoods and services, even when these are converted intoother currency terms using market exchange rates.Prices in US dollar terms are lower in China than in theUnited States, for example—as a result of this, interna-tional comparisons need to use PPP measures, not justmarket exchange rates. Low-income countries are thusprice competitive in tourism. Over time, growth in percapita incomes alters patterns of tourism price competi-tiveness; in this way, the tourism price competitivenessof Asian tiger countries such as Singapore has beeneroded over time.
Productivity performance of tourism indus-tries: The more productive a tourism industry is, thelower will be its output prices given its input prices.Output prices will reflect input (especially labor) prices,as well as industry productivity.A high-income countrycould be quite price competitive in tourism if itstourism industries are productive relative to those of itslow-income competitors.To some extent, high-incomecountries have been able to achieve high tourism pricecompetitiveness because their industries are productive.However, the relative productivity performance of dif-ferent countries’ tourism industries is a relatively under-researched area.
Export booms and Dutch disease: Structuralshifts can impact tourism competitiveness throughchanges in the exchange rate.A well-known effect is theDutch disease, whereby an export boom in one industrypushes up the exchange rate and makes other exportindustries less competitive.This effect is very relevant fora country’s tourism price competitiveness. Over the fiveyears from mid 2003 to mid 2008,Australia experienceda minerals export boom, which pushed up its exchangerate.This made its tourism industry less competitive, andinbound tourism fell—well before the effects of theglobal financial crisis.
Tax levels and structures: Taxes, and especiallyindirect taxes, can influence the prices of the goods andservices that tourists buy, and thus they can impact pricecompetitiveness. If taxes result in price rises of a coun-try’s goods and services for export and home markets,they will tend to be counteracted by exchange ratedepreciation, and the country’s tourism price competi-tiveness will be relatively unchanged. However, oftentaxes impact different industries unevenly.Taxes such asthe value-added tax (VAT) or goods and services tax
85
1.6:
Tou
rism
Pric
e Co
mpe
titiv
enes
s
part1.r2 2/26/09 11:59 AM Page 85
The Travel & Tourism Competitiveness Report 2009 © 2009 World Economic Forum
(GST) are typically levied on goods and services sold athome, but not on exports.When the rate of these taxesis increased, it will not affect most export industries—but tourism is the exception.The exchange rate will notalter much, but prices to tourists will rise and the coun-try will lose competitiveness.Thus the ways taxes arelevied will be a significant determinant of tourism com-petitiveness. Countries that rely heavily on taxes such asthe VAT/GST will be less tourism competitive thanother countries with similar per capita incomes andindustry structures.
Infrastructure charges: Infrastructure charges cantake many forms, such as road pricing, airport levies, anddeveloper contributions to resort developments.Thesecharges push up the prices charged to tourists. Sincethey are specific, they will not have any significantimpact on exchange rates, and thus they will reduce acountry’s tourism competitiveness.
Fuel prices and taxation: Fuel is an importantinput into tourism goods and services, and fuel pricescan have a significant impact on tourism price competi-tiveness. Fuel prices are dominated by the price of oil,which is much the same for all countries. However,countries differ considerably in the way they tax (orsometimes subsidize) fuels.Thus higher fuel taxes inEuropean countries lessen their tourism competitive-ness.
Environmental charges: Tourism industries arebecoming increasingly subject to environmental charges.These may be either specific, such as a noise levy on anairport, or very general, such as higher costs due to theimplementation of an emissions trading scheme (ETS).The impact on competitiveness will depend on howgeneral the charge is, and how it affects other tradingindustries. If an ETS raises costs to all industries, it willmake exports more expensive; this will tend to lead toexchange rate depreciation, which in turn will tend tocancel out the cost increase (though not exactly).However, if some export industries are exempted fromthe ETS, as is proposed in some countries, the impacton the exchange rate will be limited, and the competi-tiveness of industries that are not exempted, such astourism, will suffer. Specific duties, such as the air pas-senger duties of the United Kingdom and theNetherlands (which may or may not be regarded asenvironmental levies) will not have any appreciableimpact on the exchange rate, and thus they will reducetourism competitiveness.
Tourism competitiveness, policy, and the macro envi-ronmentDestination competitiveness is sensitive to both govern-ment policy and the general macroeconomic environ-ment. Here we provide a brief outline of how tourismcompetitiveness can be affected by these.
Government policyGovernment policy can impact tourism competitivenessthrough both general and specific policies. General poli-cies, such as the implementation of an ETS, can impacta country’s tourism, as discussed in the previous section.In addition, some policies, such as an aviation tax, maybe quite specific; these policies may have unintendedimpacts on tourism. Objectives for policies differ: some-times the objective of a policy may be to increase theprice competitiveness of tourism (for example, whenimproved infrastructure lowers the cost to tourism) and sometimes the intention is to achieve some otherobjective, which incidentally has some cost to tourismcompetitiveness (for example, when an aviation tax islevied to raise revenue or correct for an environmentalexternal cost).
Policy can thus impact the determinants of tourismcompetitiveness in a number of ways.These are summa-rized in Table 4.
The exchange rate is a variable that governmentscan, and do, use to increase the competitiveness of theirexport industries. However, there are costs to usingexchange rates in this way and most advanced countriesnow prefer floating exchange rates. Governments, throughtheir monetary policies, can influence price levels, butthis is not a very well targeted way of influencingtourism competitiveness, especially since low homeprices tend to be associated with higher exchange rates.Governments have little influence over real wage rates,which reflect the country’s stage of development.Governments can have some influence over the produc-tivity of their industries, including the tourism industry.In the main this influence is indirect, through theimplementation of policies, such as competition policy,which stimulate efficiency.Again, however, economy-wide productivity improvements will tend to result inexchange rate rises and no gain in export competitiveness.
Governments cannot really control export booms.These booms do, however, have an impact on the com-petitiveness of non-boom export industries, such astourism.Where booms are sharp and temporary, govern-ments can mitigate their effects on exchange rates, andthus on non-boom industries, through encouraging thesaving of the temporary income gains (as Norway doeswith its booms in its oil revenues).
Tax policies can have a direct impact on tourismprices, and thus on competitiveness. But it is critical todistinguish between taxes that apply to all export indus-tries and those that apply only to some.As noted, whileVAT/GST taxes are general, they are not applied tomost export industries. Since they are, however, appliedto tourism exports, they reduce tourism price competi-tiveness in much the same way that specific taxes ontourism do. If a tax is a general one and it affects alltrading industries in the same way (say, an increase incorporation tax), the impact on competitiveness of anyindustry, such as tourism, will be limited since it will set
86
1.6:
Tou
rism
Pric
e Co
mpe
titiv
enes
s
part1.r2 2/26/09 11:59 AM Page 86
The Travel & Tourism Competitiveness Report 2009 © 2009 World Economic Forum

in train compensating movements in exchange rates.Infrastructure charges are like specific taxes—when theyare increased, they lessen tourism competitiveness, andwhen they are reduced, they enhance competitiveness.Fuel prices, and especially those of oil-based fuels thatare critical to tourism, are sensitive to government policy—countries differ considerably as to how they tax fuels.
Environmental policies can affect tourism competi-tiveness. Specific environmental measures, such as levieson aviation, will reduce tourism competitiveness.To theextent that general measures, such as the implementa-tion of an ETS, apply to all trading industries, they willset in train compensating exchange rate shifts, whichwill at least partially cancel out the initial impact oncompetitiveness.Again, the exact design of the policy isimportant, because if exemptions are granted to someindustries, the loss of competitiveness experienced byother industries will be greater.
The macroeconomic environmentDestination competitiveness is sensitive to the generalmacroeconomic environment. In normal times of macrostability, the effects are not great. However, in times ofmacroeconomic stress, such as in the current global situ-ation or during the Asian Financial Crisis 10 years ago,macro conditions can have a considerable impact onpatterns of tourism competitiveness.
One of the most obvious ways in which this canhappen is through changes in exchange rates. Exchangerates have shifted, for some countries quite substantially,and they show considerable volatility.This is even thecase for currencies of major countries.The results areshifts in, and volatility of, patterns of tourism competi-tiveness.This has been very evident, for example, inAustralia.After a five-year period of real exchange rateappreciation, leading to a boom in outbound travel, thevalue of the Australian dollar has dropped sharply (seeTable 2).This has led to outbound travel becoming
much more expensive, and this travel has fallen sharply,even though real GDP in Australia has continued togrow.
Recession in several countries could impact theprices being paid for tourism inputs, especially labor.This reduction is likely to lead to reductions in productprices—hotels and airlines are cutting prices to winbusiness.This in turn will lead to at least temporarychanges in patterns of tourism competitiveness, withsome high-cost countries (in North America andEurope) increasing their tourism price competitivenessvis-à-vis other countries, such as those of Asia.Thefinancial crisis is having a large impact on oil prices.Thisshould lower the prices of tourism across the board,though it will probably not have a large impact on therelative competitiveness of countries since they all paymuch the same prices for their oil, and it not likely thatfuel taxes—the main source of differences among countries—will change much.
Although so far there is not much evidence of gov-ernments altering their tax, infrastructure, and environ-mental policies in response to the crisis, such policyadjustment could happen. Governments might postponethe introduction of their ETS proposals, depending ontheir design; such a postponement could have someimpact on patterns of tourism competitiveness.Governments of individual countries might choose tostimulate their economies through tax reductions;depending on how they do this, there could be impactson tourism competitiveness.With tax reductions puttingpressure on governments’ budgets, governments may belooking around for “easy” sources of revenue—and taxeson tourism, paid by nonresidents, may be appealing.Already the UK government has announced sharpincreases in aviation taxes, designed to reduce its fiscaldeficit.These increases will make the United Kingdomless competitive in tourism.
87
1.6:
Tou
rism
Pric
e Co
mpe
titiv
enes
s
Table 4: Government policy and the determinants of tourism competitiveness
Open to Sensitivity Impact on tourismDeterminant policy? to policy competitiveness Comments
Exchange rate Yes High Low/moderate Often not recommendedPrice level Yes Moderate Low Not easy to target tourismReal wage levels No Low LowTourism industry productivity Yes Low Low Some scope to improve productivity in longer termExport booms No n/a Moderate Governments can mitigate effects of sudden boomsGeneral taxes Yes High Low Tax structure importantSpecific taxes Yes High High Other objectives importantInfrastructure charges Yes High High Other objectives importantFuel prices Yes High Moderate/high Fuel price differences mainly tax drivenGeneral environmental policies Yes High Low Policy design criticalSpecific environmental policies Yes High High Other objectives important
Source: Authors.
part1.r2 2/26/09 11:59 AM Page 87
The Travel & Tourism Competitiveness Report 2009 © 2009 World Economic Forum

Horses for courses: Which competitiveness indicator?In this chapter, we have outlined a range of differenttourism price competitiveness indicators.Which oneshould be used, and in what context? As with manysimilar situations, it is a matter of horses for courses.Depending on the exact question at hand, differentindicators are suitable for different purposes.
Some questions apposite to the choice of indicators are:
• How detailed and tourism-specific need the indica-tor be?
• What is the tradeoff between accuracy and timeli-ness and ease of access?
• Are cross-country comparisons of the level oftourism prices needed?
• Is specific sectoral information of interest?
• Are patterns of change over time in relative tourismcompetitiveness needed?
• Is it useful to have an overall measure of changes ina country’s tourism competitiveness?
The performance of the different indicators in terms ofthese aspects is summed up in Table 5.
The Tourism Competitiveness Index is the mostcomprehensive indicator of tourism price competitive-ness we are aware of.23 It measures only prices that enterthe tourism bundle, and thus is highly reflective oftourism. It enables cross-country comparisons at a pointin time, and can be calculated over time to indicatetrends.With appropriate weights, it can be used to
develop an indicator of changes in a country’s overalltourism competitiveness. It is, however, the most data-intensive of the measures.A simple PPP comparison iseven more readily available, but it is a measure of pricesfor whole economies, and it does not take any specificaccount of the prices that tourists actually pay, thoughthese are likely to be correlated with the PPP prices.The Big Mac Index of The Economist is a popular devicefor illustrating the PPP point, but it is not to be regard-ed as a reliable indicator of tourism competitiveness.Sectoral measures, such as hotel price surveys, can give ahigh degree of accuracy about a specific sector, thoughthey do involve collection costs.
If cross-country comparisons are not needed, andall that is needed are changes in the patterns of pricecompetitiveness over time, then it is possible to adjustchanges in exchange rates by changes in prices. Iftourism-specific information is not regarded as neces-sary, then estimates of real exchange rate changesderived using CPI changes will be sufficient. However, ifit is felt that CPI changes may not accurately reflecttourism price changes, then exchange rate changes canbe adjusted using a tourism price index.
Developing a tourism price index requires data onchanges in individual tourism prices for each country,along with a weighting structure (and, as noted, giventhat the tourism product is hardly homogeneous, there isno single ideal set of weights). Such an index also requiresexpenditure data to develop a set of weights for the index.
Over time, a country’s competitiveness will rise rel-ative to some competitors and fall relative to others. Ifan overall indicator of how a country’s competitivenessfits in comparison with other countries is required, it is
88
1.6:
Tou
rism
Pric
e Co
mpe
titiv
enes
s
Table 5: Properties of tourism competitiveness indicators: A summary
Accuracy- Cross- Overall reflectiveness Data country Comparisons indicator of
Indicator of tourism gathering comparisons over time competitiveness Comments
Tourism Price Competitiveness High Extensive Yes Yes Potential Most detailed indicator availableIndex (Dwyer et al. 2000a)
Simple PPP Moderate Easy Yes Yes Potential Broad readily available indicator
Big Mac Low Moderate Yes Yes No Too specific—really a gimmick
Sectoral measures (e.g., High Extensive Yes Potential No Useful for specific purposes and in hotel prices) general indicators
Tourism price index/ High Extensive No Yes Potential Not used extensivelyexchange rate
CPI/exchange rate Moderate Easy No Yes No Broad measure of changes
Tourism Trade Weighted Index Moderate Moderate No Yes Yes Summary measure of competitivenesschanges over time
Aviation Trade Weighted Index Moderate Moderate No Yes Yes Summary measure of competitiveness changes over time for specific tourism industry
Source: Derived by authors.
part1.r2 2/26/09 11:59 AM Page 88
The Travel & Tourism Competitiveness Report 2009 © 2009 World Economic Forum

necessary to develop some measure such as the widelyused TWI.The TTWI is an index that reflects theimportance of different countries for inbound and out-bound tourism expenditure. It is thus more tourism-specific than the general TWI.The concept can beextended to a sectoral context.The ATWI takes accountof the real exchange rate changes taking place in thecountries whose airlines are competitors for the homecountry airline—it thus gives a more accurate measureof the competitive pressure an airline will be under fromits competitors than a general TWI will provide.
In the light of this discussion, some comments onthe TTCI are relevant.The intention of this Index is toprovide a timely measure of tourism price competitive-ness across countries. Four hard data price indicators areused.At the most general level, PPP price comparisonsare used (indicator 10.02)—this is a measure of the costof a general bundle of goods and services in US dollarterms for all the countries reported on.While this is agood measure of general price levels in different coun-tries, it is not tourism-specific.To address this lack, rela-tive price data for three key tourism related products arealso provided—these are ticket taxes and airport charges(10.01), fuel price levels (10.04), and, finally, a hotelprice index (10.05). By aggregating all these indicators, amore tourism-specific index of prices in different coun-tries is obtained from readily available and up-to-dateprice indicators.
Notes1 Crouch 1994a; Lim 2006.
2 Little 1980.
3 Edwards 1995.
4 Crouch 1995.
5 Crouch 1994a.
6 De Mello et al. 2002.
7 Rosensweig 1986.
8 Artus 1970; Crouch 1994b.
9 Lim 2006.
10 Lim 2006.
11 Song and Witt 2000.
12 Song and Turner 2006.
13 World Bank 1993, 2007.
14 See Dwyer et al. 1999, 2000a, 2000b, 2000c; Dwyer et al. 2001.
15 Dwyer et al. 2002.
16 Divisekera 2003.
17 Dwyer et al. 2000a.
18 Kulendran 1996; Kulendran and King 1997.
19 Dwyer et al. 2000c.
20 Dwyer et al. 2000b.
21 Forsyth and Dwyer 2008.
22 Forsyth and Dwyer 2008.
23 Dwyer et al. 2000a.
ReferencesArtus, J. R. 1970. “An Econometric Analysis of International Travel.”
International Monetary Fund Staff Papers No. 19: 579–613.
Crouch, G. I. 1994a. “The Study of International Tourism Demand: AReview of Findings.” Journal of Travel Research 33 (1): 12–23.
———. I. 1994b. “The Study of International Tourism Demand: ASurvey of Practice.” Journal of Travel Research 34 (4): 41–54.
———. 1995. “A Meta-Analysis of Tourism Demand.” Annals ofTourism Research 22 (1): 103–18.
De Mello, M., A. Pack, and M. T. Sinclair. 2002. “A System of EquationsModel of UK Tourism Demand in Neighbouring Countries.”Applied Economics 34 (4): 509–21.
Divisekera, S. 2003. “A Model of International Tourism Demand.”Annals of Tourism Research 30 (1): 31–49.
Dwyer, L., P. Forsyth, and P. Rao. 1999. “Tourism PriceCompetitiveness and Journey Purpose.” Turizam, Special Issue onCompetitiveness in Hospitality and Tourism 47 (4): 283–99.
———. 2000a. “Price Competitiveness of Package Tourism: Beyondthe Big Mac Approach.” Asia Pacific Journal of Tourism Research5 (2): 50–56.
———. 2000b. “Sectoral Analysis of Price Competitiveness of Tourism:An International Comparison.” Tourism Analysis 5 (1): 1–12.
———. 2000c. “Price Competitiveness of Package Tourism: Beyondthe Big Mac Approach.” Asia Pacific Journal of Tourism Research5 (2): 50–56.
———. 2002. “Destination Price Competitiveness: Exchange RateChanges versus Inflation Rates.” Journal of Travel Research 40(3): 340–48.
Dwyer, L., N. Mistilis, P. Forsyth, and P. Rao. 2001. “International PriceCompetitiveness of Australia’s MICE Industry.” InternationalJournal of Tourism Research 3 (2): 123–40.
Edwards, A. 1995. Asia-Pacific Travel Forecasts to 2005. ResearchReport. London: Economist Intelligence Unit.
Forsyth P. and L. Dwyer. 2008. The Aviation Trade Weighted Index:Measuring Competitiveness of International Travel.
Kim, S. and H. Song. 1998. “Analysis of Inbound Tourism Demand inSouth Korea: A Cointegration and Error Correction Approach.”Tourism Analysis 3 (1): 25–41.
Kliman, M. L. 1981. “A Quantitative Analysis of Canadian OverseasTourism.” Transportation Research 15A: 487–97.
Kulendran, N. 1996. “Modelling Quarterly Tourist Flows to AustraliaUsing Cointegration Analysis.” Tourism Economics 2 (2): 203–22.
Kulendran, N. and M. King. 1997. “Forecasting International QuarterlyTourist Flows Using Error-Correction and Time-Series Models.”International Journal of Forecasting 13 (3): 319–27.
Kwack, S. Y. 1972. ”Effects of Income and Prices on Travel SpendingAbroad, 1960 III–1967IV.” International Economic Review 13:245–56.
Lim, C. 1999. “A Meta-Analytic Review of International TourismDemand.” Journal of Travel Research 37 (3): 273–84.
———. 2006. “A Survey of Tourism Demand Modelling Practice: Issuesand Implications.” In International Handbook on the Economics ofTourism, L. Dwyer and P. Forsyth, eds. Cheltenham, UK andNorthampton, MA: Edward Elgar. 45–72.
Little, J. S. 1980. “International Travel in the US Balance of Payments.”New England Economic Review May/June: 42–55.
Rosensweig, J. A. 1986. “Exchange Rates and Competition forTourists.” New England Economic Review July/August: 57–67.
Song, H. and L. Turner. 2006. “Tourism Demand Forecasting.” InInternational Handbook on the Economics of Tourism, L. Dwyerand P. Forsyth, eds. Cheltenham, UK and Northampton, MA:Edward Elgar. 89–114.
Song, H. and S. F. Witt. 2000. Tourism Demand Modelling andForecasting: Modern Econometric Approaches. Cambridge:Pergamon.
89
1.6:
Tou
rism
Pric
e Co
mpe
titiv
enes
s
part1.r2 2/26/09 11:59 AM Page 89
The Travel & Tourism Competitiveness Report 2009 © 2009 World Economic Forum

World Bank. 1993. Purchasing Power of Currencies: ComparingNational Incomes Using ICP Data. Washington, DC: InternationalEconomics Department, World Bank.
———. 2007. 2005 International Comparison Program PreliminaryGlobal Report Compares Size of Economies. Washington, DC:International Economics Department, World Bank.
90
1.6:
Tou
rism
Pric
e Co
mpe
titiv
enes
s
part1.r2 2/26/09 11:59 AM Page 90
The Travel & Tourism Competitiveness Report 2009 © 2009 World Economic Forum

CHAPTER 1.7
National CompetitivenessCouncil: Setting Up theEgyptian Travel & TourismCompetitiveness CouncilASHRAF IBRAHIM, Clever Travel and Egyptian Travel & Tourism
Competitiveness Council
HEBA ALI ZAYED, Egyptian National Competitiveness Council
Egyptian National Competitiveness CouncilLed by a group of prominent businessmen, the EgyptianNational Competitiveness Council (ENCC) was estab-lished as a private sector–led nongovernmental organiza-tion (NGO) in February 2004. Its objective is to shedlight on the issue of competitiveness and enhance thecompetitiveness of Egypt on various levels.The ENCCstarted as an observatory for the developments takingplace in the Egyptian economy and their implicationsfor Egypt’s competitiveness. Its role is currently beingbroadened to include several initiatives that will impact,complement, and—sometimes—coordinate amongefforts to improve the competitiveness of Egypt.
For the last five years, the ENCC has successfullypublished the Egyptian Competitiveness Report. Thisreport provides a thorough analysis of Egyptian compet-itiveness based on the main competitiveness methodologyof the World Economic Forum. Each year, a specificissue or sector is discussed in more detail, generatinglively debate and highlighting the challenges within thatarea.This important annual report has attracted theattention of the Egyptian government, academic profes-sors, industry leaders, and international observers. Sinceits establishment, the ENCC has succeeded in bringingtogether senior government officials, private-sector lead-ers, professors, think tanks, and media professionals toraise awareness and generate debate on Egypt’s competi-tiveness. It has demonstrated that much more can nowbe done to strengthen the private-public dialogue oneconomic reform.The ENCC has also fostered importantdebate in Egypt and influenced competitiveness dialogueboth in Egypt and in the region through its participationin the World Economic Forum on the Middle East inrecent years.
Egyptian National Competitiveness Council’s fifthannual report: Realizing the great potential in thetourism sectorThe Travel & Tourism (T&T) sector was the focus ofthe 2008 Egyptian Competitiveness Report mainly becauseof its potential for growth and its contribution to Egypt’soverall competitiveness.The potential for developmentin the sector is immense by every standard, with agrowth rate of over 15 percent a year between 2002 and2006—more than three times the growth rate of inter-national tourism during the same period.This perform-ance accelerated to an impressive 20 percent increase in2007, indicating that the T&T sector can sustain thisdouble digit growth going forward and has yet to see itspotential fully tapped.
91
1.7:
Nat
iona
l Com
petit
iven
ess
Coun
cil
Special thanks to the members of the Travel & TourismCompetitiveness Council and Mr. George Atalla and Mr. Tarek Nassarfrom Booz & Company.
part1.r2 2/26/09 11:59 AM Page 91
The Travel & Tourism Competitiveness Report 2009 © 2009 World Economic Forum

The importance of the T&T sector and its promi-nence within the Egyptian economy is evidenced by thefollowing figures:1
• Travel & Tourism contributes—directly and indirectly—an estimated 11.3 percent of GDP.
• It accounts for around 40 percent of exported services’ receipts and generates approximately 19.3percent of foreign exchange.
• The sector is a significant employer, contributing12.6 percent of both direct and indirect job creation.
• Tourism accounts for some 4 percent of totalinvestment with the private sector, providing 73 percent of the total.
• Tax revenue from foreign tourist spending is esti-mated at 6 billion Egyptian pounds, representing 5percent of total direct and indirect tax revenue in2006.
• Investment opportunities in tourism are promising;in 2006, investment in tourism exceeded US$4.1billion, representing 2.7 percent of gross investmentthat year.
The Travel & Tourism Competitiveness Index(TTCI), published for the third year and discussed inChapter 1.1 of this volume, places Egypt 64th out of133 countries—up two places from last year but still notas high as the 58th position out of 124 countries in2007, indicating a decline since the first year of theIndex. Egypt is now just among the top half of coun-tries in the overall ranking, and in 6th position amongArab countries.
According to the TTCI, one of Egypt’s majorstrengths in tourism attraction is its price competitive-ness—it ranks 1st out of all countries as a result of verylow ticket taxes and airport charges.Additionally, Egypthas relatively low fuel price levels, ranked 3rd just afterSaudi Arabia, and it comes 4th on the hotel price index,right after Bolivia.The country is perceived as relativelysafe from HIV/Aids, ranking 1st on that indicator, as ithas in the past two Reports. It also does relatively wellwith regard to the government’s focus on the sustain-ability of the T&T sector, ranking 38th, although thegeneral assessment of environmental sustainability inEgypt is less positive, ranked 103rd overall, with envi-ronmental legislation that is not sufficiently strong orenforced. Egypt has been improving over the years withregard to the country’s affinity for Travel & Tourism,where it ranked 20th this year, with progress in tourismopenness as reflected in tourism receipts and expendi-ture as a percentage of GDP and an improving attitudetoward the value of tourism in the country.
It is clear that the most significant reason for the fallof Egypt’s overall score between 2007 and 2009 is thedrop in its rankings related to the T&T business envi-
ronment and infrastructure pillar of the Index.The quality of air transport, ground transport, and ICT allshowed a significant decline. Safety and security contin-ue to be of concern; the country is ranked 67th overallin this indicator, just ahead of Benin and Ghana.Thecountry also suffers from a lack of qualified humanresources, ranked 83rd, attributable in part to the qualityof the educational system. In addition, the TTCI findsthe overall policy environment (ranked 55th) not to besufficiently conducive to the development of the sector,because of a low prevalence of foreign ownership, a lackof transparency in government policies, and the highcost of starting a business in the country.The details ofthe most recent assessment of Egypt’s competitivenesscan be found in Section 2.1 of this Report.
The Egyptian Travel & Tourism CompetitivenessCouncilThe importance of the sector, together with the previ-ously mentioned growth potential for the EgyptianT&T sector, encouraged the Egyptian NationalCompetitiveness Council to form a Travel &TourismCompetitiveness Council (T&TCC) with the objectiveof bringing together stakeholders from the T&T sectorto review sector developments, discuss its challenges, andcome up with means of enhancing its internationalcompetitiveness.
The idea for the Council came when the ENCCwas preparing its 5th Egyptian Competitiveness Report. TheT&TCC is composed of a group of high-profile localT&T sector business leaders and international players,who coordinate and collaborate with other stakeholders(including government officials, professors, professionalconsultants, chambers of Travel & Tourism, the EgyptianTourism Federation, other NGOs, donor programs, andinternational organizations).Their mission is to assess thefactors impeding the enhanced competitiveness of thesector and suggest solutions for dealing with theseimpediments, including policy actions.This is donethrough spreading awareness (inside and outside the sector), advocacy, and mobilizing efforts in cooperationwith other stakeholders.
To achieve its objectives, the T&TCC scope ofwork includes but is not limited to:
1. preparing briefings on sector performance thatanalyze and shed light on specific issues relatedto the local T&T sector as well as following upon local and international changing market con-ditions that may impact the sector’s performance;
2. organizing discussion forums that bring togethervarious stakeholders of the T&T sector to discusschallenges and suggest feasible solutions to besubmitted for discussion with senior governmentofficials; and
92
1.7:
Nat
iona
l Com
petit
iven
ess
Coun
cil
part1.r2 2/26/09 11:59 AM Page 92
The Travel & Tourism Competitiveness Report 2009 © 2009 World Economic Forum

3. following up with policymaking bodies on theapplication of suggested solutions and monitor-ing the implementation of policy reforms.
Action plan for the Travel & Tourism CompetitivenessCouncilAnalysis of the Egyptian T&T sector indicates that itfaces a number of key challenges going forward. Overthe upcoming year, the T&TCC will focus on threemain initiatives identified as top priority:
1. human resource development,2. institution and capacity building for industry
advocacy, and3. environmental sustainability.
Human resource developmentHuman resource development is a platform throughwhich employees in the T&T sector can develop theirpersonal and organizational skills, knowledge, and abili-ties. It includes such opportunities as employee training,employee career development, performance managementand development, coaching, succession planning, keyemployee identification, tuition assistance, and organiza-tion development.
The focus here will be on aspects of human resourcedevelopment aiming to develop a workforce that bothmatches the needs of the local T&T industry and enablesit to compete with tourist destinations worldwide.
Short-term tasks will revolve around increasinginstitutional coordination and assessing the sector’shuman resources needs; long-term initiatives will focuson the industry enablers, sector research and metricmeasurement, curriculum design, and training provision.
Short-term initiatives
• Institutional coordination— Coordinate between different organizations—for
example,Technical and Vocational Education andTraining (TVET), the United States Agency forInternational Development (USAID), the Ministryof Tourism, tourism federations, chambers, and thetourism human resource development and trainingunits—to help these organizations establish a train-ing business plan that can achieve the strategic,marketing, and continuity plans of tourism sectorbusinesses.
— Encourage different organizations—such as theMinistry of Tourism, the Tourism Federation,tourism chambers,TVET, and area investors’associations—to coordinate and establish trainingcenters in different touristic regions—such as theRed Sea, Sinai, Luxor, and Cairo—to have ongoingtraining courses.
• Human resources needs assessment— Communicate with the private-sector training
companies about the required training and devel-opment programs needed for the T&T industry.
— Work in collaboration with the Ministry ofTourism and the Tourism Federation to suggestdifferent recommendations for developing enoughqualified trainers who will efficiently execute thetraining business plan.
— Provide advice regarding the development ofemployee performance and staff trainings toupgrade the skills and knowledge required to suc-cessfully fulfill their job descriptions.
— Highlight the importance of the need for humanresource training with regard to soft skills such asgreeting guests, handling complaints, up-selling,communication skills, and so on.
— Encourage the design of a training plan for eachsubsector to help in achieving its goals and objec-tives, not just training for the sake of training.
— Highlight the importance of establishing a sustain-able financial system targeted at upgrading thecurrent level of human resources in the tourismindustry through offering training and skills development programs.
Long-term initiatives
• Sector research and metric measurement— Highlight the importance of the availability of
updated information about employer requirementsand market needs.
— Work with different stakeholder organizations onembedding a clear evaluation system to measureeffectiveness in order to ensure continuous devel-opment and improvement with a focus on moni-toring and feedback. Such a system would evaluateall existing tourism-related industries, thus goingbeyond the design and implementation of voca-tional training programs.
• Curriculum design and training provision platforms— Foster the creation of sector education curricu-
lums that are more demand driven and directedtoward market needs and requirements.This canbe achieved through initiatives such as the nationalvocational skills standards project.2 The ENCCmust advocate for increased ministerial coopera-tion to change the current educational system toone that is demand driven.
93
1.7:
Nat
iona
l Com
petit
iven
ess
Coun
cil
part1.r2 2/26/09 11:59 AM Page 93
The Travel & Tourism Competitiveness Report 2009 © 2009 World Economic Forum

— Highlight the importance of developing tourism-related vocational training and education to pro-vide workers with the necessary skills and knowl-edge needed for each job, from line employees tomanagers. Developing and focusing on talentedand skilled employees will achieve the competitiveadvantage needed to differentiate Egypt fromother countries.
— Recommend and advocate for the establishmentof a series of hotel and tourism institutions fortouristic areas, such as El Gouna Hotel School.3
Institution and capacity building for industry advocacyTo advance the T&T sector, greater awareness, informa-tion dissemination, and communication are required.Active forums, councils, workshops, and seminars allowstakeholders to stay connected and work together toidentify and solve major problems facing the tourismsector in Egypt.Awareness-raising activities can ensurethat industry representatives and policymakers are up todate with recent advancements in the field.These activi-ties enable the private sector to communicate and iden-tify potential areas of collaboration with the governmentto improve tourism services and overcome obstacles.Tofoster efforts in this area, the ENCC plans to enhancethe institution and capacity building for industry advocacy.
• Institutional setup— Highlight the importance of stimulating the
Supreme Council of Tourism (SCT), which hasbeen established to coordinate among ministriesand the various bodies concerned with touristactivity.The Council is charged with finding waysto remove obstacles that hinder tourism, coordi-nating among different ministries to implementdevelopment plans and specifying the role of eachministry in tourist promotion.The SCT aims tofacilitate the quick identification of problem areasand to promote efficient, feasible, multi-stakehold-er solutions. Members include the ministers ofirrigation, environment, local government, trans-portation, and planning as well as the heads of theSupreme Council of Antiquities, Egypt Air, theCairo Airport Authority, the Egyptian Authorityfor Civil Aviation, the Egyptian Tourist Authority,the Immigration Authority, the CustomsAuthority, the Egyptian Federation of TouristChambers, the Hotels Chamber, and the TravelAgencies Chamber.
— Highlight the importance of creating the Travel &Tourism Modernization Center that will be incharge not only of training activities but also ofdeveloping the whole tourism sector.
• Capacity building— Organize several workshops to create awareness
about the importance of training and humanresources development as well as other necessarytopics that are relevant to the sector.
Environmental sustainabilityThe Egyptian tourism sector is at particular risk of fac-ing the negative effects of hurried development becauseof its reliance on environmental resources.Water scarcity,coral bleaching, loss of beaches, and acid rain are all partof the price paid for Egypt’s intense development.TheT&TCC hopes to play an active role in spreadingawareness of the importance of environmental sustain-ability—in particular, by fostering greater understandingof the effects of environmental degradation and what itcould mean for individual businesses.The focus will beon two main issues: increasing awareness among sectorbusinesses and promoting the creation of a fund pro-moting environmentally friendly business practices.
• Increasing awareness— Coordinate workshops or seminars promoting
environmental consciousness within the industryand further interest in sustainability. Beyondupper-level management, there is a significantneed to train staff and employees to implementand adopt environmentally friendly practices.Thistraining is distinct from human resource develop-ment training, but the two kinds of training arehighly complementary.The objective is to create apool of labor in the tourism industry that is awareof the effects of climate change and can embracepractices that help protect the natural environmentas an essential part of their livelihoods.
• Creating an Egyptian fund for promoting environ-mentally friendly business practices within the T&Tsector— Promote the creation of a fund pooling resources
from the government, the private sector, interna-tional donors, and investment banks with clientsinterested in conservation.The fund will offset thecost of implementing environmentally friendlybusiness practices such as recycling, coral protec-tion, water/energy conservation, and so on. Oneof the major obstacles of implementing betterenvironmental management systems is the pres-ence of high initial costs that threaten profitability.The fund will help reduce this obstacle and facili-tate green financing in Egypt’s tourism sector.
— Provide financial support, through the fund, foreco-tourism and businesses focused on eco-tourismthat attempt to preserve the natural environmentas an essential component of a thriving society andtourism industry.
94
1.7:
Nat
iona
l Com
petit
iven
ess
Coun
cil
part1.r2 2/26/09 11:59 AM Page 94
The Travel & Tourism Competitiveness Report 2009 © 2009 World Economic Forum

ConclusionsThe above review indicates the importance of the TTCIas an essential tool to track and monitor national progresswithin Egypt’s T&T sector. In addition to highlightingrelative strengths, its subindexes provide a closer look atspecific deficiencies and obstacles that must be overcometo increase investments.The Egyptian T&TCC playedan important role in disseminating this information andbringing key issues into the spotlight in its 2008 com-petitiveness report.The Council was able to examinepolicy implications and develop key recommendationsfor policymakers and other stakeholders.The Councilbased its action plan and suggested initiatives in thecoming period based on its analysis of the Index.Theproposed strategy focused on industry needs, in particu-lar human resource development and institution andcapacity building for industry advocacy and environ-mental sustainability.
Together the TTCI and the analysis based on ithelped the T&TCC provide invaluable benchmarkingand learning opportunities for Egyptian T&T stakehold-ers. Most importantly, the Egyptian experience is notunique: these efforts can be replicated across countriesto improve the performance of T&T sectors and boostnational prosperity and growth.
Notes1 These figures are all from the ENCC’s 5th Egyptian
Competitiveness Report, May 2008, Chapter 3 “The TourismSector in Egypt: Realizing the Great Potential.”
2 This is a proposed certification scheme to ensure minimum standards for certain vocations and job descriptions throughoutthe T&T sector. Accordingly professionals must meet certainrequirements including education and training before gaining certification. This ensures standardized job qualifications andincreased staff competence.
3 The Egyptian–German Hotel School Paul Rahn El Gouna, a cooperative venture, provides three-year dual vocational trainingprograms in several areas. The school opened in 2002. Seehttp://cms.rahndittrich.de/Institution.1446.0.html.
ReferencesENCC (Egyptian National Competitiveness Council). May 2008.
The 5th Egyptian Competitiveness Report. Cairo: ENCC.
95
1.7:
Nat
iona
l Com
petit
iven
ess
Coun
cil
part1.r2 2/26/09 11:59 AM Page 95
The Travel & Tourism Competitiveness Report 2009 © 2009 World Economic Forum

part1.r2 2/26/09 11:59 AM Page 96
The Travel & Tourism Competitiveness Report 2009 © 2009 World Economic Forum

CHAPTER 1.8
Navigating Yet Another PerfectStorm: The Promise ofSustainable Travel & TourismTHEA CHIESA, World Economic Forum
The 21st century will certainly be recorded as a centuryof many perfect storms for the Travel & Tourism industry.Since September 11, 2001, the industry has had torethink the way it operates. Beyond the threat of terror-ism, in the last decade alone the sector has faced a number of other challenges including pandemics andnatural disasters and, in 2008, the volatility of fuel prices,which put an additional burden on this sector.1 Yet,most importantly, 2008 was marked by the bust of thereal estate market, the near collapse of stock markets,limited access to capital, the lowest consumer confidenceexperienced since the Great Depression, and theannouncement by many governments that their respec-tive economies had entered or were entering recessions.
The financial crisis and its impact on the Travel &Tourism sectorWe have seen over the years that economic businesscycles are almost perfectly correlated with tourismgrowth rates.When economies grow, personal incomesrise, allowing for discretionary income spending onTravel & Tourism. In recent years, according to theUnited Nations World Tourism Organization (UNWTO),while the world economy grew at approximately 4 percent annually, this was outpaced by growth in inter-national tourist arrivals reaching about 6.5 percent peryear.2 On the other hand, with nations facing a globalcredit crisis, fluctuating stock markets, erratic fuel prices,and a global recession, people and businesses are begin-ning to reduce travel and businesses are scaling backtheir travel budgets. In an interview with Global Insight,Doug Shifflet notes that, while the slowdown in airtravel will vary by traveler type and purpose, businessesin particular are likely to continue to reduce travelbudgets in 2009.3
Against this background, the Travel & Tourismindustry will certainly navigate yet another perfectstorm in 2009.
Effects of a global recessionA global recession will impact the entire Travel &Tourism sector, despite the robustness that it has shownin past years.There are many reasons to expect thatdemand for all kinds of travel will decline in the comingyears.The financial crisis and economic recession arebringing about tighter credit conditions, high consumerdebt, decreased housing wealth, stagnant wages, and rising unemployment, all of which are leading to a contraction in travel demand, particularly businesstravel.4
According to IATA, in the first quarter of 2008,airlines—which tend to be very sensitive to the businessdownturn—experienced the largest contraction in business travel since 2003, with growth in economy-class travel slowing to less than 1 percent, down from 6
97
1.8:
Nav
igat
ing
Yet
Anot
her
Perf
ect
Stor
m
part1.r2 2/26/09 11:59 AM Page 97
The Travel & Tourism Competitiveness Report 2009 © 2009 World Economic Forum

percent in 2007, significantly reducing airline opera-tions’ revenues. IATA estimates that, by the end of 2008,the total loss to the global air transport industry willhave been in the order of US$5.2 billion.5 By July 2008,passenger demand growth had fallen to 1.9 percent—the lowest in five years.6 In parallel, passenger capacityincreased by twice that amount—3.8 percent—whichindicates that cuts in service did not keep up withdecreasing demand. In September 2008, the six largestUS airlines experienced a 9.5 percent drop on averagein the quantity of domestic miles traveled by passengerscompared with September 2007.7 Compounding thesedifficulties, flight ticket fares are 15 to 25 percent higheron many routes than they were in 2007.8
The lower price of crude oil, which fell by late2008 to more than two-thirds of its peak price of over$147 a barrel in July 2008, has not significantly lessenedthe financial difficulties for many airlines in the industry,as many of them hedged against the possibility of fuelprices rising to even higher levels.9
Therefore, if the US and global economies remainin recession for most of 2009, as many expect will bethe case, it is reasonable to assume that both globalleisure and business travel, measured in trips per person,will decline over the period.
Capacity contraction, industry consolidation, and possiblebankruptciesIt is safe to say that, within the Travel & Tourism indus-try, airlines have been the hardest hit by the crisis, withserious negative consequences for the bottom line.10
According to Felipe González Abad, Senior Advisor atAmadeus, airline bookings in October 2008 were downapproximately 10 percent from the same month in 2007(see Figures 1 and 2).11 As a result of the present con-traction in consumer demand, the T&T industry willprobably face an increase in the number of airlineindustry bankruptcies. Strategies to eliminate excesscapacity (e.g., grounding planes, slowing down the pur-chase of new planes) and increased mergers and acquisi-tions (market consolidation) will likely be adopted as ameans of achieving greater financial stability.
One single GDS has lost 30 percent of it segmentsproduction in nine months.
Since the beginning of 2008, more than 25 airlineshave stopped or suspended operations.These include thebankruptcies of Russia’s AiRUnion and Britain’s XLAirways UK. Globally, many airlines have grounded air-craft to reduce supply in light of slumping domesticmarkets. For example, in late 2008, China SouthernAirlines and China Eastern Airlines began to groundaircraft and cut flights because of concerns that theslumping domestic air travel market would not recoverquickly.12 Similarly, in October 2008, Singapore Airlines(SIA) addressed the problem of falling passenger numbers
through an aggressive capacity-reduction program aimedat cutting back on some routes and entirely pulling outfrom others.13
According to the corporate travel agency Egencia,the contraction in both the supply and demand of airtravel, together with the spillover effects of mergers andacquisitions, will result in lower average ticket prices forbusiness travelers in most markets, despite higher fees forservices such as meals and baggage.14
There is not all bad news, however. On the positiveside, notwithstanding much skepticism within the indus-try, the current financial crisis could provide a positiveeffect by, for example, encouraging airlines to lobbygovernments for increased liberalization of the marketthrough the adoption of global Open Skies agreements.15
It could also lobby for the removal of all current owner-ship and control restrictions, which currently hinder theairlines’ ability to consolidate on a truly global scale.Many agree that airline industry consolidation would bebeneficial by allowing for economies of scale andincreased functional synergies (e.g., shared sales services,frequent flyer programs, fuel hedging, fleet acquisitionand maintenance, etc.).16 This is along the lines of thelogic employed by the US Justice Department inapproving the merger of Delta and Northwest inOctober 2008: it was agreed that the merger was likelyto benefit consumers through improved service, madepossible by the consolidation of the airlines’ activities.17
Other mergers of present relevance are that of BritishAirways/Iberia/American Airlines, currently awaitingEuropean Union (EU) antitrust approval; the Virgin-BMIacquisition; and the alliance between India’s Jet Airwaysand Kingfisher, aimed at stabilizing the market in thegreater public interest.
With respect to the hospitality industry, since mid-September—almost in parallel with the stock marketturmoil—demand for high-end hotel rooms has sharplydecreased because businesses, especially, are cutting backon travel expenses.The hospitality industry has beenexperiencing a drop-off in business from affluent inter-national leisure and business travelers in particular, aseconomies around the globe slow and the value of theUS dollar rises against many currencies. Patrick Ford,the president of the global authority for hotel real estateLodging Econometrics, has said that in 2008 revenuerates on luxury hotel rooms “slowed in mid-Septemberand really ratcheted downward during October.…Revenue per available room, the standard measure ofperformance, dropped 14 percent at upscale and luxuryhotels in the week ending Oct. 18 over the comparableweek last year.… For hotels in general, the decline wasabout 8 percent.”18
98
1.8:
Nav
igat
ing
Yet
Anot
her
Perf
ect
Stor
m
part1.r2 2/26/09 11:59 AM Page 98
The Travel & Tourism Competitiveness Report 2009 © 2009 World Economic Forum

99
1.8:
Nav
igat
ing
Yet
Anot
her
Perf
ect
Stor
m
60
70
80
90
100
110
120
Jan Feb Mar Apr May Jun Jul Aug Sep Oct Nov Dec
2006 2007 2008
Figure 1: Air booking evolution: Global Distribution System (GDS) world-wide
Source: González, 2008.Note: From May 2008, the worldwide demand has been decreasing in comparison with 2007.
Tota
l tri
ps (
mill
ions
)
–6
–4
–2
0
2
4
6
Jan
06Fe
b 06
Mar
06
Apr 0
6M
ay 0
6Ju
n 06
Jul 0
6Au
g 06
Sep
06Oc
t 06
Nov
06
Dec
06Ja
n 07
Feb
07M
ar 0
7Ap
r 07
May
07
Jun
07Ju
l 07
Aug
07Se
p 07
Oct 0
7N
ov 0
7De
c 07
Jan
08Fe
b 08
Mar
08
Apr 0
8M
ay 0
8Ju
n 08
Jul 0
8Au
g 08
Sep
08Oc
t 08
Nov
08
Dec
08
–5.5 Total industry growth
Figure 2: Monthly airline industry growth, 2006–08
Source: González, 2008.
Indu
stry
gro
wth
(per
cent
)
part1.r2 2/26/09 11:59 AM Page 99
The Travel & Tourism Competitiveness Report 2009 © 2009 World Economic Forum

A roundtable of two dozen hospitality industry pro-fessionals and Cornell faculty members that met onNovember 10, 2008, to discuss key trends facing thelodging industry in 2009 made the following prognosis:
• Lodging supply will continue to grow at between2.5 and 3 percent per year through 2010, whiledemand for lodging will decline by approximately0.5 percent in 2008 and 1 percent in 2009 beforegrowing again in 2010.
• Hotel prices will decline by over 25 percent in theshort term as a result of the increased cost of debtcapital and slower industry growth.
• Most agree that future lending criteria will be moreconservative, but, within these strictures, some dealswill still be made.
• When an economic turnaround occurs, it willoccur quickly.
• Owners and operators will likely increase theircooperation in order to get through what everyoneknows will be a very difficult period.19
Ultimately, however, the lodging industry is alsodriven by trends in GDP growth (or contraction), theavailability of airline seats to take people to destinations,the cost of oil, the increase in hotel room supply, andthe demand for hotel rooms.Therefore, according to arecent PKF Hospitality Research study, the expecteddecline in airline travel will alone bring about a declinein hotel room demand on the order of 1 to 1.5percent.20
With respect to market consolidation, the lodgingindustry has been driven by consolidation and takeoversover the past couple of years—notably Blackstone’sHilton, Starwood Capital’s Crillion & Baccarat, andWyndham Worldwide as a spin-off from Cendant.Thistrend is likely to continue as a means to rationalize sup-ply, reduce overhead expenses and the cost of capital, andthereby mitigate the effects of the economic downturn.
How can the Travel &Tourism industry best navigatethese turbulent times?It is likely that the current global economic recession,coupled with factors such as fluctuating fuel prices,global warming, a crisis of governance, and the lack ofconsumer confidence, will act as a catalyst for structuralchange in the sector.To thrive, or even survive, in thisperiod of uncertainty and change, both the T&T indus-try and destinations themselves will need to approachthe challenges in a holistic and systemic manner, asshown in Figure 3.This would allow innovative ideas to
emerge, new directions to be taken, new alliances to beforged, and profits to be reaped.
Sustainable tourism can create innovation and economicgainsInnovation is a promising response to the present periodof crisis, transition, and change.
Current events are reshaping the financial andindustrial world, and the role of institutions and govern-ment.Together with concurrently evolving consumerbehaviors toward climate change, water consumption,and food production, these factors all provide ampleopportunity for innovation. New and profitable partnerships—whether operator to supplier, operator tooperator, or supplier to supplier—can help keep peopletraveling by creating interesting and marketable newproducts and services. In particular, as highlighted by theconclusions of the World Economic Forum’s Travel &Tourism Industry Partnership project “Climate Change:The Route to Copenhagen,” the Travel & Tourismindustry can take advantage of this current period ofuncertainty to increase collaboration among all actors ofthe T&T value chain as well as to initiate innovativepartnership across different industries and create newways of doing business (Figure 4).
For example, increased attention by consumers and governments to the issues of the environment and climate change could offer the T&T sector theopportunity to re-think the way it operates in terms of consumption levels, efficiency, and impact on theenvironment. Sustainable tourism, which has long beenthe object of a semantic debate about how to define it,has, over the course of the last couple of years, becomesynonymous with opportunity for growth and reductionof cost of sales (i.e., the ability to attain financial com-petitiveness). Sustainable tourism therefore could becomea way through which to innovate, and therefore to create competitive advantage for those companies anddestinations able to transform the concept into newmodes of operations and of management.
It could be envisioned that the air transport industrycould expand its scope of business to encompass the“movement of people and goods” regardless of themeans of transportation.This would obviously requireinnovative alliances with other transportation companiesto provide an end-to-end transportation service to customers. Such cooperative business partnerships arecurrently being formed between industries in the T&Tsector in areas such as infrastructure (e.g., the collabora-tion between Air France and Veolia to service customerson short-haul destinations) and energy procurement(e.g., the partnership of the World Wildlife Fund (WWF),the Natural Resources Defense Council (NRDC), andnine major airlines to form the Sustainable AviationFuel Users Group).21
The year 2009 might therefore be a catalytic yearfor the emergence of new alliances for the provision of
100
1.8:
Nav
igat
ing
Yet
Anot
her
Perf
ect
Stor
m
part1.r2 2/26/09 11:59 AM Page 100
The Travel & Tourism Competitiveness Report 2009 © 2009 World Economic Forum

101
1.8:
Nav
igat
ing
Yet
Anot
her
Perf
ect
Stor
m
Figure 4: Leverage cross-sector partnerships to stimulate innovation
Source: World Economic Industry Partnership Project “Travel & Tourism Climate Change: The Route to Copenhagen”; analysis provided by Booz & Co.
Figure 3: Understanding the need for managing change
Source: Author.
Cross-section partnershipsCross-sector opportunities
• Development anddeployment of second-generationbiofuels: algae andjatropha
• Integration of masstransit modes fromairport to city center
• Accelerated deployment of renewable energies
Airplanes, airports,air traffic control
Aircraft, engineOEMs
Hotels Energy/utility firms
Other modes: rail, cruise, car rentals
Stimulate cross-sectorinnovation
MANAGE CHANGE
Understand drivers of change
Analyze trends accelerating structural change
Identify how to overcome barriers
to change
External innovation drivers
• Pressing need forcarbon regulationswith major costimpacts on industry
• Fossil energy pricevolatility and energysecurity
• Growing pressurefrom consumers and investors forenvironmentally sustainable practices
part1.r2 2/26/09 11:59 AM Page 101
The Travel & Tourism Competitiveness Report 2009 © 2009 World Economic Forum

integrated horizontal seamless transportation services.This type of new service provisioning would increaseprofitability of the service providers, enable the rational-ization of investment spent in infrastructure and servicedelivery, and potentially reduce the carbon footprint oftravelers.This new type of passenger service provisioncould provide an economic gain for industry and acompetitive advantage to attract a new customer seg-ment (see Figure 5 for a more detailed explanation).
The challenges for the development of this type ofpartnership include the need to create an appropriateregulatory framework to encourage modal shifts; largeinfrastructure investment cost upfront, with limitedreturns on the investment; and limited public funds,which have other competing agendas such as health andeducation.
Transforming “green tourism” from a niche to a mass phe-nomenonInnovative cooperative partnerships could transform“green tourism” from a niche to a mass phenomenon,thereby creating a competitive advantage for thosecountries with policies that foster such cooperation.Thecurrent approach, of increasing awareness to pay for sus-tainable tourism, however, has not led to desired results.The percent of tourists who are actually aware that sus-tainable tourism options exist is unknown, but it isknown that 6 percent of the total number of touristsactually pay extra for these options, and 34 percentwould be willing to pay extra for them.22
The majority of current voluntary offsettingschemes have a low participation rate and low consumerinvolvement.This lack of participation is largely drivenby three factors: a lack of insight into the spending ofoffsetting funds, the low availability of offsetting options,and the absence of recognized offsetting standards forthe organizations offering these programs.
Three options exist to convert sustainability to amass market phenomenon and therefore provide eco-nomic returns:
• Fit sustainability into existing consumer needs orpreference schemes (e.g., low price):
— Provide multiple options for sustainabletourism to consumers.
— Make sustainable tourism financially attractive.
— Increase the convenience of booking sustain-able tourism.
• Create a new consumer need or preference for sustainability:
— Make the effect of Travel & Tourism on theenvironment more tangible by showing itsimpact on specific destinations (e.g., the coralbleaching that results from increased oceantemperature due to global warming).
— Link tourist payments of offsets to tangiblebenefits on climate.
102
1.8:
Nav
igat
ing
Yet
Anot
her
Perf
ect
Stor
m
Cumulative percent
Airport to city center mass transit connectivity 100 largest cities worldwide (based on population size)
Challenge
High Medium Low None
Current state
Decreasing connectivity
Desired state For example,DelhiMontréalLagos
For example,Mexico CityLos AngelesIstanbul
For example,PhiladelphiaSydney
For example,AmsterdamSingaporeNew York
100
90
80
70
60
50
40
30
20
10
0
Figure 5: Integration of mass transit modes, city to airport: Insights and challenges
Source: World Economic Industry Partnership Project “Travel & Tourism Climate Change: The Route to Copenhagen”; analysis provided by Booz & Co.
IMPLICATIONS
Significant opportunity to reduce CO2
emissions (needs to be further quantified)
Less road congestion and more employee productive hours
Higher travel convenience at a lower cost to the consumer
MASS TRANSIT CONNECTIVITY
Level Availability
High Dedicated(train, bus, subway)
Medium Non-dedicated (train, bus, subway)
Low Limited (train, bus)
None No mass transportation
~70% of the100 biggestcities have
no or lowconnectivity
part1.r2 2/26/09 11:59 AM Page 102
The Travel & Tourism Competitiveness Report 2009 © 2009 World Economic Forum

— Change mindset of tourists and the culture oftourism: make sustainability hot (e.g., makerenting hybrid cars the most desirable of allpossible vehicles).
• Create public-private collaboration for the develop-ment of green standards and labels in Travel &Tourism.As with the food industry, where todayconsumers have a choice of purchasing differentlabels such as fair trade, organic, locally produced,and, increasingly, foods labeled with their “carbonratings,” the T&T industry could encourage govern-ments to create truly global, world-recognized“green labels” that would be not limited only toreporting carbon footprinting but also wouldinclude a measurement of sustainable practices thatilluminates their impact on local communities andthe environment as a whole.
Creating “tourism green funds”: Destinations and industryworking togetherPresently, public and private money is being diverted tofinance investments in emissions mitigation measures.For example:
• The Global Environment Facility (GEF) fund managed by the United Nations FrameworkConvention on Climate Change (UNFCCC) andthe World Bank funds for climate change provideapproximately US$2 billion, and bilateral funding
initiatives provide approximately US$3 billion peryear until 2012 for emissions mitigation—but nodirect funding is available for projects directlylinked to Travel & Tourism activities and that would directly impact the overall industry’s carbonfootprint.
• Global venture capital investment has grown fromjust 1.6 percent of total investment in 2003 to 11percent in 2008 (approximately US$12 billion).
However, there are limited funds available for sus-tainable projects in the T&T sector. Moreover, no offset-ting scheme today is directly linked to a tourism-relatedproduct.Thus a true opportunity exists for industry anddestinations to work together to create innovative greenfunds that are linked directly to the T&T offering.Several promising investment options exist for investingin sustainable T&T projects (see Figure 6).
By creating green tourism investment funds,consumers can be proactively engaged in financing sustainable tourism initiatives by overcoming some ofthe structural short-comings of the offsetting funds. Inparticular, this would allow:
• higher transparency—for example, consumers seehow money is being spent in a destination greenproject, and
103
1.8:
Nav
igat
ing
Yet
Anot
her
Perf
ect
Stor
m
Perc
ent
Figure 6: Types of green investment options for the T&T sector
Source: World Economic Industry Partnership Project “Travel & Tourism Climate Change: The Route to Copenhagen”; analysis provided by Booz & Co.
• New Ventures India (NVI) is a joint initiative of the Confederation of Indian Industriesand the World Resources Institute to invest in businesses in ecotourism, green build-ing materials, recycling waste, and renewable energy.
• UNWTO Earth Lung projects include the reforestation of rainforests in Sri Lanka andthe carbon-neutral Sharm el Sheik resort in Egypt.
Tourism destination
Developing countrieswith large dependenceon the T&T sector
• Small island states(e.g., Malta, theMaldives)
• African nations (e.g., Morocco, Egypt)
Transport infrastructure
• Second-generation biofuels (e.g., algae or jatropha)
• Integration of masstransit modes from airport to city centers
Hospitality sector
• Collaborative sourcingof green electricity
• Improvements in build-ing energy efficiency
EXAMPLES OF GREENINVESTMENT FUND
INVESTMENT OPTIONS
part1.r2 2/26/09 11:59 AM Page 103
The Travel & Tourism Competitiveness Report 2009 © 2009 World Economic Forum

• more consumer engagement—for example, ask forinvestments for specific causes, such as preventingthe Maldives flooding.
However, the challenges in creating such funds arenumerous and include the need to:
• Design the right regulatory framework to createincentives for the formation of and investment ingreen funds.This should include, among other items:
— the development of a favorable tax regime(e.g., low capital gains tax) for investments inT&T sustainable projects, and
— linking existing industry-specific offsettingschemes to T&T green investment funds.
• Engage the funding community to invest in sustain-able projects specific to the T&T sector.This couldbe done by:
— mobilizing industry to showcase T&T sustain-able projects, and
— incentivizing travelers to contribute to theinvestment fund.
• Define the governance and operating model of thegreen T&T investment fund in terms of:
— the management and board of governors forthe investment fund,
— the identification of investment projects, and
— an understanding of the economic require-ments of investors in such funds.
ConclusionsThe present economic crisis has highlighted the urgentneed for industry, governments, and society to re-shapecompanies and institutions, to redefine values, and tocollaborate in innovative ways. Only coming together tomeet these urgent needs will ensure the effective andsustainable use of our planet’s scarce resources. For theT&T industry, this translates into the need to fullyembrace the concept of sustainability within day-to-dayoperations as well as in re-formulating new productsand services. Success in this endeavor will ensure notonly that the destinations will be able to reap the bene-fits of Travel & Tourism in the long run, but in the shortrun it will also better prepare companies to ride out thepresent economic turmoil.
There are plenty of opportunities for the sector tocollaborate innovatively to address the challenges of cli-mate change. Some of the most promising cross innova-tive partnership opportunities identified by the Forum’sAviation,Travel & Tourism community have been illus-trated in this chapter, yet many more exist.The World
Economic Forum, through its Industry PartnershipProgramme for the Aviation,Travel & Tourism industry,is engaging all key stakeholders in a collaborative dia-logue to address the barriers to implementing somepromising new cross-industry partnerships for carbonabatement that have been identified by the community.The Forum will continue this dialogue throughout thecourse of 2009–10.
Notes1 Tarlow 2008.
2 Yeoman 2008.
3 Doug Shifflet, president and CEO of D.K. Shifflet & Associates, in an interview in Global Insight (2008).
4 Global Insight 2008.
5 MacInnis 2008.
6 IATA 2008.
7 The six largest US airlines are AMR, Continental, Delta/NorthwestAirlines (Delta and Northwest are now one company), USAirways, United, SouthWest. See ChicagoTribune.com 2008.
8 Sharkey 2008a.
9 IATA Director-General, Giovanni Bisignani, noted that many of thebig banks that previously extended plentiful credit to the industryhave scaled back that activity. See MacInnis 2008.
10 WTM and Euromonitor International 2008.
11 González 2008.
12 ATW Online 2008.
13 Sreenivasan 2008.
14 BNET 2008.
15 Open Skies refers to a bilateral (and sometimes multilateral) AirTransport Agreement that liberalizes the rules for international aviation markets and minimizes government intervention—theprovisions apply to passenger, all-cargo and combination air trans-portation and encompass both scheduled and charter services.
16 Spencer 2008.
17 Moylan 2008.
18 Sharkey 2008b.
19 hospitality-Net 2008.
20 ETN 2008.
21 The Sustainable Aviation Fuel Users Group, formed in September2008, is an initiative to promote the development of biofuels foraviation. See http://www.boeing.com/commercial/environment/pdf/sustainable_aviation_fuel_users_group.pd.
22 TNS Global 2007.
ReferencesATW (Air Transport World) Online. 2008. “China Southern, China
Eastern Ground Aircraft, Cut Flights.” ATW Daily News.November 14. Available at http://www.atwonline.com/news/story.html?storyID=14705.
BNET. 2008. “Egencia Releases 2009 Forecast and First NegotiabilityIndex for Business Travel.” PRNewswire, November 10. Availableat http://findarticles.com/p/articles/mi_m4PRN/is_2008_Nov_10/ai_n30982483.
ChicagoTribune.com. 2008. “Business Travel Takes a Dive, and Airlinesand Hotels Feel It.” eTurboNews, October 26. Available athttp://www.eturbonews.com/5819/business-travel-takes-dive-and-airlines-and-hotels-feel-it.
104
1.8:
Nav
igat
ing
Yet
Anot
her
Perf
ect
Stor
m
part1.r2 2/26/09 11:59 AM Page 104
The Travel & Tourism Competitiveness Report 2009 © 2009 World Economic Forum

ETN (eTurboNews). 2008. “PKF Study Finds U.S. Hotels ExtremelyVulnerable to Sharp Declines in Airline Capacity.” July 9. Availableat http://www.eturbonews.com/3611/pkf-study-finds-us-hotels-extremely-vulnerable-sharp-declines-air.
Global Insight, 2008. “Economic Headwinds Will Slow 2008 U.S.Domestic Travel to 1.99 Billion Person-Trips.” Press Release.October 21. Available at http://www.globalinsight.com/PressRelease/PressReleaseDetail14680.htm.
González, F. A. 2008. Presentation at the Middle East andMediterranean Climate Conference entitled ”Tourism: Respondingto a Turbulent Economy and a Changing Climate.” UNWTO’sBusiness Council with the Egyptian Ministry of Tourism, Sharm elSheikh, Egypt, November 23–24.
hospitality-Net. 2008. “Cornell Finance Roundtable. Real Estate: ExpertsWeigh Risk and Opportunity.” November 14. Available athttp://www.hospitalitynet.org/news/154000390/4038627.search?query=hospitality.
IATA. 2008. “Global Airline Industry Will Lose US$5.2 Billion in 2008:Slowing Demand and High Oil to Blame.” September 3. Availableat http://www.iata.org/pressroom/pr/2008-09-03-01.htm.
MacInnis, L. 2008. “Air Cargo, Passenger Traffic Down Sharply in Crisis.” National Post, October 24. Available at http://www.nationalpost.com/related/topics/story.html?id=905999.
Moylan, M. 2008. “Justice Department Approves NorthWest–DeltaMerger.” Minnesota Public Radio, October 29.
Sharkey, J. 2008a. “Travel Industry Shaken by Economic Downturn.”The New York Times, October 7. Available athttp://docenti.luiss.it/tourism-lazzerini/files/2008/10/http___wwwnytimescom_2008_10_07_business_07outlook.pdf.
Sharkey, J. 2008b. “Luxury Hotels Grapple with Falling Demand.”International Herald Tribune, October 27.
Spencer, C. 2008. “Restructuring Challenges in the Global AirlinesSector.” Financier WorldWide, August. Available athttp://www.financierworldwide.com/result.php?stype=all&keyword=airlines&page=2.
Sreenivasan, V. 2008. “SIA Cuts Capacity to Asian Cities from FallingDemand.” The Business Times, October 30. Available athttp://www.singaporeairfreight.com/ttd_bizenterprise/Singlenews.aspx?DirID=64&rec_code=272792.
Tarlow, P. 2008. “The Economic Threat to the Travel and TourismIndustry.” eTurboNews, October 6. Available at http://www.etur-bonews.com/5416/economic-threat-travel-and-tourism-industry.
TNS Global. 2007. “Quarter of Holidaymakers Say They’ll Switch toGreener Plans.” TNS Global, November 11. Available athttp://www.tnsglobal.com/news/news-4078B2FF93A14AD084EE03C776EE6009.aspx.
WTM (World Travel Market) and Euromonitor International. 2008. WTMGlobal Trends Report 2008. Available at http://www.euromonitor.com/pdf/WTM_Global_Trends_Report_2008.pdf.
Yeoman, I. 2008. “Prospects for World Tourism: Economic Squeeze or Prosperity.” hospitalityNet, July 9. Available at http://www.hospitalitynet.org/news/4036736.search?query=prospects+for+world+tourism+.
105
1.8:
Nav
igat
ing
Yet
Anot
her
Perf
ect
Stor
m
part1.r2 2/26/09 11:59 AM Page 105
The Travel & Tourism Competitiveness Report 2009 © 2009 World Economic Forum

part1.r2 2/26/09 11:59 AM Page 106
The Travel & Tourism Competitiveness Report 2009 © 2009 World Economic Forum

CHAPTER 1.9
Strengthening the Travel &Tourism Competitiveness IndexGEOFFREY LIPMAN
JOHN KESTER
United Nations World Travel Organization (UNWTO)
Once again we offer our views on the application of theTravel & Tourism Competitiveness Index (TTCI) in thespirit of collaboration that has prevailed since this workhas been initiated.We congratulate our partners in theWorld Economic Forum for their commitment to thisprogram. We will step up our contribution to thatpartnership by not only providing data andanalysis but acting to better incorporate theviews of the sector itself.
This time, moreover, the unprecedented economicconditions, market shifts, and evolving policy responseare determining factors in which to consider the Index.This raises the central question of its relevance in a worldof short-term stimulus actions and parallel, longer-termshift to a green economy, coherent with global developmentand climate imperatives. Our comments are thereforefocused only on actions needed to strengthen theuse of the Index for the tourism & travel sectorin this underlying context.
• Summarizing our past views on the Index and thechanges in this edition, we strongly welcome theinitiatives to improve and broaden the base data and particularly to incorporate new environmentalcriteria and information.
• We also welcome the new emphasis on presentationof data by regions, which we have long argued ismore relevant than a global listing with its massiveunfair presentational differential between rich andpoor.We continue to assert that presentation bygross domestic product (GDP) clusters and byregion will be a more valid presentation becausethe competitive gap between rich and poor nationsoften reflects their place in the development cycle,their inherent infrastructure, and their resource dif-ferences as well as their capacity to allocate funds tochange tourism competitiveness. Similarly maturemarkets have had the time to put in place the infra-structure and legal frameworks that are other keycomponents of the TTCI. In fact, this disparity doesmake the Index a useful tool for developmentagencies looking to enhance the tourism competi-tiveness of poor and emerging markets.
• Looking at current global realities, we believe amajor new factor in tourism competitiveness willbe the way in which countries place tourism intheir strategic economic repositioning.
— Stimulation programs seek to create jobs andreignite growth.Tourism has more capacity forjob creation and economic regeneration thanvirtually any other sector.Tourism and travel isone of the largest employment sectors in mostcountries and a fast entry vehicle into theworkforce for young people and women.
107
1.9:
Str
engt
heni
ng t
he T
rave
l & T
ouris
m C
ompe
titiv
enes
s In
dex
part1.r2 2/26/09 11:59 AM Page 107
The Travel & Tourism Competitiveness Report 2009 © 2009 World Economic Forum

Encouraging travel boosts consumer and busi-ness confidence, it strengthens two-way trade,and it promotes export income for the poorestcountries with few similar alternatives. Socountries mainstreaming tourism squarely intheir stimulation priorities will be enhancingtheir socioeconomic competitiveness generallyand in the sector specifically.
— In regard to the parallel shift to a green economy—on the one hand, tourism transformation canbe of immense overall economic value in itsown right, given that the sector produces some5–8 percent of GDP directly and indirectly aswell as one in every 12 to 15 jobs. On theother hand, given that tourism—business andleisure—accounts for some 5 percent of carbonemissions, we must play our part in the globalresponse to climate change. In addition ourrole is highly significant, given the catalyticeffect of the sector in other areas of the econo-my and our strong consumer communicationsactivity.
— Moreover, the value of ecotourism has longbeen recognized as a beacon for environmentalchange, and it is one where poor countrieshave a comparative advantage because of theirnature, culture, and very lack of intensivedevelopment. Similarly, with the exception ofthe newly emerging industrialized economies,the poorest play a negligible role in greenhousegas emissions.
— But ecotourism, as well as green tourism gen-erally, also offers massive potential for industri-alized states competitiveness—particularly inregard to rural transformation and sustainableurban mobility. Better conservation strategiesoffer massive energy savings. Reduction incongestion in the air and on the ground, forexample, is a major factor in intelligent energy use.
— At the same time, the next generation of greenenergy, climate-proofing of buildings and otherinfrastructure, retraining, and education areareas where all states can gain competitiveenhancement in their tourism sector.The useof solar or wind power and clean biofuels areobvious strategic possibilities for hotels andtransport companies.
While serious consideration of these elementssuggests a major new thrust for the TTCI, webelieve that it is actually in keeping with the evolution of the Index to reflect the realities ofgovernment, industry, and market shifts. In orderto better ensure that the sector’s views on thesematters are better reflected in future issues of the Index UNWTO will hold an open global discussion forum on these matters in the secondhalf of 2009.
108
1.9:
Str
engt
heni
ng t
he T
rave
l & T
ouris
m C
ompe
titiv
enes
s In
dex
part1.r2 2/26/09 11:59 AM Page 108
The Travel & Tourism Competitiveness Report 2009 © 2009 World Economic Forum

Part 2 Country/Economy Profilesand Data Presentation
part2A_profiles.r2 2/26/09 4:01 AM Page 109
The Travel & Tourism Competitiveness Report 2009 © 2009 World Economic Forum

part2A_profiles.r2 2/26/09 4:01 AM Page 110
The Travel & Tourism Competitiveness Report 2009 © 2009 World Economic Forum

2.1 Country/Economy Profiles
part2A_profiles.r2 2/26/09 4:01 AM Page 111
The Travel & Tourism Competitiveness Report 2009 © 2009 World Economic Forum

part2A_profiles.r2 2/26/09 4:01 AM Page 112
The Travel & Tourism Competitiveness Report 2009 © 2009 World Economic Forum

AlbaniaKey indicatorsPopulation (millions), 2007..............................................................................3.2Surface area (1,000 square kilometers) ........................................................28.8
Gross domestic product (US$ billions), 2007 ...............................................10.8Gross domestic product (PPP, US$) per capita, 2007 .............................6,298.5Real GDP growth (percent), 2007...................................................................6.0
Environmental Performance Index, 2008 (out of 149 countries).....................27
Travel & Tourism indicators
T&T industry, 2008 estimatesGDP (US$ millions) ................................................................513...................4.1 ....................4.9Employment (1,000 jobs).........................................................41...................3.3 ....................1.8
T&T economy, 2008 estimatesGDP (US$ millions) .............................................................1,845.................14.7 ....................4.9Employment (1,000 jobs).......................................................149.................11.9 ....................1.9
Source: World Travel & Tourism Council, TSA Research 2008
International tourist arrivals (thousands), 2007........................57International tourism receipts (US$ millions), 2007 ...........1,372
Source: United Nations World Tourism Organization
Travel & Tourism Competitiveness Index
2009 Index......................................................................................................90 3.72008 Index............................................................................................................92 3.6T&T regulatory framework ..............................................................................77 4.4
Policy rules and regulations..........................................................................92 4.0Environmental sustainability..........................................................................88 4.2Safety and security .........................................................................................63 5.2Health and hygiene .........................................................................................59 4.9Prioritization of Travel & Tourism................................................................107 3.6
T&T business environment and infrastructure ..........................................104 2.8Air transport infrastructure ........................................................................104 2.4Ground transport infrastructure..................................................................113 2.5Tourism infrastructure ....................................................................................85 2.2ICT infrastructure ............................................................................................89 2.3Price competitiveness in the T&T industry.................................................84 4.4
T&T human, cultural, and natural resources ...............................................66 3.9Human resources ............................................................................................62 5.1
Education and training .............................................................................85 4.3Availability of qualified labor...................................................................12 5.9
Affinity for Travel & Tourism ............................................................................4 6.4Natural resources .........................................................................................129 2.1Cultural resources...........................................................................................79 2.0
Note: For descriptions of variables and detailed sources, please refer to “How to the Read Country/Economy Profiles.”
Rank Score(out of 133) (1–7 scale)
International tourist arrivals (thousands)
International tourism receipts (US$ millions)
1995 1996 1997 1998 1999 2000 2001 2002 2003 2004 2005 2006 20070
300
600
900
1,200
1,500
1 2 3 4 5 6 7
2009–2018Percent annual growth of total (%, forecast)
113
How
to R
ead
the
Coun
try/E
cono
my
Prof
iles
This section presents two-page profiles for all the 133 economies included in the Travel & TourismCompetitiveness Report 2009.
Left-hand page
Key indicatorsThe first section presents several key indicators that give a sense of the size of the country and its economy.Population and surface area figures are from the WorldBank’s World Development Indicators Online Database(December 2008). GDP numbers are from theInternational Monetary Fund (IMF)’s World EconomicOutlook Database (October 2008 edition).TheEnvironmental Performance Index rankings are from YCELP,Yale University and CIESIN, ColumbiaUniversity. National sources have been consulted where appropriate.
Travel & Tourism indicatorsThe second section presents Travel & Tourism (T&T)indicators that aim to provide a measure of the past,current, and projected future activity of Travel & Tourismin each economy.This section is split into two parts:
The first part presents data from the TourismSatellite Accounting Research carried out annuallyby the World Travel & Tourism Council (WTTC).Developed by the United Nations World TourismOrganization (UNWTO), the Organisation forEconomic Co-operation and Development (OECD),and Eurostat, the Tourism Satellite Accounting(TSA) framework is a statistical tool—includingconcepts, definitions, aggregates, classifications, andtables—that is compatible with internationalnational accounting guidelines and allows for validinternational comparisons.The TSA also makesthese estimates comparable with other internation-ally recognized macroeconomic aggregates andcompilations. Using the TSA approach,WTTC esti-mates the current and projected future economiccontribution of Travel & Tourism in terms of aneconomy’s GDP and employment.WTTC definesthe T&T industry as a narrow perspective of T&Tactivity that captures the production-side industrycontribution (that is, direct impact only).The T&Teconomy is a broader perspective of Travel &Tourism that takes into consideration the direct
as well as the indirect contributions by traditionaltravel service providers and industry suppliers within the resident economy.
This latter perspective is used when one wantsto understand the total impact of Travel & Tourismon the resident economy. More information regard-ing WTTC’s TSA Research, along with details onthe methodology and data, are available athttp://www.wttc.org/eng/Tourism_Research/.
The second part of the T&T indicators presentsdata on international tourist arrivals and interna-tional tourism receipts over the period 1995 to2007. In some cases data are missing for particularyears.The graph shows all available data during this period for each economy.The data for theseindicators were provided by the UNWTO.
The number of international touristarrivals, expressed in thousands, is the most com-mon unit of measure used to quantify the volumeof international tourism for statistical purposes. Itincludes exclusively overnight visitors—that is,tourists who stay at least one night in a collective
How to Read the Country/Economy Profiles
part2A_profiles.r2 2/26/09 4:01 AM Page 113
The Travel & Tourism Competitiveness Report 2009 © 2009 World Economic Forum
114
How
to R
ead
the
Coun
try/E
cono
my
Prof
iles
or private accommodation in the country visited.Same-day visitors are not included.The number of arrivals does not necessarily correspond to thenumber of persons.The same person who makesseveral trips to a given country during a given period will be counted as a new arrival each time.
International tourism receipts, expressed in millions of current US dollars, are the receiptsearned by a destination country from inboundtourism and cover all tourism receipts resultingfrom expenditures made by visitors from abroad,on, for instance, lodging, food and drinks, fuel,transport in the country, entertainment, shopping,and so on.This measure includes receipts generatedby overnight as well as by same-day trips. Receiptsfrom same-day trips can be substantial, as in thecase of countries where a lot of shopping for goodsand services takes place by visitors from neighbor-ing countries.
Travel & Tourism Competitiveness IndexThe third section of the page presents the economy’sperformance on the Travel & Tourism CompetitivenessIndex (TTCI) and its various components. For furtheranalysis, the Data Tables at the end of the Report providedetailed rankings and scores for each of the variablesincluded in the TTCI.
Right-hand page
Travel & Tourism competitiveness index in detailThis page presents the rank achieved by a country oneach of the indicators entering the composition of theTTCI. Indicators are organized by pillar. Please refer toAppendix A of Chapter 1.1 for the detailed structure ofthe TTCI.
Next to the rank, a colored square indicateswhether the indicator constitutes an advantage (bluesquare) or a disadvantage (gray square) for the country.In order to identify variables as advantage or disadvan-tages, the following rules are applied:
• For the top 10 economies in the overall TTCI, anyvariables on which the economy is ranked 10th orhigher are considered to be advantages.Any variablesranked below 10 are considered to be disadvantages.For example, Spain, ranked 6th overall, has the indicator “number of World Heritage cultural sites”(ranked 2nd) listed as an advantage, while the indicator “stringency of environmental regulation”(36th) is considered a disadvantage.
• For those economies ranked from 11th to 50th onthe overall TTCI, any variables with a higher rankthan the economy’s overall rank are considered tobe advantages.Any variables ranked equal to, orlower than, the economy’s overall rank are disad-
vantages. For example, Slovenia ranks 35th overall.Thus,“hotel price index,” on which the countryranks 24th, is an advantage, while the “attitude ofpopulation toward foreign visitors” (68th) and“number of operating airlines” (103rd) both consti-tute disadvantages.
• For economies with an overall rank on the TTCIlower than 50, any variables for which the economyhas a rank of 50 or higher are considered to beadvantages.Any variables ranked below 50 are con-sidered to be disadvantages. For example, ranked68th overall, Oman has the variable “sustainabilityof T&T industry development” (22nd) listed as anadvantage, while the variable “carbon dioxide emis-sions” (113th) is a disadvantage.
The Travel & Tourism Competitiveness Index in detail ■ Competitive Advantage ■ Competitive Disadvantage
INDICATOR RANK/133
1st pillar: Policy rules and regulations1.01 Prevalence of foreign ownership ...............................111 ...■1.02 Property rights............................................................126 ...■1.03 Business impact of rules on FDI ................................116 ...■1.04 Visa requirements* ......................................................83 ...■1.05 Openness of bilateral Air Service Agreements* ..........69 ...■1.06 Transparency of government policymaking................122 ...■1.07 Time required to start a business*...............................20 ...■1.08 Cost to start a business* .............................................90 ...■
2nd pillar: Environmental sustainability2.01 Stringency of environmental regulation .....................129 ...■2.02 Enforcement of environmental regulation..................125 ...■2.03 Sustainability of T&T industry development...............114 ...■2.04 Carbon dioxide emissions* ..........................................39 ...■2.05 Particulate matter concentration* ................................84 ...■2.06 Threatened species* ....................................................35 ...■2.07 Environmental treaty ratification*.................................81 ...■
3rd pillar: Safety and security3.01 Business costs of terrorism .........................................87 ...■3.02 Reliability of police services .........................................81 ...■3.03 Business costs of crime and violence..........................77 ...■3.04 Road traffic accidents*...................................................8 ...■
4th pillar: Health and hygiene4.01 Physician density*........................................................81 ...■4.02 Access to improved sanitation* ...................................40 ...■4.03 Access to improved drinking water*............................53 ...■4.04 Hospital beds*..............................................................57 ...■
5th pillar: Prioritization of Travel & Tourism5.01 Government prioritization of the T&T industry.............89 ...■5.02 T&T government expenditure* ....................................52 ...■5.03 Effectiveness of marketing and branding...................116 ...■5.04 T&T fair attendance*....................................................98 ...■
6th pillar: Air transport infrastructure6.01 Quality of air transport infrastructure ...........................76 ...■6.02 Available seat kilometers, domestic*.........................100 ...■6.03 Available seat kilometers, international* ....................114 ...■6.04 Departures per 1,000 population*................................84 ...■6.05 Airport density* ..........................................................102 ...■6.06 Number of operating airlines*......................................92 ...■6.07 International air transport network ...............................83 ...■
7th pillar: Ground transport infrastructure7.01 Quality of roads ..........................................................114 ...■7.02 Quality of railroad infrastructure.................................108 ...■7.03 Quality of port infrastructure ......................................124 ...■7.04 Quality of ground transport network..........................123 ...■7.05 Road density*...............................................................46 ...■
INDICATOR RANK/133
8th pillar: Tourism infrastructure8.01 Hotel rooms*................................................................95 ...■8.02 Presence of major car rental companies*....................73 ...■8.03 ATMs accepting Visa cards* ........................................82 ...■
9th pillar: ICT infrastructure9.01 Extent of business Internet use.................................114 ...■9.02 Internet users* .............................................................81 ...■9.03 Telephone lines*...........................................................86 ...■9.04 Broadband Internet subscribers* ...............................119 ...■9.05 Mobile telephone subscribers*....................................76 ...■
10th pillar: Price competitiveness in the T&T industry10.01 Ticket taxes and airport charges*...............................116 ...■10.02 Purchasing power parity*.............................................54 ...■10.03 Extent and effect of taxation........................................68 ...■10.04 Fuel price levels* .......................................................111 ...■10.05 Hotel price index* ........................................................48 ...■
11th pillar: Human resources11.01 Primary education enrollment* ....................................65 ...■11.02 Secondary education enrollment*................................88 ...■11.03 Quality of the educational system................................80 ...■11.04 Local availability of research and training services.....124 ...■11.05 Extent of staff training..................................................71 ...■11.06 Hiring and firing practices.............................................27 ...■11.07 Ease of hiring foreign labor ............................................2 ...■11.08 HIV prevalence* ...........................................................22 ...■11.09 Business impact of HIV/AIDS.......................................56 ...■11.10 Life expectancy* ..........................................................76 ...■
12th pillar: Affinity for Travel & Tourism12.01 Tourism openness* ........................................................2 ...■12.02 Attitude of population toward foreign visitors..............55 ...■12.03 Extension of business trips recommended .................42 ...■
13th pillar: Natural resources13.01 Number of World Heritage natural sites* ....................74 ...■13.02 Protected areas* ..........................................................80 ...■13.03 Quality of the natural environment.............................130 ...■13.04 Total known species*...................................................98 ...■
14th pillar: Cultural resources14.01 Number of World Heritage cultural sites* ...................65 ...■14.02 Sports stadiums* .........................................................42 ...■14.03 Number of international fairs and exhibitions* ..........107 ...■14.04 Creative industries exports*.........................................93 ...■
Albania
part2A_profiles.r2 2/26/09 4:01 AM Page 114
The Travel & Tourism Competitiveness Report 2009 © 2009 World Economic Forum

List
of
Coun
trie
s/Ec
onom
ies
List of Countries/Economies
115
Country/Economy Page
Albania 116Algeria 118Argentina 120Armenia 122Australia 124Austria 126Azerbaijan 128Bahrain 130Bangladesh 132Barbados 134Belgium 136Benin 138Bolivia 140Bosnia and Herzegovina 142Botswana 144Brazil 146Brunei Darussalam 148Bulgaria 150Burkina Faso 152Burundi 154Cambodia 156Cameroon 158Canada 160Chad 162Chile 164China 166Colombia 168Costa Rica 170Côte d’Ivoire 172Croatia 174Cyprus 176Czech Republic 178Denmark 180Dominican Republic 182Ecuador 184Egypt 186El Salvador 188Estonia 190Ethiopia 192Finland 194France 196Gambia, The 198Georgia 200Germany 202Ghana 204
Country/Economy Page
Greece 206Guatemala 208Guyana 210Honduras 212Hong Kong SAR 214Hungary 216Iceland 218India 220Indonesia 222Ireland 224Israel 226Italy 228Jamaica 230Japan 232Jordan 234Kazakhstan 236Kenya 238Korea, Rep. 240Kuwait 242Kyrgyz Republic 244Latvia 246Lesotho 248Libya 250Lithuania 252Luxembourg 254Macedonia, FYR 256Madagascar 258Malawi 260Malaysia 262Mali 264Malta 266Mauritania 268Mauritius 270Mexico 272Moldova 274Mongolia 276Montenegro 278Morocco 280Mozambique 282Namibia 284Nepal 286Netherlands 288New Zealand 290Nicaragua 292Nigeria 294
Country/Economy Page
Norway 296Oman 298Pakistan 300Panama 302Paraguay 304Peru 306Philippines 308Poland 310Portugal 312Puerto Rico 314Qatar 316Romania 318Russian Federation 320Saudi Arabia 322Senegal 324Serbia 326Singapore 328Slovak Republic 330Slovenia 332South Africa 334Spain 336Sri Lanka 338Suriname 340Sweden 342Switzerland 344Syria 346Taiwan, China 348Tajikistan 350Tanzania 352Thailand 354Trinidad and Tobago 356Tunisia 358Turkey 360Uganda 362Ukraine 364United Arab Emirates 366United Kingdom 368United States 370Uruguay 372Venezuela 374Vietnam 376Zambia 378Zimbabwe 380
part2A_profiles.r2 2/26/09 4:01 AM Page 115
The Travel & Tourism Competitiveness Report 2009 © 2009 World Economic Forum

116
2.1:
Cou
ntry
/Eco
nom
y Pr
ofile
s
AlbaniaKey indicatorsPopulation (millions), 2007..............................................................................3.2Surface area (1,000 square kilometers) ........................................................28.8
Gross domestic product (US$ billions), 2007 ...............................................10.8Gross domestic product (PPP, US$) per capita, 2007 .............................6,298.5Real GDP growth (percent), 2007...................................................................6.0
Environmental Performance Index, 2008 (out of 149 countries).....................27
Travel & Tourism indicators
T&T industry, 2008 estimatesGDP (US$ millions) ................................................................513...................4.1 ....................4.9Employment (1,000 jobs).........................................................41...................3.3 ....................1.8
T&T economy, 2008 estimatesGDP (US$ millions) .............................................................1,845.................14.7 ....................4.9Employment (1,000 jobs).......................................................149.................11.9 ....................1.9
Source: World Travel & Tourism Council, TSA Research 2008
International tourist arrivals (thousands), 2007........................57International tourism receipts (US$ millions), 2007 ...........1,372
Source: United Nations World Tourism Organization
Travel & Tourism Competitiveness Index
2009 Index......................................................................................................90 3.72008 Index............................................................................................................92 3.6T&T regulatory framework ..............................................................................77 4.4
Policy rules and regulations..........................................................................92 4.0Environmental sustainability..........................................................................88 4.2Safety and security .........................................................................................63 5.2Health and hygiene .........................................................................................59 4.9Prioritization of Travel & Tourism................................................................107 3.6
T&T business environment and infrastructure ..........................................104 2.8Air transport infrastructure ........................................................................104 2.4Ground transport infrastructure..................................................................113 2.5Tourism infrastructure ....................................................................................85 2.2ICT infrastructure ............................................................................................89 2.3Price competitiveness in the T&T industry.................................................84 4.4
T&T human, cultural, and natural resources ...............................................66 3.9Human resources ............................................................................................62 5.1
Education and training .............................................................................85 4.3Availability of qualified labor...................................................................12 5.9
Affinity for Travel & Tourism ............................................................................4 6.4Natural resources .........................................................................................129 2.1Cultural resources...........................................................................................79 2.0
Note: For descriptions of variables and detailed sources, please refer to “How to the Read Country/Economy Profiles.”
Rank Score(out of 133) (1–7 scale)
International tourist arrivals (thousands)
International tourism receipts (US$ millions)
1995 1996 1997 1998 1999 2000 2001 2002 2003 2004 2005 2006 20070
300
600
900
1,200
1,500
1 2 3 4 5 6 7
2009–2018Percent annual growth of total (%, forecast)
part2A_profiles.r2 2/26/09 4:01 AM Page 116
The Travel & Tourism Competitiveness Report 2009 © 2009 World Economic Forum

117
2.1:
Cou
ntry
/Eco
nom
y Pr
ofile
s
The Travel & Tourism Competitiveness Index in detail ■ Competitive Advantage ■ Competitive Disadvantage
INDICATOR RANK/133
1st pillar: Policy rules and regulations1.01 Prevalence of foreign ownership ...............................111 ...■1.02 Property rights............................................................126 ...■1.03 Business impact of rules on FDI ................................116 ...■1.04 Visa requirements* ......................................................83 ...■1.05 Openness of bilateral Air Service Agreements* ..........69 ...■1.06 Transparency of government policymaking................122 ...■1.07 Time required to start a business*...............................20 ...■1.08 Cost to start a business* .............................................90 ...■
2nd pillar: Environmental sustainability2.01 Stringency of environmental regulation .....................129 ...■2.02 Enforcement of environmental regulation..................125 ...■2.03 Sustainability of T&T industry development...............114 ...■2.04 Carbon dioxide emissions* ..........................................39 ...■2.05 Particulate matter concentration* ................................84 ...■2.06 Threatened species* ....................................................35 ...■2.07 Environmental treaty ratification*.................................81 ...■
3rd pillar: Safety and security3.01 Business costs of terrorism .........................................87 ...■3.02 Reliability of police services .........................................81 ...■3.03 Business costs of crime and violence..........................77 ...■3.04 Road traffic accidents*...................................................8 ...■
4th pillar: Health and hygiene4.01 Physician density*........................................................81 ...■4.02 Access to improved sanitation* ...................................40 ...■4.03 Access to improved drinking water*............................53 ...■4.04 Hospital beds*..............................................................57 ...■
5th pillar: Prioritization of Travel & Tourism5.01 Government prioritization of the T&T industry.............89 ...■5.02 T&T government expenditure* ....................................52 ...■5.03 Effectiveness of marketing and branding...................116 ...■5.04 T&T fair attendance*....................................................98 ...■
6th pillar: Air transport infrastructure6.01 Quality of air transport infrastructure ...........................76 ...■6.02 Available seat kilometers, domestic*.........................100 ...■6.03 Available seat kilometers, international* ....................114 ...■6.04 Departures per 1,000 population*................................84 ...■6.05 Airport density* ..........................................................102 ...■6.06 Number of operating airlines*......................................92 ...■6.07 International air transport network ...............................83 ...■
7th pillar: Ground transport infrastructure7.01 Quality of roads ..........................................................114 ...■7.02 Quality of railroad infrastructure.................................108 ...■7.03 Quality of port infrastructure ......................................124 ...■7.04 Quality of ground transport network..........................123 ...■7.05 Road density*...............................................................46 ...■
INDICATOR RANK/133
8th pillar: Tourism infrastructure8.01 Hotel rooms*................................................................95 ...■8.02 Presence of major car rental companies*....................73 ...■8.03 ATMs accepting Visa cards* ........................................82 ...■
9th pillar: ICT infrastructure9.01 Extent of business Internet use.................................114 ...■9.02 Internet users* .............................................................81 ...■9.03 Telephone lines*...........................................................86 ...■9.04 Broadband Internet subscribers* ...............................119 ...■9.05 Mobile telephone subscribers*....................................76 ...■
10th pillar: Price competitiveness in the T&T industry10.01 Ticket taxes and airport charges*...............................116 ...■10.02 Purchasing power parity*.............................................54 ...■10.03 Extent and effect of taxation........................................68 ...■10.04 Fuel price levels* .......................................................111 ...■10.05 Hotel price index* ........................................................48 ...■
11th pillar: Human resources11.01 Primary education enrollment* ....................................65 ...■11.02 Secondary education enrollment*................................88 ...■11.03 Quality of the educational system................................80 ...■11.04 Local availability of research and training services.....124 ...■11.05 Extent of staff training..................................................71 ...■11.06 Hiring and firing practices.............................................27 ...■11.07 Ease of hiring foreign labor ............................................2 ...■11.08 HIV prevalence* ...........................................................22 ...■11.09 Business impact of HIV/AIDS.......................................56 ...■11.10 Life expectancy* ..........................................................76 ...■
12th pillar: Affinity for Travel & Tourism12.01 Tourism openness* ........................................................2 ...■12.02 Attitude of population toward foreign visitors..............55 ...■12.03 Extension of business trips recommended .................42 ...■
13th pillar: Natural resources13.01 Number of World Heritage natural sites* ....................74 ...■13.02 Protected areas* ..........................................................80 ...■13.03 Quality of the natural environment.............................130 ...■13.04 Total known species*...................................................98 ...■
14th pillar: Cultural resources14.01 Number of World Heritage cultural sites* ...................65 ...■14.02 Sports stadiums* .........................................................42 ...■14.03 Number of international fairs and exhibitions* ..........107 ...■14.04 Creative industries exports*.........................................93 ...■
Albania
* Hard data
Note: For further details and explanation, please refer to the section “How toRead the Country/Economy Profiles” at the beginning of this chapter.
part2A_profiles.r2 2/26/09 4:01 AM Page 117
The Travel & Tourism Competitiveness Report 2009 © 2009 World Economic Forum

118
2.1:
Cou
ntry
/Eco
nom
y Pr
ofile
s
AlgeriaKey indicatorsPopulation (millions), 2007............................................................................33.9Surface area (1,000 square kilometers) ...................................................2,381.7
Gross domestic product (US$ billions), 2007 .............................................134.3Gross domestic product (PPP, US$) per capita, 2007 .............................6,538.7Real GDP growth (percent), 2007...................................................................4.6
Environmental Performance Index, 2008 (out of 149 countries).....................66
Travel & Tourism indicators
T&T industry, 2008 estimatesGDP (US$ millions) .............................................................2,190...................1.6 ....................5.6Employment (1,000 jobs).......................................................138...................1.5 ....................3.5
T&T economy, 2008 estimatesGDP (US$ millions) .............................................................8,733...................6.4 ....................4.8Employment (1,000 jobs).......................................................506...................5.6 ....................2.8
Source: World Travel & Tourism Council, TSA Research 2008
International tourist arrivals (thousands), 2007...................1,743International tourism receipts (US$ millions), 2006 ..............215
Source: United Nations World Tourism Organization
Travel & Tourism Competitiveness Index
2009 Index....................................................................................................115 3.32008 Index..........................................................................................................102 3.5T&T regulatory framework ............................................................................108 3.9
Policy rules and regulations........................................................................111 3.7Environmental sustainability........................................................................116 3.9Safety and security .........................................................................................97 4.6Health and hygiene .........................................................................................81 4.2Prioritization of Travel & Tourism................................................................124 3.0
T&T business environment and infrastructure ............................................98 2.8Air transport infrastructure ........................................................................110 2.3Ground transport infrastructure..................................................................101 2.7Tourism infrastructure ....................................................................................95 1.9ICT infrastructure ............................................................................................97 2.1Price competitiveness in the T&T industry.................................................32 5.1
T&T human, cultural, and natural resources .............................................127 3.2Human resources ..........................................................................................101 4.5
Education and training .............................................................................98 4.2Availability of qualified labor.................................................................113 4.9
Affinity for Travel & Tourism ........................................................................132 3.6Natural resources .........................................................................................105 2.5Cultural resources...........................................................................................69 2.2
Note: For descriptions of variables and detailed sources, please refer to “How to the Read Country/Economy Profiles.”
Rank Score(out of 133) (1–7 scale)
International tourist arrivals (thousands)
International tourism receipts (US$ millions)
1995 1996 1997 1998 1999 2000 2001 2002 2003 2004 2005 2006 20070
500
1,000
1,500
2,000
1 2 3 4 5 6 7
2009–2018Percent annual growth of total (%, forecast)
part2A_profiles.r2 2/26/09 4:01 AM Page 118
The Travel & Tourism Competitiveness Report 2009 © 2009 World Economic Forum

119
2.1:
Cou
ntry
/Eco
nom
y Pr
ofile
s
The Travel & Tourism Competitiveness Index in detail ■ Competitive Advantage ■ Competitive Disadvantage
INDICATOR RANK/133
1st pillar: Policy rules and regulations1.01 Prevalence of foreign ownership ...............................129 ...■1.02 Property rights............................................................115 ...■1.03 Business impact of rules on FDI ................................115 ...■1.04 Visa requirements* ....................................................120 ...■1.05 Openness of bilateral Air Service Agreements* ........105 ...■1.06 Transparency of government policymaking................112 ...■1.07 Time required to start a business*...............................68 ...■1.08 Cost to start a business* .............................................66 ...■
2nd pillar: Environmental sustainability2.01 Stringency of environmental regulation .....................114 ...■2.02 Enforcement of environmental regulation..................100 ...■2.03 Sustainability of T&T industry development...............100 ...■2.04 Carbon dioxide emissions* ..........................................84 ...■2.05 Particulate matter concentration* ..............................102 ...■2.06 Threatened species* ....................................................91 ...■2.07 Environmental treaty ratification*.................................67 ...■
3rd pillar: Safety and security3.01 Business costs of terrorism .......................................123 ...■3.02 Reliability of police services .........................................72 ...■3.03 Business costs of crime and violence..........................85 ...■3.04 Road traffic accidents*.................................................94 ...■
4th pillar: Health and hygiene4.01 Physician density*........................................................85 ...■4.02 Access to improved sanitation* ...................................48 ...■4.03 Access to improved drinking water*............................91 ...■4.04 Hospital beds*..............................................................89 ...■
5th pillar: Prioritization of Travel & Tourism5.01 Government prioritization of the T&T industry...........123 ...■5.02 T&T government expenditure* ..................................116 ...■5.03 Effectiveness of marketing and branding...................120 ...■5.04 T&T fair attendance*....................................................81 ...■
6th pillar: Air transport infrastructure6.01 Quality of air transport infrastructure .........................106 ...■6.02 Available seat kilometers, domestic*...........................41 ...■6.03 Available seat kilometers, international* ......................72 ...■6.04 Departures per 1,000 population*................................85 ...■6.05 Airport density* ............................................................55 ...■6.06 Number of operating airlines*......................................84 ...■6.07 International air transport network .............................125 ...■
7th pillar: Ground transport infrastructure7.01 Quality of roads ............................................................77 ...■7.02 Quality of railroad infrastructure...................................63 ...■7.03 Quality of port infrastructure ......................................103 ...■7.04 Quality of ground transport network..........................111 ...■7.05 Road density*.............................................................119 ...■
INDICATOR RANK/133
8th pillar: Tourism infrastructure8.01 Hotel rooms*................................................................94 ...■8.02 Presence of major car rental companies*....................73 ...■8.03 ATMs accepting Visa cards* ......................................124 ...■
9th pillar: ICT infrastructure9.01 Extent of business Internet use.................................133 ...■9.02 Internet users* .............................................................92 ...■9.03 Telephone lines*...........................................................96 ...■9.04 Broadband Internet subscribers* .................................84 ...■9.05 Mobile telephone subscribers*....................................64 ...■
10th pillar: Price competitiveness in the T&T industry10.01 Ticket taxes and airport charges*.................................60 ...■10.02 Purchasing power parity*.............................................51 ...■10.03 Extent and effect of taxation........................................58 ...■10.04 Fuel price levels* ...........................................................7 ...■10.05 Hotel price index* ........................................................92 ...■
11th pillar: Human resources11.01 Primary education enrollment* ....................................50 ...■11.02 Secondary education enrollment*................................78 ...■11.03 Quality of the educational system..............................122 ...■11.04 Local availability of research and training services.....111 ...■11.05 Extent of staff training................................................127 ...■11.06 Hiring and firing practices...........................................118 ...■11.07 Ease of hiring foreign labor ........................................123 ...■11.08 HIV prevalence* ...........................................................22 ...■11.09 Business impact of HIV/AIDS.......................................87 ...■11.10 Life expectancy* ..........................................................76 ...■
12th pillar: Affinity for Travel & Tourism12.01 Tourism openness* ....................................................131 ...■12.02 Attitude of population toward foreign visitors............128 ...■12.03 Extension of business trips recommended ...............128 ...■
13th pillar: Natural resources13.01 Number of World Heritage natural sites* ....................40 ...■13.02 Protected areas* ..........................................................94 ...■13.03 Quality of the natural environment.............................111 ...■13.04 Total known species*...................................................82 ...■
14th pillar: Cultural resources14.01 Number of World Heritage cultural sites* ...................22 ...■14.02 Sports stadiums* .........................................................87 ...■14.03 Number of international fairs and exhibitions* ..........107 ...■14.04 Creative industries exports*.......................................107 ...■
Algeria
* Hard data
Note: For further details and explanation, please refer to the section “How toRead the Country/Economy Profiles” at the beginning of this chapter.
part2A_profiles.r2 2/26/09 4:01 AM Page 119
The Travel & Tourism Competitiveness Report 2009 © 2009 World Economic Forum

120
2.1:
Cou
ntry
/Eco
nom
y Pr
ofile
s
ArgentinaKey indicatorsPopulation (millions), 2007............................................................................39.5Surface area (1,000 square kilometers) ...................................................2,780.4
Gross domestic product (US$ billions), 2007 .............................................260.1Gross domestic product (PPP, US$) per capita, 2007 ...........................13,317.8Real GDP growth (percent), 2007...................................................................8.7
Environmental Performance Index, 2008 (out of 149 countries).....................38
Travel & Tourism indicators
T&T industry, 2008 estimatesGDP (US$ millions) .............................................................9,448...................3.3 ....................3.3Employment (1,000 jobs).......................................................783...................4.6 ....................1.6
T&T economy, 2008 estimatesGDP (US$ millions) ...........................................................25,427...................8.8 ....................3.6Employment (1,000 jobs)....................................................1,813.................10.5 ....................1.9
Source: World Travel & Tourism Council, TSA Research 2008
International tourist arrivals (thousands), 2007...................4,562International tourism receipts (US$ millions), 2007 ...........4,313
Source: United Nations World Tourism Organization
Travel & Tourism Competitiveness Index
2009 Index......................................................................................................65 4.12008 Index............................................................................................................58 4.2T&T regulatory framework ..............................................................................74 4.4
Policy rules and regulations..........................................................................98 3.9Environmental sustainability........................................................................119 3.9Safety and security .......................................................................................102 4.5Health and hygiene .........................................................................................43 5.6Prioritization of Travel & Tourism..................................................................79 4.1
T&T business environment and infrastructure ............................................70 3.5Air transport infrastructure ..........................................................................72 2.9Ground transport infrastructure..................................................................105 2.7Tourism infrastructure ....................................................................................52 3.8ICT infrastructure ............................................................................................53 3.3Price competitiveness in the T&T industry.................................................52 4.9
T&T human, cultural, and natural resources ...............................................41 4.3Human resources ............................................................................................73 5.0
Education and training .............................................................................67 4.7Availability of qualified labor...................................................................83 5.3
Affinity for Travel & Tourism ..........................................................................94 4.5Natural resources ...........................................................................................13 4.9Cultural resources...........................................................................................43 2.9
Note: For descriptions of variables and detailed sources, please refer to “How to the Read Country/Economy Profiles.”
Rank Score(out of 133) (1–7 scale)
International tourist arrivals (thousands)
International tourism receipts (US$ millions)
1995 1996 1997 1998 1999 2000 2001 2002 2003 2004 2005 2006 20071,000
2,000
3,000
4,000
5,000
1 2 3 4 5 6 7
2009–2018Percent annual growth of total (%, forecast)
part2A_profiles.r2 2/26/09 4:01 AM Page 120
The Travel & Tourism Competitiveness Report 2009 © 2009 World Economic Forum

121
2.1:
Cou
ntry
/Eco
nom
y Pr
ofile
s
The Travel & Tourism Competitiveness Index in detail ■ Competitive Advantage ■ Competitive Disadvantage
INDICATOR RANK/133
1st pillar: Policy rules and regulations1.01 Prevalence of foreign ownership .................................96 ...■1.02 Property rights............................................................127 ...■1.03 Business impact of rules on FDI ................................125 ...■1.04 Visa requirements* ......................................................26 ...■1.05 Openness of bilateral Air Service Agreements* ..........79 ...■1.06 Transparency of government policymaking................131 ...■1.07 Time required to start a business*...............................89 ...■1.08 Cost to start a business* .............................................60 ...■
2nd pillar: Environmental sustainability2.01 Stringency of environmental regulation .....................121 ...■2.02 Enforcement of environmental regulation..................123 ...■2.03 Sustainability of T&T industry development...............105 ...■2.04 Carbon dioxide emissions* ..........................................63 ...■2.05 Particulate matter concentration* ..............................107 ...■2.06 Threatened species* ....................................................99 ...■2.07 Environmental treaty ratification*.................................52 ...■
3rd pillar: Safety and security3.01 Business costs of terrorism .........................................38 ...■3.02 Reliability of police services .......................................129 ...■3.03 Business costs of crime and violence........................111 ...■3.04 Road traffic accidents*.................................................89 ...■
4th pillar: Health and hygiene4.01 Physician density*........................................................32 ...■4.02 Access to improved sanitation* ...................................59 ...■4.03 Access to improved drinking water*............................58 ...■4.04 Hospital beds*..............................................................41 ...■
5th pillar: Prioritization of Travel & Tourism5.01 Government prioritization of the T&T industry.............92 ...■5.02 T&T government expenditure* ....................................87 ...■5.03 Effectiveness of marketing and branding.....................79 ...■5.04 T&T fair attendance*....................................................41 ...■
6th pillar: Air transport infrastructure6.01 Quality of air transport infrastructure .........................123 ...■6.02 Available seat kilometers, domestic*...........................21 ...■6.03 Available seat kilometers, international* ......................31 ...■6.04 Departures per 1,000 population*................................78 ...■6.05 Airport density* ............................................................37 ...■6.06 Number of operating airlines*......................................51 ...■6.07 International air transport network ...............................97 ...■
7th pillar: Ground transport infrastructure7.01 Quality of roads ............................................................89 ...■7.02 Quality of railroad infrastructure...................................76 ...■7.03 Quality of port infrastructure ........................................92 ...■7.04 Quality of ground transport network ............................95 ...■7.05 Road density*.............................................................110 ...■
INDICATOR RANK/133
8th pillar: Tourism infrastructure8.01 Hotel rooms*................................................................52 ...■8.02 Presence of major car rental companies*....................23 ...■8.03 ATMs accepting Visa cards* ........................................58 ...■
9th pillar: ICT infrastructure9.01 Extent of business Internet use...................................71 ...■9.02 Internet users* .............................................................62 ...■9.03 Telephone lines*...........................................................57 ...■9.04 Broadband Internet subscribers* .................................44 ...■9.05 Mobile telephone subscribers*....................................39 ...■
10th pillar: Price competitiveness in the T&T industry10.01 Ticket taxes and airport charges*.................................62 ...■10.02 Purchasing power parity*.............................................45 ...■10.03 Extent and effect of taxation......................................129 ...■10.04 Fuel price levels* .........................................................21 ...■10.05 Hotel price index* ........................................................50 ...■
11th pillar: Human resources11.01 Primary education enrollment* ....................................14 ...■11.02 Secondary education enrollment*................................75 ...■11.03 Quality of the educational system..............................105 ...■11.04 Local availability of research and training services.......60 ...■11.05 Extent of staff training..................................................86 ...■11.06 Hiring and firing practices...........................................119 ...■11.07 Ease of hiring foreign labor ..........................................48 ...■11.08 HIV prevalence* ...........................................................78 ...■11.09 Business impact of HIV/AIDS.......................................66 ...■11.10 Life expectancy* ..........................................................42 ...■
12th pillar: Affinity for Travel & Tourism12.01 Tourism openness* ......................................................97 ...■12.02 Attitude of population toward foreign visitors............105 ...■12.03 Extension of business trips recommended .................59 ...■
13th pillar: Natural resources13.01 Number of World Heritage natural sites* ....................10 ...■13.02 Protected areas* ..........................................................84 ...■13.03 Quality of the natural environment...............................65 ...■13.04 Total known species*...................................................13 ...■
14th pillar: Cultural resources14.01 Number of World Heritage cultural sites* ...................54 ...■14.02 Sports stadiums* .........................................................37 ...■14.03 Number of international fairs and exhibitions* ............36 ...■14.04 Creative industries exports*.........................................48 ...■
Argentina
* Hard data
Note: For further details and explanation, please refer to the section “How toRead the Country/Economy Profiles” at the beginning of this chapter.
part2A_profiles.r2 2/26/09 4:01 AM Page 121
The Travel & Tourism Competitiveness Report 2009 © 2009 World Economic Forum

122
2.1:
Cou
ntry
/Eco
nom
y Pr
ofile
s
ArmeniaKey indicatorsPopulation (millions), 2007..............................................................................3.0Surface area (1,000 square kilometers) ........................................................29.8
Gross domestic product (US$ billions), 2007 .................................................9.2Gross domestic product (PPP, US$) per capita, 2007 .............................4,945.9Real GDP growth (percent), 2007.................................................................13.8
Environmental Performance Index, 2008 (out of 149 countries).....................62
Travel & Tourism indicators
T&T industry, 2008 estimatesGDP (US$ millions) ................................................................240...................2.3 ....................4.4Employment (1,000 jobs).........................................................20...................1.8 ..................–0.8
T&T economy, 2008 estimatesGDP (US$ millions) .............................................................1,079.................10.2 ....................4.7Employment (1,000 jobs).........................................................91...................8.3 ..................–0.5
Source: World Travel & Tourism Council, TSA Research 2008
International tourist arrivals (thousands), 2007......................450International tourism receipts (US$ millions), 2007 ..............265
Source: United Nations World Tourism Organization
Travel & Tourism Competitiveness Index
2009 Index......................................................................................................91 3.72008 Index............................................................................................................89 3.6T&T regulatory framework ..............................................................................58 4.7
Policy rules and regulations..........................................................................77 4.3Environmental sustainability........................................................................113 3.9Safety and security .........................................................................................45 5.6Health and hygiene .........................................................................................30 6.0Prioritization of Travel & Tourism................................................................104 3.7
T&T business environment and infrastructure ..........................................105 2.7Air transport infrastructure ..........................................................................96 2.5Ground transport infrastructure....................................................................95 2.9Tourism infrastructure ..................................................................................106 1.7ICT infrastructure ..........................................................................................107 1.9Price competitiveness in the T&T industry.................................................63 4.8
T&T human, cultural, and natural resources .............................................102 3.5Human resources ............................................................................................81 4.9
Education and training ...........................................................................100 4.0Availability of qualified labor...................................................................18 5.8
Affinity for Travel & Tourism ..........................................................................46 5.0Natural resources .........................................................................................118 2.3Cultural resources...........................................................................................82 1.9
Note: For descriptions of variables and detailed sources, please refer to “How to the Read Country/Economy Profiles.”
Rank Score(out of 133) (1–7 scale)
International tourist arrivals (thousands)
International tourism receipts (US$ millions)
1995 1996 1997 1998 1999 2000 2001 2002 2003 2004 2005 2006 20070
100
200
300
400
500
1 2 3 4 5 6 7
2009–2018Percent annual growth of total (%, forecast)
part2A_profiles.r2 2/26/09 4:01 AM Page 122
The Travel & Tourism Competitiveness Report 2009 © 2009 World Economic Forum

123
2.1:
Cou
ntry
/Eco
nom
y Pr
ofile
s
The Travel & Tourism Competitiveness Index in detail ■ Competitive Advantage ■ Competitive Disadvantage
INDICATOR RANK/133
1st pillar: Policy rules and regulations1.01 Prevalence of foreign ownership .................................84 ...■1.02 Property rights..............................................................69 ...■1.03 Business impact of rules on FDI ..................................87 ...■1.04 Visa requirements* ....................................................117 ...■1.05 Openness of bilateral Air Service Agreements* ..........89 ...■1.06 Transparency of government policymaking................103 ...■1.07 Time required to start a business*...............................54 ...■1.08 Cost to start a business* .............................................30 ...■
2nd pillar: Environmental sustainability2.01 Stringency of environmental regulation .....................118 ...■2.02 Enforcement of environmental regulation..................128 ...■2.03 Sustainability of T&T industry development.................96 ...■2.04 Carbon dioxide emissions* ..........................................41 ...■2.05 Particulate matter concentration* ................................99 ...■2.06 Threatened species* ....................................................78 ...■2.07 Environmental treaty ratification*...............................104 ...■
3rd pillar: Safety and security3.01 Business costs of terrorism .........................................33 ...■3.02 Reliability of police services .........................................95 ...■3.03 Business costs of crime and violence..........................32 ...■3.04 Road traffic accidents*.................................................24 ...■
4th pillar: Health and hygiene4.01 Physician density*........................................................12 ...■4.02 Access to improved sanitation* ...................................59 ...■4.03 Access to improved drinking water*............................47 ...■4.04 Hospital beds*..............................................................39 ...■
5th pillar: Prioritization of Travel & Tourism5.01 Government prioritization of the T&T industry.............85 ...■5.02 T&T government expenditure* ....................................55 ...■5.03 Effectiveness of marketing and branding...................109 ...■5.04 T&T fair attendance*....................................................98 ...■
6th pillar: Air transport infrastructure6.01 Quality of air transport infrastructure ...........................85 ...■6.02 Available seat kilometers, domestic*.........................100 ...■6.03 Available seat kilometers, international* ......................96 ...■6.04 Departures per 1,000 population*................................74 ...■6.05 Airport density* ............................................................71 ...■6.06 Number of operating airlines*......................................64 ...■6.07 International air transport network .............................109 ...■
7th pillar: Ground transport infrastructure7.01 Quality of roads ............................................................79 ...■7.02 Quality of railroad infrastructure...................................83 ...■7.03 Quality of port infrastructure ......................................115 ...■7.04 Quality of ground transport network ............................60 ...■7.05 Road density*...............................................................70 ...■
INDICATOR RANK/133
8th pillar: Tourism infrastructure8.01 Hotel rooms*..............................................................101 ...■8.02 Presence of major car rental companies*....................95 ...■8.03 ATMs accepting Visa cards* ........................................87 ...■
9th pillar: ICT infrastructure9.01 Extent of business Internet use.................................116 ...■9.02 Internet users* ...........................................................105 ...■9.03 Telephone lines*...........................................................66 ...■9.04 Broadband Internet subscribers* ...............................103 ...■9.05 Mobile telephone subscribers*..................................126 ...■
10th pillar: Price competitiveness in the T&T industry10.01 Ticket taxes and airport charges*.................................65 ...■10.02 Purchasing power parity*.............................................57 ...■10.03 Extent and effect of taxation........................................83 ...■10.04 Fuel price levels* .........................................................54 ...■10.05 Hotel price index* ........................................................64 ...■
11th pillar: Human resources11.01 Primary education enrollment* ..................................109 ...■11.02 Secondary education enrollment*................................57 ...■11.03 Quality of the educational system................................98 ...■11.04 Local availability of research and training services.....125 ...■11.05 Extent of staff training................................................116 ...■11.06 Hiring and firing practices.............................................16 ...■11.07 Ease of hiring foreign labor ............................................8 ...■11.08 HIV prevalence* ...........................................................22 ...■11.09 Business impact of HIV/AIDS.......................................49 ...■11.10 Life expectancy* ..........................................................87 ...■
12th pillar: Affinity for Travel & Tourism12.01 Tourism openness* ......................................................46 ...■12.02 Attitude of population toward foreign visitors..............81 ...■12.03 Extension of business trips recommended .................31 ...■
13th pillar: Natural resources13.01 Number of World Heritage natural sites* ....................74 ...■13.02 Protected areas* ..........................................................73 ...■13.03 Quality of the natural environment.............................126 ...■13.04 Total known species*.................................................100 ...■
14th pillar: Cultural resources14.01 Number of World Heritage cultural sites* ...................54 ...■14.02 Sports stadiums* .........................................................58 ...■14.03 Number of international fairs and exhibitions* ..........101 ...■14.04 Creative industries exports*.........................................78 ...■
Armenia
* Hard data
Note: For further details and explanation, please refer to the section “How toRead the Country/Economy Profiles” at the beginning of this chapter.
part2A_profiles.r2 2/26/09 4:01 AM Page 123
The Travel & Tourism Competitiveness Report 2009 © 2009 World Economic Forum

124
2.1:
Cou
ntry
/Eco
nom
y Pr
ofile
s
AustraliaKey indicatorsPopulation (millions), 2007............................................................................20.6Surface area (1,000 square kilometers) ...................................................7,741.2
Gross domestic product (US$ billions), 2007 .............................................909.0Gross domestic product (PPP, US$) per capita, 2007 ...........................36,225.6Real GDP growth (percent), 2007...................................................................4.2
Environmental Performance Index, 2008 (out of 149 countries).....................46
Travel & Tourism indicators
T&T industry, 2008 estimatesGDP (US$ millions) ...........................................................46,299...................4.5 ....................4.1Employment (1,000 jobs).......................................................484...................4.5 ....................1.9
T&T economy, 2008 estimatesGDP (US$ millions) .........................................................112,879.................11.0 ....................4.3Employment (1,000 jobs)....................................................1,140.................10.7 ....................1.6
Source: World Travel & Tourism Council, TSA Research 2008
International tourist arrivals (thousands), 2006...................5,064International tourism receipts (US$ millions), 2007 .........22,298
Source: United Nations World Tourism Organization
Travel & Tourism Competitiveness Index
2009 Index........................................................................................................9 5.22008 Index..............................................................................................................4 5.3T&T regulatory framework ..............................................................................27 5.3
Policy rules and regulations..........................................................................27 5.1Environmental sustainability..........................................................................40 4.9Safety and security .........................................................................................25 5.9Health and hygiene .........................................................................................41 5.7Prioritization of Travel & Tourism..................................................................37 4.9
T&T business environment and infrastructure ............................................15 5.0Air transport infrastructure ............................................................................3 5.9Ground transport infrastructure....................................................................47 4.1Tourism infrastructure ......................................................................................9 6.4ICT infrastructure ............................................................................................20 4.9Price competitiveness in the T&T industry...............................................117 3.9
T&T human, cultural, and natural resources .................................................3 5.4Human resources ............................................................................................10 5.9
Education and training .............................................................................14 5.9Availability of qualified labor...................................................................13 5.8
Affinity for Travel & Tourism ..........................................................................52 4.9Natural resources .............................................................................................4 5.8Cultural resources...........................................................................................19 5.2
Note: For descriptions of variables and detailed sources, please refer to “How to the Read Country/Economy Profiles.”
Rank Score(out of 133) (1–7 scale)
International tourist arrivals (thousands)
International tourism receipts (US$ millions)
1995 1996 1997 1998 1999 2000 2001 2002 2003 2004 2005 2006 20070
5,000
10,000
15,000
20,000
25,000
1 2 3 4 5 6 7
2009–2018Percent annual growth of total (%, forecast)
part2A_profiles.r2 2/26/09 4:01 AM Page 124
The Travel & Tourism Competitiveness Report 2009 © 2009 World Economic Forum

125
2.1:
Cou
ntry
/Eco
nom
y Pr
ofile
s
The Travel & Tourism Competitiveness Index in detail ■ Competitive Advantage ■ Competitive Disadvantage
INDICATOR RANK/133
1st pillar: Policy rules and regulations1.01 Prevalence of foreign ownership .................................37 ...■1.02 Property rights..............................................................13 ...■1.03 Business impact of rules on FDI ..................................59 ...■1.04 Visa requirements* ....................................................111 ...■1.05 Openness of bilateral Air Service Agreements* ..........76 ...■1.06 Transparency of government policymaking....................9 ...■1.07 Time required to start a business*.................................2 ...■1.08 Cost to start a business* .............................................10 ...■
2nd pillar: Environmental sustainability2.01 Stringency of environmental regulation .......................16 ...■2.02 Enforcement of environmental regulation....................12 ...■2.03 Sustainability of T&T industry development.................17 ...■2.04 Carbon dioxide emissions* ........................................119 ...■2.05 Particulate matter concentration* ................................10 ...■2.06 Threatened species* ..................................................121 ...■2.07 Environmental treaty ratification*...................................2 ...■
3rd pillar: Safety and security3.01 Business costs of terrorism .........................................74 ...■3.02 Reliability of police services .........................................14 ...■3.03 Business costs of crime and violence..........................38 ...■3.04 Road traffic accidents*.................................................65 ...■
4th pillar: Health and hygiene4.01 Physician density*........................................................41 ...■4.02 Access to improved sanitation* .....................................1 ...■4.03 Access to improved drinking water*..............................1 ...■4.04 Hospital beds*..............................................................43 ...■
5th pillar: Prioritization of Travel & Tourism5.01 Government prioritization of the T&T industry.............19 ...■5.02 T&T government expenditure* ....................................56 ...■5.03 Effectiveness of marketing and branding.....................18 ...■5.04 T&T fair attendance*....................................................41 ...■
6th pillar: Air transport infrastructure6.01 Quality of air transport infrastructure ...........................19 ...■6.02 Available seat kilometers, domestic*.............................5 ...■6.03 Available seat kilometers, international* ......................12 ...■6.04 Departures per 1,000 population*................................22 ...■6.05 Airport density* ..............................................................4 ...■6.06 Number of operating airlines*......................................26 ...■6.07 International air transport network ...............................23 ...■
7th pillar: Ground transport infrastructure7.01 Quality of roads ............................................................31 ...■7.02 Quality of railroad infrastructure...................................26 ...■7.03 Quality of port infrastructure ........................................41 ...■7.04 Quality of ground transport network ............................39 ...■7.05 Road density*.............................................................104 ...■
INDICATOR RANK/133
8th pillar: Tourism infrastructure8.01 Hotel rooms*................................................................19 ...■8.02 Presence of major car rental companies*......................1 ...■8.03 ATMs accepting Visa cards* ........................................10 ...■
9th pillar: ICT infrastructure9.01 Extent of business Internet use...................................21 ...■9.02 Internet users* .............................................................25 ...■9.03 Telephone lines*...........................................................19 ...■9.04 Broadband Internet subscribers* .................................16 ...■9.05 Mobile telephone subscribers*....................................38 ...■
10th pillar: Price competitiveness in the T&T industry10.01 Ticket taxes and airport charges*...............................119 ...■10.02 Purchasing power parity*...........................................114 ...■10.03 Extent and effect of taxation........................................62 ...■10.04 Fuel price levels* .........................................................75 ...■10.05 Hotel price index* ........................................................71 ...■
11th pillar: Human resources11.01 Primary education enrollment* ....................................39 ...■11.02 Secondary education enrollment*..................................1 ...■11.03 Quality of the educational system..................................9 ...■11.04 Local availability of research and training services.......15 ...■11.05 Extent of staff training..................................................17 ...■11.06 Hiring and firing practices.............................................46 ...■11.07 Ease of hiring foreign labor ..........................................86 ...■11.08 HIV prevalence* ...........................................................49 ...■11.09 Business impact of HIV/AIDS.......................................35 ...■11.10 Life expectancy* ............................................................2 ...■
12th pillar: Affinity for Travel & Tourism12.01 Tourism openness* ......................................................81 ...■12.02 Attitude of population toward foreign visitors..............12 ...■12.03 Extension of business trips recommended .................36 ...■
13th pillar: Natural resources13.01 Number of World Heritage natural sites* ......................1 ...■13.02 Protected areas* ..........................................................31 ...■13.03 Quality of the natural environment...............................14 ...■13.04 Total known species*...................................................19 ...■
14th pillar: Cultural resources14.01 Number of World Heritage cultural sites* ...................33 ...■14.02 Sports stadiums* ...........................................................8 ...■14.03 Number of international fairs and exhibitions* ............12 ...■14.04 Creative industries exports*.........................................38 ...■
Australia
* Hard data
Note: For further details and explanation, please refer to the section “How toRead the Country/Economy Profiles” at the beginning of this chapter.
part2A_profiles.r2 2/26/09 4:01 AM Page 125
The Travel & Tourism Competitiveness Report 2009 © 2009 World Economic Forum

126
2.1:
Cou
ntry
/Eco
nom
y Pr
ofile
s
AustriaKey indicatorsPopulation (millions), 2007..............................................................................8.2Surface area (1,000 square kilometers) ........................................................83.9
Gross domestic product (US$ billions), 2007 .............................................371.2Gross domestic product (PPP, US$) per capita, 2007 ...........................38,181.0Real GDP growth (percent), 2007...................................................................3.1
Environmental Performance Index, 2008 (out of 149 countries).......................6
Travel & Tourism indicators
T&T industry, 2008 estimatesGDP (US$ millions) ...........................................................20,049...................4.9 ....................4.3Employment (1,000 jobs).......................................................248...................5.9 ....................3.4
T&T economy, 2008 estimatesGDP (US$ millions) ...........................................................59,733.................14.5 ....................4.0Employment (1,000 jobs).......................................................707.................16.8 ....................3.1
Source: World Travel & Tourism Council, TSA Research 2008
International tourist arrivals (thousands), 2007.................20,766International tourism receipts (US$ millions), 2007 .........18,887
Source: United Nations World Tourism Organization
Travel & Tourism Competitiveness Index
2009 Index........................................................................................................2 5.52008 Index..............................................................................................................2 5.4T&T regulatory framework ................................................................................4 5.9
Policy rules and regulations..........................................................................28 5.1Environmental sustainability............................................................................9 5.6Safety and security ...........................................................................................6 6.5Health and hygiene ...........................................................................................5 6.9Prioritization of Travel & Tourism..................................................................14 5.6
T&T business environment and infrastructure ..............................................6 5.2Air transport infrastructure ..........................................................................26 4.5Ground transport infrastructure....................................................................10 6.0Tourism infrastructure ......................................................................................1 7.0ICT infrastructure ............................................................................................23 4.8Price competitiveness in the T&T industry...............................................118 3.8
T&T human, cultural, and natural resources .................................................7 5.2Human resources ............................................................................................18 5.7
Education and training .............................................................................16 5.8Availability of qualified labor...................................................................52 5.5
Affinity for Travel & Tourism ..........................................................................23 5.4Natural resources ...........................................................................................40 4.1Cultural resources...........................................................................................11 5.8
Note: For descriptions of variables and detailed sources, please refer to “How to the Read Country/Economy Profiles.”
Rank Score(out of 133) (1–7 scale)
International tourist arrivals (thousands)
International tourism receipts (US$ millions)
1995 1996 1997 1998 1999 2000 2001 2002 2003 2004 2005 2006 20075,000
10,000
15,000
20,000
25,000
1 2 3 4 5 6 7
2009–2018Percent annual growth of total (%, forecast)
part2A_profiles.r2 2/26/09 4:01 AM Page 126
The Travel & Tourism Competitiveness Report 2009 © 2009 World Economic Forum

127
2.1:
Cou
ntry
/Eco
nom
y Pr
ofile
s
The Travel & Tourism Competitiveness Index in detail ■ Competitive Advantage ■ Competitive Disadvantage
INDICATOR RANK/133
1st pillar: Policy rules and regulations1.01 Prevalence of foreign ownership .................................18 ...■1.02 Property rights................................................................3 ...■1.03 Business impact of rules on FDI ..................................31 ...■1.04 Visa requirements* ......................................................40 ...■1.05 Openness of bilateral Air Service Agreements* ..........54 ...■1.06 Transparency of government policymaking..................25 ...■1.07 Time required to start a business*...............................79 ...■1.08 Cost to start a business* .............................................41 ...■
2nd pillar: Environmental sustainability2.01 Stringency of environmental regulation .......................13 ...■2.02 Enforcement of environmental regulation......................5 ...■2.03 Sustainability of T&T industry development...................5 ...■2.04 Carbon dioxide emissions* ..........................................97 ...■2.05 Particulate matter concentration* ................................57 ...■2.06 Threatened species* ....................................................42 ...■2.07 Environmental treaty ratification*.................................21 ...■
3rd pillar: Safety and security3.01 Business costs of terrorism ...........................................8 ...■3.02 Reliability of police services .........................................13 ...■3.03 Business costs of crime and violence..........................11 ...■3.04 Road traffic accidents*.................................................49 ...■
4th pillar: Health and hygiene4.01 Physician density*........................................................15 ...■4.02 Access to improved sanitation* .....................................1 ...■4.03 Access to improved drinking water*..............................1 ...■4.04 Hospital beds*..............................................................11 ...■
5th pillar: Prioritization of Travel & Tourism5.01 Government prioritization of the T&T industry.............15 ...■5.02 T&T government expenditure* ....................................39 ...■5.03 Effectiveness of marketing and branding.......................4 ...■5.04 T&T fair attendance*....................................................20 ...■
6th pillar: Air transport infrastructure6.01 Quality of air transport infrastructure ...........................13 ...■6.02 Available seat kilometers, domestic*...........................53 ...■6.03 Available seat kilometers, international* ......................36 ...■6.04 Departures per 1,000 population*................................20 ...■6.05 Airport density* ............................................................63 ...■6.06 Number of operating airlines*......................................15 ...■6.07 International air transport network ...............................15 ...■
7th pillar: Ground transport infrastructure7.01 Quality of roads ..............................................................6 ...■7.02 Quality of railroad infrastructure...................................12 ...■7.03 Quality of port infrastructure ........................................34 ...■7.04 Quality of ground transport network ..............................9 ...■7.05 Road density*...............................................................21 ...■
INDICATOR RANK/133
8th pillar: Tourism infrastructure8.01 Hotel rooms*..................................................................3 ...■8.02 Presence of major car rental companies*......................1 ...■8.03 ATMs accepting Visa cards* ..........................................4 ...■
9th pillar: ICT infrastructure9.01 Extent of business Internet use...................................13 ...■9.02 Internet users* .............................................................29 ...■9.03 Telephone lines*...........................................................30 ...■9.04 Broadband Internet subscribers* .................................25 ...■9.05 Mobile telephone subscribers*....................................17 ...■
10th pillar: Price competitiveness in the T&T industry10.01 Ticket taxes and airport charges*.................................81 ...■10.02 Purchasing power parity*...........................................118 ...■10.03 Extent and effect of taxation........................................67 ...■10.04 Fuel price levels* .......................................................106 ...■10.05 Hotel price index* ........................................................69 ...■
11th pillar: Human resources11.01 Primary education enrollment* ....................................27 ...■11.02 Secondary education enrollment*................................20 ...■11.03 Quality of the educational system................................14 ...■11.04 Local availability of research and training services.......16 ...■11.05 Extent of staff training..................................................18 ...■11.06 Hiring and firing practices.............................................86 ...■11.07 Ease of hiring foreign labor ........................................121 ...■11.08 HIV prevalence* ...........................................................49 ...■11.09 Business impact of HIV/AIDS.........................................7 ...■11.10 Life expectancy* ..........................................................12 ...■
12th pillar: Affinity for Travel & Tourism12.01 Tourism openness* ......................................................35 ...■12.02 Attitude of population toward foreign visitors..............18 ...■12.03 Extension of business trips recommended ...................5 ...■
13th pillar: Natural resources13.01 Number of World Heritage natural sites* ....................74 ...■13.02 Protected areas* ..........................................................17 ...■13.03 Quality of the natural environment.................................6 ...■13.04 Total known species*...................................................87 ...■
14th pillar: Cultural resources14.01 Number of World Heritage cultural sites* ...................22 ...■14.02 Sports stadiums* .........................................................26 ...■14.03 Number of international fairs and exhibitions* ..............9 ...■14.04 Creative industries exports*.........................................14 ...■
Austria
* Hard data
Note: For further details and explanation, please refer to the section “How toRead the Country/Economy Profiles” at the beginning of this chapter.
part2A_profiles.r2 2/26/09 4:01 AM Page 127
The Travel & Tourism Competitiveness Report 2009 © 2009 World Economic Forum

128
2.1:
Cou
ntry
/Eco
nom
y Pr
ofile
s
AzerbaijanKey indicatorsPopulation (millions), 2007..............................................................................8.5Surface area (1,000 square kilometers) ........................................................86.6
Gross domestic product (US$ billions), 2007 ...............................................31.2Gross domestic product (PPP, US$) per capita, 2007 .............................7,618.1Real GDP growth (percent), 2007.................................................................23.4
Environmental Performance Index, 2008 (out of 149 countries).....................80
Travel & Tourism indicators
T&T industry, 2008 estimatesGDP (US$ millions) ................................................................509...................1.2 ....................8.8Employment (1,000 jobs).........................................................39...................0.9 ....................3.0
T&T economy, 2008 estimatesGDP (US$ millions) .............................................................3,925...................9.0 ....................6.5Employment (1,000 jobs).......................................................305...................7.4 ....................0.8
Source: World Travel & Tourism Council, TSA Research 2008
International tourist arrivals (thousands), 2007...................1,010International tourism receipts (US$ millions), 2007 ..............178
Source: United Nations World Tourism Organization
Travel & Tourism Competitiveness Index
2009 Index......................................................................................................76 3.82008 Index............................................................................................................79 3.7T&T regulatory framework ..............................................................................47 5.0
Policy rules and regulations..........................................................................65 4.4Environmental sustainability..........................................................................72 4.4Safety and security .........................................................................................37 5.8Health and hygiene .........................................................................................39 5.8Prioritization of Travel & Tourism..................................................................66 4.3
T&T business environment and infrastructure ............................................84 3.2Air transport infrastructure ..........................................................................78 2.8Ground transport infrastructure....................................................................45 4.1Tourism infrastructure ....................................................................................99 1.9ICT infrastructure ............................................................................................87 2.4Price competitiveness in the T&T industry.................................................62 4.8
T&T human, cultural, and natural resources .............................................111 3.4Human resources ............................................................................................67 5.1
Education and training .............................................................................71 4.6Availability of qualified labor...................................................................43 5.6
Affinity for Travel & Tourism ..........................................................................89 4.6Natural resources .........................................................................................113 2.4Cultural resources.........................................................................................104 1.6
Note: For descriptions of variables and detailed sources, please refer to “How to the Read Country/Economy Profiles.”
Rank Score(out of 133) (1–7 scale)
International tourist arrivals (thousands)
International tourism receipts (US$ millions)
1995 1996 1997 1998 1999 2000 2001 2002 2003 2004 2005 2006 20070
200
400
600
800
1,000
1,200
1 2 3 4 5 6 7
2009–2018Percent annual growth of total (%, forecast)
part2A_profiles.r2 2/26/09 4:01 AM Page 128
The Travel & Tourism Competitiveness Report 2009 © 2009 World Economic Forum

129
2.1:
Cou
ntry
/Eco
nom
y Pr
ofile
s
The Travel & Tourism Competitiveness Index in detail ■ Competitive Advantage ■ Competitive Disadvantage
INDICATOR RANK/133
1st pillar: Policy rules and regulations1.01 Prevalence of foreign ownership .................................51 ...■1.02 Property rights..............................................................80 ...■1.03 Business impact of rules on FDI ..................................78 ...■1.04 Visa requirements* ....................................................119 ...■1.05 Openness of bilateral Air Service Agreements* ..........49 ...■1.06 Transparency of government policymaking..................83 ...■1.07 Time required to start a business*...............................45 ...■1.08 Cost to start a business* .............................................28 ...■
2nd pillar: Environmental sustainability2.01 Stringency of environmental regulation .......................63 ...■2.02 Enforcement of environmental regulation....................49 ...■2.03 Sustainability of T&T industry development.................71 ...■2.04 Carbon dioxide emissions* ..........................................65 ...■2.05 Particulate matter concentration* ................................90 ...■2.06 Threatened species* ....................................................70 ...■2.07 Environmental treaty ratification*...............................104 ...■
3rd pillar: Safety and security3.01 Business costs of terrorism .........................................43 ...■3.02 Reliability of police services .........................................59 ...■3.03 Business costs of crime and violence..........................24 ...■3.04 Road traffic accidents*.................................................35 ...■
4th pillar: Health and hygiene4.01 Physician density*........................................................18 ...■4.02 Access to improved sanitation* ...................................77 ...■4.03 Access to improved drinking water*..........................104 ...■4.04 Hospital beds*................................................................7 ...■
5th pillar: Prioritization of Travel & Tourism5.01 Government prioritization of the T&T industry.............63 ...■5.02 T&T government expenditure* ....................................71 ...■5.03 Effectiveness of marketing and branding.....................90 ...■5.04 T&T fair attendance*....................................................41 ...■
6th pillar: Air transport infrastructure6.01 Quality of air transport infrastructure ...........................48 ...■6.02 Available seat kilometers, domestic*...........................98 ...■6.03 Available seat kilometers, international* ......................94 ...■6.04 Departures per 1,000 population*................................83 ...■6.05 Airport density* ............................................................96 ...■6.06 Number of operating airlines*......................................66 ...■6.07 International air transport network ...............................64 ...■
7th pillar: Ground transport infrastructure7.01 Quality of roads ............................................................59 ...■7.02 Quality of railroad infrastructure...................................33 ...■7.03 Quality of port infrastructure ........................................58 ...■7.04 Quality of ground transport network ............................34 ...■7.05 Road density*...............................................................41 ...■
INDICATOR RANK/133
8th pillar: Tourism infrastructure8.01 Hotel rooms*................................................................87 ...■8.02 Presence of major car rental companies*....................95 ...■8.03 ATMs accepting Visa cards* ........................................73 ...■
9th pillar: ICT infrastructure9.01 Extent of business Internet use...................................68 ...■9.02 Internet users* .............................................................85 ...■9.03 Telephone lines*...........................................................77 ...■9.04 Broadband Internet subscribers* ...............................112 ...■9.05 Mobile telephone subscribers*....................................88 ...■
10th pillar: Price competitiveness in the T&T industry10.01 Ticket taxes and airport charges*...............................115 ...■10.02 Purchasing power parity*.............................................42 ...■10.03 Extent and effect of taxation........................................38 ...■10.04 Fuel price levels* .........................................................15 ...■10.05 Hotel price index* ........................................................96 ...■
11th pillar: Human resources11.01 Primary education enrollment* ..................................105 ...■11.02 Secondary education enrollment*................................80 ...■11.03 Quality of the educational system................................78 ...■11.04 Local availability of research and training services.......67 ...■11.05 Extent of staff training..................................................39 ...■11.06 Hiring and firing practices...............................................9 ...■11.07 Ease of hiring foreign labor ..........................................41 ...■11.08 HIV prevalence* ...........................................................49 ...■11.09 Business impact of HIV/AIDS.......................................64 ...■11.10 Life expectancy* ........................................................100 ...■
12th pillar: Affinity for Travel & Tourism12.01 Tourism openness* ....................................................124 ...■12.02 Attitude of population toward foreign visitors..............79 ...■12.03 Extension of business trips recommended .................25 ...■
13th pillar: Natural resources13.01 Number of World Heritage natural sites* ....................74 ...■13.02 Protected areas* ..........................................................84 ...■13.03 Quality of the natural environment.............................100 ...■13.04 Total known species*...................................................75 ...■
14th pillar: Cultural resources14.01 Number of World Heritage cultural sites* ...................65 ...■14.02 Sports stadiums* .........................................................88 ...■14.03 Number of international fairs and exhibitions* ............96 ...■14.04 Creative industries exports*.......................................110 ...■
Azerbaijan
* Hard data
Note: For further details and explanation, please refer to the section “How toRead the Country/Economy Profiles” at the beginning of this chapter.
part2A_profiles.r2 2/26/09 4:01 AM Page 129
The Travel & Tourism Competitiveness Report 2009 © 2009 World Economic Forum
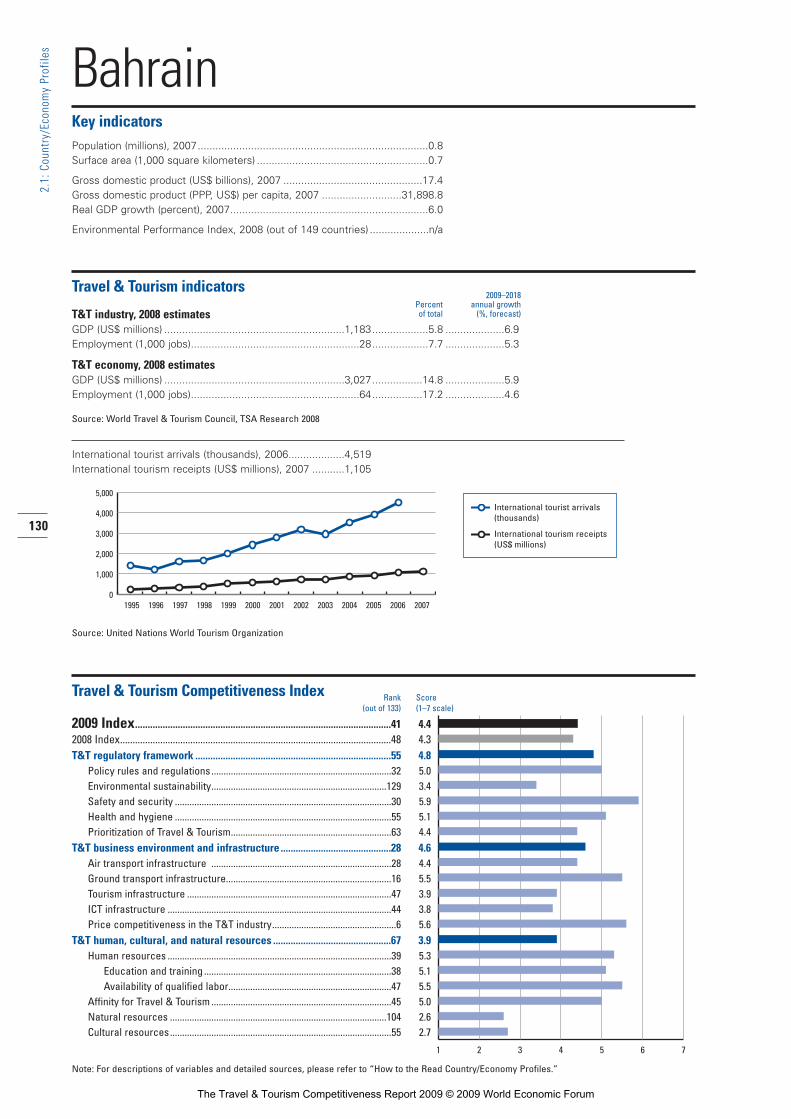
130
2.1:
Cou
ntry
/Eco
nom
y Pr
ofile
s
BahrainKey indicatorsPopulation (millions), 2007..............................................................................0.8Surface area (1,000 square kilometers) ..........................................................0.7
Gross domestic product (US$ billions), 2007 ...............................................17.4Gross domestic product (PPP, US$) per capita, 2007 ...........................31,898.8Real GDP growth (percent), 2007...................................................................6.0
Environmental Performance Index, 2008 (out of 149 countries) ....................n/a
Travel & Tourism indicators
T&T industry, 2008 estimatesGDP (US$ millions) .............................................................1,183...................5.8 ....................6.9Employment (1,000 jobs).........................................................28...................7.7 ....................5.3
T&T economy, 2008 estimatesGDP (US$ millions) .............................................................3,027.................14.8 ....................5.9Employment (1,000 jobs).........................................................64.................17.2 ....................4.6
Source: World Travel & Tourism Council, TSA Research 2008
International tourist arrivals (thousands), 2006...................4,519International tourism receipts (US$ millions), 2007 ...........1,105
Source: United Nations World Tourism Organization
Travel & Tourism Competitiveness Index
2009 Index......................................................................................................41 4.42008 Index............................................................................................................48 4.3T&T regulatory framework ..............................................................................55 4.8
Policy rules and regulations..........................................................................32 5.0Environmental sustainability........................................................................129 3.4Safety and security .........................................................................................30 5.9Health and hygiene .........................................................................................55 5.1Prioritization of Travel & Tourism..................................................................63 4.4
T&T business environment and infrastructure ............................................28 4.6Air transport infrastructure ..........................................................................28 4.4Ground transport infrastructure....................................................................16 5.5Tourism infrastructure ....................................................................................47 3.9ICT infrastructure ............................................................................................44 3.8Price competitiveness in the T&T industry...................................................6 5.6
T&T human, cultural, and natural resources ...............................................67 3.9Human resources ............................................................................................39 5.3
Education and training .............................................................................38 5.1Availability of qualified labor...................................................................47 5.5
Affinity for Travel & Tourism ..........................................................................45 5.0Natural resources .........................................................................................104 2.6Cultural resources...........................................................................................55 2.7
Note: For descriptions of variables and detailed sources, please refer to “How to the Read Country/Economy Profiles.”
Rank Score(out of 133) (1–7 scale)
International tourist arrivals (thousands)
International tourism receipts (US$ millions)
1995 1996 1997 1998 1999 2000 2001 2002 2003 2004 2005 2006 20070
1,000
2,000
3,000
4,000
5,000
1 2 3 4 5 6 7
2009–2018Percent annual growth of total (%, forecast)
part2A_profiles.r2 2/26/09 4:01 AM Page 130
The Travel & Tourism Competitiveness Report 2009 © 2009 World Economic Forum
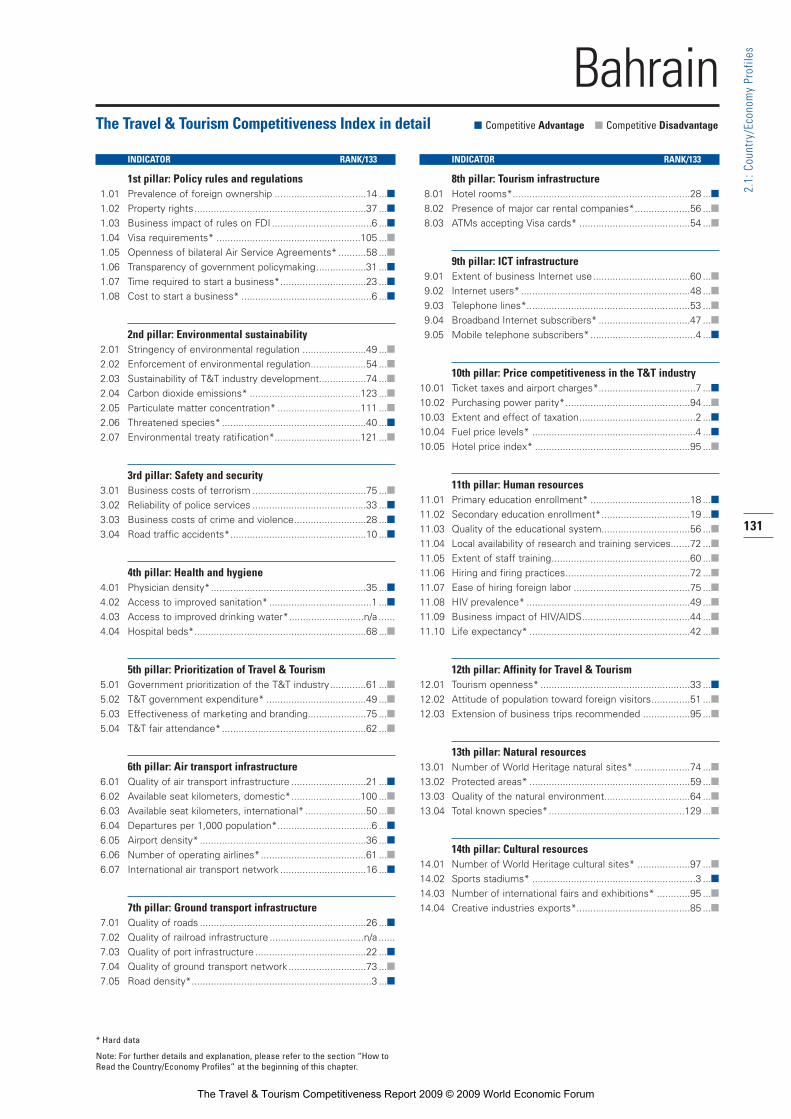
131
2.1:
Cou
ntry
/Eco
nom
y Pr
ofile
s
The Travel & Tourism Competitiveness Index in detail ■ Competitive Advantage ■ Competitive Disadvantage
INDICATOR RANK/133
1st pillar: Policy rules and regulations1.01 Prevalence of foreign ownership .................................14 ...■1.02 Property rights..............................................................37 ...■1.03 Business impact of rules on FDI ....................................6 ...■1.04 Visa requirements* ....................................................105 ...■1.05 Openness of bilateral Air Service Agreements* ..........58 ...■1.06 Transparency of government policymaking..................31 ...■1.07 Time required to start a business*...............................23 ...■1.08 Cost to start a business* ...............................................6 ...■
2nd pillar: Environmental sustainability2.01 Stringency of environmental regulation .......................49 ...■2.02 Enforcement of environmental regulation....................54 ...■2.03 Sustainability of T&T industry development.................74 ...■2.04 Carbon dioxide emissions* ........................................123 ...■2.05 Particulate matter concentration* ..............................111 ...■2.06 Threatened species* ....................................................40 ...■2.07 Environmental treaty ratification*...............................121 ...■
3rd pillar: Safety and security3.01 Business costs of terrorism .........................................75 ...■3.02 Reliability of police services .........................................33 ...■3.03 Business costs of crime and violence..........................28 ...■3.04 Road traffic accidents*.................................................10 ...■
4th pillar: Health and hygiene4.01 Physician density*........................................................35 ...■4.02 Access to improved sanitation* .....................................1 ...■4.03 Access to improved drinking water*...........................n/a ......4.04 Hospital beds*..............................................................68 ...■
5th pillar: Prioritization of Travel & Tourism5.01 Government prioritization of the T&T industry.............61 ...■5.02 T&T government expenditure* ....................................49 ...■5.03 Effectiveness of marketing and branding.....................75 ...■5.04 T&T fair attendance*....................................................62 ...■
6th pillar: Air transport infrastructure6.01 Quality of air transport infrastructure ...........................21 ...■6.02 Available seat kilometers, domestic*.........................100 ...■6.03 Available seat kilometers, international* ......................50 ...■6.04 Departures per 1,000 population*..................................6 ...■6.05 Airport density* ............................................................36 ...■6.06 Number of operating airlines*......................................61 ...■6.07 International air transport network ...............................16 ...■
7th pillar: Ground transport infrastructure7.01 Quality of roads ............................................................26 ...■7.02 Quality of railroad infrastructure ..................................n/a ......7.03 Quality of port infrastructure ........................................22 ...■7.04 Quality of ground transport network ............................73 ...■7.05 Road density*.................................................................3 ...■
INDICATOR RANK/133
8th pillar: Tourism infrastructure8.01 Hotel rooms*................................................................28 ...■8.02 Presence of major car rental companies*....................56 ...■8.03 ATMs accepting Visa cards* ........................................54 ...■
9th pillar: ICT infrastructure9.01 Extent of business Internet use...................................60 ...■9.02 Internet users* .............................................................48 ...■9.03 Telephone lines*...........................................................53 ...■9.04 Broadband Internet subscribers* .................................47 ...■9.05 Mobile telephone subscribers*......................................4 ...■
10th pillar: Price competitiveness in the T&T industry10.01 Ticket taxes and airport charges*...................................7 ...■10.02 Purchasing power parity*.............................................94 ...■10.03 Extent and effect of taxation..........................................2 ...■10.04 Fuel price levels* ...........................................................4 ...■10.05 Hotel price index* ........................................................95 ...■
11th pillar: Human resources11.01 Primary education enrollment* ....................................18 ...■11.02 Secondary education enrollment*................................19 ...■11.03 Quality of the educational system................................56 ...■11.04 Local availability of research and training services.......72 ...■11.05 Extent of staff training..................................................60 ...■11.06 Hiring and firing practices.............................................72 ...■11.07 Ease of hiring foreign labor ..........................................75 ...■11.08 HIV prevalence* ...........................................................49 ...■11.09 Business impact of HIV/AIDS.......................................44 ...■11.10 Life expectancy* ..........................................................42 ...■
12th pillar: Affinity for Travel & Tourism12.01 Tourism openness* ......................................................33 ...■12.02 Attitude of population toward foreign visitors..............51 ...■12.03 Extension of business trips recommended .................95 ...■
13th pillar: Natural resources13.01 Number of World Heritage natural sites* ....................74 ...■13.02 Protected areas* ..........................................................59 ...■13.03 Quality of the natural environment...............................64 ...■13.04 Total known species*.................................................129 ...■
14th pillar: Cultural resources14.01 Number of World Heritage cultural sites* ...................97 ...■14.02 Sports stadiums* ...........................................................3 ...■14.03 Number of international fairs and exhibitions* ............95 ...■14.04 Creative industries exports*.........................................85 ...■
Bahrain
* Hard data
Note: For further details and explanation, please refer to the section “How toRead the Country/Economy Profiles” at the beginning of this chapter.
part2A_profiles.r2 2/26/09 4:01 AM Page 131
The Travel & Tourism Competitiveness Report 2009 © 2009 World Economic Forum

132
2.1:
Cou
ntry
/Eco
nom
y Pr
ofile
s
BangladeshKey indicatorsPopulation (millions), 2007..........................................................................147.1Surface area (1,000 square kilometers) ......................................................144.0
Gross domestic product (US$ billions), 2007 ...............................................73.7Gross domestic product (PPP, US$) per capita, 2007 .............................1,311.0Real GDP growth (percent), 2007...................................................................6.3
Environmental Performance Index, 2008 (out of 149 countries)...................125
Travel & Tourism indicators
T&T industry, 2008 estimatesGDP (US$ millions) .............................................................1,185...................1.6 ....................5.1Employment (1,000 jobs).......................................................801...................1.2 ....................2.6
T&T economy, 2008 estimatesGDP (US$ millions) .............................................................2,964...................3.9 ....................5.5Employment (1,000 jobs)....................................................2,065...................3.1 ....................3.1
Source: World Travel & Tourism Council, TSA Research 2008
International tourist arrivals (thousands), 2007......................289International tourism receipts (US$ millions), 2007 ................76
Source: United Nations World Tourism Organization
Travel & Tourism Competitiveness Index
2009 Index....................................................................................................129 3.02008 Index..........................................................................................................127 2.9T&T regulatory framework ............................................................................130 3.2
Policy rules and regulations........................................................................117 3.5Environmental sustainability........................................................................125 3.6Safety and security .......................................................................................131 3.1Health and hygiene .......................................................................................115 2.3Prioritization of Travel & Tourism................................................................117 3.3
T&T business environment and infrastructure ..........................................103 2.8Air transport infrastructure ........................................................................111 2.3Ground transport infrastructure....................................................................60 3.7Tourism infrastructure ..................................................................................132 1.0ICT infrastructure ..........................................................................................125 1.6Price competitiveness in the T&T industry.................................................18 5.4
T&T human, cultural, and natural resources .............................................130 3.1Human resources ..........................................................................................110 4.3
Education and training ...........................................................................116 3.5Availability of qualified labor...................................................................99 5.1
Affinity for Travel & Tourism ........................................................................126 4.1Natural resources .........................................................................................102 2.6Cultural resources.........................................................................................110 1.5
Note: For descriptions of variables and detailed sources, please refer to “How to the Read Country/Economy Profiles.”
Rank Score(out of 133) (1–7 scale)
International tourist arrivals (thousands)
International tourism receipts (US$ millions)
1995 1996 1997 1998 1999 2000 2001 2002 2003 2004 2005 2006 20070
50
100
150
200
250
300
1 2 3 4 5 6 7
2009–2018Percent annual growth of total (%, forecast)
part2A_profiles.r2 2/26/09 4:01 AM Page 132
The Travel & Tourism Competitiveness Report 2009 © 2009 World Economic Forum

133
2.1:
Cou
ntry
/Eco
nom
y Pr
ofile
s
The Travel & Tourism Competitiveness Index in detail ■ Competitive Advantage ■ Competitive Disadvantage
INDICATOR RANK/133
1st pillar: Policy rules and regulations1.01 Prevalence of foreign ownership .................................93 ...■1.02 Property rights............................................................114 ...■1.03 Business impact of rules on FDI ..................................56 ...■1.04 Visa requirements* ....................................................101 ...■1.05 Openness of bilateral Air Service Agreements* ........109 ...■1.06 Transparency of government policymaking................108 ...■1.07 Time required to start a business*.............................120 ...■1.08 Cost to start a business* .............................................88 ...■
2nd pillar: Environmental sustainability2.01 Stringency of environmental regulation .....................125 ...■2.02 Enforcement of environmental regulation..................111 ...■2.03 Sustainability of T&T industry development...............126 ...■2.04 Carbon dioxide emissions* ..........................................16 ...■2.05 Particulate matter concentration* ..............................128 ...■2.06 Threatened species* ..................................................106 ...■2.07 Environmental treaty ratification*.................................52 ...■
3rd pillar: Safety and security3.01 Business costs of terrorism .......................................114 ...■3.02 Reliability of police services .......................................121 ...■3.03 Business costs of crime and violence........................104 ...■3.04 Road traffic accidents*...............................................121 ...■
4th pillar: Health and hygiene4.01 Physician density*......................................................106 ...■4.02 Access to improved sanitation* .................................108 ...■4.03 Access to improved drinking water*..........................100 ...■4.04 Hospital beds*............................................................125 ...■
5th pillar: Prioritization of Travel & Tourism5.01 Government prioritization of the T&T industry...........124 ...■5.02 T&T government expenditure* ....................................95 ...■5.03 Effectiveness of marketing and branding...................124 ...■5.04 T&T fair attendance*....................................................62 ...■
6th pillar: Air transport infrastructure6.01 Quality of air transport infrastructure .........................118 ...■6.02 Available seat kilometers, domestic*...........................58 ...■6.03 Available seat kilometers, international* ......................61 ...■6.04 Departures per 1,000 population*..............................123 ...■6.05 Airport density* ..........................................................132 ...■6.06 Number of operating airlines*......................................69 ...■6.07 International air transport network ...............................84 ...■
7th pillar: Ground transport infrastructure7.01 Quality of roads ............................................................93 ...■7.02 Quality of railroad infrastructure...................................67 ...■7.03 Quality of port infrastructure ......................................121 ...■7.04 Quality of ground transport network..........................100 ...■7.05 Road density*...............................................................17 ...■
INDICATOR RANK/133
8th pillar: Tourism infrastructure8.01 Hotel rooms*..............................................................125 ...■8.02 Presence of major car rental companies*..................122 ...■8.03 ATMs accepting Visa cards* ......................................120 ...■
9th pillar: ICT infrastructure9.01 Extent of business Internet use.................................122 ...■9.02 Internet users* ...........................................................132 ...■9.03 Telephone lines*.........................................................123 ...■9.04 Broadband Internet subscribers* ...............................127 ...■9.05 Mobile telephone subscribers*..................................116 ...■
10th pillar: Price competitiveness in the T&T industry10.01 Ticket taxes and airport charges*.................................87 ...■10.02 Purchasing power parity*.............................................12 ...■10.03 Extent and effect of taxation........................................50 ...■10.04 Fuel price levels* .........................................................17 ...■10.05 Hotel price index* ........................................................28 ...■
11th pillar: Human resources11.01 Primary education enrollment* ....................................93 ...■11.02 Secondary education enrollment*..............................111 ...■11.03 Quality of the educational system..............................107 ...■11.04 Local availability of research and training services.....130 ...■11.05 Extent of staff training................................................132 ...■11.06 Hiring and firing practices.............................................29 ...■11.07 Ease of hiring foreign labor ........................................124 ...■11.08 HIV prevalence* .............................................................1 ...■11.09 Business impact of HIV/AIDS.......................................73 ...■11.10 Life expectancy* ........................................................104 ...■
12th pillar: Affinity for Travel & Tourism12.01 Tourism openness* ....................................................132 ...■12.02 Attitude of population toward foreign visitors..............77 ...■12.03 Extension of business trips recommended ...............116 ...■
13th pillar: Natural resources13.01 Number of World Heritage natural sites* ....................40 ...■13.02 Protected areas* ........................................................116 ...■13.03 Quality of the natural environment.............................128 ...■13.04 Total known species*...................................................44 ...■
14th pillar: Cultural resources14.01 Number of World Heritage cultural sites* ...................65 ...■14.02 Sports stadiums* .......................................................129 ...■14.03 Number of international fairs and exhibitions* ..........101 ...■14.04 Creative industries exports*.........................................64 ...■
Bangladesh
* Hard data
Note: For further details and explanation, please refer to the section “How toRead the Country/Economy Profiles” at the beginning of this chapter.
part2A_profiles.r2 2/26/09 4:01 AM Page 133
The Travel & Tourism Competitiveness Report 2009 © 2009 World Economic Forum

134
2.1:
Cou
ntry
/Eco
nom
y Pr
ofile
s
BarbadosKey indicatorsPopulation (millions), 2007..............................................................................0.3Surface area (1,000 square kilometers) ..........................................................0.4
Gross domestic product (US$ billions), 2007 .................................................3.4Gross domestic product (PPP, US$) per capita, 2007 ...........................18,558.6Real GDP growth (percent), 2007...................................................................3.3
Environmental Performance Index, 2008 (out of 149 countries) ....................n/a
Travel & Tourism indicators
T&T industry, 2008 estimatesGDP (US$ millions) ................................................................509.................12.6 ....................4.1Employment (1,000 jobs).........................................................22.................15.9 ....................2.1
T&T economy, 2008 estimatesGDP (US$ millions) .............................................................1,645.................40.7 ....................3.6Employment (1,000 jobs).........................................................63.................45.8 ....................1.8
Source: World Travel & Tourism Council, TSA Research 2008
International tourist arrivals (thousands), 2007......................575International tourism receipts (US$ millions), 2006 ..............967
Source: United Nations World Tourism Organization
Travel & Tourism Competitiveness Index
2009 Index......................................................................................................30 4.82008 Index............................................................................................................29 4.8T&T regulatory framework ..............................................................................19 5.5
Policy rules and regulations..........................................................................24 5.1Environmental sustainability..........................................................................29 5.1Safety and security .........................................................................................26 5.9Health and hygiene .........................................................................................40 5.8Prioritization of Travel & Tourism..................................................................19 5.4
T&T business environment and infrastructure ............................................29 4.6Air transport infrastructure ..........................................................................33 4.2Ground transport infrastructure....................................................................12 5.7Tourism infrastructure ....................................................................................42 4.2ICT infrastructure ............................................................................................26 4.6Price competitiveness in the T&T industry.................................................83 4.4
T&T human, cultural, and natural resources ...............................................45 4.2Human resources ............................................................................................32 5.4
Education and training .............................................................................25 5.4Availability of qualified labor...................................................................69 5.4
Affinity for Travel & Tourism ............................................................................2 6.6Natural resources .........................................................................................121 2.2Cultural resources...........................................................................................59 2.5
Note: For descriptions of variables and detailed sources, please refer to “How to the Read Country/Economy Profiles.”
Rank Score(out of 133) (1–7 scale)
International tourist arrivals (thousands)
International tourism receipts (US$ millions)
1995 1996 1997 1998 1999 2000 2001 2002 2003 2004 2005 2006 2007400
600
800
1,000
1 2 3 4 5 6 7
2009–2018Percent annual growth of total (%, forecast)
part2A_profiles.r2 2/26/09 4:01 AM Page 134
The Travel & Tourism Competitiveness Report 2009 © 2009 World Economic Forum
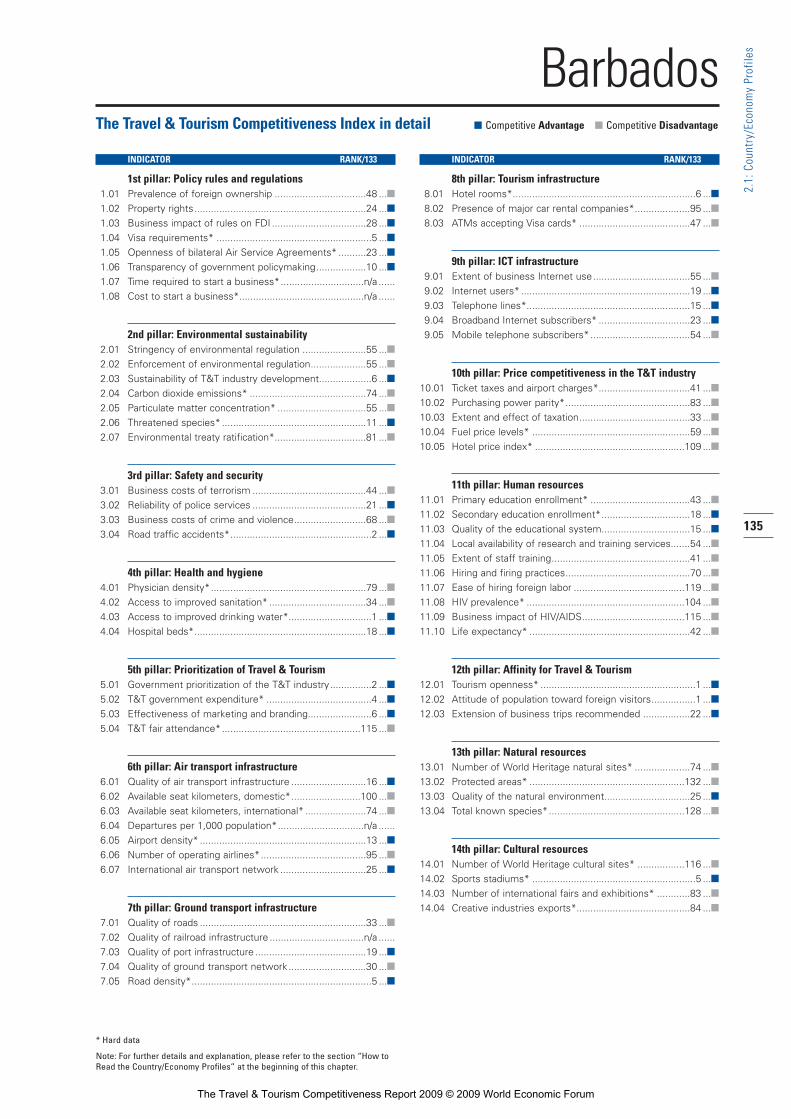
135
2.1:
Cou
ntry
/Eco
nom
y Pr
ofile
s
The Travel & Tourism Competitiveness Index in detail ■ Competitive Advantage ■ Competitive Disadvantage
INDICATOR RANK/133
1st pillar: Policy rules and regulations1.01 Prevalence of foreign ownership .................................48 ...■1.02 Property rights..............................................................24 ...■1.03 Business impact of rules on FDI ..................................28 ...■1.04 Visa requirements* ........................................................5 ...■1.05 Openness of bilateral Air Service Agreements* ..........23 ...■1.06 Transparency of government policymaking..................10 ...■1.07 Time required to start a business*..............................n/a ......1.08 Cost to start a business*.............................................n/a ......
2nd pillar: Environmental sustainability2.01 Stringency of environmental regulation .......................55 ...■2.02 Enforcement of environmental regulation....................55 ...■2.03 Sustainability of T&T industry development...................6 ...■2.04 Carbon dioxide emissions* ..........................................74 ...■2.05 Particulate matter concentration* ................................55 ...■2.06 Threatened species* ....................................................11 ...■2.07 Environmental treaty ratification*.................................81 ...■
3rd pillar: Safety and security3.01 Business costs of terrorism .........................................44 ...■3.02 Reliability of police services .........................................21 ...■3.03 Business costs of crime and violence..........................68 ...■3.04 Road traffic accidents*...................................................2 ...■
4th pillar: Health and hygiene4.01 Physician density*........................................................79 ...■4.02 Access to improved sanitation* ...................................34 ...■4.03 Access to improved drinking water*..............................1 ...■4.04 Hospital beds*..............................................................18 ...■
5th pillar: Prioritization of Travel & Tourism5.01 Government prioritization of the T&T industry...............2 ...■5.02 T&T government expenditure* ......................................4 ...■5.03 Effectiveness of marketing and branding.......................6 ...■5.04 T&T fair attendance*..................................................115 ...■
6th pillar: Air transport infrastructure6.01 Quality of air transport infrastructure ...........................16 ...■6.02 Available seat kilometers, domestic*.........................100 ...■6.03 Available seat kilometers, international* ......................74 ...■6.04 Departures per 1,000 population*...............................n/a ......6.05 Airport density* ............................................................13 ...■6.06 Number of operating airlines*......................................95 ...■6.07 International air transport network ...............................25 ...■
7th pillar: Ground transport infrastructure7.01 Quality of roads ............................................................33 ...■7.02 Quality of railroad infrastructure ..................................n/a ......7.03 Quality of port infrastructure ........................................19 ...■7.04 Quality of ground transport network ............................30 ...■7.05 Road density*.................................................................5 ...■
INDICATOR RANK/133
8th pillar: Tourism infrastructure8.01 Hotel rooms*..................................................................6 ...■8.02 Presence of major car rental companies*....................95 ...■8.03 ATMs accepting Visa cards* ........................................47 ...■
9th pillar: ICT infrastructure9.01 Extent of business Internet use...................................55 ...■9.02 Internet users* .............................................................19 ...■9.03 Telephone lines*...........................................................15 ...■9.04 Broadband Internet subscribers* .................................23 ...■9.05 Mobile telephone subscribers*....................................54 ...■
10th pillar: Price competitiveness in the T&T industry10.01 Ticket taxes and airport charges*.................................41 ...■10.02 Purchasing power parity*.............................................83 ...■10.03 Extent and effect of taxation........................................33 ...■10.04 Fuel price levels* .........................................................59 ...■10.05 Hotel price index* ......................................................109 ...■
11th pillar: Human resources11.01 Primary education enrollment* ....................................43 ...■11.02 Secondary education enrollment*................................18 ...■11.03 Quality of the educational system................................15 ...■11.04 Local availability of research and training services.......54 ...■11.05 Extent of staff training..................................................41 ...■11.06 Hiring and firing practices.............................................70 ...■11.07 Ease of hiring foreign labor ........................................119 ...■11.08 HIV prevalence* .........................................................104 ...■11.09 Business impact of HIV/AIDS.....................................115 ...■11.10 Life expectancy* ..........................................................42 ...■
12th pillar: Affinity for Travel & Tourism12.01 Tourism openness* ........................................................1 ...■12.02 Attitude of population toward foreign visitors................1 ...■12.03 Extension of business trips recommended .................22 ...■
13th pillar: Natural resources13.01 Number of World Heritage natural sites* ....................74 ...■13.02 Protected areas* ........................................................132 ...■13.03 Quality of the natural environment...............................25 ...■13.04 Total known species*.................................................128 ...■
14th pillar: Cultural resources14.01 Number of World Heritage cultural sites* .................116 ...■14.02 Sports stadiums* ...........................................................5 ...■14.03 Number of international fairs and exhibitions* ............83 ...■14.04 Creative industries exports*.........................................84 ...■
Barbados
* Hard data
Note: For further details and explanation, please refer to the section “How toRead the Country/Economy Profiles” at the beginning of this chapter.
part2A_profiles.r2 2/26/09 4:01 AM Page 135
The Travel & Tourism Competitiveness Report 2009 © 2009 World Economic Forum

136
2.1:
Cou
ntry
/Eco
nom
y Pr
ofile
s
BelgiumKey indicatorsPopulation (millions), 2007............................................................................10.5Surface area (1,000 square kilometers) ........................................................30.5
Gross domestic product (US$ billions), 2007 .............................................454.3Gross domestic product (PPP, US$) per capita, 2007 ...........................35,387.6Real GDP growth (percent), 2007...................................................................2.8
Environmental Performance Index, 2008 (out of 149 countries).....................57
Travel & Tourism indicators
T&T industry, 2008 estimatesGDP (US$ millions) ...........................................................13,057...................2.6 ....................4.3Employment (1,000 jobs).......................................................122...................2.8 ....................2.7
T&T economy, 2008 estimatesGDP (US$ millions) ...........................................................44,831...................8.9 ....................3.7Employment (1,000 jobs).......................................................405...................9.2 ....................2.2
Source: World Travel & Tourism Council, TSA Research 2008
International tourist arrivals (thousands), 2007...................7,045International tourism receipts (US$ millions), 2007 .........10,880
Source: United Nations World Tourism Organization
Travel & Tourism Competitiveness Index
2009 Index......................................................................................................22 4.92008 Index............................................................................................................27 4.8T&T regulatory framework ..............................................................................21 5.5
Policy rules and regulations..........................................................................20 5.2Environmental sustainability............................................................................8 5.6Safety and security .........................................................................................21 6.0Health and hygiene .........................................................................................16 6.6Prioritization of Travel & Tourism..................................................................92 3.9
T&T business environment and infrastructure ............................................32 4.6Air transport infrastructure ..........................................................................31 4.3Ground transport infrastructure......................................................................7 6.1Tourism infrastructure ....................................................................................41 4.2ICT infrastructure ............................................................................................22 4.8Price competitiveness in the T&T industry...............................................126 3.5
T&T human, cultural, and natural resources ...............................................20 4.7Human resources ............................................................................................13 5.8
Education and training ...............................................................................4 6.1Availability of qualified labor...................................................................55 5.5
Affinity for Travel & Tourism ..........................................................................42 5.0Natural resources .........................................................................................120 2.2Cultural resources.............................................................................................8 5.9
Note: For descriptions of variables and detailed sources, please refer to “How to the Read Country/Economy Profiles.”
Rank Score(out of 133) (1–7 scale)
International tourist arrivals (thousands)
International tourism receipts (US$ millions)
1995 1996 1997 1998 1999 2000 2001 2002 2003 2004 2005 2006 20074,000
6,000
8,000
10,000
12,000
1 2 3 4 5 6 7
2009–2018Percent annual growth of total (%, forecast)
part2A_profiles.r2 2/26/09 4:01 AM Page 136
The Travel & Tourism Competitiveness Report 2009 © 2009 World Economic Forum

137
2.1:
Cou
ntry
/Eco
nom
y Pr
ofile
s
The Travel & Tourism Competitiveness Index in detail ■ Competitive Advantage ■ Competitive Disadvantage
INDICATOR RANK/133
1st pillar: Policy rules and regulations1.01 Prevalence of foreign ownership .................................12 ...■1.02 Property rights..............................................................19 ...■1.03 Business impact of rules on FDI ..................................21 ...■1.04 Visa requirements* ......................................................40 ...■1.05 Openness of bilateral Air Service Agreements* ..........33 ...■1.06 Transparency of government policymaking..................57 ...■1.07 Time required to start a business*.................................4 ...■1.08 Cost to start a business* .............................................42 ...■
2nd pillar: Environmental sustainability2.01 Stringency of environmental regulation .........................9 ...■2.02 Enforcement of environmental regulation....................13 ...■2.03 Sustainability of T&T industry development.................60 ...■2.04 Carbon dioxide emissions* ........................................102 ...■2.05 Particulate matter concentration* ................................35 ...■2.06 Threatened species* ......................................................7 ...■2.07 Environmental treaty ratification*.................................10 ...■
3rd pillar: Safety and security3.01 Business costs of terrorism .........................................47 ...■3.02 Reliability of police services .........................................28 ...■3.03 Business costs of crime and violence..........................27 ...■3.04 Road traffic accidents*.................................................58 ...■
4th pillar: Health and hygiene4.01 Physician density*..........................................................4 ...■4.02 Access to improved sanitation* .....................................1 ...■4.03 Access to improved drinking water*..............................1 ...■4.04 Hospital beds*..............................................................32 ...■
5th pillar: Prioritization of Travel & Tourism5.01 Government prioritization of the T&T industry.............81 ...■5.02 T&T government expenditure* ....................................67 ...■5.03 Effectiveness of marketing and branding.....................64 ...■5.04 T&T fair attendance*....................................................98 ...■
6th pillar: Air transport infrastructure6.01 Quality of air transport infrastructure ...........................15 ...■6.02 Available seat kilometers, domestic*...........................96 ...■6.03 Available seat kilometers, international* ......................30 ...■6.04 Departures per 1,000 population*................................25 ...■6.05 Airport density* ............................................................84 ...■6.06 Number of operating airlines*......................................16 ...■6.07 International air transport network ...............................29 ...■
7th pillar: Ground transport infrastructure7.01 Quality of roads ............................................................11 ...■7.02 Quality of railroad infrastructure.....................................8 ...■7.03 Quality of port infrastructure ..........................................7 ...■7.04 Quality of ground transport network ............................17 ...■7.05 Road density*.................................................................2 ...■
INDICATOR RANK/133
8th pillar: Tourism infrastructure8.01 Hotel rooms*................................................................44 ...■8.02 Presence of major car rental companies*....................23 ...■8.03 ATMs accepting Visa cards* ........................................44 ...■
9th pillar: ICT infrastructure9.01 Extent of business Internet use...................................24 ...■9.02 Internet users* .............................................................30 ...■9.03 Telephone lines*...........................................................23 ...■9.04 Broadband Internet subscribers* .................................11 ...■9.05 Mobile telephone subscribers*....................................41 ...■
10th pillar: Price competitiveness in the T&T industry10.01 Ticket taxes and airport charges*.................................57 ...■10.02 Purchasing power parity*...........................................121 ...■10.03 Extent and effect of taxation......................................131 ...■10.04 Fuel price levels* .......................................................118 ...■10.05 Hotel price index* ........................................................78 ...■
11th pillar: Human resources11.01 Primary education enrollment* ....................................28 ...■11.02 Secondary education enrollment*................................12 ...■11.03 Quality of the educational system..................................4 ...■11.04 Local availability of research and training services.......11 ...■11.05 Extent of staff training..................................................13 ...■11.06 Hiring and firing practices...........................................116 ...■11.07 Ease of hiring foreign labor ..........................................78 ...■11.08 HIV prevalence* ...........................................................49 ...■11.09 Business impact of HIV/AIDS.......................................27 ...■11.10 Life expectancy* ..........................................................22 ...■
12th pillar: Affinity for Travel & Tourism12.01 Tourism openness* ......................................................47 ...■12.02 Attitude of population toward foreign visitors..............19 ...■12.03 Extension of business trips recommended .................57 ...■
13th pillar: Natural resources13.01 Number of World Heritage natural sites* ....................74 ...■13.02 Protected areas* ........................................................105 ...■13.03 Quality of the natural environment...............................84 ...■13.04 Total known species*.................................................109 ...■
14th pillar: Cultural resources14.01 Number of World Heritage cultural sites* ...................17 ...■14.02 Sports stadiums* .........................................................28 ...■14.03 Number of international fairs and exhibitions* ............19 ...■14.04 Creative industries exports*.........................................12 ...■
Belgium
* Hard data
Note: For further details and explanation, please refer to the section “How toRead the Country/Economy Profiles” at the beginning of this chapter.
part2A_profiles.r2 2/26/09 4:01 AM Page 137
The Travel & Tourism Competitiveness Report 2009 © 2009 World Economic Forum
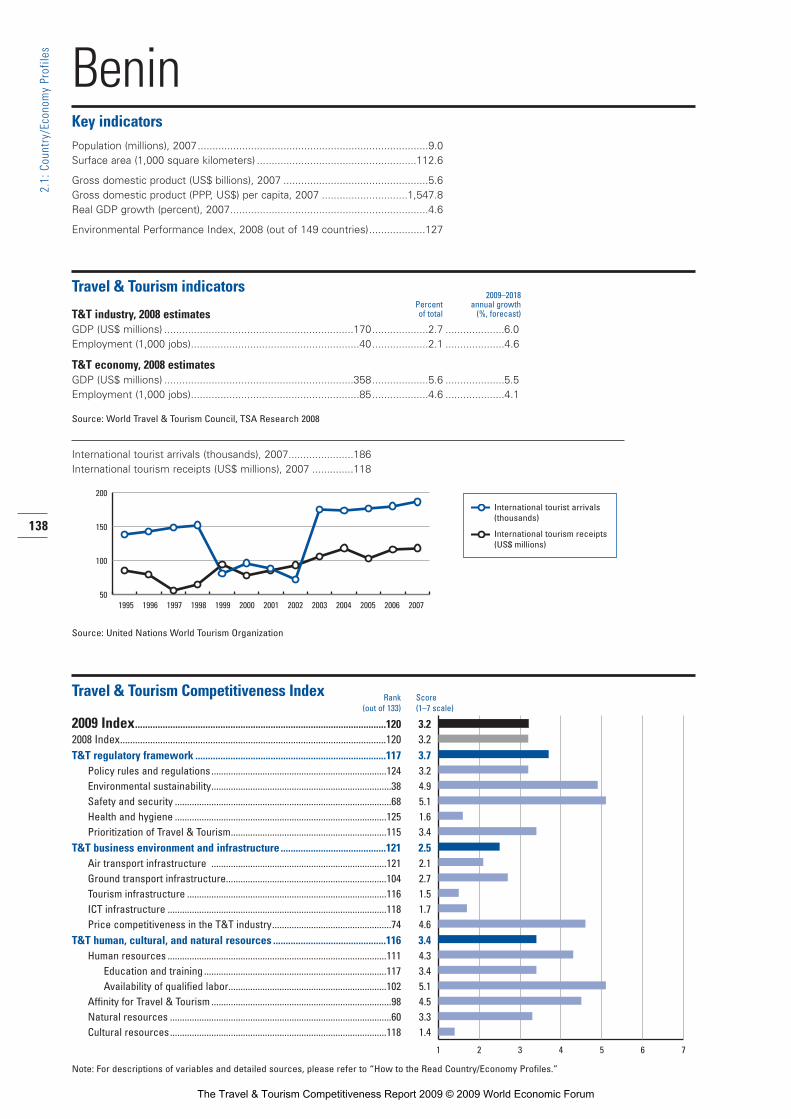
138
2.1:
Cou
ntry
/Eco
nom
y Pr
ofile
s
BeninKey indicatorsPopulation (millions), 2007..............................................................................9.0Surface area (1,000 square kilometers) ......................................................112.6
Gross domestic product (US$ billions), 2007 .................................................5.6Gross domestic product (PPP, US$) per capita, 2007 .............................1,547.8Real GDP growth (percent), 2007...................................................................4.6
Environmental Performance Index, 2008 (out of 149 countries)...................127
Travel & Tourism indicators
T&T industry, 2008 estimatesGDP (US$ millions) ................................................................170...................2.7 ....................6.0Employment (1,000 jobs).........................................................40...................2.1 ....................4.6
T&T economy, 2008 estimatesGDP (US$ millions) ................................................................358...................5.6 ....................5.5Employment (1,000 jobs).........................................................85...................4.6 ....................4.1
Source: World Travel & Tourism Council, TSA Research 2008
International tourist arrivals (thousands), 2007......................186International tourism receipts (US$ millions), 2007 ..............118
Source: United Nations World Tourism Organization
Travel & Tourism Competitiveness Index
2009 Index....................................................................................................120 3.22008 Index..........................................................................................................120 3.2T&T regulatory framework ............................................................................117 3.7
Policy rules and regulations........................................................................124 3.2Environmental sustainability..........................................................................38 4.9Safety and security .........................................................................................68 5.1Health and hygiene .......................................................................................125 1.6Prioritization of Travel & Tourism................................................................115 3.4
T&T business environment and infrastructure ..........................................121 2.5Air transport infrastructure ........................................................................121 2.1Ground transport infrastructure..................................................................104 2.7Tourism infrastructure ..................................................................................116 1.5ICT infrastructure ..........................................................................................118 1.7Price competitiveness in the T&T industry.................................................74 4.6
T&T human, cultural, and natural resources .............................................116 3.4Human resources ..........................................................................................111 4.3
Education and training ...........................................................................117 3.4Availability of qualified labor.................................................................102 5.1
Affinity for Travel & Tourism ..........................................................................98 4.5Natural resources ...........................................................................................60 3.3Cultural resources.........................................................................................118 1.4
Note: For descriptions of variables and detailed sources, please refer to “How to the Read Country/Economy Profiles.”
Rank Score(out of 133) (1–7 scale)
International tourist arrivals (thousands)
International tourism receipts (US$ millions)
1995 1996 1997 1998 1999 2000 2001 2002 2003 2004 2005 2006 200750
100
150
200
1 2 3 4 5 6 7
2009–2018Percent annual growth of total (%, forecast)
part2A_profiles.r2 2/26/09 4:01 AM Page 138
The Travel & Tourism Competitiveness Report 2009 © 2009 World Economic Forum

139
2.1:
Cou
ntry
/Eco
nom
y Pr
ofile
s
The Travel & Tourism Competitiveness Index in detail ■ Competitive Advantage ■ Competitive Disadvantage
INDICATOR RANK/133
1st pillar: Policy rules and regulations1.01 Prevalence of foreign ownership .................................90 ...■1.02 Property rights............................................................110 ...■1.03 Business impact of rules on FDI ................................105 ...■1.04 Visa requirements* ....................................................108 ...■1.05 Openness of bilateral Air Service Agreements* ........122 ...■1.06 Transparency of government policymaking..................75 ...■1.07 Time required to start a business*...............................85 ...■1.08 Cost to start a business* ...........................................126 ...■
2nd pillar: Environmental sustainability2.01 Stringency of environmental regulation .......................94 ...■2.02 Enforcement of environmental regulation....................85 ...■2.03 Sustainability of T&T industry development.................83 ...■2.04 Carbon dioxide emissions* ..........................................18 ...■2.05 Particulate matter concentration* ................................75 ...■2.06 Threatened species* ....................................................17 ...■2.07 Environmental treaty ratification*.................................52 ...■
3rd pillar: Safety and security3.01 Business costs of terrorism .........................................95 ...■3.02 Reliability of police services .........................................44 ...■3.03 Business costs of crime and violence..........................96 ...■3.04 Road traffic accidents*.................................................71 ...■
4th pillar: Health and hygiene4.01 Physician density*......................................................126 ...■4.02 Access to improved sanitation* .................................114 ...■4.03 Access to improved drinking water*..........................115 ...■4.04 Hospital beds*............................................................120 ...■
5th pillar: Prioritization of Travel & Tourism5.01 Government prioritization of the T&T industry.............91 ...■5.02 T&T government expenditure* ....................................72 ...■5.03 Effectiveness of marketing and branding.....................80 ...■5.04 T&T fair attendance*..................................................126 ...■
6th pillar: Air transport infrastructure6.01 Quality of air transport infrastructure .........................100 ...■6.02 Available seat kilometers, domestic*.........................100 ...■6.03 Available seat kilometers, international* ....................119 ...■6.04 Departures per 1,000 population*..............................118 ...■6.05 Airport density* ..........................................................126 ...■6.06 Number of operating airlines*....................................108 ...■6.07 International air transport network .............................102 ...■
7th pillar: Ground transport infrastructure7.01 Quality of roads ............................................................97 ...■7.02 Quality of railroad infrastructure...................................87 ...■7.03 Quality of port infrastructure ........................................96 ...■7.04 Quality of ground transport network ............................86 ...■7.05 Road density*...............................................................83 ...■
INDICATOR RANK/133
8th pillar: Tourism infrastructure8.01 Hotel rooms*................................................................97 ...■8.02 Presence of major car rental companies*....................95 ...■8.03 ATMs accepting Visa cards* ......................................117 ...■
9th pillar: ICT infrastructure9.01 Extent of business Internet use...................................99 ...■9.02 Internet users* ...........................................................118 ...■9.03 Telephone lines*.........................................................117 ...■9.04 Broadband Internet subscribers* ...............................114 ...■9.05 Mobile telephone subscribers*..................................117 ...■
10th pillar: Price competitiveness in the T&T industry10.01 Ticket taxes and airport charges*...............................112 ...■10.02 Purchasing power parity*.............................................34 ...■10.03 Extent and effect of taxation......................................119 ...■10.04 Fuel price levels* .........................................................61 ...■10.05 Hotel price index* .......................................................n/a ......
11th pillar: Human resources11.01 Primary education enrollment* ..................................110 ...■11.02 Secondary education enrollment*..............................116 ...■11.03 Quality of the educational system................................89 ...■11.04 Local availability of research and training services.......85 ...■11.05 Extent of staff training................................................121 ...■11.06 Hiring and firing practices.............................................57 ...■11.07 Ease of hiring foreign labor ..........................................28 ...■11.08 HIV prevalence* .........................................................104 ...■11.09 Business impact of HIV/AIDS.....................................113 ...■11.10 Life expectancy* ........................................................116 ...■
12th pillar: Affinity for Travel & Tourism12.01 Tourism openness* ......................................................99 ...■12.02 Attitude of population toward foreign visitors..............73 ...■12.03 Extension of business trips recommended .................82 ...■
13th pillar: Natural resources13.01 Number of World Heritage natural sites* ....................74 ...■13.02 Protected areas* ..........................................................22 ...■13.03 Quality of the natural environment.............................119 ...■13.04 Total known species*...................................................52 ...■
14th pillar: Cultural resources14.01 Number of World Heritage cultural sites* ...................82 ...■14.02 Sports stadiums* .......................................................100 ...■14.03 Number of international fairs and exhibitions* ..........107 ...■14.04 Creative industries exports*.......................................114 ...■
Benin
* Hard data
Note: For further details and explanation, please refer to the section “How toRead the Country/Economy Profiles” at the beginning of this chapter.
part2A_profiles.r2 2/26/09 4:01 AM Page 139
The Travel & Tourism Competitiveness Report 2009 © 2009 World Economic Forum

140
2.1:
Cou
ntry
/Eco
nom
y Pr
ofile
s
BoliviaKey indicatorsPopulation (millions), 2007..............................................................................9.5Surface area (1,000 square kilometers) ...................................................1,098.6
Gross domestic product (US$ billions), 2007 ...............................................13.3Gross domestic product (PPP, US$) per capita, 2007 .............................4,084.5Real GDP growth (percent), 2007...................................................................4.6
Environmental Performance Index, 2008 (out of 149 countries)...................110
Travel & Tourism indicators
T&T industry, 2008 estimatesGDP (US$ millions) ................................................................308...................2.1 ....................3.7Employment (1,000 jobs).........................................................72...................1.7 ....................2.4
T&T economy, 2008 estimatesGDP (US$ millions) ................................................................894...................6.1 ....................3.5Employment (1,000 jobs).......................................................209...................5.0 ....................2.2
Source: World Travel & Tourism Council, TSA Research 2008
International tourist arrivals (thousands), 2007......................556International tourism receipts (US$ millions), 2007 ..............259
Source: United Nations World Tourism Organization
Travel & Tourism Competitiveness Index
2009 Index....................................................................................................114 3.32008 Index..........................................................................................................106 3.4T&T regulatory framework ............................................................................127 3.3
Policy rules and regulations........................................................................131 2.6Environmental sustainability........................................................................126 3.6Safety and security .......................................................................................104 4.4Health and hygiene .......................................................................................104 3.1Prioritization of Travel & Tourism................................................................128 2.9
T&T business environment and infrastructure ..........................................110 2.7Air transport infrastructure ........................................................................114 2.2Ground transport infrastructure..................................................................124 2.3Tourism infrastructure ..................................................................................104 1.8ICT infrastructure ..........................................................................................109 1.9Price competitiveness in the T&T industry.................................................13 5.4
T&T human, cultural, and natural resources ...............................................58 4.0Human resources ..........................................................................................103 4.5
Education and training .............................................................................99 4.1Availability of qualified labor.................................................................112 4.9
Affinity for Travel & Tourism ........................................................................125 4.1Natural resources ...........................................................................................12 5.0Cultural resources...........................................................................................66 2.3
Note: For descriptions of variables and detailed sources, please refer to “How to the Read Country/Economy Profiles.”
Rank Score(out of 133) (1–7 scale)
International tourist arrivals (thousands)
International tourism receipts (US$ millions)
1995 1996 1997 1998 1999 2000 2001 2002 2003 2004 2005 2006 20070
100
200
300
400
500
600
1 2 3 4 5 6 7
2009–2018Percent annual growth of total (%, forecast)
part2A_profiles.r2 2/26/09 4:01 AM Page 140
The Travel & Tourism Competitiveness Report 2009 © 2009 World Economic Forum

141
2.1:
Cou
ntry
/Eco
nom
y Pr
ofile
s
The Travel & Tourism Competitiveness Index in detail ■ Competitive Advantage ■ Competitive Disadvantage
INDICATOR RANK/133
1st pillar: Policy rules and regulations1.01 Prevalence of foreign ownership ...............................124 ...■1.02 Property rights............................................................131 ...■1.03 Business impact of rules on FDI ................................131 ...■1.04 Visa requirements* ......................................................80 ...■1.05 Openness of bilateral Air Service Agreements* ..........67 ...■1.06 Transparency of government policymaking................132 ...■1.07 Time required to start a business*.............................112 ...■1.08 Cost to start a business* ...........................................117 ...■
2nd pillar: Environmental sustainability2.01 Stringency of environmental regulation .....................120 ...■2.02 Enforcement of environmental regulation..................131 ...■2.03 Sustainability of T&T industry development...............133 ...■2.04 Carbon dioxide emissions* ..........................................27 ...■2.05 Particulate matter concentration* ..............................118 ...■2.06 Threatened species* ....................................................63 ...■2.07 Environmental treaty ratification*.................................67 ...■
3rd pillar: Safety and security3.01 Business costs of terrorism .........................................94 ...■3.02 Reliability of police services .......................................131 ...■3.03 Business costs of crime and violence........................101 ...■3.04 Road traffic accidents*.................................................62 ...■
4th pillar: Health and hygiene4.01 Physician density*........................................................78 ...■4.02 Access to improved sanitation* .................................105 ...■4.03 Access to improved drinking water*............................89 ...■4.04 Hospital beds*............................................................101 ...■
5th pillar: Prioritization of Travel & Tourism5.01 Government prioritization of the T&T industry...........129 ...■5.02 T&T government expenditure* ....................................70 ...■5.03 Effectiveness of marketing and branding...................133 ...■5.04 T&T fair attendance*....................................................81 ...■
6th pillar: Air transport infrastructure6.01 Quality of air transport infrastructure .........................122 ...■6.02 Available seat kilometers, domestic*...........................45 ...■6.03 Available seat kilometers, international* ......................97 ...■6.04 Departures per 1,000 population*................................69 ...■6.05 Airport density* ............................................................34 ...■6.06 Number of operating airlines*....................................106 ...■6.07 International air transport network .............................129 ...■
7th pillar: Ground transport infrastructure7.01 Quality of roads ..........................................................128 ...■7.02 Quality of railroad infrastructure...................................95 ...■7.03 Quality of port infrastructure ........................................98 ...■7.04 Quality of ground transport network..........................119 ...■7.05 Road density*.............................................................115 ...■
INDICATOR RANK/133
8th pillar: Tourism infrastructure8.01 Hotel rooms*................................................................77 ...■8.02 Presence of major car rental companies*....................95 ...■8.03 ATMs accepting Visa cards* ........................................95 ...■
9th pillar: ICT infrastructure9.01 Extent of business Internet use.................................128 ...■9.02 Internet users* .............................................................91 ...■9.03 Telephone lines*.........................................................101 ...■9.04 Broadband Internet subscribers* .................................90 ...■9.05 Mobile telephone subscribers*..................................103 ...■
10th pillar: Price competitiveness in the T&T industry10.01 Ticket taxes and airport charges*.................................93 ...■10.02 Purchasing power parity*...............................................6 ...■10.03 Extent and effect of taxation......................................108 ...■10.04 Fuel price levels* .........................................................20 ...■10.05 Hotel price index* ..........................................................3 ...■
11th pillar: Human resources11.01 Primary education enrollment* ....................................53 ...■11.02 Secondary education enrollment*................................82 ...■11.03 Quality of the educational system..............................131 ...■11.04 Local availability of research and training services.....118 ...■11.05 Extent of staff training................................................123 ...■11.06 Hiring and firing practices...........................................126 ...■11.07 Ease of hiring foreign labor ..........................................72 ...■11.08 HIV prevalence* ...........................................................49 ...■11.09 Business impact of HIV/AIDS.......................................86 ...■11.10 Life expectancy* ..........................................................96 ...■
12th pillar: Affinity for Travel & Tourism12.01 Tourism openness* ......................................................85 ...■12.02 Attitude of population toward foreign visitors............122 ...■12.03 Extension of business trips recommended ...............126 ...■
13th pillar: Natural resources13.01 Number of World Heritage natural sites* ....................40 ...■13.02 Protected areas* ..........................................................24 ...■13.03 Quality of the natural environment...............................22 ...■13.04 Total known species*.....................................................8 ...■
14th pillar: Cultural resources14.01 Number of World Heritage cultural sites* ...................26 ...■14.02 Sports stadiums* .........................................................71 ...■14.03 Number of international fairs and exhibitions* ............71 ...■14.04 Creative industries exports*.........................................68 ...■
Bolivia
* Hard data
Note: For further details and explanation, please refer to the section “How toRead the Country/Economy Profiles” at the beginning of this chapter.
part2A_profiles.r2 2/26/09 4:01 AM Page 141
The Travel & Tourism Competitiveness Report 2009 © 2009 World Economic Forum

142
2.1:
Cou
ntry
/Eco
nom
y Pr
ofile
s
Bosnia and HerzegovinaKey indicatorsPopulation (millions), 2007..............................................................................4.0Surface area (1,000 square kilometers) ........................................................51.2
Gross domestic product (US$ billions), 2007 ...............................................15.2Gross domestic product (PPP, US$) per capita, 2007 .............................7,074.2Real GDP growth (percent), 2007...................................................................6.8
Environmental Performance Index, 2008 (out of 149 countries).....................48
Travel & Tourism indicators
T&T industry, 2008 estimatesGDP (US$ millions) ................................................................461...................2.9 ....................3.6Employment (1,000 jobs).........................................................26...................2.3 ..................–1.3
T&T economy, 2008 estimatesGDP (US$ millions) .............................................................1,637.................10.3 ....................4.3Employment (1,000 jobs).........................................................95...................8.3 ..................–0.5
Source: World Travel & Tourism Council, TSA Research 2008
International tourist arrivals (thousands), 2007......................306International tourism receipts (US$ millions), 2007 ..............728
Source: United Nations World Tourism Organization
Travel & Tourism Competitiveness Index
2009 Index....................................................................................................107 3.42008 Index..........................................................................................................105 3.4T&T regulatory framework ..............................................................................96 4.1
Policy rules and regulations........................................................................119 3.4Environmental sustainability........................................................................115 3.9Safety and security .........................................................................................57 5.3Health and hygiene .........................................................................................56 5.0Prioritization of Travel & Tourism................................................................126 3.0
T&T business environment and infrastructure ............................................93 3.0Air transport infrastructure ........................................................................130 1.9Ground transport infrastructure..................................................................126 2.2Tourism infrastructure ....................................................................................57 3.7ICT infrastructure ............................................................................................66 2.9Price competitiveness in the T&T industry...............................................100 4.2
T&T human, cultural, and natural resources .............................................124 3.3Human resources ..........................................................................................109 4.4
Education and training ...........................................................................124 3.1Availability of qualified labor...................................................................30 5.7
Affinity for Travel & Tourism ..........................................................................92 4.5Natural resources .........................................................................................123 2.2Cultural resources...........................................................................................81 1.9
Note: For descriptions of variables and detailed sources, please refer to “How to the Read Country/Economy Profiles.”
Rank Score(out of 133) (1–7 scale)
International tourist arrivals (thousands)
International tourism receipts (US$ millions)
1995 1996 1997 1998 1999 2000 2001 2002 2003 2004 2005 2006 20070
200
400
600
800
1 2 3 4 5 6 7
2009–2018Percent annual growth of total (%, forecast)
part2A_profiles.r2 2/26/09 4:01 AM Page 142
The Travel & Tourism Competitiveness Report 2009 © 2009 World Economic Forum

143
2.1:
Cou
ntry
/Eco
nom
y Pr
ofile
s
The Travel & Tourism Competitiveness Index in detail ■ Competitive Advantage ■ Competitive Disadvantage
INDICATOR RANK/133
1st pillar: Policy rules and regulations1.01 Prevalence of foreign ownership ...............................100 ...■1.02 Property rights............................................................121 ...■1.03 Business impact of rules on FDI ................................127 ...■1.04 Visa requirements* ......................................................78 ...■1.05 Openness of bilateral Air Service Agreements* ..........73 ...■1.06 Transparency of government policymaking................129 ...■1.07 Time required to start a business*.............................115 ...■1.08 Cost to start a business* .............................................96 ...■
2nd pillar: Environmental sustainability2.01 Stringency of environmental regulation .....................130 ...■2.02 Enforcement of environmental regulation..................127 ...■2.03 Sustainability of T&T industry development...............129 ...■2.04 Carbon dioxide emissions* ..........................................70 ...■2.05 Particulate matter concentration* ................................20 ...■2.06 Threatened species* ....................................................39 ...■2.07 Environmental treaty ratification*...............................127 ...■
3rd pillar: Safety and security3.01 Business costs of terrorism .........................................23 ...■3.02 Reliability of police services .......................................110 ...■3.03 Business costs of crime and violence..........................70 ...■3.04 Road traffic accidents*.................................................15 ...■
4th pillar: Health and hygiene4.01 Physician density*........................................................70 ...■4.02 Access to improved sanitation* ...................................46 ...■4.03 Access to improved drinking water*............................38 ...■4.04 Hospital beds*..............................................................57 ...■
5th pillar: Prioritization of Travel & Tourism5.01 Government prioritization of the T&T industry...........111 ...■5.02 T&T government expenditure* ..................................117 ...■5.03 Effectiveness of marketing and branding...................125 ...■5.04 T&T fair attendance*....................................................98 ...■
6th pillar: Air transport infrastructure6.01 Quality of air transport infrastructure .........................131 ...■6.02 Available seat kilometers, domestic*.........................100 ...■6.03 Available seat kilometers, international* ....................129 ...■6.04 Departures per 1,000 population*................................87 ...■6.05 Airport density* ............................................................59 ...■6.06 Number of operating airlines*....................................113 ...■6.07 International air transport network .............................130 ...■
7th pillar: Ground transport infrastructure7.01 Quality of roads ..........................................................130 ...■7.02 Quality of railroad infrastructure.................................103 ...■7.03 Quality of port infrastructure ......................................133 ...■7.04 Quality of ground transport network ............................96 ...■7.05 Road density*...............................................................55 ...■
INDICATOR RANK/133
8th pillar: Tourism infrastructure8.01 Hotel rooms*................................................................70 ...■8.02 Presence of major car rental companies*......................1 ...■8.03 ATMs accepting Visa cards* ........................................74 ...■
9th pillar: ICT infrastructure9.01 Extent of business Internet use...................................91 ...■9.02 Internet users* .............................................................55 ...■9.03 Telephone lines*...........................................................52 ...■9.04 Broadband Internet subscribers* .................................67 ...■9.05 Mobile telephone subscribers*....................................83 ...■
10th pillar: Price competitiveness in the T&T industry10.01 Ticket taxes and airport charges*...............................110 ...■10.02 Purchasing power parity*.............................................59 ...■10.03 Extent and effect of taxation......................................111 ...■10.04 Fuel price levels* .......................................................104 ...■10.05 Hotel price index* .......................................................n/a ......
11th pillar: Human resources11.01 Primary education enrollment*....................................n/a ......11.02 Secondary education enrollment*..............................109 ...■11.03 Quality of the educational system................................92 ...■11.04 Local availability of research and training services.....126 ...■11.05 Extent of staff training................................................125 ...■11.06 Hiring and firing practices.............................................20 ...■11.07 Ease of hiring foreign labor ..........................................76 ...■11.08 HIV prevalence* .............................................................1 ...■11.09 Business impact of HIV/AIDS.......................................26 ...■11.10 Life expectancy* ..........................................................42 ...■
12th pillar: Affinity for Travel & Tourism12.01 Tourism openness* ......................................................48 ...■12.02 Attitude of population toward foreign visitors..............98 ...■12.03 Extension of business trips recommended ...............117 ...■
13th pillar: Natural resources13.01 Number of World Heritage natural sites* ....................74 ...■13.02 Protected areas* ........................................................124 ...■13.03 Quality of the natural environment...............................71 ...■13.04 Total known species*.................................................104 ...■
14th pillar: Cultural resources14.01 Number of World Heritage cultural sites* ...................82 ...■14.02 Sports stadiums* .........................................................36 ...■14.03 Number of international fairs and exhibitions* ............83 ...■14.04 Creative industries exports*.........................................86 ...■
Bosnia and Herzegovina
* Hard data
Note: For further details and explanation, please refer to the section “How toRead the Country/Economy Profiles” at the beginning of this chapter.
part2A_profiles.r2 2/26/09 4:01 AM Page 143
The Travel & Tourism Competitiveness Report 2009 © 2009 World Economic Forum

144
2.1:
Cou
ntry
/Eco
nom
y Pr
ofile
s
BotswanaKey indicatorsPopulation (millions), 2007..............................................................................1.8Surface area (1,000 square kilometers) ......................................................581.7
Gross domestic product (US$ billions), 2007 ...............................................12.4Gross domestic product (PPP, US$) per capita, 2007 ...........................16,516.1Real GDP growth (percent), 2007...................................................................5.7
Environmental Performance Index, 2008 (out of 149 countries).....................98
Travel & Tourism indicators
T&T industry, 2008 estimatesGDP (US$ millions) ................................................................503...................4.3 ....................6.6Employment (1,000 jobs).........................................................25...................4.4 ....................2.5
T&T economy, 2008 estimatesGDP (US$ millions) .............................................................1,110...................9.4 ....................6.3Employment (1,000 jobs).........................................................60.................10.7 ....................3.0
Source: World Travel & Tourism Council, TSA Research 2008
International tourist arrivals (thousands), 2005...................1,675International tourism receipts (US$ millions), 2007 ..............546
Source: United Nations World Tourism Organization
Travel & Tourism Competitiveness Index
2009 Index......................................................................................................79 3.82008 Index............................................................................................................87 3.7T&T regulatory framework ..............................................................................66 4.5
Policy rules and regulations..........................................................................70 4.4Environmental sustainability..........................................................................62 4.6Safety and security .........................................................................................49 5.5Health and hygiene .........................................................................................97 3.4Prioritization of Travel & Tourism..................................................................43 4.8
T&T business environment and infrastructure ............................................76 3.3Air transport infrastructure ..........................................................................83 2.7Ground transport infrastructure....................................................................66 3.5Tourism infrastructure ....................................................................................79 2.5ICT infrastructure ............................................................................................93 2.2Price competitiveness in the T&T industry...................................................9 5.6
T&T human, cultural, and natural resources ...............................................95 3.6Human resources ..........................................................................................120 4.0
Education and training .............................................................................88 4.3Availability of qualified labor.................................................................130 3.6
Affinity for Travel & Tourism ..........................................................................49 4.9Natural resources ...........................................................................................34 4.2Cultural resources.........................................................................................126 1.3
Note: For descriptions of variables and detailed sources, please refer to “How to the Read Country/Economy Profiles.”
Rank Score(out of 133) (1–7 scale)
International tourist arrivals (thousands)
International tourism receipts (US$ millions)
1995 1996 1997 1998 1999 2000 2001 2002 2003 2004 2005 2006 20070
500
1,000
1,500
2,000
1 2 3 4 5 6 7
2009–2018Percent annual growth of total (%, forecast)
part2A_profiles.r2 2/26/09 4:01 AM Page 144
The Travel & Tourism Competitiveness Report 2009 © 2009 World Economic Forum

145
2.1:
Cou
ntry
/Eco
nom
y Pr
ofile
s
The Travel & Tourism Competitiveness Index in detail ■ Competitive Advantage ■ Competitive Disadvantage
INDICATOR RANK/133
1st pillar: Policy rules and regulations1.01 Prevalence of foreign ownership .................................38 ...■1.02 Property rights..............................................................48 ...■1.03 Business impact of rules on FDI ..................................33 ...■1.04 Visa requirements* ......................................................26 ...■1.05 Openness of bilateral Air Service Agreements* ........103 ...■1.06 Transparency of government policymaking..................39 ...■1.07 Time required to start a business*.............................123 ...■1.08 Cost to start a business* .............................................22 ...■
2nd pillar: Environmental sustainability2.01 Stringency of environmental regulation .......................59 ...■2.02 Enforcement of environmental regulation....................68 ...■2.03 Sustainability of T&T industry development.................14 ...■2.04 Carbon dioxide emissions* ..........................................57 ...■2.05 Particulate matter concentration* ..............................100 ...■2.06 Threatened species* ....................................................13 ...■2.07 Environmental treaty ratification*...............................104 ...■
3rd pillar: Safety and security3.01 Business costs of terrorism .........................................46 ...■3.02 Reliability of police services .........................................48 ...■3.03 Business costs of crime and violence..........................88 ...■3.04 Road traffic accidents*.................................................22 ...■
4th pillar: Health and hygiene4.01 Physician density*......................................................103 ...■4.02 Access to improved sanitation* .................................102 ...■4.03 Access to improved drinking water*............................58 ...■4.04 Hospital beds*..............................................................74 ...■
5th pillar: Prioritization of Travel & Tourism5.01 Government prioritization of the T&T industry.............26 ...■5.02 T&T government expenditure* ....................................23 ...■5.03 Effectiveness of marketing and branding.....................34 ...■5.04 T&T fair attendance*....................................................81 ...■
6th pillar: Air transport infrastructure6.01 Quality of air transport infrastructure ...........................97 ...■6.02 Available seat kilometers, domestic*...........................79 ...■6.03 Available seat kilometers, international* ....................131 ...■6.04 Departures per 1,000 population*................................56 ...■6.05 Airport density* ............................................................23 ...■6.06 Number of operating airlines*....................................132 ...■6.07 International air transport network ...............................95 ...■
7th pillar: Ground transport infrastructure7.01 Quality of roads ............................................................44 ...■7.02 Quality of railroad infrastructure...................................36 ...■7.03 Quality of port infrastructure ........................................60 ...■7.04 Quality of ground transport network ............................94 ...■7.05 Road density*.............................................................120 ...■
INDICATOR RANK/133
8th pillar: Tourism infrastructure8.01 Hotel rooms*................................................................72 ...■8.02 Presence of major car rental companies*....................73 ...■8.03 ATMs accepting Visa cards* ........................................70 ...■
9th pillar: ICT infrastructure9.01 Extent of business Internet use.................................103 ...■9.02 Internet users* ...........................................................111 ...■9.03 Telephone lines*.........................................................100 ...■9.04 Broadband Internet subscribers* .................................97 ...■9.05 Mobile telephone subscribers*....................................70 ...■
10th pillar: Price competitiveness in the T&T industry10.01 Ticket taxes and airport charges*.................................15 ...■10.02 Purchasing power parity*.............................................37 ...■10.03 Extent and effect of taxation........................................19 ...■10.04 Fuel price levels* .........................................................49 ...■10.05 Hotel price index* .......................................................n/a ......
11th pillar: Human resources11.01 Primary education enrollment* ..................................107 ...■11.02 Secondary education enrollment*................................89 ...■11.03 Quality of the educational system................................50 ...■11.04 Local availability of research and training services.....104 ...■11.05 Extent of staff training..................................................69 ...■11.06 Hiring and firing practices.............................................85 ...■11.07 Ease of hiring foreign labor ..........................................92 ...■11.08 HIV prevalence* .........................................................133 ...■11.09 Business impact of HIV/AIDS.....................................127 ...■11.10 Life expectancy* ........................................................119 ...■
12th pillar: Affinity for Travel & Tourism12.01 Tourism openness* ......................................................42 ...■12.02 Attitude of population toward foreign visitors..............94 ...■12.03 Extension of business trips recommended .................45 ...■
13th pillar: Natural resources13.01 Number of World Heritage natural sites* ....................74 ...■13.02 Protected areas* ..........................................................13 ...■13.03 Quality of the natural environment...............................24 ...■13.04 Total known species*...................................................47 ...■
14th pillar: Cultural resources14.01 Number of World Heritage cultural sites* ...................97 ...■14.02 Sports stadiums* .........................................................98 ...■14.03 Number of international fairs and exhibitions* ..........122 ...■14.04 Creative industries exports*.........................................98 ...■
Botswana
* Hard data
Note: For further details and explanation, please refer to the section “How toRead the Country/Economy Profiles” at the beginning of this chapter.
part2A_profiles.r2 2/26/09 4:01 AM Page 145
The Travel & Tourism Competitiveness Report 2009 © 2009 World Economic Forum

146
2.1:
Cou
ntry
/Eco
nom
y Pr
ofile
s
BrazilKey indicatorsPopulation (millions), 2007..........................................................................191.3Surface area (1,000 square kilometers) ...................................................8,514.9
Gross domestic product (US$ billions), 2007 ..........................................1,313.6Gross domestic product (PPP, US$) per capita, 2007 .............................9,703.2Real GDP growth (percent), 2007...................................................................5.4
Environmental Performance Index, 2008 (out of 149 countries).....................35
Travel & Tourism indicators
T&T industry, 2008 estimatesGDP (US$ millions) ...........................................................36,077...................2.5 ....................4.2Employment (1,000 jobs)....................................................2,279...................2.5 ....................3.0
T&T economy, 2008 estimatesGDP (US$ millions) ...........................................................88,261...................6.2 ....................4.7Employment (1,000 jobs)....................................................5,500...................5.9 ....................3.3
Source: World Travel & Tourism Council, TSA Research 2008
International tourist arrivals (thousands), 2007...................5,026International tourism receipts (US$ millions), 2007 ...........4,953
Source: United Nations World Tourism Organization
Travel & Tourism Competitiveness Index
2009 Index......................................................................................................45 4.32008 Index............................................................................................................49 4.3T&T regulatory framework ..............................................................................95 4.1
Policy rules and regulations..........................................................................94 4.0Environmental sustainability..........................................................................33 5.0Safety and security .......................................................................................130 3.4Health and hygiene .........................................................................................80 4.2Prioritization of Travel & Tourism..................................................................84 4.1
T&T business environment and infrastructure ............................................69 3.5Air transport infrastructure ..........................................................................46 3.8Ground transport infrastructure..................................................................110 2.6Tourism infrastructure ....................................................................................45 4.0ICT infrastructure ............................................................................................60 3.1Price competitiveness in the T&T industry.................................................91 4.2
T&T human, cultural, and natural resources .................................................4 5.4Human resources ............................................................................................55 5.2
Education and training .............................................................................40 5.0Availability of qualified labor...................................................................87 5.3
Affinity for Travel & Tourism ........................................................................108 4.4Natural resources .............................................................................................2 6.4Cultural resources...........................................................................................14 5.6
Note: For descriptions of variables and detailed sources, please refer to “How to the Read Country/Economy Profiles.”
Rank Score(out of 133) (1–7 scale)
International tourist arrivals (thousands)
International tourism receipts (US$ millions)
1995 1996 1997 1998 1999 2000 2001 2002 2003 2004 2005 2006 20070
1,000
2,000
3,000
4,000
5,000
6,000
1 2 3 4 5 6 7
2009–2018Percent annual growth of total (%, forecast)
part2A_profiles.r2 2/26/09 4:01 AM Page 146
The Travel & Tourism Competitiveness Report 2009 © 2009 World Economic Forum

147
2.1:
Cou
ntry
/Eco
nom
y Pr
ofile
s
The Travel & Tourism Competitiveness Index in detail ■ Competitive Advantage ■ Competitive Disadvantage
INDICATOR RANK/133
1st pillar: Policy rules and regulations1.01 Prevalence of foreign ownership .................................80 ...■1.02 Property rights..............................................................70 ...■1.03 Business impact of rules on FDI ..................................82 ...■1.04 Visa requirements* ......................................................67 ...■1.05 Openness of bilateral Air Service Agreements* ..........37 ...■1.06 Transparency of government policymaking................101 ...■1.07 Time required to start a business*.............................128 ...■1.08 Cost to start a business* .............................................56 ...■
2nd pillar: Environmental sustainability2.01 Stringency of environmental regulation .......................40 ...■2.02 Enforcement of environmental regulation....................51 ...■2.03 Sustainability of T&T industry development...............104 ...■2.04 Carbon dioxide emissions* ..........................................50 ...■2.05 Particulate matter concentration* ................................41 ...■2.06 Threatened species* ..................................................100 ...■2.07 Environmental treaty ratification*.................................21 ...■
3rd pillar: Safety and security3.01 Business costs of terrorism .........................................12 ...■3.02 Reliability of police services .......................................116 ...■3.03 Business costs of crime and violence........................122 ...■3.04 Road traffic accidents*...............................................123 ...■
4th pillar: Health and hygiene4.01 Physician density*........................................................81 ...■4.02 Access to improved sanitation* ...................................83 ...■4.03 Access to improved drinking water*............................78 ...■4.04 Hospital beds*..............................................................70 ...■
5th pillar: Prioritization of Travel & Tourism5.01 Government prioritization of the T&T industry...........113 ...■5.02 T&T government expenditure* ....................................77 ...■5.03 Effectiveness of marketing and branding.....................95 ...■5.04 T&T fair attendance*....................................................25 ...■
6th pillar: Air transport infrastructure6.01 Quality of air transport infrastructure .........................101 ...■6.02 Available seat kilometers, domestic*.............................6 ...■6.03 Available seat kilometers, international* ......................18 ...■6.04 Departures per 1,000 population*................................62 ...■6.05 Airport density* ............................................................78 ...■6.06 Number of operating airlines*......................................32 ...■6.07 International air transport network ...............................68 ...■
7th pillar: Ground transport infrastructure7.01 Quality of roads ..........................................................110 ...■7.02 Quality of railroad infrastructure...................................86 ...■7.03 Quality of port infrastructure ......................................123 ...■7.04 Quality of ground transport network ............................69 ...■7.05 Road density*...............................................................77 ...■
INDICATOR RANK/133
8th pillar: Tourism infrastructure8.01 Hotel rooms*...............................................................n/a ......8.02 Presence of major car rental companies*....................23 ...■8.03 ATMs accepting Visa cards* ........................................68 ...■
9th pillar: ICT infrastructure9.01 Extent of business Internet use...................................28 ...■9.02 Internet users* .............................................................57 ...■9.03 Telephone lines*...........................................................63 ...■9.04 Broadband Internet subscribers* .................................55 ...■9.05 Mobile telephone subscribers*....................................82 ...■
10th pillar: Price competitiveness in the T&T industry10.01 Ticket taxes and airport charges*.................................88 ...■10.02 Purchasing power parity*.............................................97 ...■10.03 Extent and effect of taxation......................................133 ...■10.04 Fuel price levels* .........................................................62 ...■10.05 Hotel price index* ........................................................49 ...■
11th pillar: Human resources11.01 Primary education enrollment* ....................................58 ...■11.02 Secondary education enrollment*................................14 ...■11.03 Quality of the educational system..............................117 ...■11.04 Local availability of research and training services.......26 ...■11.05 Extent of staff training..................................................46 ...■11.06 Hiring and firing practices...........................................111 ...■11.07 Ease of hiring foreign labor ..........................................61 ...■11.08 HIV prevalence* ...........................................................85 ...■11.09 Business impact of HIV/AIDS.......................................71 ...■11.10 Life expectancy* ..........................................................66 ...■
12th pillar: Affinity for Travel & Tourism12.01 Tourism openness* ....................................................128 ...■12.02 Attitude of population toward foreign visitors..............75 ...■12.03 Extension of business trips recommended .................56 ...■
13th pillar: Natural resources13.01 Number of World Heritage natural sites* ......................6 ...■13.02 Protected areas* ..........................................................15 ...■13.03 Quality of the natural environment...............................58 ...■13.04 Total known species*.....................................................1 ...■
14th pillar: Cultural resources14.01 Number of World Heritage cultural sites* ...................14 ...■14.02 Sports stadiums* .........................................................54 ...■14.03 Number of international fairs and exhibitions* ............11 ...■14.04 Creative industries exports*.........................................23 ...■
Brazil
* Hard data
Note: For further details and explanation, please refer to the section “How toRead the Country/Economy Profiles” at the beginning of this chapter.
part2A_profiles.r2 2/26/09 4:01 AM Page 147
The Travel & Tourism Competitiveness Report 2009 © 2009 World Economic Forum

148
2.1:
Cou
ntry
/Eco
nom
y Pr
ofile
s
Brunei DarussalamKey indicatorsPopulation (millions), 2007..............................................................................0.4Surface area (1,000 square kilometers) ..........................................................5.8
Gross domestic product (US$ billions), 2007 ...............................................12.3Gross domestic product (PPP, US$) per capita, 2007 ...........................50,790.4Real GDP growth (percent), 2007...................................................................0.6
Environmental Performance Index, 2008 (out of 149 countries) ....................n/a
Travel & Tourism indicators
T&T industry, 2008 estimatesGDP (US$ millions) ................................................................261...................1.9 ....................6.3Employment (1,000 jobs)...........................................................5...................3.1 ....................5.0
T&T economy, 2008 estimatesGDP (US$ millions) .............................................................1,615.................11.6 ....................4.5Employment (1,000 jobs).........................................................24.................13.8 ....................4.2
Source: World Travel & Tourism Council, TSA Research 2008
International tourist arrivals (thousands), 2007......................179International tourism receipts (US$ millions), 2006 ..............224
Source: United Nations World Tourism Organization
Travel & Tourism Competitiveness Index
2009 Index......................................................................................................69 4.02008 Index..........................................................................................................n/a n/aT&T regulatory framework ..............................................................................99 4.0
Policy rules and regulations..........................................................................88 4.0Environmental sustainability........................................................................131 3.3Safety and security .........................................................................................19 6.1Health and hygiene .......................................................................................105 3.0Prioritization of Travel & Tourism..................................................................99 3.8
T&T business environment and infrastructure ............................................47 4.0Air transport infrastructure ..........................................................................32 4.2Ground transport infrastructure....................................................................35 4.3Tourism infrastructure ....................................................................................86 2.2ICT infrastructure ............................................................................................55 3.2Price competitiveness in the T&T industry...................................................2 5.9
T&T human, cultural, and natural resources ...............................................60 3.9Human resources ............................................................................................52 5.2
Education and training .............................................................................56 4.9Availability of qualified labor...................................................................65 5.5
Affinity for Travel & Tourism ........................................................................100 4.5Natural resources ...........................................................................................31 4.3Cultural resources...........................................................................................86 1.9
Note: For descriptions of variables and detailed sources, please refer to “How to the Read Country/Economy Profiles.”
Rank Score(out of 133) (1–7 scale)
International tourist arrivals (thousands)
International tourism receipts (US$ millions)
1995 1996 1997 1998 1999 2000 2001 2002 2003 2004 2005 2006 2007100
150
200
250
1 2 3 4 5 6 7
2009–2018Percent annual growth of total (%, forecast)
part2A_profiles.r2 2/26/09 4:01 AM Page 148
The Travel & Tourism Competitiveness Report 2009 © 2009 World Economic Forum

149
2.1:
Cou
ntry
/Eco
nom
y Pr
ofile
s
The Travel & Tourism Competitiveness Index in detail ■ Competitive Advantage ■ Competitive Disadvantage
INDICATOR RANK/133
1st pillar: Policy rules and regulations1.01 Prevalence of foreign ownership ...............................120 ...■1.02 Property rights..............................................................62 ...■1.03 Business impact of rules on FDI ..................................81 ...■1.04 Visa requirements* ......................................................79 ...■1.05 Openness of bilateral Air Service Agreements* ..........14 ...■1.06 Transparency of government policymaking..................36 ...■1.07 Time required to start a business*.............................126 ...■1.08 Cost to start a business* .............................................62 ...■
2nd pillar: Environmental sustainability2.01 Stringency of environmental regulation .......................46 ...■2.02 Enforcement of environmental regulation....................45 ...■2.03 Sustainability of T&T industry development.................54 ...■2.04 Carbon dioxide emissions* ........................................124 ...■2.05 Particulate matter concentration* ................................81 ...■2.06 Threatened species* ..................................................114 ...■2.07 Environmental treaty ratification*...............................129 ...■
3rd pillar: Safety and security3.01 Business costs of terrorism .........................................22 ...■3.02 Reliability of police services .........................................42 ...■3.03 Business costs of crime and violence..........................15 ...■3.04 Road traffic accidents*...................................................5 ...■
4th pillar: Health and hygiene4.01 Physician density*........................................................84 ...■4.02 Access to improved sanitation* ..................................n/a ......4.03 Access to improved drinking water*...........................n/a ......4.04 Hospital beds*..............................................................57 ...■
5th pillar: Prioritization of Travel & Tourism5.01 Government prioritization of the T&T industry.............76 ...■5.02 T&T government expenditure* ..................................123 ...■5.03 Effectiveness of marketing and branding.....................82 ...■5.04 T&T fair attendance*....................................................62 ...■
6th pillar: Air transport infrastructure6.01 Quality of air transport infrastructure ...........................38 ...■6.02 Available seat kilometers, domestic*.........................100 ...■6.03 Available seat kilometers, international* ......................85 ...■6.04 Departures per 1,000 population*................................11 ...■6.05 Airport density* ............................................................17 ...■6.06 Number of operating airlines*....................................121 ...■6.07 International air transport network ...............................43 ...■
7th pillar: Ground transport infrastructure7.01 Quality of roads ............................................................28 ...■7.02 Quality of railroad infrastructure ..................................n/a ......7.03 Quality of port infrastructure ........................................35 ...■7.04 Quality of ground transport network..........................107 ...■7.05 Road density*...............................................................45 ...■
INDICATOR RANK/133
8th pillar: Tourism infrastructure8.01 Hotel rooms*................................................................42 ...■8.02 Presence of major car rental companies*..................122 ...■8.03 ATMs accepting Visa cards*........................................n/a ......
9th pillar: ICT infrastructure9.01 Extent of business Internet use...................................51 ...■9.02 Internet users* .............................................................41 ...■9.03 Telephone lines*...........................................................61 ...■9.04 Broadband Internet subscribers* .................................61 ...■9.05 Mobile telephone subscribers*....................................67 ...■
10th pillar: Price competitiveness in the T&T industry10.01 Ticket taxes and airport charges*...................................3 ...■10.02 Purchasing power parity*.............................................76 ...■10.03 Extent and effect of taxation........................................10 ...■10.04 Fuel price levels*.........................................................n/a ......10.05 Hotel price index* .......................................................n/a ......
11th pillar: Human resources11.01 Primary education enrollment* ....................................64 ...■11.02 Secondary education enrollment*................................33 ...■11.03 Quality of the educational system................................48 ...■11.04 Local availability of research and training services.....105 ...■11.05 Extent of staff training..................................................61 ...■11.06 Hiring and firing practices.............................................79 ...■11.07 Ease of hiring foreign labor ..........................................99 ...■11.08 HIV prevalence* .............................................................1 ...■11.09 Business impact of HIV/AIDS.......................................69 ...■11.10 Life expectancy* ..........................................................37 ...■
12th pillar: Affinity for Travel & Tourism12.01 Tourism openness* ......................................................59 ...■12.02 Attitude of population toward foreign visitors..............93 ...■12.03 Extension of business trips recommended ...............115 ...■
13th pillar: Natural resources13.01 Number of World Heritage natural sites* ....................74 ...■13.02 Protected areas* ............................................................8 ...■13.03 Quality of the natural environment...............................10 ...■13.04 Total known species*...................................................57 ...■
14th pillar: Cultural resources14.01 Number of World Heritage cultural sites* .................116 ...■14.02 Sports stadiums* .........................................................27 ...■14.03 Number of international fairs and exhibitions* ............83 ...■14.04 Creative industries exports*.......................................118 ...■
Brunei Darussalam
* Hard data
Note: For further details and explanation, please refer to the section “How toRead the Country/Economy Profiles” at the beginning of this chapter.
part2A_profiles.r2 2/26/09 4:01 AM Page 149
The Travel & Tourism Competitiveness Report 2009 © 2009 World Economic Forum

150
2.1:
Cou
ntry
/Eco
nom
y Pr
ofile
s
BulgariaKey indicatorsPopulation (millions), 2007..............................................................................7.6Surface area (1,000 square kilometers) ......................................................111.0
Gross domestic product (US$ billions), 2007 ...............................................39.6Gross domestic product (PPP, US$) per capita, 2007 ...........................11,310.9Real GDP growth (percent), 2007...................................................................6.2
Environmental Performance Index, 2008 (out of 149 countries).....................56
Travel & Tourism indicators
T&T industry, 2008 estimatesGDP (US$ millions) ........................................................1,483.22...................3.1 ....................3.3Employment (1,000 jobs).........................................................84...................2.7 ..................–2.7
T&T economy, 2008 estimatesGDP (US$ millions) .............................................................5,757.................12.0 ....................4.4Employment (1,000 jobs).......................................................324.................10.2 ..................–1.7
Source: World Travel & Tourism Council, TSA Research 2008
International tourist arrivals (thousands), 2007...................5,151International tourism receipts (US$ millions), 2007 ...........3,130
Source: United Nations World Tourism Organization
Travel & Tourism Competitiveness Index
2009 Index......................................................................................................50 4.32008 Index............................................................................................................43 4.4T&T regulatory framework ..............................................................................56 4.7
Policy rules and regulations..........................................................................95 3.9Environmental sustainability..........................................................................76 4.4Safety and security .........................................................................................87 4.7Health and hygiene .........................................................................................15 6.6Prioritization of Travel & Tourism..................................................................78 4.1
T&T business environment and infrastructure ............................................48 4.0Air transport infrastructure ..........................................................................90 2.6Ground transport infrastructure....................................................................75 3.2Tourism infrastructure ....................................................................................18 5.8ICT infrastructure ............................................................................................47 3.6Price competitiveness in the T&T industry.................................................73 4.6
T&T human, cultural, and natural resources ...............................................46 4.2Human resources ............................................................................................65 5.1
Education and training .............................................................................69 4.7Availability of qualified labor...................................................................57 5.5
Affinity for Travel & Tourism ..........................................................................18 5.4Natural resources ...........................................................................................68 3.1Cultural resources...........................................................................................36 3.1
Note: For descriptions of variables and detailed sources, please refer to “How to the Read Country/Economy Profiles.”
Rank Score(out of 133) (1–7 scale)
International tourist arrivals (thousands)
International tourism receipts (US$ millions)
1995 1996 1997 1998 1999 2000 2001 2002 2003 2004 2005 2006 20070
1,000
2,000
3,000
4,000
5,000
6,000
1 2 3 4 5 6 7
2009–2018Percent annual growth of total (%, forecast)
part2A_profiles.r2 2/26/09 4:01 AM Page 150
The Travel & Tourism Competitiveness Report 2009 © 2009 World Economic Forum

151
2.1:
Cou
ntry
/Eco
nom
y Pr
ofile
s
The Travel & Tourism Competitiveness Index in detail ■ Competitive Advantage ■ Competitive Disadvantage
INDICATOR RANK/133
1st pillar: Policy rules and regulations1.01 Prevalence of foreign ownership ...............................102 ...■1.02 Property rights..............................................................97 ...■1.03 Business impact of rules on FDI ................................118 ...■1.04 Visa requirements* ......................................................40 ...■1.05 Openness of bilateral Air Service Agreements* ........100 ...■1.06 Transparency of government policymaking................113 ...■1.07 Time required to start a business*.............................110 ...■1.08 Cost to start a business* .............................................18 ...■
2nd pillar: Environmental sustainability2.01 Stringency of environmental regulation .....................107 ...■2.02 Enforcement of environmental regulation....................92 ...■2.03 Sustainability of T&T industry development...............103 ...■2.04 Carbon dioxide emissions* ..........................................78 ...■2.05 Particulate matter concentration* ................................91 ...■2.06 Threatened species* ....................................................59 ...■2.07 Environmental treaty ratification*.................................21 ...■
3rd pillar: Safety and security3.01 Business costs of terrorism .......................................104 ...■3.02 Reliability of police services .......................................111 ...■3.03 Business costs of crime and violence..........................99 ...■3.04 Road traffic accidents*.................................................52 ...■
4th pillar: Health and hygiene4.01 Physician density*........................................................15 ...■4.02 Access to improved sanitation* ...................................34 ...■4.03 Access to improved drinking water*............................38 ...■4.04 Hospital beds*..............................................................23 ...■
5th pillar: Prioritization of Travel & Tourism5.01 Government prioritization of the T&T industry...........101 ...■5.02 T&T government expenditure* ....................................66 ...■5.03 Effectiveness of marketing and branding.....................88 ...■5.04 T&T fair attendance*....................................................41 ...■
6th pillar: Air transport infrastructure6.01 Quality of air transport infrastructure .........................104 ...■6.02 Available seat kilometers, domestic*...........................74 ...■6.03 Available seat kilometers, international* ......................77 ...■6.04 Departures per 1,000 population*................................81 ...■6.05 Airport density* ............................................................93 ...■6.06 Number of operating airlines*......................................44 ...■6.07 International air transport network ...............................88 ...■
7th pillar: Ground transport infrastructure7.01 Quality of roads ..........................................................117 ...■7.02 Quality of railroad infrastructure...................................55 ...■7.03 Quality of port infrastructure ........................................79 ...■7.04 Quality of ground transport network ............................50 ...■7.05 Road density*...............................................................56 ...■
INDICATOR RANK/133
8th pillar: Tourism infrastructure8.01 Hotel rooms*..................................................................9 ...■8.02 Presence of major car rental companies*....................23 ...■8.03 ATMs accepting Visa cards* ........................................28 ...■
9th pillar: ICT infrastructure9.01 Extent of business Internet use...................................81 ...■9.02 Internet users* .............................................................61 ...■9.03 Telephone lines*...........................................................42 ...■9.04 Broadband Internet subscribers* .................................42 ...■9.05 Mobile telephone subscribers*......................................8 ...■
10th pillar: Price competitiveness in the T&T industry10.01 Ticket taxes and airport charges*.................................49 ...■10.02 Purchasing power parity*.............................................33 ...■10.03 Extent and effect of taxation........................................78 ...■10.04 Fuel price levels* .........................................................87 ...■10.05 Hotel price index* ........................................................82 ...■
11th pillar: Human resources11.01 Primary education enrollment* ....................................70 ...■11.02 Secondary education enrollment*................................13 ...■11.03 Quality of the educational system................................81 ...■11.04 Local availability of research and training services.......70 ...■11.05 Extent of staff training................................................117 ...■11.06 Hiring and firing practices.............................................35 ...■11.07 Ease of hiring foreign labor ..........................................93 ...■11.08 HIV prevalence* .............................................................1 ...■11.09 Business impact of HIV/AIDS.......................................62 ...■11.10 Life expectancy* ..........................................................55 ...■
12th pillar: Affinity for Travel & Tourism12.01 Tourism openness* ......................................................17 ...■12.02 Attitude of population toward foreign visitors..............96 ...■12.03 Extension of business trips recommended .................47 ...■
13th pillar: Natural resources13.01 Number of World Heritage natural sites* ....................23 ...■13.02 Protected areas* ..........................................................64 ...■13.03 Quality of the natural environment.............................108 ...■13.04 Total known species*...................................................79 ...■
14th pillar: Cultural resources14.01 Number of World Heritage cultural sites* ...................22 ...■14.02 Sports stadiums* .........................................................24 ...■14.03 Number of international fairs and exhibitions* ............57 ...■14.04 Creative industries exports*.........................................62 ...■
Bulgaria
* Hard data
Note: For further details and explanation, please refer to the section “How toRead the Country/Economy Profiles” at the beginning of this chapter.
part2A_profiles.r2 2/26/09 4:01 AM Page 151
The Travel & Tourism Competitiveness Report 2009 © 2009 World Economic Forum

152
2.1:
Cou
ntry
/Eco
nom
y Pr
ofile
s
Burkina FasoKey indicatorsPopulation (millions), 2007............................................................................14.0Surface area (1,000 square kilometers) ......................................................274.0
Gross domestic product (US$ billions), 2007 .................................................6.8Gross domestic product (PPP, US$) per capita, 2007 .............................1,206.5Real GDP growth (percent), 2007...................................................................3.6
Environmental Performance Index, 2008 (out of 149 countries)...................144
Travel & Tourism indicators
T&T industry, 2008 estimatesGDP (US$ millions) ..................................................................25...................0.3 ....................0.5Employment (1,000 jobs).........................................................10...................0.2 ..................–2.2
T&T economy, 2008 estimatesGDP (US$ millions) ................................................................116...................1.5 ....................3.3Employment (1,000 jobs).........................................................48...................1.2 ....................0.6
Source: World Travel & Tourism Council, TSA Research 2008
International tourist arrivals (thousands), 2006......................264International tourism receipts (US$ millions), 2006 ................53
Source: United Nations World Tourism Organization
Travel & Tourism Competitiveness Index
2009 Index....................................................................................................126 3.12008 Index..........................................................................................................124 3.0T&T regulatory framework ............................................................................118 3.7
Policy rules and regulations........................................................................110 3.7Environmental sustainability..........................................................................71 4.4Safety and security .........................................................................................83 4.8Health and hygiene .......................................................................................122 1.8Prioritization of Travel & Tourism................................................................110 3.5
T&T business environment and infrastructure ..........................................122 2.5Air transport infrastructure ........................................................................124 2.0Ground transport infrastructure....................................................................82 3.1Tourism infrastructure ..................................................................................110 1.6ICT infrastructure ..........................................................................................128 1.5Price competitiveness in the T&T industry.................................................87 4.3
T&T human, cultural, and natural resources .............................................131 3.1Human resources ..........................................................................................129 3.6
Education and training ...........................................................................132 2.4Availability of qualified labor.................................................................117 4.8
Affinity for Travel & Tourism ........................................................................101 4.5Natural resources ...........................................................................................71 3.1Cultural resources.........................................................................................131 1.1
Note: For descriptions of variables and detailed sources, please refer to “How to the Read Country/Economy Profiles.”
Rank Score(out of 133) (1–7 scale)
International tourist arrivals (thousands)
International tourism receipts (US$ millions)
1995 1996 1997 1998 1999 2000 2001 2002 2003 2004 2005 2006 20070
50
100
150
200
250
300
1 2 3 4 5 6 7
2009–2018Percent annual growth of total (%, forecast)
part2A_profiles.r2 2/26/09 4:01 AM Page 152
The Travel & Tourism Competitiveness Report 2009 © 2009 World Economic Forum

153
2.1:
Cou
ntry
/Eco
nom
y Pr
ofile
s
The Travel & Tourism Competitiveness Index in detail ■ Competitive Advantage ■ Competitive Disadvantage
INDICATOR RANK/133
1st pillar: Policy rules and regulations1.01 Prevalence of foreign ownership .................................94 ...■1.02 Property rights..............................................................72 ...■1.03 Business impact of rules on FDI ..................................93 ...■1.04 Visa requirements* ....................................................114 ...■1.05 Openness of bilateral Air Service Agreements* ........127 ...■1.06 Transparency of government policymaking..................34 ...■1.07 Time required to start a business*...............................45 ...■1.08 Cost to start a business* ...........................................109 ...■
2nd pillar: Environmental sustainability2.01 Stringency of environmental regulation .......................81 ...■2.02 Enforcement of environmental regulation....................71 ...■2.03 Sustainability of T&T industry development.................42 ...■2.04 Carbon dioxide emissions* ............................................7 ...■2.05 Particulate matter concentration* ..............................113 ...■2.06 Threatened species* ....................................................19 ...■2.07 Environmental treaty ratification*.................................81 ...■
3rd pillar: Safety and security3.01 Business costs of terrorism .........................................86 ...■3.02 Reliability of police services .........................................51 ...■3.03 Business costs of crime and violence........................107 ...■3.04 Road traffic accidents*.................................................91 ...■
4th pillar: Health and hygiene4.01 Physician density*......................................................124 ...■4.02 Access to improved sanitation* .................................122 ...■4.03 Access to improved drinking water*..........................109 ...■4.04 Hospital beds*............................................................107 ...■
5th pillar: Prioritization of Travel & Tourism5.01 Government prioritization of the T&T industry.............66 ...■5.02 T&T government expenditure* ..................................102 ...■5.03 Effectiveness of marketing and branding.....................38 ...■5.04 T&T fair attendance*..................................................126 ...■
6th pillar: Air transport infrastructure6.01 Quality of air transport infrastructure .........................107 ...■6.02 Available seat kilometers, domestic*...........................94 ...■6.03 Available seat kilometers, international* ....................122 ...■6.04 Departures per 1,000 population*..............................117 ...■6.05 Airport density* ..........................................................122 ...■6.06 Number of operating airlines*....................................118 ...■6.07 International air transport network .............................106 ...■
7th pillar: Ground transport infrastructure7.01 Quality of roads ............................................................98 ...■7.02 Quality of railroad infrastructure...................................75 ...■7.03 Quality of port infrastructure ........................................66 ...■7.04 Quality of ground transport network ............................48 ...■7.05 Road density*...............................................................59 ...■
INDICATOR RANK/133
8th pillar: Tourism infrastructure8.01 Hotel rooms*...............................................................n/a ......8.02 Presence of major car rental companies*....................95 ...■8.03 ATMs accepting Visa cards* ......................................114 ...■
9th pillar: ICT infrastructure9.01 Extent of business Internet use.................................120 ...■9.02 Internet users* ...........................................................128 ...■9.03 Telephone lines*.........................................................125 ...■9.04 Broadband Internet subscribers* ...............................116 ...■9.05 Mobile telephone subscribers*..................................125 ...■
10th pillar: Price competitiveness in the T&T industry10.01 Ticket taxes and airport charges*...............................125 ...■10.02 Purchasing power parity*.............................................20 ...■10.03 Extent and effect of taxation........................................81 ...■10.04 Fuel price levels* .........................................................93 ...■10.05 Hotel price index* .......................................................n/a ......
11th pillar: Human resources11.01 Primary education enrollment* ..................................129 ...■11.02 Secondary education enrollment*..............................131 ...■11.03 Quality of the educational system..............................113 ...■11.04 Local availability of research and training services.......80 ...■11.05 Extent of staff training................................................124 ...■11.06 Hiring and firing practices.............................................55 ...■11.07 Ease of hiring foreign labor ..........................................36 ...■11.08 HIV prevalence* .........................................................110 ...■11.09 Business impact of HIV/AIDS.....................................103 ...■11.10 Life expectancy* ........................................................128 ...■
12th pillar: Affinity for Travel & Tourism12.01 Tourism openness* ....................................................119 ...■12.02 Attitude of population toward foreign visitors..............65 ...■12.03 Extension of business trips recommended .................72 ...■
13th pillar: Natural resources13.01 Number of World Heritage natural sites* ....................74 ...■13.02 Protected areas* ..........................................................46 ...■13.03 Quality of the natural environment...............................80 ...■13.04 Total known species*...................................................59 ...■
14th pillar: Cultural resources14.01 Number of World Heritage cultural sites* .................116 ...■14.02 Sports stadiums* .......................................................108 ...■14.03 Number of international fairs and exhibitions* ..........101 ...■14.04 Creative industries exports*.......................................111 ...■
Burkina Faso
* Hard data
Note: For further details and explanation, please refer to the section “How toRead the Country/Economy Profiles” at the beginning of this chapter.
part2A_profiles.r2 2/26/09 4:01 AM Page 153
The Travel & Tourism Competitiveness Report 2009 © 2009 World Economic Forum

154
2.1:
Cou
ntry
/Eco
nom
y Pr
ofile
s
BurundiKey indicatorsPopulation (millions), 2007..............................................................................8.1Surface area (1,000 square kilometers) ........................................................27.8
Gross domestic product (US$ billions), 2007 .................................................1.0Gross domestic product (PPP, US$) per capita, 2007 ................................371.7Real GDP growth (percent), 2007...................................................................3.6
Environmental Performance Index, 2008 (out of 149 countries)...................132
Travel & Tourism indicators
T&T industry, 2008 estimatesGDP (US$ millions) ..................................................................13...................1.3 ....................4.3Employment (1,000 jobs).........................................................16...................1.0 ..................–0.1
T&T economy, 2008 estimatesGDP (US$ millions) ..................................................................31...................3.0 ....................4.9Employment (1,000 jobs).........................................................41...................2.4 ....................0.5
Source: World Travel & Tourism Council, TSA Research 2008
International tourist arrivals (thousands), 2006......................201International tourism receipts (US$ millions), 2006 ..................1
Source: United Nations World Tourism Organization
Travel & Tourism Competitiveness Index
2009 Index....................................................................................................131 3.02008 Index..........................................................................................................128 2.9T&T regulatory framework ............................................................................129 3.2
Policy rules and regulations........................................................................128 2.8Environmental sustainability..........................................................................75 4.4Safety and security .......................................................................................106 4.4Health and hygiene .......................................................................................118 2.1Prioritization of Travel & Tourism................................................................133 2.2
T&T business environment and infrastructure ..........................................119 2.5Air transport infrastructure ........................................................................120 2.1Ground transport infrastructure....................................................................86 3.0Tourism infrastructure ..................................................................................123 1.4ICT infrastructure ..........................................................................................131 1.5Price competitiveness in the T&T industry.................................................71 4.6
T&T human, cultural, and natural resources .............................................126 3.2Human resources ..........................................................................................127 3.7
Education and training ...........................................................................131 2.8Availability of qualified labor.................................................................120 4.7
Affinity for Travel & Tourism ..........................................................................16 5.5Natural resources ...........................................................................................97 2.7Cultural resources.........................................................................................133 1.0
Note: For descriptions of variables and detailed sources, please refer to “How to the Read Country/Economy Profiles.”
Rank Score(out of 133) (1–7 scale)
International tourist arrivals (thousands)
International tourism receipts (US$ millions)
1995 1996 1997 1998 1999 2000 2001 2002 2003 2004 2005 2006 20070
50
100
150
200
250
1 2 3 4 5 6 7
2009–2018Percent annual growth of total (%, forecast)
part2A_profiles.r2 2/26/09 4:01 AM Page 154
The Travel & Tourism Competitiveness Report 2009 © 2009 World Economic Forum
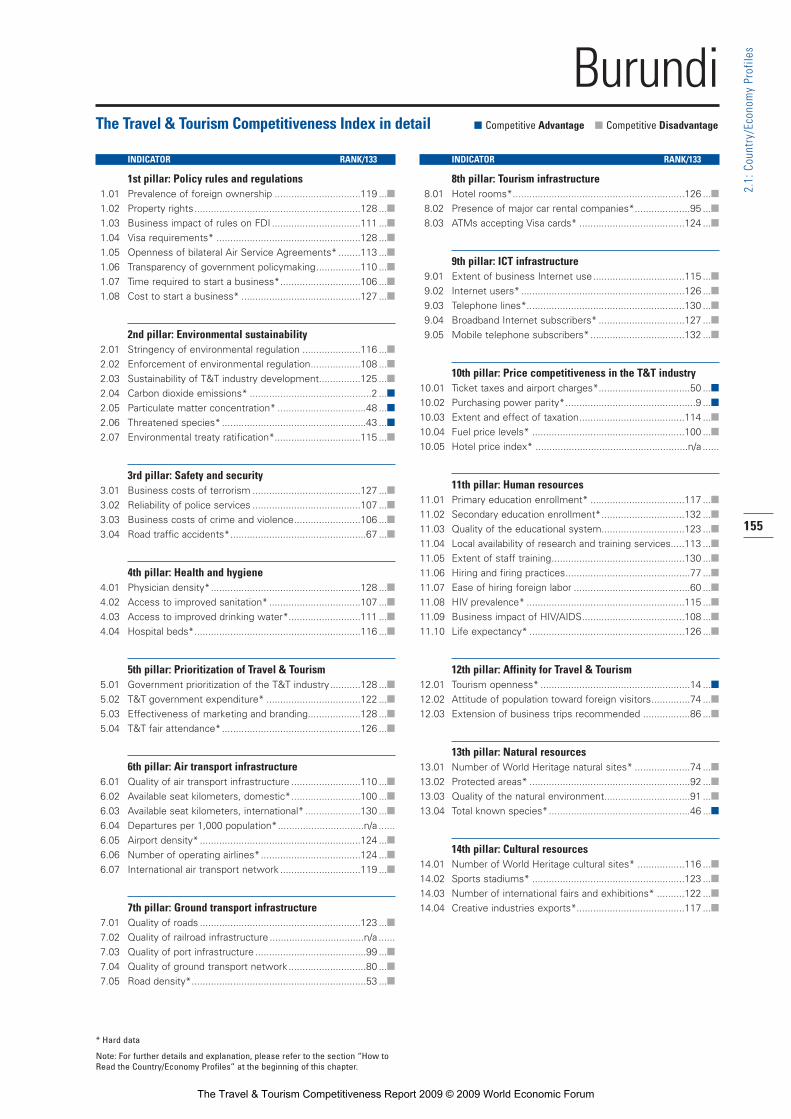
155
2.1:
Cou
ntry
/Eco
nom
y Pr
ofile
s
The Travel & Tourism Competitiveness Index in detail ■ Competitive Advantage ■ Competitive Disadvantage
INDICATOR RANK/133
1st pillar: Policy rules and regulations1.01 Prevalence of foreign ownership ...............................119 ...■1.02 Property rights............................................................128 ...■1.03 Business impact of rules on FDI ................................111 ...■1.04 Visa requirements* ....................................................128 ...■1.05 Openness of bilateral Air Service Agreements* ........113 ...■1.06 Transparency of government policymaking................110 ...■1.07 Time required to start a business*.............................106 ...■1.08 Cost to start a business* ...........................................127 ...■
2nd pillar: Environmental sustainability2.01 Stringency of environmental regulation .....................116 ...■2.02 Enforcement of environmental regulation..................108 ...■2.03 Sustainability of T&T industry development...............125 ...■2.04 Carbon dioxide emissions* ............................................2 ...■2.05 Particulate matter concentration* ................................48 ...■2.06 Threatened species* ....................................................43 ...■2.07 Environmental treaty ratification*...............................115 ...■
3rd pillar: Safety and security3.01 Business costs of terrorism .......................................127 ...■3.02 Reliability of police services .......................................107 ...■3.03 Business costs of crime and violence........................106 ...■3.04 Road traffic accidents*.................................................67 ...■
4th pillar: Health and hygiene4.01 Physician density*......................................................128 ...■4.02 Access to improved sanitation* .................................107 ...■4.03 Access to improved drinking water*..........................111 ...■4.04 Hospital beds*............................................................116 ...■
5th pillar: Prioritization of Travel & Tourism5.01 Government prioritization of the T&T industry...........128 ...■5.02 T&T government expenditure* ..................................122 ...■5.03 Effectiveness of marketing and branding...................128 ...■5.04 T&T fair attendance*..................................................126 ...■
6th pillar: Air transport infrastructure6.01 Quality of air transport infrastructure .........................110 ...■6.02 Available seat kilometers, domestic*.........................100 ...■6.03 Available seat kilometers, international* ....................130 ...■6.04 Departures per 1,000 population*...............................n/a ......6.05 Airport density* ..........................................................124 ...■6.06 Number of operating airlines*....................................124 ...■6.07 International air transport network .............................119 ...■
7th pillar: Ground transport infrastructure7.01 Quality of roads ..........................................................123 ...■7.02 Quality of railroad infrastructure ..................................n/a ......7.03 Quality of port infrastructure ........................................99 ...■7.04 Quality of ground transport network ............................80 ...■7.05 Road density*...............................................................53 ...■
INDICATOR RANK/133
8th pillar: Tourism infrastructure8.01 Hotel rooms*..............................................................126 ...■8.02 Presence of major car rental companies*....................95 ...■8.03 ATMs accepting Visa cards* ......................................124 ...■
9th pillar: ICT infrastructure9.01 Extent of business Internet use.................................115 ...■9.02 Internet users* ...........................................................126 ...■9.03 Telephone lines*.........................................................130 ...■9.04 Broadband Internet subscribers* ...............................127 ...■9.05 Mobile telephone subscribers*..................................132 ...■
10th pillar: Price competitiveness in the T&T industry10.01 Ticket taxes and airport charges*.................................50 ...■10.02 Purchasing power parity*...............................................9 ...■10.03 Extent and effect of taxation......................................114 ...■10.04 Fuel price levels* .......................................................100 ...■10.05 Hotel price index* .......................................................n/a ......
11th pillar: Human resources11.01 Primary education enrollment* ..................................117 ...■11.02 Secondary education enrollment*..............................132 ...■11.03 Quality of the educational system..............................123 ...■11.04 Local availability of research and training services.....113 ...■11.05 Extent of staff training................................................130 ...■11.06 Hiring and firing practices.............................................77 ...■11.07 Ease of hiring foreign labor ..........................................60 ...■11.08 HIV prevalence* .........................................................115 ...■11.09 Business impact of HIV/AIDS.....................................108 ...■11.10 Life expectancy* ........................................................126 ...■
12th pillar: Affinity for Travel & Tourism12.01 Tourism openness* ......................................................14 ...■12.02 Attitude of population toward foreign visitors..............74 ...■12.03 Extension of business trips recommended .................86 ...■
13th pillar: Natural resources13.01 Number of World Heritage natural sites* ....................74 ...■13.02 Protected areas* ..........................................................92 ...■13.03 Quality of the natural environment...............................91 ...■13.04 Total known species*...................................................46 ...■
14th pillar: Cultural resources14.01 Number of World Heritage cultural sites* .................116 ...■14.02 Sports stadiums* .......................................................123 ...■14.03 Number of international fairs and exhibitions* ..........122 ...■14.04 Creative industries exports*.......................................117 ...■
Burundi
* Hard data
Note: For further details and explanation, please refer to the section “How toRead the Country/Economy Profiles” at the beginning of this chapter.
part2A_profiles.r2 2/26/09 4:01 AM Page 155
The Travel & Tourism Competitiveness Report 2009 © 2009 World Economic Forum

156
2.1:
Cou
ntry
/Eco
nom
y Pr
ofile
s
CambodiaKey indicatorsPopulation (millions), 2007............................................................................14.6Surface area (1,000 square kilometers) ......................................................181.0
Gross domestic product (US$ billions), 2007 .................................................8.7Gross domestic product (PPP, US$) per capita, 2007 .............................1,817.7Real GDP growth (percent), 2007.................................................................10.2
Environmental Performance Index, 2008 (out of 149 countries)...................136
Travel & Tourism indicators
T&T industry, 2008 estimatesGDP (US$ millions) ................................................................821...................9.0 ....................5.2Employment (1,000 jobs).......................................................492...................6.9 ..................–0.1
T&T economy, 2008 estimatesGDP (US$ millions) .............................................................1,801.................19.7 ....................5.5Employment (1,000 jobs)....................................................1,102.................15.4 ....................0.2
Source: World Travel & Tourism Council, TSA Research 2008
International tourist arrivals (thousands), 2007...................1,873International tourism receipts (US$ millions), 2007 ...........1,135
Source: United Nations World Tourism Organization
Travel & Tourism Competitiveness Index
2009 Index....................................................................................................108 3.42008 Index..........................................................................................................112 3.3T&T regulatory framework ............................................................................111 3.8
Policy rules and regulations........................................................................122 3.3Environmental sustainability........................................................................107 4.0Safety and security .........................................................................................88 4.7Health and hygiene .......................................................................................126 1.6Prioritization of Travel & Tourism..................................................................18 5.4
T&T business environment and infrastructure ..........................................113 2.6Air transport infrastructure ........................................................................106 2.4Ground transport infrastructure..................................................................107 2.7Tourism infrastructure ..................................................................................125 1.3ICT infrastructure ..........................................................................................122 1.6Price competitiveness in the T&T industry.................................................21 5.3
T&T human, cultural, and natural resources ...............................................74 3.8Human resources ..........................................................................................108 4.4
Education and training ...........................................................................113 3.6Availability of qualified labor.................................................................100 5.1
Affinity for Travel & Tourism ..........................................................................15 5.5Natural resources ...........................................................................................58 3.5Cultural resources...........................................................................................77 2.0
Note: For descriptions of variables and detailed sources, please refer to “How to the Read Country/Economy Profiles.”
Rank Score(out of 133) (1–7 scale)
International tourist arrivals (thousands)
International tourism receipts (US$ millions)
1995 1996 1997 1998 1999 2000 2001 2002 2003 2004 2005 2006 20070
500
1,000
1,500
2,000
1 2 3 4 5 6 7
2009–2018Percent annual growth of total (%, forecast)
part2A_profiles.r2 2/26/09 4:01 AM Page 156
The Travel & Tourism Competitiveness Report 2009 © 2009 World Economic Forum

157
2.1:
Cou
ntry
/Eco
nom
y Pr
ofile
s
The Travel & Tourism Competitiveness Index in detail ■ Competitive Advantage ■ Competitive Disadvantage
INDICATOR RANK/133
1st pillar: Policy rules and regulations1.01 Prevalence of foreign ownership .................................75 ...■1.02 Property rights............................................................118 ...■1.03 Business impact of rules on FDI ..................................70 ...■1.04 Visa requirements* ......................................................10 ...■1.05 Openness of bilateral Air Service Agreements* ..........86 ...■1.06 Transparency of government policymaking..................76 ...■1.07 Time required to start a business*.............................124 ...■1.08 Cost to start a business* ...........................................124 ...■
2nd pillar: Environmental sustainability2.01 Stringency of environmental regulation .....................104 ...■2.02 Enforcement of environmental regulation..................115 ...■2.03 Sustainability of T&T industry development.................68 ...■2.04 Carbon dioxide emissions* ............................................3 ...■2.05 Particulate matter concentration* ................................94 ...■2.06 Threatened species* ..................................................113 ...■2.07 Environmental treaty ratification*...............................104 ...■
3rd pillar: Safety and security3.01 Business costs of terrorism .........................................98 ...■3.02 Reliability of police services .......................................114 ...■3.03 Business costs of crime and violence..........................79 ...■3.04 Road traffic accidents*.................................................79 ...■
4th pillar: Health and hygiene4.01 Physician density*......................................................112 ...■4.02 Access to improved sanitation* .................................116 ...■4.03 Access to improved drinking water*..........................115 ...■4.04 Hospital beds*............................................................130 ...■
5th pillar: Prioritization of Travel & Tourism5.01 Government prioritization of the T&T industry.............86 ...■5.02 T&T government expenditure* ....................................10 ...■5.03 Effectiveness of marketing and branding.....................69 ...■5.04 T&T fair attendance*....................................................25 ...■
6th pillar: Air transport infrastructure6.01 Quality of air transport infrastructure ...........................87 ...■6.02 Available seat kilometers, domestic*...........................73 ...■6.03 Available seat kilometers, international* ......................88 ...■6.04 Departures per 1,000 population*..............................113 ...■6.05 Airport density* ..........................................................111 ...■6.06 Number of operating airlines*......................................75 ...■6.07 International air transport network ...............................86 ...■
7th pillar: Ground transport infrastructure7.01 Quality of roads ............................................................80 ...■7.02 Quality of railroad infrastructure...................................96 ...■7.03 Quality of port infrastructure ........................................91 ...■7.04 Quality of ground transport network..........................116 ...■7.05 Road density*...............................................................75 ...■
INDICATOR RANK/133
8th pillar: Tourism infrastructure8.01 Hotel rooms*................................................................79 ...■8.02 Presence of major car rental companies*..................122 ...■8.03 ATMs accepting Visa cards* ......................................112 ...■
9th pillar: ICT infrastructure9.01 Extent of business Internet use.................................108 ...■9.02 Internet users* ...........................................................130 ...■9.03 Telephone lines*.........................................................132 ...■9.04 Broadband Internet subscribers* ...............................105 ...■9.05 Mobile telephone subscribers*..................................121 ...■
10th pillar: Price competitiveness in the T&T industry10.01 Ticket taxes and airport charges*.................................68 ...■10.02 Purchasing power parity*...............................................8 ...■10.03 Extent and effect of taxation........................................44 ...■10.04 Fuel price levels* .........................................................56 ...■10.05 Hotel price index* ........................................................19 ...■
11th pillar: Human resources11.01 Primary education enrollment* ....................................87 ...■11.02 Secondary education enrollment*..............................114 ...■11.03 Quality of the educational system..............................112 ...■11.04 Local availability of research and training services.....115 ...■11.05 Extent of staff training................................................107 ...■11.06 Hiring and firing practices.............................................47 ...■11.07 Ease of hiring foreign labor ..........................................77 ...■11.08 HIV prevalence* ...........................................................94 ...■11.09 Business impact of HIV/AIDS.....................................109 ...■11.10 Life expectancy* ........................................................107 ...■
12th pillar: Affinity for Travel & Tourism12.01 Tourism openness* ......................................................11 ...■12.02 Attitude of population toward foreign visitors............103 ...■12.03 Extension of business trips recommended .................78 ...■
13th pillar: Natural resources13.01 Number of World Heritage natural sites* ....................74 ...■13.02 Protected areas* ..........................................................23 ...■13.03 Quality of the natural environment.............................103 ...■13.04 Total known species*...................................................49 ...■
14th pillar: Cultural resources14.01 Number of World Heritage cultural sites* ...................54 ...■14.02 Sports stadiums* .......................................................122 ...■14.03 Number of international fairs and exhibitions* ..........107 ...■14.04 Creative industries exports*.........................................35 ...■
Cambodia
* Hard data
Note: For further details and explanation, please refer to the section “How toRead the Country/Economy Profiles” at the beginning of this chapter.
part2A_profiles.r2 2/26/09 4:01 AM Page 157
The Travel & Tourism Competitiveness Report 2009 © 2009 World Economic Forum

158
2.1:
Cou
ntry
/Eco
nom
y Pr
ofile
s
CameroonKey indicatorsPopulation (millions), 2007............................................................................16.9Surface area (1,000 square kilometers) ......................................................475.4
Gross domestic product (US$ billions), 2007 ...............................................20.7Gross domestic product (PPP, US$) per capita, 2007 .............................2,093.6Real GDP growth (percent), 2007...................................................................3.5
Environmental Performance Index, 2008 (out of 149 countries)...................114
Travel & Tourism indicators
T&T industry, 2008 estimatesGDP (US$ millions) ................................................................362...................1.5 ....................4.5Employment (1,000 jobs).........................................................48...................1.3 ....................2.1
T&T economy, 2008 estimatesGDP (US$ millions) .............................................................1,000...................4.2 ....................4.8Employment (1,000 jobs).......................................................132...................3.5 ....................2.4
Source: World Travel & Tourism Council, TSA Research 2008
International tourist arrivals (thousands), 2006......................185International tourism receipts (US$ millions), 2004 ..............158
Source: United Nations World Tourism Organization
Travel & Tourism Competitiveness Index
2009 Index....................................................................................................125 3.12008 Index..........................................................................................................126 3.0T&T regulatory framework ............................................................................126 3.5
Policy rules and regulations........................................................................120 3.4Environmental sustainability........................................................................110 4.0Safety and security .........................................................................................80 4.9Health and hygiene .......................................................................................112 2.5Prioritization of Travel & Tourism................................................................125 3.0
T&T business environment and infrastructure ..........................................132 2.4Air transport infrastructure ........................................................................126 2.0Ground transport infrastructure..................................................................114 2.5Tourism infrastructure ..................................................................................114 1.6ICT infrastructure ..........................................................................................124 1.6Price competitiveness in the T&T industry...............................................104 4.1
T&T human, cultural, and natural resources .............................................115 3.4Human resources ..........................................................................................123 3.9
Education and training ...........................................................................125 3.1Availability of qualified labor.................................................................121 4.7
Affinity for Travel & Tourism ..........................................................................97 4.5Natural resources ...........................................................................................42 3.9Cultural resources.........................................................................................129 1.2
Note: For descriptions of variables and detailed sources, please refer to “How to the Read Country/Economy Profiles.”
Rank Score(out of 133) (1–7 scale)
International tourist arrivals (thousands)
International tourism receipts (US$ millions)
1995 1996 1997 1998 1999 2000 2001 2002 2003 2004 2005 2006 20070
50
100
150
200
250
300
1 2 3 4 5 6 7
2009–2018Percent annual growth of total (%, forecast)
part2A_profiles.r2 2/26/09 4:01 AM Page 158
The Travel & Tourism Competitiveness Report 2009 © 2009 World Economic Forum

159
2.1:
Cou
ntry
/Eco
nom
y Pr
ofile
s
The Travel & Tourism Competitiveness Index in detail ■ Competitive Advantage ■ Competitive Disadvantage
INDICATOR RANK/133
1st pillar: Policy rules and regulations1.01 Prevalence of foreign ownership .................................59 ...■1.02 Property rights............................................................105 ...■1.03 Business impact of rules on FDI ................................104 ...■1.04 Visa requirements* ....................................................126 ...■1.05 Openness of bilateral Air Service Agreements* ..........62 ...■1.06 Transparency of government policymaking..................53 ...■1.07 Time required to start a business*...............................96 ...■1.08 Cost to start a business* ...........................................123 ...■
2nd pillar: Environmental sustainability2.01 Stringency of environmental regulation .....................115 ...■2.02 Enforcement of environmental regulation..................112 ...■2.03 Sustainability of T&T industry development...............108 ...■2.04 Carbon dioxide emissions* ..........................................15 ...■2.05 Particulate matter concentration* ................................98 ...■2.06 Threatened species* ..................................................105 ...■2.07 Environmental treaty ratification*.................................81 ...■
3rd pillar: Safety and security3.01 Business costs of terrorism .........................................63 ...■3.02 Reliability of police services .........................................68 ...■3.03 Business costs of crime and violence..........................98 ...■3.04 Road traffic accidents*.................................................93 ...■
4th pillar: Health and hygiene4.01 Physician density*......................................................111 ...■4.02 Access to improved sanitation* ...................................99 ...■4.03 Access to improved drinking water*..........................113 ...■4.04 Hospital beds*..............................................................92 ...■
5th pillar: Prioritization of Travel & Tourism5.01 Government prioritization of the T&T industry...........122 ...■5.02 T&T government expenditure* ..................................103 ...■5.03 Effectiveness of marketing and branding...................118 ...■5.04 T&T fair attendance*....................................................98 ...■
6th pillar: Air transport infrastructure6.01 Quality of air transport infrastructure .........................125 ...■6.02 Available seat kilometers, domestic*...........................89 ...■6.03 Available seat kilometers, international* ......................99 ...■6.04 Departures per 1,000 population*..............................101 ...■6.05 Airport density* ..........................................................115 ...■6.06 Number of operating airlines*......................................99 ...■6.07 International air transport network .............................114 ...■
7th pillar: Ground transport infrastructure7.01 Quality of roads ..........................................................113 ...■7.02 Quality of railroad infrastructure...................................71 ...■7.03 Quality of port infrastructure ......................................114 ...■7.04 Quality of ground transport network ............................97 ...■7.05 Road density*.............................................................103 ...■
INDICATOR RANK/133
8th pillar: Tourism infrastructure8.01 Hotel rooms*................................................................88 ...■8.02 Presence of major car rental companies*....................95 ...■8.03 ATMs accepting Visa cards* ......................................121 ...■
9th pillar: ICT infrastructure9.01 Extent of business Internet use.................................130 ...■9.02 Internet users* ...........................................................117 ...■9.03 Telephone lines*.........................................................121 ...■9.04 Broadband Internet subscribers* ...............................122 ...■9.05 Mobile telephone subscribers*..................................113 ...■
10th pillar: Price competitiveness in the T&T industry10.01 Ticket taxes and airport charges*...............................124 ...■10.02 Purchasing power parity*.............................................55 ...■10.03 Extent and effect of taxation......................................115 ...■10.04 Fuel price levels* .........................................................86 ...■10.05 Hotel price index* ........................................................65 ...■
11th pillar: Human resources11.01 Primary education enrollment*....................................n/a ......11.02 Secondary education enrollment*..............................127 ...■11.03 Quality of the educational system................................85 ...■11.04 Local availability of research and training services.......94 ...■11.05 Extent of staff training................................................104 ...■11.06 Hiring and firing practices.............................................56 ...■11.07 Ease of hiring foreign labor ..........................................45 ...■11.08 HIV prevalence* .........................................................122 ...■11.09 Business impact of HIV/AIDS.....................................114 ...■11.10 Life expectancy* ........................................................120 ...■
12th pillar: Affinity for Travel & Tourism12.01 Tourism openness* ......................................................72 ...■12.02 Attitude of population toward foreign visitors............110 ...■12.03 Extension of business trips recommended .................96 ...■
13th pillar: Natural resources13.01 Number of World Heritage natural sites* ....................40 ...■13.02 Protected areas* ..........................................................61 ...■13.03 Quality of the natural environment...............................95 ...■13.04 Total known species*...................................................15 ...■
14th pillar: Cultural resources14.01 Number of World Heritage cultural sites* .................116 ...■14.02 Sports stadiums* .........................................................93 ...■14.03 Number of international fairs and exhibitions* ............83 ...■14.04 Creative industries exports*.........................................96 ...■
Cameroon
* Hard data
Note: For further details and explanation, please refer to the section “How toRead the Country/Economy Profiles” at the beginning of this chapter.
part2A_profiles.r2 2/26/09 4:01 AM Page 159
The Travel & Tourism Competitiveness Report 2009 © 2009 World Economic Forum

160
2.1:
Cou
ntry
/Eco
nom
y Pr
ofile
s
CanadaKey indicatorsPopulation (millions), 2007............................................................................32.9Surface area (1,000 square kilometers) ...................................................9,984.7
Gross domestic product (US$ billions), 2007 ..........................................1,436.1Gross domestic product (PPP, US$) per capita, 2007 ...........................38,613.6Real GDP growth (percent), 2007...................................................................2.7
Environmental Performance Index, 2008 (out of 149 countries).....................12
Travel & Tourism indicators
T&T industry, 2008 estimatesGDP (US$ millions) ...........................................................45,780...................2.9 ....................2.1Employment (1,000 jobs).......................................................582...................3.4 ....................0.0
T&T economy, 2008 estimatesGDP (US$ millions) .........................................................154,631...................9.7 ....................3.1Employment (1,000 jobs)....................................................1,747.................10.2 ....................0.5
Source: World Travel & Tourism Council, TSA Research 2008
International tourist arrivals (thousands), 2007.................17,931International tourism receipts (US$ millions), 2007 .........15,486
Source: United Nations World Tourism Organization
Travel & Tourism Competitiveness Index
2009 Index........................................................................................................5 5.32008 Index..............................................................................................................9 5.3T&T regulatory framework ..............................................................................23 5.4
Policy rules and regulations............................................................................5 5.5Environmental sustainability..........................................................................46 4.8Safety and security .........................................................................................29 5.9Health and hygiene .........................................................................................51 5.4Prioritization of Travel & Tourism..................................................................17 5.5
T&T business environment and infrastructure ..............................................4 5.4Air transport infrastructure ............................................................................1 6.7Ground transport infrastructure....................................................................24 4.9Tourism infrastructure ....................................................................................20 5.7ICT infrastructure ............................................................................................13 5.3Price competitiveness in the T&T industry...............................................106 4.1
T&T human, cultural, and natural resources ...............................................10 5.2Human resources ..............................................................................................6 6.0
Education and training ...............................................................................7 6.0Availability of qualified labor...................................................................11 5.9
Affinity for Travel & Tourism ..........................................................................67 4.7Natural resources ...........................................................................................17 4.7Cultural resources...........................................................................................18 5.3
Note: For descriptions of variables and detailed sources, please refer to “How to the Read Country/Economy Profiles.”
Rank Score(out of 133) (1–7 scale)
International tourist arrivals (thousands)
International tourism receipts (US$ millions)
1995 1996 1997 1998 1999 2000 2001 2002 2003 2004 2005 2006 20075,000
10,000
15,000
20,000
25,000
1 2 3 4 5 6 7
2009–2018Percent annual growth of total (%, forecast)
part2A_profiles.r2 2/26/09 4:01 AM Page 160
The Travel & Tourism Competitiveness Report 2009 © 2009 World Economic Forum

161
2.1:
Cou
ntry
/Eco
nom
y Pr
ofile
s
The Travel & Tourism Competitiveness Index in detail ■ Competitive Advantage ■ Competitive Disadvantage
INDICATOR RANK/133
1st pillar: Policy rules and regulations1.01 Prevalence of foreign ownership .................................34 ...■1.02 Property rights................................................................8 ...■1.03 Business impact of rules on FDI ..................................45 ...■1.04 Visa requirements* ......................................................72 ...■1.05 Openness of bilateral Air Service Agreements* ..........10 ...■1.06 Transparency of government policymaking..................16 ...■1.07 Time required to start a business*.................................6 ...■1.08 Cost to start a business* ...............................................5 ...■
2nd pillar: Environmental sustainability2.01 Stringency of environmental regulation .......................20 ...■2.02 Enforcement of environmental regulation....................17 ...■2.03 Sustainability of T&T industry development.................31 ...■2.04 Carbon dioxide emissions* ........................................121 ...■2.05 Particulate matter concentration* ................................18 ...■2.06 Threatened species* ....................................................50 ...■2.07 Environmental treaty ratification*.................................52 ...■
3rd pillar: Safety and security3.01 Business costs of terrorism .........................................73 ...■3.02 Reliability of police services ...........................................9 ...■3.03 Business costs of crime and violence..........................41 ...■3.04 Road traffic accidents*.................................................78 ...■
4th pillar: Health and hygiene4.01 Physician density*........................................................59 ...■4.02 Access to improved sanitation* .....................................1 ...■4.03 Access to improved drinking water*..............................1 ...■4.04 Hospital beds*..............................................................51 ...■
5th pillar: Prioritization of Travel & Tourism5.01 Government prioritization of the T&T industry.............37 ...■5.02 T&T government expenditure* ....................................47 ...■5.03 Effectiveness of marketing and branding.....................30 ...■5.04 T&T fair attendance*......................................................3 ...■
6th pillar: Air transport infrastructure6.01 Quality of air transport infrastructure ...........................17 ...■6.02 Available seat kilometers, domestic*.............................7 ...■6.03 Available seat kilometers, international* ......................13 ...■6.04 Departures per 1,000 population*................................12 ...■6.05 Airport density* ..............................................................3 ...■6.06 Number of operating airlines*........................................7 ...■6.07 International air transport network .................................8 ...■
7th pillar: Ground transport infrastructure7.01 Quality of roads ............................................................10 ...■7.02 Quality of railroad infrastructure...................................15 ...■7.03 Quality of port infrastructure ........................................14 ...■7.04 Quality of ground transport network ............................12 ...■7.05 Road density*...............................................................88 ...■
INDICATOR RANK/133
8th pillar: Tourism infrastructure8.01 Hotel rooms*................................................................18 ...■8.02 Presence of major car rental companies*....................23 ...■8.03 ATMs accepting Visa cards* ........................................17 ...■
9th pillar: ICT infrastructure9.01 Extent of business Internet use.....................................8 ...■9.02 Internet users* ...............................................................4 ...■9.03 Telephone lines*.............................................................8 ...■9.04 Broadband Internet subscribers* ...................................9 ...■9.05 Mobile telephone subscribers*....................................84 ...■
10th pillar: Price competitiveness in the T&T industry10.01 Ticket taxes and airport charges*.................................98 ...■10.02 Purchasing power parity*...........................................115 ...■10.03 Extent and effect of taxation........................................87 ...■10.04 Fuel price levels* .........................................................56 ...■10.05 Hotel price index* ........................................................60 ...■
11th pillar: Human resources11.01 Primary education enrollment* ......................................6 ...■11.02 Secondary education enrollment*..................................6 ...■11.03 Quality of the educational system..................................8 ...■11.04 Local availability of research and training services.......10 ...■11.05 Extent of staff training..................................................19 ...■11.06 Hiring and firing practices.............................................30 ...■11.07 Ease of hiring foreign labor ..........................................82 ...■11.08 HIV prevalence* ...........................................................73 ...■11.09 Business impact of HIV/AIDS.......................................38 ...■11.10 Life expectancy* ............................................................5 ...■
12th pillar: Affinity for Travel & Tourism12.01 Tourism openness* ....................................................100 ...■12.02 Attitude of population toward foreign visitors..............14 ...■12.03 Extension of business trips recommended .................46 ...■
13th pillar: Natural resources13.01 Number of World Heritage natural sites* ......................4 ...■13.02 Protected areas* ..........................................................81 ...■13.03 Quality of the natural environment...............................15 ...■13.04 Total known species*...................................................43 ...■
14th pillar: Cultural resources14.01 Number of World Heritage cultural sites* ...................33 ...■14.02 Sports stadiums* .........................................................39 ...■14.03 Number of international fairs and exhibitions* ............13 ...■14.04 Creative industries exports*...........................................8 ...■
Canada
* Hard data
Note: For further details and explanation, please refer to the section “How toRead the Country/Economy Profiles” at the beginning of this chapter.
part2A_profiles.r2 2/26/09 4:01 AM Page 161
The Travel & Tourism Competitiveness Report 2009 © 2009 World Economic Forum

162
2.1:
Cou
ntry
/Eco
nom
y Pr
ofile
s
ChadKey indicatorsPopulation (millions), 2007............................................................................10.3Surface area (1,000 square kilometers) ...................................................1,284.0
Gross domestic product (US$ billions), 2007 .................................................7.0Gross domestic product (PPP, US$) per capita, 2007 .............................1,668.7Real GDP growth (percent), 2007...................................................................0.2
Environmental Performance Index, 2008 (out of 149 countries)...................143
Travel & Tourism indicators
T&T industry, 2008 estimatesGDP (US$ millions) ..................................................................88...................1.0 ....................5.3Employment (1,000 jobs).........................................................14...................0.8 ....................2.2
T&T economy, 2008 estimatesGDP (US$ millions) ................................................................644...................7.6 ....................5.7Employment (1,000 jobs).......................................................109...................6.2 ....................2.6
Source: World Travel & Tourism Council, TSA Research 2008
International tourist arrivals (thousands), 2007........................25International tourism receipts (US$ millions), 2002 ................25
Source: United Nations World Tourism Organization
Travel & Tourism Competitiveness Index
2009 Index....................................................................................................133 2.52008 Index..........................................................................................................130 2.5T&T regulatory framework ............................................................................133 2.8
Policy rules and regulations........................................................................132 2.5Environmental sustainability........................................................................128 3.6Safety and security .......................................................................................115 4.0Health and hygiene .......................................................................................132 1.1Prioritization of Travel & Tourism................................................................127 2.9
T&T business environment and infrastructure ..........................................133 1.9Air transport infrastructure ........................................................................131 1.7Ground transport infrastructure..................................................................131 2.1Tourism infrastructure ..................................................................................131 1.0ICT infrastructure ..........................................................................................133 1.4Price competitiveness in the T&T industry...............................................125 3.5
T&T human, cultural, and natural resources .............................................132 2.8Human resources ..........................................................................................132 3.3
Education and training ...........................................................................133 2.3Availability of qualified labor.................................................................124 4.3
Affinity for Travel & Tourism ........................................................................120 4.2Natural resources ...........................................................................................99 2.7Cultural resources.........................................................................................132 1.0
Note: For descriptions of variables and detailed sources, please refer to “How to the Read Country/Economy Profiles.”
Rank Score(out of 133) (1–7 scale)
International tourist arrivals (thousands)
International tourism receipts (US$ millions)
1995 1996 1997 1998 1999 2000 2001 2002 2003 2004 2005 2006 200710
20
30
40
50
60
1 2 3 4 5 6 7
2009–2018Percent annual growth of total (%, forecast)
part2A_profiles.r2 2/26/09 4:01 AM Page 162
The Travel & Tourism Competitiveness Report 2009 © 2009 World Economic Forum

163
2.1:
Cou
ntry
/Eco
nom
y Pr
ofile
s
The Travel & Tourism Competitiveness Index in detail ■ Competitive Advantage ■ Competitive Disadvantage
INDICATOR RANK/133
1st pillar: Policy rules and regulations1.01 Prevalence of foreign ownership ...............................118 ...■1.02 Property rights............................................................130 ...■1.03 Business impact of rules on FDI ................................124 ...■1.04 Visa requirements* ....................................................115 ...■1.05 Openness of bilateral Air Service Agreements* ..........70 ...■1.06 Transparency of government policymaking................116 ...■1.07 Time required to start a business*.............................121 ...■1.08 Cost to start a business* ...........................................125 ...■
2nd pillar: Environmental sustainability2.01 Stringency of environmental regulation .....................133 ...■2.02 Enforcement of environmental regulation..................129 ...■2.03 Sustainability of T&T industry development...............107 ...■2.04 Carbon dioxide emissions* ............................................1 ...■2.05 Particulate matter concentration* ..............................124 ...■2.06 Threatened species* ....................................................38 ...■2.07 Environmental treaty ratification*...............................115 ...■
3rd pillar: Safety and security3.01 Business costs of terrorism .......................................122 ...■3.02 Reliability of police services .......................................126 ...■3.03 Business costs of crime and violence........................119 ...■3.04 Road traffic accidents*.................................................81 ...■
4th pillar: Health and hygiene4.01 Physician density*......................................................126 ...■4.02 Access to improved sanitation* .................................126 ...■4.03 Access to improved drinking water*..........................123 ...■4.04 Hospital beds*............................................................122 ...■
5th pillar: Prioritization of Travel & Tourism5.01 Government prioritization of the T&T industry...........120 ...■5.02 T&T government expenditure* ....................................51 ...■5.03 Effectiveness of marketing and branding...................123 ...■5.04 T&T fair attendance*..................................................126 ...■
6th pillar: Air transport infrastructure6.01 Quality of air transport infrastructure .........................129 ...■6.02 Available seat kilometers, domestic*.........................100 ...■6.03 Available seat kilometers, international* ....................125 ...■6.04 Departures per 1,000 population*..............................120 ...■6.05 Airport density* ..........................................................128 ...■6.06 Number of operating airlines*....................................130 ...■6.07 International air transport network .............................128 ...■
7th pillar: Ground transport infrastructure7.01 Quality of roads ..........................................................131 ...■7.02 Quality of railroad infrastructure ..................................n/a ......7.03 Quality of port infrastructure ......................................117 ...■7.04 Quality of ground transport network..........................128 ...■7.05 Road density*.............................................................128 ...■
INDICATOR RANK/133
8th pillar: Tourism infrastructure8.01 Hotel rooms*..............................................................122 ...■8.02 Presence of major car rental companies*..................122 ...■8.03 ATMs accepting Visa cards* ......................................124 ...■
9th pillar: ICT infrastructure9.01 Extent of business Internet use.................................132 ...■9.02 Internet users* ...........................................................127 ...■9.03 Telephone lines*.........................................................133 ...■9.04 Broadband Internet subscribers* ...............................127 ...■9.05 Mobile telephone subscribers*..................................128 ...■
10th pillar: Price competitiveness in the T&T industry10.01 Ticket taxes and airport charges*...............................131 ...■10.02 Purchasing power parity*.............................................25 ...■10.03 Extent and effect of taxation......................................117 ...■10.04 Fuel price levels* .........................................................97 ...■10.05 Hotel price index* ........................................................58 ...■
11th pillar: Human resources11.01 Primary education enrollment* ..................................127 ...■11.02 Secondary education enrollment*..............................130 ...■11.03 Quality of the educational system..............................127 ...■11.04 Local availability of research and training services.....127 ...■11.05 Extent of staff training................................................133 ...■11.06 Hiring and firing practices.............................................88 ...■11.07 Ease of hiring foreign labor ..........................................97 ...■11.08 HIV prevalence* .........................................................120 ...■11.09 Business impact of HIV/AIDS.....................................125 ...■11.10 Life expectancy* ........................................................129 ...■
12th pillar: Affinity for Travel & Tourism12.01 Tourism openness* ......................................................64 ...■12.02 Attitude of population toward foreign visitors............118 ...■12.03 Extension of business trips recommended ...............129 ...■
13th pillar: Natural resources13.01 Number of World Heritage natural sites* ....................74 ...■13.02 Protected areas* ..........................................................66 ...■13.03 Quality of the natural environment.............................115 ...■13.04 Total known species*...................................................53 ...■
14th pillar: Cultural resources14.01 Number of World Heritage cultural sites* .................116 ...■14.02 Sports stadiums* .......................................................127 ...■14.03 Number of international fairs and exhibitions*............n/a ......14.04 Creative industries exports*........................................n/a ......
Chad
* Hard data
Note: For further details and explanation, please refer to the section “How toRead the Country/Economy Profiles” at the beginning of this chapter.
part2A_profiles.r2 2/26/09 4:01 AM Page 163
The Travel & Tourism Competitiveness Report 2009 © 2009 World Economic Forum

164
2.1:
Cou
ntry
/Eco
nom
y Pr
ofile
s
ChileKey indicatorsPopulation (millions), 2007............................................................................16.6Surface area (1,000 square kilometers) ......................................................756.6
Gross domestic product (US$ billions), 2007 .............................................163.9Gross domestic product (PPP, US$) per capita, 2007 ...........................13,921.2Real GDP growth (percent), 2007...................................................................5.1
Environmental Performance Index, 2008 (out of 149 countries).....................29
Travel & Tourism indicators
T&T industry, 2008 estimatesGDP (US$ millions) .............................................................3,079...................1.7 ....................4.9Employment (1,000 jobs).......................................................128...................2.0 ....................2.2
T&T economy, 2008 estimatesGDP (US$ millions) .............................................................8,206...................4.5 ....................4.5Employment (1,000 jobs).......................................................307...................4.7 ....................1.9
Source: World Travel & Tourism Council, TSA Research 2008
International tourist arrivals (thousands), 2007...................2,507International tourism receipts (US$ millions), 2007 ...........1,419
Source: United Nations World Tourism Organization
Travel & Tourism Competitiveness Index
2009 Index......................................................................................................57 4.22008 Index............................................................................................................51 4.3T&T regulatory framework ..............................................................................49 4.9
Policy rules and regulations..........................................................................19 5.2Environmental sustainability..........................................................................64 4.6Safety and security .........................................................................................38 5.8Health and hygiene .........................................................................................66 4.6Prioritization of Travel & Tourism..................................................................77 4.2
T&T business environment and infrastructure ............................................58 3.8Air transport infrastructure ..........................................................................51 3.5Ground transport infrastructure....................................................................57 3.8Tourism infrastructure ....................................................................................69 3.2ICT infrastructure ............................................................................................49 3.4Price competitiveness in the T&T industry.................................................53 4.9
T&T human, cultural, and natural resources ...............................................64 3.9Human resources ............................................................................................47 5.2
Education and training .............................................................................63 4.8Availability of qualified labor...................................................................25 5.7
Affinity for Travel & Tourism ........................................................................111 4.4Natural resources ...........................................................................................63 3.2Cultural resources...........................................................................................48 2.9
Note: For descriptions of variables and detailed sources, please refer to “How to the Read Country/Economy Profiles.”
Rank Score(out of 133) (1–7 scale)
International tourist arrivals (thousands)
International tourism receipts (US$ millions)
1995 1996 1997 1998 1999 2000 2001 2002 2003 2004 2005 2006 2007500
1,000
1,500
2,000
2,500
3,000
1 2 3 4 5 6 7
2009–2018Percent annual growth of total (%, forecast)
part2A_profiles.r2 2/26/09 4:01 AM Page 164
The Travel & Tourism Competitiveness Report 2009 © 2009 World Economic Forum

165
2.1:
Cou
ntry
/Eco
nom
y Pr
ofile
s
The Travel & Tourism Competitiveness Index in detail ■ Competitive Advantage ■ Competitive Disadvantage
INDICATOR RANK/133
1st pillar: Policy rules and regulations1.01 Prevalence of foreign ownership .................................11 ...■1.02 Property rights..............................................................40 ...■1.03 Business impact of rules on FDI ..................................19 ...■1.04 Visa requirements* ......................................................20 ...■1.05 Openness of bilateral Air Service Agreements* ..........12 ...■1.06 Transparency of government policymaking..................26 ...■1.07 Time required to start a business*...............................76 ...■1.08 Cost to start a business* .............................................51 ...■
2nd pillar: Environmental sustainability2.01 Stringency of environmental regulation .......................39 ...■2.02 Enforcement of environmental regulation....................24 ...■2.03 Sustainability of T&T industry development.................95 ...■2.04 Carbon dioxide emissions* ..........................................67 ...■2.05 Particulate matter concentration* ................................88 ...■2.06 Threatened species* ..................................................117 ...■2.07 Environmental treaty ratification*.................................21 ...■
3rd pillar: Safety and security3.01 Business costs of terrorism .........................................27 ...■3.02 Reliability of police services .........................................16 ...■3.03 Business costs of crime and violence..........................84 ...■3.04 Road traffic accidents*.................................................75 ...■
4th pillar: Health and hygiene4.01 Physician density*........................................................87 ...■4.02 Access to improved sanitation* ...................................48 ...■4.03 Access to improved drinking water*............................62 ...■4.04 Hospital beds*..............................................................75 ...■
5th pillar: Prioritization of Travel & Tourism5.01 Government prioritization of the T&T industry...........109 ...■5.02 T&T government expenditure* ....................................46 ...■5.03 Effectiveness of marketing and branding.....................98 ...■5.04 T&T fair attendance*....................................................41 ...■
6th pillar: Air transport infrastructure6.01 Quality of air transport infrastructure ...........................24 ...■6.02 Available seat kilometers, domestic*...........................25 ...■6.03 Available seat kilometers, international* ......................42 ...■6.04 Departures per 1,000 population*................................46 ...■6.05 Airport density* ............................................................42 ...■6.06 Number of operating airlines*......................................70 ...■6.07 International air transport network ...............................20 ...■
7th pillar: Ground transport infrastructure7.01 Quality of roads ............................................................22 ...■7.02 Quality of railroad infrastructure...................................73 ...■7.03 Quality of port infrastructure ........................................37 ...■7.04 Quality of ground transport network ............................35 ...■7.05 Road density*.............................................................102 ...■
INDICATOR RANK/133
8th pillar: Tourism infrastructure8.01 Hotel rooms*................................................................58 ...■8.02 Presence of major car rental companies*....................56 ...■8.03 ATMs accepting Visa cards* ........................................62 ...■
9th pillar: ICT infrastructure9.01 Extent of business Internet use...................................27 ...■9.02 Internet users* .............................................................46 ...■9.03 Telephone lines*...........................................................64 ...■9.04 Broadband Internet subscribers* .................................43 ...■9.05 Mobile telephone subscribers*....................................59 ...■
10th pillar: Price competitiveness in the T&T industry10.01 Ticket taxes and airport charges*.................................48 ...■10.02 Purchasing power parity*.............................................95 ...■10.03 Extent and effect of taxation........................................45 ...■10.04 Fuel price levels* .........................................................66 ...■10.05 Hotel price index* ........................................................26 ...■
11th pillar: Human resources11.01 Primary education enrollment* ....................................99 ...■11.02 Secondary education enrollment*................................54 ...■11.03 Quality of the educational system................................86 ...■11.04 Local availability of research and training services.......46 ...■11.05 Extent of staff training..................................................48 ...■11.06 Hiring and firing practices.............................................74 ...■11.07 Ease of hiring foreign labor ..........................................43 ...■11.08 HIV prevalence* ...........................................................67 ...■11.09 Business impact of HIV/AIDS.......................................43 ...■11.10 Life expectancy* ..........................................................29 ...■
12th pillar: Affinity for Travel & Tourism12.01 Tourism openness* ....................................................115 ...■12.02 Attitude of population toward foreign visitors..............82 ...■12.03 Extension of business trips recommended .................84 ...■
13th pillar: Natural resources13.01 Number of World Heritage natural sites* ....................74 ...■13.02 Protected areas* ..........................................................51 ...■13.03 Quality of the natural environment...............................52 ...■13.04 Total known species*...................................................55 ...■
14th pillar: Cultural resources14.01 Number of World Heritage cultural sites* ...................45 ...■14.02 Sports stadiums* .........................................................44 ...■14.03 Number of international fairs and exhibitions* ............37 ...■14.04 Creative industries exports*.........................................55 ...■
Chile
* Hard data
Note: For further details and explanation, please refer to the section “How toRead the Country/Economy Profiles” at the beginning of this chapter.
part2A_profiles.r2 2/26/09 4:01 AM Page 165
The Travel & Tourism Competitiveness Report 2009 © 2009 World Economic Forum

166
2.1:
Cou
ntry
/Eco
nom
y Pr
ofile
s
ChinaKey indicatorsPopulation (millions), 2007.......................................................................1,331.4Surface area (1,000 square kilometers) ...................................................9,598.1
Gross domestic product (US$ billions), 2007 ..........................................3,280.2Gross domestic product (PPP, US$) per capita, 2007 .............................5,325.2Real GDP growth (percent), 2007.................................................................11.9
Environmental Performance Index, 2008 (out of 149 countries)...................105
Travel & Tourism indicators
T&T industry, 2008 estimatesGDP (US$ millions) .........................................................109,000...................2.6 ....................7.6Employment (1,000 jobs)..................................................19,138...................2.5 ....................2.5
T&T economy, 2008 estimatesGDP (US$ millions) .........................................................508,589.................12.2 ....................8.8Employment (1,000 jobs)..................................................74,498...................9.6 ....................2.9
Source: World Travel & Tourism Council, TSA Research 2008
International tourist arrivals (thousands), 2007.................54,720International tourism receipts (US$ millions), 2007 .........37,233
Source: United Nations World Tourism Organization
Travel & Tourism Competitiveness Index
2009 Index......................................................................................................47 4.32008 Index............................................................................................................62 4.1T&T regulatory framework ..............................................................................88 4.2
Policy rules and regulations..........................................................................87 4.1Environmental sustainability........................................................................105 4.0Safety and security .......................................................................................116 4.0Health and hygiene .........................................................................................91 3.9Prioritization of Travel & Tourism..................................................................28 5.2
T&T business environment and infrastructure ............................................59 3.7Air transport infrastructure ..........................................................................34 4.2Ground transport infrastructure....................................................................55 3.9Tourism infrastructure ....................................................................................80 2.5ICT infrastructure ............................................................................................68 2.8Price competitiveness in the T&T industry.................................................20 5.3
T&T human, cultural, and natural resources ...............................................12 5.0Human resources ............................................................................................43 5.3
Education and training .............................................................................46 5.0Availability of qualified labor...................................................................62 5.5
Affinity for Travel & Tourism ........................................................................127 4.0Natural resources .............................................................................................7 5.3Cultural resources...........................................................................................15 5.5
Note: For descriptions of variables and detailed sources, please refer to “How to the Read Country/Economy Profiles.”
Rank Score(out of 133) (1–7 scale)
International tourist arrivals (thousands)
International tourism receipts (US$ millions)
1995 1996 1997 1998 1999 2000 2001 2002 2003 2004 2005 2006 20070
10,000
20,000
30,000
40,000
50,000
60,000
1 2 3 4 5 6 7
2009–2018Percent annual growth of total (%, forecast)
part2A_profiles.r2 2/26/09 4:01 AM Page 166
The Travel & Tourism Competitiveness Report 2009 © 2009 World Economic Forum

167
2.1:
Cou
ntry
/Eco
nom
y Pr
ofile
s
The Travel & Tourism Competitiveness Index in detail ■ Competitive Advantage ■ Competitive Disadvantage
INDICATOR RANK/133
1st pillar: Policy rules and regulations1.01 Prevalence of foreign ownership ...............................105 ...■1.02 Property rights..............................................................54 ...■1.03 Business impact of rules on FDI ..................................55 ...■1.04 Visa requirements* ....................................................128 ...■1.05 Openness of bilateral Air Service Agreements* ........112 ...■1.06 Transparency of government policymaking..................46 ...■1.07 Time required to start a business*.............................100 ...■1.08 Cost to start a business* .............................................57 ...■
2nd pillar: Environmental sustainability2.01 Stringency of environmental regulation .......................71 ...■2.02 Enforcement of environmental regulation....................63 ...■2.03 Sustainability of T&T industry development.................59 ...■2.04 Carbon dioxide emissions* ..........................................66 ...■2.05 Particulate matter concentration* ..............................104 ...■2.06 Threatened species* ..................................................119 ...■2.07 Environmental treaty ratification*.................................52 ...■
3rd pillar: Safety and security3.01 Business costs of terrorism .........................................89 ...■3.02 Reliability of police services .........................................50 ...■3.03 Business costs of crime and violence..........................56 ...■3.04 Road traffic accidents*...............................................128 ...■
4th pillar: Health and hygiene4.01 Physician density*........................................................70 ...■4.02 Access to improved sanitation* ...................................91 ...■4.03 Access to improved drinking water*............................87 ...■4.04 Hospital beds*..............................................................78 ...■
5th pillar: Prioritization of Travel & Tourism5.01 Government prioritization of the T&T industry.............74 ...■5.02 T&T government expenditure* ....................................50 ...■5.03 Effectiveness of marketing and branding.....................60 ...■5.04 T&T fair attendance*......................................................3 ...■
6th pillar: Air transport infrastructure6.01 Quality of air transport infrastructure ...........................74 ...■6.02 Available seat kilometers, domestic*.............................2 ...■6.03 Available seat kilometers, international* ........................7 ...■6.04 Departures per 1,000 population*................................88 ...■6.05 Airport density* ..........................................................125 ...■6.06 Number of operating airlines*......................................10 ...■6.07 International air transport network ...............................74 ...■
7th pillar: Ground transport infrastructure7.01 Quality of roads ............................................................51 ...■7.02 Quality of railroad infrastructure...................................28 ...■7.03 Quality of port infrastructure ........................................54 ...■7.04 Quality of ground transport network ............................33 ...■7.05 Road density*...............................................................78 ...■
INDICATOR RANK/133
8th pillar: Tourism infrastructure8.01 Hotel rooms*................................................................98 ...■8.02 Presence of major car rental companies*....................56 ...■8.03 ATMs accepting Visa cards* ........................................90 ...■
9th pillar: ICT infrastructure9.01 Extent of business Internet use...................................54 ...■9.02 Internet users* .............................................................78 ...■9.03 Telephone lines*...........................................................50 ...■9.04 Broadband Internet subscribers* .................................50 ...■9.05 Mobile telephone subscribers*....................................94 ...■
10th pillar: Price competitiveness in the T&T industry10.01 Ticket taxes and airport charges*.................................21 ...■10.02 Purchasing power parity*.............................................36 ...■10.03 Extent and effect of taxation........................................36 ...■10.04 Fuel price levels* .........................................................32 ...■10.05 Hotel price index* ........................................................41 ...■
11th pillar: Human resources11.01 Primary education enrollment* ......................................5 ...■11.02 Secondary education enrollment*................................92 ...■11.03 Quality of the educational system................................55 ...■11.04 Local availability of research and training services.......39 ...■11.05 Extent of staff training..................................................42 ...■11.06 Hiring and firing practices.............................................53 ...■11.07 Ease of hiring foreign labor ..........................................44 ...■11.08 HIV prevalence* ...........................................................22 ...■11.09 Business impact of HIV/AIDS.......................................48 ...■11.10 Life expectancy* ..........................................................55 ...■
12th pillar: Affinity for Travel & Tourism12.01 Tourism openness* ....................................................113 ...■12.02 Attitude of population toward foreign visitors............121 ...■12.03 Extension of business trips recommended ...............122 ...■
13th pillar: Natural resources13.01 Number of World Heritage natural sites* ......................3 ...■13.02 Protected areas* ..........................................................48 ...■13.03 Quality of the natural environment.............................127 ...■13.04 Total known species*.....................................................6 ...■
14th pillar: Cultural resources14.01 Number of World Heritage cultural sites* .....................3 ...■14.02 Sports stadiums* .......................................................126 ...■14.03 Number of international fairs and exhibitions* ............10 ...■14.04 Creative industries exports*...........................................1 ...■
China
* Hard data
Note: For further details and explanation, please refer to the section “How toRead the Country/Economy Profiles” at the beginning of this chapter.
part2A_profiles.r2 2/26/09 4:01 AM Page 167
The Travel & Tourism Competitiveness Report 2009 © 2009 World Economic Forum

168
2.1:
Cou
ntry
/Eco
nom
y Pr
ofile
s
ColombiaKey indicatorsPopulation (millions), 2007............................................................................47.0Surface area (1,000 square kilometers) ...................................................1,141.8
Gross domestic product (US$ billions), 2007 .............................................202.6Gross domestic product (PPP, US$) per capita, 2007 .............................7,968.2Real GDP growth (percent), 2007...................................................................7.7
Environmental Performance Index, 2008 (out of 149 countries).......................9
Travel & Tourism indicators
T&T industry, 2008 estimatesGDP (US$ millions) .............................................................3,524...................1.9 ....................3.5Employment (1,000 jobs).......................................................386...................1.8 ....................2.1
T&T economy, 2008 estimatesGDP (US$ millions) ...........................................................10,753...................5.9 ....................4.0Employment (1,000 jobs)....................................................1,121...................5.3 ....................2.6
Source: World Travel & Tourism Council, TSA Research 2008
International tourist arrivals (thousands), 2007...................1,193International tourism receipts (US$ millions), 2007 ...........1,669
Source: United Nations World Tourism Organization
Travel & Tourism Competitiveness Index
2009 Index......................................................................................................72 3.92008 Index............................................................................................................71 3.9T&T regulatory framework ..............................................................................91 4.2
Policy rules and regulations..........................................................................60 4.5Environmental sustainability..........................................................................84 4.3Safety and security .......................................................................................125 3.7Health and hygiene .........................................................................................86 4.1Prioritization of Travel & Tourism..................................................................67 4.3
T&T business environment and infrastructure ............................................88 3.1Air transport infrastructure ..........................................................................65 3.1Ground transport infrastructure..................................................................108 2.7Tourism infrastructure ....................................................................................93 2.0ICT infrastructure ............................................................................................65 2.9Price competitiveness in the T&T industry.................................................66 4.7
T&T human, cultural, and natural resources ...............................................34 4.4Human resources ............................................................................................64 5.1
Education and training .............................................................................72 4.6Availability of qualified labor...................................................................37 5.6
Affinity for Travel & Tourism ........................................................................104 4.4Natural resources .............................................................................................5 5.5Cultural resources...........................................................................................56 2.7
Note: For descriptions of variables and detailed sources, please refer to “How to the Read Country/Economy Profiles.”
Rank Score(out of 133) (1–7 scale)
International tourist arrivals (thousands)
International tourism receipts (US$ millions)
1995 1996 1997 1998 1999 2000 2001 2002 2003 2004 2005 2006 2007500
1,000
1,500
2,000
1 2 3 4 5 6 7
2009–2018Percent annual growth of total (%, forecast)
part2A_profiles.r2 2/26/09 4:01 AM Page 168
The Travel & Tourism Competitiveness Report 2009 © 2009 World Economic Forum

169
2.1:
Cou
ntry
/Eco
nom
y Pr
ofile
s
The Travel & Tourism Competitiveness Index in detail ■ Competitive Advantage ■ Competitive Disadvantage
INDICATOR RANK/133
1st pillar: Policy rules and regulations1.01 Prevalence of foreign ownership .................................86 ...■1.02 Property rights..............................................................73 ...■1.03 Business impact of rules on FDI ..................................80 ...■1.04 Visa requirements* ......................................................14 ...■1.05 Openness of bilateral Air Service Agreements* ..........41 ...■1.06 Transparency of government policymaking..................48 ...■1.07 Time required to start a business*...............................95 ...■1.08 Cost to start a business* .............................................72 ...■
2nd pillar: Environmental sustainability2.01 Stringency of environmental regulation .......................66 ...■2.02 Enforcement of environmental regulation....................76 ...■2.03 Sustainability of T&T industry development.................53 ...■2.04 Carbon dioxide emissions* ..........................................42 ...■2.05 Particulate matter concentration* ................................32 ...■2.06 Threatened species* ..................................................120 ...■2.07 Environmental treaty ratification*...............................121 ...■
3rd pillar: Safety and security3.01 Business costs of terrorism .......................................133 ...■3.02 Reliability of police services .........................................77 ...■3.03 Business costs of crime and violence........................118 ...■3.04 Road traffic accidents*...............................................109 ...■
4th pillar: Health and hygiene4.01 Physician density*........................................................73 ...■4.02 Access to improved sanitation* ...................................80 ...■4.03 Access to improved drinking water*............................68 ...■4.04 Hospital beds*..............................................................99 ...■
5th pillar: Prioritization of Travel & Tourism5.01 Government prioritization of the T&T industry.............67 ...■5.02 T&T government expenditure* ....................................99 ...■5.03 Effectiveness of marketing and branding.....................54 ...■5.04 T&T fair attendance*....................................................41 ...■
6th pillar: Air transport infrastructure6.01 Quality of air transport infrastructure ...........................64 ...■6.02 Available seat kilometers, domestic*...........................27 ...■6.03 Available seat kilometers, international* ......................51 ...■6.04 Departures per 1,000 population*................................55 ...■6.05 Airport density* ............................................................41 ...■6.06 Number of operating airlines*......................................68 ...■6.07 International air transport network ...............................72 ...■
7th pillar: Ground transport infrastructure7.01 Quality of roads ............................................................91 ...■7.02 Quality of railroad infrastructure...................................99 ...■7.03 Quality of port infrastructure ......................................108 ...■7.04 Quality of ground transport network ............................62 ...■7.05 Road density*...............................................................86 ...■
INDICATOR RANK/133
8th pillar: Tourism infrastructure8.01 Hotel rooms*................................................................83 ...■8.02 Presence of major car rental companies*....................95 ...■8.03 ATMs accepting Visa cards* ........................................65 ...■
9th pillar: ICT infrastructure9.01 Extent of business Internet use...................................61 ...■9.02 Internet users* .............................................................56 ...■9.03 Telephone lines*...........................................................72 ...■9.04 Broadband Internet subscribers* .................................63 ...■9.05 Mobile telephone subscribers*....................................74 ...■
10th pillar: Price competitiveness in the T&T industry10.01 Ticket taxes and airport charges*...............................117 ...■10.02 Purchasing power parity*.............................................58 ...■10.03 Extent and effect of taxation......................................103 ...■10.04 Fuel price levels* .........................................................28 ...■10.05 Hotel price index* ........................................................33 ...■
11th pillar: Human resources11.01 Primary education enrollment* ....................................95 ...■11.02 Secondary education enrollment*................................83 ...■11.03 Quality of the educational system................................61 ...■11.04 Local availability of research and training services.......61 ...■11.05 Extent of staff training..................................................91 ...■11.06 Hiring and firing practices.............................................73 ...■11.07 Ease of hiring foreign labor ..........................................33 ...■11.08 HIV prevalence* ...........................................................85 ...■11.09 Business impact of HIV/AIDS.......................................93 ...■11.10 Life expectancy* ..........................................................50 ...■
12th pillar: Affinity for Travel & Tourism12.01 Tourism openness* ....................................................117 ...■12.02 Attitude of population toward foreign visitors..............57 ...■12.03 Extension of business trips recommended .................85 ...■
13th pillar: Natural resources13.01 Number of World Heritage natural sites* ....................23 ...■13.02 Protected areas* ..........................................................12 ...■13.03 Quality of the natural environment...............................61 ...■13.04 Total known species*.....................................................2 ...■
14th pillar: Cultural resources14.01 Number of World Heritage cultural sites* ...................33 ...■14.02 Sports stadiums* .........................................................78 ...■14.03 Number of international fairs and exhibitions* ............42 ...■14.04 Creative industries exports*.........................................40 ...■
Colombia
* Hard data
Note: For further details and explanation, please refer to the section “How toRead the Country/Economy Profiles” at the beginning of this chapter.
part2A_profiles.r2 2/26/09 4:01 AM Page 169
The Travel & Tourism Competitiveness Report 2009 © 2009 World Economic Forum

170
2.1:
Cou
ntry
/Eco
nom
y Pr
ofile
s
Costa RicaKey indicatorsPopulation (millions), 2007..............................................................................4.5Surface area (1,000 square kilometers) ........................................................51.1
Gross domestic product (US$ billions), 2007 ...............................................26.2Gross domestic product (PPP, US$) per capita, 2007 ...........................10,357.9Real GDP growth (percent), 2007...................................................................7.3
Environmental Performance Index, 2008 (out of 149 countries).......................5
Travel & Tourism indicators
T&T industry, 2008 estimatesGDP (US$ millions) .............................................................1,466...................5.3 ....................4.7Employment (1,000 jobs).......................................................107...................5.4 ....................3.4
T&T economy, 2008 estimatesGDP (US$ millions) .............................................................3,769.................13.5 ....................4.7Employment (1,000 jobs).......................................................258.................13.1 ....................3.4
Source: World Travel & Tourism Council, TSA Research 2008
International tourist arrivals (thousands), 2007...................1,980International tourism receipts (US$ millions), 2007 ...........2,029
Source: United Nations World Tourism Organization
Travel & Tourism Competitiveness Index
2009 Index......................................................................................................42 4.42008 Index............................................................................................................44 4.3T&T regulatory framework ..............................................................................48 4.9
Policy rules and regulations..........................................................................48 4.7Environmental sustainability..........................................................................27 5.1Safety and security .........................................................................................72 5.1Health and hygiene .........................................................................................65 4.6Prioritization of Travel & Tourism..................................................................29 5.2
T&T business environment and infrastructure ............................................55 3.8Air transport infrastructure ..........................................................................42 3.9Ground transport infrastructure..................................................................103 2.7Tourism infrastructure ....................................................................................33 4.5ICT infrastructure ............................................................................................61 3.0Price competitiveness in the T&T industry.................................................57 4.8
T&T human, cultural, and natural resources ...............................................31 4.5Human resources ............................................................................................24 5.6
Education and training .............................................................................31 5.3Availability of qualified labor...................................................................10 5.9
Affinity for Travel & Tourism ..........................................................................27 5.4Natural resources .............................................................................................6 5.4Cultural resources...........................................................................................89 1.8
Note: For descriptions of variables and detailed sources, please refer to “How to the Read Country/Economy Profiles.”
Rank Score(out of 133) (1–7 scale)
International tourist arrivals (thousands)
International tourism receipts (US$ millions)
1995 1996 1997 1998 1999 2000 2001 2002 2003 2004 2005 2006 2007500
1,000
1,500
2,000
2,500
1 2 3 4 5 6 7
2009–2018Percent annual growth of total (%, forecast)
part2A_profiles.r2 2/26/09 4:01 AM Page 170
The Travel & Tourism Competitiveness Report 2009 © 2009 World Economic Forum

171
2.1:
Cou
ntry
/Eco
nom
y Pr
ofile
s
The Travel & Tourism Competitiveness Index in detail ■ Competitive Advantage ■ Competitive Disadvantage
INDICATOR RANK/133
1st pillar: Policy rules and regulations1.01 Prevalence of foreign ownership .................................10 ...■1.02 Property rights..............................................................71 ...■1.03 Business impact of rules on FDI ..................................17 ...■1.04 Visa requirements* ......................................................12 ...■1.05 Openness of bilateral Air Service Agreements* ............9 ...■1.06 Transparency of government policymaking..................52 ...■1.07 Time required to start a business*.............................115 ...■1.08 Cost to start a business* .............................................85 ...■
2nd pillar: Environmental sustainability2.01 Stringency of environmental regulation .......................32 ...■2.02 Enforcement of environmental regulation....................34 ...■2.03 Sustainability of T&T industry development.................24 ...■2.04 Carbon dioxide emissions* ..........................................46 ...■2.05 Particulate matter concentration* ................................68 ...■2.06 Threatened species* ....................................................93 ...■2.07 Environmental treaty ratification*.................................52 ...■
3rd pillar: Safety and security3.01 Business costs of terrorism .........................................59 ...■3.02 Reliability of police services .........................................84 ...■3.03 Business costs of crime and violence........................108 ...■3.04 Road traffic accidents*.................................................47 ...■
4th pillar: Health and hygiene4.01 Physician density*........................................................75 ...■4.02 Access to improved sanitation* ...................................44 ...■4.03 Access to improved drinking water*............................47 ...■4.04 Hospital beds*..............................................................95 ...■
5th pillar: Prioritization of Travel & Tourism5.01 Government prioritization of the T&T industry.............10 ...■5.02 T&T government expenditure* ....................................22 ...■5.03 Effectiveness of marketing and branding.....................19 ...■5.04 T&T fair attendance*....................................................62 ...■
6th pillar: Air transport infrastructure6.01 Quality of air transport infrastructure ...........................58 ...■6.02 Available seat kilometers, domestic*...........................69 ...■6.03 Available seat kilometers, international* ......................67 ...■6.04 Departures per 1,000 population*................................39 ...■6.05 Airport density* ............................................................12 ...■6.06 Number of operating airlines*......................................75 ...■6.07 International air transport network ...............................45 ...■
7th pillar: Ground transport infrastructure7.01 Quality of roads ..........................................................118 ...■7.02 Quality of railroad infrastructure.................................113 ...■7.03 Quality of port infrastructure ......................................128 ...■7.04 Quality of ground transport network ............................79 ...■7.05 Road density*...............................................................40 ...■
INDICATOR RANK/133
8th pillar: Tourism infrastructure8.01 Hotel rooms*................................................................29 ...■8.02 Presence of major car rental companies*....................23 ...■8.03 ATMs accepting Visa cards* ........................................46 ...■
9th pillar: ICT infrastructure9.01 Extent of business Internet use...................................72 ...■9.02 Internet users* .............................................................45 ...■9.03 Telephone lines*...........................................................38 ...■9.04 Broadband Internet subscribers* .................................60 ...■9.05 Mobile telephone subscribers*..................................104 ...■
10th pillar: Price competitiveness in the T&T industry10.01 Ticket taxes and airport charges*.................................59 ...■10.02 Purchasing power parity*.............................................56 ...■10.03 Extent and effect of taxation........................................46 ...■10.04 Fuel price levels* .........................................................42 ...■10.05 Hotel price index* ........................................................89 ...■
11th pillar: Human resources11.01 Primary education enrollment* ....................................11 ...■11.02 Secondary education enrollment*................................71 ...■11.03 Quality of the educational system................................32 ...■11.04 Local availability of research and training services.......40 ...■11.05 Extent of staff training..................................................25 ...■11.06 Hiring and firing practices.............................................15 ...■11.07 Ease of hiring foreign labor ..........................................52 ...■11.08 HIV prevalence* ...........................................................73 ...■11.09 Business impact of HIV/AIDS.......................................58 ...■11.10 Life expectancy* ..........................................................29 ...■
12th pillar: Affinity for Travel & Tourism12.01 Tourism openness* ......................................................24 ...■12.02 Attitude of population toward foreign visitors..............31 ...■12.03 Extension of business trips recommended .................53 ...■
13th pillar: Natural resources13.01 Number of World Heritage natural sites* ....................16 ...■13.02 Protected areas* ..........................................................21 ...■13.03 Quality of the natural environment...............................19 ...■13.04 Total known species*...................................................19 ...■
14th pillar: Cultural resources14.01 Number of World Heritage cultural sites* ...................97 ...■14.02 Sports stadiums* .........................................................48 ...■14.03 Number of international fairs and exhibitions* ............66 ...■14.04 Creative industries exports*.........................................72 ...■
Costa Rica
* Hard data
Note: For further details and explanation, please refer to the section “How toRead the Country/Economy Profiles” at the beginning of this chapter.
part2A_profiles.r2 2/26/09 4:01 AM Page 171
The Travel & Tourism Competitiveness Report 2009 © 2009 World Economic Forum

172
2.1:
Cou
ntry
/Eco
nom
y Pr
ofile
s
Côte d’IvoireKey indicatorsPopulation (millions), 2007............................................................................18.8Surface area (1,000 square kilometers) ......................................................322.5
Gross domestic product (US$ billions), 2007 ...............................................19.8Gross domestic product (PPP, US$) per capita, 2007 .............................1,736.8Real GDP growth (percent), 2007...................................................................1.6
Environmental Performance Index, 2008 (out of 149 countries)...................103
Travel & Tourism indicators
T&T industry, 2008 estimatesGDP (US$ millions) ................................................................338...................1.5 ....................3.5Employment (1,000 jobs).........................................................55...................1.3 ....................1.5
T&T economy, 2008 estimatesGDP (US$ millions) ................................................................983...................4.4 ....................4.2Employment (1,000 jobs).......................................................159...................3.6 ....................2.3
Source: World Travel & Tourism Council, TSA Research 2008
International tourist arrivals (thousands), 2003......................180International tourism receipts (US$ millions), 2007 ..............104
Source: United Nations World Tourism Organization
Travel & Tourism Competitiveness Index
2009 Index....................................................................................................130 3.02008 Index..........................................................................................................n/a n/aT&T regulatory framework ............................................................................131 3.1
Policy rules and regulations........................................................................115 3.5Environmental sustainability........................................................................102 4.1Safety and security .......................................................................................124 3.7Health and hygiene .......................................................................................119 2.0Prioritization of Travel & Tourism................................................................132 2.2
T&T business environment and infrastructure ..........................................123 2.5Air transport infrastructure ..........................................................................88 2.6Ground transport infrastructure....................................................................71 3.3Tourism infrastructure ..................................................................................133 1.0ICT infrastructure ..........................................................................................113 1.8Price competitiveness in the T&T industry...............................................120 3.8
T&T human, cultural, and natural resources .............................................118 3.4Human resources ..........................................................................................126 3.8
Education and training ...........................................................................129 2.9Availability of qualified labor.................................................................122 4.6
Affinity for Travel & Tourism ........................................................................116 4.3Natural resources ...........................................................................................32 4.3Cultural resources.........................................................................................130 1.1
Note: For descriptions of variables and detailed sources, please refer to “How to the Read Country/Economy Profiles.”
Rank Score(out of 133) (1–7 scale)
International tourist arrivals (thousands)
International tourism receipts (US$ millions)
1995 1996 1997 1998 1999 2000 2001 2002 2003 2004 2005 2006 20070
50
100
150
200
250
300
350
1 2 3 4 5 6 7
2009–2018Percent annual growth of total (%, forecast)
part2A_profiles.r2 2/26/09 4:01 AM Page 172
The Travel & Tourism Competitiveness Report 2009 © 2009 World Economic Forum

173
2.1:
Cou
ntry
/Eco
nom
y Pr
ofile
s
The Travel & Tourism Competitiveness Index in detail ■ Competitive Advantage ■ Competitive Disadvantage
INDICATOR RANK/133
1st pillar: Policy rules and regulations1.01 Prevalence of foreign ownership .................................21 ...■1.02 Property rights............................................................113 ...■1.03 Business impact of rules on FDI ..................................39 ...■1.04 Visa requirements* ....................................................105 ...■1.05 Openness of bilateral Air Service Agreements* ..........98 ...■1.06 Transparency of government policymaking..................66 ...■1.07 Time required to start a business*.............................100 ...■1.08 Cost to start a business* ...........................................122 ...■
2nd pillar: Environmental sustainability2.01 Stringency of environmental regulation .....................132 ...■2.02 Enforcement of environmental regulation..................132 ...■2.03 Sustainability of T&T industry development...............130 ...■2.04 Carbon dioxide emissions* ..........................................17 ...■2.05 Particulate matter concentration* ................................83 ...■2.06 Threatened species* ....................................................74 ...■2.07 Environmental treaty ratification*.................................34 ...■
3rd pillar: Safety and security3.01 Business costs of terrorism .......................................111 ...■3.02 Reliability of police services .......................................120 ...■3.03 Business costs of crime and violence........................128 ...■3.04 Road traffic accidents*.................................................99 ...■
4th pillar: Health and hygiene4.01 Physician density*......................................................117 ...■4.02 Access to improved sanitation* .................................120 ...■4.03 Access to improved drinking water*............................98 ...■4.04 Hospital beds*............................................................122 ...■
5th pillar: Prioritization of Travel & Tourism5.01 Government prioritization of the T&T industry...........131 ...■5.02 T&T government expenditure* ..................................108 ...■5.03 Effectiveness of marketing and branding...................130 ...■5.04 T&T fair attendance*..................................................126 ...■
6th pillar: Air transport infrastructure6.01 Quality of air transport infrastructure ...........................82 ...■6.02 Available seat kilometers, domestic*.........................100 ...■6.03 Available seat kilometers, international* ....................102 ...■6.04 Departures per 1,000 population*...............................n/a ......6.05 Airport density* ..........................................................131 ...■6.06 Number of operating airlines*......................................86 ...■6.07 International air transport network ...............................67 ...■
7th pillar: Ground transport infrastructure7.01 Quality of roads ............................................................58 ...■7.02 Quality of railroad infrastructure...................................80 ...■7.03 Quality of port infrastructure ........................................40 ...■7.04 Quality of ground transport network ............................76 ...■7.05 Road density*...............................................................72 ...■
INDICATOR RANK/133
8th pillar: Tourism infrastructure8.01 Hotel rooms*...............................................................n/a ......8.02 Presence of major car rental companies*..................122 ...■8.03 ATMs accepting Visa cards*........................................n/a ......
9th pillar: ICT infrastructure9.01 Extent of business Internet use.................................104 ...■9.02 Internet users* ...........................................................119 ...■9.03 Telephone lines*.........................................................115 ...■9.04 Broadband Internet subscribers* ...............................107 ...■9.05 Mobile telephone subscribers*..................................101 ...■
10th pillar: Price competitiveness in the T&T industry10.01 Ticket taxes and airport charges*...............................129 ...■10.02 Purchasing power parity*.............................................71 ...■10.03 Extent and effect of taxation........................................84 ...■10.04 Fuel price levels* .........................................................83 ...■10.05 Hotel price index* .......................................................n/a ......
11th pillar: Human resources11.01 Primary education enrollment* ..................................128 ...■11.02 Secondary education enrollment*..............................124 ...■11.03 Quality of the educational system..............................106 ...■11.04 Local availability of research and training services.......84 ...■11.05 Extent of staff training..................................................68 ...■11.06 Hiring and firing practices.............................................69 ...■11.07 Ease of hiring foreign labor ..........................................95 ...■11.08 HIV prevalence* .........................................................121 ...■11.09 Business impact of HIV/AIDS.....................................121 ...■11.10 Life expectancy* ........................................................117 ...■
12th pillar: Affinity for Travel & Tourism12.01 Tourism openness* ....................................................107 ...■12.02 Attitude of population toward foreign visitors............101 ...■12.03 Extension of business trips recommended ...............110 ...■
13th pillar: Natural resources13.01 Number of World Heritage natural sites* ....................16 ...■13.02 Protected areas* ..........................................................26 ...■13.03 Quality of the natural environment.............................133 ...■13.04 Total known species*...................................................31 ...■
14th pillar: Cultural resources14.01 Number of World Heritage cultural sites* .................116 ...■14.02 Sports stadiums* .......................................................115 ...■14.03 Number of international fairs and exhibitions* ..........117 ...■14.04 Creative industries exports*.........................................71 ...■
Côte d’Ivoire
* Hard data
Note: For further details and explanation, please refer to the section “How toRead the Country/Economy Profiles” at the beginning of this chapter.
part2A_profiles.r2 2/26/09 4:01 AM Page 173
The Travel & Tourism Competitiveness Report 2009 © 2009 World Economic Forum

174
2.1:
Cou
ntry
/Eco
nom
y Pr
ofile
s
CroatiaKey indicatorsPopulation (millions), 2007..............................................................................4.6Surface area (1,000 square kilometers) ........................................................56.5
Gross domestic product (US$ billions), 2007 ...............................................51.3Gross domestic product (PPP, US$) per capita, 2007 ...........................15,532.2Real GDP growth (percent), 2007...................................................................5.6
Environmental Performance Index, 2008 (out of 149 countries).....................20
Travel & Tourism indicators
T&T industry, 2008 estimatesGDP (US$ millions) .............................................................6,904.................12.1 ....................6.6Employment (1,000 jobs).......................................................159.................13.6 ....................2.5
T&T economy, 2008 estimatesGDP (US$ millions) ...........................................................14,557.................25.5 ....................7.1Employment (1,000 jobs).......................................................336.................28.7 ....................3.0
Source: World Travel & Tourism Council, TSA Research 2008
International tourist arrivals (thousands), 2007...................9,307International tourism receipts (US$ millions), 2007 ...........9,254
Source: United Nations World Tourism Organization
Travel & Tourism Competitiveness Index
2009 Index......................................................................................................34 4.52008 Index............................................................................................................34 4.6T&T regulatory framework ..............................................................................43 5.0
Policy rules and regulations..........................................................................80 4.2Environmental sustainability..........................................................................39 4.9Safety and security .........................................................................................42 5.7Health and hygiene .........................................................................................33 6.0Prioritization of Travel & Tourism..................................................................64 4.4
T&T business environment and infrastructure ............................................37 4.3Air transport infrastructure ..........................................................................69 3.0Ground transport infrastructure....................................................................54 3.9Tourism infrastructure ......................................................................................6 6.6ICT infrastructure ............................................................................................38 4.0Price competitiveness in the T&T industry...............................................103 4.1
T&T human, cultural, and natural resources ...............................................43 4.3Human resources ............................................................................................53 5.2
Education and training .............................................................................58 4.8Availability of qualified labor...................................................................60 5.5
Affinity for Travel & Tourism ............................................................................9 5.8Natural resources ...........................................................................................69 3.1Cultural resources...........................................................................................41 3.0
Note: For descriptions of variables and detailed sources, please refer to “How to the Read Country/Economy Profiles.”
Rank Score(out of 133) (1–7 scale)
International tourist arrivals (thousands)
International tourism receipts (US$ millions)
1995 1996 1997 1998 1999 2000 2001 2002 2003 2004 2005 2006 20070
2,000
4,000
6,000
8,000
10,000
1 2 3 4 5 6 7
2009–2018Percent annual growth of total (%, forecast)
part2A_profiles.r2 2/26/09 4:01 AM Page 174
The Travel & Tourism Competitiveness Report 2009 © 2009 World Economic Forum

175
2.1:
Cou
ntry
/Eco
nom
y Pr
ofile
s
The Travel & Tourism Competitiveness Index in detail ■ Competitive Advantage ■ Competitive Disadvantage
INDICATOR RANK/133
1st pillar: Policy rules and regulations1.01 Prevalence of foreign ownership .................................82 ...■1.02 Property rights..............................................................84 ...■1.03 Business impact of rules on FDI ................................117 ...■1.04 Visa requirements* ......................................................36 ...■1.05 Openness of bilateral Air Service Agreements* ..........46 ...■1.06 Transparency of government policymaking..................90 ...■1.07 Time required to start a business*.............................100 ...■1.08 Cost to start a business* .............................................68 ...■
2nd pillar: Environmental sustainability2.01 Stringency of environmental regulation .......................53 ...■2.02 Enforcement of environmental regulation....................61 ...■2.03 Sustainability of T&T industry development.................82 ...■2.04 Carbon dioxide emissions* ..........................................77 ...■2.05 Particulate matter concentration* ................................50 ...■2.06 Threatened species* ....................................................69 ...■2.07 Environmental treaty ratification*.................................34 ...■
3rd pillar: Safety and security3.01 Business costs of terrorism .........................................39 ...■3.02 Reliability of police services .........................................53 ...■3.03 Business costs of crime and violence..........................49 ...■3.04 Road traffic accidents*.................................................42 ...■
4th pillar: Health and hygiene4.01 Physician density*........................................................41 ...■4.02 Access to improved sanitation* ...................................34 ...■4.03 Access to improved drinking water*............................38 ...■4.04 Hospital beds*..............................................................30 ...■
5th pillar: Prioritization of Travel & Tourism5.01 Government prioritization of the T&T industry.............44 ...■5.02 T&T government expenditure* ..................................110 ...■5.03 Effectiveness of marketing and branding.....................73 ...■5.04 T&T fair attendance*....................................................25 ...■
6th pillar: Air transport infrastructure6.01 Quality of air transport infrastructure ...........................81 ...■6.02 Available seat kilometers, domestic*...........................57 ...■6.03 Available seat kilometers, international* ......................91 ...■6.04 Departures per 1,000 population*................................51 ...■6.05 Airport density* ............................................................26 ...■6.06 Number of operating airlines*......................................55 ...■6.07 International air transport network ...............................99 ...■
7th pillar: Ground transport infrastructure7.01 Quality of roads ............................................................34 ...■7.02 Quality of railroad infrastructure...................................45 ...■7.03 Quality of port infrastructure ........................................90 ...■7.04 Quality of ground transport network ............................44 ...■7.05 Road density*...............................................................51 ...■
INDICATOR RANK/133
8th pillar: Tourism infrastructure8.01 Hotel rooms*................................................................11 ...■8.02 Presence of major car rental companies*......................1 ...■8.03 ATMs accepting Visa cards* ........................................19 ...■
9th pillar: ICT infrastructure9.01 Extent of business Internet use...................................66 ...■9.02 Internet users* .............................................................35 ...■9.03 Telephone lines*...........................................................31 ...■9.04 Broadband Internet subscribers* .................................38 ...■9.05 Mobile telephone subscribers*....................................27 ...■
10th pillar: Price competitiveness in the T&T industry10.01 Ticket taxes and airport charges*.................................75 ...■10.02 Purchasing power parity*.............................................99 ...■10.03 Extent and effect of taxation........................................96 ...■10.04 Fuel price levels* .......................................................100 ...■10.05 Hotel price index* ........................................................75 ...■
11th pillar: Human resources11.01 Primary education enrollment* ....................................82 ...■11.02 Secondary education enrollment*................................55 ...■11.03 Quality of the educational system................................66 ...■11.04 Local availability of research and training services.......47 ...■11.05 Extent of staff training..................................................64 ...■11.06 Hiring and firing practices.............................................68 ...■11.07 Ease of hiring foreign labor ........................................105 ...■11.08 HIV prevalence* .............................................................1 ...■11.09 Business impact of HIV/AIDS.........................................6 ...■11.10 Life expectancy* ..........................................................40 ...■
12th pillar: Affinity for Travel & Tourism12.01 Tourism openness* ........................................................6 ...■12.02 Attitude of population toward foreign visitors..............59 ...■12.03 Extension of business trips recommended ...............123 ...■
13th pillar: Natural resources13.01 Number of World Heritage natural sites* ....................40 ...■13.02 Protected areas* ..........................................................83 ...■13.03 Quality of the natural environment...............................16 ...■13.04 Total known species*...................................................84 ...■
14th pillar: Cultural resources14.01 Number of World Heritage cultural sites* ...................33 ...■14.02 Sports stadiums* .........................................................32 ...■14.03 Number of international fairs and exhibitions* ............44 ...■14.04 Creative industries exports*.........................................45 ...■
Croatia
* Hard data
Note: For further details and explanation, please refer to the section “How toRead the Country/Economy Profiles” at the beginning of this chapter.
part2A_profiles.r2 2/26/09 4:01 AM Page 175
The Travel & Tourism Competitiveness Report 2009 © 2009 World Economic Forum

176
2.1:
Cou
ntry
/Eco
nom
y Pr
ofile
s
CyprusKey indicatorsPopulation (millions), 2007..............................................................................0.8Surface area (1,000 square kilometers) ..........................................................9.3
Gross domestic product (US$ billions), 2007 ...............................................21.3Gross domestic product (PPP, US$) per capita, 2007 ...........................27,170.7Real GDP growth (percent), 2007...................................................................4.4
Environmental Performance Index, 2008 (out of 149 countries).....................52
Travel & Tourism indicators
T&T industry, 2008 estimatesGDP (US$ millions) .............................................................2,280...................9.6 ....................4.7Employment (1,000 jobs).........................................................55.................13.5 ....................1.3
T&T economy, 2008 estimatesGDP (US$ millions) .............................................................5,077.................21.4 ....................4.5Employment (1,000 jobs).......................................................110.................27.2 ....................1.2
Source: World Travel & Tourism Council, TSA Research 2008
International tourist arrivals (thousands), 2007...................2,416International tourism receipts (US$ millions), 2007 ...........2,685
Source: United Nations World Tourism Organization
Travel & Tourism Competitiveness Index
2009 Index......................................................................................................21 4.92008 Index............................................................................................................24 4.9T&T regulatory framework ..............................................................................25 5.4
Policy rules and regulations..........................................................................69 4.4Environmental sustainability..........................................................................43 4.8Safety and security .........................................................................................12 6.2Health and hygiene .........................................................................................45 5.6Prioritization of Travel & Tourism..................................................................11 5.7
T&T business environment and infrastructure ............................................13 5.0Air transport infrastructure ..........................................................................21 4.7Ground transport infrastructure....................................................................19 5.3Tourism infrastructure ......................................................................................8 6.6ICT infrastructure ............................................................................................32 4.3Price competitiveness in the T&T industry.................................................82 4.4
T&T human, cultural, and natural resources ...............................................37 4.4Human resources ............................................................................................27 5.6
Education and training .............................................................................22 5.5Availability of qualified labor...................................................................28 5.7
Affinity for Travel & Tourism ............................................................................5 6.4Natural resources .........................................................................................111 2.4Cultural resources...........................................................................................38 3.1
Note: For descriptions of variables and detailed sources, please refer to “How to the Read Country/Economy Profiles.”
Rank Score(out of 133) (1–7 scale)
International tourist arrivals (thousands)
International tourism receipts (US$ millions)
1995 1996 1997 1998 1999 2000 2001 2002 2003 2004 2005 2006 20071,500
2,000
2,500
3,000
1 2 3 4 5 6 7
2009–2018Percent annual growth of total (%, forecast)
part2A_profiles.r2 2/26/09 4:01 AM Page 176
The Travel & Tourism Competitiveness Report 2009 © 2009 World Economic Forum

177
2.1:
Cou
ntry
/Eco
nom
y Pr
ofile
s
The Travel & Tourism Competitiveness Index in detail ■ Competitive Advantage ■ Competitive Disadvantage
INDICATOR RANK/133
1st pillar: Policy rules and regulations1.01 Prevalence of foreign ownership .................................66 ...■1.02 Property rights..............................................................29 ...■1.03 Business impact of rules on FDI ..................................32 ...■1.04 Visa requirements* ......................................................40 ...■1.05 Openness of bilateral Air Service Agreements* ........118 ...■1.06 Transparency of government policymaking..................32 ...■1.07 Time required to start a business*..............................n/a ......1.08 Cost to start a business*.............................................n/a ......
2nd pillar: Environmental sustainability2.01 Stringency of environmental regulation .......................48 ...■2.02 Enforcement of environmental regulation....................44 ...■2.03 Sustainability of T&T industry development.................45 ...■2.04 Carbon dioxide emissions* ........................................100 ...■2.05 Particulate matter concentration* ................................82 ...■2.06 Threatened species* ....................................................44 ...■2.07 Environmental treaty ratification*.................................21 ...■
3rd pillar: Safety and security3.01 Business costs of terrorism .........................................26 ...■3.02 Reliability of police services .........................................30 ...■3.03 Business costs of crime and violence..........................12 ...■3.04 Road traffic accidents*.................................................18 ...■
4th pillar: Health and hygiene4.01 Physician density*........................................................47 ...■4.02 Access to improved sanitation* .....................................1 ...■4.03 Access to improved drinking water*..............................1 ...■4.04 Hospital beds*..............................................................46 ...■
5th pillar: Prioritization of Travel & Tourism5.01 Government prioritization of the T&T industry.............22 ...■5.02 T&T government expenditure* ....................................11 ...■5.03 Effectiveness of marketing and branding.....................28 ...■5.04 T&T fair attendance*....................................................41 ...■
6th pillar: Air transport infrastructure6.01 Quality of air transport infrastructure ...........................44 ...■6.02 Available seat kilometers, domestic*...........................90 ...■6.03 Available seat kilometers, international* ......................60 ...■6.04 Departures per 1,000 population*................................14 ...■6.05 Airport density* ............................................................11 ...■6.06 Number of operating airlines*......................................36 ...■6.07 International air transport network ...............................53 ...■
7th pillar: Ground transport infrastructure7.01 Quality of roads ............................................................15 ...■7.02 Quality of railroad infrastructure ..................................n/a ......7.03 Quality of port infrastructure ........................................26 ...■7.04 Quality of ground transport network ............................83 ...■7.05 Road density*...............................................................27 ...■
INDICATOR RANK/133
8th pillar: Tourism infrastructure8.01 Hotel rooms*..................................................................1 ...■8.02 Presence of major car rental companies*....................23 ...■8.03 ATMs accepting Visa cards* ........................................14 ...■
9th pillar: ICT infrastructure9.01 Extent of business Internet use...................................42 ...■9.02 Internet users* .............................................................34 ...■9.03 Telephone lines*...........................................................21 ...■9.04 Broadband Internet subscribers* .................................35 ...■9.05 Mobile telephone subscribers*....................................18 ...■
10th pillar: Price competitiveness in the T&T industry10.01 Ticket taxes and airport charges*.................................55 ...■10.02 Purchasing power parity*...........................................108 ...■10.03 Extent and effect of taxation........................................14 ...■10.04 Fuel price levels* .........................................................97 ...■10.05 Hotel price index* ........................................................67 ...■
11th pillar: Human resources11.01 Primary education enrollment* ....................................10 ...■11.02 Secondary education enrollment*................................37 ...■11.03 Quality of the educational system................................10 ...■11.04 Local availability of research and training services.......49 ...■11.05 Extent of staff training..................................................56 ...■11.06 Hiring and firing practices.............................................82 ...■11.07 Ease of hiring foreign labor ..........................................88 ...■11.08 HIV prevalence* ...........................................................49 ...■11.09 Business impact of HIV/AIDS.......................................12 ...■11.10 Life expectancy* ..........................................................12 ...■
12th pillar: Affinity for Travel & Tourism12.01 Tourism openness* ........................................................7 ...■12.02 Attitude of population toward foreign visitors..............21 ...■12.03 Extension of business trips recommended .................14 ...■
13th pillar: Natural resources13.01 Number of World Heritage natural sites* ....................74 ...■13.02 Protected areas* ..........................................................96 ...■13.03 Quality of the natural environment...............................33 ...■13.04 Total known species*.................................................121 ...■
14th pillar: Cultural resources14.01 Number of World Heritage cultural sites* ...................65 ...■14.02 Sports stadiums* ...........................................................6 ...■14.03 Number of international fairs and exhibitions* ............51 ...■14.04 Creative industries exports*.........................................89 ...■
Cyprus
* Hard data
Note: For further details and explanation, please refer to the section “How toRead the Country/Economy Profiles” at the beginning of this chapter.
part2A_profiles.r2 2/26/09 4:01 AM Page 177
The Travel & Tourism Competitiveness Report 2009 © 2009 World Economic Forum

178
2.1:
Cou
ntry
/Eco
nom
y Pr
ofile
s
Czech RepublicKey indicatorsPopulation (millions), 2007............................................................................10.2Surface area (1,000 square kilometers) ........................................................78.9
Gross domestic product (US$ billions), 2007 .............................................175.0Gross domestic product (PPP, US$) per capita, 2007 ...........................24,229.2Real GDP growth (percent), 2007...................................................................6.6
Environmental Performance Index, 2008 (out of 149 countries).....................68
Travel & Tourism indicators
T&T industry, 2008 estimatesGDP (US$ millions) .............................................................3,474...................1.6 ....................4.0Employment (1,000 jobs).........................................................86...................1.7 ..................–0.6
T&T economy, 2008 estimatesGDP (US$ millions) ...........................................................22,019.................10.4 ....................6.0Employment (1,000 jobs).......................................................478...................9.6 ....................1.1
Source: World Travel & Tourism Council, TSA Research 2008
International tourist arrivals (thousands), 2007...................6,680International tourism receipts (US$ millions), 2007 ...........6,618
Source: United Nations World Tourism Organization
Travel & Tourism Competitiveness Index
2009 Index......................................................................................................26 4.92008 Index............................................................................................................30 4.8T&T regulatory framework ..............................................................................16 5.5
Policy rules and regulations..........................................................................46 4.8Environmental sustainability..........................................................................23 5.2Safety and security .........................................................................................44 5.6Health and hygiene ...........................................................................................6 6.8Prioritization of Travel & Tourism..................................................................32 5.1
T&T business environment and infrastructure ............................................36 4.4Air transport infrastructure ..........................................................................50 3.5Ground transport infrastructure....................................................................25 4.9Tourism infrastructure ....................................................................................24 5.1ICT infrastructure ............................................................................................29 4.4Price competitiveness in the T&T industry.................................................97 4.2
T&T human, cultural, and natural resources ...............................................24 4.7Human resources ............................................................................................28 5.5
Education and training .............................................................................28 5.4Availability of qualified labor...................................................................39 5.6
Affinity for Travel & Tourism ..........................................................................59 4.9Natural resources ...........................................................................................84 2.9Cultural resources...........................................................................................17 5.4
Note: For descriptions of variables and detailed sources, please refer to “How to the Read Country/Economy Profiles.”
Rank Score(out of 133) (1–7 scale)
International tourist arrivals (thousands)
International tourism receipts (US$ millions)
1995 1996 1997 1998 1999 2000 2001 2002 2003 2004 2005 2006 20072,000
3,000
4,000
5,000
6,000
7,000
8,000
1 2 3 4 5 6 7
2009–2018Percent annual growth of total (%, forecast)
part2A_profiles.r2 2/26/09 4:01 AM Page 178
The Travel & Tourism Competitiveness Report 2009 © 2009 World Economic Forum

179
2.1:
Cou
ntry
/Eco
nom
y Pr
ofile
s
The Travel & Tourism Competitiveness Index in detail ■ Competitive Advantage ■ Competitive Disadvantage
INDICATOR RANK/133
1st pillar: Policy rules and regulations1.01 Prevalence of foreign ownership .................................52 ...■1.02 Property rights..............................................................63 ...■1.03 Business impact of rules on FDI ..................................25 ...■1.04 Visa requirements* ......................................................40 ...■1.05 Openness of bilateral Air Service Agreements* ..........32 ...■1.06 Transparency of government policymaking................104 ...■1.07 Time required to start a business*...............................41 ...■1.08 Cost to start a business* .............................................63 ...■
2nd pillar: Environmental sustainability2.01 Stringency of environmental regulation .......................15 ...■2.02 Enforcement of environmental regulation....................28 ...■2.03 Sustainability of T&T industry development.................81 ...■2.04 Carbon dioxide emissions* ........................................112 ...■2.05 Particulate matter concentration* ................................31 ...■2.06 Threatened species* ....................................................16 ...■2.07 Environmental treaty ratification*.................................34 ...■
3rd pillar: Safety and security3.01 Business costs of terrorism .........................................13 ...■3.02 Reliability of police services .........................................91 ...■3.03 Business costs of crime and violence..........................36 ...■3.04 Road traffic accidents*.................................................54 ...■
4th pillar: Health and hygiene4.01 Physician density*........................................................20 ...■4.02 Access to improved sanitation* ...................................34 ...■4.03 Access to improved drinking water*..............................1 ...■4.04 Hospital beds*................................................................5 ...■
5th pillar: Prioritization of Travel & Tourism5.01 Government prioritization of the T&T industry.............75 ...■5.02 T&T government expenditure* ....................................58 ...■5.03 Effectiveness of marketing and branding.....................72 ...■5.04 T&T fair attendance*......................................................3 ...■
6th pillar: Air transport infrastructure6.01 Quality of air transport infrastructure ...........................45 ...■6.02 Available seat kilometers, domestic*...........................75 ...■6.03 Available seat kilometers, international* ......................55 ...■6.04 Departures per 1,000 population*................................43 ...■6.05 Airport density* ............................................................77 ...■6.06 Number of operating airlines*......................................29 ...■6.07 International air transport network ...............................35 ...■
7th pillar: Ground transport infrastructure7.01 Quality of roads ............................................................81 ...■7.02 Quality of railroad infrastructure...................................23 ...■7.03 Quality of port infrastructure ........................................61 ...■7.04 Quality of ground transport network ............................16 ...■7.05 Road density*...............................................................19 ...■
INDICATOR RANK/133
8th pillar: Tourism infrastructure8.01 Hotel rooms*................................................................24 ...■8.02 Presence of major car rental companies*......................1 ...■8.03 ATMs accepting Visa cards* ........................................42 ...■
9th pillar: ICT infrastructure9.01 Extent of business Internet use...................................19 ...■9.02 Internet users* .............................................................37 ...■9.03 Telephone lines*...........................................................47 ...■9.04 Broadband Internet subscribers* .................................30 ...■9.05 Mobile telephone subscribers*....................................11 ...■
10th pillar: Price competitiveness in the T&T industry10.01 Ticket taxes and airport charges*.................................80 ...■10.02 Purchasing power parity*.............................................91 ...■10.03 Extent and effect of taxation........................................61 ...■10.04 Fuel price levels* .......................................................111 ...■10.05 Hotel price index* ........................................................84 ...■
11th pillar: Human resources11.01 Primary education enrollment* ....................................69 ...■11.02 Secondary education enrollment*................................41 ...■11.03 Quality of the educational system................................26 ...■11.04 Local availability of research and training services.......23 ...■11.05 Extent of staff training..................................................28 ...■11.06 Hiring and firing practices.............................................99 ...■11.07 Ease of hiring foreign labor ..........................................34 ...■11.08 HIV prevalence* ...........................................................22 ...■11.09 Business impact of HIV/AIDS.......................................53 ...■11.10 Life expectancy* ..........................................................37 ...■
12th pillar: Affinity for Travel & Tourism12.01 Tourism openness* ......................................................52 ...■12.02 Attitude of population toward foreign visitors..............72 ...■12.03 Extension of business trips recommended .................66 ...■
13th pillar: Natural resources13.01 Number of World Heritage natural sites* ....................74 ...■13.02 Protected areas* ..........................................................35 ...■13.03 Quality of the natural environment...............................82 ...■13.04 Total known species*.................................................101 ...■
14th pillar: Cultural resources14.01 Number of World Heritage cultural sites* ...................12 ...■14.02 Sports stadiums* .........................................................29 ...■14.03 Number of international fairs and exhibitions* ............24 ...■14.04 Creative industries exports*.........................................24 ...■
Czech Republic
* Hard data
Note: For further details and explanation, please refer to the section “How toRead the Country/Economy Profiles” at the beginning of this chapter.
part2A_profiles.r2 2/26/09 4:01 AM Page 179
The Travel & Tourism Competitiveness Report 2009 © 2009 World Economic Forum

180
2.1:
Cou
ntry
/Eco
nom
y Pr
ofile
s
DenmarkKey indicatorsPopulation (millions), 2007..............................................................................5.5Surface area (1,000 square kilometers) ........................................................43.1
Gross domestic product (US$ billions), 2007 .............................................312.0Gross domestic product (PPP, US$) per capita, 2007 ...........................37,265.0Real GDP growth (percent), 2007...................................................................1.7
Environmental Performance Index, 2008 (out of 149 countries).....................25
Travel & Tourism indicators
T&T industry, 2008 estimatesGDP (US$ millions) ...........................................................10,987...................3.2 ....................3.2Employment (1,000 jobs).........................................................89...................3.2 ....................0.7
T&T economy, 2008 estimatesGDP (US$ millions) ...........................................................29,273...................8.5 ....................2.9Employment (1,000 jobs).......................................................238...................8.5 ....................0.3
Source: World Travel & Tourism Council, TSA Research 2008
International tourist arrivals (thousands), 2006...................4,716International tourism receipts (US$ millions), 2007 ...........6,220
Source: United Nations World Tourism Organization
Travel & Tourism Competitiveness Index
2009 Index......................................................................................................14 5.12008 Index............................................................................................................13 5.1T&T regulatory framework ..............................................................................10 5.6
Policy rules and regulations............................................................................4 5.6Environmental sustainability............................................................................3 5.8Safety and security ...........................................................................................4 6.5Health and hygiene .........................................................................................28 6.1Prioritization of Travel & Tourism..................................................................91 4.0
T&T business environment and infrastructure ............................................10 5.1Air transport infrastructure ..........................................................................12 5.1Ground transport infrastructure......................................................................6 6.3Tourism infrastructure ....................................................................................23 5.2ICT infrastructure ..............................................................................................4 5.8Price competitiveness in the T&T industry...............................................131 3.0
T&T human, cultural, and natural resources ...............................................28 4.6Human resources ..............................................................................................2 6.2
Education and training ...............................................................................2 6.2Availability of qualified labor.....................................................................5 6.2
Affinity for Travel & Tourism ..........................................................................72 4.7Natural resources ...........................................................................................77 3.0Cultural resources...........................................................................................26 4.4
Note: For descriptions of variables and detailed sources, please refer to “How to the Read Country/Economy Profiles.”
Rank Score(out of 133) (1–7 scale)
International tourist arrivals (thousands)
International tourism receipts (US$ millions)
1995 1996 1997 1998 1999 2000 2001 2002 2003 2004 2005 2006 20072,000
3,000
4,000
5,000
6,000
7,000
8,000
1 2 3 4 5 6 7
2009–2018Percent annual growth of total (%, forecast)
part2A_profiles.r2 2/26/09 4:01 AM Page 180
The Travel & Tourism Competitiveness Report 2009 © 2009 World Economic Forum

181
2.1:
Cou
ntry
/Eco
nom
y Pr
ofile
s
The Travel & Tourism Competitiveness Index in detail ■ Competitive Advantage ■ Competitive Disadvantage
INDICATOR RANK/133
1st pillar: Policy rules and regulations1.01 Prevalence of foreign ownership .................................17 ...■1.02 Property rights................................................................2 ...■1.03 Business impact of rules on FDI ..................................24 ...■1.04 Visa requirements* ......................................................40 ...■1.05 Openness of bilateral Air Service Agreements* ..........18 ...■1.06 Transparency of government policymaking....................4 ...■1.07 Time required to start a business*.................................9 ...■1.08 Cost to start a business* ...............................................1 ...■
2nd pillar: Environmental sustainability2.01 Stringency of environmental regulation .........................2 ...■2.02 Enforcement of environmental regulation......................3 ...■2.03 Sustainability of T&T industry development.................33 ...■2.04 Carbon dioxide emissions* ........................................105 ...■2.05 Particulate matter concentration* ................................19 ...■2.06 Threatened species* ......................................................4 ...■2.07 Environmental treaty ratification*.................................10 ...■
3rd pillar: Safety and security3.01 Business costs of terrorism .........................................41 ...■3.02 Reliability of police services ...........................................2 ...■3.03 Business costs of crime and violence............................8 ...■3.04 Road traffic accidents*.................................................37 ...■
4th pillar: Health and hygiene4.01 Physician density*........................................................19 ...■4.02 Access to improved sanitation* .....................................1 ...■4.03 Access to improved drinking water*..............................1 ...■4.04 Hospital beds*..............................................................46 ...■
5th pillar: Prioritization of Travel & Tourism5.01 Government prioritization of the T&T industry.............62 ...■5.02 T&T government expenditure* ....................................89 ...■5.03 Effectiveness of marketing and branding.....................36 ...■5.04 T&T fair attendance*....................................................98 ...■
6th pillar: Air transport infrastructure6.01 Quality of air transport infrastructure .............................7 ...■6.02 Available seat kilometers, domestic*...........................44 ...■6.03 Available seat kilometers, international* ......................39 ...■6.04 Departures per 1,000 population*................................13 ...■6.05 Airport density* ............................................................25 ...■6.06 Number of operating airlines*......................................21 ...■6.07 International air transport network ...............................10 ...■
7th pillar: Ground transport infrastructure7.01 Quality of roads ..............................................................7 ...■7.02 Quality of railroad infrastructure...................................14 ...■7.03 Quality of port infrastructure ..........................................5 ...■7.04 Quality of ground transport network ..............................7 ...■7.05 Road density*...............................................................16 ...■
INDICATOR RANK/133
8th pillar: Tourism infrastructure8.01 Hotel rooms*................................................................36 ...■8.02 Presence of major car rental companies*....................23 ...■8.03 ATMs accepting Visa cards* ........................................21 ...■
9th pillar: ICT infrastructure9.01 Extent of business Internet use.....................................5 ...■9.02 Internet users* .............................................................16 ...■9.03 Telephone lines*...........................................................14 ...■9.04 Broadband Internet subscribers* ...................................1 ...■9.05 Mobile telephone subscribers*....................................23 ...■
10th pillar: Price competitiveness in the T&T industry10.01 Ticket taxes and airport charges*.................................96 ...■10.02 Purchasing power parity*...........................................131 ...■10.03 Extent and effect of taxation......................................123 ...■10.04 Fuel price levels* .......................................................125 ...■10.05 Hotel price index* ........................................................79 ...■
11th pillar: Human resources11.01 Primary education enrollment* ....................................47 ...■11.02 Secondary education enrollment*..................................3 ...■11.03 Quality of the educational system..................................6 ...■11.04 Local availability of research and training services.........6 ...■11.05 Extent of staff training....................................................1 ...■11.06 Hiring and firing practices...............................................1 ...■11.07 Ease of hiring foreign labor ..........................................38 ...■11.08 HIV prevalence* ...........................................................49 ...■11.09 Business impact of HIV/AIDS.........................................9 ...■11.10 Life expectancy* ..........................................................22 ...■
12th pillar: Affinity for Travel & Tourism12.01 Tourism openness* ......................................................69 ...■12.02 Attitude of population toward foreign visitors..............56 ...■12.03 Extension of business trips recommended .................90 ...■
13th pillar: Natural resources13.01 Number of World Heritage natural sites* ....................40 ...■13.02 Protected areas* ..........................................................98 ...■13.03 Quality of the natural environment...............................11 ...■13.04 Total known species*.................................................107 ...■
14th pillar: Cultural resources14.01 Number of World Heritage cultural sites* ...................65 ...■14.02 Sports stadiums* .........................................................21 ...■14.03 Number of international fairs and exhibitions* ............23 ...■14.04 Creative industries exports*.........................................26 ...■
Denmark
* Hard data
Note: For further details and explanation, please refer to the section “How toRead the Country/Economy Profiles” at the beginning of this chapter.
part2A_profiles.r2 2/26/09 4:01 AM Page 181
The Travel & Tourism Competitiveness Report 2009 © 2009 World Economic Forum

182
2.1:
Cou
ntry
/Eco
nom
y Pr
ofile
s
Dominican RepublicKey indicatorsPopulation (millions), 2007..............................................................................9.1Surface area (1,000 square kilometers) ........................................................48.7
Gross domestic product (US$ billions), 2007 ...............................................41.0Gross domestic product (PPP, US$) per capita, 2007 .............................8,116.5Real GDP growth (percent), 2007...................................................................8.5
Environmental Performance Index, 2008 (out of 149 countries).....................33
Travel & Tourism indicators
T&T industry, 2008 estimatesGDP (US$ millions) .............................................................2,325...................5.3 ....................3.7Employment (1,000 jobs).......................................................178...................4.7 ....................3.1
T&T economy, 2008 estimatesGDP (US$ millions) .............................................................7,325.................16.6 ....................3.7Employment (1,000 jobs).......................................................550.................14.4 ....................3.1
Source: World Travel & Tourism Council, TSA Research 2008
International tourist arrivals (thousands), 2007...................3,980International tourism receipts (US$ millions), 2007 ...........4,026
Source: United Nations World Tourism Organization
Travel & Tourism Competitiveness Index
2009 Index......................................................................................................67 4.02008 Index............................................................................................................63 4.0T&T regulatory framework ..............................................................................54 4.8
Policy rules and regulations..........................................................................26 5.1Environmental sustainability........................................................................108 4.0Safety and security .......................................................................................101 4.5Health and hygiene .........................................................................................68 4.5Prioritization of Travel & Tourism..................................................................13 5.6
T&T business environment and infrastructure ............................................71 3.5Air transport infrastructure ..........................................................................47 3.7Ground transport infrastructure....................................................................99 2.8Tourism infrastructure ....................................................................................51 3.8ICT infrastructure ............................................................................................83 2.4Price competitiveness in the T&T industry.................................................81 4.5
T&T human, cultural, and natural resources ...............................................68 3.9Human resources ............................................................................................92 4.8
Education and training ...........................................................................108 3.8Availability of qualified labor...................................................................19 5.8
Affinity for Travel & Tourism ..........................................................................14 5.6Natural resources ...........................................................................................55 3.5Cultural resources...........................................................................................95 1.7
Note: For descriptions of variables and detailed sources, please refer to “How to the Read Country/Economy Profiles.”
Rank Score(out of 133) (1–7 scale)
International tourist arrivals (thousands)
International tourism receipts (US$ millions)
1995 1996 1997 1998 1999 2000 2001 2002 2003 2004 2005 2006 20071,000
2,000
3,000
4,000
5,000
1 2 3 4 5 6 7
2009–2018Percent annual growth of total (%, forecast)
part2A_profiles.r2 2/26/09 4:01 AM Page 182
The Travel & Tourism Competitiveness Report 2009 © 2009 World Economic Forum

183
2.1:
Cou
ntry
/Eco
nom
y Pr
ofile
s
The Travel & Tourism Competitiveness Index in detail ■ Competitive Advantage ■ Competitive Disadvantage
INDICATOR RANK/133 ........
1st pillar: Policy rules and regulations1.01 Prevalence of foreign ownership .................................36 ...■1.02 Property rights..............................................................90 ...■1.03 Business impact of rules on FDI ..................................67 ...■1.04 Visa requirements* ........................................................7 ...■1.05 Openness of bilateral Air Service Agreements* ............4 ...■1.06 Transparency of government policymaking..................80 ...■1.07 Time required to start a business*...............................57 ...■1.08 Cost to start a business* .............................................83 ...■
2nd pillar: Environmental sustainability2.01 Stringency of environmental regulation .....................110 ...■2.02 Enforcement of environmental regulation..................121 ...■2.03 Sustainability of T&T industry development.................56 ...■2.04 Carbon dioxide emissions* ..........................................53 ...■2.05 Particulate matter concentration* ................................34 ...■2.06 Threatened species* ..................................................127 ...■2.07 Environmental treaty ratification*.................................94 ...■
3rd pillar: Safety and security3.01 Business costs of terrorism .........................................49 ...■3.02 Reliability of police services .......................................128 ...■3.03 Business costs of crime and violence........................116 ...■3.04 Road traffic accidents*.................................................72 ...■
4th pillar: Health and hygiene4.01 Physician density*........................................................60 ...■4.02 Access to improved sanitation* ...................................78 ...■4.03 Access to improved drinking water*............................62 ...■4.04 Hospital beds*..............................................................82 ...■
5th pillar: Prioritization of Travel & Tourism5.01 Government prioritization of the T&T industry.............28 ...■5.02 T&T government expenditure* ......................................1 ...■5.03 Effectiveness of marketing and branding.....................25 ...■5.04 T&T fair attendance*....................................................62 ...■
6th pillar: Air transport infrastructure6.01 Quality of air transport infrastructure ...........................37 ...■6.02 Available seat kilometers, domestic*...........................88 ...■6.03 Available seat kilometers, international* ......................46 ...■6.04 Departures per 1,000 population*...............................n/a ......6.05 Airport density* ............................................................64 ...■6.06 Number of operating airlines*......................................39 ...■6.07 International air transport network ...............................32 ...■
7th pillar: Ground transport infrastructure7.01 Quality of roads ............................................................64 ...■7.02 Quality of railroad infrastructure.................................109 ...■7.03 Quality of port infrastructure ........................................74 ...■7.04 Quality of ground transport network..........................114 ...■7.05 Road density*...............................................................69 ...■
INDICATOR RANK/133 ........
8th pillar: Tourism infrastructure8.01 Hotel rooms*................................................................40 ...■8.02 Presence of major car rental companies*....................23 ...■8.03 ATMs accepting Visa cards* ........................................67 ...■
9th pillar: ICT infrastructure9.01 Extent of business Internet use...................................76 ...■9.02 Internet users* .............................................................76 ...■9.03 Telephone lines*...........................................................94 ...■9.04 Broadband Internet subscribers* .................................71 ...■9.05 Mobile telephone subscribers*....................................86 ...■
10th pillar: Price competitiveness in the T&T industry10.01 Ticket taxes and airport charges*...............................122 ...■10.02 Purchasing power parity*.............................................64 ...■10.03 Extent and effect of taxation......................................124 ...■10.04 Fuel price levels* .........................................................51 ...■10.05 Hotel price index* ........................................................21 ...■
11th pillar: Human resources11.01 Primary education enrollment* ..................................113 ...■11.02 Secondary education enrollment*................................96 ...■11.03 Quality of the educational system..............................130 ...■11.04 Local availability of research and training services.......89 ...■11.05 Extent of staff training..................................................78 ...■11.06 Hiring and firing practices.............................................37 ...■11.07 Ease of hiring foreign labor ............................................7 ...■11.08 HIV prevalence* .........................................................102 ...■11.09 Business impact of HIV/AIDS.....................................112 ...■11.10 Life expectancy* ..........................................................83 ...■
12th pillar: Affinity for Travel & Tourism12.01 Tourism openness* ......................................................18 ...■12.02 Attitude of population toward foreign visitors..............28 ...■12.03 Extension of business trips recommended .................44 ...■
13th pillar: Natural resources13.01 Number of World Heritage natural sites* ....................74 ...■13.02 Protected areas* ............................................................7 ...■13.03 Quality of the natural environment...............................85 ...■13.04 Total known species*.................................................113 ...■
14th pillar: Cultural resources14.01 Number of World Heritage cultural sites* ...................65 ...■14.02 Sports stadiums* .........................................................91 ...■14.03 Number of international fairs and exhibitions* ............62 ...■14.04 Creative industries exports*.......................................118 ...■
Dominican Republic
* Hard data
Note: For further details and explanation, please refer to the section “How toRead the Country/Economy Profiles” at the beginning of this chapter.
part2A_profiles.r2 2/26/09 4:01 AM Page 183
The Travel & Tourism Competitiveness Report 2009 © 2009 World Economic Forum

184
2.1:
Cou
ntry
/Eco
nom
y Pr
ofile
s
EcuadorKey indicatorsPopulation (millions), 2007............................................................................13.6Surface area (1,000 square kilometers) ......................................................283.6
Gross domestic product (US$ billions), 2007 ...............................................45.8Gross domestic product (PPP, US$) per capita, 2007 .............................7,242.1Real GDP growth (percent), 2007...................................................................2.5
Environmental Performance Index, 2008 (out of 149 countries).....................22
Travel & Tourism indicators
T&T industry, 2008 estimatesGDP (US$ millions) ................................................................824...................1.7 ....................4.2Employment (1,000 jobs).........................................................96...................1.5 ....................3.4
T&T economy, 2008 estimatesGDP (US$ millions) .............................................................3,839...................8.1 ....................3.3Employment (1,000 jobs).......................................................429...................6.9 ....................2.5
Source: World Travel & Tourism Council, TSA Research 2008
International tourist arrivals (thousands), 2007......................937International tourism receipts (US$ millions), 2007 ..............623
Source: United Nations World Tourism Organization
Travel & Tourism Competitiveness Index
2009 Index......................................................................................................96 3.62008 Index............................................................................................................86 3.7T&T regulatory framework ............................................................................103 4.0
Policy rules and regulations........................................................................126 3.2Environmental sustainability..........................................................................86 4.2Safety and security .........................................................................................99 4.5Health and hygiene .........................................................................................73 4.4Prioritization of Travel & Tourism................................................................106 3.7
T&T business environment and infrastructure ............................................97 2.9Air transport infrastructure ..........................................................................86 2.7Ground transport infrastructure..................................................................119 2.4Tourism infrastructure ....................................................................................89 2.1ICT infrastructure ............................................................................................85 2.4Price competitiveness in the T&T industry.................................................40 5.0
T&T human, cultural, and natural resources ...............................................62 3.9Human resources ............................................................................................98 4.6
Education and training ...........................................................................101 4.0Availability of qualified labor...................................................................97 5.1
Affinity for Travel & Tourism ........................................................................117 4.2Natural resources ...........................................................................................19 4.7Cultural resources...........................................................................................71 2.2
Note: For descriptions of variables and detailed sources, please refer to “How to the Read Country/Economy Profiles.”
Rank Score(out of 133) (1–7 scale)
International tourist arrivals (thousands)
International tourism receipts (US$ millions)
1995 1996 1997 1998 1999 2000 2001 2002 2003 2004 2005 2006 2007200
400
600
800
1,000
1 2 3 4 5 6 7
2009–2018Percent annual growth of total (%, forecast)
part2A_profiles.r2 2/26/09 4:01 AM Page 184
The Travel & Tourism Competitiveness Report 2009 © 2009 World Economic Forum

185
2.1:
Cou
ntry
/Eco
nom
y Pr
ofile
s
The Travel & Tourism Competitiveness Index in detail ■ Competitive Advantage ■ Competitive Disadvantage
INDICATOR RANK/133
1st pillar: Policy rules and regulations1.01 Prevalence of foreign ownership ...............................121 ...■1.02 Property rights............................................................125 ...■1.03 Business impact of rules on FDI ................................130 ...■1.04 Visa requirements* ......................................................70 ...■1.05 Openness of bilateral Air Service Agreements* ..........34 ...■1.06 Transparency of government policymaking................130 ...■1.07 Time required to start a business*.............................117 ...■1.08 Cost to start a business* ...........................................100 ...■
2nd pillar: Environmental sustainability2.01 Stringency of environmental regulation .....................109 ...■2.02 Enforcement of environmental regulation..................109 ...■2.03 Sustainability of T&T industry development...............110 ...■2.04 Carbon dioxide emissions* ..........................................55 ...■2.05 Particulate matter concentration* ................................40 ...■2.06 Threatened species* ..................................................118 ...■2.07 Environmental treaty ratification*.................................34 ...■
3rd pillar: Safety and security3.01 Business costs of terrorism .........................................68 ...■3.02 Reliability of police services .......................................125 ...■3.03 Business costs of crime and violence........................112 ...■3.04 Road traffic accidents*.................................................68 ...■
4th pillar: Health and hygiene4.01 Physician density*........................................................69 ...■4.02 Access to improved sanitation* ...................................70 ...■4.03 Access to improved drinking water*............................62 ...■4.04 Hospital beds*..............................................................89 ...■
5th pillar: Prioritization of Travel & Tourism5.01 Government prioritization of the T&T industry...........118 ...■5.02 T&T government expenditure* ....................................53 ...■5.03 Effectiveness of marketing and branding...................106 ...■5.04 T&T fair attendance*....................................................81 ...■
6th pillar: Air transport infrastructure6.01 Quality of air transport infrastructure ...........................77 ...■6.02 Available seat kilometers, domestic*...........................37 ...■6.03 Available seat kilometers, international* ......................71 ...■6.04 Departures per 1,000 population*................................70 ...■6.05 Airport density* ............................................................44 ...■6.06 Number of operating airlines*......................................81 ...■6.07 International air transport network ...............................93 ...■
7th pillar: Ground transport infrastructure7.01 Quality of roads ..........................................................100 ...■7.02 Quality of railroad infrastructure.................................116 ...■7.03 Quality of port infrastructure ......................................109 ...■7.04 Quality of ground transport network..........................109 ...■7.05 Road density*...............................................................85 ...■
INDICATOR RANK/133
8th pillar: Tourism infrastructure8.01 Hotel rooms*................................................................59 ...■8.02 Presence of major car rental companies*....................95 ...■8.03 ATMs accepting Visa cards* ........................................79 ...■
9th pillar: ICT infrastructure9.01 Extent of business Internet use.................................118 ...■9.02 Internet users* .............................................................87 ...■9.03 Telephone lines*...........................................................82 ...■9.04 Broadband Internet subscribers* .................................66 ...■9.05 Mobile telephone subscribers*....................................71 ...■
10th pillar: Price competitiveness in the T&T industry10.01 Ticket taxes and airport charges*...............................123 ...■10.02 Purchasing power parity*.............................................27 ...■10.03 Extent and effect of taxation........................................91 ...■10.04 Fuel price levels* .........................................................12 ...■10.05 Hotel price index* ........................................................13 ...■
11th pillar: Human resources11.01 Primary education enrollment* ....................................36 ...■11.02 Secondary education enrollment*................................97 ...■11.03 Quality of the educational system..............................125 ...■11.04 Local availability of research and training services.....110 ...■11.05 Extent of staff training................................................119 ...■11.06 Hiring and firing practices...........................................122 ...■11.07 Ease of hiring foreign labor ..........................................90 ...■11.08 HIV prevalence* ...........................................................67 ...■11.09 Business impact of HIV/AIDS.......................................72 ...■11.10 Life expectancy* ..........................................................55 ...■
12th pillar: Affinity for Travel & Tourism12.01 Tourism openness* ....................................................109 ...■12.02 Attitude of population toward foreign visitors............107 ...■12.03 Extension of business trips recommended ...............109 ...■
13th pillar: Natural resources13.01 Number of World Heritage natural sites* ....................23 ...■13.02 Protected areas* ..........................................................43 ...■13.03 Quality of the natural environment...............................74 ...■13.04 Total known species*.....................................................5 ...■
14th pillar: Cultural resources14.01 Number of World Heritage cultural sites* ...................65 ...■14.02 Sports stadiums* .........................................................38 ...■14.03 Number of international fairs and exhibitions* ............59 ...■14.04 Creative industries exports*.........................................79 ...■
Ecuador
* Hard data
Note: For further details and explanation, please refer to the section “How toRead the Country/Economy Profiles” at the beginning of this chapter.
part2A_profiles.r2 2/26/09 4:01 AM Page 185
The Travel & Tourism Competitiveness Report 2009 © 2009 World Economic Forum

186
2.1:
Cou
ntry
/Eco
nom
y Pr
ofile
s
EgyptKey indicatorsPopulation (millions), 2007............................................................................76.9Surface area (1,000 square kilometers) ...................................................1,001.5
Gross domestic product (US$ billions), 2007 .............................................128.0Gross domestic product (PPP, US$) per capita, 2007 .............................5,495.1Real GDP growth (percent), 2007...................................................................7.1
Environmental Performance Index, 2008 (out of 149 countries).....................71
Travel & Tourism indicators
T&T industry, 2008 estimatesGDP (US$ millions) ...........................................................11,630...................8.3 ....................4.2Employment (1,000 jobs)....................................................1,467...................7.0 ....................1.6
T&T economy, 2008 estimatesGDP (US$ millions) ...........................................................22,594.................16.1 ....................5.8Employment (1,000 jobs)....................................................2,833.................13.5 ....................3.2
Source: World Travel & Tourism Council, TSA Research 2008
International tourist arrivals (thousands), 2007.................10,610International tourism receipts (US$ millions), 2007 ...........9,303
Source: United Nations World Tourism Organization
Travel & Tourism Competitiveness Index
2009 Index......................................................................................................64 4.12008 Index............................................................................................................66 4.0T&T regulatory framework ..............................................................................52 4.8
Policy rules and regulations..........................................................................55 4.6Environmental sustainability........................................................................103 4.1Safety and security .........................................................................................67 5.1Health and hygiene .........................................................................................64 4.6Prioritization of Travel & Tourism....................................................................9 5.8
T&T business environment and infrastructure ............................................65 3.6Air transport infrastructure ..........................................................................58 3.3Ground transport infrastructure....................................................................79 3.2Tourism infrastructure ....................................................................................74 3.0ICT infrastructure ............................................................................................84 2.4Price competitiveness in the T&T industry...................................................1 6.0
T&T human, cultural, and natural resources ...............................................73 3.8Human resources ............................................................................................83 4.9
Education and training .............................................................................83 4.4Availability of qualified labor...................................................................75 5.4
Affinity for Travel & Tourism ..........................................................................20 5.4Natural resources .........................................................................................109 2.5Cultural resources...........................................................................................60 2.5
Note: For descriptions of variables and detailed sources, please refer to “How to the Read Country/Economy Profiles.”
Rank Score(out of 133) (1–7 scale)
International tourist arrivals (thousands)
International tourism receipts (US$ millions)
1995 1996 1997 1998 1999 2000 2001 2002 2003 2004 2005 2006 20072,000
4,000
6,000
8,000
10,000
12,000
1 2 3 4 5 6 7
2009–2018Percent annual growth of total (%, forecast)
part2A_profiles.r2 2/26/09 4:01 AM Page 186
The Travel & Tourism Competitiveness Report 2009 © 2009 World Economic Forum

187
2.1:
Cou
ntry
/Eco
nom
y Pr
ofile
s
The Travel & Tourism Competitiveness Index in detail ■ Competitive Advantage ■ Competitive Disadvantage
INDICATOR RANK/133
1st pillar: Policy rules and regulations1.01 Prevalence of foreign ownership .................................78 ...■1.02 Property rights..............................................................67 ...■1.03 Business impact of rules on FDI ..................................83 ...■1.04 Visa requirements* ......................................................38 ...■1.05 Openness of bilateral Air Service Agreements* ..........67 ...■1.06 Transparency of government policymaking..................67 ...■1.07 Time required to start a business*...............................15 ...■1.08 Cost to start a business* .............................................80 ...■
2nd pillar: Environmental sustainability2.01 Stringency of environmental regulation .....................103 ...■2.02 Enforcement of environmental regulation..................120 ...■2.03 Sustainability of T&T industry development.................38 ...■2.04 Carbon dioxide emissions* ..........................................54 ...■2.05 Particulate matter concentration* ..............................125 ...■2.06 Threatened species* ....................................................80 ...■2.07 Environmental treaty ratification*.................................34 ...■
3rd pillar: Safety and security3.01 Business costs of terrorism .........................................72 ...■3.02 Reliability of police services .........................................52 ...■3.03 Business costs of crime and violence..........................23 ...■3.04 Road traffic accidents*...............................................111 ...■
4th pillar: Health and hygiene4.01 Physician density*........................................................43 ...■4.02 Access to improved sanitation* ...................................89 ...■4.03 Access to improved drinking water*............................47 ...■4.04 Hospital beds*..............................................................78 ...■
5th pillar: Prioritization of Travel & Tourism5.01 Government prioritization of the T&T industry.............33 ...■5.02 T&T government expenditure* ....................................20 ...■5.03 Effectiveness of marketing and branding.....................49 ...■5.04 T&T fair attendance*......................................................3 ...■
6th pillar: Air transport infrastructure6.01 Quality of air transport infrastructure ...........................52 ...■6.02 Available seat kilometers, domestic*...........................40 ...■6.03 Available seat kilometers, international* ......................26 ...■6.04 Departures per 1,000 population*................................99 ...■6.05 Airport density* ..........................................................117 ...■6.06 Number of operating airlines*......................................20 ...■6.07 International air transport network ...............................73 ...■
7th pillar: Ground transport infrastructure7.01 Quality of roads ............................................................74 ...■7.02 Quality of railroad infrastructure...................................54 ...■7.03 Quality of port infrastructure ........................................69 ...■7.04 Quality of ground transport network ............................67 ...■7.05 Road density*.............................................................106 ...■
INDICATOR RANK/133
8th pillar: Tourism infrastructure8.01 Hotel rooms*................................................................74 ...■8.02 Presence of major car rental companies*....................23 ...■8.03 ATMs accepting Visa cards* ........................................96 ...■
9th pillar: ICT infrastructure9.01 Extent of business Internet use...................................36 ...■9.02 Internet users* .............................................................88 ...■9.03 Telephone lines*...........................................................76 ...■9.04 Broadband Internet subscribers* .................................89 ...■9.05 Mobile telephone subscribers*....................................96 ...■
10th pillar: Price competitiveness in the T&T industry10.01 Ticket taxes and airport charges*.................................34 ...■10.02 Purchasing power parity*...............................................4 ...■10.03 Extent and effect of taxation........................................34 ...■10.04 Fuel price levels* ...........................................................3 ...■10.05 Hotel price index* ..........................................................4 ...■
11th pillar: Human resources11.01 Primary education enrollment* ....................................63 ...■11.02 Secondary education enrollment*................................65 ...■11.03 Quality of the educational system..............................126 ...■11.04 Local availability of research and training services.......92 ...■11.05 Extent of staff training..................................................96 ...■11.06 Hiring and firing practices.............................................91 ...■11.07 Ease of hiring foreign labor ..........................................39 ...■11.08 HIV prevalence* .............................................................1 ...■11.09 Business impact of HIV/AIDS.......................................32 ...■11.10 Life expectancy* ..........................................................89 ...■
12th pillar: Affinity for Travel & Tourism12.01 Tourism openness* ......................................................27 ...■12.02 Attitude of population toward foreign visitors..............54 ...■12.03 Extension of business trips recommended ...................6 ...■
13th pillar: Natural resources13.01 Number of World Heritage natural sites* ....................40 ...■13.02 Protected areas* ..........................................................75 ...■13.03 Quality of the natural environment.............................131 ...■13.04 Total known species*...................................................70 ...■
14th pillar: Cultural resources14.01 Number of World Heritage cultural sites* ...................26 ...■14.02 Sports stadiums* .......................................................109 ...■14.03 Number of international fairs and exhibitions* ............51 ...■14.04 Creative industries exports*........................................n/a ......
Egypt
* Hard data
Note: For further details and explanation, please refer to the section “How toRead the Country/Economy Profiles” at the beginning of this chapter.
part2A_profiles.r2 2/26/09 4:01 AM Page 187
The Travel & Tourism Competitiveness Report 2009 © 2009 World Economic Forum

188
2.1:
Cou
ntry
/Eco
nom
y Pr
ofile
s
El SalvadorKey indicatorsPopulation (millions), 2007..............................................................................7.1Surface area (1,000 square kilometers) ........................................................21.0
Gross domestic product (US$ billions), 2007 ...............................................20.4Gross domestic product (PPP, US$) per capita, 2007 .............................5,846.8Real GDP growth (percent), 2007...................................................................4.7
Environmental Performance Index, 2008 (out of 149 countries).....................65
Travel & Tourism indicators
T&T industry, 2008 estimatesGDP (US$ millions) ................................................................841...................3.9 ....................1.9Employment (1,000 jobs).........................................................97...................3.4 ....................1.4
T&T economy, 2008 estimatesGDP (US$ millions) .............................................................1,954...................9.1 ....................2.0Employment (1,000 jobs).......................................................221...................7.9 ....................1.5
Source: World Travel & Tourism Council, TSA Research 2008
International tourist arrivals (thousands), 2007...................1,339International tourism receipts (US$ millions), 2007 ..............847
Source: United Nations World Tourism Organization
Travel & Tourism Competitiveness Index
2009 Index......................................................................................................94 3.62008 Index............................................................................................................97 3.6T&T regulatory framework ..............................................................................73 4.4
Policy rules and regulations..........................................................................40 4.9Environmental sustainability..........................................................................58 4.6Safety and security .......................................................................................112 4.1Health and hygiene .........................................................................................92 3.9Prioritization of Travel & Tourism..................................................................56 4.6
T&T business environment and infrastructure ............................................83 3.2Air transport infrastructure ..........................................................................74 2.8Ground transport infrastructure....................................................................78 3.2Tourism infrastructure ....................................................................................87 2.1ICT infrastructure ............................................................................................74 2.7Price competitiveness in the T&T industry.................................................31 5.1
T&T human, cultural, and natural resources .............................................123 3.3Human resources ............................................................................................75 5.0
Education and training .............................................................................87 4.3Availability of qualified labor...................................................................27 5.7
Affinity for Travel & Tourism ..........................................................................84 4.6Natural resources .........................................................................................127 2.1Cultural resources.........................................................................................117 1.4
Note: For descriptions of variables and detailed sources, please refer to “How to the Read Country/Economy Profiles.”
Rank Score(out of 133) (1–7 scale)
International tourist arrivals (thousands)
International tourism receipts (US$ millions)
1995 1996 1997 1998 1999 2000 2001 2002 2003 2004 2005 2006 20070
300
600
900
1,200
1,500
1 2 3 4 5 6 7
2009–2018Percent annual growth of total (%, forecast)
part2A_profiles.r2 2/26/09 4:01 AM Page 188
The Travel & Tourism Competitiveness Report 2009 © 2009 World Economic Forum

189
2.1:
Cou
ntry
/Eco
nom
y Pr
ofile
s
The Travel & Tourism Competitiveness Index in detail ■ Competitive Advantage ■ Competitive Disadvantage
INDICATOR RANK/133
1st pillar: Policy rules and regulations1.01 Prevalence of foreign ownership .................................50 ...■1.02 Property rights..............................................................82 ...■1.03 Business impact of rules on FDI ..................................43 ...■1.04 Visa requirements* ......................................................23 ...■1.05 Openness of bilateral Air Service Agreements* ............1 ...■1.06 Transparency of government policymaking..................72 ...■1.07 Time required to start a business*...............................50 ...■1.08 Cost to start a business* ...........................................104 ...■
2nd pillar: Environmental sustainability2.01 Stringency of environmental regulation .......................98 ...■2.02 Enforcement of environmental regulation..................106 ...■2.03 Sustainability of T&T industry development.................67 ...■2.04 Carbon dioxide emissions* ..........................................33 ...■2.05 Particulate matter concentration* ................................60 ...■2.06 Threatened species* ....................................................31 ...■2.07 Environmental treaty ratification*...............................104 ...■
3rd pillar: Safety and security3.01 Business costs of terrorism .......................................116 ...■3.02 Reliability of police services .........................................96 ...■3.03 Business costs of crime and violence........................132 ...■3.04 Road traffic accidents*.................................................69 ...■
4th pillar: Health and hygiene4.01 Physician density*........................................................77 ...■4.02 Access to improved sanitation* ...................................66 ...■4.03 Access to improved drinking water*............................92 ...■4.04 Hospital beds*............................................................107 ...■
5th pillar: Prioritization of Travel & Tourism5.01 Government prioritization of the T&T industry.............32 ...■5.02 T&T government expenditure* ....................................85 ...■5.03 Effectiveness of marketing and branding.....................35 ...■5.04 T&T fair attendance*....................................................41 ...■
6th pillar: Air transport infrastructure6.01 Quality of air transport infrastructure ...........................33 ...■6.02 Available seat kilometers, domestic*.........................100 ...■6.03 Available seat kilometers, international* ......................79 ...■6.04 Departures per 1,000 population*................................57 ...■6.05 Airport density* ..........................................................121 ...■6.06 Number of operating airlines*....................................115 ...■6.07 International air transport network ...............................36 ...■
7th pillar: Ground transport infrastructure7.01 Quality of roads ............................................................36 ...■7.02 Quality of railroad infrastructure.................................112 ...■7.03 Quality of port infrastructure ........................................81 ...■7.04 Quality of ground transport network..........................118 ...■7.05 Road density*...............................................................52 ...■
INDICATOR RANK/133
8th pillar: Tourism infrastructure8.01 Hotel rooms*..............................................................102 ...■8.02 Presence of major car rental companies*....................73 ...■8.03 ATMs accepting Visa cards* ........................................83 ...■
9th pillar: ICT infrastructure9.01 Extent of business Internet use...................................77 ...■9.02 Internet users* .............................................................89 ...■9.03 Telephone lines*...........................................................75 ...■9.04 Broadband Internet subscribers* .................................76 ...■9.05 Mobile telephone subscribers*....................................52 ...■
10th pillar: Price competitiveness in the T&T industry10.01 Ticket taxes and airport charges*...............................107 ...■10.02 Purchasing power parity*.............................................47 ...■10.03 Extent and effect of taxation........................................32 ...■10.04 Fuel price levels* .........................................................60 ...■10.05 Hotel price index* ..........................................................8 ...■
11th pillar: Human resources11.01 Primary education enrollment* ....................................62 ...■11.02 Secondary education enrollment*..............................101 ...■11.03 Quality of the educational system..............................102 ...■11.04 Local availability of research and training services.......81 ...■11.05 Extent of staff training..................................................66 ...■11.06 Hiring and firing practices.............................................26 ...■11.07 Ease of hiring foreign labor ..........................................16 ...■11.08 HIV prevalence* ...........................................................94 ...■11.09 Business impact of HIV/AIDS.....................................104 ...■11.10 Life expectancy* ..........................................................76 ...■
12th pillar: Affinity for Travel & Tourism12.01 Tourism openness* ......................................................40 ...■12.02 Attitude of population toward foreign visitors............100 ...■12.03 Extension of business trips recommended ...............121 ...■
13th pillar: Natural resources13.01 Number of World Heritage natural sites* ....................74 ...■13.02 Protected areas* ........................................................123 ...■13.03 Quality of the natural environment.............................129 ...■13.04 Total known species*...................................................51 ...■
14th pillar: Cultural resources14.01 Number of World Heritage cultural sites* ...................97 ...■14.02 Sports stadiums* .........................................................82 ...■14.03 Number of international fairs and exhibitions* ............79 ...■14.04 Creative industries exports*.........................................81 ...■
El Salvador
* Hard data
Note: For further details and explanation, please refer to the section “How toRead the Country/Economy Profiles” at the beginning of this chapter.
part2A_profiles.r2 2/26/09 4:01 AM Page 189
The Travel & Tourism Competitiveness Report 2009 © 2009 World Economic Forum

190
2.1:
Cou
ntry
/Eco
nom
y Pr
ofile
s
EstoniaKey indicatorsPopulation (millions), 2007..............................................................................1.3Surface area (1,000 square kilometers) ........................................................45.2
Gross domestic product (US$ billions), 2007 ...............................................20.9Gross domestic product (PPP, US$) per capita, 2007 ...........................20,584.3Real GDP growth (percent), 2007...................................................................6.3
Environmental Performance Index, 2008 (out of 149 countries).....................19
Travel & Tourism indicators
T&T industry, 2008 estimatesGDP (US$ millions) ................................................................750...................3.1 ....................5.0Employment (1,000 jobs).........................................................19...................2.8 ..................–0.5
T&T economy, 2008 estimatesGDP (US$ millions) .............................................................4,887.................20.4 ....................3.6Employment (1,000 jobs).......................................................115.................17.5 ..................–1.7
Source: World Travel & Tourism Council, TSA Research 2008
International tourist arrivals (thousands), 2007...................1,900International tourism receipts (US$ millions), 2007 ...........1,035
Source: United Nations World Tourism Organization
Travel & Tourism Competitiveness Index
2009 Index......................................................................................................27 4.82008 Index............................................................................................................26 4.8T&T regulatory framework ..............................................................................17 5.5
Policy rules and regulations..........................................................................31 5.1Environmental sustainability..........................................................................30 5.1Safety and security .........................................................................................20 6.0Health and hygiene .........................................................................................23 6.3Prioritization of Travel & Tourism..................................................................34 5.1
T&T business environment and infrastructure ............................................21 4.8Air transport infrastructure ..........................................................................59 3.3Ground transport infrastructure....................................................................29 4.8Tourism infrastructure ....................................................................................15 6.1ICT infrastructure ............................................................................................16 5.2Price competitiveness in the T&T industry.................................................64 4.8
T&T human, cultural, and natural resources ...............................................47 4.2Human resources ............................................................................................38 5.4
Education and training .............................................................................23 5.5Availability of qualified labor...................................................................91 5.2
Affinity for Travel & Tourism ..........................................................................31 5.3Natural resources ...........................................................................................45 3.8Cultural resources...........................................................................................67 2.3
Note: For descriptions of variables and detailed sources, please refer to “How to the Read Country/Economy Profiles.”
Rank Score(out of 133) (1–7 scale)
International tourist arrivals (thousands)
International tourism receipts (US$ millions)
1995 1996 1997 1998 1999 2000 2001 2002 2003 2004 2005 2006 20070
500
1,000
1,500
2,000
1 2 3 4 5 6 7
2009–2018Percent annual growth of total (%, forecast)
part2A_profiles.r2 2/26/09 4:01 AM Page 190
The Travel & Tourism Competitiveness Report 2009 © 2009 World Economic Forum

191
2.1:
Cou
ntry
/Eco
nom
y Pr
ofile
s
The Travel & Tourism Competitiveness Index in detail ■ Competitive Advantage ■ Competitive Disadvantage
INDICATOR RANK/133
1st pillar: Policy rules and regulations1.01 Prevalence of foreign ownership .................................35 ...■1.02 Property rights..............................................................28 ...■1.03 Business impact of rules on FDI ..................................11 ...■1.04 Visa requirements* ......................................................40 ...■1.05 Openness of bilateral Air Service Agreements* ........124 ...■1.06 Transparency of government policymaking..................27 ...■1.07 Time required to start a business*...............................15 ...■1.08 Cost to start a business* .............................................17 ...■
2nd pillar: Environmental sustainability2.01 Stringency of environmental regulation .......................26 ...■2.02 Enforcement of environmental regulation....................29 ...■2.03 Sustainability of T&T industry development.................57 ...■2.04 Carbon dioxide emissions* ........................................118 ...■2.05 Particulate matter concentration* ..................................4 ...■2.06 Threatened species* ......................................................5 ...■2.07 Environmental treaty ratification*.................................67 ...■
3rd pillar: Safety and security3.01 Business costs of terrorism .........................................19 ...■3.02 Reliability of police services .........................................35 ...■3.03 Business costs of crime and violence..........................37 ...■3.04 Road traffic accidents*.................................................17 ...■
4th pillar: Health and hygiene4.01 Physician density*........................................................24 ...■4.02 Access to improved sanitation* ...................................46 ...■4.03 Access to improved drinking water*..............................1 ...■4.04 Hospital beds*..............................................................28 ...■
5th pillar: Prioritization of Travel & Tourism5.01 Government prioritization of the T&T industry.............70 ...■5.02 T&T government expenditure* ....................................14 ...■5.03 Effectiveness of marketing and branding.....................55 ...■5.04 T&T fair attendance*....................................................62 ...■
6th pillar: Air transport infrastructure6.01 Quality of air transport infrastructure ...........................51 ...■6.02 Available seat kilometers, domestic*...........................93 ...■6.03 Available seat kilometers, international* ....................110 ...■6.04 Departures per 1,000 population*................................45 ...■6.05 Airport density* ............................................................21 ...■6.06 Number of operating airlines*......................................92 ...■6.07 International air transport network ...............................60 ...■
7th pillar: Ground transport infrastructure7.01 Quality of roads ............................................................53 ...■7.02 Quality of railroad infrastructure...................................39 ...■7.03 Quality of port infrastructure ........................................20 ...■7.04 Quality of ground transport network ............................29 ...■7.05 Road density*...............................................................28 ...■
INDICATOR RANK/133
8th pillar: Tourism infrastructure8.01 Hotel rooms*................................................................16 ...■8.02 Presence of major car rental companies*....................23 ...■8.03 ATMs accepting Visa cards* ........................................16 ...■
9th pillar: ICT infrastructure9.01 Extent of business Internet use.....................................4 ...■9.02 Internet users* .............................................................20 ...■9.03 Telephone lines*...........................................................34 ...■9.04 Broadband Internet subscribers* .................................22 ...■9.05 Mobile telephone subscribers*......................................3 ...■
10th pillar: Price competitiveness in the T&T industry10.01 Ticket taxes and airport charges*.................................38 ...■10.02 Purchasing power parity*...........................................100 ...■10.03 Extent and effect of taxation........................................13 ...■10.04 Fuel price levels* .......................................................100 ...■10.05 Hotel price index* ........................................................55 ...■
11th pillar: Human resources11.01 Primary education enrollment* ....................................60 ...■11.02 Secondary education enrollment*................................27 ...■11.03 Quality of the educational system................................30 ...■11.04 Local availability of research and training services.......21 ...■11.05 Extent of staff training..................................................35 ...■11.06 Hiring and firing practices.............................................76 ...■11.07 Ease of hiring foreign labor ........................................125 ...■11.08 HIV prevalence* .........................................................106 ...■11.09 Business impact of HIV/AIDS.......................................82 ...■11.10 Life expectancy* ..........................................................55 ...■
12th pillar: Affinity for Travel & Tourism12.01 Tourism openness* ......................................................34 ...■12.02 Attitude of population toward foreign visitors..............52 ...■12.03 Extension of business trips recommended .................13 ...■
13th pillar: Natural resources13.01 Number of World Heritage natural sites* ....................74 ...■13.02 Protected areas* ............................................................9 ...■13.03 Quality of the natural environment...............................21 ...■13.04 Total known species*.................................................117 ...■
14th pillar: Cultural resources14.01 Number of World Heritage cultural sites* ...................54 ...■14.02 Sports stadiums* .........................................................56 ...■14.03 Number of international fairs and exhibitions* ............48 ...■14.04 Creative industries exports*.........................................56 ...■
Estonia
* Hard data
Note: For further details and explanation, please refer to the section “How toRead the Country/Economy Profiles” at the beginning of this chapter.
part2A_profiles.r2 2/26/09 4:01 AM Page 191
The Travel & Tourism Competitiveness Report 2009 © 2009 World Economic Forum
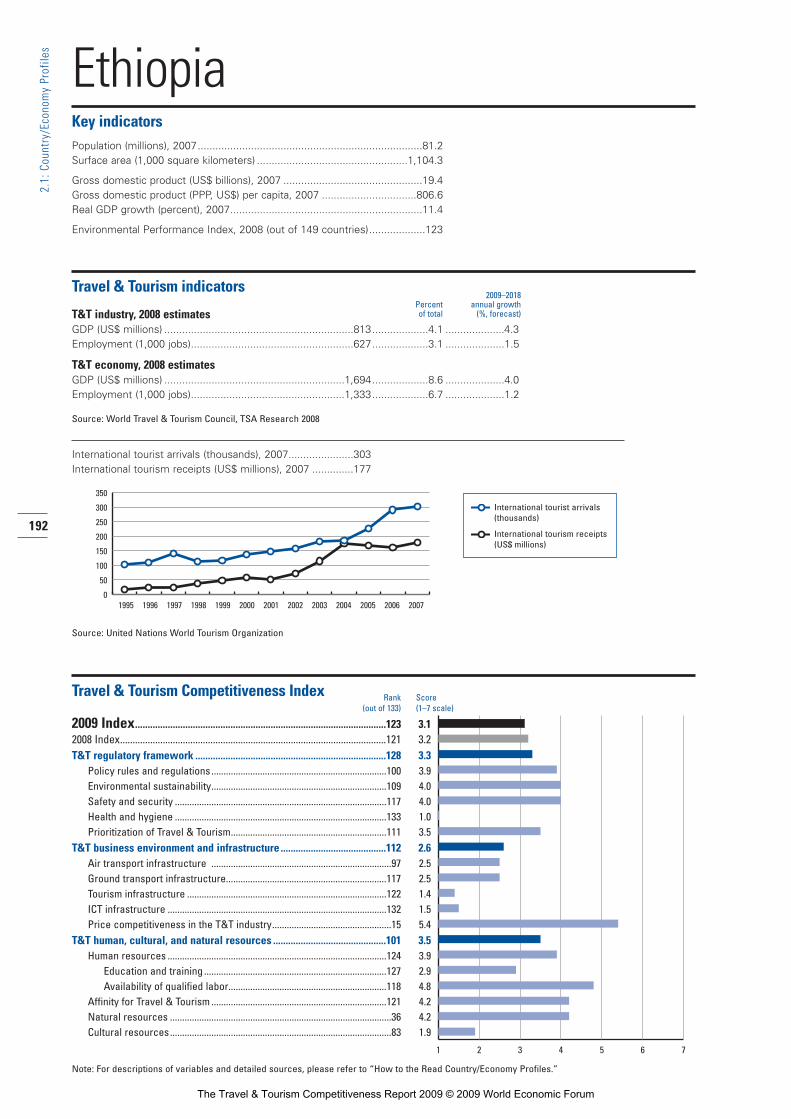
192
2.1:
Cou
ntry
/Eco
nom
y Pr
ofile
s
EthiopiaKey indicatorsPopulation (millions), 2007............................................................................81.2Surface area (1,000 square kilometers) ...................................................1,104.3
Gross domestic product (US$ billions), 2007 ...............................................19.4Gross domestic product (PPP, US$) per capita, 2007 ................................806.6Real GDP growth (percent), 2007.................................................................11.4
Environmental Performance Index, 2008 (out of 149 countries)...................123
Travel & Tourism indicators
T&T industry, 2008 estimatesGDP (US$ millions) ................................................................813...................4.1 ....................4.3Employment (1,000 jobs).......................................................627...................3.1 ....................1.5
T&T economy, 2008 estimatesGDP (US$ millions) .............................................................1,694...................8.6 ....................4.0Employment (1,000 jobs)....................................................1,333...................6.7 ....................1.2
Source: World Travel & Tourism Council, TSA Research 2008
International tourist arrivals (thousands), 2007......................303International tourism receipts (US$ millions), 2007 ..............177
Source: United Nations World Tourism Organization
Travel & Tourism Competitiveness Index
2009 Index....................................................................................................123 3.12008 Index..........................................................................................................121 3.2T&T regulatory framework ............................................................................128 3.3
Policy rules and regulations........................................................................100 3.9Environmental sustainability........................................................................109 4.0Safety and security .......................................................................................117 4.0Health and hygiene .......................................................................................133 1.0Prioritization of Travel & Tourism................................................................111 3.5
T&T business environment and infrastructure ..........................................112 2.6Air transport infrastructure ..........................................................................97 2.5Ground transport infrastructure..................................................................117 2.5Tourism infrastructure ..................................................................................122 1.4ICT infrastructure ..........................................................................................132 1.5Price competitiveness in the T&T industry.................................................15 5.4
T&T human, cultural, and natural resources .............................................101 3.5Human resources ..........................................................................................124 3.9
Education and training ...........................................................................127 2.9Availability of qualified labor.................................................................118 4.8
Affinity for Travel & Tourism ........................................................................121 4.2Natural resources ...........................................................................................36 4.2Cultural resources...........................................................................................83 1.9
Note: For descriptions of variables and detailed sources, please refer to “How to the Read Country/Economy Profiles.”
Rank Score(out of 133) (1–7 scale)
International tourist arrivals (thousands)
International tourism receipts (US$ millions)
1995 1996 1997 1998 1999 2000 2001 2002 2003 2004 2005 2006 20070
50
100
150
200
250
300
350
1 2 3 4 5 6 7
2009–2018Percent annual growth of total (%, forecast)
part2A_profiles.r2 2/26/09 4:01 AM Page 192
The Travel & Tourism Competitiveness Report 2009 © 2009 World Economic Forum

193
2.1:
Cou
ntry
/Eco
nom
y Pr
ofile
s
The Travel & Tourism Competitiveness Index in detail ■ Competitive Advantage ■ Competitive Disadvantage
INDICATOR RANK/133
1st pillar: Policy rules and regulations1.01 Prevalence of foreign ownership ...............................123 ...■1.02 Property rights..............................................................78 ...■1.03 Business impact of rules on FDI ..................................98 ...■1.04 Visa requirements* ....................................................128 ...■1.05 Openness of bilateral Air Service Agreements* ..........56 ...■1.06 Transparency of government policymaking..................92 ...■1.07 Time required to start a business*...............................45 ...■1.08 Cost to start a business* .............................................94 ...■
2nd pillar: Environmental sustainability2.01 Stringency of environmental regulation .......................93 ...■2.02 Enforcement of environmental regulation....................91 ...■2.03 Sustainability of T&T industry development.................91 ...■2.04 Carbon dioxide emissions* ............................................9 ...■2.05 Particulate matter concentration* ..............................103 ...■2.06 Threatened species* ....................................................79 ...■2.07 Environmental treaty ratification*...............................121 ...■
3rd pillar: Safety and security3.01 Business costs of terrorism .........................................91 ...■3.02 Reliability of police services .........................................82 ...■3.03 Business costs of crime and violence..........................54 ...■3.04 Road traffic accidents*...............................................119 ...■
4th pillar: Health and hygiene4.01 Physician density*......................................................128 ...■4.02 Access to improved sanitation* .................................124 ...■4.03 Access to improved drinking water*..........................126 ...■4.04 Hospital beds*............................................................128 ...■
5th pillar: Prioritization of Travel & Tourism5.01 Government prioritization of the T&T industry.............98 ...■5.02 T&T government expenditure* ....................................90 ...■5.03 Effectiveness of marketing and branding.....................91 ...■5.04 T&T fair attendance*....................................................98 ...■
6th pillar: Air transport infrastructure6.01 Quality of air transport infrastructure ...........................60 ...■6.02 Available seat kilometers, domestic*...........................59 ...■6.03 Available seat kilometers, international* ......................70 ...■6.04 Departures per 1,000 population*..............................108 ...■6.05 Airport density* ..........................................................107 ...■6.06 Number of operating airlines*....................................108 ...■6.07 International air transport network ...............................69 ...■
7th pillar: Ground transport infrastructure7.01 Quality of roads ............................................................92 ...■7.02 Quality of railroad infrastructure...................................98 ...■7.03 Quality of port infrastructure ........................................80 ...■7.04 Quality of ground transport network..........................122 ...■7.05 Road density*.............................................................123 ...■
INDICATOR RANK/133
8th pillar: Tourism infrastructure8.01 Hotel rooms*..............................................................120 ...■8.02 Presence of major car rental companies*....................95 ...■8.03 ATMs accepting Visa cards* ......................................123 ...■
9th pillar: ICT infrastructure9.01 Extent of business Internet use.................................117 ...■9.02 Internet users* ...........................................................131 ...■9.03 Telephone lines*.........................................................120 ...■9.04 Broadband Internet subscribers* ...............................126 ...■9.05 Mobile telephone subscribers*..................................133 ...■
10th pillar: Price competitiveness in the T&T industry10.01 Ticket taxes and airport charges*.................................25 ...■10.02 Purchasing power parity*...............................................3 ...■10.03 Extent and effect of taxation........................................54 ...■10.04 Fuel price levels* .........................................................34 ...■10.05 Hotel price index* ........................................................37 ...■
11th pillar: Human resources11.01 Primary education enrollment* ..................................122 ...■11.02 Secondary education enrollment*..............................118 ...■11.03 Quality of the educational system................................88 ...■11.04 Local availability of research and training services.....114 ...■11.05 Extent of staff training................................................126 ...■11.06 Hiring and firing practices.............................................62 ...■11.07 Ease of hiring foreign labor ........................................103 ...■11.08 HIV prevalence* .........................................................116 ...■11.09 Business impact of HIV/AIDS.....................................123 ...■11.10 Life expectancy* ........................................................115 ...■
12th pillar: Affinity for Travel & Tourism12.01 Tourism openness* ....................................................123 ...■12.02 Attitude of population toward foreign visitors............108 ...■12.03 Extension of business trips recommended ...............107 ...■
13th pillar: Natural resources13.01 Number of World Heritage natural sites* ....................40 ...■13.02 Protected areas* ..........................................................29 ...■13.03 Quality of the natural environment...............................68 ...■13.04 Total known species*...................................................26 ...■
14th pillar: Cultural resources14.01 Number of World Heritage cultural sites* ...................26 ...■14.02 Sports stadiums* .......................................................128 ...■14.03 Number of international fairs and exhibitions* ............83 ...■14.04 Creative industries exports*.......................................103 ...■
Ethiopia
* Hard data
Note: For further details and explanation, please refer to the section “How toRead the Country/Economy Profiles” at the beginning of this chapter.
part2A_profiles.r2 2/26/09 4:01 AM Page 193
The Travel & Tourism Competitiveness Report 2009 © 2009 World Economic Forum

194
2.1:
Cou
ntry
/Eco
nom
y Pr
ofile
s
FinlandKey indicatorsPopulation (millions), 2007..............................................................................5.3Surface area (1,000 square kilometers) ......................................................338.2
Gross domestic product (US$ billions), 2007 .............................................246.4Gross domestic product (PPP, US$) per capita, 2007 ...........................35,349.4Real GDP growth (percent), 2007...................................................................4.5
Environmental Performance Index, 2008 (out of 149 countries).......................4
Travel & Tourism indicators
T&T industry, 2008 estimatesGDP (US$ millions) .............................................................8,014...................3.0 ....................2.0Employment (1,000 jobs).........................................................76...................3.0 ....................0.0
T&T economy, 2008 estimatesGDP (US$ millions) ...........................................................24,131...................8.9 ....................3.4Employment (1,000 jobs).......................................................234...................9.4 ....................1.3
Source: World Travel & Tourism Council, TSA Research 2008
International tourist arrivals (thousands), 2007...................3,519International tourism receipts (US$ millions), 2007 ...........2,838
Source: United Nations World Tourism Organization
Travel & Tourism Competitiveness Index
2009 Index......................................................................................................15 5.12008 Index............................................................................................................12 5.1T&T regulatory framework ................................................................................5 5.8
Policy rules and regulations............................................................................6 5.4Environmental sustainability............................................................................7 5.6Safety and security ...........................................................................................1 6.7Health and hygiene .........................................................................................12 6.6Prioritization of Travel & Tourism..................................................................54 4.6
T&T business environment and infrastructure ............................................25 4.7Air transport infrastructure ..........................................................................14 5.0Ground transport infrastructure....................................................................21 5.3Tourism infrastructure ....................................................................................38 4.3ICT infrastructure ............................................................................................14 5.2Price competitiveness in the T&T industry...............................................121 3.6
T&T human, cultural, and natural resources ...............................................21 4.7Human resources ..............................................................................................5 6.0
Education and training ...............................................................................1 6.2Availability of qualified labor...................................................................16 5.8
Affinity for Travel & Tourism ..........................................................................88 4.6Natural resources ...........................................................................................61 3.3Cultural resources...........................................................................................22 5.0
Note: For descriptions of variables and detailed sources, please refer to “How to the Read Country/Economy Profiles.”
Rank Score(out of 133) (1–7 scale)
International tourist arrivals (thousands)
International tourism receipts (US$ millions)
1995 1996 1997 1998 1999 2000 2001 2002 2003 2004 2005 2006 20071,000
1,500
2,000
2,500
3,000
3,500
4,000
1 2 3 4 5 6 7
2009–2018Percent annual growth of total (%, forecast)
part2A_profiles.r2 2/26/09 4:01 AM Page 194
The Travel & Tourism Competitiveness Report 2009 © 2009 World Economic Forum

195
2.1:
Cou
ntry
/Eco
nom
y Pr
ofile
s
The Travel & Tourism Competitiveness Index in detail ■ Competitive Advantage ■ Competitive Disadvantage
INDICATOR RANK/133
1st pillar: Policy rules and regulations1.01 Prevalence of foreign ownership ...................................8 ...■1.02 Property rights................................................................5 ...■1.03 Business impact of rules on FDI ..................................14 ...■1.04 Visa requirements* ......................................................40 ...■1.05 Openness of bilateral Air Service Agreements* ..........35 ...■1.06 Transparency of government policymaking....................5 ...■1.07 Time required to start a business*...............................38 ...■1.08 Cost to start a business* .............................................14 ...■
2nd pillar: Environmental sustainability2.01 Stringency of environmental regulation .........................4 ...■2.02 Enforcement of environmental regulation......................6 ...■2.03 Sustainability of T&T industry development.................49 ...■2.04 Carbon dioxide emissions* ........................................115 ...■2.05 Particulate matter concentration* ................................17 ...■2.06 Threatened species* ......................................................9 ...■2.07 Environmental treaty ratification*.................................10 ...■
3rd pillar: Safety and security3.01 Business costs of terrorism ...........................................1 ...■3.02 Reliability of police services ...........................................1 ...■3.03 Business costs of crime and violence............................3 ...■3.04 Road traffic accidents*.................................................34 ...■
4th pillar: Health and hygiene4.01 Physician density*........................................................25 ...■4.02 Access to improved sanitation* .....................................1 ...■4.03 Access to improved drinking water*..............................1 ...■4.04 Hospital beds*..............................................................16 ...■
5th pillar: Prioritization of Travel & Tourism5.01 Government prioritization of the T&T industry.............90 ...■5.02 T&T government expenditure* ....................................76 ...■5.03 Effectiveness of marketing and branding.....................67 ...■5.04 T&T fair attendance*....................................................20 ...■
6th pillar: Air transport infrastructure6.01 Quality of air transport infrastructure .............................8 ...■6.02 Available seat kilometers, domestic*...........................38 ...■6.03 Available seat kilometers, international* ......................41 ...■6.04 Departures per 1,000 population*................................16 ...■6.05 Airport density* ............................................................10 ...■6.06 Number of operating airlines*......................................50 ...■6.07 International air transport network ...............................11 ...■
7th pillar: Ground transport infrastructure7.01 Quality of roads ............................................................12 ...■7.02 Quality of railroad infrastructure.....................................6 ...■7.03 Quality of port infrastructure ..........................................6 ...■7.04 Quality of ground transport network ..............................6 ...■7.05 Road density*...............................................................74 ...■
INDICATOR RANK/133
8th pillar: Tourism infrastructure8.01 Hotel rooms*................................................................25 ...■8.02 Presence of major car rental companies*....................56 ...■8.03 ATMs accepting Visa cards* ........................................40 ...■
9th pillar: ICT infrastructure9.01 Extent of business Internet use...................................10 ...■9.02 Internet users* .............................................................11 ...■9.03 Telephone lines*...........................................................35 ...■9.04 Broadband Internet subscribers* ...................................6 ...■9.05 Mobile telephone subscribers*....................................20 ...■
10th pillar: Price competitiveness in the T&T industry10.01 Ticket taxes and airport charges*.................................44 ...■10.02 Purchasing power parity*...........................................127 ...■10.03 Extent and effect of taxation......................................113 ...■10.04 Fuel price levels* .......................................................106 ...■10.05 Hotel price index* ........................................................66 ...■
11th pillar: Human resources11.01 Primary education enrollment* ....................................35 ...■11.02 Secondary education enrollment*..................................9 ...■11.03 Quality of the educational system..................................1 ...■11.04 Local availability of research and training services.........4 ...■11.05 Extent of staff training..................................................11 ...■11.06 Hiring and firing practices.............................................89 ...■11.07 Ease of hiring foreign labor ..........................................23 ...■11.08 HIV prevalence* ...........................................................22 ...■11.09 Business impact of HIV/AIDS.........................................8 ...■11.10 Life expectancy* ..........................................................22 ...■
12th pillar: Affinity for Travel & Tourism12.01 Tourism openness* ....................................................102 ...■12.02 Attitude of population toward foreign visitors..............23 ...■12.03 Extension of business trips recommended .................91 ...■
13th pillar: Natural resources13.01 Number of World Heritage natural sites* ....................40 ...■13.02 Protected areas* ..........................................................71 ...■13.03 Quality of the natural environment.................................4 ...■13.04 Total known species*.................................................115 ...■
14th pillar: Cultural resources14.01 Number of World Heritage cultural sites* ...................33 ...■14.02 Sports stadiums* .........................................................13 ...■14.03 Number of international fairs and exhibitions* ............21 ...■14.04 Creative industries exports*.........................................32 ...■
Finland
* Hard data
Note: For further details and explanation, please refer to the section “How toRead the Country/Economy Profiles” at the beginning of this chapter.
part2A_profiles.r2 2/26/09 4:01 AM Page 195
The Travel & Tourism Competitiveness Report 2009 © 2009 World Economic Forum
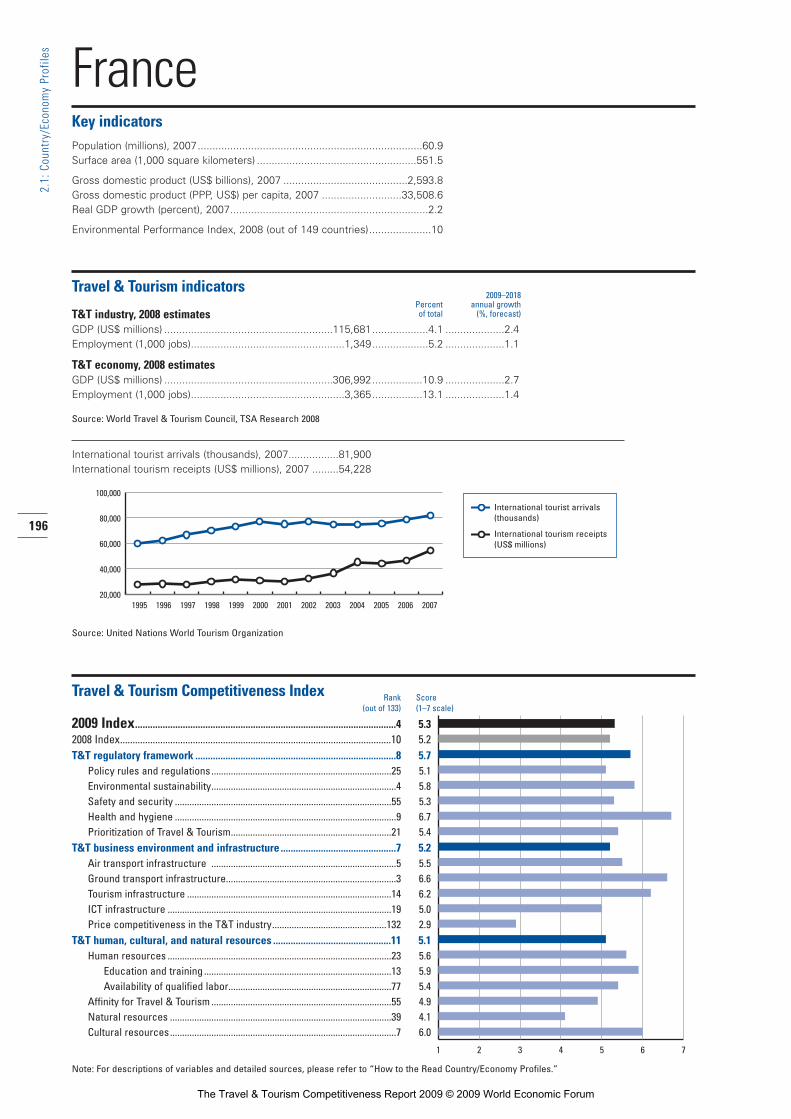
196
2.1:
Cou
ntry
/Eco
nom
y Pr
ofile
s
FranceKey indicatorsPopulation (millions), 2007............................................................................60.9Surface area (1,000 square kilometers) ......................................................551.5
Gross domestic product (US$ billions), 2007 ..........................................2,593.8Gross domestic product (PPP, US$) per capita, 2007 ...........................33,508.6Real GDP growth (percent), 2007...................................................................2.2
Environmental Performance Index, 2008 (out of 149 countries).....................10
Travel & Tourism indicators
T&T industry, 2008 estimatesGDP (US$ millions) .........................................................115,681...................4.1 ....................2.4Employment (1,000 jobs)....................................................1,349...................5.2 ....................1.1
T&T economy, 2008 estimatesGDP (US$ millions) .........................................................306,992.................10.9 ....................2.7Employment (1,000 jobs)....................................................3,365.................13.1 ....................1.4
Source: World Travel & Tourism Council, TSA Research 2008
International tourist arrivals (thousands), 2007.................81,900International tourism receipts (US$ millions), 2007 .........54,228
Source: United Nations World Tourism Organization
Travel & Tourism Competitiveness Index
2009 Index........................................................................................................4 5.32008 Index............................................................................................................10 5.2T&T regulatory framework ................................................................................8 5.7
Policy rules and regulations..........................................................................25 5.1Environmental sustainability............................................................................4 5.8Safety and security .........................................................................................55 5.3Health and hygiene ...........................................................................................9 6.7Prioritization of Travel & Tourism..................................................................21 5.4
T&T business environment and infrastructure ..............................................7 5.2Air transport infrastructure ............................................................................5 5.5Ground transport infrastructure......................................................................3 6.6Tourism infrastructure ....................................................................................14 6.2ICT infrastructure ............................................................................................19 5.0Price competitiveness in the T&T industry...............................................132 2.9
T&T human, cultural, and natural resources ...............................................11 5.1Human resources ............................................................................................23 5.6
Education and training .............................................................................13 5.9Availability of qualified labor...................................................................77 5.4
Affinity for Travel & Tourism ..........................................................................55 4.9Natural resources ...........................................................................................39 4.1Cultural resources.............................................................................................7 6.0
Note: For descriptions of variables and detailed sources, please refer to “How to the Read Country/Economy Profiles.”
Rank Score(out of 133) (1–7 scale)
International tourist arrivals (thousands)
International tourism receipts (US$ millions)
1995 1996 1997 1998 1999 2000 2001 2002 2003 2004 2005 2006 200720,000
40,000
60,000
80,000
100,000
1 2 3 4 5 6 7
2009–2018Percent annual growth of total (%, forecast)
part2A_profiles.r2 2/26/09 4:01 AM Page 196
The Travel & Tourism Competitiveness Report 2009 © 2009 World Economic Forum

197
2.1:
Cou
ntry
/Eco
nom
y Pr
ofile
s
The Travel & Tourism Competitiveness Index in detail ■ Competitive Advantage ■ Competitive Disadvantage
INDICATOR RANK/133
1st pillar: Policy rules and regulations1.01 Prevalence of foreign ownership .................................46 ...■1.02 Property rights..............................................................18 ...■1.03 Business impact of rules on FDI ..................................65 ...■1.04 Visa requirements* ......................................................40 ...■1.05 Openness of bilateral Air Service Agreements* ..........72 ...■1.06 Transparency of government policymaking..................33 ...■1.07 Time required to start a business*...............................15 ...■1.08 Cost to start a business* .............................................14 ...■
2nd pillar: Environmental sustainability2.01 Stringency of environmental regulation .......................14 ...■2.02 Enforcement of environmental regulation....................19 ...■2.03 Sustainability of T&T industry development.................19 ...■2.04 Carbon dioxide emissions* ..........................................86 ...■2.05 Particulate matter concentration* ..................................5 ...■2.06 Threatened species* ....................................................46 ...■2.07 Environmental treaty ratification*...................................2 ...■
3rd pillar: Safety and security3.01 Business costs of terrorism .........................................69 ...■3.02 Reliability of police services .........................................19 ...■3.03 Business costs of crime and violence..........................52 ...■3.04 Road traffic accidents*...............................................110 ...■
4th pillar: Health and hygiene4.01 Physician density*........................................................23 ...■4.02 Access to improved sanitation* .....................................1 ...■4.03 Access to improved drinking water*..............................1 ...■4.04 Hospital beds*..............................................................15 ...■
5th pillar: Prioritization of Travel & Tourism5.01 Government prioritization of the T&T industry.............31 ...■5.02 T&T government expenditure* ....................................75 ...■5.03 Effectiveness of marketing and branding.....................20 ...■5.04 T&T fair attendance*......................................................3 ...■
6th pillar: Air transport infrastructure6.01 Quality of air transport infrastructure .............................5 ...■6.02 Available seat kilometers, domestic*...........................13 ...■6.03 Available seat kilometers, international* ........................4 ...■6.04 Departures per 1,000 population*................................28 ...■6.05 Airport density* ............................................................49 ...■6.06 Number of operating airlines*........................................3 ...■6.07 International air transport network .................................6 ...■
7th pillar: Ground transport infrastructure7.01 Quality of roads ..............................................................1 ...■7.02 Quality of railroad infrastructure.....................................2 ...■7.03 Quality of port infrastructure ........................................10 ...■7.04 Quality of ground transport network ..............................5 ...■7.05 Road density*...............................................................14 ...■
INDICATOR RANK/133
8th pillar: Tourism infrastructure8.01 Hotel rooms*................................................................27 ...■8.02 Presence of major car rental companies*......................1 ...■8.03 ATMs accepting Visa cards* ..........................................9 ...■
9th pillar: ICT infrastructure9.01 Extent of business Internet use...................................23 ...■9.02 Internet users* .............................................................31 ...■9.03 Telephone lines*.............................................................7 ...■9.04 Broadband Internet subscribers* .................................13 ...■9.05 Mobile telephone subscribers*....................................51 ...■
10th pillar: Price competitiveness in the T&T industry10.01 Ticket taxes and airport charges*...............................114 ...■10.02 Purchasing power parity*...........................................123 ...■10.03 Extent and effect of taxation........................................98 ...■10.04 Fuel price levels* .......................................................116 ...■10.05 Hotel price index* ......................................................113 ...■
11th pillar: Human resources11.01 Primary education enrollment* ....................................13 ...■11.02 Secondary education enrollment*..................................7 ...■11.03 Quality of the educational system................................20 ...■11.04 Local availability of research and training services.........8 ...■11.05 Extent of staff training..................................................24 ...■11.06 Hiring and firing practices...........................................125 ...■11.07 Ease of hiring foreign labor ..........................................96 ...■11.08 HIV prevalence* ...........................................................73 ...■11.09 Business impact of HIV/AIDS.......................................40 ...■11.10 Life expectancy* ............................................................5 ...■
12th pillar: Affinity for Travel & Tourism12.01 Tourism openness* ......................................................91 ...■12.02 Attitude of population toward foreign visitors..............71 ...■12.03 Extension of business trips recommended ...................9 ...■
13th pillar: Natural resources13.01 Number of World Heritage natural sites* ....................16 ...■13.02 Protected areas* ..........................................................51 ...■13.03 Quality of the natural environment...............................32 ...■13.04 Total known species*...................................................66 ...■
14th pillar: Cultural resources14.01 Number of World Heritage cultural sites* .....................4 ...■14.02 Sports stadiums* .........................................................49 ...■14.03 Number of international fairs and exhibitions* ..............5 ...■14.04 Creative industries exports*...........................................7 ...■
France
* Hard data
Note: For further details and explanation, please refer to the section “How toRead the Country/Economy Profiles” at the beginning of this chapter.
part2A_profiles.r2 2/26/09 4:01 AM Page 197
The Travel & Tourism Competitiveness Report 2009 © 2009 World Economic Forum

198
2.1:
Cou
ntry
/Eco
nom
y Pr
ofile
s
Gambia, TheKey indicatorsPopulation (millions), 2007..............................................................................1.6Surface area (1,000 square kilometers) ........................................................11.3
Gross domestic product (US$ billions), 2007 .................................................0.6Gross domestic product (PPP, US$) per capita, 2007 .............................1,317.7Real GDP growth (percent), 2007...................................................................6.3
Environmental Performance Index, 2008 (out of 149 countries) ....................n/a
Travel & Tourism indicators
T&T industry, 2008 estimatesGDP (US$ millions) ..................................................................58...................8.0 ....................3.7Employment (1,000 jobs).........................................................39...................6.4 ....................2.6
T&T economy, 2008 estimatesGDP (US$ millions) ................................................................129.................17.9 ....................3.7Employment (1,000 jobs).........................................................89.................14.4 ....................2.7
Source: World Travel & Tourism Council, TSA Research 2008
International tourist arrivals (thousands), 2007......................143International tourism receipts (US$ millions), 2007 ................84
Source: United Nations World Tourism Organization
Travel & Tourism Competitiveness Index
2009 Index......................................................................................................87 3.72008 Index............................................................................................................84 3.7T&T regulatory framework ..............................................................................65 4.6
Policy rules and regulations..........................................................................85 4.1Environmental sustainability..........................................................................52 4.7Safety and security .........................................................................................27 5.9Health and hygiene .......................................................................................107 2.8Prioritization of Travel & Tourism..................................................................25 5.3
T&T business environment and infrastructure ............................................90 3.1Air transport infrastructure ..........................................................................85 2.7Ground transport infrastructure....................................................................58 3.8Tourism infrastructure ..................................................................................124 1.4ICT infrastructure ..........................................................................................100 2.1Price competitiveness in the T&T industry.................................................14 5.4
T&T human, cultural, and natural resources ...............................................98 3.5Human resources ..........................................................................................102 4.5
Education and training ...........................................................................112 3.6Availability of qualified labor...................................................................76 5.4
Affinity for Travel & Tourism ..........................................................................13 5.6Natural resources .........................................................................................101 2.6Cultural resources.........................................................................................107 1.5
Note: For descriptions of variables and detailed sources, please refer to “How to the Read Country/Economy Profiles.”
Rank Score(out of 133) (1–7 scale)
International tourist arrivals (thousands)
International tourism receipts (US$ millions)
1995 1996 1997 1998 1999 2000 2001 2002 2003 2004 2005 2006 20070
30
60
90
120
150
1 2 3 4 5 6 7
2009–2018Percent annual growth of total (%, forecast)
part2A_profiles.r2 2/26/09 4:01 AM Page 198
The Travel & Tourism Competitiveness Report 2009 © 2009 World Economic Forum

199
2.1:
Cou
ntry
/Eco
nom
y Pr
ofile
s
The Travel & Tourism Competitiveness Index in detail ■ Competitive Advantage ■ Competitive Disadvantage
INDICATOR RANK/133
1st pillar: Policy rules and regulations1.01 Prevalence of foreign ownership .................................15 ...■1.02 Property rights..............................................................56 ...■1.03 Business impact of rules on FDI ..................................13 ...■1.04 Visa requirements* ......................................................88 ...■1.05 Openness of bilateral Air Service Agreements* ..........76 ...■1.06 Transparency of government policymaking..................24 ...■1.07 Time required to start a business*...............................76 ...■1.08 Cost to start a business* ...........................................128 ...■
2nd pillar: Environmental sustainability2.01 Stringency of environmental regulation .......................45 ...■2.02 Enforcement of environmental regulation....................43 ...■2.03 Sustainability of T&T industry development...................3 ...■2.04 Carbon dioxide emissions* ..........................................13 ...■2.05 Particulate matter concentration* ..............................116 ...■2.06 Threatened species* ....................................................23 ...■2.07 Environmental treaty ratification*.................................81 ...■
3rd pillar: Safety and security3.01 Business costs of terrorism .........................................42 ...■3.02 Reliability of police services .........................................38 ...■3.03 Business costs of crime and violence..........................33 ...■3.04 Road traffic accidents*.................................................30 ...■
4th pillar: Health and hygiene4.01 Physician density*......................................................119 ...■4.02 Access to improved sanitation* ...................................96 ...■4.03 Access to improved drinking water*............................89 ...■4.04 Hospital beds*............................................................114 ...■
5th pillar: Prioritization of Travel & Tourism5.01 Government prioritization of the T&T industry.............11 ...■5.02 T&T government expenditure* ......................................9 ...■5.03 Effectiveness of marketing and branding.....................11 ...■5.04 T&T fair attendance*..................................................115 ...■
6th pillar: Air transport infrastructure6.01 Quality of air transport infrastructure ...........................71 ...■6.02 Available seat kilometers, domestic*.........................100 ...■6.03 Available seat kilometers, international* ....................128 ...■6.04 Departures per 1,000 population*...............................n/a ......6.05 Airport density* ............................................................76 ...■6.06 Number of operating airlines*....................................121 ...■6.07 International air transport network ...............................80 ...■
7th pillar: Ground transport infrastructure7.01 Quality of roads ............................................................56 ...■7.02 Quality of railroad infrastructure ..................................n/a ......7.03 Quality of port infrastructure ........................................62 ...■7.04 Quality of ground transport network ............................38 ...■7.05 Road density*...............................................................60 ...■
INDICATOR RANK/133
8th pillar: Tourism infrastructure8.01 Hotel rooms*................................................................69 ...■8.02 Presence of major car rental companies*..................122 ...■8.03 ATMs accepting Visa cards* ......................................124 ...■
9th pillar: ICT infrastructure9.01 Extent of business Internet use...................................78 ...■9.02 Internet users* ...........................................................104 ...■9.03 Telephone lines*.........................................................104 ...■9.04 Broadband Internet subscribers* ...............................121 ...■9.05 Mobile telephone subscribers*....................................91 ...■
10th pillar: Price competitiveness in the T&T industry10.01 Ticket taxes and airport charges*...............................100 ...■10.02 Purchasing power parity*...............................................1 ...■10.03 Extent and effect of taxation........................................35 ...■10.04 Fuel price levels* .........................................................80 ...■10.05 Hotel price index* ..........................................................1 ...■
11th pillar: Human resources11.01 Primary education enrollment* ..................................125 ...■11.02 Secondary education enrollment*..............................110 ...■11.03 Quality of the educational system................................34 ...■11.04 Local availability of research and training services.......93 ...■11.05 Extent of staff training..................................................53 ...■11.06 Hiring and firing practices.............................................22 ...■11.07 Ease of hiring foreign labor ..........................................26 ...■11.08 HIV prevalence* ...........................................................99 ...■11.09 Business impact of HIV/AIDS.......................................92 ...■11.10 Life expectancy* ........................................................110 ...■
12th pillar: Affinity for Travel & Tourism12.01 Tourism openness* ......................................................13 ...■12.02 Attitude of population toward foreign visitors..............39 ...■12.03 Extension of business trips recommended .................87 ...■
13th pillar: Natural resources13.01 Number of World Heritage natural sites* ....................74 ...■13.02 Protected areas* ........................................................115 ...■13.03 Quality of the natural environment...............................36 ...■13.04 Total known species*...................................................58 ...■
14th pillar: Cultural resources14.01 Number of World Heritage cultural sites* ...................65 ...■14.02 Sports stadiums* .......................................................106 ...■14.03 Number of international fairs and exhibitions* ............96 ...■14.04 Creative industries exports*.......................................116 ...■
Gambia, The
* Hard data
Note: For further details and explanation, please refer to the section “How toRead the Country/Economy Profiles” at the beginning of this chapter.
part2A_profiles.r2 2/26/09 4:01 AM Page 199
The Travel & Tourism Competitiveness Report 2009 © 2009 World Economic Forum

200
2.1:
Cou
ntry
/Eco
nom
y Pr
ofile
s
GeorgiaKey indicatorsPopulation (millions), 2007..............................................................................4.4Surface area (1,000 square kilometers) ........................................................69.7
Gross domestic product (US$ billions), 2007 ...............................................10.2Gross domestic product (PPP, US$) per capita, 2007 .............................4,694.1Real GDP growth (percent), 2007.................................................................12.4
Environmental Performance Index, 2008 (out of 149 countries).....................37
Travel & Tourism indicators
T&T industry, 2008 estimatesGDP (US$ millions) .................................................................n/a ...................n/a ....................n/aEmployment (1,000 jobs)........................................................n/a ...................n/a ....................n/a
T&T economy, 2008 estimatesGDP (US$ millions) .................................................................n/a ...................n/a ....................n/aEmployment (1,000 jobs)........................................................n/a ...................n/a ....................n/a
Source: World Travel & Tourism Council, TSA Research 2008
International tourist arrivals (thousands), 2007...................1,052International tourism receipts (US$ millions), 2007 ..............384
Source: United Nations World Tourism Organization
Travel & Tourism Competitiveness Index
2009 Index......................................................................................................73 3.92008 Index............................................................................................................72 3.8T&T regulatory framework ..............................................................................33 5.2
Policy rules and regulations..........................................................................56 4.6Environmental sustainability..........................................................................56 4.6Safety and security .........................................................................................32 5.9Health and hygiene .........................................................................................29 6.1Prioritization of Travel & Tourism..................................................................40 4.8
T&T business environment and infrastructure ............................................99 2.8Air transport infrastructure ........................................................................100 2.5Ground transport infrastructure....................................................................67 3.5Tourism infrastructure ..................................................................................115 1.5ICT infrastructure ............................................................................................96 2.1Price competitiveness in the T&T industry.................................................72 4.6
T&T human, cultural, and natural resources ...............................................92 3.6Human resources ............................................................................................51 5.2
Education and training .............................................................................84 4.4Availability of qualified labor.....................................................................8 6.0
Affinity for Travel & Tourism ..........................................................................37 5.1Natural resources .........................................................................................115 2.3Cultural resources...........................................................................................76 2.0
Note: For descriptions of variables and detailed sources, please refer to “How to the Read Country/Economy Profiles.”
Rank Score(out of 133) (1–7 scale)
International tourist arrivals (thousands)
International tourism receipts (US$ millions)
1995 1996 1997 1998 1999 2000 2001 2002 2003 2004 2005 2006 20070
200
400
600
800
1,000
1,200
1 2 3 4 5 6 7
2009–2018Percent annual growth of total (%, forecast)
part2A_profiles.r2 2/26/09 4:01 AM Page 200
The Travel & Tourism Competitiveness Report 2009 © 2009 World Economic Forum

201
2.1:
Cou
ntry
/Eco
nom
y Pr
ofile
s
The Travel & Tourism Competitiveness Index in detail ■ Competitive Advantage ■ Competitive Disadvantage
INDICATOR RANK/133
1st pillar: Policy rules and regulations1.01 Prevalence of foreign ownership .................................53 ...■1.02 Property rights............................................................109 ...■1.03 Business impact of rules on FDI ..................................60 ...■1.04 Visa requirements* ......................................................72 ...■1.05 Openness of bilateral Air Service Agreements* ........117 ...■1.06 Transparency of government policymaking..................86 ...■1.07 Time required to start a business*.................................3 ...■1.08 Cost to start a business* .............................................34 ...■
2nd pillar: Environmental sustainability2.01 Stringency of environmental regulation .......................70 ...■2.02 Enforcement of environmental regulation....................66 ...■2.03 Sustainability of T&T industry development.................79 ...■2.04 Carbon dioxide emissions* ..........................................31 ...■2.05 Particulate matter concentration* ................................85 ...■2.06 Threatened species* ....................................................77 ...■2.07 Environmental treaty ratification*.................................67 ...■
3rd pillar: Safety and security3.01 Business costs of terrorism .........................................50 ...■3.02 Reliability of police services .........................................39 ...■3.03 Business costs of crime and violence..........................39 ...■3.04 Road traffic accidents*.................................................23 ...■
4th pillar: Health and hygiene4.01 Physician density*..........................................................2 ...■4.02 Access to improved sanitation* ...................................52 ...■4.03 Access to improved drinking water*............................38 ...■4.04 Hospital beds*..............................................................48 ...■
5th pillar: Prioritization of Travel & Tourism5.01 Government prioritization of the T&T industry.............34 ...■5.02 T&T government expenditure* ...................................n/a ......5.03 Effectiveness of marketing and branding.....................74 ...■5.04 T&T fair attendance*....................................................62 ...■
6th pillar: Air transport infrastructure6.01 Quality of air transport infrastructure ...........................86 ...■6.02 Available seat kilometers, domestic*.........................100 ...■6.03 Available seat kilometers, international* ....................108 ...■6.04 Departures per 1,000 population*................................91 ...■6.05 Airport density* ............................................................68 ...■6.06 Number of operating airlines*......................................83 ...■6.07 International air transport network ...............................85 ...■
7th pillar: Ground transport infrastructure7.01 Quality of roads ............................................................68 ...■7.02 Quality of railroad infrastructure...................................38 ...■7.03 Quality of port infrastructure ........................................67 ...■7.04 Quality of ground transport network ............................71 ...■7.05 Road density*...............................................................66 ...■
INDICATOR RANK/133
8th pillar: Tourism infrastructure8.01 Hotel rooms*................................................................81 ...■8.02 Presence of major car rental companies*..................122 ...■8.03 ATMs accepting Visa cards* ........................................76 ...■
9th pillar: ICT infrastructure9.01 Extent of business Internet use...................................98 ...■9.02 Internet users* .............................................................96 ...■9.03 Telephone lines*...........................................................84 ...■9.04 Broadband Internet subscribers* .................................81 ...■9.05 Mobile telephone subscribers*....................................98 ...■
10th pillar: Price competitiveness in the T&T industry10.01 Ticket taxes and airport charges*.................................95 ...■10.02 Purchasing power parity*.............................................43 ...■10.03 Extent and effect of taxation........................................24 ...■10.04 Fuel price levels* .........................................................73 ...■10.05 Hotel price index* ......................................................106 ...■
11th pillar: Human resources11.01 Primary education enrollment* ....................................91 ...■11.02 Secondary education enrollment*................................73 ...■11.03 Quality of the educational system................................83 ...■11.04 Local availability of research and training services.....117 ...■11.05 Extent of staff training..................................................73 ...■11.06 Hiring and firing practices...............................................5 ...■11.07 Ease of hiring foreign labor ............................................6 ...■11.08 HIV prevalence* ...........................................................22 ...■11.09 Business impact of HIV/AIDS.......................................42 ...■11.10 Life expectancy* ..........................................................83 ...■
12th pillar: Affinity for Travel & Tourism12.01 Tourism openness* ......................................................60 ...■12.02 Attitude of population toward foreign visitors..............48 ...■12.03 Extension of business trips recommended .................12 ...■
13th pillar: Natural resources13.01 Number of World Heritage natural sites* ....................74 ...■13.02 Protected areas* ........................................................101 ...■13.03 Quality of the natural environment...............................77 ...■13.04 Total known species*...................................................96 ...■
14th pillar: Cultural resources14.01 Number of World Heritage cultural sites* ...................54 ...■14.02 Sports stadiums* .........................................................47 ...■14.03 Number of international fairs and exhibitions* ..........117 ...■14.04 Creative industries exports*.......................................105 ...■
Georgia
* Hard data
Note: For further details and explanation, please refer to the section “How toRead the Country/Economy Profiles” at the beginning of this chapter.
part2A_profiles.r2 2/26/09 4:01 AM Page 201
The Travel & Tourism Competitiveness Report 2009 © 2009 World Economic Forum

202
2.1:
Cou
ntry
/Eco
nom
y Pr
ofile
s
GermanyKey indicatorsPopulation (millions), 2007............................................................................82.7Surface area (1,000 square kilometers) ......................................................357.1
Gross domestic product (US$ billions), 2007 ..........................................3,320.9Gross domestic product (PPP, US$) per capita, 2007 ...........................34,212.4Real GDP growth (percent), 2007...................................................................2.5
Environmental Performance Index, 2008 (out of 149 countries).....................13
Travel & Tourism indicators
T&T industry, 2008 estimatesGDP (US$ millions) ...........................................................88,712...................2.4 ....................0.8Employment (1,000 jobs)....................................................1,062...................2.6 ..................–1.0
T&T economy, 2008 estimatesGDP (US$ millions) .........................................................316,217...................8.6 ....................1.9Employment (1,000 jobs)....................................................3,616...................9.0 ....................0.2
Source: World Travel & Tourism Council, TSA Research 2008
International tourist arrivals (thousands), 2007.................24,425International tourism receipts (US$ millions), 2007 .........36,029
Source: United Nations World Tourism Organization
Travel & Tourism Competitiveness Index
2009 Index........................................................................................................3 5.42008 Index..............................................................................................................3 5.4T&T regulatory framework ..............................................................................13 5.6
Policy rules and regulations..........................................................................17 5.3Environmental sustainability............................................................................6 5.7Safety and security .........................................................................................39 5.8Health and hygiene ...........................................................................................7 6.8Prioritization of Travel & Tourism..................................................................65 4.3
T&T business environment and infrastructure ..............................................3 5.4Air transport infrastructure ............................................................................7 5.5Ground transport infrastructure......................................................................5 6.5Tourism infrastructure ....................................................................................17 6.0ICT infrastructure ............................................................................................11 5.4Price competitiveness in the T&T industry...............................................119 3.8
T&T human, cultural, and natural resources .................................................9 5.2Human resources ............................................................................................21 5.7
Education and training .............................................................................11 5.9Availability of qualified labor...................................................................81 5.4
Affinity for Travel & Tourism ..........................................................................68 4.7Natural resources ...........................................................................................29 4.3Cultural resources.............................................................................................4 6.2
Note: For descriptions of variables and detailed sources, please refer to “How to the Read Country/Economy Profiles.”
Rank Score(out of 133) (1–7 scale)
International tourist arrivals (thousands)
International tourism receipts (US$ millions)
1995 1996 1997 1998 1999 2000 2001 2002 2003 2004 2005 2006 200710,000
15,000
20,000
25,000
30,000
35,000
40,000
1 2 3 4 5 6 7
2009–2018Percent annual growth of total (%, forecast)
part2A_profiles.r2 2/26/09 4:01 AM Page 202
The Travel & Tourism Competitiveness Report 2009 © 2009 World Economic Forum

203
2.1:
Cou
ntry
/Eco
nom
y Pr
ofile
s
The Travel & Tourism Competitiveness Index in detail ■ Competitive Advantage ■ Competitive Disadvantage
INDICATOR RANK/133
1st pillar: Policy rules and regulations1.01 Prevalence of foreign ownership .................................31 ...■1.02 Property rights................................................................6 ...■1.03 Business impact of rules on FDI ..................................46 ...■1.04 Visa requirements* ......................................................40 ...■1.05 Openness of bilateral Air Service Agreements* ..........16 ...■1.06 Transparency of government policymaking..................22 ...■1.07 Time required to start a business*...............................54 ...■1.08 Cost to start a business* .............................................45 ...■
2nd pillar: Environmental sustainability2.01 Stringency of environmental regulation .........................5 ...■2.02 Enforcement of environmental regulation......................1 ...■2.03 Sustainability of T&T industry development.................73 ...■2.04 Carbon dioxide emissions* ........................................104 ...■2.05 Particulate matter concentration* ................................22 ...■2.06 Threatened species* ....................................................33 ...■2.07 Environmental treaty ratification*.................................10 ...■
3rd pillar: Safety and security3.01 Business costs of terrorism .........................................62 ...■3.02 Reliability of police services ...........................................4 ...■3.03 Business costs of crime and violence..........................19 ...■3.04 Road traffic accidents*...............................................106 ...■
4th pillar: Health and hygiene4.01 Physician density*........................................................21 ...■4.02 Access to improved sanitation* .....................................1 ...■4.03 Access to improved drinking water*..............................1 ...■4.04 Hospital beds*................................................................6 ...■
5th pillar: Prioritization of Travel & Tourism5.01 Government prioritization of the T&T industry...........106 ...■5.02 T&T government expenditure* ..................................100 ...■5.03 Effectiveness of marketing and branding.....................77 ...■5.04 T&T fair attendance*....................................................20 ...■
6th pillar: Air transport infrastructure6.01 Quality of air transport infrastructure .............................3 ...■6.02 Available seat kilometers, domestic*...........................15 ...■6.03 Available seat kilometers, international* ........................3 ...■6.04 Departures per 1,000 population*................................27 ...■6.05 Airport density* ............................................................87 ...■6.06 Number of operating airlines*........................................4 ...■6.07 International air transport network .................................1 ...■
7th pillar: Ground transport infrastructure7.01 Quality of roads ..............................................................4 ...■7.02 Quality of railroad infrastructure.....................................4 ...■7.03 Quality of port infrastructure ..........................................4 ...■7.04 Quality of ground transport network ..............................2 ...■7.05 Road density*..............................................................n/a ......
INDICATOR RANK/133
8th pillar: Tourism infrastructure8.01 Hotel rooms*................................................................23 ...■8.02 Presence of major car rental companies*......................1 ...■8.03 ATMs accepting Visa cards* ........................................18 ...■
9th pillar: ICT infrastructure9.01 Extent of business Internet use.....................................6 ...■9.02 Internet users* .............................................................28 ...■9.03 Telephone lines*.............................................................2 ...■9.04 Broadband Internet subscribers* .................................15 ...■9.05 Mobile telephone subscribers*....................................16 ...■
10th pillar: Price competitiveness in the T&T industry10.01 Ticket taxes and airport charges*.................................27 ...■10.02 Purchasing power parity*...........................................119 ...■10.03 Extent and effect of taxation......................................104 ...■10.04 Fuel price levels* .......................................................122 ...■10.05 Hotel price index* ........................................................54 ...■
11th pillar: Human resources11.01 Primary education enrollment* ....................................17 ...■11.02 Secondary education enrollment*................................25 ...■11.03 Quality of the educational system................................23 ...■11.04 Local availability of research and training services.........5 ...■11.05 Extent of staff training..................................................12 ...■11.06 Hiring and firing practices...........................................129 ...■11.07 Ease of hiring foreign labor ..........................................83 ...■11.08 HIV prevalence* ...........................................................22 ...■11.09 Business impact of HIV/AIDS.......................................16 ...■11.10 Life expectancy* ..........................................................12 ...■
12th pillar: Affinity for Travel & Tourism12.01 Tourism openness* ......................................................90 ...■12.02 Attitude of population toward foreign visitors..............67 ...■12.03 Extension of business trips recommended .................43 ...■
13th pillar: Natural resources13.01 Number of World Heritage natural sites* ....................40 ...■13.02 Protected areas* ............................................................2 ...■13.03 Quality of the natural environment...............................18 ...■13.04 Total known species*...................................................81 ...■
14th pillar: Cultural resources14.01 Number of World Heritage cultural sites* .....................4 ...■14.02 Sports stadiums* .........................................................33 ...■14.03 Number of international fairs and exhibitions* ..............2 ...■14.04 Creative industries exports*...........................................5 ...■
Germany
* Hard data
Note: For further details and explanation, please refer to the section “How toRead the Country/Economy Profiles” at the beginning of this chapter.
part2A_profiles.r2 2/26/09 4:01 AM Page 203
The Travel & Tourism Competitiveness Report 2009 © 2009 World Economic Forum

204
2.1:
Cou
ntry
/Eco
nom
y Pr
ofile
s
GhanaKey indicatorsPopulation (millions), 2007............................................................................23.0Surface area (1,000 square kilometers) ......................................................238.5
Gross domestic product (US$ billions), 2007 ...............................................15.2Gross domestic product (PPP, US$) per capita, 2007 .............................1,426.0Real GDP growth (percent), 2007...................................................................6.3
Environmental Performance Index, 2008 (out of 149 countries).....................86
Travel & Tourism indicators
T&T industry, 2008 estimatesGDP (US$ millions) ................................................................726...................4.3 ....................5.0Employment (1,000 jobs).......................................................175...................3.5 ....................2.6
T&T economy, 2008 estimatesGDP (US$ millions) .............................................................1,611...................9.6 ....................5.0Employment (1,000 jobs).......................................................393...................7.8 ....................2.5
Source: World Travel & Tourism Council, TSA Research 2008
International tourist arrivals (thousands), 2006......................497International tourism receipts (US$ millions), 2006 ..............861
Source: United Nations World Tourism Organization
Travel & Tourism Competitiveness Index
2009 Index....................................................................................................110 3.42008 Index..........................................................................................................n/a n/aT&T regulatory framework ............................................................................105 3.9
Policy rules and regulations..........................................................................84 4.1Environmental sustainability..........................................................................48 4.8Safety and security .........................................................................................69 5.1Health and hygiene .......................................................................................117 2.1Prioritization of Travel & Tourism................................................................108 3.6
T&T business environment and infrastructure ..........................................102 2.8Air transport infrastructure ........................................................................101 2.5Ground transport infrastructure....................................................................96 2.9Tourism infrastructure ..................................................................................105 1.8ICT infrastructure ..........................................................................................114 1.8Price competitiveness in the T&T industry.................................................36 5.1
T&T human, cultural, and natural resources .............................................104 3.5Human resources ..........................................................................................114 4.1
Education and training ...........................................................................120 3.4Availability of qualified labor.................................................................111 4.9
Affinity for Travel & Tourism ..........................................................................56 4.9Natural resources ...........................................................................................57 3.5Cultural resources.........................................................................................105 1.5
Note: For descriptions of variables and detailed sources, please refer to “How to the Read Country/Economy Profiles.”
Rank Score(out of 133) (1–7 scale)
International tourist arrivals (thousands)
International tourism receipts (US$ millions)
1995 1996 1997 1998 1999 2000 2001 2002 2003 2004 2005 2006 20070
200
400
600
800
1,000
1 2 3 4 5 6 7
2009–2018Percent annual growth of total (%, forecast)
part2A_profiles.r2 2/26/09 4:01 AM Page 204
The Travel & Tourism Competitiveness Report 2009 © 2009 World Economic Forum

205
2.1:
Cou
ntry
/Eco
nom
y Pr
ofile
s
The Travel & Tourism Competitiveness Index in detail ■ Competitive Advantage ■ Competitive Disadvantage
INDICATOR RANK/133
1st pillar: Policy rules and regulations1.01 Prevalence of foreign ownership .................................29 ...■1.02 Property rights..............................................................74 ...■1.03 Business impact of rules on FDI ..................................35 ...■1.04 Visa requirements* ....................................................108 ...■1.05 Openness of bilateral Air Service Agreements* ..........62 ...■1.06 Transparency of government policymaking..................84 ...■1.07 Time required to start a business*...............................91 ...■1.08 Cost to start a business* .............................................97 ...■
2nd pillar: Environmental sustainability2.01 Stringency of environmental regulation .......................97 ...■2.02 Enforcement of environmental regulation..................101 ...■2.03 Sustainability of T&T industry development.................88 ...■2.04 Carbon dioxide emissions* ..........................................20 ...■2.05 Particulate matter concentration* ................................58 ...■2.06 Threatened species* ....................................................47 ...■2.07 Environmental treaty ratification*.................................67 ...■
3rd pillar: Safety and security3.01 Business costs of terrorism .........................................18 ...■3.02 Reliability of police services .........................................89 ...■3.03 Business costs of crime and violence..........................63 ...■3.04 Road traffic accidents*.................................................95 ...■
4th pillar: Health and hygiene4.01 Physician density*......................................................114 ...■4.02 Access to improved sanitation* .................................125 ...■4.03 Access to improved drinking water*..........................100 ...■4.04 Hospital beds*............................................................107 ...■
5th pillar: Prioritization of Travel & Tourism5.01 Government prioritization of the T&T industry.............60 ...■5.02 T&T government expenditure* ....................................65 ...■5.03 Effectiveness of marketing and branding...................104 ...■5.04 T&T fair attendance*..................................................115 ...■
6th pillar: Air transport infrastructure6.01 Quality of air transport infrastructure ...........................91 ...■6.02 Available seat kilometers, domestic*...........................92 ...■6.03 Available seat kilometers, international* ......................80 ...■6.04 Departures per 1,000 population*..............................122 ...■6.05 Airport density* ..........................................................118 ...■6.06 Number of operating airlines*......................................70 ...■6.07 International air transport network ...............................58 ...■
7th pillar: Ground transport infrastructure7.01 Quality of roads ............................................................73 ...■7.02 Quality of railroad infrastructure.................................110 ...■7.03 Quality of port infrastructure ........................................86 ...■7.04 Quality of ground transport network ............................81 ...■7.05 Road density*...............................................................73 ...■
INDICATOR RANK/133
8th pillar: Tourism infrastructure8.01 Hotel rooms*..............................................................103 ...■8.02 Presence of major car rental companies*....................95 ...■8.03 ATMs accepting Visa cards*........................................n/a ......
9th pillar: ICT infrastructure9.01 Extent of business Internet use.................................100 ...■9.02 Internet users* ...........................................................115 ...■9.03 Telephone lines*.........................................................114 ...■9.04 Broadband Internet subscribers* ...............................104 ...■9.05 Mobile telephone subscribers*..................................107 ...■
10th pillar: Price competitiveness in the T&T industry10.01 Ticket taxes and airport charges*...............................101 ...■10.02 Purchasing power parity*.............................................41 ...■10.03 Extent and effect of taxation........................................51 ...■10.04 Fuel price levels* .........................................................62 ...■10.05 Hotel price index* ..........................................................9 ...■
11th pillar: Human resources11.01 Primary education enrollment* ..................................123 ...■11.02 Secondary education enrollment*..............................108 ...■11.03 Quality of the educational system................................75 ...■11.04 Local availability of research and training services.....101 ...■11.05 Extent of staff training................................................103 ...■11.06 Hiring and firing practices.............................................92 ...■11.07 Ease of hiring foreign labor ..........................................66 ...■11.08 HIV prevalence* .........................................................114 ...■11.09 Business impact of HIV/AIDS.....................................111 ...■11.10 Life expectancy* ........................................................114 ...■
12th pillar: Affinity for Travel & Tourism12.01 Tourism openness* ......................................................26 ...■12.02 Attitude of population toward foreign visitors..............44 ...■12.03 Extension of business trips recommended ...............125 ...■
13th pillar: Natural resources13.01 Number of World Heritage natural sites* ....................74 ...■13.02 Protected areas* ..........................................................35 ...■13.03 Quality of the natural environment...............................99 ...■13.04 Total known species*...................................................33 ...■
14th pillar: Cultural resources14.01 Number of World Heritage cultural sites* ...................82 ...■14.02 Sports stadiums* .........................................................97 ...■14.03 Number of international fairs and exhibitions* ............78 ...■14.04 Creative industries exports*.........................................66 ...■
Ghana
* Hard data
Note: For further details and explanation, please refer to the section “How toRead the Country/Economy Profiles” at the beginning of this chapter.
part2A_profiles.r2 2/26/09 4:01 AM Page 205
The Travel & Tourism Competitiveness Report 2009 © 2009 World Economic Forum

206
2.1:
Cou
ntry
/Eco
nom
y Pr
ofile
s
GreeceKey indicatorsPopulation (millions), 2007............................................................................11.2Surface area (1,000 square kilometers) ......................................................132.0
Gross domestic product (US$ billions), 2007 .............................................313.8Gross domestic product (PPP, US$) per capita, 2007 ...........................29,146.3Real GDP growth (percent), 2007...................................................................4.0
Environmental Performance Index, 2008 (out of 149 countries).....................44
Travel & Tourism indicators
T&T industry, 2008 estimatesGDP (US$ millions) ...........................................................21,394...................7.8 ....................3.9Employment (1,000 jobs).......................................................496.................10.8 ....................3.0
T&T economy, 2008 estimatesGDP (US$ millions) ...........................................................47,420.................17.2 ....................3.9Employment (1,000 jobs).......................................................963.................20.9 ....................3.4
Source: World Travel & Tourism Council, TSA Research 2008
International tourist arrivals (thousands), 2007.................17,518International tourism receipts (US$ millions), 2007 .........15,513
Source: United Nations World Tourism Organization
Travel & Tourism Competitiveness Index
2009 Index......................................................................................................24 4.92008 Index............................................................................................................22 4.9T&T regulatory framework ..............................................................................18 5.5
Policy rules and regulations..........................................................................57 4.6Environmental sustainability..........................................................................47 4.8Safety and security .........................................................................................47 5.6Health and hygiene .........................................................................................19 6.4Prioritization of Travel & Tourism....................................................................3 6.1
T&T business environment and infrastructure ............................................27 4.7Air transport infrastructure ..........................................................................19 4.7Ground transport infrastructure....................................................................43 4.1Tourism infrastructure ......................................................................................5 6.7ICT infrastructure ............................................................................................40 3.8Price competitiveness in the T&T industry...............................................114 3.9
T&T human, cultural, and natural resources ...............................................27 4.6Human resources ............................................................................................44 5.3
Education and training .............................................................................53 4.9Availability of qualified labor...................................................................41 5.6
Affinity for Travel & Tourism ..........................................................................35 5.1Natural resources ...........................................................................................74 3.0Cultural resources...........................................................................................23 5.0
Note: For descriptions of variables and detailed sources, please refer to “How to the Read Country/Economy Profiles.”
Rank Score(out of 133) (1–7 scale)
International tourist arrivals (thousands)
International tourism receipts (US$ millions)
1995 1996 1997 1998 1999 2000 2001 2002 2003 2004 2005 2006 20070
5,000
10,000
15,000
20,000
1 2 3 4 5 6 7
2009–2018Percent annual growth of total (%, forecast)
part2A_profiles.r2 2/26/09 4:01 AM Page 206
The Travel & Tourism Competitiveness Report 2009 © 2009 World Economic Forum

207
2.1:
Cou
ntry
/Eco
nom
y Pr
ofile
s
The Travel & Tourism Competitiveness Index in detail ■ Competitive Advantage ■ Competitive Disadvantage
INDICATOR RANK/133
1st pillar: Policy rules and regulations1.01 Prevalence of foreign ownership .................................64 ...■1.02 Property rights..............................................................51 ...■1.03 Business impact of rules on FDI ................................107 ...■1.04 Visa requirements* ......................................................40 ...■1.05 Openness of bilateral Air Service Agreements* ..........51 ...■1.06 Transparency of government policymaking..................99 ...■1.07 Time required to start a business*...............................57 ...■1.08 Cost to start a business* .............................................64 ...■
2nd pillar: Environmental sustainability2.01 Stringency of environmental regulation .......................67 ...■2.02 Enforcement of environmental regulation....................74 ...■2.03 Sustainability of T&T industry development.................69 ...■2.04 Carbon dioxide emissions* ..........................................99 ...■2.05 Particulate matter concentration* ................................66 ...■2.06 Threatened species* ....................................................81 ...■2.07 Environmental treaty ratification*...................................2 ...■
3rd pillar: Safety and security3.01 Business costs of terrorism .........................................56 ...■3.02 Reliability of police services .........................................63 ...■3.03 Business costs of crime and violence..........................31 ...■3.04 Road traffic accidents*.................................................73 ...■
4th pillar: Health and hygiene4.01 Physician density*..........................................................1 ...■4.02 Access to improved sanitation* ...................................39 ...■4.03 Access to improved drinking water*..............................1 ...■4.04 Hospital beds*..............................................................37 ...■
5th pillar: Prioritization of Travel & Tourism5.01 Government prioritization of the T&T industry.............20 ...■5.02 T&T government expenditure* ....................................13 ...■5.03 Effectiveness of marketing and branding.....................39 ...■5.04 T&T fair attendance*......................................................3 ...■
6th pillar: Air transport infrastructure6.01 Quality of air transport infrastructure ...........................40 ...■6.02 Available seat kilometers, domestic*...........................34 ...■6.03 Available seat kilometers, international* ......................32 ...■6.04 Departures per 1,000 population*................................31 ...■6.05 Airport density* ............................................................14 ...■6.06 Number of operating airlines*......................................19 ...■6.07 International air transport network ...............................44 ...■
7th pillar: Ground transport infrastructure7.01 Quality of roads ............................................................47 ...■7.02 Quality of railroad infrastructure...................................50 ...■7.03 Quality of port infrastructure ........................................57 ...■7.04 Quality of ground transport network ............................41 ...■7.05 Road density*...............................................................35 ...■
INDICATOR RANK/133
8th pillar: Tourism infrastructure8.01 Hotel rooms*..................................................................4 ...■8.02 Presence of major car rental companies*......................1 ...■8.03 ATMs accepting Visa cards* ........................................20 ...■
9th pillar: ICT infrastructure9.01 Extent of business Internet use...................................97 ...■9.02 Internet users* .............................................................63 ...■9.03 Telephone lines*...........................................................10 ...■9.04 Broadband Internet subscribers* .................................37 ...■9.05 Mobile telephone subscribers*....................................29 ...■
10th pillar: Price competitiveness in the T&T industry10.01 Ticket taxes and airport charges*.................................99 ...■10.02 Purchasing power parity*...........................................107 ...■10.03 Extent and effect of taxation........................................72 ...■10.04 Fuel price levels* .........................................................96 ...■10.05 Hotel price index* ........................................................83 ...■
11th pillar: Human resources11.01 Primary education enrollment* ......................................7 ...■11.02 Secondary education enrollment*................................17 ...■11.03 Quality of the educational system................................82 ...■11.04 Local availability of research and training services.......87 ...■11.05 Extent of staff training..................................................81 ...■11.06 Hiring and firing practices...........................................113 ...■11.07 Ease of hiring foreign labor ..........................................73 ...■11.08 HIV prevalence* ...........................................................49 ...■11.09 Business impact of HIV/AIDS.......................................29 ...■11.10 Life expectancy* ..........................................................12 ...■
12th pillar: Affinity for Travel & Tourism12.01 Tourism openness* ......................................................50 ...■12.02 Attitude of population toward foreign visitors..............16 ...■12.03 Extension of business trips recommended .................28 ...■
13th pillar: Natural resources13.01 Number of World Heritage natural sites* ....................23 ...■13.02 Protected areas* ........................................................108 ...■13.03 Quality of the natural environment...............................62 ...■13.04 Total known species*...................................................73 ...■
14th pillar: Cultural resources14.01 Number of World Heritage cultural sites* .....................9 ...■14.02 Sports stadiums* .........................................................34 ...■14.03 Number of international fairs and exhibitions* ............19 ...■14.04 Creative industries exports*.........................................34 ...■
Greece
* Hard data
Note: For further details and explanation, please refer to the section “How toRead the Country/Economy Profiles” at the beginning of this chapter.
part2A_profiles.r2 2/26/09 4:01 AM Page 207
The Travel & Tourism Competitiveness Report 2009 © 2009 World Economic Forum

208
2.1:
Cou
ntry
/Eco
nom
y Pr
ofile
s
GuatemalaKey indicatorsPopulation (millions), 2007............................................................................13.2Surface area (1,000 square kilometers) ......................................................108.9
Gross domestic product (US$ billions), 2007 ...............................................33.7Gross domestic product (PPP, US$) per capita, 2007 .............................4,702.5Real GDP growth (percent), 2007...................................................................5.7
Environmental Performance Index, 2008 (out of 149 countries).....................69
Travel & Tourism indicators
T&T industry, 2008 estimatesGDP (US$ millions) .............................................................1,257...................3.0 ....................3.7Employment (1,000 jobs).......................................................110...................2.6 ....................2.7
T&T economy, 2008 estimatesGDP (US$ millions) .............................................................2,864...................6.8 ....................3.9Employment (1,000 jobs).......................................................248...................5.9 ....................3.0
Source: World Travel & Tourism Council, TSA Research 2008
International tourist arrivals (thousands), 2007...................1,448International tourism receipts (US$ millions), 2007 ...........1,199
Source: United Nations World Tourism Organization
Travel & Tourism Competitiveness Index
2009 Index......................................................................................................70 3.92008 Index............................................................................................................68 3.9T&T regulatory framework ..............................................................................81 4.3
Policy rules and regulations..........................................................................45 4.8Environmental sustainability..........................................................................95 4.2Safety and security .......................................................................................114 4.1Health and hygiene .........................................................................................88 4.0Prioritization of Travel & Tourism..................................................................55 4.6
T&T business environment and infrastructure ............................................81 3.2Air transport infrastructure ..........................................................................71 2.9Ground transport infrastructure....................................................................92 2.9Tourism infrastructure ....................................................................................82 2.3ICT infrastructure ............................................................................................78 2.6Price competitiveness in the T&T industry.................................................23 5.3
T&T human, cultural, and natural resources ...............................................48 4.2Human resources ............................................................................................85 4.9
Education and training .............................................................................92 4.3Availability of qualified labor...................................................................54 5.5
Affinity for Travel & Tourism ..........................................................................40 5.0Natural resources ...........................................................................................20 4.7Cultural resources...........................................................................................74 2.1
Note: For descriptions of variables and detailed sources, please refer to “How to the Read Country/Economy Profiles.”
Rank Score(out of 133) (1–7 scale)
International tourist arrivals (thousands)
International tourism receipts (US$ millions)
1995 1996 1997 1998 1999 2000 2001 2002 2003 2004 2005 2006 20070
300
600
900
1,200
1,500
1 2 3 4 5 6 7
2009–2018Percent annual growth of total (%, forecast)
part2A_profiles.r2 2/26/09 4:01 AM Page 208
The Travel & Tourism Competitiveness Report 2009 © 2009 World Economic Forum

209
2.1:
Cou
ntry
/Eco
nom
y Pr
ofile
s
The Travel & Tourism Competitiveness Index in detail ■ Competitive Advantage ■ Competitive Disadvantage
INDICATOR RANK/133
1st pillar: Policy rules and regulations1.01 Prevalence of foreign ownership .................................41 ...■1.02 Property rights..............................................................87 ...■1.03 Business impact of rules on FDI ..................................73 ...■1.04 Visa requirements* ......................................................17 ...■1.05 Openness of bilateral Air Service Agreements* ............3 ...■1.06 Transparency of government policymaking..................61 ...■1.07 Time required to start a business*...............................71 ...■1.08 Cost to start a business* ...........................................105 ...■
2nd pillar: Environmental sustainability2.01 Stringency of environmental regulation .......................85 ...■2.02 Enforcement of environmental regulation....................89 ...■2.03 Sustainability of T&T industry development.................63 ...■2.04 Carbon dioxide emissions* ..........................................35 ...■2.05 Particulate matter concentration* ................................95 ...■2.06 Threatened species* ..................................................115 ...■2.07 Environmental treaty ratification*.................................67 ...■
3rd pillar: Safety and security3.01 Business costs of terrorism .......................................101 ...■3.02 Reliability of police services .......................................127 ...■3.03 Business costs of crime and violence........................130 ...■3.04 Road traffic accidents*.................................................48 ...■
4th pillar: Health and hygiene4.01 Physician density*........................................................89 ...■4.02 Access to improved sanitation* ...................................70 ...■4.03 Access to improved drinking water*............................58 ...■4.04 Hospital beds*............................................................116 ...■
5th pillar: Prioritization of Travel & Tourism5.01 Government prioritization of the T&T industry.............51 ...■5.02 T&T government expenditure* ....................................40 ...■5.03 Effectiveness of marketing and branding.....................62 ...■5.04 T&T fair attendance*....................................................62 ...■
6th pillar: Air transport infrastructure6.01 Quality of air transport infrastructure ...........................53 ...■6.02 Available seat kilometers, domestic*...........................70 ...■6.03 Available seat kilometers, international* ......................87 ...■6.04 Departures per 1,000 population*...............................n/a ......6.05 Airport density* ..........................................................120 ...■6.06 Number of operating airlines*......................................95 ...■6.07 International air transport network ...............................46 ...■
7th pillar: Ground transport infrastructure7.01 Quality of roads ............................................................52 ...■7.02 Quality of railroad infrastructure.................................114 ...■7.03 Quality of port infrastructure ........................................63 ...■7.04 Quality of ground transport network..........................105 ...■7.05 Road density*...............................................................90 ...■
INDICATOR RANK/133
8th pillar: Tourism infrastructure8.01 Hotel rooms*................................................................66 ...■8.02 Presence of major car rental companies*....................73 ...■8.03 ATMs accepting Visa cards* ........................................86 ...■
9th pillar: ICT infrastructure9.01 Extent of business Internet use...................................32 ...■9.02 Internet users* .............................................................93 ...■9.03 Telephone lines*...........................................................88 ...■9.04 Broadband Internet subscribers* .................................96 ...■9.05 Mobile telephone subscribers*....................................68 ...■
10th pillar: Price competitiveness in the T&T industry10.01 Ticket taxes and airport charges*.................................39 ...■10.02 Purchasing power parity*.............................................62 ...■10.03 Extent and effect of taxation........................................40 ...■10.04 Fuel price levels* .........................................................36 ...■10.05 Hotel price index* ........................................................20 ...■
11th pillar: Human resources11.01 Primary education enrollment* ....................................57 ...■11.02 Secondary education enrollment*..............................105 ...■11.03 Quality of the educational system..............................118 ...■11.04 Local availability of research and training services.......48 ...■11.05 Extent of staff training..................................................55 ...■11.06 Hiring and firing practices.............................................41 ...■11.07 Ease of hiring foreign labor ..........................................42 ...■11.08 HIV prevalence* ...........................................................94 ...■11.09 Business impact of HIV/AIDS.......................................74 ...■11.10 Life expectancy* ..........................................................89 ...■
12th pillar: Affinity for Travel & Tourism12.01 Tourism openness* ......................................................49 ...■12.02 Attitude of population toward foreign visitors..............69 ...■12.03 Extension of business trips recommended .................21 ...■
13th pillar: Natural resources13.01 Number of World Heritage natural sites* ....................40 ...■13.02 Protected areas* ..........................................................10 ...■13.03 Quality of the natural environment...............................70 ...■13.04 Total known species*...................................................27 ...■
14th pillar: Cultural resources14.01 Number of World Heritage cultural sites* ...................45 ...■14.02 Sports stadiums* .........................................................77 ...■14.03 Number of international fairs and exhibitions* ............70 ...■14.04 Creative industries exports*.........................................58 ...■
Guatemala
* Hard data
Note: For further details and explanation, please refer to the section “How toRead the Country/Economy Profiles” at the beginning of this chapter.
part2A_profiles.r2 2/26/09 4:01 AM Page 209
The Travel & Tourism Competitiveness Report 2009 © 2009 World Economic Forum

210
2.1:
Cou
ntry
/Eco
nom
y Pr
ofile
s
GuyanaKey indicatorsPopulation (millions), 2007..............................................................................0.8Surface area (1,000 square kilometers) ......................................................215.0
Gross domestic product (US$ billions), 2007 .................................................1.1Gross domestic product (PPP, US$) per capita, 2007 .............................3,841.2Real GDP growth (percent), 2007...................................................................5.5
Environmental Performance Index, 2008 (out of 149 countries)...................108
Travel & Tourism indicators
T&T industry, 2008 estimatesGDP (US$ millions) ..................................................................24...................2.2 ....................5.1Employment (1,000 jobs)...........................................................6...................1.8 ....................3.7
T&T economy, 2008 estimatesGDP (US$ millions) ..................................................................90...................8.3 ....................4.4Employment (1,000 jobs).........................................................21...................6.8 ....................3.0
Source: World Travel & Tourism Council, TSA Research 2008
International tourist arrivals (thousands), 2007......................131International tourism receipts (US$ millions), 2007 ................50
Source: United Nations World Tourism Organization
Travel & Tourism Competitiveness Index
2009 Index....................................................................................................102 3.52008 Index..........................................................................................................109 3.4T&T regulatory framework ..............................................................................94 4.1
Policy rules and regulations........................................................................118 3.4Environmental sustainability..........................................................................50 4.7Safety and security .......................................................................................111 4.2Health and hygiene .........................................................................................84 4.1Prioritization of Travel & Tourism..................................................................72 4.2
T&T business environment and infrastructure ..........................................111 2.7Air transport infrastructure ........................................................................112 2.3Ground transport infrastructure..................................................................109 2.6Tourism infrastructure ..................................................................................128 1.1ICT infrastructure ............................................................................................82 2.4Price competitiveness in the T&T industry.................................................41 5.0
T&T human, cultural, and natural resources ...............................................88 3.7Human resources ............................................................................................60 5.1
Education and training .............................................................................62 4.8Availability of qualified labor...................................................................71 5.4
Affinity for Travel & Tourism ..........................................................................38 5.1Natural resources ...........................................................................................64 3.2Cultural resources.........................................................................................122 1.3
Note: For descriptions of variables and detailed sources, please refer to “How to the Read Country/Economy Profiles.”
Rank Score(out of 133) (1–7 scale)
International tourist arrivals (thousands)
International tourism receipts (US$ millions)
1995 1996 1997 1998 1999 2000 2001 2002 2003 2004 2005 2006 20070
30
60
90
120
150
1 2 3 4 5 6 7
2009–2018Percent annual growth of total (%, forecast)
part2A_profiles.r2 2/26/09 4:01 AM Page 210
The Travel & Tourism Competitiveness Report 2009 © 2009 World Economic Forum

211
2.1:
Cou
ntry
/Eco
nom
y Pr
ofile
s
The Travel & Tourism Competitiveness Index in detail ■ Competitive Advantage ■ Competitive Disadvantage
INDICATOR RANK/133
1st pillar: Policy rules and regulations1.01 Prevalence of foreign ownership .................................95 ...■1.02 Property rights............................................................104 ...■1.03 Business impact of rules on FDI ..................................86 ...■1.04 Visa requirements* ......................................................91 ...■1.05 Openness of bilateral Air Service Agreements* ........108 ...■1.06 Transparency of government policymaking..................95 ...■1.07 Time required to start a business*.............................100 ...■1.08 Cost to start a business* ...........................................111 ...■
2nd pillar: Environmental sustainability2.01 Stringency of environmental regulation .......................82 ...■2.02 Enforcement of environmental regulation....................78 ...■2.03 Sustainability of T&T industry development.................90 ...■2.04 Carbon dioxide emissions* ..........................................51 ...■2.05 Particulate matter concentration* ................................64 ...■2.06 Threatened species* ....................................................10 ...■2.07 Environmental treaty ratification*.................................94 ...■
3rd pillar: Safety and security3.01 Business costs of terrorism .......................................120 ...■3.02 Reliability of police services .......................................118 ...■3.03 Business costs of crime and violence........................127 ...■3.04 Road traffic accidents*...................................................9 ...■
4th pillar: Health and hygiene4.01 Physician density*......................................................101 ...■4.02 Access to improved sanitation* ...................................75 ...■4.03 Access to improved drinking water*............................68 ...■4.04 Hospital beds*..............................................................66 ...■
5th pillar: Prioritization of Travel & Tourism5.01 Government prioritization of the T&T industry.............93 ...■5.02 T&T government expenditure* ....................................24 ...■5.03 Effectiveness of marketing and branding.....................94 ...■5.04 T&T fair attendance*....................................................81 ...■
6th pillar: Air transport infrastructure6.01 Quality of air transport infrastructure .........................115 ...■6.02 Available seat kilometers, domestic*.........................100 ...■6.03 Available seat kilometers, international* ....................126 ...■6.04 Departures per 1,000 population*..............................111 ...■6.05 Airport density* ............................................................35 ...■6.06 Number of operating airlines*....................................130 ...■6.07 International air transport network .............................115 ...■
7th pillar: Ground transport infrastructure7.01 Quality of roads ............................................................72 ...■7.02 Quality of railroad infrastructure.................................106 ...■7.03 Quality of port infrastructure ......................................105 ...■7.04 Quality of ground transport network ............................85 ...■7.05 Road density*.............................................................122 ...■
INDICATOR RANK/133
8th pillar: Tourism infrastructure8.01 Hotel rooms*...............................................................n/a ......8.02 Presence of major car rental companies*..................122 ...■8.03 ATMs accepting Visa cards* ......................................101 ...■
9th pillar: ICT infrastructure9.01 Extent of business Internet use...................................82 ...■9.02 Internet users* .............................................................58 ...■9.03 Telephone lines*...........................................................79 ...■9.04 Broadband Internet subscribers* .................................95 ...■9.05 Mobile telephone subscribers*..................................100 ...■
10th pillar: Price competitiveness in the T&T industry10.01 Ticket taxes and airport charges*.................................24 ...■10.02 Purchasing power parity*.............................................38 ...■10.03 Extent and effect of taxation......................................121 ...■10.04 Fuel price levels* .........................................................32 ...■10.05 Hotel price index* ........................................................46 ...■
11th pillar: Human resources11.01 Primary education enrollment* ....................................31 ...■11.02 Secondary education enrollment*................................15 ...■11.03 Quality of the educational system................................67 ...■11.04 Local availability of research and training services.....120 ...■11.05 Extent of staff training..................................................82 ...■11.06 Hiring and firing practices.............................................34 ...■11.07 Ease of hiring foreign labor ..........................................12 ...■11.08 HIV prevalence* .........................................................118 ...■11.09 Business impact of HIV/AIDS.....................................118 ...■11.10 Life expectancy* ........................................................100 ...■
12th pillar: Affinity for Travel & Tourism12.01 Tourism openness* ......................................................23 ...■12.02 Attitude of population toward foreign visitors..............89 ...■12.03 Extension of business trips recommended ...............103 ...■
13th pillar: Natural resources13.01 Number of World Heritage natural sites* ....................74 ...■13.02 Protected areas* ........................................................112 ...■13.03 Quality of the natural environment...............................47 ...■13.04 Total known species*...................................................25 ...■
14th pillar: Cultural resources14.01 Number of World Heritage cultural sites* .................116 ...■14.02 Sports stadiums* .........................................................70 ...■14.03 Number of international fairs and exhibitions* ..........122 ...■14.04 Creative industries exports*.......................................112 ...■
Guyana
* Hard data
Note: For further details and explanation, please refer to the section “How toRead the Country/Economy Profiles” at the beginning of this chapter.
part2A_profiles.r2 2/26/09 4:01 AM Page 211
The Travel & Tourism Competitiveness Report 2009 © 2009 World Economic Forum

212
2.1:
Cou
ntry
/Eco
nom
y Pr
ofile
s
HondurasKey indicatorsPopulation (millions), 2007..............................................................................7.5Surface area (1,000 square kilometers) ......................................................112.1
Gross domestic product (US$ billions), 2007 ...............................................12.3Gross domestic product (PPP, US$) per capita, 2007 .............................4,085.0Real GDP growth (percent), 2007...................................................................6.3
Environmental Performance Index, 2008 (out of 149 countries).....................73
Travel & Tourism indicators
T&T industry, 2008 estimatesGDP (US$ millions) ................................................................409...................3.6 ....................5.1Employment (1,000 jobs).........................................................95...................2.9 ....................4.3
T&T economy, 2008 estimatesGDP (US$ millions) .............................................................1,049...................9.3 ....................4.8Employment (1,000 jobs).......................................................246...................7.6 ....................4.0
Source: World Travel & Tourism Council, TSA Research 2008
International tourist arrivals (thousands), 2007......................831International tourism receipts (US$ millions), 2007 ..............557
Source: United Nations World Tourism Organization
Travel & Tourism Competitiveness Index
2009 Index......................................................................................................83 3.82008 Index............................................................................................................75 3.8T&T regulatory framework ..............................................................................83 4.3
Policy rules and regulations..........................................................................41 4.9Environmental sustainability..........................................................................59 4.6Safety and security .........................................................................................89 4.7Health and hygiene .......................................................................................103 3.2Prioritization of Travel & Tourism..................................................................83 4.1
T&T business environment and infrastructure ............................................87 3.1Air transport infrastructure ..........................................................................66 3.1Ground transport infrastructure....................................................................77 3.2Tourism infrastructure ..................................................................................103 1.8ICT infrastructure ............................................................................................95 2.1Price competitiveness in the T&T industry.................................................30 5.2
T&T human, cultural, and natural resources ...............................................63 3.9Human resources ............................................................................................76 5.0
Education and training .............................................................................81 4.4Availability of qualified labor...................................................................48 5.5
Affinity for Travel & Tourism ..........................................................................44 5.0Natural resources ...........................................................................................38 4.1Cultural resources...........................................................................................97 1.6
Note: For descriptions of variables and detailed sources, please refer to “How to the Read Country/Economy Profiles.”
Rank Score(out of 133) (1–7 scale)
International tourist arrivals (thousands)
International tourism receipts (US$ millions)
1995 1996 1997 1998 1999 2000 2001 2002 2003 2004 2005 2006 20070
200
400
600
800
1,000
1 2 3 4 5 6 7
2009–2018Percent annual growth of total (%, forecast)
part2A_profiles.r2 2/26/09 4:01 AM Page 212
The Travel & Tourism Competitiveness Report 2009 © 2009 World Economic Forum

213
2.1:
Cou
ntry
/Eco
nom
y Pr
ofile
s
The Travel & Tourism Competitiveness Index in detail ■ Competitive Advantage ■ Competitive Disadvantage
INDICATOR RANK/133
1st pillar: Policy rules and regulations1.01 Prevalence of foreign ownership .................................44 ...■1.02 Property rights..............................................................77 ...■1.03 Business impact of rules on FDI ..................................54 ...■1.04 Visa requirements* ......................................................18 ...■1.05 Openness of bilateral Air Service Agreements* ............2 ...■1.06 Transparency of government policymaking..................56 ...■1.07 Time required to start a business*...............................61 ...■1.08 Cost to start a business* ...........................................106 ...■
2nd pillar: Environmental sustainability2.01 Stringency of environmental regulation .......................62 ...■2.02 Enforcement of environmental regulation....................56 ...■2.03 Sustainability of T&T industry development.................58 ...■2.04 Carbon dioxide emissions* ..........................................37 ...■2.05 Particulate matter concentration* ................................80 ...■2.06 Threatened species* ....................................................97 ...■2.07 Environmental treaty ratification*.................................81 ...■
3rd pillar: Safety and security3.01 Business costs of terrorism .........................................80 ...■3.02 Reliability of police services .......................................103 ...■3.03 Business costs of crime and violence........................117 ...■3.04 Road traffic accidents*.................................................53 ...■
4th pillar: Health and hygiene4.01 Physician density*........................................................96 ...■4.02 Access to improved sanitation* ...................................89 ...■4.03 Access to improved drinking water*............................92 ...■4.04 Hospital beds*............................................................105 ...■
5th pillar: Prioritization of Travel & Tourism5.01 Government prioritization of the T&T industry.............49 ...■5.02 T&T government expenditure* ....................................48 ...■5.03 Effectiveness of marketing and branding.....................66 ...■5.04 T&T fair attendance*....................................................98 ...■
6th pillar: Air transport infrastructure6.01 Quality of air transport infrastructure ...........................69 ...■6.02 Available seat kilometers, domestic*...........................67 ...■6.03 Available seat kilometers, international* ....................107 ...■6.04 Departures per 1,000 population*...............................n/a ......6.05 Airport density* ............................................................39 ...■6.06 Number of operating airlines*....................................101 ...■6.07 International air transport network ...............................66 ...■
7th pillar: Ground transport infrastructure7.01 Quality of roads ............................................................61 ...■7.02 Quality of railroad infrastructure.................................101 ...■7.03 Quality of port infrastructure ........................................36 ...■7.04 Quality of ground transport network ............................64 ...■7.05 Road density*...............................................................94 ...■
INDICATOR RANK/133
8th pillar: Tourism infrastructure8.01 Hotel rooms*................................................................73 ...■8.02 Presence of major car rental companies*....................95 ...■8.03 ATMs accepting Visa cards* ........................................91 ...■
9th pillar: ICT infrastructure9.01 Extent of business Internet use...................................49 ...■9.02 Internet users* ...........................................................108 ...■9.03 Telephone lines*...........................................................91 ...■9.04 Broadband Internet subscribers* ...............................127 ...■9.05 Mobile telephone subscribers*..................................109 ...■
10th pillar: Price competitiveness in the T&T industry10.01 Ticket taxes and airport charges*.................................64 ...■10.02 Purchasing power parity*.............................................30 ...■10.03 Extent and effect of taxation........................................41 ...■10.04 Fuel price levels* .........................................................47 ...■10.05 Hotel price index* ........................................................22 ...■
11th pillar: Human resources11.01 Primary education enrollment* ....................................41 ...■11.02 Secondary education enrollment*................................91 ...■11.03 Quality of the educational system..............................116 ...■11.04 Local availability of research and training services.......83 ...■11.05 Extent of staff training..................................................77 ...■11.06 Hiring and firing practices.............................................54 ...■11.07 Ease of hiring foreign labor ..........................................32 ...■11.08 HIV prevalence* ...........................................................91 ...■11.09 Business impact of HIV/AIDS.....................................100 ...■11.10 Life expectancy* ..........................................................83 ...■
12th pillar: Affinity for Travel & Tourism12.01 Tourism openness* ......................................................41 ...■12.02 Attitude of population toward foreign visitors..............66 ...■12.03 Extension of business trips recommended .................62 ...■
13th pillar: Natural resources13.01 Number of World Heritage natural sites* ....................40 ...■13.02 Protected areas* ..........................................................34 ...■13.03 Quality of the natural environment...............................44 ...■13.04 Total known species*...................................................30 ...■
14th pillar: Cultural resources14.01 Number of World Heritage cultural sites* ...................82 ...■14.02 Sports stadiums* .........................................................63 ...■14.03 Number of international fairs and exhibitions* ............96 ...■14.04 Creative industries exports*.........................................75 ...■
Honduras
* Hard data
Note: For further details and explanation, please refer to the section “How toRead the Country/Economy Profiles” at the beginning of this chapter.
part2A_profiles.r2 2/26/09 4:01 AM Page 213
The Travel & Tourism Competitiveness Report 2009 © 2009 World Economic Forum

214
2.1:
Cou
ntry
/Eco
nom
y Pr
ofile
s
Hong Kong SARKey indicatorsPopulation (millions), 2007..............................................................................7.2Surface area (1,000 square kilometers) ..........................................................1.1
Gross domestic product (US$ billions), 2007 .............................................207.2Gross domestic product (PPP, US$) per capita, 2007 ...........................42,123.6Real GDP growth (percent), 2007...................................................................6.4
Environmental Performance Index, 2008 (out of 149 countries) ....................n/a
Travel & Tourism indicators
T&T industry, 2008 estimatesGDP (US$ millions) .............................................................8,209...................3.7 ....................6.1Employment (1,000 jobs).......................................................110...................5.4 ....................2.5
T&T economy, 2008 estimatesGDP (US$ millions) ...........................................................34,773.................15.7 ....................6.4Employment (1,000 jobs).......................................................545.................15.3 ....................3.1
Source: World Travel & Tourism Council, TSA Research 2008
International tourist arrivals (thousands), 2007.................17,154International tourism receipts (US$ millions), 2007 .........13,766
Source: United Nations World Tourism Organization
Travel & Tourism Competitiveness Index
2009 Index......................................................................................................12 5.22008 Index............................................................................................................14 5.1T&T regulatory framework ................................................................................2 5.9
Policy rules and regulations............................................................................2 6.0Environmental sustainability..........................................................................80 4.3Safety and security ...........................................................................................5 6.5Health and hygiene ...........................................................................................1 7.0Prioritization of Travel & Tourism....................................................................8 5.8
T&T business environment and infrastructure ............................................12 5.1Air transport infrastructure ..........................................................................13 5.1Ground transport infrastructure......................................................................2 6.6Tourism infrastructure ....................................................................................68 3.2ICT infrastructure ..............................................................................................9 5.4Price competitiveness in the T&T industry.................................................45 5.0
T&T human, cultural, and natural resources ...............................................30 4.5Human resources ............................................................................................15 5.7
Education and training .............................................................................35 5.2Availability of qualified labor.....................................................................4 6.2
Affinity for Travel & Tourism ..........................................................................11 5.6Natural resources ...........................................................................................62 3.3Cultural resources...........................................................................................34 3.6
Note: For descriptions of variables and detailed sources, please refer to “How to the Read Country/Economy Profiles.”
Rank Score(out of 133) (1–7 scale)
International tourist arrivals (thousands)
International tourism receipts (US$ millions)
1995 1996 1997 1998 1999 2000 2001 2002 2003 2004 2005 2006 20075,000
10,000
15,000
20,000
1 2 3 4 5 6 7
2009–2018Percent annual growth of total (%, forecast)
part2A_profiles.r2 2/26/09 4:01 AM Page 214
The Travel & Tourism Competitiveness Report 2009 © 2009 World Economic Forum

215
2.1:
Cou
ntry
/Eco
nom
y Pr
ofile
s
The Travel & Tourism Competitiveness Index in detail ■ Competitive Advantage ■ Competitive Disadvantage
]INDICATOR RANK/133
1st pillar: Policy rules and regulations1.01 Prevalence of foreign ownership ...................................1 ...■1.02 Property rights..............................................................12 ...■1.03 Business impact of rules on FDI ....................................3 ...■1.04 Visa requirements* ........................................................4 ...■1.05 Openness of bilateral Air Service Agreements* ..........25 ...■1.06 Transparency of government policymaking....................2 ...■1.07 Time required to start a business*...............................29 ...■1.08 Cost to start a business* .............................................18 ...■
2nd pillar: Environmental sustainability2.01 Stringency of environmental regulation .......................58 ...■2.02 Enforcement of environmental regulation....................40 ...■2.03 Sustainability of T&T industry development.................10 ...■2.04 Carbon dioxide emissions* ..........................................80 ...■2.05 Particulate matter concentration* ..............................104 ...■2.06 Threatened species* ..................................................108 ...■2.07 Environmental treaty ratification*................................n/a ......
3rd pillar: Safety and security3.01 Business costs of terrorism ...........................................6 ...■3.02 Reliability of police services ...........................................7 ...■3.03 Business costs of crime and violence............................7 ...■3.04 Road traffic accidents*................................................n/a ......
4th pillar: Health and hygiene4.01 Physician density* .......................................................n/a ......4.02 Access to improved sanitation* .....................................1 ...■4.03 Access to improved drinking water*..............................1 ...■4.04 Hospital beds*.............................................................n/a ......
5th pillar: Prioritization of Travel & Tourism5.01 Government prioritization of the T&T industry...............8 ...■5.02 T&T government expenditure* ....................................16 ...■5.03 Effectiveness of marketing and branding.......................5 ...■5.04 T&T fair attendance*....................................................25 ...■
6th pillar: Air transport infrastructure6.01 Quality of air transport infrastructure .............................2 ...■6.02 Available seat kilometers, domestic*.........................100 ...■6.03 Available seat kilometers, international* ........................9 ...■6.04 Departures per 1,000 population*................................19 ...■6.05 Airport density* ..........................................................109 ...■6.06 Number of operating airlines*......................................24 ...■6.07 International air transport network .................................3 ...■
7th pillar: Ground transport infrastructure7.01 Quality of roads ..............................................................5 ...■7.02 Quality of railroad infrastructure.....................................5 ...■7.03 Quality of port infrastructure ..........................................2 ...■7.04 Quality of ground transport network ..............................3 ...■7.05 Road density*...............................................................12 ...■
]INDICATOR RANK/133
8th pillar: Tourism infrastructure8.01 Hotel rooms*................................................................37 ...■8.02 Presence of major car rental companies*....................95 ...■8.03 ATMs accepting Visa cards* ........................................41 ...■
9th pillar: ICT infrastructure9.01 Extent of business Internet use...................................20 ...■9.02 Internet users* .............................................................23 ...■9.03 Telephone lines*...........................................................11 ...■9.04 Broadband Internet subscribers* .................................10 ...■9.05 Mobile telephone subscribers*......................................5 ...■
10th pillar: Price competitiveness in the T&T industry10.01 Ticket taxes and airport charges*.................................35 ...■10.02 Purchasing power parity*.............................................93 ...■10.03 Extent and effect of taxation..........................................3 ...■10.04 Fuel price levels* .........................................................83 ...■10.05 Hotel price index* ........................................................72 ...■
11th pillar: Human resources11.01 Primary education enrollment* ..................................101 ...■11.02 Secondary education enrollment*................................72 ...■11.03 Quality of the educational system................................22 ...■11.04 Local availability of research and training services.......25 ...■11.05 Extent of staff training..................................................29 ...■11.06 Hiring and firing practices...............................................7 ...■11.07 Ease of hiring foreign labor ..........................................24 ...■11.08 HIV prevalence* .............................................................1 ...■11.09 Business impact of HIV/AIDS.......................................22 ...■11.10 Life expectancy* ............................................................4 ...■
12th pillar: Affinity for Travel & Tourism12.01 Tourism openness* ......................................................12 ...■12.02 Attitude of population toward foreign visitors..............35 ...■12.03 Extension of business trips recommended .................69 ...■
13th pillar: Natural resources13.01 Number of World Heritage natural sites* ....................74 ...■13.02 Protected areas* ............................................................3 ...■13.03 Quality of the natural environment.............................120 ...■13.04 Total known species*.................................................123 ...■
14th pillar: Cultural resources14.01 Number of World Heritage cultural sites* .................116 ...■14.02 Sports stadiums* .........................................................76 ...■14.03 Number of international fairs and exhibitions* ............31 ...■14.04 Creative industries exports*...........................................4 ...■
Hong Kong SAR
* Hard data
Note: For further details and explanation, please refer to the section “How toRead the Country/Economy Profiles” at the beginning of this chapter.
part2A_profiles.r2 2/26/09 4:01 AM Page 215
The Travel & Tourism Competitiveness Report 2009 © 2009 World Economic Forum

216
2.1:
Cou
ntry
/Eco
nom
y Pr
ofile
s
HungaryKey indicatorsPopulation (millions), 2007............................................................................10.0Surface area (1,000 square kilometers) ........................................................93.0
Gross domestic product (US$ billions), 2007 .............................................138.4Gross domestic product (PPP, US$) per capita, 2007 ...........................19,019.7Real GDP growth (percent), 2007...................................................................1.3
Environmental Performance Index, 2008 (out of 149 countries).....................23
Travel & Tourism indicators
T&T industry, 2008 estimatesGDP (US$ millions) .............................................................4,078...................2.6 ....................3.1Employment (1,000 jobs).......................................................170...................4.3 ..................–1.2
T&T economy, 2008 estimatesGDP (US$ millions) ...........................................................10,419...................6.7 ....................3.8Employment (1,000 jobs).......................................................244...................6.1 ..................–1.5
Source: World Travel & Tourism Council, TSA Research 2008
International tourist arrivals (thousands), 2007...................8,638International tourism receipts (US$ millions), 2007 ...........4,728
Source: United Nations World Tourism Organization
Travel & Tourism Competitiveness Index
2009 Index......................................................................................................38 4.52008 Index............................................................................................................33 4.6T&T regulatory framework ..............................................................................26 5.3
Policy rules and regulations..........................................................................37 4.9Environmental sustainability..........................................................................24 5.1Safety and security .........................................................................................41 5.8Health and hygiene .........................................................................................11 6.6Prioritization of Travel & Tourism..................................................................68 4.3
T&T business environment and infrastructure ............................................42 4.1Air transport infrastructure ..........................................................................68 3.0Ground transport infrastructure....................................................................33 4.4Tourism infrastructure ....................................................................................27 4.9ICT infrastructure ............................................................................................36 4.0Price competitiveness in the T&T industry...............................................112 3.9
T&T human, cultural, and natural resources ...............................................59 4.0Human resources ............................................................................................77 5.0
Education and training .............................................................................73 4.6Availability of qualified labor...................................................................74 5.4
Affinity for Travel & Tourism ........................................................................115 4.3Natural resources .........................................................................................103 2.6Cultural resources...........................................................................................31 3.9
Note: For descriptions of variables and detailed sources, please refer to “How to the Read Country/Economy Profiles.”
Rank Score(out of 133) (1–7 scale)
International tourist arrivals (thousands)
International tourism receipts (US$ millions)
1995 1996 1997 1998 1999 2000 2001 2002 2003 2004 2005 2006 20070
3,000
6,000
9,000
12,000
15,000
1 2 3 4 5 6 7
2009–2018Percent annual growth of total (%, forecast)
part2A_profiles.r2 2/26/09 4:01 AM Page 216
The Travel & Tourism Competitiveness Report 2009 © 2009 World Economic Forum

217
2.1:
Cou
ntry
/Eco
nom
y Pr
ofile
s
The Travel & Tourism Competitiveness Index in detail ■ Competitive Advantage ■ Competitive Disadvantage
INDICATOR RANK/133
1st pillar: Policy rules and regulations1.01 Prevalence of foreign ownership ...................................9 ...■1.02 Property rights..............................................................46 ...■1.03 Business impact of rules on FDI ..................................40 ...■1.04 Visa requirements* ......................................................40 ...■1.05 Openness of bilateral Air Service Agreements* ..........46 ...■1.06 Transparency of government policymaking................117 ...■1.07 Time required to start a business*.................................6 ...■1.08 Cost to start a business* .............................................57 ...■
2nd pillar: Environmental sustainability2.01 Stringency of environmental regulation .......................35 ...■2.02 Enforcement of environmental regulation....................59 ...■2.03 Sustainability of T&T industry development...............102 ...■2.04 Carbon dioxide emissions* ..........................................82 ...■2.05 Particulate matter concentration* ................................16 ...■2.06 Threatened species* ....................................................37 ...■2.07 Environmental treaty ratification*.................................21 ...■
3rd pillar: Safety and security3.01 Business costs of terrorism .........................................21 ...■3.02 Reliability of police services .........................................46 ...■3.03 Business costs of crime and violence..........................45 ...■3.04 Road traffic accidents*.................................................63 ...■
4th pillar: Health and hygiene4.01 Physician density*........................................................31 ...■4.02 Access to improved sanitation* .....................................1 ...■4.03 Access to improved drinking water*..............................1 ...■4.04 Hospital beds*................................................................9 ...■
5th pillar: Prioritization of Travel & Tourism5.01 Government prioritization of the T&T industry.............71 ...■5.02 T&T government expenditure* ....................................32 ...■5.03 Effectiveness of marketing and branding...................107 ...■5.04 T&T fair attendance*....................................................62 ...■
6th pillar: Air transport infrastructure6.01 Quality of air transport infrastructure ...........................70 ...■6.02 Available seat kilometers, domestic*.........................100 ...■6.03 Available seat kilometers, international* ......................65 ...■6.04 Departures per 1,000 population*................................54 ...■6.05 Airport density* ..........................................................105 ...■6.06 Number of operating airlines*......................................38 ...■6.07 International air transport network ...............................61 ...■
7th pillar: Ground transport infrastructure7.01 Quality of roads ............................................................67 ...■7.02 Quality of railroad infrastructure...................................41 ...■7.03 Quality of port infrastructure ........................................70 ...■7.04 Quality of ground transport network ............................74 ...■7.05 Road density*...............................................................15 ...■
INDICATOR RANK/133
8th pillar: Tourism infrastructure8.01 Hotel rooms*................................................................43 ...■8.02 Presence of major car rental companies*......................1 ...■8.03 ATMs accepting Visa cards* ........................................31 ...■
9th pillar: ICT infrastructure9.01 Extent of business Internet use...................................59 ...■9.02 Internet users* .............................................................39 ...■9.03 Telephone lines*...........................................................37 ...■9.04 Broadband Internet subscribers* .................................33 ...■9.05 Mobile telephone subscribers*....................................31 ...■
10th pillar: Price competitiveness in the T&T industry10.01 Ticket taxes and airport charges*.................................54 ...■10.02 Purchasing power parity*.............................................98 ...■10.03 Extent and effect of taxation......................................132 ...■10.04 Fuel price levels* .......................................................114 ...■10.05 Hotel price index* ........................................................68 ...■
11th pillar: Human resources11.01 Primary education enrollment* ....................................96 ...■11.02 Secondary education enrollment*................................42 ...■11.03 Quality of the educational system................................87 ...■11.04 Local availability of research and training services.......73 ...■11.05 Extent of staff training................................................101 ...■11.06 Hiring and firing practices.............................................67 ...■11.07 Ease of hiring foreign labor ..........................................70 ...■11.08 HIV prevalence* ...........................................................22 ...■11.09 Business impact of HIV/AIDS.......................................13 ...■11.10 Life expectancy* ..........................................................55 ...■
12th pillar: Affinity for Travel & Tourism12.01 Tourism openness* ......................................................58 ...■12.02 Attitude of population toward foreign visitors............112 ...■12.03 Extension of business trips recommended ...............127 ...■
13th pillar: Natural resources13.01 Number of World Heritage natural sites* ....................40 ...■13.02 Protected areas* ..........................................................92 ...■13.03 Quality of the natural environment...............................94 ...■13.04 Total known species*.................................................103 ...■
14th pillar: Cultural resources14.01 Number of World Heritage cultural sites* ...................26 ...■14.02 Sports stadiums* .........................................................35 ...■14.03 Number of international fairs and exhibitions* ............22 ...■14.04 Creative industries exports*.........................................44 ...■
Hungary
* Hard data
Note: For further details and explanation, please refer to the section “How toRead the Country/Economy Profiles” at the beginning of this chapter.
part2A_profiles.r2 2/26/09 4:01 AM Page 217
The Travel & Tourism Competitiveness Report 2009 © 2009 World Economic Forum

218
2.1:
Cou
ntry
/Eco
nom
y Pr
ofile
s
IcelandKey indicatorsPopulation (millions), 2007..............................................................................0.3Surface area (1,000 square kilometers) ......................................................103.0
Gross domestic product (US$ billions), 2007 ...............................................20.2Gross domestic product (PPP, US$) per capita, 2007 ...........................39,167.6Real GDP growth (percent), 2007...................................................................4.9
Environmental Performance Index, 2008 (out of 149 countries).....................11
Travel & Tourism indicators
T&T industry, 2008 estimatesGDP (US$ millions) ................................................................907...................4.6 ....................3.5Employment (1,000 jobs)...........................................................8...................4.2 ....................1.4
T&T economy, 2008 estimatesGDP (US$ millions) .............................................................2,586.................13.3 ....................3.3Employment (1,000 jobs).........................................................24.................13.5 ....................1.3
Source: World Travel & Tourism Council, TSA Research 2008
International tourist arrivals (thousands), 2007...................1,054International tourism receipts (US$ millions), 2007 ..............633
Source: United Nations World Tourism Organization
Travel & Tourism Competitiveness Index
2009 Index......................................................................................................16 5.12008 Index............................................................................................................11 5.2T&T regulatory framework ................................................................................3 5.9
Policy rules and regulations..........................................................................21 5.2Environmental sustainability..........................................................................13 5.4Safety and security ...........................................................................................2 6.7Health and hygiene ...........................................................................................4 6.9Prioritization of Travel & Tourism..................................................................20 5.4
T&T business environment and infrastructure ............................................17 4.9Air transport infrastructure ..........................................................................18 4.8Ground transport infrastructure....................................................................34 4.4Tourism infrastructure ....................................................................................13 6.2ICT infrastructure ..............................................................................................2 5.9Price competitiveness in the T&T industry...............................................128 3.4
T&T human, cultural, and natural resources ...............................................39 4.4Human resources ..............................................................................................3 6.2
Education and training ...............................................................................9 6.0Availability of qualified labor.....................................................................2 6.3
Affinity for Travel & Tourism ..........................................................................17 5.5Natural resources ...........................................................................................73 3.0Cultural resources...........................................................................................50 2.8
Note: For descriptions of variables and detailed sources, please refer to “How to the Read Country/Economy Profiles.”
Rank Score(out of 133) (1–7 scale)
International tourist arrivals (thousands)
International tourism receipts (US$ millions)
1995 1996 1997 1998 1999 2000 2001 2002 2003 2004 2005 2006 20070
200
400
600
800
1,000
1,200
1 2 3 4 5 6 7
2009–2018Percent annual growth of total (%, forecast)
part2A_profiles.r2 2/26/09 4:01 AM Page 218
The Travel & Tourism Competitiveness Report 2009 © 2009 World Economic Forum

219
2.1:
Cou
ntry
/Eco
nom
y Pr
ofile
s
The Travel & Tourism Competitiveness Index in detail ■ Competitive Advantage ■ Competitive Disadvantage
INDICATOR RANK/133
1st pillar: Policy rules and regulations1.01 Prevalence of foreign ownership ...............................103 ...■1.02 Property rights..............................................................10 ...■1.03 Business impact of rules on FDI ..................................95 ...■1.04 Visa requirements* ......................................................40 ...■1.05 Openness of bilateral Air Service Agreements* ..........17 ...■1.06 Transparency of government policymaking....................6 ...■1.07 Time required to start a business*.................................6 ...■1.08 Cost to start a business* .............................................24 ...■
2nd pillar: Environmental sustainability2.01 Stringency of environmental regulation .......................17 ...■2.02 Enforcement of environmental regulation....................15 ...■2.03 Sustainability of T&T industry development.................30 ...■2.04 Carbon dioxide emissions* ..........................................91 ...■2.05 Particulate matter concentration* ................................13 ...■2.06 Threatened species* ....................................................51 ...■2.07 Environmental treaty ratification*.................................52 ...■
3rd pillar: Safety and security3.01 Business costs of terrorism ...........................................2 ...■3.02 Reliability of police services ...........................................5 ...■3.03 Business costs of crime and violence............................2 ...■3.04 Road traffic accidents*...................................................3 ...■
4th pillar: Health and hygiene4.01 Physician density*..........................................................9 ...■4.02 Access to improved sanitation* .....................................1 ...■4.03 Access to improved drinking water*..............................1 ...■4.04 Hospital beds*..............................................................14 ...■
5th pillar: Prioritization of Travel & Tourism5.01 Government prioritization of the T&T industry.............47 ...■5.02 T&T government expenditure* ......................................5 ...■5.03 Effectiveness of marketing and branding.....................22 ...■5.04 T&T fair attendance*....................................................81 ...■
6th pillar: Air transport infrastructure6.01 Quality of air transport infrastructure ...........................11 ...■6.02 Available seat kilometers, domestic*...........................60 ...■6.03 Available seat kilometers, international* ......................78 ...■6.04 Departures per 1,000 population*..................................7 ...■6.05 Airport density* ..............................................................1 ...■6.06 Number of operating airlines*....................................116 ...■6.07 International air transport network ...............................18 ...■
7th pillar: Ground transport infrastructure7.01 Quality of roads ............................................................42 ...■7.02 Quality of railroad infrastructure ..................................n/a ......7.03 Quality of port infrastructure ..........................................9 ...■7.04 Quality of ground transport network ............................18 ...■7.05 Road density*...............................................................92 ...■
INDICATOR RANK/133
8th pillar: Tourism infrastructure8.01 Hotel rooms*..................................................................5 ...■8.02 Presence of major car rental companies*....................56 ...■8.03 ATMs accepting Visa cards* ..........................................8 ...■
9th pillar: ICT infrastructure9.01 Extent of business Internet use...................................16 ...■9.02 Internet users* .............................................................12 ...■9.03 Telephone lines*.............................................................4 ...■9.04 Broadband Internet subscribers* ...................................2 ...■9.05 Mobile telephone subscribers*....................................19 ...■
10th pillar: Price competitiveness in the T&T industry10.01 Ticket taxes and airport charges*.................................46 ...■10.02 Purchasing power parity*...........................................132 ...■10.03 Extent and effect of taxation........................................11 ...■10.04 Fuel price levels* .......................................................130 ...■10.05 Hotel price index* ........................................................94 ...■
11th pillar: Human resources11.01 Primary education enrollment* ....................................25 ...■11.02 Secondary education enrollment*................................11 ...■11.03 Quality of the educational system..................................5 ...■11.04 Local availability of research and training services.......17 ...■11.05 Extent of staff training....................................................9 ...■11.06 Hiring and firing practices...............................................8 ...■11.07 Ease of hiring foreign labor ..........................................11 ...■11.08 HIV prevalence* ...........................................................49 ...■11.09 Business impact of HIV/AIDS.........................................2 ...■11.10 Life expectancy* ............................................................5 ...■
12th pillar: Affinity for Travel & Tourism12.01 Tourism openness* ......................................................25 ...■12.02 Attitude of population toward foreign visitors................5 ...■12.03 Extension of business trips recommended .................35 ...■
13th pillar: Natural resources13.01 Number of World Heritage natural sites* ....................40 ...■13.02 Protected areas* ..........................................................76 ...■13.03 Quality of the natural environment.................................1 ...■13.04 Total known species*.................................................132 ...■
14th pillar: Cultural resources14.01 Number of World Heritage cultural sites* ...................97 ...■14.02 Sports stadiums* ...........................................................4 ...■14.03 Number of international fairs and exhibitions* ............49 ...■14.04 Creative industries exports*.......................................106 ...■
Iceland
* Hard data
Note: For further details and explanation, please refer to the section “How toRead the Country/Economy Profiles” at the beginning of this chapter.
part2A_profiles.r2 2/26/09 4:01 AM Page 219
The Travel & Tourism Competitiveness Report 2009 © 2009 World Economic Forum

220
2.1:
Cou
ntry
/Eco
nom
y Pr
ofile
s
IndiaKey indicatorsPopulation (millions), 2007.......................................................................1,135.6Surface area (1,000 square kilometers) ...................................................3,287.3
Gross domestic product (US$ billions), 2007 ..........................................1,100.7Gross domestic product (PPP, US$) per capita, 2007 .............................2,563.3Real GDP growth (percent), 2007...................................................................9.3
Environmental Performance Index, 2008 (out of 149 countries)...................120
Travel & Tourism indicators
T&T industry, 2008 estimatesGDP (US$ millions) ...........................................................28,143...................2.3 ....................6.7Employment (1,000 jobs)..................................................13,127...................2.8 ....................2.3
T&T economy, 2008 estimatesGDP (US$ millions) ...........................................................73,558...................6.1 ....................7.6Employment (1,000 jobs)..................................................30,491...................6.4 ....................2.7
Source: World Travel & Tourism Council, TSA Research 2008
International tourist arrivals (thousands), 2007...................5,060International tourism receipts (US$ millions), 2007 .........10,729
Source: United Nations World Tourism Organization
Travel & Tourism Competitiveness Index
2009 Index......................................................................................................62 4.12008 Index............................................................................................................65 4.0T&T regulatory framework ............................................................................107 3.9
Policy rules and regulations........................................................................108 3.7Environmental sustainability..........................................................................74 4.4Safety and security .......................................................................................120 3.9Health and hygiene .......................................................................................111 2.6Prioritization of Travel & Tourism..................................................................42 4.8
T&T business environment and infrastructure ............................................63 3.7Air transport infrastructure ..........................................................................37 4.2Ground transport infrastructure....................................................................49 4.1Tourism infrastructure ....................................................................................73 3.1ICT infrastructure ..........................................................................................104 2.0Price competitiveness in the T&T industry.................................................46 5.0
T&T human, cultural, and natural resources ...............................................18 4.7Human resources ............................................................................................90 4.8
Education and training .............................................................................70 4.7Availability of qualified labor.................................................................109 5.0
Affinity for Travel & Tourism ..........................................................................96 4.5Natural resources ...........................................................................................14 4.9Cultural resources...........................................................................................24 4.7
Note: For descriptions of variables and detailed sources, please refer to “How to the Read Country/Economy Profiles.”
Rank Score(out of 133) (1–7 scale)
International tourist arrivals (thousands)
International tourism receipts (US$ millions)
1995 1996 1997 1998 1999 2000 2001 2002 2003 2004 2005 2006 20072,000
4,000
6,000
8,000
10,000
12,000
1 2 3 4 5 6 7
2009–2018Percent annual growth of total (%, forecast)
part2A_profiles.r2 2/26/09 4:01 AM Page 220
The Travel & Tourism Competitiveness Report 2009 © 2009 World Economic Forum
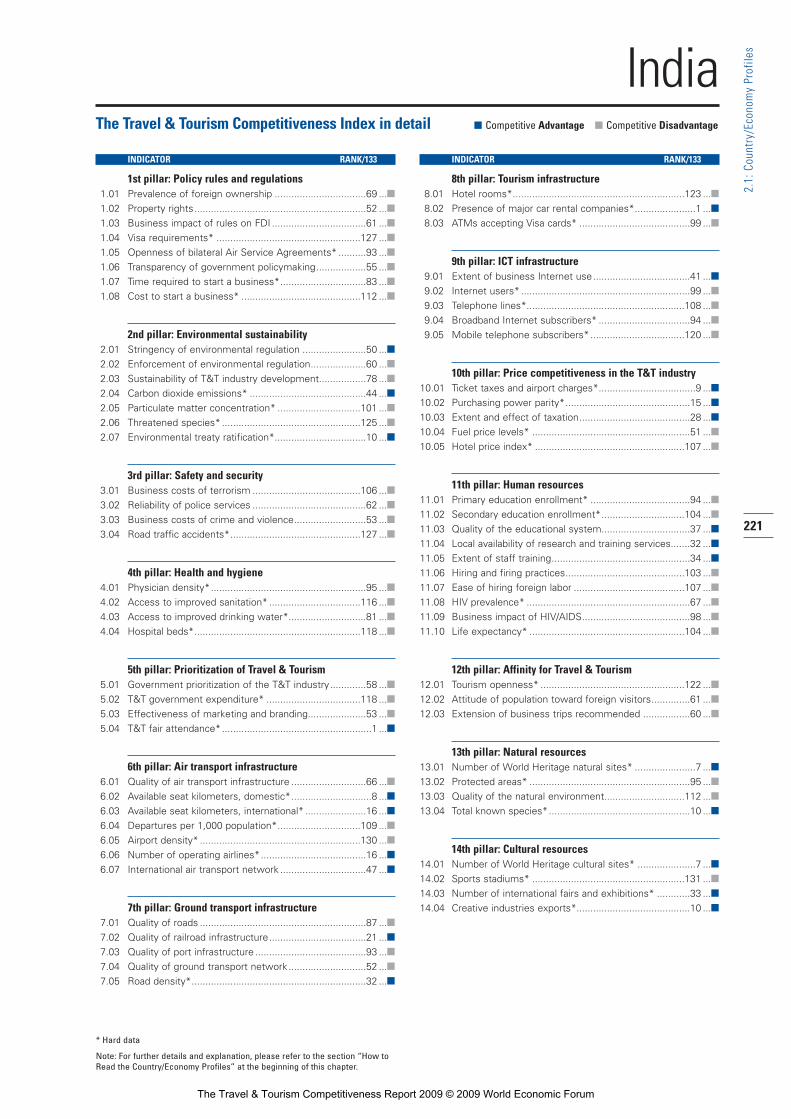
221
2.1:
Cou
ntry
/Eco
nom
y Pr
ofile
s
The Travel & Tourism Competitiveness Index in detail ■ Competitive Advantage ■ Competitive Disadvantage
INDICATOR RANK/133
1st pillar: Policy rules and regulations1.01 Prevalence of foreign ownership .................................69 ...■1.02 Property rights..............................................................52 ...■1.03 Business impact of rules on FDI ..................................61 ...■1.04 Visa requirements* ....................................................127 ...■1.05 Openness of bilateral Air Service Agreements* ..........93 ...■1.06 Transparency of government policymaking..................55 ...■1.07 Time required to start a business*...............................83 ...■1.08 Cost to start a business* ...........................................112 ...■
2nd pillar: Environmental sustainability2.01 Stringency of environmental regulation .......................50 ...■2.02 Enforcement of environmental regulation....................60 ...■2.03 Sustainability of T&T industry development.................78 ...■2.04 Carbon dioxide emissions* ..........................................44 ...■2.05 Particulate matter concentration* ..............................101 ...■2.06 Threatened species* ..................................................125 ...■2.07 Environmental treaty ratification*.................................10 ...■
3rd pillar: Safety and security3.01 Business costs of terrorism .......................................106 ...■3.02 Reliability of police services .........................................62 ...■3.03 Business costs of crime and violence..........................53 ...■3.04 Road traffic accidents*...............................................127 ...■
4th pillar: Health and hygiene4.01 Physician density*........................................................95 ...■4.02 Access to improved sanitation* .................................116 ...■4.03 Access to improved drinking water*............................81 ...■4.04 Hospital beds*............................................................118 ...■
5th pillar: Prioritization of Travel & Tourism5.01 Government prioritization of the T&T industry.............58 ...■5.02 T&T government expenditure* ..................................118 ...■5.03 Effectiveness of marketing and branding.....................53 ...■5.04 T&T fair attendance*......................................................1 ...■
6th pillar: Air transport infrastructure6.01 Quality of air transport infrastructure ...........................66 ...■6.02 Available seat kilometers, domestic*.............................8 ...■6.03 Available seat kilometers, international* ......................16 ...■6.04 Departures per 1,000 population*..............................109 ...■6.05 Airport density* ..........................................................130 ...■6.06 Number of operating airlines*......................................16 ...■6.07 International air transport network ...............................47 ...■
7th pillar: Ground transport infrastructure7.01 Quality of roads ............................................................87 ...■7.02 Quality of railroad infrastructure...................................21 ...■7.03 Quality of port infrastructure ........................................93 ...■7.04 Quality of ground transport network ............................52 ...■7.05 Road density*...............................................................32 ...■
INDICATOR RANK/133
8th pillar: Tourism infrastructure8.01 Hotel rooms*..............................................................123 ...■8.02 Presence of major car rental companies*......................1 ...■8.03 ATMs accepting Visa cards* ........................................99 ...■
9th pillar: ICT infrastructure9.01 Extent of business Internet use...................................41 ...■9.02 Internet users* .............................................................99 ...■9.03 Telephone lines*.........................................................108 ...■9.04 Broadband Internet subscribers* .................................94 ...■9.05 Mobile telephone subscribers*..................................120 ...■
10th pillar: Price competitiveness in the T&T industry10.01 Ticket taxes and airport charges*...................................9 ...■10.02 Purchasing power parity*.............................................15 ...■10.03 Extent and effect of taxation........................................28 ...■10.04 Fuel price levels* .........................................................51 ...■10.05 Hotel price index* ......................................................107 ...■
11th pillar: Human resources11.01 Primary education enrollment* ....................................94 ...■11.02 Secondary education enrollment*..............................104 ...■11.03 Quality of the educational system................................37 ...■11.04 Local availability of research and training services.......32 ...■11.05 Extent of staff training..................................................34 ...■11.06 Hiring and firing practices...........................................103 ...■11.07 Ease of hiring foreign labor ........................................107 ...■11.08 HIV prevalence* ...........................................................67 ...■11.09 Business impact of HIV/AIDS.......................................98 ...■11.10 Life expectancy* ........................................................104 ...■
12th pillar: Affinity for Travel & Tourism12.01 Tourism openness* ....................................................122 ...■12.02 Attitude of population toward foreign visitors..............61 ...■12.03 Extension of business trips recommended .................60 ...■
13th pillar: Natural resources13.01 Number of World Heritage natural sites* ......................7 ...■13.02 Protected areas* ..........................................................95 ...■13.03 Quality of the natural environment.............................112 ...■13.04 Total known species*...................................................10 ...■
14th pillar: Cultural resources14.01 Number of World Heritage cultural sites* .....................7 ...■14.02 Sports stadiums* .......................................................131 ...■14.03 Number of international fairs and exhibitions* ............33 ...■14.04 Creative industries exports*.........................................10 ...■
India
* Hard data
Note: For further details and explanation, please refer to the section “How toRead the Country/Economy Profiles” at the beginning of this chapter.
part2A_profiles.r2 2/26/09 4:01 AM Page 221
The Travel & Tourism Competitiveness Report 2009 © 2009 World Economic Forum

222
2.1:
Cou
ntry
/Eco
nom
y Pr
ofile
s
IndonesiaKey indicatorsPopulation (millions), 2007..........................................................................228.1Surface area (1,000 square kilometers) ...................................................1,904.6
Gross domestic product (US$ billions), 2007 .............................................432.9Gross domestic product (PPP, US$) per capita, 2007 .............................3,728.2Real GDP growth (percent), 2007...................................................................6.3
Environmental Performance Index, 2008 (out of 149 countries)...................102
Travel & Tourism indicators
T&T industry, 2008 estimatesGDP (US$ millions) ...........................................................11,059...................2.3 ....................6.6Employment (1,000 jobs)....................................................1,926...................1.9 ....................2.6
T&T economy, 2008 estimatesGDP (US$ millions) ...........................................................33,993...................7.2 ....................5.6Employment (1,000 jobs)....................................................5,936...................6.0 ....................1.6
Source: World Travel & Tourism Council, TSA Research 2008
International tourist arrivals (thousands), 2007...................5,506International tourism receipts (US$ millions), 2007 ...........5,346
Source: United Nations World Tourism Organization
Travel & Tourism Competitiveness Index
2009 Index......................................................................................................81 3.82008 Index............................................................................................................80 3.7T&T regulatory framework ............................................................................113 3.8
Policy rules and regulations........................................................................123 3.3Environmental sustainability........................................................................130 3.4Safety and security .......................................................................................119 3.9Health and hygiene .......................................................................................110 2.6Prioritization of Travel & Tourism..................................................................10 5.7
T&T business environment and infrastructure ............................................79 3.2Air transport infrastructure ..........................................................................60 3.2Ground transport infrastructure....................................................................89 3.0Tourism infrastructure ....................................................................................88 2.1ICT infrastructure ..........................................................................................102 2.1Price competitiveness in the T&T industry...................................................3 5.9
T&T human, cultural, and natural resources ...............................................40 4.4Human resources ............................................................................................42 5.3
Education and training .............................................................................55 4.9Availability of qualified labor...................................................................33 5.6
Affinity for Travel & Tourism ..........................................................................78 4.6Natural resources ...........................................................................................28 4.4Cultural resources...........................................................................................37 3.1
Note: For descriptions of variables and detailed sources, please refer to “How to the Read Country/Economy Profiles.”
Rank Score(out of 133) (1–7 scale)
International tourist arrivals (thousands)
International tourism receipts (US$ millions)
1995 1996 1997 1998 1999 2000 2001 2002 2003 2004 2005 2006 20074,000
5,000
6,000
7,000
8,000
1 2 3 4 5 6 7
2009–2018Percent annual growth of total (%, forecast)
part2A_profiles.r2 2/26/09 4:01 AM Page 222
The Travel & Tourism Competitiveness Report 2009 © 2009 World Economic Forum
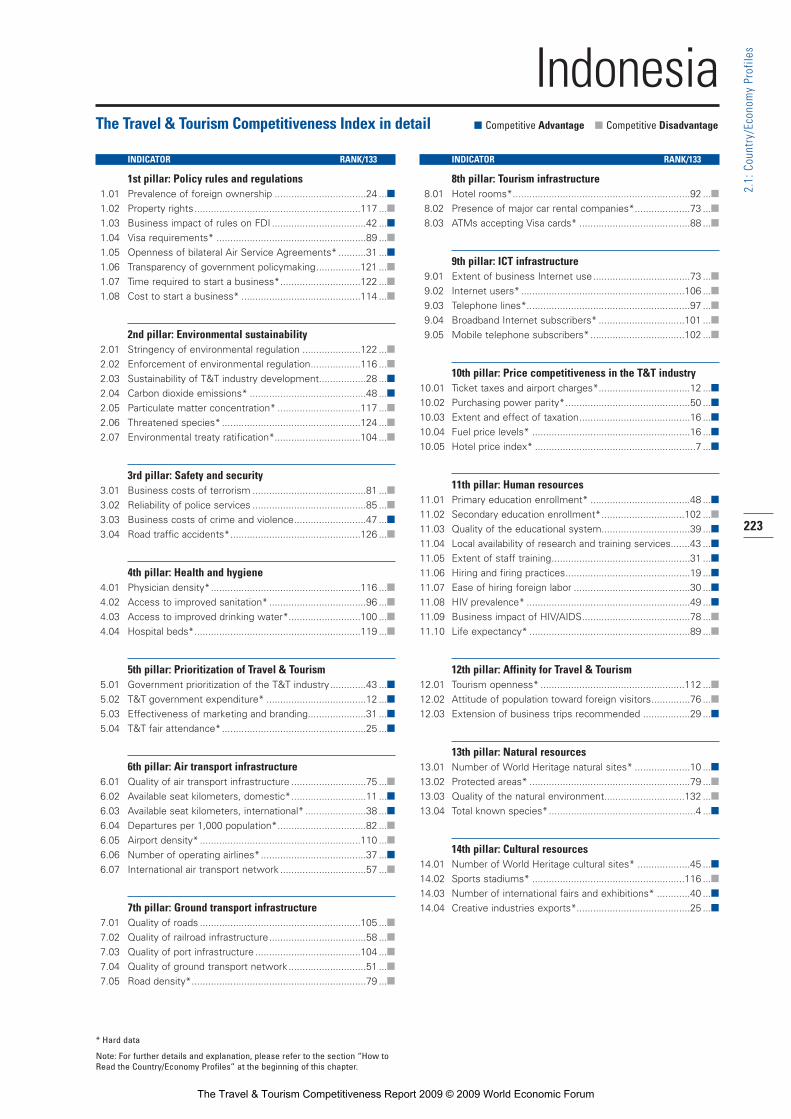
223
2.1:
Cou
ntry
/Eco
nom
y Pr
ofile
s
The Travel & Tourism Competitiveness Index in detail ■ Competitive Advantage ■ Competitive Disadvantage
INDICATOR RANK/133
1st pillar: Policy rules and regulations1.01 Prevalence of foreign ownership .................................24 ...■1.02 Property rights............................................................117 ...■1.03 Business impact of rules on FDI ..................................42 ...■1.04 Visa requirements* ......................................................89 ...■1.05 Openness of bilateral Air Service Agreements* ..........31 ...■1.06 Transparency of government policymaking................121 ...■1.07 Time required to start a business*.............................122 ...■1.08 Cost to start a business* ...........................................114 ...■
2nd pillar: Environmental sustainability2.01 Stringency of environmental regulation .....................122 ...■2.02 Enforcement of environmental regulation..................116 ...■2.03 Sustainability of T&T industry development.................28 ...■2.04 Carbon dioxide emissions* ..........................................48 ...■2.05 Particulate matter concentration* ..............................117 ...■2.06 Threatened species* ..................................................124 ...■2.07 Environmental treaty ratification*...............................104 ...■
3rd pillar: Safety and security3.01 Business costs of terrorism .........................................81 ...■3.02 Reliability of police services .........................................85 ...■3.03 Business costs of crime and violence..........................47 ...■3.04 Road traffic accidents*...............................................126 ...■
4th pillar: Health and hygiene4.01 Physician density*......................................................116 ...■4.02 Access to improved sanitation* ...................................96 ...■4.03 Access to improved drinking water*..........................100 ...■4.04 Hospital beds*............................................................119 ...■
5th pillar: Prioritization of Travel & Tourism5.01 Government prioritization of the T&T industry.............43 ...■5.02 T&T government expenditure* ....................................12 ...■5.03 Effectiveness of marketing and branding.....................31 ...■5.04 T&T fair attendance*....................................................25 ...■
6th pillar: Air transport infrastructure6.01 Quality of air transport infrastructure ...........................75 ...■6.02 Available seat kilometers, domestic*...........................11 ...■6.03 Available seat kilometers, international* ......................38 ...■6.04 Departures per 1,000 population*................................82 ...■6.05 Airport density* ..........................................................110 ...■6.06 Number of operating airlines*......................................37 ...■6.07 International air transport network ...............................57 ...■
7th pillar: Ground transport infrastructure7.01 Quality of roads ..........................................................105 ...■7.02 Quality of railroad infrastructure...................................58 ...■7.03 Quality of port infrastructure ......................................104 ...■7.04 Quality of ground transport network ............................51 ...■7.05 Road density*...............................................................79 ...■
INDICATOR RANK/133
8th pillar: Tourism infrastructure8.01 Hotel rooms*................................................................92 ...■8.02 Presence of major car rental companies*....................73 ...■8.03 ATMs accepting Visa cards* ........................................88 ...■
9th pillar: ICT infrastructure9.01 Extent of business Internet use...................................73 ...■9.02 Internet users* ...........................................................106 ...■9.03 Telephone lines*...........................................................97 ...■9.04 Broadband Internet subscribers* ...............................101 ...■9.05 Mobile telephone subscribers*..................................102 ...■
10th pillar: Price competitiveness in the T&T industry10.01 Ticket taxes and airport charges*.................................12 ...■10.02 Purchasing power parity*.............................................50 ...■10.03 Extent and effect of taxation........................................16 ...■10.04 Fuel price levels* .........................................................16 ...■10.05 Hotel price index* ..........................................................7 ...■
11th pillar: Human resources11.01 Primary education enrollment* ....................................48 ...■11.02 Secondary education enrollment*..............................102 ...■11.03 Quality of the educational system................................39 ...■11.04 Local availability of research and training services.......43 ...■11.05 Extent of staff training..................................................31 ...■11.06 Hiring and firing practices.............................................19 ...■11.07 Ease of hiring foreign labor ..........................................30 ...■11.08 HIV prevalence* ...........................................................49 ...■11.09 Business impact of HIV/AIDS.......................................78 ...■11.10 Life expectancy* ..........................................................89 ...■
12th pillar: Affinity for Travel & Tourism12.01 Tourism openness* ....................................................112 ...■12.02 Attitude of population toward foreign visitors..............76 ...■12.03 Extension of business trips recommended .................29 ...■
13th pillar: Natural resources13.01 Number of World Heritage natural sites* ....................10 ...■13.02 Protected areas* ..........................................................79 ...■13.03 Quality of the natural environment.............................132 ...■13.04 Total known species*.....................................................4 ...■
14th pillar: Cultural resources14.01 Number of World Heritage cultural sites* ...................45 ...■14.02 Sports stadiums* .......................................................116 ...■14.03 Number of international fairs and exhibitions* ............40 ...■14.04 Creative industries exports*.........................................25 ...■
Indonesia
* Hard data
Note: For further details and explanation, please refer to the section “How toRead the Country/Economy Profiles” at the beginning of this chapter.
part2A_profiles.r2 2/26/09 4:01 AM Page 223
The Travel & Tourism Competitiveness Report 2009 © 2009 World Economic Forum

224
2.1:
Cou
ntry
/Eco
nom
y Pr
ofile
s
IrelandKey indicatorsPopulation (millions), 2007..............................................................................4.3Surface area (1,000 square kilometers) ........................................................70.3
Gross domestic product (US$ billions), 2007 .............................................261.2Gross domestic product (PPP, US$) per capita, 2007 ...........................43,413.7Real GDP growth (percent), 2007...................................................................6.0
Environmental Performance Index, 2008 (out of 149 countries).....................34
Travel & Tourism indicators
T&T industry, 2008 estimatesGDP (US$ millions) .............................................................6,241...................2.1 ....................3.5Employment (1,000 jobs).........................................................44...................2.0 ....................2.2
T&T economy, 2008 estimatesGDP (US$ millions) ...........................................................21,258...................7.3 ....................3.7Employment (1,000 jobs).......................................................140...................6.4 ....................2.6
Source: World Travel & Tourism Council, TSA Research 2008
International tourist arrivals (thousands), 2007...................8,332International tourism receipts (US$ millions), 2007 ...........6,066
Source: United Nations World Tourism Organization
Travel & Tourism Competitiveness Index
2009 Index......................................................................................................18 5.02008 Index............................................................................................................21 4.9T&T regulatory framework ................................................................................7 5.7
Policy rules and regulations............................................................................3 5.7Environmental sustainability..........................................................................12 5.5Safety and security .........................................................................................18 6.1Health and hygiene .........................................................................................25 6.2Prioritization of Travel & Tourism..................................................................27 5.2
T&T business environment and infrastructure ............................................22 4.8Air transport infrastructure ..........................................................................23 4.6Ground transport infrastructure....................................................................48 4.1Tourism infrastructure ......................................................................................4 6.8ICT infrastructure ............................................................................................28 4.5Price competitiveness in the T&T industry...............................................111 4.0
T&T human, cultural, and natural resources ...............................................32 4.4Human resources ..............................................................................................9 5.9
Education and training .............................................................................18 5.8Availability of qualified labor.....................................................................7 6.0
Affinity for Travel & Tourism ..........................................................................36 5.1Natural resources .........................................................................................116 2.3Cultural resources...........................................................................................25 4.5
Note: For descriptions of variables and detailed sources, please refer to “How to the Read Country/Economy Profiles.”
Rank Score(out of 133) (1–7 scale)
International tourist arrivals (thousands)
International tourism receipts (US$ millions)
1995 1996 1997 1998 1999 2000 2001 2002 2003 2004 2005 2006 20072,000
4,000
6,000
8,000
10,000
1 2 3 4 5 6 7
2009–2018Percent annual growth of total (%, forecast)
part2A_profiles.r2 2/26/09 4:01 AM Page 224
The Travel & Tourism Competitiveness Report 2009 © 2009 World Economic Forum

225
2.1:
Cou
ntry
/Eco
nom
y Pr
ofile
s
The Travel & Tourism Competitiveness Index in detail ■ Competitive Advantage ■ Competitive Disadvantage
INDICATOR RANK/133
1st pillar: Policy rules and regulations1.01 Prevalence of foreign ownership ...................................2 ...■1.02 Property rights..............................................................11 ...■1.03 Business impact of rules on FDI ....................................1 ...■1.04 Visa requirements* ......................................................14 ...■1.05 Openness of bilateral Air Service Agreements* ..........27 ...■1.06 Transparency of government policymaking..................14 ...■1.07 Time required to start a business*...............................33 ...■1.08 Cost to start a business* ...............................................3 ...■
2nd pillar: Environmental sustainability2.01 Stringency of environmental regulation .......................21 ...■2.02 Enforcement of environmental regulation....................27 ...■2.03 Sustainability of T&T industry development.................27 ...■2.04 Carbon dioxide emissions* ........................................109 ...■2.05 Particulate matter concentration* ................................15 ...■2.06 Threatened species* ....................................................22 ...■2.07 Environmental treaty ratification*.................................10 ...■
3rd pillar: Safety and security3.01 Business costs of terrorism .........................................17 ...■3.02 Reliability of police services .........................................25 ...■3.03 Business costs of crime and violence..........................48 ...■3.04 Road traffic accidents*.................................................29 ...■
4th pillar: Health and hygiene4.01 Physician density*........................................................33 ...■4.02 Access to improved sanitation* .....................................1 ...■4.03 Access to improved drinking water*..............................1 ...■4.04 Hospital beds*..............................................................28 ...■
5th pillar: Prioritization of Travel & Tourism5.01 Government prioritization of the T&T industry.............14 ...■5.02 T&T government expenditure* ....................................54 ...■5.03 Effectiveness of marketing and branding.......................8 ...■5.04 T&T fair attendance*....................................................25 ...■
6th pillar: Air transport infrastructure6.01 Quality of air transport infrastructure ...........................46 ...■6.02 Available seat kilometers, domestic*...........................51 ...■6.03 Available seat kilometers, international* ......................34 ...■6.04 Departures per 1,000 population*..................................2 ...■6.05 Airport density* ............................................................20 ...■6.06 Number of operating airlines*......................................39 ...■6.07 International air transport network ...............................48 ...■
7th pillar: Ground transport infrastructure7.01 Quality of roads ............................................................70 ...■7.02 Quality of railroad infrastructure...................................51 ...■7.03 Quality of port infrastructure ........................................64 ...■7.04 Quality of ground transport network..........................108 ...■7.05 Road density*...............................................................24 ...■
INDICATOR RANK/133
8th pillar: Tourism infrastructure8.01 Hotel rooms*................................................................14 ...■8.02 Presence of major car rental companies*......................1 ...■8.03 ATMs accepting Visa cards* ........................................11 ...■
9th pillar: ICT infrastructure9.01 Extent of business Internet use...................................31 ...■9.02 Internet users* .............................................................42 ...■9.03 Telephone lines*...........................................................17 ...■9.04 Broadband Internet subscribers* .................................29 ...■9.05 Mobile telephone subscribers*....................................21 ...■
10th pillar: Price competitiveness in the T&T industry10.01 Ticket taxes and airport charges*.................................43 ...■10.02 Purchasing power parity*...........................................128 ...■10.03 Extent and effect of taxation........................................18 ...■10.04 Fuel price levels* .......................................................119 ...■10.05 Hotel price index* ........................................................70 ...■
11th pillar: Human resources11.01 Primary education enrollment* ....................................54 ...■11.02 Secondary education enrollment*................................10 ...■11.03 Quality of the educational system..................................7 ...■11.04 Local availability of research and training services.......22 ...■11.05 Extent of staff training..................................................21 ...■11.06 Hiring and firing practices.............................................84 ...■11.07 Ease of hiring foreign labor ............................................3 ...■11.08 HIV prevalence* ...........................................................49 ...■11.09 Business impact of HIV/AIDS.......................................24 ...■11.10 Life expectancy* ..........................................................12 ...■
12th pillar: Affinity for Travel & Tourism12.01 Tourism openness* ......................................................54 ...■12.02 Attitude of population toward foreign visitors................3 ...■12.03 Extension of business trips recommended .................30 ...■
13th pillar: Natural resources13.01 Number of World Heritage natural sites* ....................74 ...■13.02 Protected areas* ........................................................126 ...■13.03 Quality of the natural environment...............................20 ...■13.04 Total known species*.................................................125 ...■
14th pillar: Cultural resources14.01 Number of World Heritage cultural sites* ...................82 ...■14.02 Sports stadiums* ...........................................................1 ...■14.03 Number of international fairs and exhibitions* ............32 ...■14.04 Creative industries exports*.........................................28 ...■
Ireland
* Hard data
Note: For further details and explanation, please refer to the section “How toRead the Country/Economy Profiles” at the beginning of this chapter.
part2A_profiles.r2 2/26/09 4:01 AM Page 225
The Travel & Tourism Competitiveness Report 2009 © 2009 World Economic Forum

226
2.1:
Cou
ntry
/Eco
nom
y Pr
ofile
s
IsraelKey indicatorsPopulation (millions), 2007..............................................................................7.0Surface area (1,000 square kilometers) ........................................................22.1
Gross domestic product (US$ billions), 2007 .............................................164.1Gross domestic product (PPP, US$) per capita, 2007 ...........................27,146.8Real GDP growth (percent), 2007...................................................................5.4
Environmental Performance Index, 2008 (out of 149 countries).....................49
Travel & Tourism indicators
T&T industry, 2008 estimatesGDP (US$ millions) .............................................................4,243...................2.4 ....................3.0Employment (1,000 jobs).........................................................92...................3.4 ....................1.1
T&T economy, 2008 estimatesGDP (US$ millions) ...........................................................11,806...................6.7 ....................3.2Employment (1,000 jobs).......................................................217...................8.0 ....................1.2
Source: World Travel & Tourism Council, TSA Research 2008
International tourist arrivals (thousands), 2007...................2,068International tourism receipts (US$ millions), 2007 ...........3,059
Source: United Nations World Tourism Organization
Travel & Tourism Competitiveness Index
2009 Index......................................................................................................36 4.52008 Index............................................................................................................35 4.5T&T regulatory framework ..............................................................................37 5.1
Policy rules and regulations..........................................................................39 4.9Environmental sustainability..........................................................................81 4.3Safety and security .........................................................................................73 5.1Health and hygiene .........................................................................................14 6.6Prioritization of Travel & Tourism..................................................................41 4.8
T&T business environment and infrastructure ............................................39 4.2Air transport infrastructure ..........................................................................52 3.5Ground transport infrastructure....................................................................36 4.3Tourism infrastructure ....................................................................................32 4.5ICT infrastructure ............................................................................................24 4.7Price competitiveness in the T&T industry...............................................101 4.2
T&T human, cultural, and natural resources ...............................................51 4.2Human resources ............................................................................................29 5.5
Education and training .............................................................................27 5.4Availability of qualified labor...................................................................44 5.6
Affinity for Travel & Tourism ..........................................................................60 4.8Natural resources ...........................................................................................49 3.7Cultural resources...........................................................................................57 2.6
Note: For descriptions of variables and detailed sources, please refer to “How to the Read Country/Economy Profiles.”
Rank Score(out of 133) (1–7 scale)
International tourist arrivals (thousands)
International tourism receipts (US$ millions)
1995 1996 1997 1998 1999 2000 2001 2002 2003 2004 2005 2006 20070
1,000
2,000
3,000
4,000
5,000
1 2 3 4 5 6 7
2009–2018Percent annual growth of total (%, forecast)
part2A_profiles.r2 2/26/09 4:01 AM Page 226
The Travel & Tourism Competitiveness Report 2009 © 2009 World Economic Forum

227
2.1:
Cou
ntry
/Eco
nom
y Pr
ofile
s
The Travel & Tourism Competitiveness Index in detail ■ Competitive Advantage ■ Competitive Disadvantage
INDICATOR RANK/133
1st pillar: Policy rules and regulations1.01 Prevalence of foreign ownership .................................23 ...■1.02 Property rights..............................................................49 ...■1.03 Business impact of rules on FDI ..................................48 ...■1.04 Visa requirements* ......................................................24 ...■1.05 Openness of bilateral Air Service Agreements* ..........40 ...■1.06 Transparency of government policymaking..................37 ...■1.07 Time required to start a business*...............................91 ...■1.08 Cost to start a business* .............................................37 ...■
2nd pillar: Environmental sustainability2.01 Stringency of environmental regulation .......................42 ...■2.02 Enforcement of environmental regulation....................41 ...■2.03 Sustainability of T&T industry development.................86 ...■2.04 Carbon dioxide emissions* ........................................110 ...■2.05 Particulate matter concentration* ................................52 ...■2.06 Threatened species* ....................................................84 ...■2.07 Environmental treaty ratification*...............................115 ...■
3rd pillar: Safety and security3.01 Business costs of terrorism .......................................129 ...■3.02 Reliability of police services .........................................76 ...■3.03 Business costs of crime and violence..........................43 ...■3.04 Road traffic accidents*.................................................39 ...■
4th pillar: Health and hygiene4.01 Physician density*........................................................14 ...■4.02 Access to improved sanitation* .....................................1 ...■4.03 Access to improved drinking water*..............................1 ...■4.04 Hospital beds*..............................................................25 ...■
5th pillar: Prioritization of Travel & Tourism5.01 Government prioritization of the T&T industry.............72 ...■5.02 T&T government expenditure* ....................................98 ...■5.03 Effectiveness of marketing and branding.....................78 ...■5.04 T&T fair attendance*......................................................3 ...■
6th pillar: Air transport infrastructure6.01 Quality of air transport infrastructure ...........................39 ...■6.02 Available seat kilometers, domestic*...........................63 ...■6.03 Available seat kilometers, international* ......................37 ...■6.04 Departures per 1,000 population*................................50 ...■6.05 Airport density* ............................................................80 ...■6.06 Number of operating airlines*......................................46 ...■6.07 International air transport network ...............................27 ...■
7th pillar: Ground transport infrastructure7.01 Quality of roads ............................................................45 ...■7.02 Quality of railroad infrastructure...................................40 ...■7.03 Quality of port infrastructure ........................................53 ...■7.04 Quality of ground transport network ............................27 ...■7.05 Road density*...............................................................39 ...■
INDICATOR RANK/133
8th pillar: Tourism infrastructure8.01 Hotel rooms*................................................................41 ...■8.02 Presence of major car rental companies*......................1 ...■8.03 ATMs accepting Visa cards* ........................................49 ...■
9th pillar: ICT infrastructure9.01 Extent of business Internet use...................................17 ...■9.02 Internet users* .............................................................52 ...■9.03 Telephone lines*...........................................................24 ...■9.04 Broadband Internet subscribers* .................................19 ...■9.05 Mobile telephone subscribers*....................................10 ...■
10th pillar: Price competitiveness in the T&T industry10.01 Ticket taxes and airport charges*.................................58 ...■10.02 Purchasing power parity*...........................................104 ...■10.03 Extent and effect of taxation........................................77 ...■10.04 Fuel price levels* .......................................................109 ...■10.05 Hotel price index* ........................................................61 ...■
11th pillar: Human resources11.01 Primary education enrollment* ....................................33 ...■11.02 Secondary education enrollment*................................53 ...■11.03 Quality of the educational system................................45 ...■11.04 Local availability of research and training services.......14 ...■11.05 Extent of staff training..................................................32 ...■11.06 Hiring and firing practices.............................................36 ...■11.07 Ease of hiring foreign labor ........................................131 ...■11.08 HIV prevalence* ...........................................................22 ...■11.09 Business impact of HIV/AIDS.........................................3 ...■11.10 Life expectancy* ............................................................5 ...■
12th pillar: Affinity for Travel & Tourism12.01 Tourism openness* ......................................................84 ...■12.02 Attitude of population toward foreign visitors..............27 ...■12.03 Extension of business trips recommended .................40 ...■
13th pillar: Natural resources13.01 Number of World Heritage natural sites* ....................74 ...■13.02 Protected areas* ..........................................................14 ...■13.03 Quality of the natural environment...............................72 ...■13.04 Total known species*...................................................69 ...■
14th pillar: Cultural resources14.01 Number of World Heritage cultural sites* ...................33 ...■14.02 Sports stadiums* .........................................................67 ...■14.03 Number of international fairs and exhibitions* ............75 ...■14.04 Creative industries exports*.........................................36 ...■
Israel
* Hard data
Note: For further details and explanation, please refer to the section “How toRead the Country/Economy Profiles” at the beginning of this chapter.
part2A_profiles.r2 2/26/09 4:01 AM Page 227
The Travel & Tourism Competitiveness Report 2009 © 2009 World Economic Forum

228
2.1:
Cou
ntry
/Eco
nom
y Pr
ofile
s
ItalyKey indicatorsPopulation (millions), 2007............................................................................58.2Surface area (1,000 square kilometers) ......................................................301.3
Gross domestic product (US$ billions), 2007 ..........................................2,104.7Gross domestic product (PPP, US$) per capita, 2007 ...........................30,365.2Real GDP growth (percent), 2007...................................................................1.5
Environmental Performance Index, 2008 (out of 149 countries).....................24
Travel & Tourism indicators
T&T industry, 2008 estimatesGDP (US$ millions) ...........................................................93,994...................4.0 ....................1.9Employment (1,000 jobs)....................................................1,006...................4.4 ....................0.6
T&T economy, 2008 estimatesGDP (US$ millions) .........................................................226,072...................9.7 ....................1.8Employment (1,000 jobs)....................................................2,491.................10.8 ....................0.5
Source: World Travel & Tourism Council, TSA Research 2008
International tourist arrivals (thousands), 2007.................43,654International tourism receipts (US$ millions), 2007 .........42,651
Source: United Nations World Tourism Organization
Travel & Tourism Competitiveness Index
2009 Index......................................................................................................28 4.82008 Index............................................................................................................28 4.8T&T regulatory framework ..............................................................................46 5.0
Policy rules and regulations..........................................................................71 4.4Environmental sustainability..........................................................................51 4.7Safety and security .........................................................................................82 4.9Health and hygiene .........................................................................................27 6.2Prioritization of Travel & Tourism..................................................................51 4.7
T&T business environment and infrastructure ............................................26 4.7Air transport infrastructure ..........................................................................27 4.4Ground transport infrastructure....................................................................40 4.2Tourism infrastructure ......................................................................................3 6.9ICT infrastructure ............................................................................................25 4.7Price competitiveness in the T&T industry...............................................130 3.2
T&T human, cultural, and natural resources ...............................................22 4.7Human resources ............................................................................................41 5.3
Education and training .............................................................................45 5.0Availability of qualified labor...................................................................46 5.6
Affinity for Travel & Tourism ..........................................................................71 4.7Natural resources ...........................................................................................90 2.8Cultural resources.............................................................................................5 6.1
Note: For descriptions of variables and detailed sources, please refer to “How to the Read Country/Economy Profiles.”
Rank Score(out of 133) (1–7 scale)
International tourist arrivals (thousands)
International tourism receipts (US$ millions)
1995 1996 1997 1998 1999 2000 2001 2002 2003 2004 2005 2006 200720,000
30,000
40,000
50,000
1 2 3 4 5 6 7
2009–2018Percent annual growth of total (%, forecast)
part2A_profiles.r2 2/26/09 4:01 AM Page 228
The Travel & Tourism Competitiveness Report 2009 © 2009 World Economic Forum

229
2.1:
Cou
ntry
/Eco
nom
y Pr
ofile
s
The Travel & Tourism Competitiveness Index in detail ■ Competitive Advantage ■ Competitive Disadvantage
INDICATOR RANK/133
1st pillar: Policy rules and regulations1.01 Prevalence of foreign ownership ...............................106 ...■1.02 Property rights..............................................................59 ...■1.03 Business impact of rules on FDI ................................122 ...■1.04 Visa requirements* ......................................................40 ...■1.05 Openness of bilateral Air Service Agreements* ..........29 ...■1.06 Transparency of government policymaking................111 ...■1.07 Time required to start a business*...............................25 ...■1.08 Cost to start a business* .............................................81 ...■
2nd pillar: Environmental sustainability2.01 Stringency of environmental regulation .......................41 ...■2.02 Enforcement of environmental regulation....................64 ...■2.03 Sustainability of T&T industry development...............119 ...■2.04 Carbon dioxide emissions* ..........................................93 ...■2.05 Particulate matter concentration* ................................44 ...■2.06 Threatened species* ....................................................68 ...■2.07 Environmental treaty ratification*.................................21 ...■
3rd pillar: Safety and security3.01 Business costs of terrorism .........................................79 ...■3.02 Reliability of police services .........................................54 ...■3.03 Business costs of crime and violence..........................73 ...■3.04 Road traffic accidents*...............................................107 ...■
4th pillar: Health and hygiene4.01 Physician density*........................................................12 ...■4.02 Access to improved sanitation* .....................................1 ...■4.03 Access to improved drinking water*..............................1 ...■4.04 Hospital beds*..............................................................43 ...■
5th pillar: Prioritization of Travel & Tourism5.01 Government prioritization of the T&T industry...........107 ...■5.02 T&T government expenditure* ....................................61 ...■5.03 Effectiveness of marketing and branding...................108 ...■5.04 T&T fair attendance*......................................................3 ...■
6th pillar: Air transport infrastructure6.01 Quality of air transport infrastructure ...........................78 ...■6.02 Available seat kilometers, domestic*...........................12 ...■6.03 Available seat kilometers, international* ......................14 ...■6.04 Departures per 1,000 population*................................42 ...■6.05 Airport density* ............................................................69 ...■6.06 Number of operating airlines*........................................5 ...■6.07 International air transport network ...............................89 ...■
7th pillar: Ground transport infrastructure7.01 Quality of roads ............................................................55 ...■7.02 Quality of railroad infrastructure...................................52 ...■7.03 Quality of port infrastructure ........................................95 ...■7.04 Quality of ground transport network ............................99 ...■7.05 Road density*...............................................................20 ...■
INDICATOR RANK/133
8th pillar: Tourism infrastructure8.01 Hotel rooms*..................................................................8 ...■8.02 Presence of major car rental companies*......................1 ...■8.03 ATMs accepting Visa cards* ........................................15 ...■
9th pillar: ICT infrastructure9.01 Extent of business Internet use...................................83 ...■9.02 Internet users* .............................................................24 ...■9.03 Telephone lines*...........................................................20 ...■9.04 Broadband Internet subscribers* .................................26 ...■9.05 Mobile telephone subscribers*......................................7 ...■
10th pillar: Price competitiveness in the T&T industry10.01 Ticket taxes and airport charges*.................................37 ...■10.02 Purchasing power parity*...........................................117 ...■10.03 Extent and effect of taxation......................................128 ...■10.04 Fuel price levels* .......................................................126 ...■10.05 Hotel price index* ......................................................102 ...■
11th pillar: Human resources11.01 Primary education enrollment* ....................................12 ...■11.02 Secondary education enrollment*................................26 ...■11.03 Quality of the educational system................................84 ...■11.04 Local availability of research and training services.......35 ...■11.05 Extent of staff training................................................109 ...■11.06 Hiring and firing practices...........................................133 ...■11.07 Ease of hiring foreign labor ..........................................14 ...■11.08 HIV prevalence* ...........................................................73 ...■11.09 Business impact of HIV/AIDS.......................................31 ...■11.10 Life expectancy* ............................................................5 ...■
12th pillar: Affinity for Travel & Tourism12.01 Tourism openness* ......................................................94 ...■12.02 Attitude of population toward foreign visitors..............78 ...■12.03 Extension of business trips recommended .................34 ...■
13th pillar: Natural resources13.01 Number of World Heritage natural sites* ....................40 ...■13.02 Protected areas* ..........................................................91 ...■13.03 Quality of the natural environment...............................87 ...■13.04 Total known species*...................................................68 ...■
14th pillar: Cultural resources14.01 Number of World Heritage cultural sites* .....................1 ...■14.02 Sports stadiums* .........................................................41 ...■14.03 Number of international fairs and exhibitions* ..............6 ...■14.04 Creative industries exports*...........................................2 ...■
Italy
* Hard data
Note: For further details and explanation, please refer to the section “How toRead the Country/Economy Profiles” at the beginning of this chapter.
part2A_profiles.r2 2/26/09 4:01 AM Page 229
The Travel & Tourism Competitiveness Report 2009 © 2009 World Economic Forum

230
2.1:
Cou
ntry
/Eco
nom
y Pr
ofile
s
JamaicaKey indicatorsPopulation (millions), 2007..............................................................................2.7Surface area (1,000 square kilometers) ........................................................11.0
Gross domestic product (US$ billions), 2007 ...............................................11.3Gross domestic product (PPP, US$) per capita, 2007 .............................7,688.2Real GDP growth (percent), 2007...................................................................1.2
Environmental Performance Index, 2008 (out of 149 countries).....................54
Travel & Tourism indicators
T&T industry, 2008 estimatesGDP (US$ millions) .............................................................1,009...................9.1 ....................4.8Employment (1,000 jobs).........................................................88...................8.2 ....................3.9
T&T economy, 2008 estimatesGDP (US$ millions) .............................................................3,415.................30.8 ....................3.7Employment (1,000 jobs).......................................................290.................27.1 ....................2.9
Source: World Travel & Tourism Council, TSA Research 2008
International tourist arrivals (thousands), 2007...................1,704International tourism receipts (US$ millions), 2007 ...........1,853
Source: United Nations World Tourism Organization
Travel & Tourism Competitiveness Index
2009 Index......................................................................................................60 4.12008 Index............................................................................................................57 4.2T&T regulatory framework ..............................................................................51 4.9
Policy rules and regulations............................................................................8 5.4Environmental sustainability..........................................................................93 4.2Safety and security .........................................................................................96 4.6Health and hygiene .........................................................................................85 4.1Prioritization of Travel & Tourism....................................................................5 6.0
T&T business environment and infrastructure ............................................57 3.8Air transport infrastructure ..........................................................................55 3.3Ground transport infrastructure....................................................................41 4.2Tourism infrastructure ....................................................................................70 3.2ICT infrastructure ............................................................................................48 3.4Price competitiveness in the T&T industry.................................................68 4.7
T&T human, cultural, and natural resources ...............................................80 3.8Human resources ............................................................................................78 5.0
Education and training .............................................................................74 4.6Availability of qualified labor...................................................................78 5.4
Affinity for Travel & Tourism ............................................................................8 6.1Natural resources .........................................................................................114 2.3Cultural resources...........................................................................................98 1.6
Note: For descriptions of variables and detailed sources, please refer to “How to the Read Country/Economy Profiles.”
Rank Score(out of 133) (1–7 scale)
International tourist arrivals (thousands)
International tourism receipts (US$ millions)
1995 1996 1997 1998 1999 2000 2001 2002 2003 2004 2005 2006 20071,000
1,250
1,500
1,750
2,000
1 2 3 4 5 6 7
2009–2018Percent annual growth of total (%, forecast)
part2A_profiles.r2 2/26/09 4:01 AM Page 230
The Travel & Tourism Competitiveness Report 2009 © 2009 World Economic Forum

231
2.1:
Cou
ntry
/Eco
nom
y Pr
ofile
s
The Travel & Tourism Competitiveness Index in detail ■ Competitive Advantage ■ Competitive Disadvantage
INDICATOR RANK/133
1st pillar: Policy rules and regulations1.01 Prevalence of foreign ownership .................................28 ...■1.02 Property rights..............................................................53 ...■1.03 Business impact of rules on FDI ..................................36 ...■1.04 Visa requirements* ........................................................8 ...■1.05 Openness of bilateral Air Service Agreements* ............6 ...■1.06 Transparency of government policymaking..................77 ...■1.07 Time required to start a business*...............................20 ...■1.08 Cost to start a business* .............................................54 ...■
2nd pillar: Environmental sustainability2.01 Stringency of environmental regulation .......................78 ...■2.02 Enforcement of environmental regulation....................84 ...■2.03 Sustainability of T&T industry development.................46 ...■2.04 Carbon dioxide emissions* ..........................................69 ...■2.05 Particulate matter concentration* ................................71 ...■2.06 Threatened species* ..................................................122 ...■2.07 Environmental treaty ratification*.................................67 ...■
3rd pillar: Safety and security3.01 Business costs of terrorism .........................................48 ...■3.02 Reliability of police services .......................................102 ...■3.03 Business costs of crime and violence........................131 ...■3.04 Road traffic accidents*...................................................4 ...■
4th pillar: Health and hygiene4.01 Physician density*........................................................90 ...■4.02 Access to improved sanitation* ...................................72 ...■4.03 Access to improved drinking water*............................68 ...■4.04 Hospital beds*..............................................................89 ...■
5th pillar: Prioritization of Travel & Tourism5.01 Government prioritization of the T&T industry...............9 ...■5.02 T&T government expenditure* ......................................2 ...■5.03 Effectiveness of marketing and branding.....................13 ...■5.04 T&T fair attendance*....................................................41 ...■
6th pillar: Air transport infrastructure6.01 Quality of air transport infrastructure ...........................41 ...■6.02 Available seat kilometers, domestic*...........................78 ...■6.03 Available seat kilometers, international* ......................68 ...■6.04 Departures per 1,000 population*................................41 ...■6.05 Airport density* ............................................................62 ...■6.06 Number of operating airlines*......................................55 ...■6.07 International air transport network ...............................28 ...■
7th pillar: Ground transport infrastructure7.01 Quality of roads ............................................................60 ...■7.02 Quality of railroad infrastructure.................................118 ...■7.03 Quality of port infrastructure ........................................32 ...■7.04 Quality of ground transport network ............................92 ...■7.05 Road density*...............................................................10 ...■
INDICATOR RANK/133
8th pillar: Tourism infrastructure8.01 Hotel rooms*................................................................33 ...■8.02 Presence of major car rental companies*....................73 ...■8.03 ATMs accepting Visa cards* ........................................69 ...■
9th pillar: ICT infrastructure9.01 Extent of business Internet use...................................40 ...■9.02 Internet users* .............................................................22 ...■9.03 Telephone lines*...........................................................83 ...■9.04 Broadband Internet subscribers* .................................59 ...■9.05 Mobile telephone subscribers*....................................47 ...■
10th pillar: Price competitiveness in the T&T industry10.01 Ticket taxes and airport charges*.................................79 ...■10.02 Purchasing power parity*.............................................70 ...■10.03 Extent and effect of taxation......................................120 ...■10.04 Fuel price levels* .........................................................51 ...■10.05 Hotel price index* ........................................................42 ...■
11th pillar: Human resources11.01 Primary education enrollment* ....................................83 ...■11.02 Secondary education enrollment*................................68 ...■11.03 Quality of the educational system................................99 ...■11.04 Local availability of research and training services.......57 ...■11.05 Extent of staff training..................................................85 ...■11.06 Hiring and firing practices.............................................66 ...■11.07 Ease of hiring foreign labor ..........................................94 ...■11.08 HIV prevalence* .........................................................110 ...■11.09 Business impact of HIV/AIDS.....................................117 ...■11.10 Life expectancy* ..........................................................66 ...■
12th pillar: Affinity for Travel & Tourism12.01 Tourism openness* ........................................................8 ...■12.02 Attitude of population toward foreign visitors..............37 ...■12.03 Extension of business trips recommended .................63 ...■
13th pillar: Natural resources13.01 Number of World Heritage natural sites* ....................74 ...■13.02 Protected areas* ..........................................................76 ...■13.03 Quality of the natural environment...............................81 ...■13.04 Total known species*.................................................126 ...■
14th pillar: Cultural resources14.01 Number of World Heritage cultural sites* ...................97 ...■14.02 Sports stadiums* .........................................................51 ...■14.03 Number of international fairs and exhibitions* ............79 ...■14.04 Creative industries exports*.......................................109 ...■
Jamaica
* Hard data
Note: For further details and explanation, please refer to the section “How toRead the Country/Economy Profiles” at the beginning of this chapter.
part2A_profiles.r2 2/26/09 4:01 AM Page 231
The Travel & Tourism Competitiveness Report 2009 © 2009 World Economic Forum

232
2.1:
Cou
ntry
/Eco
nom
y Pr
ofile
s
JapanKey indicatorsPopulation (millions), 2007..........................................................................128.3Surface area (1,000 square kilometers) ......................................................377.9
Gross domestic product (US$ billions), 2007 ..........................................4,381.6Gross domestic product (PPP, US$) per capita, 2007 ...........................33,596.5Real GDP growth (percent), 2007...................................................................2.1
Environmental Performance Index, 2008 (out of 149 countries).....................21
Travel & Tourism indicators
T&T industry, 2008 estimatesGDP (US$ millions) .........................................................162,528...................3.4 ....................2.2Employment (1,000 jobs)....................................................2,645...................4.1 ....................0.8
T&T economy, 2008 estimatesGDP (US$ millions) .........................................................438,080...................9.2 ....................2.7Employment (1,000 jobs)....................................................6,833.................10.6 ....................1.2
Source: World Travel & Tourism Council, TSA Research 2008
International tourist arrivals (thousands), 2007...................8,347International tourism receipts (US$ millions), 2007 ...........9,334
Source: United Nations World Tourism Organization
Travel & Tourism Competitiveness Index
2009 Index......................................................................................................25 4.92008 Index............................................................................................................23 4.9T&T regulatory framework ..............................................................................40 5.1
Policy rules and regulations..........................................................................38 4.9Environmental sustainability..........................................................................49 4.7Safety and security .........................................................................................84 4.8Health and hygiene .........................................................................................21 6.3Prioritization of Travel & Tourism..................................................................49 4.7
T&T business environment and infrastructure ............................................20 4.8Air transport infrastructure ..........................................................................24 4.6Ground transport infrastructure......................................................................8 6.1Tourism infrastructure ....................................................................................40 4.2ICT infrastructure ............................................................................................21 4.9Price competitiveness in the T&T industry.................................................86 4.3
T&T human, cultural, and natural resources ...............................................15 4.8Human resources ............................................................................................20 5.7
Education and training .............................................................................12 5.9Availability of qualified labor...................................................................67 5.5
Affinity for Travel & Tourism ........................................................................131 3.8Natural resources ...........................................................................................41 3.9Cultural resources...........................................................................................10 5.8
Note: For descriptions of variables and detailed sources, please refer to “How to the Read Country/Economy Profiles.”
Rank Score(out of 133) (1–7 scale)
International tourist arrivals (thousands)
International tourism receipts (US$ millions)
1995 1996 1997 1998 1999 2000 2001 2002 2003 2004 2005 2006 20072,000
4,000
6,000
8,000
10,000
12,000
1 2 3 4 5 6 7
2009–2018Percent annual growth of total (%, forecast)
part2A_profiles.r2 2/26/09 4:01 AM Page 232
The Travel & Tourism Competitiveness Report 2009 © 2009 World Economic Forum

233
2.1:
Cou
ntry
/Eco
nom
y Pr
ofile
s
The Travel & Tourism Competitiveness Index in detail ■ Competitive Advantage ■ Competitive Disadvantage
INDICATOR RANK/133
1st pillar: Policy rules and regulations1.01 Prevalence of foreign ownership .................................99 ...■1.02 Property rights..............................................................15 ...■1.03 Business impact of rules on FDI ..................................90 ...■1.04 Visa requirements* ......................................................37 ...■1.05 Openness of bilateral Air Service Agreements* ..........20 ...■1.06 Transparency of government policymaking..................19 ...■1.07 Time required to start a business*...............................66 ...■1.08 Cost to start a business* .............................................51 ...■
2nd pillar: Environmental sustainability2.01 Stringency of environmental regulation .......................11 ...■2.02 Enforcement of environmental regulation....................14 ...■2.03 Sustainability of T&T industry development.................89 ...■2.04 Carbon dioxide emissions* ........................................107 ...■2.05 Particulate matter concentration* ................................51 ...■2.06 Threatened species* ..................................................126 ...■2.07 Environmental treaty ratification*.................................10 ...■
3rd pillar: Safety and security3.01 Business costs of terrorism .......................................112 ...■3.02 Reliability of police services .........................................22 ...■3.03 Business costs of crime and violence..........................57 ...■3.04 Road traffic accidents*...............................................114 ...■
4th pillar: Health and hygiene4.01 Physician density*........................................................51 ...■4.02 Access to improved sanitation* .....................................1 ...■4.03 Access to improved drinking water*..............................1 ...■4.04 Hospital beds*................................................................1 ...■
5th pillar: Prioritization of Travel & Tourism5.01 Government prioritization of the T&T industry.............83 ...■5.02 T&T government expenditure* ....................................45 ...■5.03 Effectiveness of marketing and branding.....................89 ...■5.04 T&T fair attendance*....................................................20 ...■
6th pillar: Air transport infrastructure6.01 Quality of air transport infrastructure ...........................49 ...■6.02 Available seat kilometers, domestic*.............................3 ...■6.03 Available seat kilometers, international* ........................5 ...■6.04 Departures per 1,000 population*................................48 ...■6.05 Airport density* ............................................................79 ...■6.06 Number of operating airlines*......................................18 ...■6.07 International air transport network ...............................17 ...■
7th pillar: Ground transport infrastructure7.01 Quality of roads ............................................................19 ...■7.02 Quality of railroad infrastructure.....................................3 ...■7.03 Quality of port infrastructure ........................................25 ...■7.04 Quality of ground transport network ............................10 ...■7.05 Road density*.................................................................6 ...■
INDICATOR RANK/133
8th pillar: Tourism infrastructure8.01 Hotel rooms*................................................................17 ...■8.02 Presence of major car rental companies*....................56 ...■8.03 ATMs accepting Visa cards* ........................................57 ...■
9th pillar: ICT infrastructure9.01 Extent of business Internet use...................................11 ...■9.02 Internet users* .............................................................10 ...■9.03 Telephone lines*...........................................................32 ...■9.04 Broadband Internet subscribers* .................................18 ...■9.05 Mobile telephone subscribers*....................................60 ...■
10th pillar: Price competitiveness in the T&T industry10.01 Ticket taxes and airport charges*.................................52 ...■10.02 Purchasing power parity*...........................................112 ...■10.03 Extent and effect of taxation........................................92 ...■10.04 Fuel price levels* .........................................................74 ...■10.05 Hotel price index* ........................................................51 ...■
11th pillar: Human resources11.01 Primary education enrollment* ......................................2 ...■11.02 Secondary education enrollment*................................22 ...■11.03 Quality of the educational system................................31 ...■11.04 Local availability of research and training services.......12 ...■11.05 Extent of staff training....................................................5 ...■11.06 Hiring and firing practices...........................................110 ...■11.07 Ease of hiring foreign labor ........................................115 ...■11.08 HIV prevalence* .............................................................1 ...■11.09 Business impact of HIV/AIDS.......................................46 ...■11.10 Life expectancy* ............................................................1 ...■
12th pillar: Affinity for Travel & Tourism12.01 Tourism openness* ....................................................130 ...■12.02 Attitude of population toward foreign visitors............106 ...■12.03 Extension of business trips recommended ...............130 ...■
13th pillar: Natural resources13.01 Number of World Heritage natural sites* ....................16 ...■13.02 Protected areas* ..........................................................65 ...■13.03 Quality of the natural environment...............................38 ...■13.04 Total known species*...................................................54 ...■
14th pillar: Cultural resources14.01 Number of World Heritage cultural sites* ...................11 ...■14.02 Sports stadiums* .........................................................64 ...■14.03 Number of international fairs and exhibitions* ..............8 ...■14.04 Creative industries exports*.........................................16 ...■
Japan
* Hard data
Note: For further details and explanation, please refer to the section “How toRead the Country/Economy Profiles” at the beginning of this chapter.
part2A_profiles.r2 2/26/09 4:01 AM Page 233
The Travel & Tourism Competitiveness Report 2009 © 2009 World Economic Forum

234
2.1:
Cou
ntry
/Eco
nom
y Pr
ofile
s
JordanKey indicatorsPopulation (millions), 2007..............................................................................6.0Surface area (1,000 square kilometers) ........................................................88.8
Gross domestic product (US$ billions), 2007 ...............................................15.8Gross domestic product (PPP, US$) per capita, 2007 .............................4,906.3Real GDP growth (percent), 2007...................................................................6.0
Environmental Performance Index, 2008 (out of 149 countries).....................70
Travel & Tourism indicators
T&T industry, 2008 estimatesGDP (US$ millions) .............................................................1,360...................7.9 ....................4.8Employment (1,000 jobs).......................................................134...................7.6 ....................3.3
T&T economy, 2008 estimatesGDP (US$ millions) .............................................................3,280.................19.2 ....................4.9Employment (1,000 jobs).......................................................312.................17.6 ....................3.4
Source: World Travel & Tourism Council, TSA Research 2008
International tourist arrivals (thousands), 2007...................3,431International tourism receipts (US$ millions), 2007 ...........2,312
Source: United Nations World Tourism Organization
Travel & Tourism Competitiveness Index
2009 Index......................................................................................................54 4.22008 Index............................................................................................................53 4.2T&T regulatory framework ..............................................................................36 5.2
Policy rules and regulations..........................................................................61 4.5Environmental sustainability..........................................................................35 4.9Safety and security .........................................................................................17 6.1Health and hygiene .........................................................................................58 4.9Prioritization of Travel & Tourism..................................................................24 5.3
T&T business environment and infrastructure ............................................67 3.5Air transport infrastructure ..........................................................................63 3.2Ground transport infrastructure....................................................................69 3.5Tourism infrastructure ....................................................................................65 3.4ICT infrastructure ............................................................................................70 2.8Price competitiveness in the T&T industry.................................................42 5.0
T&T human, cultural, and natural resources ...............................................54 4.1Human resources ............................................................................................59 5.1
Education and training .............................................................................44 5.0Availability of qualified labor...................................................................92 5.2
Affinity for Travel & Tourism ............................................................................6 6.4Natural resources ...........................................................................................87 2.8Cultural resources...........................................................................................87 1.8
Note: For descriptions of variables and detailed sources, please refer to “How to the Read Country/Economy Profiles.”
Rank Score(out of 133) (1–7 scale)
International tourist arrivals (thousands)
International tourism receipts (US$ millions)
1995 1996 1997 1998 1999 2000 2001 2002 2003 2004 2005 2006 20070
1,000
2,000
3,000
4,000
1 2 3 4 5 6 7
2009–2018Percent annual growth of total (%, forecast)
part2A_profiles.r2 2/26/09 4:01 AM Page 234
The Travel & Tourism Competitiveness Report 2009 © 2009 World Economic Forum

235
2.1:
Cou
ntry
/Eco
nom
y Pr
ofile
s
The Travel & Tourism Competitiveness Index in detail ■ Competitive Advantage ■ Competitive Disadvantage
INDICATOR RANK/133
1st pillar: Policy rules and regulations1.01 Prevalence of foreign ownership .................................45 ...■1.02 Property rights..............................................................23 ...■1.03 Business impact of rules on FDI ..................................44 ...■1.04 Visa requirements* ......................................................35 ...■1.05 Openness of bilateral Air Service Agreements* ..........37 ...■1.06 Transparency of government policymaking..................49 ...■1.07 Time required to start a business*...............................38 ...■1.08 Cost to start a business* ...........................................108 ...■
2nd pillar: Environmental sustainability2.01 Stringency of environmental regulation .......................52 ...■2.02 Enforcement of environmental regulation....................42 ...■2.03 Sustainability of T&T industry development.................41 ...■2.04 Carbon dioxide emissions* ..........................................60 ...■2.05 Particulate matter concentration* ................................86 ...■2.06 Threatened species* ....................................................75 ...■2.07 Environmental treaty ratification*.................................21 ...■
3rd pillar: Safety and security3.01 Business costs of terrorism .........................................52 ...■3.02 Reliability of police services .........................................20 ...■3.03 Business costs of crime and violence..........................14 ...■3.04 Road traffic accidents*.................................................61 ...■
4th pillar: Health and hygiene4.01 Physician density*........................................................46 ...■4.02 Access to improved sanitation* ...................................68 ...■4.03 Access to improved drinking water*............................47 ...■4.04 Hospital beds*..............................................................83 ...■
5th pillar: Prioritization of Travel & Tourism5.01 Government prioritization of the T&T industry.............50 ...■5.02 T&T government expenditure* ......................................7 ...■5.03 Effectiveness of marketing and branding.....................46 ...■5.04 T&T fair attendance*....................................................81 ...■
6th pillar: Air transport infrastructure6.01 Quality of air transport infrastructure ...........................31 ...■6.02 Available seat kilometers, domestic*...........................80 ...■6.03 Available seat kilometers, international* ......................63 ...■6.04 Departures per 1,000 population*................................52 ...■6.05 Airport density* ............................................................97 ...■6.06 Number of operating airlines*......................................62 ...■6.07 International air transport network ...............................30 ...■
7th pillar: Ground transport infrastructure7.01 Quality of roads ............................................................38 ...■7.02 Quality of railroad infrastructure...................................91 ...■7.03 Quality of port infrastructure ........................................46 ...■7.04 Quality of ground transport network ............................37 ...■7.05 Road density*.............................................................107 ...■
INDICATOR RANK/133
8th pillar: Tourism infrastructure8.01 Hotel rooms*................................................................61 ...■8.02 Presence of major car rental companies*....................23 ...■8.03 ATMs accepting Visa cards* ........................................75 ...■
9th pillar: ICT infrastructure9.01 Extent of business Internet use...................................39 ...■9.02 Internet users* .............................................................72 ...■9.03 Telephone lines*...........................................................90 ...■9.04 Broadband Internet subscribers* .................................72 ...■9.05 Mobile telephone subscribers*....................................65 ...■
10th pillar: Price competitiveness in the T&T industry10.01 Ticket taxes and airport charges*...............................104 ...■10.02 Purchasing power parity*.............................................65 ...■10.03 Extent and effect of taxation........................................79 ...■10.04 Fuel price levels* .........................................................17 ...■10.05 Hotel price index* ........................................................29 ...■
11th pillar: Human resources11.01 Primary education enrollment* ....................................89 ...■11.02 Secondary education enrollment*................................61 ...■11.03 Quality of the educational system................................27 ...■11.04 Local availability of research and training services.......53 ...■11.05 Extent of staff training..................................................50 ...■11.06 Hiring and firing practices...........................................108 ...■11.07 Ease of hiring foreign labor ........................................101 ...■11.08 HIV prevalence* .............................................................1 ...■11.09 Business impact of HIV/AIDS.......................................10 ...■11.10 Life expectancy* ..........................................................76 ...■
12th pillar: Affinity for Travel & Tourism12.01 Tourism openness* ........................................................5 ...■12.02 Attitude of population toward foreign visitors..............41 ...■12.03 Extension of business trips recommended .................15 ...■
13th pillar: Natural resources13.01 Number of World Heritage natural sites* ....................74 ...■13.02 Protected areas* ..........................................................60 ...■13.03 Quality of the natural environment...............................39 ...■13.04 Total known species*...................................................89 ...■
14th pillar: Cultural resources14.01 Number of World Heritage cultural sites* ...................54 ...■14.02 Sports stadiums* .........................................................95 ...■14.03 Number of international fairs and exhibitions* ............83 ...■14.04 Creative industries exports*.........................................46 ...■
Jordan
* Hard data
Note: For further details and explanation, please refer to the section “How toRead the Country/Economy Profiles” at the beginning of this chapter.
part2A_profiles.r2 2/26/09 4:01 AM Page 235
The Travel & Tourism Competitiveness Report 2009 © 2009 World Economic Forum

236
2.1:
Cou
ntry
/Eco
nom
y Pr
ofile
s
KazakhstanKey indicatorsPopulation (millions), 2007............................................................................14.8Surface area (1,000 square kilometers) ...................................................2,724.9
Gross domestic product (US$ billions), 2007 .............................................104.9Gross domestic product (PPP, US$) per capita, 2007 ...........................10,837.2Real GDP growth (percent), 2007...................................................................8.9
Environmental Performance Index, 2008 (out of 149 countries)...................107
Travel & Tourism indicators
T&T industry, 2008 estimatesGDP (US$ millions) .................................................................n/a ...................n/a ....................n/aEmployment (1,000 jobs)........................................................n/a ...................n/a ....................n/a
T&T economy, 2008 estimatesGDP (US$ millions) .................................................................n/a ...................n/a ....................n/aEmployment (1,000 jobs)........................................................n/a ...................n/a ....................n/a
Source: World Travel & Tourism Council, TSA Research 2008
International tourist arrivals (thousands), 2007...................3,876International tourism receipts (US$ millions), 2007 ...........1,013
Source: United Nations World Tourism Organization
Travel & Tourism Competitiveness Index
2009 Index......................................................................................................92 3.62008 Index............................................................................................................91 3.6T&T regulatory framework ..............................................................................60 4.7
Policy rules and regulations..........................................................................86 4.1Environmental sustainability........................................................................117 3.9Safety and security .........................................................................................76 5.0Health and hygiene ...........................................................................................8 6.8Prioritization of Travel & Tourism................................................................101 3.7
T&T business environment and infrastructure ............................................96 2.9Air transport infrastructure ..........................................................................89 2.6Ground transport infrastructure....................................................................87 3.0Tourism infrastructure ....................................................................................91 2.1ICT infrastructure ............................................................................................72 2.7Price competitiveness in the T&T industry.................................................93 4.2
T&T human, cultural, and natural resources .............................................121 3.3Human resources ............................................................................................74 5.0
Education and training .............................................................................68 4.7Availability of qualified labor...................................................................84 5.3
Affinity for Travel & Tourism ........................................................................112 4.3Natural resources .........................................................................................106 2.5Cultural resources.........................................................................................116 1.4
Note: For descriptions of variables and detailed sources, please refer to “How to the Read Country/Economy Profiles.”
Rank Score(out of 133) (1–7 scale)
International tourist arrivals (thousands)
International tourism receipts (US$ millions)
1995 1996 1997 1998 1999 2000 2001 2002 2003 2004 2005 2006 20070
1,000
2,000
3,000
4,000
1 2 3 4 5 6 7
2009–2018Percent annual growth of total (%, forecast)
part2A_profiles.r2 2/26/09 4:01 AM Page 236
The Travel & Tourism Competitiveness Report 2009 © 2009 World Economic Forum

237
2.1:
Cou
ntry
/Eco
nom
y Pr
ofile
s
The Travel & Tourism Competitiveness Index in detail ■ Competitive Advantage ■ Competitive Disadvantage
INDICATOR RANK/133
1st pillar: Policy rules and regulations1.01 Prevalence of foreign ownership ...............................110 ...■1.02 Property rights..............................................................95 ...■1.03 Business impact of rules on FDI ................................101 ...■1.04 Visa requirements* ....................................................112 ...■1.05 Openness of bilateral Air Service Agreements* ........101 ...■1.06 Transparency of government policymaking..................70 ...■1.07 Time required to start a business*...............................63 ...■1.08 Cost to start a business* .............................................42 ...■
2nd pillar: Environmental sustainability2.01 Stringency of environmental regulation .....................108 ...■2.02 Enforcement of environmental regulation....................90 ...■2.03 Sustainability of T&T industry development.................97 ...■2.04 Carbon dioxide emissions* ........................................116 ...■2.05 Particulate matter concentration* ................................24 ...■2.06 Threatened species* ....................................................88 ...■2.07 Environmental treaty ratification*...............................115 ...■
3rd pillar: Safety and security3.01 Business costs of terrorism .........................................84 ...■3.02 Reliability of police services .........................................97 ...■3.03 Business costs of crime and violence..........................71 ...■3.04 Road traffic accidents*.................................................76 ...■
4th pillar: Health and hygiene4.01 Physician density*..........................................................7 ...■4.02 Access to improved sanitation* ...................................40 ...■4.03 Access to improved drinking water*............................58 ...■4.04 Hospital beds*..............................................................10 ...■
5th pillar: Prioritization of Travel & Tourism5.01 Government prioritization of the T&T industry...........104 ...■5.02 T&T government expenditure* ...................................n/a ......5.03 Effectiveness of marketing and branding...................105 ...■5.04 T&T fair attendance*....................................................98 ...■
6th pillar: Air transport infrastructure6.01 Quality of air transport infrastructure .........................102 ...■6.02 Available seat kilometers, domestic*...........................32 ...■6.03 Available seat kilometers, international* ......................73 ...■6.04 Departures per 1,000 population*................................86 ...■6.05 Airport density* ............................................................45 ...■6.06 Number of operating airlines*......................................64 ...■6.07 International air transport network ...............................96 ...■
7th pillar: Ground transport infrastructure7.01 Quality of roads ..........................................................108 ...■7.02 Quality of railroad infrastructure...................................34 ...■7.03 Quality of port infrastructure ......................................101 ...■7.04 Quality of ground transport network ............................55 ...■7.05 Road density*.............................................................124 ...■
INDICATOR RANK/133
8th pillar: Tourism infrastructure8.01 Hotel rooms*................................................................90 ...■8.02 Presence of major car rental companies*....................95 ...■8.03 ATMs accepting Visa cards* ........................................63 ...■
9th pillar: ICT infrastructure9.01 Extent of business Internet use...................................87 ...■9.02 Internet users* .............................................................84 ...■9.03 Telephone lines*...........................................................62 ...■9.04 Broadband Internet subscribers* .................................64 ...■9.05 Mobile telephone subscribers*....................................63 ...■
10th pillar: Price competitiveness in the T&T industry10.01 Ticket taxes and airport charges*................................n/a ......10.02 Purchasing power parity*.............................................74 ...■10.03 Extent and effect of taxation........................................82 ...■10.04 Fuel price levels* .........................................................17 ...■10.05 Hotel price index* ......................................................108 ...■
11th pillar: Human resources11.01 Primary education enrollment* ....................................85 ...■11.02 Secondary education enrollment*................................51 ...■11.03 Quality of the educational system................................68 ...■11.04 Local availability of research and training services.......82 ...■11.05 Extent of staff training..................................................92 ...■11.06 Hiring and firing practices...............................................4 ...■11.07 Ease of hiring foreign labor ........................................111 ...■11.08 HIV prevalence* ...........................................................22 ...■11.09 Business impact of HIV/AIDS.......................................95 ...■11.10 Life expectancy* ........................................................100 ...■
12th pillar: Affinity for Travel & Tourism12.01 Tourism openness* ....................................................114 ...■12.02 Attitude of population toward foreign visitors............114 ...■12.03 Extension of business trips recommended .................68 ...■
13th pillar: Natural resources13.01 Number of World Heritage natural sites* ....................40 ...■13.02 Protected areas* ........................................................109 ...■13.03 Quality of the natural environment.............................125 ...■13.04 Total known species*...................................................56 ...■
14th pillar: Cultural resources14.01 Number of World Heritage cultural sites* ...................82 ...■14.02 Sports stadiums* .........................................................96 ...■14.03 Number of international fairs and exhibitions* ..........107 ...■14.04 Creative industries exports*.........................................90 ...■
Kazakhstan
* Hard data
Note: For further details and explanation, please refer to the section “How toRead the Country/Economy Profiles” at the beginning of this chapter.
part2A_profiles.r2 2/26/09 4:01 AM Page 237
The Travel & Tourism Competitiveness Report 2009 © 2009 World Economic Forum

238
2.1:
Cou
ntry
/Eco
nom
y Pr
ofile
s
KenyaKey indicatorsPopulation (millions), 2007............................................................................36.0Surface area (1,000 square kilometers) ......................................................580.4
Gross domestic product (US$ billions), 2007 ...............................................27.0Gross domestic product (PPP, US$) per capita, 2007 .............................1,672.6Real GDP growth (percent), 2007...................................................................7.0
Environmental Performance Index, 2008 (out of 149 countries).....................96
Travel & Tourism indicators
T&T industry, 2008 estimatesGDP (US$ millions) .............................................................1,572...................4.9 ....................3.8Employment (1,000 jobs).......................................................217...................3.9 ....................2.4
T&T economy, 2008 estimatesGDP (US$ millions) .............................................................3,464.................10.8 ....................4.0Employment (1,000 jobs).......................................................483...................8.7 ....................2.6
Source: World Travel & Tourism Council, TSA Research 2008
International tourist arrivals (thousands), 2006...................1,644International tourism receipts (US$ millions), 2007 ..............911
Source: United Nations World Tourism Organization
Travel & Tourism Competitiveness Index
2009 Index......................................................................................................97 3.62008 Index..........................................................................................................101 3.5T&T regulatory framework ..............................................................................93 4.2
Policy rules and regulations..........................................................................90 4.0Environmental sustainability..........................................................................16 5.3Safety and security .......................................................................................121 3.9Health and hygiene .......................................................................................121 1.9Prioritization of Travel & Tourism..................................................................12 5.7
T&T business environment and infrastructure ..........................................100 2.8Air transport infrastructure ..........................................................................77 2.8Ground transport infrastructure....................................................................98 2.8Tourism infrastructure ....................................................................................98 1.9ICT infrastructure ..........................................................................................110 1.9Price competitiveness in the T&T industry.................................................70 4.7
T&T human, cultural, and natural resources ...............................................72 3.8Human resources ..........................................................................................100 4.5
Education and training .............................................................................95 4.2Availability of qualified labor.................................................................114 4.8
Affinity for Travel & Tourism ..........................................................................50 4.9Natural resources ...........................................................................................25 4.5Cultural resources.........................................................................................114 1.4
Note: For descriptions of variables and detailed sources, please refer to “How to the Read Country/Economy Profiles.”
Rank Score(out of 133) (1–7 scale)
International tourist arrivals (thousands)
International tourism receipts (US$ millions)
1995 1996 1997 1998 1999 2000 2001 2002 2003 2004 2005 2006 20070
500
1,000
1,500
2,000
1 2 3 4 5 6 7
2009–2018Percent annual growth of total (%, forecast)
part2A_profiles.r2 2/26/09 4:01 AM Page 238
The Travel & Tourism Competitiveness Report 2009 © 2009 World Economic Forum

239
2.1:
Cou
ntry
/Eco
nom
y Pr
ofile
s
The Travel & Tourism Competitiveness Index in detail ■ Competitive Advantage ■ Competitive Disadvantage
INDICATOR RANK/133
1st pillar: Policy rules and regulations1.01 Prevalence of foreign ownership .................................57 ...■1.02 Property rights..............................................................81 ...■1.03 Business impact of rules on FDI ..................................79 ...■1.04 Visa requirements* ......................................................87 ...■1.05 Openness of bilateral Air Service Agreements* ........115 ...■1.06 Transparency of government policymaking..................68 ...■1.07 Time required to start a business*...............................83 ...■1.08 Cost to start a business* ...........................................101 ...■
2nd pillar: Environmental sustainability2.01 Stringency of environmental regulation .......................56 ...■2.02 Enforcement of environmental regulation....................58 ...■2.03 Sustainability of T&T industry development...................9 ...■2.04 Carbon dioxide emissions* ..........................................19 ...■2.05 Particulate matter concentration* ................................70 ...■2.06 Threatened species* ....................................................55 ...■2.07 Environmental treaty ratification*.................................10 ...■
3rd pillar: Safety and security3.01 Business costs of terrorism .......................................128 ...■3.02 Reliability of police services .........................................88 ...■3.03 Business costs of crime and violence........................125 ...■3.04 Road traffic accidents*...............................................105 ...■
4th pillar: Health and hygiene4.01 Physician density*......................................................115 ...■4.02 Access to improved sanitation* .................................106 ...■4.03 Access to improved drinking water*..........................121 ...■4.04 Hospital beds*..............................................................93 ...■
5th pillar: Prioritization of Travel & Tourism5.01 Government prioritization of the T&T industry.............17 ...■5.02 T&T government expenditure* ....................................19 ...■5.03 Effectiveness of marketing and branding.......................9 ...■5.04 T&T fair attendance*....................................................25 ...■
6th pillar: Air transport infrastructure6.01 Quality of air transport infrastructure ...........................68 ...■6.02 Available seat kilometers, domestic*...........................48 ...■6.03 Available seat kilometers, international* ......................53 ...■6.04 Departures per 1,000 population*................................96 ...■6.05 Airport density* ..........................................................106 ...■6.06 Number of operating airlines*......................................54 ...■6.07 International air transport network ...............................59 ...■
7th pillar: Ground transport infrastructure7.01 Quality of roads ............................................................95 ...■7.02 Quality of railroad infrastructure...................................68 ...■7.03 Quality of port infrastructure ........................................83 ...■7.04 Quality of ground transport network ............................82 ...■7.05 Road density*.............................................................100 ...■
INDICATOR RANK/133
8th pillar: Tourism infrastructure8.01 Hotel rooms*..............................................................109 ...■8.02 Presence of major car rental companies*....................73 ...■8.03 ATMs accepting Visa cards* ........................................98 ...■
9th pillar: ICT infrastructure9.01 Extent of business Internet use...................................88 ...■9.02 Internet users* .............................................................98 ...■9.03 Telephone lines*.........................................................124 ...■9.04 Broadband Internet subscribers* ...............................108 ...■9.05 Mobile telephone subscribers*..................................108 ...■
10th pillar: Price competitiveness in the T&T industry10.01 Ticket taxes and airport charges*...............................111 ...■10.02 Purchasing power parity*.............................................48 ...■10.03 Extent and effect of taxation......................................110 ...■10.04 Fuel price levels* .........................................................77 ...■10.05 Hotel price index* ........................................................16 ...■
11th pillar: Human resources11.01 Primary education enrollment* ..................................116 ...■11.02 Secondary education enrollment*..............................107 ...■11.03 Quality of the educational system................................33 ...■11.04 Local availability of research and training services.......36 ...■11.05 Extent of staff training..................................................47 ...■11.06 Hiring and firing practices.............................................21 ...■11.07 Ease of hiring foreign labor ..........................................85 ...■11.08 HIV prevalence* .........................................................124 ...■11.09 Business impact of HIV/AIDS.....................................119 ...■11.10 Life expectancy* ........................................................117 ...■
12th pillar: Affinity for Travel & Tourism12.01 Tourism openness* ......................................................82 ...■12.02 Attitude of population toward foreign visitors..............22 ...■12.03 Extension of business trips recommended .................26 ...■
13th pillar: Natural resources13.01 Number of World Heritage natural sites* ....................23 ...■13.02 Protected areas* ..........................................................57 ...■13.03 Quality of the natural environment...............................90 ...■13.04 Total known species*...................................................14 ...■
14th pillar: Cultural resources14.01 Number of World Heritage cultural sites* ...................82 ...■14.02 Sports stadiums* .......................................................113 ...■14.03 Number of international fairs and exhibitions* ............73 ...■14.04 Creative industries exports*.........................................76 ...■
Kenya
* Hard data
Note: For further details and explanation, please refer to the section “How toRead the Country/Economy Profiles” at the beginning of this chapter.
part2A_profiles.r2 2/26/09 4:01 AM Page 239
The Travel & Tourism Competitiveness Report 2009 © 2009 World Economic Forum

240
2.1:
Cou
ntry
/Eco
nom
y Pr
ofile
s
Korea, Rep.Key indicatorsPopulation (millions), 2007............................................................................48.1Surface area (1,000 square kilometers) ........................................................99.3
Gross domestic product (US$ billions), 2007 .............................................969.9Gross domestic product (PPP, US$) per capita, 2007 ...........................24,803.1Real GDP growth (percent), 2007...................................................................5.0
Environmental Performance Index, 2008 (out of 149 countries).....................51
Travel & Tourism indicators
T&T industry, 2008 estimatesGDP (US$ millions) ...........................................................14,872...................1.4 ....................4.0Employment (1,000 jobs).......................................................471...................2.0 ....................0.6
T&T economy, 2008 estimatesGDP (US$ millions) ...........................................................69,258...................6.6 ....................5.4Employment (1,000 jobs)....................................................1,707...................7.2 ....................1.7
Source: World Travel & Tourism Council, TSA Research 2008
International tourist arrivals (thousands), 2007...................6,448International tourism receipts (US$ millions), 2007 ...........5,797
Source: United Nations World Tourism Organization
Travel & Tourism Competitiveness Index
2009 Index......................................................................................................31 4.72008 Index............................................................................................................31 4.7T&T regulatory framework ..............................................................................41 5.1
Policy rules and regulations..........................................................................34 5.0Environmental sustainability..........................................................................55 4.7Safety and security .........................................................................................71 5.1Health and hygiene .........................................................................................37 5.8Prioritization of Travel & Tourism..................................................................52 4.7
T&T business environment and infrastructure ............................................35 4.5Air transport infrastructure ..........................................................................39 4.0Ground transport infrastructure....................................................................15 5.5Tourism infrastructure ....................................................................................71 3.2ICT infrastructure ..............................................................................................8 5.5Price competitiveness in the T&T industry...............................................102 4.1
T&T human, cultural, and natural resources ...............................................26 4.6Human resources ............................................................................................19 5.7
Education and training .............................................................................21 5.7Availability of qualified labor...................................................................29 5.7
Affinity for Travel & Tourism ........................................................................114 4.3Natural resources ...........................................................................................91 2.8Cultural resources...........................................................................................13 5.8
Note: For descriptions of variables and detailed sources, please refer to “How to the Read Country/Economy Profiles.”
Rank Score(out of 133) (1–7 scale)
International tourist arrivals (thousands)
International tourism receipts (US$ millions)
1995 1996 1997 1998 1999 2000 2001 2002 2003 2004 2005 2006 20073,000
4,000
5,000
6,000
7,000
8,000
1 2 3 4 5 6 7
2009–2018Percent annual growth of total (%, forecast)
part2A_profiles.r2 2/26/09 4:01 AM Page 240
The Travel & Tourism Competitiveness Report 2009 © 2009 World Economic Forum
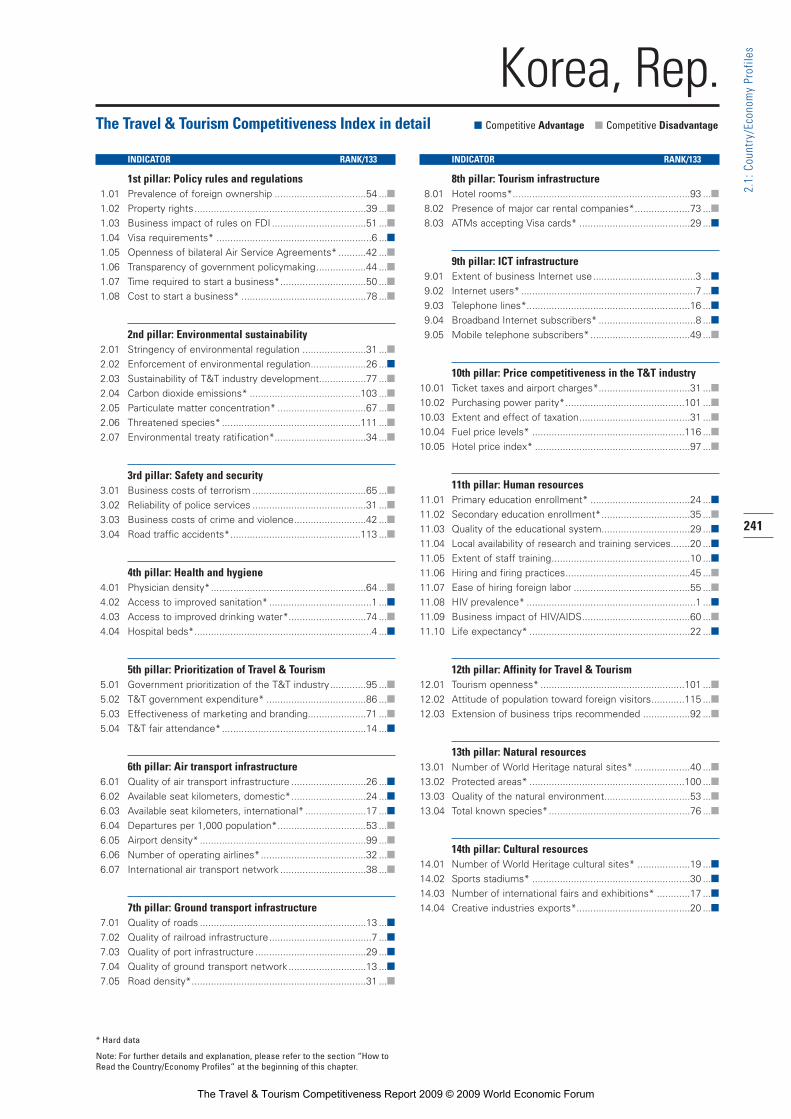
241
2.1:
Cou
ntry
/Eco
nom
y Pr
ofile
s
The Travel & Tourism Competitiveness Index in detail ■ Competitive Advantage ■ Competitive Disadvantage
INDICATOR RANK/133
1st pillar: Policy rules and regulations1.01 Prevalence of foreign ownership .................................54 ...■1.02 Property rights..............................................................39 ...■1.03 Business impact of rules on FDI ..................................51 ...■1.04 Visa requirements* ........................................................6 ...■1.05 Openness of bilateral Air Service Agreements* ..........42 ...■1.06 Transparency of government policymaking..................44 ...■1.07 Time required to start a business*...............................50 ...■1.08 Cost to start a business* .............................................78 ...■
2nd pillar: Environmental sustainability2.01 Stringency of environmental regulation .......................31 ...■2.02 Enforcement of environmental regulation....................26 ...■2.03 Sustainability of T&T industry development.................77 ...■2.04 Carbon dioxide emissions* ........................................103 ...■2.05 Particulate matter concentration* ................................67 ...■2.06 Threatened species* ..................................................111 ...■2.07 Environmental treaty ratification*.................................34 ...■
3rd pillar: Safety and security3.01 Business costs of terrorism .........................................65 ...■3.02 Reliability of police services .........................................31 ...■3.03 Business costs of crime and violence..........................42 ...■3.04 Road traffic accidents*...............................................113 ...■
4th pillar: Health and hygiene4.01 Physician density*........................................................64 ...■4.02 Access to improved sanitation* .....................................1 ...■4.03 Access to improved drinking water*............................74 ...■4.04 Hospital beds*................................................................4 ...■
5th pillar: Prioritization of Travel & Tourism5.01 Government prioritization of the T&T industry.............95 ...■5.02 T&T government expenditure* ....................................86 ...■5.03 Effectiveness of marketing and branding.....................71 ...■5.04 T&T fair attendance*....................................................14 ...■
6th pillar: Air transport infrastructure6.01 Quality of air transport infrastructure ...........................26 ...■6.02 Available seat kilometers, domestic*...........................24 ...■6.03 Available seat kilometers, international* ......................17 ...■6.04 Departures per 1,000 population*................................53 ...■6.05 Airport density* ............................................................99 ...■6.06 Number of operating airlines*......................................32 ...■6.07 International air transport network ...............................38 ...■
7th pillar: Ground transport infrastructure7.01 Quality of roads ............................................................13 ...■7.02 Quality of railroad infrastructure.....................................7 ...■7.03 Quality of port infrastructure ........................................29 ...■7.04 Quality of ground transport network ............................13 ...■7.05 Road density*...............................................................31 ...■
INDICATOR RANK/133
8th pillar: Tourism infrastructure8.01 Hotel rooms*................................................................93 ...■8.02 Presence of major car rental companies*....................73 ...■8.03 ATMs accepting Visa cards* ........................................29 ...■
9th pillar: ICT infrastructure9.01 Extent of business Internet use.....................................3 ...■9.02 Internet users* ...............................................................7 ...■9.03 Telephone lines*...........................................................16 ...■9.04 Broadband Internet subscribers* ...................................8 ...■9.05 Mobile telephone subscribers*....................................49 ...■
10th pillar: Price competitiveness in the T&T industry10.01 Ticket taxes and airport charges*.................................31 ...■10.02 Purchasing power parity*...........................................101 ...■10.03 Extent and effect of taxation........................................31 ...■10.04 Fuel price levels* .......................................................116 ...■10.05 Hotel price index* ........................................................97 ...■
11th pillar: Human resources11.01 Primary education enrollment* ....................................24 ...■11.02 Secondary education enrollment*................................35 ...■11.03 Quality of the educational system................................29 ...■11.04 Local availability of research and training services.......20 ...■11.05 Extent of staff training..................................................10 ...■11.06 Hiring and firing practices.............................................45 ...■11.07 Ease of hiring foreign labor ..........................................55 ...■11.08 HIV prevalence* .............................................................1 ...■11.09 Business impact of HIV/AIDS.......................................60 ...■11.10 Life expectancy* ..........................................................22 ...■
12th pillar: Affinity for Travel & Tourism12.01 Tourism openness* ....................................................101 ...■12.02 Attitude of population toward foreign visitors............115 ...■12.03 Extension of business trips recommended .................92 ...■
13th pillar: Natural resources13.01 Number of World Heritage natural sites* ....................40 ...■13.02 Protected areas* ........................................................100 ...■13.03 Quality of the natural environment...............................53 ...■13.04 Total known species*...................................................76 ...■
14th pillar: Cultural resources14.01 Number of World Heritage cultural sites* ...................19 ...■14.02 Sports stadiums* .........................................................30 ...■14.03 Number of international fairs and exhibitions* ............17 ...■14.04 Creative industries exports*.........................................20 ...■
Korea, Rep.
* Hard data
Note: For further details and explanation, please refer to the section “How toRead the Country/Economy Profiles” at the beginning of this chapter.
part2A_profiles.r2 2/26/09 4:01 AM Page 241
The Travel & Tourism Competitiveness Report 2009 © 2009 World Economic Forum

242
2.1:
Cou
ntry
/Eco
nom
y Pr
ofile
s
KuwaitKey indicatorsPopulation (millions), 2007..............................................................................2.8Surface area (1,000 square kilometers) ........................................................17.8
Gross domestic product (US$ billions), 2007 .............................................111.5Gross domestic product (PPP, US$) per capita, 2007 ...........................39,343.8Real GDP growth (percent), 2007...................................................................4.6
Environmental Performance Index, 2008 (out of 149 countries)...................111
Travel & Tourism indicators
T&T industry, 2008 estimatesGDP (US$ millions) ................................................................638...................0.5 ....................5.6Employment (1,000 jobs).........................................................13...................0.7 ....................4.5
T&T economy, 2008 estimatesGDP (US$ millions) .............................................................6,811...................5.0 ....................4.9Employment (1,000 jobs).........................................................91...................4.6 ....................3.8
Source: World Travel & Tourism Council, TSA Research 2008
International tourist arrivals (thousands), 2007......................292International tourism receipts (US$ millions), 2007 ..............222
Source: United Nations World Tourism Organization
Travel & Tourism Competitiveness Index
2009 Index......................................................................................................95 3.62008 Index............................................................................................................85 3.7T&T regulatory framework ............................................................................109 3.9
Policy rules and regulations........................................................................101 3.8Environmental sustainability........................................................................133 2.8Safety and security .........................................................................................28 5.9Health and hygiene .........................................................................................76 4.4Prioritization of Travel & Tourism................................................................131 2.4
T&T business environment and infrastructure ............................................50 3.8Air transport infrastructure ..........................................................................64 3.1Ground transport infrastructure....................................................................52 4.0Tourism infrastructure ....................................................................................50 3.9ICT infrastructure ............................................................................................58 3.1Price competitiveness in the T&T industry.................................................24 5.3
T&T human, cultural, and natural resources .............................................128 3.2Human resources ............................................................................................61 5.1
Education and training .............................................................................78 4.5Availability of qualified labor...................................................................22 5.7
Affinity for Travel & Tourism ........................................................................128 4.0Natural resources .........................................................................................131 2.0Cultural resources.........................................................................................100 1.6
Note: For descriptions of variables and detailed sources, please refer to “How to the Read Country/Economy Profiles.”
Rank Score(out of 133) (1–7 scale)
International tourist arrivals (thousands)
International tourism receipts (US$ millions)
1995 1996 1997 1998 1999 2000 2001 2002 2003 2004 2005 2006 200750
100
150
200
250
300
1 2 3 4 5 6 7
2009–2018Percent annual growth of total (%, forecast)
part2A_profiles.r2 2/26/09 4:01 AM Page 242
The Travel & Tourism Competitiveness Report 2009 © 2009 World Economic Forum

243
2.1:
Cou
ntry
/Eco
nom
y Pr
ofile
s
The Travel & Tourism Competitiveness Index in detail ■ Competitive Advantage ■ Competitive Disadvantage
INDICATOR RANK/133
1st pillar: Policy rules and regulations1.01 Prevalence of foreign ownership ...............................131 ...■1.02 Property rights..............................................................27 ...■1.03 Business impact of rules on FDI ................................129 ...■1.04 Visa requirements* ....................................................103 ...■1.05 Openness of bilateral Air Service Agreements* ........126 ...■1.06 Transparency of government policymaking..................91 ...■1.07 Time required to start a business*...............................93 ...■1.08 Cost to start a business* .............................................16 ...■
2nd pillar: Environmental sustainability2.01 Stringency of environmental regulation .....................105 ...■2.02 Enforcement of environmental regulation..................107 ...■2.03 Sustainability of T&T industry development...............131 ...■2.04 Carbon dioxide emissions* ........................................128 ...■2.05 Particulate matter concentration* ..............................119 ...■2.06 Threatened species* ....................................................72 ...■2.07 Environmental treaty ratification*.................................94 ...■
3rd pillar: Safety and security3.01 Business costs of terrorism .........................................61 ...■3.02 Reliability of police services .........................................41 ...■3.03 Business costs of crime and violence..........................18 ...■3.04 Road traffic accidents*.................................................28 ...■
4th pillar: Health and hygiene4.01 Physician density*........................................................61 ...■4.02 Access to improved sanitation* .....................................1 ...■4.03 Access to improved drinking water*...........................n/a ......4.04 Hospital beds*..............................................................83 ...■
5th pillar: Prioritization of Travel & Tourism5.01 Government prioritization of the T&T industry...........133 ...■5.02 T&T government expenditure* ..................................115 ...■5.03 Effectiveness of marketing and branding...................132 ...■5.04 T&T fair attendance*....................................................98 ...■
6th pillar: Air transport infrastructure6.01 Quality of air transport infrastructure ...........................62 ...■6.02 Available seat kilometers, domestic*.........................100 ...■6.03 Available seat kilometers, international* ......................52 ...■6.04 Departures per 1,000 population*................................40 ...■6.05 Airport density* ............................................................95 ...■6.06 Number of operating airlines*......................................48 ...■6.07 International air transport network ...............................65 ...■
7th pillar: Ground transport infrastructure7.01 Quality of roads ............................................................35 ...■7.02 Quality of railroad infrastructure ..................................n/a ......7.03 Quality of port infrastructure ........................................65 ...■7.04 Quality of ground transport network ............................53 ...■7.05 Road density*...............................................................62 ...■
INDICATOR RANK/133
8th pillar: Tourism infrastructure8.01 Hotel rooms*................................................................76 ...■8.02 Presence of major car rental companies*......................1 ...■8.03 ATMs accepting Visa cards* ........................................60 ...■
9th pillar: ICT infrastructure9.01 Extent of business Internet use...................................63 ...■9.02 Internet users* .............................................................50 ...■9.03 Telephone lines*...........................................................67 ...■9.04 Broadband Internet subscribers* .................................83 ...■9.05 Mobile telephone subscribers*....................................43 ...■
10th pillar: Price competitiveness in the T&T industry10.01 Ticket taxes and airport charges*...................................4 ...■10.02 Purchasing power parity*...........................................103 ...■10.03 Extent and effect of taxation..........................................6 ...■10.04 Fuel price levels* ...........................................................9 ...■10.05 Hotel price index* ......................................................105 ...■
11th pillar: Human resources11.01 Primary education enrollment* ..................................108 ...■11.02 Secondary education enrollment*................................60 ...■11.03 Quality of the educational system................................94 ...■11.04 Local availability of research and training services.......64 ...■11.05 Extent of staff training..................................................57 ...■11.06 Hiring and firing practices.............................................50 ...■11.07 Ease of hiring foreign labor ............................................9 ...■11.08 HIV prevalence* .............................................................1 ...■11.09 Business impact of HIV/AIDS.......................................14 ...■11.10 Life expectancy* ..........................................................29 ...■
12th pillar: Affinity for Travel & Tourism12.01 Tourism openness* ......................................................55 ...■12.02 Attitude of population toward foreign visitors............130 ...■12.03 Extension of business trips recommended ...............132 ...■
13th pillar: Natural resources13.01 Number of World Heritage natural sites* ....................74 ...■13.02 Protected areas* ........................................................122 ...■13.03 Quality of the natural environment...............................93 ...■13.04 Total known species*.................................................122 ...■
14th pillar: Cultural resources14.01 Number of World Heritage cultural sites* .................116 ...■14.02 Sports stadiums* .........................................................43 ...■14.03 Number of international fairs and exhibitions* ..........101 ...■14.04 Creative industries exports*.......................................118 ...■
Kuwait
* Hard data
Note: For further details and explanation, please refer to the section “How toRead the Country/Economy Profiles” at the beginning of this chapter.
part2A_profiles.r2 2/26/09 4:01 AM Page 243
The Travel & Tourism Competitiveness Report 2009 © 2009 World Economic Forum

244
2.1:
Cou
ntry
/Eco
nom
y Pr
ofile
s
Kyrgyz RepublicKey indicatorsPopulation (millions), 2007..............................................................................5.4Surface area (1,000 square kilometers) ......................................................199.9
Gross domestic product (US$ billions), 2007 .................................................3.7Gross domestic product (PPP, US$) per capita, 2007 .............................2,000.3Real GDP growth (percent), 2007...................................................................8.2
Environmental Performance Index, 2008 (out of 149 countries).....................94
Travel & Tourism indicators
T&T industry, 2008 estimatesGDP (US$ millions) .................................................................n/a ...................n/a ....................n/aEmployment (1,000 jobs)........................................................n/a ...................n/a ....................n/a
T&T economy, 2008 estimatesGDP (US$ millions) .................................................................n/a ...................n/a ....................n/aEmployment (1,000 jobs)........................................................n/a ...................n/a ....................n/a
Source: World Travel & Tourism Council, TSA Research 2008
International tourist arrivals (thousands), 2006......................766International tourism receipts (US$ millions), 2007 ..............346
Source: United Nations World Tourism Organization
Travel & Tourism Competitiveness Index
2009 Index....................................................................................................106 3.52008 Index..........................................................................................................113 3.3T&T regulatory framework ..............................................................................76 4.4
Policy rules and regulations........................................................................102 3.8Environmental sustainability..........................................................................89 4.2Safety and security .........................................................................................90 4.7Health and hygiene .........................................................................................50 5.4Prioritization of Travel & Tourism..................................................................97 3.8
T&T business environment and infrastructure ..........................................124 2.5Air transport infrastructure ........................................................................127 2.0Ground transport infrastructure..................................................................112 2.5Tourism infrastructure ..................................................................................129 1.1ICT infrastructure ............................................................................................98 2.1Price competitiveness in the T&T industry.................................................65 4.7
T&T human, cultural, and natural resources .............................................105 3.5Human resources ............................................................................................94 4.8
Education and training .............................................................................97 4.2Availability of qualified labor...................................................................89 5.3
Affinity for Travel & Tourism ..........................................................................28 5.4Natural resources .........................................................................................107 2.5Cultural resources.........................................................................................121 1.3
Note: For descriptions of variables and detailed sources, please refer to “How to the Read Country/Economy Profiles.”
Rank Score(out of 133) (1–7 scale)
International tourist arrivals (thousands)
International tourism receipts (US$ millions)
1995 1996 1997 1998 1999 2000 2001 2002 2003 2004 2005 2006 20070
100200300400500600700800
1 2 3 4 5 6 7
2009–2018Percent annual growth of total (%, forecast)
part2A_profiles.r2 2/26/09 4:01 AM Page 244
The Travel & Tourism Competitiveness Report 2009 © 2009 World Economic Forum

245
2.1:
Cou
ntry
/Eco
nom
y Pr
ofile
s
The Travel & Tourism Competitiveness Index in detail ■ Competitive Advantage ■ Competitive Disadvantage
INDICATOR RANK/133
1st pillar: Policy rules and regulations1.01 Prevalence of foreign ownership ...............................116 ...■1.02 Property rights............................................................124 ...■1.03 Business impact of rules on FDI ................................123 ...■1.04 Visa requirements* ......................................................95 ...■1.05 Openness of bilateral Air Service Agreements* ........119 ...■1.06 Transparency of government policymaking................125 ...■1.07 Time required to start a business*...............................41 ...■1.08 Cost to start a business* .............................................50 ...■
2nd pillar: Environmental sustainability2.01 Stringency of environmental regulation .....................123 ...■2.02 Enforcement of environmental regulation..................113 ...■2.03 Sustainability of T&T industry development...............113 ...■2.04 Carbon dioxide emissions* ..........................................36 ...■2.05 Particulate matter concentration* ................................36 ...■2.06 Threatened species* ....................................................65 ...■2.07 Environmental treaty ratification*...............................121 ...■
3rd pillar: Safety and security3.01 Business costs of terrorism .......................................110 ...■3.02 Reliability of police services .......................................113 ...■3.03 Business costs of crime and violence..........................97 ...■3.04 Road traffic accidents*.................................................44 ...■
4th pillar: Health and hygiene4.01 Physician density*........................................................45 ...■4.02 Access to improved sanitation* ...................................52 ...■4.03 Access to improved drinking water*............................81 ...■4.04 Hospital beds*..............................................................34 ...■
5th pillar: Prioritization of Travel & Tourism5.01 Government prioritization of the T&T industry.............78 ...■5.02 T&T government expenditure* ...................................n/a ......5.03 Effectiveness of marketing and branding.....................96 ...■5.04 T&T fair attendance*..................................................115 ...■
6th pillar: Air transport infrastructure6.01 Quality of air transport infrastructure .........................120 ...■6.02 Available seat kilometers, domestic*...........................82 ...■6.03 Available seat kilometers, international* ....................112 ...■6.04 Departures per 1,000 population*................................94 ...■6.05 Airport density* ............................................................94 ...■6.06 Number of operating airlines*....................................103 ...■6.07 International air transport network .............................124 ...■
7th pillar: Ground transport infrastructure7.01 Quality of roads ..........................................................101 ...■7.02 Quality of railroad infrastructure...................................60 ...■7.03 Quality of port infrastructure ......................................131 ...■7.04 Quality of ground transport network ............................75 ...■7.05 Road density*.............................................................105 ...■
INDICATOR RANK/133
8th pillar: Tourism infrastructure8.01 Hotel rooms*..............................................................117 ...■8.02 Presence of major car rental companies*..................122 ...■8.03 ATMs accepting Visa cards* ......................................113 ...■
9th pillar: ICT infrastructure9.01 Extent of business Internet use.................................101 ...■9.02 Internet users* .............................................................82 ...■9.03 Telephone lines*...........................................................95 ...■9.04 Broadband Internet subscribers* ...............................106 ...■9.05 Mobile telephone subscribers*....................................95 ...■
10th pillar: Price competitiveness in the T&T industry10.01 Ticket taxes and airport charges*.................................76 ...■10.02 Purchasing power parity*.............................................10 ...■10.03 Extent and effect of taxation......................................106 ...■10.04 Fuel price levels* .........................................................25 ...■10.05 Hotel price index* ........................................................98 ...■
11th pillar: Human resources11.01 Primary education enrollment* ..................................104 ...■11.02 Secondary education enrollment*................................69 ...■11.03 Quality of the educational system................................74 ...■11.04 Local availability of research and training services.....128 ...■11.05 Extent of staff training................................................102 ...■11.06 Hiring and firing practices.............................................14 ...■11.07 Ease of hiring foreign labor ........................................113 ...■11.08 HIV prevalence* ...........................................................22 ...■11.09 Business impact of HIV/AIDS.....................................101 ...■11.10 Life expectancy* ..........................................................96 ...■
12th pillar: Affinity for Travel & Tourism12.01 Tourism openness* ......................................................19 ...■12.02 Attitude of population toward foreign visitors............117 ...■12.03 Extension of business trips recommended .................27 ...■
13th pillar: Natural resources13.01 Number of World Heritage natural sites* ....................74 ...■13.02 Protected areas* ........................................................105 ...■13.03 Quality of the natural environment...............................31 ...■13.04 Total known species*...................................................91 ...■
14th pillar: Cultural resources14.01 Number of World Heritage cultural sites* ...................97 ...■14.02 Sports stadiums* .......................................................105 ...■14.03 Number of international fairs and exhibitions*............n/a ......14.04 Creative industries exports*.......................................100 ...■
Kyrgyz Republic
* Hard data
Note: For further details and explanation, please refer to the section “How toRead the Country/Economy Profiles” at the beginning of this chapter.
part2A_profiles.r2 2/26/09 4:01 AM Page 245
The Travel & Tourism Competitiveness Report 2009 © 2009 World Economic Forum

246
2.1:
Cou
ntry
/Eco
nom
y Pr
ofile
s
LatviaKey indicatorsPopulation (millions), 2007..............................................................................2.3Surface area (1,000 square kilometers) ........................................................64.6
Gross domestic product (US$ billions), 2007 ...............................................27.2Gross domestic product (PPP, US$) per capita, 2007 ...........................17,488.4Real GDP growth (percent), 2007.................................................................10.3
Environmental Performance Index, 2008 (out of 149 countries).......................8
Travel & Tourism indicators
T&T industry, 2008 estimatesGDP (US$ millions) ................................................................496...................1.5 ....................4.3Employment (1,000 jobs).........................................................14...................1.3 ..................–1.1
T&T economy, 2008 estimatesGDP (US$ millions) .............................................................2,433...................7.5 ....................4.4Employment (1,000 jobs).........................................................66...................6.4 ..................–1.1
Source: World Travel & Tourism Council, TSA Research 2008
International tourist arrivals (thousands), 2007...................1,653International tourism receipts (US$ millions), 2007 ..............671
Source: United Nations World Tourism Organization
Travel & Tourism Competitiveness Index
2009 Index......................................................................................................48 4.32008 Index............................................................................................................45 4.3T&T regulatory framework ..............................................................................32 5.2
Policy rules and regulations..........................................................................51 4.7Environmental sustainability..........................................................................14 5.3Safety and security .........................................................................................35 5.8Health and hygiene .........................................................................................26 6.2Prioritization of Travel & Tourism..................................................................88 4.0
T&T business environment and infrastructure ............................................43 4.0Air transport infrastructure ..........................................................................53 3.4Ground transport infrastructure....................................................................44 4.1Tourism infrastructure ....................................................................................36 4.4ICT infrastructure ............................................................................................43 3.8Price competitiveness in the T&T industry.................................................76 4.6
T&T human, cultural, and natural resources ...............................................86 3.7Human resources ............................................................................................79 5.0
Education and training .............................................................................57 4.8Availability of qualified labor.................................................................103 5.1
Affinity for Travel & Tourism ..........................................................................73 4.7Natural resources ...........................................................................................75 3.0Cultural resources...........................................................................................73 2.1
Note: For descriptions of variables and detailed sources, please refer to “How to the Read Country/Economy Profiles.”
Rank Score(out of 133) (1–7 scale)
International tourist arrivals (thousands)
International tourism receipts (US$ millions)
1995 1996 1997 1998 1999 2000 2001 2002 2003 2004 2005 2006 20070
500
1,000
1,500
2,000
1 2 3 4 5 6 7
2009–2018Percent annual growth of total (%, forecast)
part2A_profiles.r2 2/26/09 4:01 AM Page 246
The Travel & Tourism Competitiveness Report 2009 © 2009 World Economic Forum

247
2.1:
Cou
ntry
/Eco
nom
y Pr
ofile
s
The Travel & Tourism Competitiveness Index in detail ■ Competitive Advantage ■ Competitive Disadvantage
INDICATOR RANK/133
1st pillar: Policy rules and regulations1.01 Prevalence of foreign ownership .................................33 ...■1.02 Property rights..............................................................45 ...■1.03 Business impact of rules on FDI ..................................69 ...■1.04 Visa requirements* ......................................................40 ...■1.05 Openness of bilateral Air Service Agreements* ........113 ...■1.06 Transparency of government policymaking..................98 ...■1.07 Time required to start a business*...............................45 ...■1.08 Cost to start a business* .............................................22 ...■
2nd pillar: Environmental sustainability2.01 Stringency of environmental regulation .......................43 ...■2.02 Enforcement of environmental regulation....................38 ...■2.03 Sustainability of T&T industry development...............101 ...■2.04 Carbon dioxide emissions* ..........................................59 ...■2.05 Particulate matter concentration* ..................................9 ...■2.06 Threatened species* ......................................................8 ...■2.07 Environmental treaty ratification*.................................34 ...■
3rd pillar: Safety and security3.01 Business costs of terrorism .........................................24 ...■3.02 Reliability of police services .........................................64 ...■3.03 Business costs of crime and violence..........................29 ...■3.04 Road traffic accidents*.................................................43 ...■
4th pillar: Health and hygiene4.01 Physician density*........................................................28 ...■4.02 Access to improved sanitation* ...................................80 ...■4.03 Access to improved drinking water*............................38 ...■4.04 Hospital beds*..............................................................11 ...■
5th pillar: Prioritization of Travel & Tourism5.01 Government prioritization of the T&T industry...........108 ...■5.02 T&T government expenditure* ....................................73 ...■5.03 Effectiveness of marketing and branding.....................97 ...■5.04 T&T fair attendance*....................................................41 ...■
6th pillar: Air transport infrastructure6.01 Quality of air transport infrastructure ...........................36 ...■6.02 Available seat kilometers, domestic*...........................86 ...■6.03 Available seat kilometers, international* ......................82 ...■6.04 Departures per 1,000 population*................................30 ...■6.05 Airport density* ............................................................54 ...■6.06 Number of operating airlines*......................................84 ...■6.07 International air transport network ...............................37 ...■
7th pillar: Ground transport infrastructure7.01 Quality of roads ............................................................90 ...■7.02 Quality of railroad infrastructure...................................35 ...■7.03 Quality of port infrastructure ........................................52 ...■7.04 Quality of ground transport network ............................56 ...■7.05 Road density*...............................................................30 ...■
INDICATOR RANK/133
8th pillar: Tourism infrastructure8.01 Hotel rooms*................................................................56 ...■8.02 Presence of major car rental companies*....................23 ...■8.03 ATMs accepting Visa cards* ........................................27 ...■
9th pillar: ICT infrastructure9.01 Extent of business Internet use...................................45 ...■9.02 Internet users* .............................................................27 ...■9.03 Telephone lines*...........................................................46 ...■9.04 Broadband Internet subscribers* .................................45 ...■9.05 Mobile telephone subscribers*....................................42 ...■
10th pillar: Price competitiveness in the T&T industry10.01 Ticket taxes and airport charges*.................................47 ...■10.02 Purchasing power parity*.............................................85 ...■10.03 Extent and effect of taxation........................................69 ...■10.04 Fuel price levels* .........................................................95 ...■10.05 Hotel price index* ........................................................45 ...■
11th pillar: Human resources11.01 Primary education enrollment* ....................................86 ...■11.02 Secondary education enrollment*................................32 ...■11.03 Quality of the educational system................................63 ...■11.04 Local availability of research and training services.......75 ...■11.05 Extent of staff training..................................................62 ...■11.06 Hiring and firing practices.............................................83 ...■11.07 Ease of hiring foreign labor ........................................126 ...■11.08 HIV prevalence* ...........................................................94 ...■11.09 Business impact of HIV/AIDS.......................................52 ...■11.10 Life expectancy* ..........................................................76 ...■
12th pillar: Affinity for Travel & Tourism12.01 Tourism openness* ......................................................53 ...■12.02 Attitude of population toward foreign visitors............116 ...■12.03 Extension of business trips recommended .................75 ...■
13th pillar: Natural resources13.01 Number of World Heritage natural sites* ....................74 ...■13.02 Protected areas* ..........................................................50 ...■13.03 Quality of the natural environment...............................26 ...■13.04 Total known species*.................................................111 ...■
14th pillar: Cultural resources14.01 Number of World Heritage cultural sites* ...................65 ...■14.02 Sports stadiums* .........................................................61 ...■14.03 Number of international fairs and exhibitions* ............44 ...■14.04 Creative industries exports*.........................................70 ...■
Latvia
* Hard data
Note: For further details and explanation, please refer to the section “How toRead the Country/Economy Profiles” at the beginning of this chapter.
part2A_profiles.r2 2/26/09 4:01 AM Page 247
The Travel & Tourism Competitiveness Report 2009 © 2009 World Economic Forum

248
2.1:
Cou
ntry
/Eco
nom
y Pr
ofile
s
LesothoKey indicatorsPopulation (millions), 2007..............................................................................1.8Surface area (1,000 square kilometers) ........................................................30.4
Gross domestic product (US$ billions), 2007 .................................................1.6Gross domestic product (PPP, US$) per capita, 2007 .............................1,285.6Real GDP growth (percent), 2007...................................................................4.9
Environmental Performance Index, 2008 (out of 149 countries) ....................n/a
Travel & Tourism indicators
T&T industry, 2008 estimatesGDP (US$ millions) ..................................................................31...................2.1 ....................3.6Employment (1,000 jobs)...........................................................6...................1.7 ....................1.2
T&T economy, 2008 estimatesGDP (US$ millions) ................................................................102...................6.9 ....................3.8Employment (1,000 jobs).........................................................21...................5.6 ....................1.3
Source: World Travel & Tourism Council, TSA Research 2008
International tourist arrivals (thousands), 2007......................300International tourism receipts (US$ millions), 2007 ................37
Source: United Nations World Tourism Organization
Travel & Tourism Competitiveness Index
2009 Index....................................................................................................132 2.92008 Index..........................................................................................................129 2.8T&T regulatory framework ............................................................................121 3.6
Policy rules and regulations........................................................................112 3.6Environmental sustainability..........................................................................90 4.2Safety and security .........................................................................................95 4.6Health and hygiene .......................................................................................113 2.3Prioritization of Travel & Tourism................................................................114 3.4
T&T business environment and infrastructure ..........................................128 2.4Air transport infrastructure ........................................................................132 1.6Ground transport infrastructure..................................................................121 2.3Tourism infrastructure ..................................................................................113 1.6ICT infrastructure ..........................................................................................117 1.7Price competitiveness in the T&T industry.................................................44 5.0
T&T human, cultural, and natural resources .............................................133 2.7Human resources ..........................................................................................133 3.3
Education and training ...........................................................................118 3.4Availability of qualified labor.................................................................132 3.2
Affinity for Travel & Tourism ........................................................................119 4.2Natural resources .........................................................................................132 1.9Cultural resources.........................................................................................128 1.2
Note: For descriptions of variables and detailed sources, please refer to “How to the Read Country/Economy Profiles.”
Rank Score(out of 133) (1–7 scale)
International tourist arrivals (thousands)
International tourism receipts (US$ millions)
1995 1996 1997 1998 1999 2000 2001 2002 2003 2004 2005 2006 20070
100
200
300
400
1 2 3 4 5 6 7
2009–2018Percent annual growth of total (%, forecast)
part2A_profiles.r2 2/26/09 4:01 AM Page 248
The Travel & Tourism Competitiveness Report 2009 © 2009 World Economic Forum

249
2.1:
Cou
ntry
/Eco
nom
y Pr
ofile
s
The Travel & Tourism Competitiveness Index in detail ■ Competitive Advantage ■ Competitive Disadvantage
INDICATOR RANK/133
1st pillar: Policy rules and regulations1.01 Prevalence of foreign ownership .................................81 ...■1.02 Property rights............................................................120 ...■1.03 Business impact of rules on FDI ................................100 ...■1.04 Visa requirements* ......................................................32 ...■1.05 Openness of bilateral Air Service Agreements* ........128 ...■1.06 Transparency of government policymaking................105 ...■1.07 Time required to start a business*.............................100 ...■1.08 Cost to start a business* .............................................99 ...■
2nd pillar: Environmental sustainability2.01 Stringency of environmental regulation .......................99 ...■2.02 Enforcement of environmental regulation....................98 ...■2.03 Sustainability of T&T industry development.................94 ...■2.04 Carbon dioxide emissions* .........................................n/a ......2.05 Particulate matter concentration* ................................77 ...■2.06 Threatened species* ....................................................18 ...■2.07 Environmental treaty ratification*.................................94 ...■
3rd pillar: Safety and security3.01 Business costs of terrorism .......................................119 ...■3.02 Reliability of police services .......................................100 ...■3.03 Business costs of crime and violence........................114 ...■3.04 Road traffic accidents*.................................................31 ...■
4th pillar: Health and hygiene4.01 Physician density*......................................................124 ...■4.02 Access to improved sanitation* .................................108 ...■4.03 Access to improved drinking water*..........................104 ...■4.04 Hospital beds*..............................................................95 ...■
5th pillar: Prioritization of Travel & Tourism5.01 Government prioritization of the T&T industry.............96 ...■5.02 T&T government expenditure* ..................................114 ...■5.03 Effectiveness of marketing and branding.....................83 ...■5.04 T&T fair attendance*....................................................98 ...■
6th pillar: Air transport infrastructure6.01 Quality of air transport infrastructure .........................132 ...■6.02 Available seat kilometers, domestic*.........................100 ...■6.03 Available seat kilometers, international* ....................132 ...■6.04 Departures per 1,000 population*...............................n/a ......6.05 Airport density* ............................................................83 ...■6.06 Number of operating airlines*....................................133 ...■6.07 International air transport network .............................133 ...■
7th pillar: Ground transport infrastructure7.01 Quality of roads ..........................................................124 ...■7.02 Quality of railroad infrastructure...................................81 ...■7.03 Quality of port infrastructure ......................................122 ...■7.04 Quality of ground transport network..........................113 ...■7.05 Road density*...............................................................80 ...■
INDICATOR RANK/133
8th pillar: Tourism infrastructure8.01 Hotel rooms*................................................................96 ...■8.02 Presence of major car rental companies*....................95 ...■8.03 ATMs accepting Visa cards* ......................................100 ...■
9th pillar: ICT infrastructure9.01 Extent of business Internet use.................................112 ...■9.02 Internet users* ...........................................................114 ...■9.03 Telephone lines*.........................................................110 ...■9.04 Broadband Internet subscribers* ...............................123 ...■9.05 Mobile telephone subscribers*..................................114 ...■
10th pillar: Price competitiveness in the T&T industry10.01 Ticket taxes and airport charges*...................................2 ...■10.02 Purchasing power parity*.............................................52 ...■10.03 Extent and effect of taxation......................................101 ...■10.04 Fuel price levels* .........................................................72 ...■10.05 Hotel price index* .......................................................n/a ......
11th pillar: Human resources11.01 Primary education enrollment* ..................................119 ...■11.02 Secondary education enrollment*..............................115 ...■11.03 Quality of the educational system................................79 ...■11.04 Local availability of research and training services.....109 ...■11.05 Extent of staff training..................................................75 ...■11.06 Hiring and firing practices.............................................64 ...■11.07 Ease of hiring foreign labor ..........................................91 ...■11.08 HIV prevalence* .........................................................132 ...■11.09 Business impact of HIV/AIDS.....................................133 ...■11.10 Life expectancy* ........................................................133 ...■
12th pillar: Affinity for Travel & Tourism12.01 Tourism openness* ......................................................93 ...■12.02 Attitude of population toward foreign visitors............126 ...■12.03 Extension of business trips recommended ...............112 ...■
13th pillar: Natural resources13.01 Number of World Heritage natural sites* ....................74 ...■13.02 Protected areas* ........................................................130 ...■13.03 Quality of the natural environment.............................106 ...■13.04 Total known species*.................................................118 ...■
14th pillar: Cultural resources14.01 Number of World Heritage cultural sites* .................116 ...■14.02 Sports stadiums* .......................................................104 ...■14.03 Number of international fairs and exhibitions*............n/a ......14.04 Creative industries exports*........................................n/a ......
Lesotho
* Hard data
Note: For further details and explanation, please refer to the section “How toRead the Country/Economy Profiles” at the beginning of this chapter.
part2A_profiles.r2 2/26/09 4:01 AM Page 249
The Travel & Tourism Competitiveness Report 2009 © 2009 World Economic Forum

250
2.1:
Cou
ntry
/Eco
nom
y Pr
ofile
s
LibyaKey indicatorsPopulation (millions), 2007..............................................................................6.1Surface area (1,000 square kilometers) ...................................................1,759.5
Gross domestic product (US$ billions), 2007 ...............................................69.9Gross domestic product (PPP, US$) per capita, 2007 ...........................13,593.3Real GDP growth (percent), 2007...................................................................6.8
Environmental Performance Index, 2008 (out of 149 countries) ....................n/a
Travel & Tourism indicators
T&T industry, 2008 estimatesGDP (US$ millions) .............................................................1,672...................2.2 ....................9.3Employment (1,000 jobs).........................................................56...................3.1 ....................5.6
T&T economy, 2008 estimatesGDP (US$ millions) .............................................................9,383.................12.6 ....................7.7Employment (1,000 jobs).......................................................216.................12.2 ....................4.3
Source: World Travel & Tourism Council, TSA Research 2008
International tourist arrivals (thousands), 2004......................149International tourism receipts (US$ millions), 2006 ..............190
Source: United Nations World Tourism Organization
Travel & Tourism Competitiveness Index
2009 Index....................................................................................................112 3.42008 Index..........................................................................................................104 3.5T&T regulatory framework ..............................................................................97 4.1
Policy rules and regulations........................................................................125 3.2Environmental sustainability........................................................................122 3.8Safety and security .........................................................................................34 5.8Health and hygiene .........................................................................................77 4.3Prioritization of Travel & Tourism................................................................120 3.3
T&T business environment and infrastructure ..........................................109 2.7Air transport infrastructure ........................................................................102 2.5Ground transport infrastructure..................................................................122 2.3Tourism infrastructure ..................................................................................107 1.7ICT infrastructure ............................................................................................91 2.2Price competitiveness in the T&T industry.................................................48 4.9
T&T human, cultural, and natural resources .............................................114 3.4Human resources ..........................................................................................104 4.5
Education and training ...........................................................................104 3.9Availability of qualified labor.................................................................108 5.0
Affinity for Travel & Tourism ........................................................................110 4.4Natural resources .........................................................................................124 2.2Cultural resources...........................................................................................61 2.5
Note: For descriptions of variables and detailed sources, please refer to “How to the Read Country/Economy Profiles.”
Rank Score(out of 133) (1–7 scale)
International tourist arrivals (thousands)
International tourism receipts (US$ millions)
1995 1996 1997 1998 1999 2000 2001 2002 2003 2004 2005 2006 20070
50
100
150
200
250
1 2 3 4 5 6 7
2009–2018Percent annual growth of total (%, forecast)
part2A_profiles.r2 2/26/09 4:01 AM Page 250
The Travel & Tourism Competitiveness Report 2009 © 2009 World Economic Forum

251
2.1:
Cou
ntry
/Eco
nom
y Pr
ofile
s
The Travel & Tourism Competitiveness Index in detail ■ Competitive Advantage ■ Competitive Disadvantage
INDICATOR RANK/133
1st pillar: Policy rules and regulations1.01 Prevalence of foreign ownership ...............................133 ...■1.02 Property rights............................................................103 ...■1.03 Business impact of rules on FDI ................................109 ...■1.04 Visa requirements* ....................................................112 ...■1.05 Openness of bilateral Air Service Agreements* ..........57 ...■1.06 Transparency of government policymaking................100 ...■1.07 Time required to start a business*..............................n/a ......1.08 Cost to start a business*.............................................n/a ......
2nd pillar: Environmental sustainability2.01 Stringency of environmental regulation .......................88 ...■2.02 Enforcement of environmental regulation....................80 ...■2.03 Sustainability of T&T industry development...............112 ...■2.04 Carbon dioxide emissions* ........................................108 ...■2.05 Particulate matter concentration* ..............................114 ...■2.06 Threatened species* ....................................................67 ...■2.07 Environmental treaty ratification*.................................34 ...■
3rd pillar: Safety and security3.01 Business costs of terrorism .........................................16 ...■3.02 Reliability of police services .........................................94 ...■3.03 Business costs of crime and violence............................6 ...■3.04 Road traffic accidents*.................................................51 ...■
4th pillar: Health and hygiene4.01 Physician density*........................................................76 ...■4.02 Access to improved sanitation* ...................................40 ...■4.03 Access to improved drinking water*..........................111 ...■4.04 Hospital beds*..............................................................48 ...■
5th pillar: Prioritization of Travel & Tourism5.01 Government prioritization of the T&T industry...........116 ...■5.02 T&T government expenditure* ....................................80 ...■5.03 Effectiveness of marketing and branding...................111 ...■5.04 T&T fair attendance*....................................................98 ...■
6th pillar: Air transport infrastructure6.01 Quality of air transport infrastructure .........................126 ...■6.02 Available seat kilometers, domestic*...........................43 ...■6.03 Available seat kilometers, international* ......................81 ...■6.04 Departures per 1,000 population*................................73 ...■6.05 Airport density* ............................................................38 ...■6.06 Number of operating airlines*......................................70 ...■6.07 International air transport network .............................110 ...■
7th pillar: Ground transport infrastructure7.01 Quality of roads ............................................................85 ...■7.02 Quality of railroad infrastructure.................................115 ...■7.03 Quality of port infrastructure ......................................110 ...■7.04 Quality of ground transport network..........................121 ...■7.05 Road density*.............................................................118 ...■
INDICATOR RANK/133
8th pillar: Tourism infrastructure8.01 Hotel rooms*................................................................78 ...■8.02 Presence of major car rental companies*....................95 ...■8.03 ATMs accepting Visa cards* ......................................115 ...■
9th pillar: ICT infrastructure9.01 Extent of business Internet use.................................125 ...■9.02 Internet users* ...........................................................110 ...■9.03 Telephone lines*...........................................................80 ...■9.04 Broadband Internet subscribers* .................................98 ...■9.05 Mobile telephone subscribers*....................................75 ...■
10th pillar: Price competitiveness in the T&T industry10.01 Ticket taxes and airport charges*...................................1 ...■10.02 Purchasing power parity*.............................................81 ...■10.03 Extent and effect of taxation........................................37 ...■10.04 Fuel price levels* ...........................................................4 ...■10.05 Hotel price index* ......................................................112 ...■
11th pillar: Human resources11.01 Primary education enrollment*....................................n/a ......11.02 Secondary education enrollment*................................49 ...■11.03 Quality of the educational system..............................121 ...■11.04 Local availability of research and training services.....106 ...■11.05 Extent of staff training................................................114 ...■11.06 Hiring and firing practices...........................................120 ...■11.07 Ease of hiring foreign labor ........................................127 ...■11.08 HIV prevalence* ...........................................................67 ...■11.09 Business impact of HIV/AIDS.......................................80 ...■11.10 Life expectancy* ..........................................................66 ...■
12th pillar: Affinity for Travel & Tourism12.01 Tourism openness* ....................................................121 ...■12.02 Attitude of population toward foreign visitors..............70 ...■12.03 Extension of business trips recommended .................89 ...■
13th pillar: Natural resources13.01 Number of World Heritage natural sites* ....................74 ...■13.02 Protected areas* ........................................................132 ...■13.03 Quality of the natural environment...............................57 ...■13.04 Total known species*.................................................108 ...■
14th pillar: Cultural resources14.01 Number of World Heritage cultural sites* ...................45 ...■14.02 Sports stadiums* .........................................................50 ...■14.03 Number of international fairs and exhibitions* ..........107 ...■14.04 Creative industries exports*........................................n/a ......
Libya
* Hard data
Note: For further details and explanation, please refer to the section “How toRead the Country/Economy Profiles” at the beginning of this chapter.
part2A_profiles.r2 2/26/09 4:01 AM Page 251
The Travel & Tourism Competitiveness Report 2009 © 2009 World Economic Forum

252
2.1:
Cou
ntry
/Eco
nom
y Pr
ofile
s
LithuaniaKey indicatorsPopulation (millions), 2007..............................................................................3.4Surface area (1,000 square kilometers) ........................................................65.3
Gross domestic product (US$ billions), 2007 ...............................................38.9Gross domestic product (PPP, US$) per capita, 2007 ...........................17,732.6Real GDP growth (percent), 2007...................................................................8.9
Environmental Performance Index, 2008 (out of 149 countries).....................16
Travel & Tourism indicators
T&T industry, 2008 estimatesGDP (US$ millions) ................................................................467...................1.1 ....................5.4Employment (1,000 jobs).........................................................14...................0.9 ..................–0.4
T&T economy, 2008 estimatesGDP (US$ millions) .............................................................2,690...................6.2 ....................5.7Employment (1,000 jobs).........................................................80...................5.2 ..................–0.1
Source: World Travel & Tourism Council, TSA Research 2008
International tourist arrivals (thousands), 2006...................2,180International tourism receipts (US$ millions), 2007 ...........1,153
Source: United Nations World Tourism Organization
Travel & Tourism Competitiveness Index
2009 Index......................................................................................................49 4.32008 Index............................................................................................................47 4.3T&T regulatory framework ..............................................................................30 5.3
Policy rules and regulations..........................................................................59 4.5Environmental sustainability..........................................................................21 5.3Safety and security .........................................................................................33 5.8Health and hygiene ...........................................................................................2 7.0Prioritization of Travel & Tourism..................................................................95 3.8
T&T business environment and infrastructure ............................................46 4.0Air transport infrastructure ..........................................................................80 2.7Ground transport infrastructure....................................................................22 4.9Tourism infrastructure ....................................................................................62 3.5ICT infrastructure ............................................................................................35 4.2Price competitiveness in the T&T industry.................................................78 4.5
T&T human, cultural, and natural resources ...............................................89 3.7Human resources ............................................................................................66 5.1
Education and training .............................................................................50 5.0Availability of qualified labor...................................................................96 5.2
Affinity for Travel & Tourism ..........................................................................74 4.7Natural resources .........................................................................................108 2.5Cultural resources...........................................................................................62 2.4
Note: For descriptions of variables and detailed sources, please refer to “How to the Read Country/Economy Profiles.”
Rank Score(out of 133) (1–7 scale)
International tourist arrivals (thousands)
International tourism receipts (US$ millions)
1995 1996 1997 1998 1999 2000 2001 2002 2003 2004 2005 2006 20070
500
1,000
1,500
2,000
2,500
1 2 3 4 5 6 7
2009–2018Percent annual growth of total (%, forecast)
part2A_profiles.r2 2/26/09 4:01 AM Page 252
The Travel & Tourism Competitiveness Report 2009 © 2009 World Economic Forum

253
2.1:
Cou
ntry
/Eco
nom
y Pr
ofile
s
The Travel & Tourism Competitiveness Index in detail ■ Competitive Advantage ■ Competitive Disadvantage
INDICATOR RANK/133
1st pillar: Policy rules and regulations1.01 Prevalence of foreign ownership .................................76 ...■1.02 Property rights..............................................................50 ...■1.03 Business impact of rules on FDI ................................102 ...■1.04 Visa requirements* ......................................................40 ...■1.05 Openness of bilateral Air Service Agreements* ..........89 ...■1.06 Transparency of government policymaking..................64 ...■1.07 Time required to start a business*...............................71 ...■1.08 Cost to start a business* .............................................26 ...■
2nd pillar: Environmental sustainability2.01 Stringency of environmental regulation .......................38 ...■2.02 Enforcement of environmental regulation....................39 ...■2.03 Sustainability of T&T industry development.................99 ...■2.04 Carbon dioxide emissions* ..........................................68 ...■2.05 Particulate matter concentration* ................................23 ...■2.06 Threatened species* ....................................................20 ...■2.07 Environmental treaty ratification*.................................34 ...■
3rd pillar: Safety and security3.01 Business costs of terrorism ...........................................9 ...■3.02 Reliability of police services .........................................65 ...■3.03 Business costs of crime and violence..........................34 ...■3.04 Road traffic accidents*.................................................46 ...■
4th pillar: Health and hygiene4.01 Physician density*..........................................................6 ...■4.02 Access to improved sanitation* ..................................n/a ......4.03 Access to improved drinking water*...........................n/a ......4.04 Hospital beds*................................................................8 ...■
5th pillar: Prioritization of Travel & Tourism5.01 Government prioritization of the T&T industry...........112 ...■5.02 T&T government expenditure* ....................................74 ...■5.03 Effectiveness of marketing and branding...................103 ...■5.04 T&T fair attendance*....................................................62 ...■
6th pillar: Air transport infrastructure6.01 Quality of air transport infrastructure ...........................72 ...■6.02 Available seat kilometers, domestic*.........................100 ...■6.03 Available seat kilometers, international* ......................95 ...■6.04 Departures per 1,000 population*................................58 ...■6.05 Airport density* ............................................................53 ...■6.06 Number of operating airlines*......................................92 ...■6.07 International air transport network ...............................63 ...■
7th pillar: Ground transport infrastructure7.01 Quality of roads ............................................................27 ...■7.02 Quality of railroad infrastructure...................................27 ...■7.03 Quality of port infrastructure ........................................43 ...■7.04 Quality of ground transport network ............................26 ...■7.05 Road density*...............................................................29 ...■
INDICATOR RANK/133
8th pillar: Tourism infrastructure8.01 Hotel rooms*................................................................67 ...■8.02 Presence of major car rental companies*....................56 ...■8.03 ATMs accepting Visa cards* ........................................39 ...■
9th pillar: ICT infrastructure9.01 Extent of business Internet use...................................33 ...■9.02 Internet users* .............................................................43 ...■9.03 Telephone lines*...........................................................58 ...■9.04 Broadband Internet subscribers* .................................34 ...■9.05 Mobile telephone subscribers*......................................6 ...■
10th pillar: Price competitiveness in the T&T industry10.01 Ticket taxes and airport charges*...............................102 ...■10.02 Purchasing power parity*.............................................79 ...■10.03 Extent and effect of taxation........................................63 ...■10.04 Fuel price levels* .........................................................88 ...■10.05 Hotel price index* ........................................................32 ...■
11th pillar: Human resources11.01 Primary education enrollment* ....................................90 ...■11.02 Secondary education enrollment*................................30 ...■11.03 Quality of the educational system................................64 ...■11.04 Local availability of research and training services.......56 ...■11.05 Extent of staff training..................................................38 ...■11.06 Hiring and firing practices.............................................94 ...■11.07 Ease of hiring foreign labor ........................................109 ...■11.08 HIV prevalence* ...........................................................22 ...■11.09 Business impact of HIV/AIDS.......................................51 ...■11.10 Life expectancy* ..........................................................76 ...■
12th pillar: Affinity for Travel & Tourism12.01 Tourism openness* ......................................................51 ...■12.02 Attitude of population toward foreign visitors............111 ...■12.03 Extension of business trips recommended .................88 ...■
13th pillar: Natural resources13.01 Number of World Heritage natural sites* ....................74 ...■13.02 Protected areas* ..........................................................86 ...■13.03 Quality of the natural environment...............................42 ...■13.04 Total known species*.................................................119 ...■
14th pillar: Cultural resources14.01 Number of World Heritage cultural sites* ...................33 ...■14.02 Sports stadiums* .........................................................66 ...■14.03 Number of international fairs and exhibitions* ............51 ...■14.04 Creative industries exports*.........................................59 ...■
Lithuania
* Hard data
Note: For further details and explanation, please refer to the section “How toRead the Country/Economy Profiles” at the beginning of this chapter.
part2A_profiles.r2 2/26/09 4:01 AM Page 253
The Travel & Tourism Competitiveness Report 2009 © 2009 World Economic Forum

254
2.1:
Cou
ntry
/Eco
nom
y Pr
ofile
s
LuxembourgKey indicatorsPopulation (millions), 2007..............................................................................0.5Surface area (1,000 square kilometers) ..........................................................2.6
Gross domestic product (US$ billions), 2007 ...............................................49.5Gross domestic product (PPP, US$) per capita, 2007 ...........................79,659.7Real GDP growth (percent), 2007...................................................................4.5
Environmental Performance Index, 2008 (out of 149 countries).....................31
Travel & Tourism indicators
T&T industry, 2008 estimatesGDP (US$ millions) .............................................................1,517...................2.7 ....................3.0Employment (1,000 jobs)...........................................................8...................3.5 ....................1.2
T&T economy, 2008 estimatesGDP (US$ millions) .............................................................4,564...................8.1 ....................3.4Employment (1,000 jobs).........................................................23.................11.0 ....................1.9
Source: World Travel & Tourism Council, TSA Research 2008
International tourist arrivals (thousands), 2007......................917International tourism receipts (US$ millions), 2007 ...........4,001
Source: United Nations World Tourism Organization
Travel & Tourism Competitiveness Index
2009 Index......................................................................................................23 4.92008 Index............................................................................................................20 5.0T&T regulatory framework ..............................................................................20 5.5
Policy rules and regulations..........................................................................12 5.3Environmental sustainability..........................................................................15 5.3Safety and security ...........................................................................................7 6.4Health and hygiene .........................................................................................22 6.3Prioritization of Travel & Tourism..................................................................89 4.0
T&T business environment and infrastructure ............................................16 5.0Air transport infrastructure ..........................................................................41 3.9Ground transport infrastructure....................................................................13 5.6Tourism infrastructure ....................................................................................21 5.7ICT infrastructure ............................................................................................10 5.4Price competitiveness in the T&T industry.................................................92 4.2
T&T human, cultural, and natural resources ...............................................42 4.3Human resources ............................................................................................26 5.6
Education and training .............................................................................29 5.4Availability of qualified labor...................................................................20 5.7
Affinity for Travel & Tourism ..........................................................................12 5.6Natural resources ...........................................................................................67 3.1Cultural resources...........................................................................................46 2.9
Note: For descriptions of variables and detailed sources, please refer to “How to the Read Country/Economy Profiles.”
Rank Score(out of 133) (1–7 scale)
International tourist arrivals (thousands)
International tourism receipts (US$ millions)
1995 1996 1997 1998 1999 2000 2001 2002 2003 2004 2005 2006 20070
1,000
2,000
3,000
4,000
5,000
1 2 3 4 5 6 7
2009–2018Percent annual growth of total (%, forecast)
part2A_profiles.r2 2/26/09 4:01 AM Page 254
The Travel & Tourism Competitiveness Report 2009 © 2009 World Economic Forum

255
2.1:
Cou
ntry
/Eco
nom
y Pr
ofile
s
The Travel & Tourism Competitiveness Index in detail ■ Competitive Advantage ■ Competitive Disadvantage
INDICATOR RANK/133
1st pillar: Policy rules and regulations1.01 Prevalence of foreign ownership ...................................5 ...■1.02 Property rights..............................................................17 ...■1.03 Business impact of rules on FDI ....................................4 ...■1.04 Visa requirements* ......................................................40 ...■1.05 Openness of bilateral Air Service Agreements* ..........15 ...■1.06 Transparency of government policymaking..................12 ...■1.07 Time required to start a business*...............................71 ...■1.08 Cost to start a business* .............................................48 ...■
2nd pillar: Environmental sustainability2.01 Stringency of environmental regulation .........................7 ...■2.02 Enforcement of environmental regulation....................10 ...■2.03 Sustainability of T&T industry development.................34 ...■2.04 Carbon dioxide emissions* ........................................126 ...■2.05 Particulate matter concentration* ..................................8 ...■2.06 Threatened species* ......................................................1 ...■2.07 Environmental treaty ratification*.................................21 ...■
3rd pillar: Safety and security3.01 Business costs of terrorism .........................................28 ...■3.02 Reliability of police services .........................................17 ...■3.03 Business costs of crime and violence..........................10 ...■3.04 Road traffic accidents*...................................................7 ...■
4th pillar: Health and hygiene4.01 Physician density*........................................................34 ...■4.02 Access to improved sanitation* .....................................1 ...■4.03 Access to improved drinking water*..............................1 ...■4.04 Hospital beds*..............................................................21 ...■
5th pillar: Prioritization of Travel & Tourism5.01 Government prioritization of the T&T industry.............84 ...■5.02 T&T government expenditure* ....................................84 ...■5.03 Effectiveness of marketing and branding.....................57 ...■5.04 T&T fair attendance*....................................................81 ...■
6th pillar: Air transport infrastructure6.01 Quality of air transport infrastructure ...........................54 ...■6.02 Available seat kilometers, domestic*.........................100 ...■6.03 Available seat kilometers, international* ....................109 ...■6.04 Departures per 1,000 population*..................................1 ...■6.05 Airport density* ............................................................24 ...■6.06 Number of operating airlines*....................................108 ...■6.07 International air transport network ...............................75 ...■
7th pillar: Ground transport infrastructure7.01 Quality of roads ............................................................16 ...■7.02 Quality of railroad infrastructure...................................18 ...■7.03 Quality of port infrastructure ........................................21 ...■7.04 Quality of ground transport network ............................32 ...■7.05 Road density*.................................................................9 ...■
INDICATOR RANK/133
8th pillar: Tourism infrastructure8.01 Hotel rooms*................................................................12 ...■8.02 Presence of major car rental companies*....................73 ...■8.03 ATMs accepting Visa cards* ..........................................6 ...■
9th pillar: ICT infrastructure9.01 Extent of business Internet use...................................25 ...■9.02 Internet users* ...............................................................6 ...■9.03 Telephone lines*...........................................................13 ...■9.04 Broadband Internet subscribers* .................................14 ...■9.05 Mobile telephone subscribers*......................................9 ...■
10th pillar: Price competitiveness in the T&T industry10.01 Ticket taxes and airport charges*...................................6 ...■10.02 Purchasing power parity*...........................................124 ...■10.03 Extent and effect of taxation........................................12 ...■10.04 Fuel price levels* .......................................................120 ...■10.05 Hotel price index* ........................................................74 ...■
11th pillar: Human resources11.01 Primary education enrollment* ....................................32 ...■11.02 Secondary education enrollment*................................38 ...■11.03 Quality of the educational system................................41 ...■11.04 Local availability of research and training services.......38 ...■11.05 Extent of staff training..................................................14 ...■11.06 Hiring and firing practices...........................................112 ...■11.07 Ease of hiring foreign labor ..........................................13 ...■11.08 HIV prevalence* ...........................................................49 ...■11.09 Business impact of HIV/AIDS.......................................34 ...■11.10 Life expectancy* ..........................................................12 ...■
12th pillar: Affinity for Travel & Tourism12.01 Tourism openness* ......................................................10 ...■12.02 Attitude of population toward foreign visitors..............34 ...■12.03 Extension of business trips recommended ...............101 ...■
13th pillar: Natural resources13.01 Number of World Heritage natural sites* ....................74 ...■13.02 Protected areas* ..........................................................32 ...■13.03 Quality of the natural environment...............................17 ...■13.04 Total known species*.................................................127 ...■
14th pillar: Cultural resources14.01 Number of World Heritage cultural sites* ...................97 ...■14.02 Sports stadiums* .........................................................11 ...■14.03 Number of international fairs and exhibitions* ............63 ...■14.04 Creative industries exports*.........................................57 ...■
Luxembourg
* Hard data
Note: For further details and explanation, please refer to the section “How toRead the Country/Economy Profiles” at the beginning of this chapter.
part2A_profiles.r2 2/26/09 4:01 AM Page 255
The Travel & Tourism Competitiveness Report 2009 © 2009 World Economic Forum

256
2.1:
Cou
ntry
/Eco
nom
y Pr
ofile
s
Macedonia, FYRKey indicatorsPopulation (millions), 2007..............................................................................2.0Surface area (1,000 square kilometers) ........................................................25.7
Gross domestic product (US$ billions), 2007 .................................................7.7Gross domestic product (PPP, US$) per capita, 2007 .............................8,490.5Real GDP growth (percent), 2007...................................................................5.0
Environmental Performance Index, 2008 (out of 149 countries).....................74
Travel & Tourism indicators
T&T industry, 2008 estimatesGDP (US$ millions) ................................................................120...................1.4 ....................4.8Employment (1,000 jobs)...........................................................8...................1.4 ....................1.4
T&T economy, 2008 estimatesGDP (US$ millions) ................................................................514...................6.2 ....................5.3Employment (1,000 jobs).........................................................33...................5.6 ....................1.8
Source: World Travel & Tourism Council, TSA Research 2008
International tourist arrivals (thousands), 2007......................230International tourism receipts (US$ millions), 2007 ..............185
Source: United Nations World Tourism Organization
Travel & Tourism Competitiveness Index
2009 Index......................................................................................................80 3.82008 Index............................................................................................................83 3.7T&T regulatory framework ..............................................................................69 4.5
Policy rules and regulations..........................................................................76 4.3Environmental sustainability..........................................................................83 4.3Safety and security .........................................................................................64 5.2Health and hygiene .........................................................................................42 5.6Prioritization of Travel & Tourism................................................................129 2.9
T&T business environment and infrastructure ............................................75 3.3Air transport infrastructure ........................................................................119 2.1Ground transport infrastructure....................................................................76 3.2Tourism infrastructure ....................................................................................63 3.4ICT infrastructure ............................................................................................67 2.9Price competitiveness in the T&T industry.................................................59 4.8
T&T human, cultural, and natural resources ...............................................87 3.7Human resources ............................................................................................70 5.0
Education and training .............................................................................75 4.6Availability of qualified labor...................................................................61 5.5
Affinity for Travel & Tourism ..........................................................................69 4.7Natural resources ...........................................................................................92 2.8Cultural resources...........................................................................................70 2.2
Note: For descriptions of variables and detailed sources, please refer to “How to the Read Country/Economy Profiles.”
Rank Score(out of 133) (1–7 scale)
International tourist arrivals (thousands)
International tourism receipts (US$ millions)
1995 1996 1997 1998 1999 2000 2001 2002 2003 2004 2005 2006 20070
50
100
150
200
250
1 2 3 4 5 6 7
2009–2018Percent annual growth of total (%, forecast)
part2A_profiles.r2 2/26/09 4:01 AM Page 256
The Travel & Tourism Competitiveness Report 2009 © 2009 World Economic Forum

257
2.1:
Cou
ntry
/Eco
nom
y Pr
ofile
s
The Travel & Tourism Competitiveness Index in detail ■ Competitive Advantage ■ Competitive Disadvantage
INDICATOR RANK/133
1st pillar: Policy rules and regulations1.01 Prevalence of foreign ownership ...............................113 ...■1.02 Property rights..............................................................96 ...■1.03 Business impact of rules on FDI ................................106 ...■1.04 Visa requirements* ......................................................84 ...■1.05 Openness of bilateral Air Service Agreements* ........116 ...■1.06 Transparency of government policymaking..................79 ...■1.07 Time required to start a business*...............................23 ...■1.08 Cost to start a business* .............................................33 ...■
2nd pillar: Environmental sustainability2.01 Stringency of environmental regulation .....................119 ...■2.02 Enforcement of environmental regulation..................118 ...■2.03 Sustainability of T&T industry development...............116 ...■2.04 Carbon dioxide emissions* ..........................................76 ...■2.05 Particulate matter concentration* ................................26 ...■2.06 Threatened species* ....................................................48 ...■2.07 Environmental treaty ratification*...............................104 ...■
3rd pillar: Safety and security3.01 Business costs of terrorism .........................................96 ...■3.02 Reliability of police services .........................................79 ...■3.03 Business costs of crime and violence..........................76 ...■3.04 Road traffic accidents*.................................................12 ...■
4th pillar: Health and hygiene4.01 Physician density*........................................................40 ...■4.02 Access to improved sanitation* ...................................62 ...■4.03 Access to improved drinking water*..............................1 ...■4.04 Hospital beds*..............................................................38 ...■
5th pillar: Prioritization of Travel & Tourism5.01 Government prioritization of the T&T industry...........110 ...■5.02 T&T government expenditure* ..................................112 ...■5.03 Effectiveness of marketing and branding...................115 ...■5.04 T&T fair attendance*..................................................115 ...■
6th pillar: Air transport infrastructure6.01 Quality of air transport infrastructure .........................121 ...■6.02 Available seat kilometers, domestic*.........................100 ...■6.03 Available seat kilometers, international* ....................124 ...■6.04 Departures per 1,000 population*................................89 ...■6.05 Airport density* ............................................................48 ...■6.06 Number of operating airlines*....................................101 ...■6.07 International air transport network .............................126 ...■
7th pillar: Ground transport infrastructure7.01 Quality of roads ............................................................83 ...■7.02 Quality of railroad infrastructure...................................70 ...■7.03 Quality of port infrastructure ........................................85 ...■7.04 Quality of ground transport network ............................77 ...■7.05 Road density*...............................................................48 ...■
INDICATOR RANK/133
8th pillar: Tourism infrastructure8.01 Hotel rooms*................................................................63 ...■8.02 Presence of major car rental companies*....................23 ...■8.03 ATMs accepting Visa cards* ........................................66 ...■
9th pillar: ICT infrastructure9.01 Extent of business Internet use.................................129 ...■9.02 Internet users* .............................................................71 ...■9.03 Telephone lines*...........................................................59 ...■9.04 Broadband Internet subscribers* .................................52 ...■9.05 Mobile telephone subscribers*....................................46 ...■
10th pillar: Price competitiveness in the T&T industry10.01 Ticket taxes and airport charges*.................................82 ...■10.02 Purchasing power parity*.............................................22 ...■10.03 Extent and effect of taxation........................................47 ...■10.04 Fuel price levels* .........................................................88 ...■10.05 Hotel price index* .......................................................n/a ......
11th pillar: Human resources11.01 Primary education enrollment* ....................................73 ...■11.02 Secondary education enrollment*................................77 ...■11.03 Quality of the educational system................................65 ...■11.04 Local availability of research and training services.......99 ...■11.05 Extent of staff training..................................................83 ...■11.06 Hiring and firing practices.............................................78 ...■11.07 Ease of hiring foreign labor ..........................................71 ...■11.08 HIV prevalence* .............................................................1 ...■11.09 Business impact of HIV/AIDS.......................................77 ...■11.10 Life expectancy* ..........................................................55 ...■
12th pillar: Affinity for Travel & Tourism12.01 Tourism openness* ......................................................86 ...■12.02 Attitude of population toward foreign visitors..............40 ...■12.03 Extension of business trips recommended .................67 ...■
13th pillar: Natural resources13.01 Number of World Heritage natural sites* ....................40 ...■13.02 Protected areas* ..........................................................78 ...■13.03 Quality of the natural environment...............................86 ...■13.04 Total known species*...................................................87 ...■
14th pillar: Cultural resources14.01 Number of World Heritage cultural sites* ...................97 ...■14.02 Sports stadiums* .........................................................19 ...■14.03 Number of international fairs and exhibitions* ..........107 ...■14.04 Creative industries exports*.........................................87 ...■
Macedonia, FYR
* Hard data
Note: For further details and explanation, please refer to the section “How toRead the Country/Economy Profiles” at the beginning of this chapter.
part2A_profiles.r2 2/26/09 4:01 AM Page 257
The Travel & Tourism Competitiveness Report 2009 © 2009 World Economic Forum

258
2.1:
Cou
ntry
/Eco
nom
y Pr
ofile
s
MadagascarKey indicatorsPopulation (millions), 2007............................................................................19.6Surface area (1,000 square kilometers) ......................................................587.0
Gross domestic product (US$ billions), 2007 .................................................7.7Gross domestic product (PPP, US$) per capita, 2007 ................................979.4Real GDP growth (percent), 2007...................................................................6.4
Environmental Performance Index, 2008 (out of 149 countries)...................133
Travel & Tourism indicators
T&T industry, 2008 estimatesGDP (US$ millions) ................................................................235...................3.0 ....................2.1Employment (1,000 jobs).........................................................99...................2.4 ....................0.9
T&T economy, 2008 estimatesGDP (US$ millions) ................................................................612...................7.8 ....................1.8Employment (1,000 jobs).......................................................264...................6.3 ....................0.6
Source: World Travel & Tourism Council, TSA Research 2008
International tourist arrivals (thousands), 2007......................344International tourism receipts (US$ millions), 2007 ..............176
Source: United Nations World Tourism Organization
Travel & Tourism Competitiveness Index
2009 Index....................................................................................................116 3.32008 Index..........................................................................................................118 3.2T&T regulatory framework ............................................................................112 3.8
Policy rules and regulations..........................................................................83 4.1Environmental sustainability..........................................................................65 4.5Safety and security .........................................................................................93 4.6Health and hygiene .......................................................................................131 1.1Prioritization of Travel & Tourism..................................................................57 4.5
T&T business environment and infrastructure ..........................................106 2.7Air transport infrastructure ..........................................................................93 2.6Ground transport infrastructure..................................................................115 2.5Tourism infrastructure ....................................................................................84 2.3ICT infrastructure ..........................................................................................127 1.5Price competitiveness in the T&T industry.................................................55 4.8
T&T human, cultural, and natural resources .............................................119 3.3Human resources ..........................................................................................107 4.4
Education and training ...........................................................................110 3.7Availability of qualified labor.................................................................104 5.1
Affinity for Travel & Tourism ..........................................................................93 4.5Natural resources ...........................................................................................70 3.1Cultural resources.........................................................................................123 1.3
Note: For descriptions of variables and detailed sources, please refer to “How to the Read Country/Economy Profiles.”
Rank Score(out of 133) (1–7 scale)
International tourist arrivals (thousands)
International tourism receipts (US$ millions)
1995 1996 1997 1998 1999 2000 2001 2002 2003 2004 2005 2006 200750
100
150
200
250
300
350
1 2 3 4 5 6 7
2009–2018Percent annual growth of total (%, forecast)
part2A_profiles.r2 2/26/09 4:01 AM Page 258
The Travel & Tourism Competitiveness Report 2009 © 2009 World Economic Forum

259
2.1:
Cou
ntry
/Eco
nom
y Pr
ofile
s
The Travel & Tourism Competitiveness Index in detail ■ Competitive Advantage ■ Competitive Disadvantage
INDICATOR RANK/133
1st pillar: Policy rules and regulations1.01 Prevalence of foreign ownership .................................91 ...■1.02 Property rights............................................................107 ...■1.03 Business impact of rules on FDI ................................103 ...■1.04 Visa requirements* ....................................................132 ...■1.05 Openness of bilateral Air Service Agreements* ..........95 ...■1.06 Transparency of government policymaking..................73 ...■1.07 Time required to start a business*...............................15 ...■1.08 Cost to start a business* .............................................67 ...■
2nd pillar: Environmental sustainability2.01 Stringency of environmental regulation .......................64 ...■2.02 Enforcement of environmental regulation....................52 ...■2.03 Sustainability of T&T industry development.................39 ...■2.04 Carbon dioxide emissions* ..........................................12 ...■2.05 Particulate matter concentration* ................................61 ...■2.06 Threatened species* ..................................................132 ...■2.07 Environmental treaty ratification*.................................34 ...■
3rd pillar: Safety and security3.01 Business costs of terrorism .......................................105 ...■3.02 Reliability of police services .........................................73 ...■3.03 Business costs of crime and violence........................109 ...■3.04 Road traffic accidents*.................................................92 ...■
4th pillar: Health and hygiene4.01 Physician density*......................................................108 ...■4.02 Access to improved sanitation* .................................123 ...■4.03 Access to improved drinking water*..........................124 ...■4.04 Hospital beds*............................................................125 ...■
5th pillar: Prioritization of Travel & Tourism5.01 Government prioritization of the T&T industry.............54 ...■5.02 T&T government expenditure* ....................................27 ...■5.03 Effectiveness of marketing and branding.....................61 ...■5.04 T&T fair attendance*....................................................81 ...■
6th pillar: Air transport infrastructure6.01 Quality of air transport infrastructure ...........................80 ...■6.02 Available seat kilometers, domestic*...........................55 ...■6.03 Available seat kilometers, international* ......................98 ...■6.04 Departures per 1,000 population*................................97 ...■6.05 Airport density* ............................................................32 ...■6.06 Number of operating airlines*....................................118 ...■6.07 International air transport network ...............................87 ...■
7th pillar: Ground transport infrastructure7.01 Quality of roads ............................................................88 ...■7.02 Quality of railroad infrastructure...................................94 ...■7.03 Quality of port infrastructure ......................................118 ...■7.04 Quality of ground transport network..........................101 ...■7.05 Road density*.............................................................108 ...■
INDICATOR RANK/133
8th pillar: Tourism infrastructure8.01 Hotel rooms*..............................................................108 ...■8.02 Presence of major car rental companies*....................56 ...■8.03 ATMs accepting Visa cards* ......................................118 ...■
9th pillar: ICT infrastructure9.01 Extent of business Internet use.................................119 ...■9.02 Internet users* ...........................................................129 ...■9.03 Telephone lines*.........................................................126 ...■9.04 Broadband Internet subscribers* ...............................127 ...■9.05 Mobile telephone subscribers*..................................124 ...■
10th pillar: Price competitiveness in the T&T industry10.01 Ticket taxes and airport charges*.................................92 ...■10.02 Purchasing power parity*.............................................19 ...■10.03 Extent and effect of taxation........................................70 ...■10.04 Fuel price levels* .........................................................79 ...■10.05 Hotel price index* ........................................................36 ...■
11th pillar: Human resources11.01 Primary education enrollment* ....................................46 ...■11.02 Secondary education enrollment*..............................125 ...■11.03 Quality of the educational system..............................103 ...■11.04 Local availability of research and training services.......98 ...■11.05 Extent of staff training..................................................97 ...■11.06 Hiring and firing practices.............................................52 ...■11.07 Ease of hiring foreign labor ..........................................81 ...■11.08 HIV prevalence* ...........................................................22 ...■11.09 Business impact of HIV/AIDS.....................................107 ...■11.10 Life expectancy* ........................................................110 ...■
12th pillar: Affinity for Travel & Tourism12.01 Tourism openness* ......................................................89 ...■12.02 Attitude of population toward foreign visitors..............95 ...■12.03 Extension of business trips recommended .................81 ...■
13th pillar: Natural resources13.01 Number of World Heritage natural sites* ....................23 ...■13.02 Protected areas* ........................................................111 ...■13.03 Quality of the natural environment.............................102 ...■13.04 Total known species*...................................................50 ...■
14th pillar: Cultural resources14.01 Number of World Heritage cultural sites* ...................82 ...■14.02 Sports stadiums* .......................................................133 ...■14.03 Number of international fairs and exhibitions* ..........122 ...■14.04 Creative industries exports*.........................................73 ...■
Madagascar
* Hard data
Note: For further details and explanation, please refer to the section “How toRead the Country/Economy Profiles” at the beginning of this chapter.
part2A_profiles.r2 2/26/09 4:01 AM Page 259
The Travel & Tourism Competitiveness Report 2009 © 2009 World Economic Forum

260
2.1:
Cou
ntry
/Eco
nom
y Pr
ofile
s
MalawiKey indicatorsPopulation (millions), 2007............................................................................13.5Surface area (1,000 square kilometers) ......................................................118.5
Gross domestic product (US$ billions), 2007 .................................................3.6Gross domestic product (PPP, US$) per capita, 2007 ................................792.6Real GDP growth (percent), 2007...................................................................7.9
Environmental Performance Index, 2008 (out of 149 countries)...................121
Travel & Tourism indicators
T&T industry, 2008 estimatesGDP (US$ millions) ..................................................................82...................3.0 ....................3.9Employment (1,000 jobs).........................................................72...................2.4 ....................2.0
T&T economy, 2008 estimatesGDP (US$ millions) ................................................................159...................5.9 ....................4.1Employment (1,000 jobs).......................................................142...................4.6 ....................2.3
Source: World Travel & Tourism Council, TSA Research 2008
International tourist arrivals (thousands), 2007......................714International tourism receipts (US$ millions), 2007 ................27
Source: United Nations World Tourism Organization
Travel & Tourism Competitiveness Index
2009 Index....................................................................................................117 3.32008 Index..........................................................................................................n/a n/aT&T regulatory framework ............................................................................106 3.9
Policy rules and regulations........................................................................106 3.8Environmental sustainability..........................................................................60 4.6Safety and security .........................................................................................53 5.3Health and hygiene .......................................................................................108 2.7Prioritization of Travel & Tourism................................................................123 3.1
T&T business environment and infrastructure ..........................................131 2.4Air transport infrastructure ........................................................................129 1.9Ground transport infrastructure..................................................................106 2.7Tourism infrastructure ..................................................................................126 1.2ICT infrastructure ..........................................................................................126 1.5Price competitiveness in the T&T industry.................................................60 4.8
T&T human, cultural, and natural resources .............................................107 3.5Human resources ..........................................................................................117 4.0
Education and training ...........................................................................106 3.8Availability of qualified labor.................................................................126 4.2
Affinity for Travel & Tourism ..........................................................................80 4.6Natural resources ...........................................................................................46 3.8Cultural resources.........................................................................................115 1.4
Note: For descriptions of variables and detailed sources, please refer to “How to the Read Country/Economy Profiles.”
Rank Score(out of 133) (1–7 scale)
International tourist arrivals (thousands)
International tourism receipts (US$ millions)
1995 1996 1997 1998 1999 2000 2001 2002 2003 2004 2005 2006 20070
200
400
600
800
1 2 3 4 5 6 7
2009–2018Percent annual growth of total (%, forecast)
part2A_profiles.r2 2/26/09 4:01 AM Page 260
The Travel & Tourism Competitiveness Report 2009 © 2009 World Economic Forum
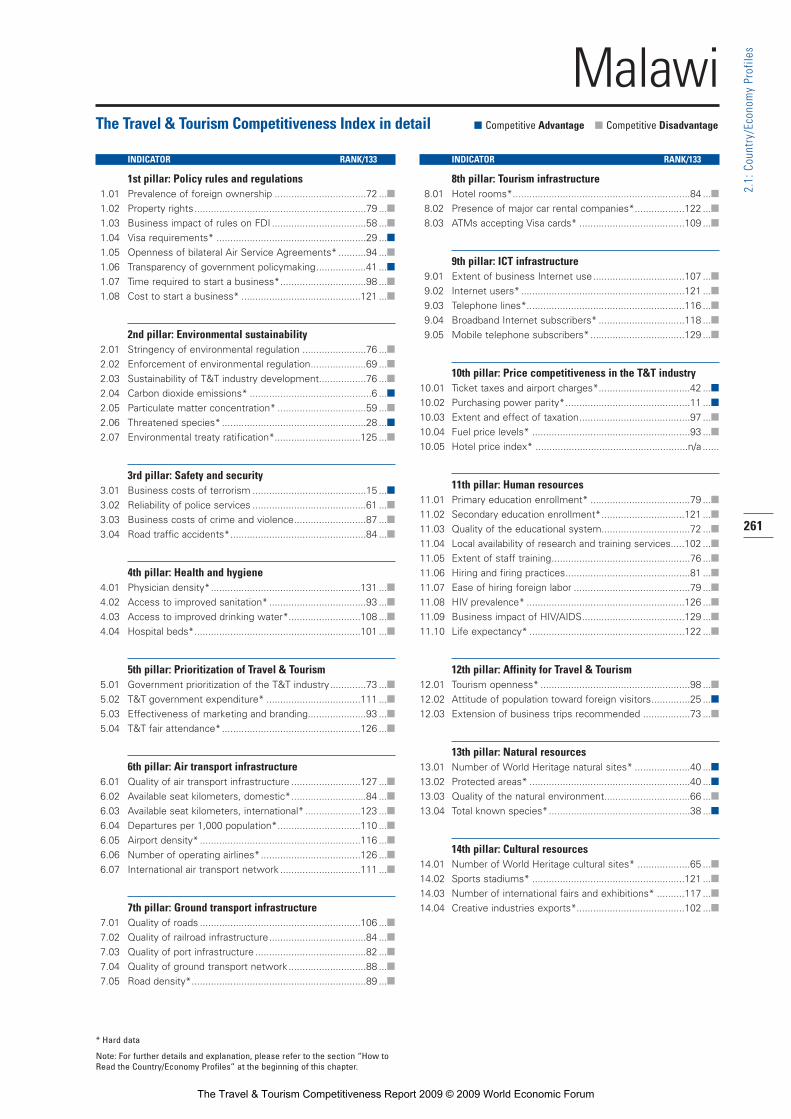
261
2.1:
Cou
ntry
/Eco
nom
y Pr
ofile
s
The Travel & Tourism Competitiveness Index in detail ■ Competitive Advantage ■ Competitive Disadvantage
INDICATOR RANK/133
1st pillar: Policy rules and regulations1.01 Prevalence of foreign ownership .................................72 ...■1.02 Property rights..............................................................79 ...■1.03 Business impact of rules on FDI ..................................58 ...■1.04 Visa requirements* ......................................................29 ...■1.05 Openness of bilateral Air Service Agreements* ..........94 ...■1.06 Transparency of government policymaking..................41 ...■1.07 Time required to start a business*...............................98 ...■1.08 Cost to start a business* ...........................................121 ...■
2nd pillar: Environmental sustainability2.01 Stringency of environmental regulation .......................76 ...■2.02 Enforcement of environmental regulation....................69 ...■2.03 Sustainability of T&T industry development.................76 ...■2.04 Carbon dioxide emissions* ............................................6 ...■2.05 Particulate matter concentration* ................................59 ...■2.06 Threatened species* ....................................................28 ...■2.07 Environmental treaty ratification*...............................125 ...■
3rd pillar: Safety and security3.01 Business costs of terrorism .........................................15 ...■3.02 Reliability of police services .........................................61 ...■3.03 Business costs of crime and violence..........................87 ...■3.04 Road traffic accidents*.................................................84 ...■
4th pillar: Health and hygiene4.01 Physician density*......................................................131 ...■4.02 Access to improved sanitation* ...................................93 ...■4.03 Access to improved drinking water*..........................108 ...■4.04 Hospital beds*............................................................101 ...■
5th pillar: Prioritization of Travel & Tourism5.01 Government prioritization of the T&T industry.............73 ...■5.02 T&T government expenditure* ..................................111 ...■5.03 Effectiveness of marketing and branding.....................93 ...■5.04 T&T fair attendance*..................................................126 ...■
6th pillar: Air transport infrastructure6.01 Quality of air transport infrastructure .........................127 ...■6.02 Available seat kilometers, domestic*...........................84 ...■6.03 Available seat kilometers, international* ....................123 ...■6.04 Departures per 1,000 population*..............................110 ...■6.05 Airport density* ..........................................................116 ...■6.06 Number of operating airlines*....................................126 ...■6.07 International air transport network .............................111 ...■
7th pillar: Ground transport infrastructure7.01 Quality of roads ..........................................................106 ...■7.02 Quality of railroad infrastructure...................................84 ...■7.03 Quality of port infrastructure ........................................82 ...■7.04 Quality of ground transport network ............................88 ...■7.05 Road density*...............................................................89 ...■
INDICATOR RANK/133
8th pillar: Tourism infrastructure8.01 Hotel rooms*................................................................84 ...■8.02 Presence of major car rental companies*..................122 ...■8.03 ATMs accepting Visa cards* ......................................109 ...■
9th pillar: ICT infrastructure9.01 Extent of business Internet use.................................107 ...■9.02 Internet users* ...........................................................121 ...■9.03 Telephone lines*.........................................................116 ...■9.04 Broadband Internet subscribers* ...............................118 ...■9.05 Mobile telephone subscribers*..................................129 ...■
10th pillar: Price competitiveness in the T&T industry10.01 Ticket taxes and airport charges*.................................42 ...■10.02 Purchasing power parity*.............................................11 ...■10.03 Extent and effect of taxation........................................97 ...■10.04 Fuel price levels* .........................................................93 ...■10.05 Hotel price index* .......................................................n/a ......
11th pillar: Human resources11.01 Primary education enrollment* ....................................79 ...■11.02 Secondary education enrollment*..............................121 ...■11.03 Quality of the educational system................................72 ...■11.04 Local availability of research and training services.....102 ...■11.05 Extent of staff training..................................................76 ...■11.06 Hiring and firing practices.............................................81 ...■11.07 Ease of hiring foreign labor ..........................................79 ...■11.08 HIV prevalence* .........................................................126 ...■11.09 Business impact of HIV/AIDS.....................................129 ...■11.10 Life expectancy* ........................................................122 ...■
12th pillar: Affinity for Travel & Tourism12.01 Tourism openness* ......................................................98 ...■12.02 Attitude of population toward foreign visitors..............25 ...■12.03 Extension of business trips recommended .................73 ...■
13th pillar: Natural resources13.01 Number of World Heritage natural sites* ....................40 ...■13.02 Protected areas* ..........................................................40 ...■13.03 Quality of the natural environment...............................66 ...■13.04 Total known species*...................................................38 ...■
14th pillar: Cultural resources14.01 Number of World Heritage cultural sites* ...................65 ...■14.02 Sports stadiums* .......................................................121 ...■14.03 Number of international fairs and exhibitions* ..........117 ...■14.04 Creative industries exports*.......................................102 ...■
Malawi
* Hard data
Note: For further details and explanation, please refer to the section “How toRead the Country/Economy Profiles” at the beginning of this chapter.
part2A_profiles.r2 2/26/09 4:01 AM Page 261
The Travel & Tourism Competitiveness Report 2009 © 2009 World Economic Forum

262
2.1:
Cou
ntry
/Eco
nom
y Pr
ofile
s
MalaysiaKey indicatorsPopulation (millions), 2007............................................................................26.2Surface area (1,000 square kilometers) ......................................................329.7
Gross domestic product (US$ billions), 2007 .............................................186.7Gross domestic product (PPP, US$) per capita, 2007 ...........................13,385.1Real GDP growth (percent), 2007...................................................................6.3
Environmental Performance Index, 2008 (out of 149 countries).....................26
Travel & Tourism indicators
T&T industry, 2008 estimatesGDP (US$ millions) .............................................................9,512...................4.8 ....................4.5Employment (1,000 jobs).......................................................532...................4.9 ....................2.0
T&T economy, 2008 estimatesGDP (US$ millions) ...........................................................26,504.................13.2 ....................5.3Employment (1,000 jobs)....................................................1,257.................11.6 ....................2.6
Source: World Travel & Tourism Council, TSA Research 2008
International tourist arrivals (thousands), 2007.................20,973International tourism receipts (US$ millions), 2007 .........14,047
Source: United Nations World Tourism Organization
Travel & Tourism Competitiveness Index
2009 Index......................................................................................................32 4.72008 Index............................................................................................................32 4.6T&T regulatory framework ..............................................................................42 5.0
Policy rules and regulations............................................................................9 5.4Environmental sustainability..........................................................................54 4.7Safety and security .........................................................................................59 5.3Health and hygiene .........................................................................................69 4.5Prioritization of Travel & Tourism..................................................................23 5.3
T&T business environment and infrastructure ............................................38 4.2Air transport infrastructure ..........................................................................35 4.2Ground transport infrastructure....................................................................28 4.8Tourism infrastructure ....................................................................................77 2.7ICT infrastructure ............................................................................................46 3.6Price competitiveness in the T&T industry...................................................4 5.8
T&T human, cultural, and natural resources ...............................................14 4.9Human resources ............................................................................................30 5.5
Education and training .............................................................................30 5.4Availability of qualified labor...................................................................36 5.6
Affinity for Travel & Tourism ..........................................................................21 5.4Natural resources ...........................................................................................21 4.6Cultural resources...........................................................................................32 3.9
Note: For descriptions of variables and detailed sources, please refer to “How to the Read Country/Economy Profiles.”
Rank Score(out of 133) (1–7 scale)
International tourist arrivals (thousands)
International tourism receipts (US$ millions)
1995 1996 1997 1998 1999 2000 2001 2002 2003 2004 2005 2006 20070
5,000
10,000
15,000
20,000
25,000
1 2 3 4 5 6 7
2009–2018Percent annual growth of total (%, forecast)
part2A_profiles.r2 2/26/09 4:01 AM Page 262
The Travel & Tourism Competitiveness Report 2009 © 2009 World Economic Forum

263
2.1:
Cou
ntry
/Eco
nom
y Pr
ofile
s
The Travel & Tourism Competitiveness Index in detail ■ Competitive Advantage ■ Competitive Disadvantage
INDICATOR RANK/133
1st pillar: Policy rules and regulations1.01 Prevalence of foreign ownership .................................67 ...■1.02 Property rights..............................................................38 ...■1.03 Business impact of rules on FDI ..................................47 ...■1.04 Visa requirements* ........................................................1 ...■1.05 Openness of bilateral Air Service Agreements* ..........52 ...■1.06 Transparency of government policymaking..................20 ...■1.07 Time required to start a business*...............................33 ...■1.08 Cost to start a business* .............................................73 ...■
2nd pillar: Environmental sustainability2.01 Stringency of environmental regulation .......................28 ...■2.02 Enforcement of environmental regulation....................32 ...■2.03 Sustainability of T&T industry development.................11 ...■2.04 Carbon dioxide emissions* ..........................................90 ...■2.05 Particulate matter concentration* ................................38 ...■2.06 Threatened species* ..................................................123 ...■2.07 Environmental treaty ratification*.................................67 ...■
3rd pillar: Safety and security3.01 Business costs of terrorism .........................................82 ...■3.02 Reliability of police services .........................................37 ...■3.03 Business costs of crime and violence..........................74 ...■3.04 Road traffic accidents*.................................................85 ...■
4th pillar: Health and hygiene4.01 Physician density*........................................................94 ...■4.02 Access to improved sanitation* ...................................48 ...■4.03 Access to improved drinking water*............................38 ...■4.04 Hospital beds*..............................................................83 ...■
5th pillar: Prioritization of Travel & Tourism5.01 Government prioritization of the T&T industry.............23 ...■5.02 T&T government expenditure* ..................................104 ...■5.03 Effectiveness of marketing and branding.....................12 ...■5.04 T&T fair attendance*......................................................1 ...■
6th pillar: Air transport infrastructure6.01 Quality of air transport infrastructure ...........................20 ...■6.02 Available seat kilometers, domestic*...........................17 ...■6.03 Available seat kilometers, international* ......................23 ...■6.04 Departures per 1,000 population*................................44 ...■6.05 Airport density* ............................................................33 ...■6.06 Number of operating airlines*......................................27 ...■6.07 International air transport network ...............................33 ...■
7th pillar: Ground transport infrastructure7.01 Quality of roads ............................................................17 ...■7.02 Quality of railroad infrastructure...................................17 ...■7.03 Quality of port infrastructure ........................................16 ...■7.04 Quality of ground transport network ............................21 ...■7.05 Road density*...............................................................63 ...■
INDICATOR RANK/133
8th pillar: Tourism infrastructure8.01 Hotel rooms*................................................................45 ...■8.02 Presence of major car rental companies*....................95 ...■8.03 ATMs accepting Visa cards* ........................................55 ...■
9th pillar: ICT infrastructure9.01 Extent of business Internet use...................................29 ...■9.02 Internet users* .............................................................18 ...■9.03 Telephone lines*...........................................................73 ...■9.04 Broadband Internet subscribers* .................................49 ...■9.05 Mobile telephone subscribers*....................................53 ...■
10th pillar: Price competitiveness in the T&T industry10.01 Ticket taxes and airport charges*.................................13 ...■10.02 Purchasing power parity*.............................................46 ...■10.03 Extent and effect of taxation........................................20 ...■10.04 Fuel price levels* .........................................................14 ...■10.05 Hotel price index* ..........................................................6 ...■
11th pillar: Human resources11.01 Primary education enrollment* ......................................1 ...■11.02 Secondary education enrollment*................................95 ...■11.03 Quality of the educational system................................18 ...■11.04 Local availability of research and training services.......27 ...■11.05 Extent of staff training..................................................20 ...■11.06 Hiring and firing practices.............................................42 ...■11.07 Ease of hiring foreign labor ..........................................50 ...■11.08 HIV prevalence* ...........................................................78 ...■11.09 Business impact of HIV/AIDS.......................................67 ...■11.10 Life expectancy* ..........................................................66 ...■
12th pillar: Affinity for Travel & Tourism12.01 Tourism openness* ......................................................21 ...■12.02 Attitude of population toward foreign visitors..............50 ...■12.03 Extension of business trips recommended .................32 ...■
13th pillar: Natural resources13.01 Number of World Heritage natural sites* ....................23 ...■13.02 Protected areas* ..........................................................40 ...■13.03 Quality of the natural environment...............................35 ...■13.04 Total known species*...................................................22 ...■
14th pillar: Cultural resources14.01 Number of World Heritage cultural sites* ...................82 ...■14.02 Sports stadiums* .........................................................60 ...■14.03 Number of international fairs and exhibitions* ............30 ...■14.04 Creative industries exports*.........................................21 ...■
Malaysia
* Hard data
Note: For further details and explanation, please refer to the section “How toRead the Country/Economy Profiles” at the beginning of this chapter.
part2A_profiles.r2 2/26/09 4:01 AM Page 263
The Travel & Tourism Competitiveness Report 2009 © 2009 World Economic Forum

264
2.1:
Cou
ntry
/Eco
nom
y Pr
ofile
s
MaliKey indicatorsPopulation (millions), 2007............................................................................14.3Surface area (1,000 square kilometers) ...................................................1,240.2
Gross domestic product (US$ billions), 2007 .................................................6.9Gross domestic product (PPP, US$) per capita, 2007 .............................1,038.5Real GDP growth (percent), 2007...................................................................3.1
Environmental Performance Index, 2008 (out of 149 countries)...................145
Travel & Tourism indicators
T&T industry, 2008 estimatesGDP (US$ millions) ................................................................177...................2.3 ....................4.3Employment (1,000 jobs).........................................................57...................1.8 ....................3.0
T&T economy, 2008 estimatesGDP (US$ millions) ................................................................421...................5.4 ....................4.4Employment (1,000 jobs).......................................................138...................4.3 ....................3.1
Source: World Travel & Tourism Council, TSA Research 2008
International tourist arrivals (thousands), 2007......................164International tourism receipts (US$ millions), 2006 ..............175
Source: United Nations World Tourism Organization
Travel & Tourism Competitiveness Index
2009 Index....................................................................................................119 3.22008 Index..........................................................................................................119 3.2T&T regulatory framework ............................................................................114 3.8
Policy rules and regulations........................................................................116 3.5Environmental sustainability..........................................................................70 4.5Safety and security .........................................................................................77 4.9Health and hygiene .......................................................................................124 1.8Prioritization of Travel & Tourism..................................................................76 4.2
T&T business environment and infrastructure ..........................................126 2.5Air transport infrastructure ........................................................................118 2.2Ground transport infrastructure..................................................................100 2.8Tourism infrastructure ..................................................................................119 1.5ICT infrastructure ..........................................................................................116 1.7Price competitiveness in the T&T industry.................................................89 4.3
T&T human, cultural, and natural resources .............................................120 3.3Human resources ..........................................................................................125 3.8
Education and training ...........................................................................130 2.8Availability of qualified labor.................................................................116 4.8
Affinity for Travel & Tourism ..........................................................................54 4.9Natural resources ...........................................................................................88 2.8Cultural resources...........................................................................................91 1.7
Note: For descriptions of variables and detailed sources, please refer to “How to the Read Country/Economy Profiles.”
Rank Score(out of 133) (1–7 scale)
International tourist arrivals (thousands)
International tourism receipts (US$ millions)
1995 1996 1997 1998 1999 2000 2001 2002 2003 2004 2005 2006 20070
50
100
150
200
1 2 3 4 5 6 7
2009–2018Percent annual growth of total (%, forecast)
part2A_profiles.r2 2/26/09 4:01 AM Page 264
The Travel & Tourism Competitiveness Report 2009 © 2009 World Economic Forum

265
2.1:
Cou
ntry
/Eco
nom
y Pr
ofile
s
The Travel & Tourism Competitiveness Index in detail ■ Competitive Advantage ■ Competitive Disadvantage
INDICATOR RANK/133
1st pillar: Policy rules and regulations1.01 Prevalence of foreign ownership ...............................101 ...■1.02 Property rights..............................................................91 ...■1.03 Business impact of rules on FDI ..................................85 ...■1.04 Visa requirements* ....................................................101 ...■1.05 Openness of bilateral Air Service Agreements* ........105 ...■1.06 Transparency of government policymaking..................40 ...■1.07 Time required to start a business*...............................71 ...■1.08 Cost to start a business* ...........................................119 ...■
2nd pillar: Environmental sustainability2.01 Stringency of environmental regulation .......................79 ...■2.02 Enforcement of environmental regulation....................70 ...■2.03 Sustainability of T&T industry development...................7 ...■2.04 Carbon dioxide emissions* ............................................4 ...■2.05 Particulate matter concentration* ..............................130 ...■2.06 Threatened species* ....................................................24 ...■2.07 Environmental treaty ratification*.................................81 ...■
3rd pillar: Safety and security3.01 Business costs of terrorism .........................................92 ...■3.02 Reliability of police services .........................................60 ...■3.03 Business costs of crime and violence..........................89 ...■3.04 Road traffic accidents*.................................................90 ...■
4th pillar: Health and hygiene4.01 Physician density*......................................................121 ...■4.02 Access to improved sanitation* .................................104 ...■4.03 Access to improved drinking water*..........................118 ...■4.04 Hospital beds*............................................................125 ...■
5th pillar: Prioritization of Travel & Tourism5.01 Government prioritization of the T&T industry.............21 ...■5.02 T&T government expenditure* ..................................107 ...■5.03 Effectiveness of marketing and branding.....................10 ...■5.04 T&T fair attendance*....................................................98 ...■
6th pillar: Air transport infrastructure6.01 Quality of air transport infrastructure ...........................95 ...■6.02 Available seat kilometers, domestic*.........................100 ...■6.03 Available seat kilometers, international* ....................106 ...■6.04 Departures per 1,000 population*..............................121 ...■6.05 Airport density* ..........................................................129 ...■6.06 Number of operating airlines*......................................95 ...■6.07 International air transport network .............................104 ...■
7th pillar: Ground transport infrastructure7.01 Quality of roads ............................................................96 ...■7.02 Quality of railroad infrastructure...................................89 ...■7.03 Quality of port infrastructure ........................................77 ...■7.04 Quality of ground transport network ............................47 ...■7.05 Road density*.............................................................129 ...■
INDICATOR RANK/133
8th pillar: Tourism infrastructure8.01 Hotel rooms*..............................................................113 ...■8.02 Presence of major car rental companies*....................95 ...■8.03 ATMs accepting Visa cards* ......................................119 ...■
9th pillar: ICT infrastructure9.01 Extent of business Internet use...................................86 ...■9.02 Internet users* ...........................................................125 ...■9.03 Telephone lines*.........................................................127 ...■9.04 Broadband Internet subscribers* ...............................113 ...■9.05 Mobile telephone subscribers*..................................118 ...■
10th pillar: Price competitiveness in the T&T industry10.01 Ticket taxes and airport charges*...............................128 ...■10.02 Purchasing power parity*.............................................49 ...■10.03 Extent and effect of taxation........................................57 ...■10.04 Fuel price levels* .........................................................82 ...■10.05 Hotel price index* .......................................................n/a ......
11th pillar: Human resources11.01 Primary education enrollment* ..................................126 ...■11.02 Secondary education enrollment*..............................122 ...■11.03 Quality of the educational system..............................119 ...■11.04 Local availability of research and training services.......88 ...■11.05 Extent of staff training................................................122 ...■11.06 Hiring and firing practices.............................................38 ...■11.07 Ease of hiring foreign labor ..........................................51 ...■11.08 HIV prevalence* .........................................................108 ...■11.09 Business impact of HIV/AIDS.....................................116 ...■11.10 Life expectancy* ........................................................129 ...■
12th pillar: Affinity for Travel & Tourism12.01 Tourism openness* ......................................................70 ...■12.02 Attitude of population toward foreign visitors..............32 ...■12.03 Extension of business trips recommended .................51 ...■
13th pillar: Natural resources13.01 Number of World Heritage natural sites* ....................40 ...■13.02 Protected areas* ........................................................113 ...■13.03 Quality of the natural environment...............................89 ...■13.04 Total known species*...................................................48 ...■
14th pillar: Cultural resources14.01 Number of World Heritage cultural sites* ...................45 ...■14.02 Sports stadiums* .......................................................101 ...■14.03 Number of international fairs and exhibitions* ..........107 ...■14.04 Creative industries exports*.......................................113 ...■
Mali
* Hard data
Note: For further details and explanation, please refer to the section “How toRead the Country/Economy Profiles” at the beginning of this chapter.
part2A_profiles.r2 2/26/09 4:01 AM Page 265
The Travel & Tourism Competitiveness Report 2009 © 2009 World Economic Forum

266
2.1:
Cou
ntry
/Eco
nom
y Pr
ofile
s
MaltaKey indicatorsPopulation (millions), 2007..............................................................................0.4Surface area (1,000 square kilometers) ..........................................................0.3
Gross domestic product (US$ billions), 2007 .................................................7.5Gross domestic product (PPP, US$) per capita, 2007 ...........................23,025.9Real GDP growth (percent), 2007...................................................................3.7
Environmental Performance Index, 2008 (out of 149 countries) ....................n/a
Travel & Tourism indicators
T&T industry, 2008 estimatesGDP (US$ millions) ................................................................924.................11.3 ....................5.1Employment (1,000 jobs).........................................................24.................15.8 ....................2.5
T&T economy, 2008 estimatesGDP (US$ millions) .............................................................1,882.................23.0 ....................4.5Employment (1,000 jobs).........................................................43.................27.8 ....................2.1
Source: World Travel & Tourism Council, TSA Research 2008
International tourist arrivals (thousands), 2007...................1,244International tourism receipts (US$ millions), 2007 ..............919
Source: United Nations World Tourism Organization
Travel & Tourism Competitiveness Index
2009 Index......................................................................................................29 4.82008 Index............................................................................................................25 4.9T&T regulatory framework ..............................................................................11 5.6
Policy rules and regulations..........................................................................54 4.6Environmental sustainability..........................................................................66 4.5Safety and security .........................................................................................11 6.3Health and hygiene ...........................................................................................3 6.9Prioritization of Travel & Tourism..................................................................16 5.5
T&T business environment and infrastructure ............................................31 4.6Air transport infrastructure ..........................................................................22 4.7Ground transport infrastructure....................................................................27 4.8Tourism infrastructure ....................................................................................22 5.6ICT infrastructure ............................................................................................33 4.3Price competitiveness in the T&T industry...............................................122 3.6
T&T human, cultural, and natural resources ...............................................52 4.1Human resources ............................................................................................37 5.4
Education and training .............................................................................37 5.1Availability of qualified labor...................................................................35 5.6
Affinity for Travel & Tourism ............................................................................7 6.2Natural resources .........................................................................................133 1.8Cultural resources...........................................................................................35 3.2
Note: For descriptions of variables and detailed sources, please refer to “How to the Read Country/Economy Profiles.”
Rank Score(out of 133) (1–7 scale)
International tourist arrivals (thousands)
International tourism receipts (US$ millions)
1995 1996 1997 1998 1999 2000 2001 2002 2003 2004 2005 2006 2007300
600
900
1,200
1,500
1 2 3 4 5 6 7
2009–2018Percent annual growth of total (%, forecast)
part2A_profiles.r2 2/26/09 4:01 AM Page 266
The Travel & Tourism Competitiveness Report 2009 © 2009 World Economic Forum

267
2.1:
Cou
ntry
/Eco
nom
y Pr
ofile
s
The Travel & Tourism Competitiveness Index in detail ■ Competitive Advantage ■ Competitive Disadvantage
INDICATOR RANK/133
1st pillar: Policy rules and regulations1.01 Prevalence of foreign ownership .................................27 ...■1.02 Property rights..............................................................32 ...■1.03 Business impact of rules on FDI ....................................7 ...■1.04 Visa requirements* ......................................................40 ...■1.05 Openness of bilateral Air Service Agreements* ..........73 ...■1.06 Transparency of government policymaking..................42 ...■1.07 Time required to start a business*..............................n/a ......1.08 Cost to start a business*.............................................n/a ......
2nd pillar: Environmental sustainability2.01 Stringency of environmental regulation .......................83 ...■2.02 Enforcement of environmental regulation....................96 ...■2.03 Sustainability of T&T industry development.................66 ...■2.04 Carbon dioxide emissions* ..........................................85 ...■2.05 Particulate matter concentration* ...............................n/a ......2.06 Threatened species* ....................................................30 ...■2.07 Environmental treaty ratification*.................................67 ...■
3rd pillar: Safety and security3.01 Business costs of terrorism .........................................11 ...■3.02 Reliability of police services .........................................29 ...■3.03 Business costs of crime and violence..........................13 ...■3.04 Road traffic accidents*...................................................1 ...■
4th pillar: Health and hygiene4.01 Physician density*..........................................................7 ...■4.02 Access to improved sanitation* ..................................n/a ......4.03 Access to improved drinking water*..............................1 ...■4.04 Hospital beds*..............................................................11 ...■
5th pillar: Prioritization of Travel & Tourism5.01 Government prioritization of the T&T industry...............5 ...■5.02 T&T government expenditure* ......................................6 ...■5.03 Effectiveness of marketing and branding.....................47 ...■5.04 T&T fair attendance*....................................................81 ...■
6th pillar: Air transport infrastructure6.01 Quality of air transport infrastructure ...........................35 ...■6.02 Available seat kilometers, domestic*...........................99 ...■6.03 Available seat kilometers, international* ......................86 ...■6.04 Departures per 1,000 population*..................................8 ...■6.05 Airport density* ..............................................................8 ...■6.06 Number of operating airlines*......................................81 ...■6.07 International air transport network ...............................56 ...■
7th pillar: Ground transport infrastructure7.01 Quality of roads ............................................................75 ...■7.02 Quality of railroad infrastructure ..................................n/a ......7.03 Quality of port infrastructure ........................................28 ...■7.04 Quality of ground transport network..........................104 ...■7.05 Road density*.................................................................1 ...■
INDICATOR RANK/133
8th pillar: Tourism infrastructure8.01 Hotel rooms*..................................................................2 ...■8.02 Presence of major car rental companies*....................23 ...■8.03 ATMs accepting Visa cards* ........................................35 ...■
9th pillar: ICT infrastructure9.01 Extent of business Internet use...................................34 ...■9.02 Internet users* .............................................................44 ...■9.03 Telephone lines*...........................................................18 ...■9.04 Broadband Internet subscribers* .................................32 ...■9.05 Mobile telephone subscribers*....................................48 ...■
10th pillar: Price competitiveness in the T&T industry10.01 Ticket taxes and airport charges*.................................89 ...■10.02 Purchasing power parity*...........................................133 ...■10.03 Extent and effect of taxation........................................48 ...■10.04 Fuel price levels* .......................................................106 ...■10.05 Hotel price index* ........................................................40 ...■
11th pillar: Human resources11.01 Primary education enrollment* ....................................78 ...■11.02 Secondary education enrollment*................................29 ...■11.03 Quality of the educational system................................24 ...■11.04 Local availability of research and training services.......96 ...■11.05 Extent of staff training..................................................45 ...■11.06 Hiring and firing practices...........................................107 ...■11.07 Ease of hiring foreign labor ..........................................65 ...■11.08 HIV prevalence* ...........................................................22 ...■11.09 Business impact of HIV/AIDS.......................................36 ...■11.10 Life expectancy* ..........................................................22 ...■
12th pillar: Affinity for Travel & Tourism12.01 Tourism openness* ........................................................9 ...■12.02 Attitude of population toward foreign visitors................4 ...■12.03 Extension of business trips recommended .................20 ...■
13th pillar: Natural resources13.01 Number of World Heritage natural sites* ....................74 ...■13.02 Protected areas* ........................................................118 ...■13.03 Quality of the natural environment.............................114 ...■13.04 Total known species*.................................................131 ...■
14th pillar: Cultural resources14.01 Number of World Heritage cultural sites* ...................65 ...■14.02 Sports stadiums* ...........................................................7 ...■14.03 Number of international fairs and exhibitions* ............55 ...■14.04 Creative industries exports*.........................................61 ...■
Malta
* Hard data
Note: For further details and explanation, please refer to the section “How toRead the Country/Economy Profiles” at the beginning of this chapter.
part2A_profiles.r2 2/26/09 4:01 AM Page 267
The Travel & Tourism Competitiveness Report 2009 © 2009 World Economic Forum

268
2.1:
Cou
ntry
/Eco
nom
y Pr
ofile
s
MauritaniaKey indicatorsPopulation (millions), 2007..............................................................................3.2Surface area (1,000 square kilometers) ...................................................1,030.7
Gross domestic product (US$ billions), 2007 .................................................2.8Gross domestic product (PPP, US$) per capita, 2007 .............................2,011.5Real GDP growth (percent), 2007...................................................................1.0
Environmental Performance Index, 2008 (out of 149 countries)...................146
Travel & Tourism indicators
T&T industry, 2008 estimatesGDP (US$ millions) .................................................................n/a ...................n/a ....................n/aEmployment (1,000 jobs)........................................................n/a ...................n/a ....................n/a
T&T economy, 2008 estimatesGDP (US$ millions) .................................................................n/a ...................n/a ....................n/aEmployment (1,000 jobs)........................................................n/a ...................n/a ....................n/a
Source: World Travel & Tourism Council, TSA Research 2008
International tourist arrivals (thousands), 2000........................30International tourism receipts (US$ millions), 1999 ................28
Source: United Nations World Tourism Organization
Travel & Tourism Competitiveness Index
2009 Index....................................................................................................127 3.12008 Index..........................................................................................................122 3.1T&T regulatory framework ............................................................................123 3.6
Policy rules and regulations........................................................................107 3.8Environmental sustainability..........................................................................96 4.2Safety and security .........................................................................................75 5.0Health and hygiene .......................................................................................128 1.4Prioritization of Travel & Tourism................................................................100 3.7
T&T business environment and infrastructure ..........................................127 2.5Air transport infrastructure ........................................................................128 2.0Ground transport infrastructure..................................................................128 2.2Tourism infrastructure ..................................................................................112 1.6ICT infrastructure ..........................................................................................115 1.8Price competitiveness in the T&T industry.................................................54 4.9
T&T human, cultural, and natural resources .............................................129 3.1Human resources ..........................................................................................119 4.0
Education and training ...........................................................................128 2.9Availability of qualified labor.................................................................106 5.0
Affinity for Travel & Tourism ..........................................................................76 4.6Natural resources ...........................................................................................98 2.7Cultural resources.........................................................................................127 1.2
Note: For descriptions of variables and detailed sources, please refer to “How to the Read Country/Economy Profiles.”
Rank Score(out of 133) (1–7 scale)
International tourist arrivals (thousands)
International tourism receipts (US$ millions)
1995 1996 1997 1998 1999 2000 2001 2002 2003 2004 2005 2006 200710
15
20
25
30
1 2 3 4 5 6 7
2009–2018Percent annual growth of total (%, forecast)
part2A_profiles.r2 2/26/09 4:01 AM Page 268
The Travel & Tourism Competitiveness Report 2009 © 2009 World Economic Forum

269
2.1:
Cou
ntry
/Eco
nom
y Pr
ofile
s
The Travel & Tourism Competitiveness Index in detail ■ Competitive Advantage ■ Competitive Disadvantage
INDICATOR RANK/133
1st pillar: Policy rules and regulations1.01 Prevalence of foreign ownership ...............................128 ...■1.02 Property rights..............................................................99 ...■1.03 Business impact of rules on FDI ..................................96 ...■1.04 Visa requirements* ......................................................98 ...■1.05 Openness of bilateral Air Service Agreements* ..........85 ...■1.06 Transparency of government policymaking..................81 ...■1.07 Time required to start a business*...............................57 ...■1.08 Cost to start a business* .............................................98 ...■
2nd pillar: Environmental sustainability2.01 Stringency of environmental regulation .....................113 ...■2.02 Enforcement of environmental regulation..................105 ...■2.03 Sustainability of T&T industry development.................85 ...■2.04 Carbon dioxide emissions* ..........................................32 ...■2.05 Particulate matter concentration* ..............................120 ...■2.06 Threatened species* ....................................................53 ...■2.07 Environmental treaty ratification*.................................34 ...■
3rd pillar: Safety and security3.01 Business costs of terrorism .......................................109 ...■3.02 Reliability of police services .........................................87 ...■3.03 Business costs of crime and violence..........................75 ...■3.04 Road traffic accidents*.................................................56 ...■
4th pillar: Health and hygiene4.01 Physician density*......................................................119 ...■4.02 Access to improved sanitation* .................................120 ...■4.03 Access to improved drinking water*..........................118 ...■4.04 Hospital beds*............................................................122 ...■
5th pillar: Prioritization of Travel & Tourism5.01 Government prioritization of the T&T industry.............79 ...■5.02 T&T government expenditure* ...................................n/a ......5.03 Effectiveness of marketing and branding...................101 ...■5.04 T&T fair attendance*..................................................115 ...■
6th pillar: Air transport infrastructure6.01 Quality of air transport infrastructure .........................128 ...■6.02 Available seat kilometers, domestic*.........................100 ...■6.03 Available seat kilometers, international* ....................127 ...■6.04 Departures per 1,000 population*..............................102 ...■6.05 Airport density* ............................................................72 ...■6.06 Number of operating airlines*....................................124 ...■6.07 International air transport network .............................122 ...■
7th pillar: Ground transport infrastructure7.01 Quality of roads ..........................................................121 ...■7.02 Quality of railroad infrastructure...................................97 ...■7.03 Quality of port infrastructure ......................................116 ...■7.04 Quality of ground transport network..........................117 ...■7.05 Road density*.............................................................130 ...■
INDICATOR RANK/133
8th pillar: Tourism infrastructure8.01 Hotel rooms*...............................................................n/a ......8.02 Presence of major car rental companies*....................95 ...■8.03 ATMs accepting Visa cards* ......................................124 ...■
9th pillar: ICT infrastructure9.01 Extent of business Internet use.................................113 ...■9.02 Internet users* ...........................................................123 ...■9.03 Telephone lines*.........................................................118 ...■9.04 Broadband Internet subscribers* ...............................111 ...■9.05 Mobile telephone subscribers*....................................92 ...■
10th pillar: Price competitiveness in the T&T industry10.01 Ticket taxes and airport charges*...............................113 ...■10.02 Purchasing power parity*.............................................24 ...■10.03 Extent and effect of taxation........................................43 ...■10.04 Fuel price levels* .........................................................62 ...■10.05 Hotel price index* .......................................................n/a ......
11th pillar: Human resources11.01 Primary education enrollment* ..................................111 ...■11.02 Secondary education enrollment*..............................123 ...■11.03 Quality of the educational system..............................128 ...■11.04 Local availability of research and training services.....129 ...■11.05 Extent of staff training................................................129 ...■11.06 Hiring and firing practices.............................................63 ...■11.07 Ease of hiring foreign labor ..........................................69 ...■11.08 HIV prevalence* ...........................................................94 ...■11.09 Business impact of HIV/AIDS.....................................102 ...■11.10 Life expectancy* ........................................................113 ...■
12th pillar: Affinity for Travel & Tourism12.01 Tourism openness* ......................................................65 ...■12.02 Attitude of population toward foreign visitors..............84 ...■12.03 Extension of business trips recommended .................94 ...■
13th pillar: Natural resources13.01 Number of World Heritage natural sites* ....................40 ...■13.02 Protected areas* ........................................................117 ...■13.03 Quality of the natural environment...............................78 ...■13.04 Total known species*...................................................60 ...■
14th pillar: Cultural resources14.01 Number of World Heritage cultural sites* ...................97 ...■14.02 Sports stadiums* .........................................................98 ...■14.03 Number of international fairs and exhibitions* ..........122 ...■14.04 Creative industries exports*.......................................118 ...■
Mauritania
* Hard data
Note: For further details and explanation, please refer to the section “How toRead the Country/Economy Profiles” at the beginning of this chapter.
part2A_profiles.r2 2/26/09 4:01 AM Page 269
The Travel & Tourism Competitiveness Report 2009 © 2009 World Economic Forum

270
2.1:
Cou
ntry
/Eco
nom
y Pr
ofile
s
MauritiusKey indicatorsPopulation (millions), 2007..............................................................................1.3Surface area (1,000 square kilometers) ..........................................................2.0
Gross domestic product (US$ billions), 2007 .................................................6.9Gross domestic product (PPP, US$) per capita, 2007 ...........................11,126.0Real GDP growth (percent), 2007...................................................................4.2
Environmental Performance Index, 2008 (out of 149 countries).....................58
Travel & Tourism indicators
T&T industry, 2008 estimatesGDP (US$ millions) .............................................................1,089.................13.9 ....................3.1Employment (1,000 jobs).........................................................87.................16.2 ....................0.7
T&T economy, 2008 estimatesGDP (US$ millions) .............................................................2,361.................30.2 ....................3.2Employment (1,000 jobs).......................................................174.................32.4 ....................0.7
Source: World Travel & Tourism Council, TSA Research 2008
International tourist arrivals (thousands), 2007......................907International tourism receipts (US$ millions), 2007 ...........1,299
Source: United Nations World Tourism Organization
Travel & Tourism Competitiveness Index
2009 Index......................................................................................................40 4.42008 Index............................................................................................................41 4.4T&T regulatory framework ..............................................................................24 5.4
Policy rules and regulations..........................................................................13 5.3Environmental sustainability..........................................................................53 4.7Safety and security .........................................................................................40 5.8Health and hygiene .........................................................................................60 4.9Prioritization of Travel & Tourism....................................................................1 6.3
T&T business environment and infrastructure ............................................44 4.0Air transport infrastructure ..........................................................................49 3.5Ground transport infrastructure....................................................................31 4.6Tourism infrastructure ....................................................................................53 3.8ICT infrastructure ............................................................................................59 3.1Price competitiveness in the T&T industry.................................................26 5.2
T&T human, cultural, and natural resources ...............................................69 3.9Human resources ............................................................................................45 5.2
Education and training .............................................................................49 5.0Availability of qualified labor...................................................................58 5.5
Affinity for Travel & Tourism ............................................................................3 6.6Natural resources .........................................................................................130 2.0Cultural resources...........................................................................................99 1.6
Note: For descriptions of variables and detailed sources, please refer to “How to the Read Country/Economy Profiles.”
Rank Score(out of 133) (1–7 scale)
International tourist arrivals (thousands)
International tourism receipts (US$ millions)
1995 1996 1997 1998 1999 2000 2001 2002 2003 2004 2005 2006 2007300
600
900
1,200
1,500
1 2 3 4 5 6 7
2009–2018Percent annual growth of total (%, forecast)
part2A_profiles.r2 2/26/09 4:01 AM Page 270
The Travel & Tourism Competitiveness Report 2009 © 2009 World Economic Forum

271
2.1:
Cou
ntry
/Eco
nom
y Pr
ofile
s
The Travel & Tourism Competitiveness Index in detail ■ Competitive Advantage ■ Competitive Disadvantage
INDICATOR RANK/133
1st pillar: Policy rules and regulations1.01 Prevalence of foreign ownership .................................43 ...■1.02 Property rights..............................................................22 ...■1.03 Business impact of rules on FDI ....................................8 ...■1.04 Visa requirements* ........................................................8 ...■1.05 Openness of bilateral Air Service Agreements* ........104 ...■1.06 Transparency of government policymaking..................30 ...■1.07 Time required to start a business*.................................9 ...■1.08 Cost to start a business* .............................................40 ...■
2nd pillar: Environmental sustainability2.01 Stringency of environmental regulation .......................61 ...■2.02 Enforcement of environmental regulation....................50 ...■2.03 Sustainability of T&T industry development.................13 ...■2.04 Carbon dioxide emissions* ..........................................58 ...■2.05 Particulate matter concentration* ................................14 ...■2.06 Threatened species* ..................................................131 ...■2.07 Environmental treaty ratification*.................................34 ...■
3rd pillar: Safety and security3.01 Business costs of terrorism ...........................................5 ...■3.02 Reliability of police services .........................................66 ...■3.03 Business costs of crime and violence..........................55 ...■3.04 Road traffic accidents*.................................................16 ...■
4th pillar: Health and hygiene4.01 Physician density*........................................................88 ...■4.02 Access to improved sanitation* ...................................48 ...■4.03 Access to improved drinking water*..............................1 ...■4.04 Hospital beds*..............................................................57 ...■
5th pillar: Prioritization of Travel & Tourism5.01 Government prioritization of the T&T industry...............1 ...■5.02 T&T government expenditure* ......................................3 ...■5.03 Effectiveness of marketing and branding.......................2 ...■5.04 T&T fair attendance*....................................................25 ...■
6th pillar: Air transport infrastructure6.01 Quality of air transport infrastructure ...........................42 ...■6.02 Available seat kilometers, domestic*...........................65 ...■6.03 Available seat kilometers, international* ......................56 ...■6.04 Departures per 1,000 population*................................33 ...■6.05 Airport density* ............................................................28 ...■6.06 Number of operating airlines*......................................89 ...■6.07 International air transport network ...............................34 ...■
7th pillar: Ground transport infrastructure7.01 Quality of roads ............................................................43 ...■7.02 Quality of railroad infrastructure ..................................n/a ......7.03 Quality of port infrastructure ........................................47 ...■7.04 Quality of ground transport network ............................59 ...■7.05 Road density*...............................................................33 ...■
INDICATOR RANK/133
8th pillar: Tourism infrastructure8.01 Hotel rooms*................................................................35 ...■8.02 Presence of major car rental companies*....................56 ...■8.03 ATMs accepting Visa cards* ........................................56 ...■
9th pillar: ICT infrastructure9.01 Extent of business Internet use...................................65 ...■9.02 Internet users* .............................................................54 ...■9.03 Telephone lines*...........................................................45 ...■9.04 Broadband Internet subscribers* .................................69 ...■9.05 Mobile telephone subscribers*....................................73 ...■
10th pillar: Price competitiveness in the T&T industry10.01 Ticket taxes and airport charges*.................................83 ...■10.02 Purchasing power parity*.............................................26 ...■10.03 Extent and effect of taxation..........................................8 ...■10.04 Fuel price levels* .........................................................27 ...■10.05 Hotel price index* ........................................................87 ...■
11th pillar: Human resources11.01 Primary education enrollment* ....................................51 ...■11.02 Secondary education enrollment*................................63 ...■11.03 Quality of the educational system................................47 ...■11.04 Local availability of research and training services.......90 ...■11.05 Extent of staff training..................................................36 ...■11.06 Hiring and firing practices...........................................109 ...■11.07 Ease of hiring foreign labor ..........................................25 ...■11.08 HIV prevalence* .........................................................113 ...■11.09 Business impact of HIV/AIDS.......................................65 ...■11.10 Life expectancy* ..........................................................55 ...■
12th pillar: Affinity for Travel & Tourism12.01 Tourism openness* ........................................................3 ...■12.02 Attitude of population toward foreign visitors..............17 ...■12.03 Extension of business trips recommended .................23 ...■
13th pillar: Natural resources13.01 Number of World Heritage natural sites* ....................74 ...■13.02 Protected areas* ........................................................124 ...■13.03 Quality of the natural environment...............................46 ...■13.04 Total known species*.................................................133 ...■
14th pillar: Cultural resources14.01 Number of World Heritage cultural sites* ...................82 ...■14.02 Sports stadiums* .........................................................74 ...■14.03 Number of international fairs and exhibitions* ............91 ...■14.04 Creative industries exports*.........................................69 ...■
Mauritius
* Hard data
Note: For further details and explanation, please refer to the section “How toRead the Country/Economy Profiles” at the beginning of this chapter.
part2A_profiles.r2 2/26/09 4:01 AM Page 271
The Travel & Tourism Competitiveness Report 2009 © 2009 World Economic Forum

272
2.1:
Cou
ntry
/Eco
nom
y Pr
ofile
s
MexicoKey indicatorsPopulation (millions), 2007..........................................................................109.6Surface area (1,000 square kilometers) ...................................................1,964.4
Gross domestic product (US$ billions), 2007 ..........................................1,022.8Gross domestic product (PPP, US$) per capita, 2007 ...........................14,119.8Real GDP growth (percent), 2007...................................................................3.2
Environmental Performance Index, 2008 (out of 149 countries).....................47
Travel & Tourism indicators
T&T industry, 2008 estimatesGDP (US$ millions) ...........................................................44,624...................4.8 ....................3.5Employment (1,000 jobs)....................................................2,058...................4.4 ....................1.4
T&T economy, 2008 estimatesGDP (US$ millions) .........................................................130,199.................14.0 ....................4.4Employment (1,000 jobs)....................................................6,633.................14.3 ....................2.0
Source: World Travel & Tourism Council, TSA Research 2008
International tourist arrivals (thousands), 2007.................21,424International tourism receipts (US$ millions), 2007 .........12,901
Source: United Nations World Tourism Organization
Travel & Tourism Competitiveness Index
2009 Index......................................................................................................51 4.32008 Index............................................................................................................55 4.2T&T regulatory framework ..............................................................................80 4.3
Policy rules and regulations..........................................................................58 4.5Environmental sustainability........................................................................101 4.1Safety and security .......................................................................................126 3.6Health and hygiene .........................................................................................74 4.4Prioritization of Travel & Tourism..................................................................35 5.0
T&T business environment and infrastructure ............................................62 3.7Air transport infrastructure ..........................................................................40 4.0Ground transport infrastructure....................................................................84 3.1Tourism infrastructure ....................................................................................49 3.9ICT infrastructure ............................................................................................69 2.8Price competitiveness in the T&T industry.................................................77 4.6
T&T human, cultural, and natural resources ...............................................13 4.9Human resources ............................................................................................63 5.1
Education and training .............................................................................65 4.7Availability of qualified labor...................................................................64 5.5
Affinity for Travel & Tourism ..........................................................................90 4.6Natural resources ...........................................................................................18 4.7Cultural resources...........................................................................................20 5.1
Note: For descriptions of variables and detailed sources, please refer to “How to the Read Country/Economy Profiles.”
Rank Score(out of 133) (1–7 scale)
International tourist arrivals (thousands)
International tourism receipts (US$ millions)
1995 1996 1997 1998 1999 2000 2001 2002 2003 2004 2005 2006 20075,000
10,000
15,000
20,000
25,000
1 2 3 4 5 6 7
2009–2018Percent annual growth of total (%, forecast)
part2A_profiles.r2 2/26/09 4:01 AM Page 272
The Travel & Tourism Competitiveness Report 2009 © 2009 World Economic Forum
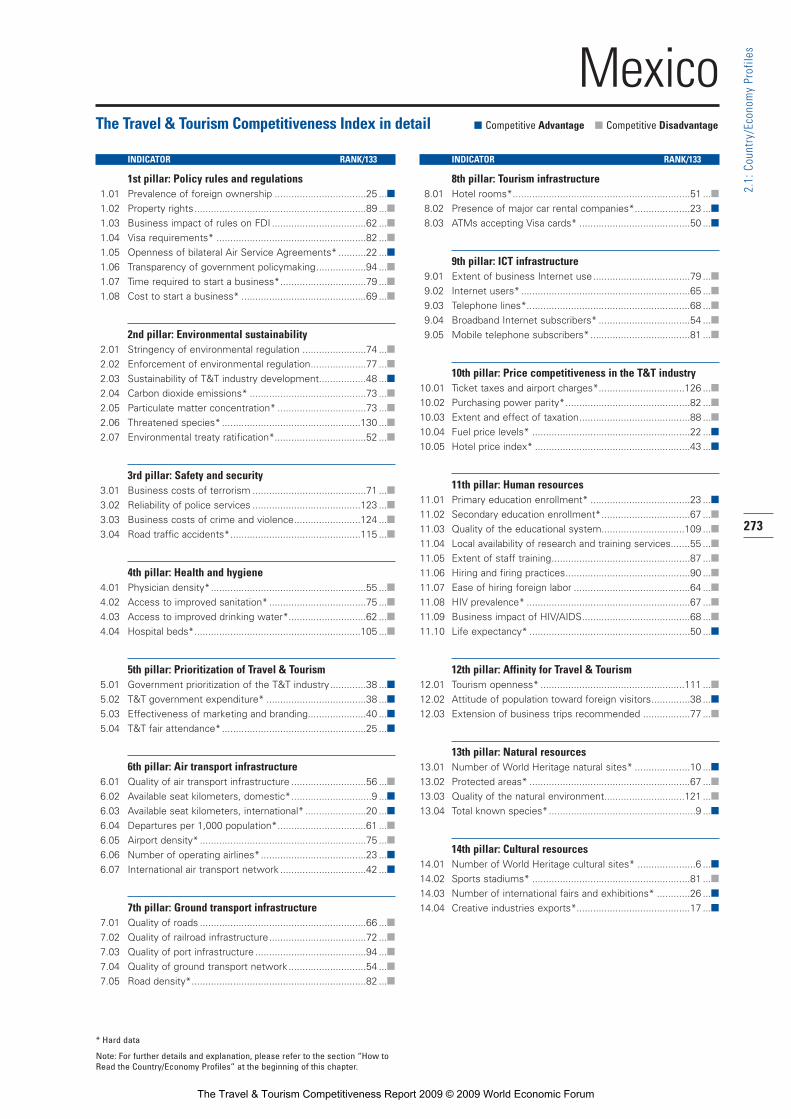
273
2.1:
Cou
ntry
/Eco
nom
y Pr
ofile
s
The Travel & Tourism Competitiveness Index in detail ■ Competitive Advantage ■ Competitive Disadvantage
INDICATOR RANK/133
1st pillar: Policy rules and regulations1.01 Prevalence of foreign ownership .................................25 ...■1.02 Property rights..............................................................89 ...■1.03 Business impact of rules on FDI ..................................62 ...■1.04 Visa requirements* ......................................................82 ...■1.05 Openness of bilateral Air Service Agreements* ..........22 ...■1.06 Transparency of government policymaking..................94 ...■1.07 Time required to start a business*...............................79 ...■1.08 Cost to start a business* .............................................69 ...■
2nd pillar: Environmental sustainability2.01 Stringency of environmental regulation .......................74 ...■2.02 Enforcement of environmental regulation....................77 ...■2.03 Sustainability of T&T industry development.................48 ...■2.04 Carbon dioxide emissions* ..........................................73 ...■2.05 Particulate matter concentration* ................................73 ...■2.06 Threatened species* ..................................................130 ...■2.07 Environmental treaty ratification*.................................52 ...■
3rd pillar: Safety and security3.01 Business costs of terrorism .........................................71 ...■3.02 Reliability of police services .......................................123 ...■3.03 Business costs of crime and violence........................124 ...■3.04 Road traffic accidents*...............................................115 ...■
4th pillar: Health and hygiene4.01 Physician density*........................................................55 ...■4.02 Access to improved sanitation* ...................................75 ...■4.03 Access to improved drinking water*............................62 ...■4.04 Hospital beds*............................................................105 ...■
5th pillar: Prioritization of Travel & Tourism5.01 Government prioritization of the T&T industry.............38 ...■5.02 T&T government expenditure* ....................................38 ...■5.03 Effectiveness of marketing and branding.....................40 ...■5.04 T&T fair attendance*....................................................25 ...■
6th pillar: Air transport infrastructure6.01 Quality of air transport infrastructure ...........................56 ...■6.02 Available seat kilometers, domestic*.............................9 ...■6.03 Available seat kilometers, international* ......................20 ...■6.04 Departures per 1,000 population*................................61 ...■6.05 Airport density* ............................................................75 ...■6.06 Number of operating airlines*......................................23 ...■6.07 International air transport network ...............................42 ...■
7th pillar: Ground transport infrastructure7.01 Quality of roads ............................................................66 ...■7.02 Quality of railroad infrastructure...................................72 ...■7.03 Quality of port infrastructure ........................................94 ...■7.04 Quality of ground transport network ............................54 ...■7.05 Road density*...............................................................82 ...■
INDICATOR RANK/133
8th pillar: Tourism infrastructure8.01 Hotel rooms*................................................................51 ...■8.02 Presence of major car rental companies*....................23 ...■8.03 ATMs accepting Visa cards* ........................................50 ...■
9th pillar: ICT infrastructure9.01 Extent of business Internet use...................................79 ...■9.02 Internet users* .............................................................65 ...■9.03 Telephone lines*...........................................................68 ...■9.04 Broadband Internet subscribers* .................................54 ...■9.05 Mobile telephone subscribers*....................................81 ...■
10th pillar: Price competitiveness in the T&T industry10.01 Ticket taxes and airport charges*...............................126 ...■10.02 Purchasing power parity*.............................................82 ...■10.03 Extent and effect of taxation........................................88 ...■10.04 Fuel price levels* .........................................................22 ...■10.05 Hotel price index* ........................................................43 ...■
11th pillar: Human resources11.01 Primary education enrollment* ....................................23 ...■11.02 Secondary education enrollment*................................67 ...■11.03 Quality of the educational system..............................109 ...■11.04 Local availability of research and training services.......55 ...■11.05 Extent of staff training..................................................87 ...■11.06 Hiring and firing practices.............................................90 ...■11.07 Ease of hiring foreign labor ..........................................64 ...■11.08 HIV prevalence* ...........................................................67 ...■11.09 Business impact of HIV/AIDS.......................................68 ...■11.10 Life expectancy* ..........................................................50 ...■
12th pillar: Affinity for Travel & Tourism12.01 Tourism openness* ....................................................111 ...■12.02 Attitude of population toward foreign visitors..............38 ...■12.03 Extension of business trips recommended .................77 ...■
13th pillar: Natural resources13.01 Number of World Heritage natural sites* ....................10 ...■13.02 Protected areas* ..........................................................67 ...■13.03 Quality of the natural environment.............................121 ...■13.04 Total known species*.....................................................9 ...■
14th pillar: Cultural resources14.01 Number of World Heritage cultural sites* .....................6 ...■14.02 Sports stadiums* .........................................................81 ...■14.03 Number of international fairs and exhibitions* ............26 ...■14.04 Creative industries exports*.........................................17 ...■
Mexico
* Hard data
Note: For further details and explanation, please refer to the section “How toRead the Country/Economy Profiles” at the beginning of this chapter.
part2A_profiles.r2 2/26/09 4:01 AM Page 273
The Travel & Tourism Competitiveness Report 2009 © 2009 World Economic Forum

274
2.1:
Cou
ntry
/Eco
nom
y Pr
ofile
s
MoldovaKey indicatorsPopulation (millions), 2007..............................................................................4.2Surface area (1,000 square kilometers) ........................................................33.8
Gross domestic product (US$ billions), 2007 .................................................4.4Gross domestic product (PPP, US$) per capita, 2007 .............................2,897.4Real GDP growth (percent), 2007...................................................................4.0
Environmental Performance Index, 2008 (out of 149 countries).....................87
Travel & Tourism indicators
T&T industry, 2008 estimatesGDP (US$ millions) .................................................................n/a ...................n/a ....................n/aEmployment (1,000 jobs)........................................................n/a ...................n/a ....................n/a
T&T economy, 2008 estimatesGDP (US$ millions) .................................................................n/a ...................n/a ....................n/aEmployment (1,000 jobs)........................................................n/a ...................n/a ....................n/a
Source: World Travel & Tourism Council, TSA Research 2008
International tourist arrivals (thousands), 2007........................13International tourism receipts (US$ millions), 2007 ..............164
Source: United Nations World Tourism Organization
Travel & Tourism Competitiveness Index
2009 Index......................................................................................................93 3.62008 Index............................................................................................................98 3.6T&T regulatory framework ..............................................................................67 4.5
Policy rules and regulations..........................................................................82 4.2Environmental sustainability..........................................................................82 4.3Safety and security .........................................................................................52 5.4Health and hygiene .........................................................................................48 5.5Prioritization of Travel & Tourism................................................................118 3.3
T&T business environment and infrastructure ............................................95 2.9Air transport infrastructure ........................................................................122 2.1Ground transport infrastructure..................................................................111 2.6Tourism infrastructure ....................................................................................90 2.1ICT infrastructure ............................................................................................73 2.7Price competitiveness in the T&T industry.................................................22 5.3
T&T human, cultural, and natural resources .............................................110 3.4Human resources ............................................................................................80 4.9
Education and training .............................................................................94 4.3Availability of qualified labor...................................................................40 5.6
Affinity for Travel & Tourism ..........................................................................30 5.3Natural resources .........................................................................................122 2.2Cultural resources.........................................................................................120 1.3
Note: For descriptions of variables and detailed sources, please refer to “How to the Read Country/Economy Profiles.”
Rank Score(out of 133) (1–7 scale)
International tourist arrivals (thousands)
International tourism receipts (US$ millions)
1995 1996 1997 1998 1999 2000 2001 2002 2003 2004 2005 2006 20070
50
100
150
200
1 2 3 4 5 6 7
2009–2018Percent annual growth of total (%, forecast)
part2A_profiles.r2 2/26/09 4:01 AM Page 274
The Travel & Tourism Competitiveness Report 2009 © 2009 World Economic Forum

275
2.1:
Cou
ntry
/Eco
nom
y Pr
ofile
s
The Travel & Tourism Competitiveness Index in detail ■ Competitive Advantage ■ Competitive Disadvantage
INDICATOR RANK/133
1st pillar: Policy rules and regulations1.01 Prevalence of foreign ownership ...............................117 ...■1.02 Property rights..............................................................98 ...■1.03 Business impact of rules on FDI ..................................94 ...■1.04 Visa requirements* ......................................................85 ...■1.05 Openness of bilateral Air Service Agreements* ........120 ...■1.06 Transparency of government policymaking..................87 ...■1.07 Time required to start a business*...............................41 ...■1.08 Cost to start a business* .............................................59 ...■
2nd pillar: Environmental sustainability2.01 Stringency of environmental regulation .....................128 ...■2.02 Enforcement of environmental regulation..................104 ...■2.03 Sustainability of T&T industry development...............124 ...■2.04 Carbon dioxide emissions* ..........................................52 ...■2.05 Particulate matter concentration* ................................72 ...■2.06 Threatened species* ....................................................56 ...■2.07 Environmental treaty ratification*.................................81 ...■
3rd pillar: Safety and security3.01 Business costs of terrorism .........................................31 ...■3.02 Reliability of police services .......................................112 ...■3.03 Business costs of crime and violence..........................46 ...■3.04 Road traffic accidents*.................................................45 ...■
4th pillar: Health and hygiene4.01 Physician density*........................................................36 ...■4.02 Access to improved sanitation* ...................................78 ...■4.03 Access to improved drinking water*............................79 ...■4.04 Hospital beds*..............................................................21 ...■
5th pillar: Prioritization of Travel & Tourism5.01 Government prioritization of the T&T industry...........117 ...■5.02 T&T government expenditure* ...................................n/a ......5.03 Effectiveness of marketing and branding...................127 ...■5.04 T&T fair attendance*....................................................98 ...■
6th pillar: Air transport infrastructure6.01 Quality of air transport infrastructure ...........................93 ...■6.02 Available seat kilometers, domestic*.........................100 ...■6.03 Available seat kilometers, international* ....................120 ...■6.04 Departures per 1,000 population*................................90 ...■6.05 Airport density* ..........................................................112 ...■6.06 Number of operating airlines*....................................117 ...■6.07 International air transport network .............................123 ...■
7th pillar: Ground transport infrastructure7.01 Quality of roads ..........................................................132 ...■7.02 Quality of railroad infrastructure...................................62 ...■7.03 Quality of port infrastructure ......................................130 ...■7.04 Quality of ground transport network ............................87 ...■7.05 Road density*...............................................................57 ...■
INDICATOR RANK/133
8th pillar: Tourism infrastructure8.01 Hotel rooms*..............................................................110 ...■8.02 Presence of major car rental companies*....................73 ...■8.03 ATMs accepting Visa cards* ........................................81 ...■
9th pillar: ICT infrastructure9.01 Extent of business Internet use...................................84 ...■9.02 Internet users* .............................................................73 ...■9.03 Telephone lines*...........................................................44 ...■9.04 Broadband Internet subscribers* .................................77 ...■9.05 Mobile telephone subscribers*....................................89 ...■
10th pillar: Price competitiveness in the T&T industry10.01 Ticket taxes and airport charges*...............................108 ...■10.02 Purchasing power parity*.............................................29 ...■10.03 Extent and effect of taxation........................................99 ...■10.04 Fuel price levels* .........................................................11 ...■10.05 Hotel price index* ........................................................10 ...■
11th pillar: Human resources11.01 Primary education enrollment* ..................................103 ...■11.02 Secondary education enrollment*................................59 ...■11.03 Quality of the educational system................................90 ...■11.04 Local availability of research and training services.....122 ...■11.05 Extent of staff training................................................111 ...■11.06 Hiring and firing practices.............................................33 ...■11.07 Ease of hiring foreign labor ..........................................31 ...■11.08 HIV prevalence* ...........................................................73 ...■11.09 Business impact of HIV/AIDS.......................................57 ...■11.10 Life expectancy* ..........................................................89 ...■
12th pillar: Affinity for Travel & Tourism12.01 Tourism openness* ......................................................28 ...■12.02 Attitude of population toward foreign visitors..............64 ...■12.03 Extension of business trips recommended .................24 ...■
13th pillar: Natural resources13.01 Number of World Heritage natural sites* ....................74 ...■13.02 Protected areas* ........................................................118 ...■13.03 Quality of the natural environment...............................56 ...■13.04 Total known species*.................................................120 ...■
14th pillar: Cultural resources14.01 Number of World Heritage cultural sites* ...................97 ...■14.02 Sports stadiums* .........................................................92 ...■14.03 Number of international fairs and exhibitions* ..........122 ...■14.04 Creative industries exports*.........................................77 ...■
Moldova
* Hard data
Note: For further details and explanation, please refer to the section “How toRead the Country/Economy Profiles” at the beginning of this chapter.
part2A_profiles.r2 2/26/09 4:01 AM Page 275
The Travel & Tourism Competitiveness Report 2009 © 2009 World Economic Forum

276
2.1:
Cou
ntry
/Eco
nom
y Pr
ofile
s
MongoliaKey indicatorsPopulation (millions), 2007..............................................................................2.7Surface area (1,000 square kilometers) ...................................................1,566.5
Gross domestic product (US$ billions), 2007 .................................................3.9Gross domestic product (PPP, US$) per capita, 2007 .............................3,222.4Real GDP growth (percent), 2007...................................................................9.9
Environmental Performance Index, 2008 (out of 149 countries)...................100
Travel & Tourism indicators
T&T industry, 2008 estimatesGDP (US$ millions) .................................................................n/a ...................n/a ....................n/aEmployment (1,000 jobs)........................................................n/a ...................n/a ....................n/a
T&T economy, 2008 estimatesGDP (US$ millions) .................................................................n/a ...................n/a ....................n/aEmployment (1,000 jobs)........................................................n/a ...................n/a ....................n/a
Source: World Travel & Tourism Council, TSA Research 2008
International tourist arrivals (thousands), 2007......................452International tourism receipts (US$ millions), 2006 ..............225
Source: United Nations World Tourism Organization
Travel & Tourism Competitiveness Index
2009 Index....................................................................................................105 3.52008 Index..........................................................................................................100 3.5T&T regulatory framework ..............................................................................90 4.2
Policy rules and regulations..........................................................................91 4.0Environmental sustainability........................................................................124 3.7Safety and security .........................................................................................74 5.0Health and hygiene .........................................................................................72 4.4Prioritization of Travel & Tourism..................................................................94 3.8
T&T business environment and infrastructure ..........................................107 2.7Air transport infrastructure ..........................................................................76 2.8Ground transport infrastructure..................................................................130 2.1Tourism infrastructure ..................................................................................108 1.7ICT infrastructure ..........................................................................................105 2.0Price competitiveness in the T&T industry.................................................37 5.0
T&T human, cultural, and natural resources .............................................106 3.5Human resources ............................................................................................96 4.7
Education and training .............................................................................90 4.3Availability of qualified labor.................................................................101 5.1
Affinity for Travel & Tourism ..........................................................................64 4.8Natural resources ...........................................................................................76 3.0Cultural resources.........................................................................................109 1.5
Note: For descriptions of variables and detailed sources, please refer to “How to the Read Country/Economy Profiles.”
Rank Score(out of 133) (1–7 scale)
International tourist arrivals (thousands)
International tourism receipts (US$ millions)
1995 1996 1997 1998 1999 2000 2001 2002 2003 2004 2005 2006 20070
100
200
300
400
500
1 2 3 4 5 6 7
2009–2018Percent annual growth of total (%, forecast)
part2A_profiles.r2 2/26/09 4:01 AM Page 276
The Travel & Tourism Competitiveness Report 2009 © 2009 World Economic Forum

277
2.1:
Cou
ntry
/Eco
nom
y Pr
ofile
s
The Travel & Tourism Competitiveness Index in detail ■ Competitive Advantage ■ Competitive Disadvantage
INDICATOR RANK/133
1st pillar: Policy rules and regulations1.01 Prevalence of foreign ownership .................................74 ...■1.02 Property rights............................................................101 ...■1.03 Business impact of rules on FDI ................................121 ...■1.04 Visa requirements* ....................................................122 ...■1.05 Openness of bilateral Air Service Agreements* ........111 ...■1.06 Transparency of government policymaking................128 ...■1.07 Time required to start a business*...............................33 ...■1.08 Cost to start a business* .............................................34 ...■
2nd pillar: Environmental sustainability2.01 Stringency of environmental regulation .....................131 ...■2.02 Enforcement of environmental regulation..................133 ...■2.03 Sustainability of T&T industry development...............127 ...■2.04 Carbon dioxide emissions* ..........................................62 ...■2.05 Particulate matter concentration* ................................97 ...■2.06 Threatened species* ....................................................92 ...■2.07 Environmental treaty ratification*.................................67 ...■
3rd pillar: Safety and security3.01 Business costs of terrorism .........................................45 ...■3.02 Reliability of police services .......................................115 ...■3.03 Business costs of crime and violence..........................78 ...■3.04 Road traffic accidents*.................................................57 ...■
4th pillar: Health and hygiene4.01 Physician density*........................................................38 ...■4.02 Access to improved sanitation* .................................100 ...■4.03 Access to improved drinking water*..........................109 ...■4.04 Hospital beds*..............................................................20 ...■
5th pillar: Prioritization of Travel & Tourism5.01 Government prioritization of the T&T industry.............99 ...■5.02 T&T government expenditure* ...................................n/a ......5.03 Effectiveness of marketing and branding...................121 ...■5.04 T&T fair attendance*....................................................81 ...■
6th pillar: Air transport infrastructure6.01 Quality of air transport infrastructure .........................130 ...■6.02 Available seat kilometers, domestic*...........................61 ...■6.03 Available seat kilometers, international* ....................117 ...■6.04 Departures per 1,000 population*................................68 ...■6.05 Airport density* ..............................................................7 ...■6.06 Number of operating airlines*....................................123 ...■6.07 International air transport network .............................127 ...■
7th pillar: Ground transport infrastructure7.01 Quality of roads ..........................................................133 ...■7.02 Quality of railroad infrastructure...................................74 ...■7.03 Quality of port infrastructure ......................................125 ...■7.04 Quality of ground transport network..........................112 ...■7.05 Road density*.............................................................125 ...■
INDICATOR RANK/133
8th pillar: Tourism infrastructure8.01 Hotel rooms*...............................................................n/a ......8.02 Presence of major car rental companies*....................95 ...■8.03 ATMs accepting Visa cards* ......................................107 ...■
9th pillar: ICT infrastructure9.01 Extent of business Internet use...................................94 ...■9.02 Internet users* .............................................................86 ...■9.03 Telephone lines*.........................................................103 ...■9.04 Broadband Internet subscribers* .................................99 ...■9.05 Mobile telephone subscribers*..................................110 ...■
10th pillar: Price competitiveness in the T&T industry10.01 Ticket taxes and airport charges*.................................28 ...■10.02 Purchasing power parity*.............................................35 ...■10.03 Extent and effect of taxation........................................64 ...■10.04 Fuel price levels* .........................................................68 ...■10.05 Hotel price index* .......................................................n/a ......
11th pillar: Human resources11.01 Primary education enrollment* ....................................75 ...■11.02 Secondary education enrollment*................................58 ...■11.03 Quality of the educational system..............................124 ...■11.04 Local availability of research and training services.....108 ...■11.05 Extent of staff training................................................113 ...■11.06 Hiring and firing practices.............................................18 ...■11.07 Ease of hiring foreign labor ..........................................98 ...■11.08 HIV prevalence* ...........................................................22 ...■11.09 Business impact of HIV/AIDS.....................................110 ...■11.10 Life expectancy* ..........................................................96 ...■
12th pillar: Affinity for Travel & Tourism12.01 Tourism openness* ......................................................15 ...■12.02 Attitude of population toward foreign visitors............132 ...■12.03 Extension of business trips recommended ...............119 ...■
13th pillar: Natural resources13.01 Number of World Heritage natural sites* ....................40 ...■13.02 Protected areas* ..........................................................53 ...■13.03 Quality of the natural environment.............................118 ...■13.04 Total known species*...................................................71 ...■
14th pillar: Cultural resources14.01 Number of World Heritage cultural sites* ...................65 ...■14.02 Sports stadiums* .......................................................112 ...■14.03 Number of international fairs and exhibitions* ............91 ...■14.04 Creative industries exports*.......................................108 ...■
Mongolia
* Hard data
Note: For further details and explanation, please refer to the section “How toRead the Country/Economy Profiles” at the beginning of this chapter.
part2A_profiles.r2 2/26/09 4:01 AM Page 277
The Travel & Tourism Competitiveness Report 2009 © 2009 World Economic Forum

278
2.1:
Cou
ntry
/Eco
nom
y Pr
ofile
s
MontenegroKey indicatorsPopulation (millions), 2007..............................................................................0.7Surface area (1,000 square kilometers) ........................................................14.0
Gross domestic product (US$ billions), 2007 .................................................3.5Gross domestic product (PPP, US$) per capita, 2007.....................................n/aReal GDP growth (percent), 2007...................................................................9.7
Environmental Performance Index, 2008 (out of 149 countries) ....................n/a
Travel & Tourism indicators
T&T industry, 2008 estimatesGDP (US$ millions) ................................................................425.................12.7 ....................7.7Employment (1,000 jobs).........................................................17.................10.8 ....................4.7
T&T economy, 2008 estimatesGDP (US$ millions) ................................................................823.................24.6 ....................5.6Employment (1,000 jobs).........................................................34.................20.9 ....................2.7
Source: World Travel & Tourism Council, TSA Research 2008
International tourist arrivals (thousands), 2007......................984International tourism receipts (US$ millions), 2007 ..............630
Source: United Nations World Tourism Organization
Travel & Tourism Competitiveness Index
2009 Index......................................................................................................52 4.32008 Index............................................................................................................59 4.2T&T regulatory framework ..............................................................................50 4.9
Policy rules and regulations..........................................................................35 5.0Environmental sustainability..........................................................................98 4.2Safety and security .........................................................................................48 5.5Health and hygiene .........................................................................................52 5.3Prioritization of Travel & Tourism..................................................................69 4.3
T&T business environment and infrastructure ............................................66 3.6Air transport infrastructure ..........................................................................56 3.3Ground transport infrastructure....................................................................88 3.0Tourism infrastructure ....................................................................................64 3.4ICT infrastructure ............................................................................................39 3.9Price competitiveness in the T&T industry.................................................95 4.2
T&T human, cultural, and natural resources ...............................................35 4.4Human resources ............................................................................................40 5.3
Education and training .............................................................................52 4.9Availability of qualified labor...................................................................34 5.6
Affinity for Travel & Tourism ............................................................................1 6.7Natural resources ...........................................................................................80 3.0Cultural resources...........................................................................................51 2.8
Note: For descriptions of variables and detailed sources, please refer to “How to the Read Country/Economy Profiles.”
Rank Score(out of 133) (1–7 scale)
International tourist arrivals (thousands)
International tourism receipts (US$ millions)
1995 1996 1997 1998 1999 2000 2001 2002 2003 2004 2005 2006 2007200
400
600
800
1,000
1 2 3 4 5 6 7
2009–2018Percent annual growth of total (%, forecast)
part2A_profiles.r2 2/26/09 4:01 AM Page 278
The Travel & Tourism Competitiveness Report 2009 © 2009 World Economic Forum

279
2.1:
Cou
ntry
/Eco
nom
y Pr
ofile
s
The Travel & Tourism Competitiveness Index in detail ■ Competitive Advantage ■ Competitive Disadvantage
INDICATOR RANK/133
1st pillar: Policy rules and regulations1.01 Prevalence of foreign ownership .................................65 ...■1.02 Property rights..............................................................64 ...■1.03 Business impact of rules on FDI ..................................37 ...■1.04 Visa requirements* ......................................................72 ...■1.05 Openness of bilateral Air Service Agreements* .........n/a ......1.06 Transparency of government policymaking..................59 ...■1.07 Time required to start a business*...............................63 ...■1.08 Cost to start a business* .............................................37 ...■
2nd pillar: Environmental sustainability2.01 Stringency of environmental regulation .......................68 ...■2.02 Enforcement of environmental regulation....................88 ...■2.03 Sustainability of T&T industry development.................32 ...■2.04 Carbon dioxide emissions* .........................................n/a ......2.05 Particulate matter concentration* ...............................n/a ......2.06 Threatened species* ....................................................60 ...■2.07 Environmental treaty ratification*...............................104 ...■
3rd pillar: Safety and security3.01 Business costs of terrorism .........................................14 ...■3.02 Reliability of police services .........................................58 ...■3.03 Business costs of crime and violence..........................40 ...■3.04 Road traffic accidents*................................................n/a ......
4th pillar: Health and hygiene4.01 Physician density*........................................................52 ...■4.02 Access to improved sanitation* ...................................59 ...■4.03 Access to improved drinking water*............................47 ...■4.04 Hospital beds*..............................................................40 ...■
5th pillar: Prioritization of Travel & Tourism5.01 Government prioritization of the T&T industry.............29 ...■5.02 T&T government expenditure* ....................................62 ...■5.03 Effectiveness of marketing and branding.....................23 ...■5.04 T&T fair attendance*....................................................98 ...■
6th pillar: Air transport infrastructure6.01 Quality of air transport infrastructure ...........................73 ...■6.02 Available seat kilometers, domestic*.........................100 ...■6.03 Available seat kilometers, international* ....................121 ...■6.04 Departures per 1,000 population*................................38 ...■6.05 Airport density* ............................................................16 ...■6.06 Number of operating airlines*....................................112 ...■6.07 International air transport network .............................105 ...■
7th pillar: Ground transport infrastructure7.01 Quality of roads ..........................................................119 ...■7.02 Quality of railroad infrastructure...................................78 ...■7.03 Quality of port infrastructure ........................................75 ...■7.04 Quality of ground transport network ............................91 ...■7.05 Road density*..............................................................n/a ......
INDICATOR RANK/133
8th pillar: Tourism infrastructure8.01 Hotel rooms*...............................................................n/a ......8.02 Presence of major car rental companies*....................56 ...■8.03 ATMs accepting Visa cards* ........................................71 ...■
9th pillar: ICT infrastructure9.01 Extent of business Internet use.................................124 ...■9.02 Internet users* .............................................................32 ...■9.03 Telephone lines*.............................................................6 ...■9.04 Broadband Internet subscribers* .................................53 ...■9.05 Mobile telephone subscribers*....................................34 ...■
10th pillar: Price competitiveness in the T&T industry10.01 Ticket taxes and airport charges*................................n/a ......10.02 Purchasing power parity*.............................................67 ...■10.03 Extent and effect of taxation........................................30 ...■10.04 Fuel price levels* .......................................................109 ...■10.05 Hotel price index* .......................................................n/a ......
11th pillar: Human resources11.01 Primary education enrollment* ....................................30 ...■11.02 Secondary education enrollment*................................39 ...■11.03 Quality of the educational system................................57 ...■11.04 Local availability of research and training services.......78 ...■11.05 Extent of staff training..................................................84 ...■11.06 Hiring and firing practices.............................................87 ...■11.07 Ease of hiring foreign labor ..........................................46 ...■11.08 HIV prevalence* .............................................................1 ...■11.09 Business impact of HIV/AIDS.......................................15 ...■11.10 Life expectancy* ..........................................................49 ...■
12th pillar: Affinity for Travel & Tourism12.01 Tourism openness* ........................................................4 ...■12.02 Attitude of population toward foreign visitors................6 ...■12.03 Extension of business trips recommended .................10 ...■
13th pillar: Natural resources13.01 Number of World Heritage natural sites* ....................40 ...■13.02 Protected areas* ..........................................................90 ...■13.03 Quality of the natural environment...............................29 ...■13.04 Total known species*...................................................85 ...■
14th pillar: Cultural resources14.01 Number of World Heritage cultural sites* ...................97 ...■14.02 Sports stadiums* .........................................................17 ...■14.03 Number of international fairs and exhibitions* ..........101 ...■14.04 Creative industries exports*........................................n/a ......
Montenegro
* Hard data
Note: For further details and explanation, please refer to the section “How toRead the Country/Economy Profiles” at the beginning of this chapter.
part2A_profiles.r2 2/26/09 4:01 AM Page 279
The Travel & Tourism Competitiveness Report 2009 © 2009 World Economic Forum

280
2.1:
Cou
ntry
/Eco
nom
y Pr
ofile
s
MoroccoKey indicatorsPopulation (millions), 2007............................................................................32.4Surface area (1,000 square kilometers) ......................................................446.6
Gross domestic product (US$ billions), 2007 ...............................................75.1Gross domestic product (PPP, US$) per capita, 2007 .............................4,093.7Real GDP growth (percent), 2007...................................................................2.7
Environmental Performance Index, 2008 (out of 149 countries).....................82
Travel & Tourism indicators
T&T industry, 2008 estimatesGDP (US$ millions) .............................................................8,258.................11.0 ....................5.0Employment (1,000 jobs)....................................................1,035...................9.6 ....................3.0
T&T economy, 2008 estimatesGDP (US$ millions) ...........................................................14,214.................18.9 ....................5.0Employment (1,000 jobs)....................................................1,762.................16.4 ....................3.0
Source: World Travel & Tourism Council, TSA Research 2008
International tourist arrivals (thousands), 2007...................7,408International tourism receipts (US$ millions), 2007 ...........7,264
Source: United Nations World Tourism Organization
Travel & Tourism Competitiveness Index
2009 Index......................................................................................................75 3.92008 Index............................................................................................................67 3.9T&T regulatory framework ..............................................................................64 4.6
Policy rules and regulations..........................................................................50 4.7Environmental sustainability..........................................................................36 4.9Safety and security .........................................................................................79 4.9Health and hygiene .......................................................................................100 3.3Prioritization of Travel & Tourism..................................................................30 5.1
T&T business environment and infrastructure ............................................78 3.3Air transport infrastructure ..........................................................................67 3.0Ground transport infrastructure....................................................................70 3.4Tourism infrastructure ....................................................................................72 3.1ICT infrastructure ............................................................................................88 2.4Price competitiveness in the T&T industry.................................................79 4.5
T&T human, cultural, and natural resources ...............................................83 3.7Human resources ............................................................................................95 4.7
Education and training ...........................................................................102 4.0Availability of qualified labor...................................................................68 5.5
Affinity for Travel & Tourism ..........................................................................29 5.3Natural resources .........................................................................................125 2.2Cultural resources...........................................................................................52 2.7
Note: For descriptions of variables and detailed sources, please refer to “How to the Read Country/Economy Profiles.”
Rank Score(out of 133) (1–7 scale)
International tourist arrivals (thousands)
International tourism receipts (US$ millions)
1995 1996 1997 1998 1999 2000 2001 2002 2003 2004 2005 2006 20070
2,000
4,000
6,000
8,000
1 2 3 4 5 6 7
2009–2018Percent annual growth of total (%, forecast)
part2A_profiles.r2 2/26/09 4:01 AM Page 280
The Travel & Tourism Competitiveness Report 2009 © 2009 World Economic Forum

281
2.1:
Cou
ntry
/Eco
nom
y Pr
ofile
s
The Travel & Tourism Competitiveness Index in detail ■ Competitive Advantage ■ Competitive Disadvantage
INDICATOR RANK/133
1st pillar: Policy rules and regulations1.01 Prevalence of foreign ownership .................................85 ...■1.02 Property rights..............................................................66 ...■1.03 Business impact of rules on FDI ..................................74 ...■1.04 Visa requirements* ......................................................32 ...■1.05 Openness of bilateral Air Service Agreements* ..........55 ...■1.06 Transparency of government policymaking..................47 ...■1.07 Time required to start a business*...............................31 ...■1.08 Cost to start a business* .............................................64 ...■
2nd pillar: Environmental sustainability2.01 Stringency of environmental regulation .......................92 ...■2.02 Enforcement of environmental regulation....................82 ...■2.03 Sustainability of T&T industry development.................12 ...■2.04 Carbon dioxide emissions* ..........................................45 ...■2.05 Particulate matter concentration* ................................29 ...■2.06 Threatened species* ....................................................87 ...■2.07 Environmental treaty ratification*.................................67 ...■
3rd pillar: Safety and security3.01 Business costs of terrorism .......................................113 ...■3.02 Reliability of police services .........................................47 ...■3.03 Business costs of crime and violence..........................66 ...■3.04 Road traffic accidents*.................................................97 ...■
4th pillar: Health and hygiene4.01 Physician density*......................................................100 ...■4.02 Access to improved sanitation* ...................................85 ...■4.03 Access to improved drinking water*............................95 ...■4.04 Hospital beds*............................................................107 ...■
5th pillar: Prioritization of Travel & Tourism5.01 Government prioritization of the T&T industry.............27 ...■5.02 T&T government expenditure* ....................................60 ...■5.03 Effectiveness of marketing and branding.....................24 ...■5.04 T&T fair attendance*....................................................20 ...■
6th pillar: Air transport infrastructure6.01 Quality of air transport infrastructure ...........................61 ...■6.02 Available seat kilometers, domestic*...........................47 ...■6.03 Available seat kilometers, international* ......................44 ...■6.04 Departures per 1,000 population*................................79 ...■6.05 Airport density* ............................................................82 ...■6.06 Number of operating airlines*......................................45 ...■6.07 International air transport network ...............................62 ...■
7th pillar: Ground transport infrastructure7.01 Quality of roads ............................................................62 ...■7.02 Quality of railroad infrastructure...................................47 ...■7.03 Quality of port infrastructure ........................................59 ...■7.04 Quality of ground transport network ............................78 ...■7.05 Road density*...............................................................91 ...■
INDICATOR RANK/133
8th pillar: Tourism infrastructure8.01 Hotel rooms*................................................................80 ...■8.02 Presence of major car rental companies*....................23 ...■8.03 ATMs accepting Visa cards* ........................................80 ...■
9th pillar: ICT infrastructure9.01 Extent of business Internet use.................................110 ...■9.02 Internet users* .............................................................66 ...■9.03 Telephone lines*...........................................................98 ...■9.04 Broadband Internet subscribers* .................................73 ...■9.05 Mobile telephone subscribers*....................................80 ...■
10th pillar: Price competitiveness in the T&T industry10.01 Ticket taxes and airport charges*.................................84 ...■10.02 Purchasing power parity*.............................................68 ...■10.03 Extent and effect of taxation........................................66 ...■10.04 Fuel price levels* .........................................................68 ...■10.05 Hotel price index* ........................................................86 ...■
11th pillar: Human resources11.01 Primary education enrollment* ....................................98 ...■11.02 Secondary education enrollment*..............................106 ...■11.03 Quality of the educational system..............................100 ...■11.04 Local availability of research and training services.......69 ...■11.05 Extent of staff training..................................................79 ...■11.06 Hiring and firing practices.............................................60 ...■11.07 Ease of hiring foreign labor ..........................................74 ...■11.08 HIV prevalence* ...........................................................22 ...■11.09 Business impact of HIV/AIDS.......................................88 ...■11.10 Life expectancy* ..........................................................66 ...■
12th pillar: Affinity for Travel & Tourism12.01 Tourism openness* ......................................................20 ...■12.02 Attitude of population toward foreign visitors..............90 ...■12.03 Extension of business trips recommended .................61 ...■
13th pillar: Natural resources13.01 Number of World Heritage natural sites* ....................74 ...■13.02 Protected areas* ........................................................120 ...■13.03 Quality of the natural environment.............................101 ...■13.04 Total known species*...................................................72 ...■
14th pillar: Cultural resources14.01 Number of World Heritage cultural sites* ...................19 ...■14.02 Sports stadiums* .........................................................85 ...■14.03 Number of international fairs and exhibitions* ............61 ...■14.04 Creative industries exports*.........................................54 ...■
Morocco
* Hard data
Note: For further details and explanation, please refer to the section “How toRead the Country/Economy Profiles” at the beginning of this chapter.
part2A_profiles.r2 2/26/09 4:01 AM Page 281
The Travel & Tourism Competitiveness Report 2009 © 2009 World Economic Forum

282
2.1:
Cou
ntry
/Eco
nom
y Pr
ofile
s
MozambiqueKey indicatorsPopulation (millions), 2007............................................................................20.5Surface area (1,000 square kilometers) ......................................................799.4
Gross domestic product (US$ billions), 2007 .................................................8.1Gross domestic product (PPP, US$) per capita, 2007 ................................842.9Real GDP growth (percent), 2007...................................................................7.0
Environmental Performance Index, 2008 (out of 149 countries)...................134
Travel & Tourism indicators
T&T industry, 2008 estimatesGDP (US$ millions) .................................................................n/a ...................n/a ....................n/aEmployment (1,000 jobs)........................................................n/a ...................n/a ....................n/a
T&T economy, 2008 estimatesGDP (US$ millions) .................................................................n/a ...................n/a ....................n/aEmployment (1,000 jobs)........................................................n/a ...................n/a ....................n/a
Source: World Travel & Tourism Council, TSA Research 2008
International tourist arrivals (thousands), 2006......................664International tourism receipts (US$ millions), 2007 ..............163
Source: United Nations World Tourism Organization
Travel & Tourism Competitiveness Index
2009 Index....................................................................................................124 3.12008 Index..........................................................................................................123 3.1T&T regulatory framework ............................................................................120 3.7
Policy rules and regulations..........................................................................99 3.9Environmental sustainability..........................................................................57 4.6Safety and security .......................................................................................103 4.4Health and hygiene .......................................................................................130 1.3Prioritization of Travel & Tourism..................................................................85 4.0
T&T business environment and infrastructure ..........................................129 2.4Air transport infrastructure ........................................................................116 2.2Ground transport infrastructure..................................................................129 2.1Tourism infrastructure ..................................................................................117 1.5ICT infrastructure ..........................................................................................129 1.5Price competitiveness in the T&T industry.................................................51 4.9
T&T human, cultural, and natural resources .............................................125 3.2Human resources ..........................................................................................130 3.5
Education and training ...........................................................................122 3.1Availability of qualified labor.................................................................128 4.0
Affinity for Travel & Tourism ..........................................................................95 4.5Natural resources ...........................................................................................56 3.5Cultural resources.........................................................................................113 1.4
Note: For descriptions of variables and detailed sources, please refer to “How to the Read Country/Economy Profiles.”
Rank Score(out of 133) (1–7 scale)
International tourist arrivals (thousands)
International tourism receipts (US$ millions)
1995 1996 1997 1998 1999 2000 2001 2002 2003 2004 2005 2006 20070
200
400
600
800
1 2 3 4 5 6 7
2009–2018Percent annual growth of total (%, forecast)
part2A_profiles.r2 2/26/09 4:01 AM Page 282
The Travel & Tourism Competitiveness Report 2009 © 2009 World Economic Forum

283
2.1:
Cou
ntry
/Eco
nom
y Pr
ofile
s
The Travel & Tourism Competitiveness Index in detail ■ Competitive Advantage ■ Competitive Disadvantage
INDICATOR RANK/133
1st pillar: Policy rules and regulations1.01 Prevalence of foreign ownership .................................88 ...■1.02 Property rights............................................................116 ...■1.03 Business impact of rules on FDI ..................................91 ...■1.04 Visa requirements* ....................................................122 ...■1.05 Openness of bilateral Air Service Agreements* ..........79 ...■1.06 Transparency of government policymaking..................93 ...■1.07 Time required to start a business*...............................71 ...■1.08 Cost to start a business* .............................................87 ...■
2nd pillar: Environmental sustainability2.01 Stringency of environmental regulation .....................102 ...■2.02 Enforcement of environmental regulation..................122 ...■2.03 Sustainability of T&T industry development.................80 ...■2.04 Carbon dioxide emissions* ............................................8 ...■2.05 Particulate matter concentration* ................................46 ...■2.06 Threatened species* ....................................................49 ...■2.07 Environmental treaty ratification*.................................94 ...■
3rd pillar: Safety and security3.01 Business costs of terrorism .........................................93 ...■3.02 Reliability of police services .......................................117 ...■3.03 Business costs of crime and violence........................115 ...■3.04 Road traffic accidents*.................................................77 ...■
4th pillar: Health and hygiene4.01 Physician density*......................................................128 ...■4.02 Access to improved sanitation* .................................113 ...■4.03 Access to improved drinking water*..........................126 ...■4.04 Hospital beds*............................................................114 ...■
5th pillar: Prioritization of Travel & Tourism5.01 Government prioritization of the T&T industry.............46 ...■5.02 T&T government expenditure* ...................................n/a ......5.03 Effectiveness of marketing and branding.....................85 ...■5.04 T&T fair attendance*..................................................115 ...■
6th pillar: Air transport infrastructure6.01 Quality of air transport infrastructure .........................113 ...■6.02 Available seat kilometers, domestic*...........................46 ...■6.03 Available seat kilometers, international* ....................118 ...■6.04 Departures per 1,000 population*..............................106 ...■6.05 Airport density* ............................................................66 ...■6.06 Number of operating airlines*....................................114 ...■6.07 International air transport network .............................107 ...■
7th pillar: Ground transport infrastructure7.01 Quality of roads ..........................................................122 ...■7.02 Quality of railroad infrastructure...................................82 ...■7.03 Quality of port infrastructure ......................................111 ...■7.04 Quality of ground transport network..........................130 ...■7.05 Road density*.............................................................121 ...■
INDICATOR RANK/133
8th pillar: Tourism infrastructure8.01 Hotel rooms*..............................................................112 ...■8.02 Presence of major car rental companies*....................95 ...■8.03 ATMs accepting Visa cards* ......................................102 ...■
9th pillar: ICT infrastructure9.01 Extent of business Internet use.................................126 ...■9.02 Internet users* ...........................................................124 ...■9.03 Telephone lines*.........................................................131 ...■9.04 Broadband Internet subscribers* ...............................127 ...■9.05 Mobile telephone subscribers*..................................122 ...■
10th pillar: Price competitiveness in the T&T industry10.01 Ticket taxes and airport charges*.................................23 ...■10.02 Purchasing power parity*.............................................32 ...■10.03 Extent and effect of taxation........................................90 ...■10.04 Fuel price levels* .........................................................83 ...■10.05 Hotel price index* ........................................................30 ...■
11th pillar: Human resources11.01 Primary education enrollment* ..................................115 ...■11.02 Secondary education enrollment*..............................129 ...■11.03 Quality of the educational system..............................115 ...■11.04 Local availability of research and training services.....116 ...■11.05 Extent of staff training..................................................74 ...■11.06 Hiring and firing practices.............................................96 ...■11.07 Ease of hiring foreign labor ........................................108 ...■11.08 HIV prevalence* .........................................................127 ...■11.09 Business impact of HIV/AIDS.....................................131 ...■11.10 Life expectancy* ........................................................122 ...■
12th pillar: Affinity for Travel & Tourism12.01 Tourism openness* ......................................................77 ...■12.02 Attitude of population toward foreign visitors..............83 ...■12.03 Extension of business trips recommended ...............106 ...■
13th pillar: Natural resources13.01 Number of World Heritage natural sites* ....................74 ...■13.02 Protected areas* ..........................................................45 ...■13.03 Quality of the natural environment...............................79 ...■13.04 Total known species*...................................................35 ...■
14th pillar: Cultural resources14.01 Number of World Heritage cultural sites* ...................65 ...■14.02 Sports stadiums* .......................................................117 ...■14.03 Number of international fairs and exhibitions* ..........117 ...■14.04 Creative industries exports*.......................................115 ...■
Mozambique
* Hard data
Note: For further details and explanation, please refer to the section “How toRead the Country/Economy Profiles” at the beginning of this chapter.
part2A_profiles.r2 2/26/09 4:01 AM Page 283
The Travel & Tourism Competitiveness Report 2009 © 2009 World Economic Forum

284
2.1:
Cou
ntry
/Eco
nom
y Pr
ofile
s
NamibiaKey indicatorsPopulation (millions), 2007..............................................................................2.1Surface area (1,000 square kilometers) ......................................................824.3
Gross domestic product (US$ billions), 2007 .................................................7.4Gross domestic product (PPP, US$) per capita, 2007 .............................5,249.6Real GDP growth (percent), 2007...................................................................3.6
Environmental Performance Index, 2008 (out of 149 countries).....................88
Travel & Tourism indicators
T&T industry, 2008 estimatesGDP (US$ millions) ................................................................238...................3.3 ..................10.5Employment (1,000 jobs).........................................................20...................4.6 ....................7.4
T&T economy, 2008 estimatesGDP (US$ millions) .............................................................1,052.................14.5 ....................7.7Employment (1,000 jobs).........................................................77.................18.2 ....................5.3
Source: World Travel & Tourism Council, TSA Research 2008
International tourist arrivals (thousands), 2007......................929International tourism receipts (US$ millions), 2007 ..............434
Source: United Nations World Tourism Organization
Travel & Tourism Competitiveness Index
2009 Index......................................................................................................82 3.82008 Index............................................................................................................93 3.6T&T regulatory framework ..............................................................................71 4.5
Policy rules and regulations..........................................................................79 4.2Environmental sustainability..........................................................................26 5.1Safety and security .........................................................................................60 5.3Health and hygiene .......................................................................................102 3.2Prioritization of Travel & Tourism..................................................................62 4.4
T&T business environment and infrastructure ............................................77 3.3Air transport infrastructure ..........................................................................54 3.4Ground transport infrastructure....................................................................51 4.0Tourism infrastructure ....................................................................................83 2.3ICT infrastructure ..........................................................................................106 1.9Price competitiveness in the T&T industry.................................................67 4.7
T&T human, cultural, and natural resources ...............................................94 3.6Human resources ..........................................................................................128 3.7
Education and training ...........................................................................111 3.6Availability of qualified labor.................................................................129 3.8
Affinity for Travel & Tourism ..........................................................................25 5.4Natural resources ...........................................................................................44 3.8Cultural resources.........................................................................................106 1.5
Note: For descriptions of variables and detailed sources, please refer to “How to the Read Country/Economy Profiles.”
Rank Score(out of 133) (1–7 scale)
International tourist arrivals (thousands)
International tourism receipts (US$ millions)
1995 1996 1997 1998 1999 2000 2001 2002 2003 2004 2005 2006 20070
200
400
600
800
1,000
1 2 3 4 5 6 7
2009–2018Percent annual growth of total (%, forecast)
part2A_profiles.r2 2/26/09 4:01 AM Page 284
The Travel & Tourism Competitiveness Report 2009 © 2009 World Economic Forum

285
2.1:
Cou
ntry
/Eco
nom
y Pr
ofile
s
The Travel & Tourism Competitiveness Index in detail ■ Competitive Advantage ■ Competitive Disadvantage
INDICATOR RANK/133
1st pillar: Policy rules and regulations1.01 Prevalence of foreign ownership .................................61 ...■1.02 Property rights..............................................................25 ...■1.03 Business impact of rules on FDI ..................................72 ...■1.04 Visa requirements* ......................................................76 ...■1.05 Openness of bilateral Air Service Agreements* ..........50 ...■1.06 Transparency of government policymaking..................51 ...■1.07 Time required to start a business*.............................119 ...■1.08 Cost to start a business* .............................................86 ...■
2nd pillar: Environmental sustainability2.01 Stringency of environmental regulation .......................44 ...■2.02 Enforcement of environmental regulation....................48 ...■2.03 Sustainability of T&T industry development.................18 ...■2.04 Carbon dioxide emissions* ..........................................43 ...■2.05 Particulate matter concentration* ................................76 ...■2.06 Threatened species* ....................................................54 ...■2.07 Environmental treaty ratification*.................................52 ...■
3rd pillar: Safety and security3.01 Business costs of terrorism .........................................30 ...■3.02 Reliability of police services .........................................80 ...■3.03 Business costs of crime and violence........................105 ...■3.04 Road traffic accidents*.................................................36 ...■
4th pillar: Health and hygiene4.01 Physician density*......................................................106 ...■4.02 Access to improved sanitation* .................................110 ...■4.03 Access to improved drinking water*............................68 ...■4.04 Hospital beds*..............................................................53 ...■
5th pillar: Prioritization of Travel & Tourism5.01 Government prioritization of the T&T industry.............25 ...■5.02 T&T government expenditure* ....................................68 ...■5.03 Effectiveness of marketing and branding.....................27 ...■5.04 T&T fair attendance*....................................................81 ...■
6th pillar: Air transport infrastructure6.01 Quality of air transport infrastructure ...........................50 ...■6.02 Available seat kilometers, domestic*...........................83 ...■6.03 Available seat kilometers, international* ....................103 ...■6.04 Departures per 1,000 population*................................59 ...■6.05 Airport density* ............................................................15 ...■6.06 Number of operating airlines*....................................126 ...■6.07 International air transport network ...............................55 ...■
7th pillar: Ground transport infrastructure7.01 Quality of roads ............................................................23 ...■7.02 Quality of railroad infrastructure...................................24 ...■7.03 Quality of port infrastructure ........................................24 ...■7.04 Quality of ground transport network..........................106 ...■7.05 Road density*.............................................................116 ...■
INDICATOR RANK/133
8th pillar: Tourism infrastructure8.01 Hotel rooms*................................................................86 ...■8.02 Presence of major car rental companies*....................73 ...■8.03 ATMs accepting Visa cards* ........................................72 ...■
9th pillar: ICT infrastructure9.01 Extent of business Internet use...................................95 ...■9.02 Internet users* ...........................................................107 ...■9.03 Telephone lines*.........................................................102 ...■9.04 Broadband Internet subscribers* ...............................117 ...■9.05 Mobile telephone subscribers*....................................97 ...■
10th pillar: Price competitiveness in the T&T industry10.01 Ticket taxes and airport charges*.................................90 ...■10.02 Purchasing power parity*.............................................77 ...■10.03 Extent and effect of taxation........................................52 ...■10.04 Fuel price levels* .........................................................68 ...■10.05 Hotel price index* .......................................................n/a ......
11th pillar: Human resources11.01 Primary education enrollment* ..................................114 ...■11.02 Secondary education enrollment*..............................103 ...■11.03 Quality of the educational system..............................114 ...■11.04 Local availability of research and training services.....133 ...■11.05 Extent of staff training..................................................44 ...■11.06 Hiring and firing practices...........................................130 ...■11.07 Ease of hiring foreign labor ........................................132 ...■11.08 HIV prevalence* .........................................................129 ...■11.09 Business impact of HIV/AIDS.....................................124 ...■11.10 Life expectancy* ........................................................109 ...■
12th pillar: Affinity for Travel & Tourism12.01 Tourism openness* ......................................................37 ...■12.02 Attitude of population toward foreign visitors..............30 ...■12.03 Extension of business trips recommended ...................2 ...■
13th pillar: Natural resources13.01 Number of World Heritage natural sites* ....................74 ...■13.02 Protected areas* ..........................................................46 ...■13.03 Quality of the natural environment.................................5 ...■13.04 Total known species*...................................................41 ...■
14th pillar: Cultural resources14.01 Number of World Heritage cultural sites* ...................97 ...■14.02 Sports stadiums* .........................................................83 ...■14.03 Number of international fairs and exhibitions* ..........117 ...■14.04 Creative industries exports*.........................................52 ...■
Namibia
* Hard data
Note: For further details and explanation, please refer to the section “How toRead the Country/Economy Profiles” at the beginning of this chapter.
part2A_profiles.r2 2/26/09 4:01 AM Page 285
The Travel & Tourism Competitiveness Report 2009 © 2009 World Economic Forum

286
2.1:
Cou
ntry
/Eco
nom
y Pr
ofile
s
NepalKey indicatorsPopulation (millions), 2007............................................................................28.2Surface area (1,000 square kilometers) ......................................................147.2
Gross domestic product (US$ billions), 2007 ...............................................10.3Gross domestic product (PPP, US$) per capita, 2007 .............................1,078.4Real GDP growth (percent), 2007...................................................................3.2
Environmental Performance Index, 2008 (out of 149 countries).....................81
Travel & Tourism indicators
T&T industry, 2008 estimatesGDP (US$ millions) ................................................................319...................3.0 ....................5.2Employment (1,000 jobs).......................................................237...................2.3 ....................4.5
T&T economy, 2008 estimatesGDP (US$ millions) ................................................................717...................6.8 ....................4.9Employment (1,000 jobs).......................................................548...................5.3 ....................4.2
Source: World Travel & Tourism Council, TSA Research 2008
International tourist arrivals (thousands), 2007......................527International tourism receipts (US$ millions), 2007 ..............198
Source: United Nations World Tourism Organization
Travel & Tourism Competitiveness Index
2009 Index....................................................................................................118 3.32008 Index..........................................................................................................116 3.2T&T regulatory framework ............................................................................119 3.7
Policy rules and regulations........................................................................127 3.1Environmental sustainability..........................................................................87 4.2Safety and security .......................................................................................123 3.8Health and hygiene .......................................................................................114 2.3Prioritization of Travel & Tourism..................................................................39 4.9
T&T business environment and infrastructure ..........................................120 2.5Air transport infrastructure ........................................................................109 2.3Ground transport infrastructure..................................................................123 2.3Tourism infrastructure ..................................................................................130 1.1ICT infrastructure ..........................................................................................130 1.5Price competitiveness in the T&T industry.................................................10 5.5
T&T human, cultural, and natural resources ...............................................97 3.6Human resources ..........................................................................................118 4.0
Education and training ...........................................................................121 3.3Availability of qualified labor.................................................................119 4.7
Affinity for Travel & Tourism ..........................................................................61 4.8Natural resources ...........................................................................................37 4.1Cultural resources.........................................................................................119 1.4
Note: For descriptions of variables and detailed sources, please refer to “How to the Read Country/Economy Profiles.”
Rank Score(out of 133) (1–7 scale)
International tourist arrivals (thousands)
International tourism receipts (US$ millions)
1995 1996 1997 1998 1999 2000 2001 2002 2003 2004 2005 2006 2007100
200
300
400
500
600
1 2 3 4 5 6 7
2009–2018Percent annual growth of total (%, forecast)
part2A_profiles.r2 2/26/09 4:01 AM Page 286
The Travel & Tourism Competitiveness Report 2009 © 2009 World Economic Forum

287
2.1:
Cou
ntry
/Eco
nom
y Pr
ofile
s
The Travel & Tourism Competitiveness Index in detail ■ Competitive Advantage ■ Competitive Disadvantage
INDICATOR RANK/133
1st pillar: Policy rules and regulations1.01 Prevalence of foreign ownership ...............................125 ...■1.02 Property rights............................................................111 ...■1.03 Business impact of rules on FDI ................................113 ...■1.04 Visa requirements* ....................................................131 ...■1.05 Openness of bilateral Air Service Agreements* ........124 ...■1.06 Transparency of government policymaking................120 ...■1.07 Time required to start a business*...............................85 ...■1.08 Cost to start a business* ...........................................107 ...■
2nd pillar: Environmental sustainability2.01 Stringency of environmental regulation .....................117 ...■2.02 Enforcement of environmental regulation..................110 ...■2.03 Sustainability of T&T industry development.................93 ...■2.04 Carbon dioxide emissions* ..........................................10 ...■2.05 Particulate matter concentration* ................................65 ...■2.06 Threatened species* ....................................................90 ...■2.07 Environmental treaty ratification*...............................115 ...■
3rd pillar: Safety and security3.01 Business costs of terrorism .......................................131 ...■3.02 Reliability of police services .......................................109 ...■3.03 Business costs of crime and violence........................120 ...■3.04 Road traffic accidents*.................................................86 ...■
4th pillar: Health and hygiene4.01 Physician density*......................................................110 ...■4.02 Access to improved sanitation* .................................119 ...■4.03 Access to improved drinking water*............................81 ...■4.04 Hospital beds*............................................................128 ...■
5th pillar: Prioritization of Travel & Tourism5.01 Government prioritization of the T&T industry.............48 ...■5.02 T&T government expenditure* ....................................35 ...■5.03 Effectiveness of marketing and branding.....................81 ...■5.04 T&T fair attendance*....................................................25 ...■
6th pillar: Air transport infrastructure6.01 Quality of air transport infrastructure .........................114 ...■6.02 Available seat kilometers, domestic*...........................62 ...■6.03 Available seat kilometers, international* ......................84 ...■6.04 Departures per 1,000 population*..............................114 ...■6.05 Airport density* ............................................................61 ...■6.06 Number of operating airlines*......................................74 ...■6.07 International air transport network .............................112 ...■
7th pillar: Ground transport infrastructure7.01 Quality of roads ..........................................................125 ...■7.02 Quality of railroad infrastructure.................................111 ...■7.03 Quality of port infrastructure ......................................107 ...■7.04 Quality of ground transport network..........................103 ...■7.05 Road density*...............................................................96 ...■
INDICATOR RANK/133
8th pillar: Tourism infrastructure8.01 Hotel rooms*..............................................................116 ...■8.02 Presence of major car rental companies*..................122 ...■8.03 ATMs accepting Visa cards* ......................................116 ...■
9th pillar: ICT infrastructure9.01 Extent of business Internet use.................................121 ...■9.02 Internet users* ...........................................................120 ...■9.03 Telephone lines*.........................................................111 ...■9.04 Broadband Internet subscribers* ...............................109 ...■9.05 Mobile telephone subscribers*..................................130 ...■
10th pillar: Price competitiveness in the T&T industry10.01 Ticket taxes and airport charges*.................................40 ...■10.02 Purchasing power parity*.............................................14 ...■10.03 Extent and effect of taxation........................................49 ...■10.04 Fuel price levels* .........................................................47 ...■10.05 Hotel price index* ..........................................................2 ...■
11th pillar: Human resources11.01 Primary education enrollment* ..................................112 ...■11.02 Secondary education enrollment*..............................112 ...■11.03 Quality of the educational system................................97 ...■11.04 Local availability of research and training services.....119 ...■11.05 Extent of staff training................................................131 ...■11.06 Hiring and firing practices...........................................106 ...■11.07 Ease of hiring foreign labor ........................................130 ...■11.08 HIV prevalence* ...........................................................78 ...■11.09 Business impact of HIV/AIDS.....................................105 ...■11.10 Life expectancy* ........................................................107 ...■
12th pillar: Affinity for Travel & Tourism12.01 Tourism openness* ......................................................67 ...■12.02 Attitude of population toward foreign visitors..............43 ...■12.03 Extension of business trips recommended .................71 ...■
13th pillar: Natural resources13.01 Number of World Heritage natural sites* ....................23 ...■13.02 Protected areas* ..........................................................32 ...■13.03 Quality of the natural environment.............................113 ...■13.04 Total known species*...................................................29 ...■
14th pillar: Cultural resources14.01 Number of World Heritage cultural sites* ...................82 ...■14.02 Sports stadiums* .......................................................125 ...■14.03 Number of international fairs and exhibitions* ............90 ...■14.04 Creative industries exports*.........................................65 ...■
Nepal
* Hard data
Note: For further details and explanation, please refer to the section “How toRead the Country/Economy Profiles” at the beginning of this chapter.
part2A_profiles.r2 2/26/09 4:01 AM Page 287
The Travel & Tourism Competitiveness Report 2009 © 2009 World Economic Forum

288
2.1:
Cou
ntry
/Eco
nom
y Pr
ofile
s
NetherlandsKey indicatorsPopulation (millions), 2007............................................................................16.4Surface area (1,000 square kilometers) ........................................................41.5
Gross domestic product (US$ billions), 2007 .............................................777.2Gross domestic product (PPP, US$) per capita, 2007 ...........................38,994.7Real GDP growth (percent), 2007...................................................................3.5
Environmental Performance Index, 2008 (out of 149 countries).....................55
Travel & Tourism indicators
T&T industry, 2008 estimatesGDP (US$ millions) ...........................................................23,640...................2.8 ....................1.7Employment (1,000 jobs).......................................................203...................2.8 ..................–0.1
T&T economy, 2008 estimatesGDP (US$ millions) ...........................................................62,133...................7.4 ....................1.7Employment (1,000 jobs).......................................................505...................6.9 ..................–0.1
Source: World Travel & Tourism Council, TSA Research 2008
International tourist arrivals (thousands), 2007.................11,008International tourism receipts (US$ millions), 2007 .........13,305
Source: United Nations World Tourism Organization
Travel & Tourism Competitiveness Index
2009 Index......................................................................................................13 5.12008 Index............................................................................................................18 5.0T&T regulatory framework ..............................................................................22 5.4
Policy rules and regulations..........................................................................11 5.4Environmental sustainability............................................................................5 5.7Safety and security .........................................................................................36 5.8Health and hygiene .........................................................................................20 6.4Prioritization of Travel & Tourism..................................................................90 4.0
T&T business environment and infrastructure ..............................................9 5.1Air transport infrastructure ..........................................................................16 5.0Ground transport infrastructure......................................................................9 6.0Tourism infrastructure ....................................................................................25 5.0ICT infrastructure ..............................................................................................5 5.8Price competitiveness in the T&T industry...............................................124 3.6
T&T human, cultural, and natural resources ...............................................17 4.7Human resources ............................................................................................11 5.8
Education and training ...............................................................................5 6.1Availability of qualified labor...................................................................42 5.6
Affinity for Travel & Tourism ..........................................................................63 4.8Natural resources ...........................................................................................81 2.9Cultural resources...........................................................................................16 5.5
Note: For descriptions of variables and detailed sources, please refer to “How to the Read Country/Economy Profiles.”
Rank Score(out of 133) (1–7 scale)
International tourist arrivals (thousands)
International tourism receipts (US$ millions)
1995 1996 1997 1998 1999 2000 2001 2002 2003 2004 2005 2006 20076,000
9,000
12,000
15,000
1 2 3 4 5 6 7
2009–2018Percent annual growth of total (%, forecast)
part2A_profiles.r2 2/26/09 4:01 AM Page 288
The Travel & Tourism Competitiveness Report 2009 © 2009 World Economic Forum

289
2.1:
Cou
ntry
/Eco
nom
y Pr
ofile
s
The Travel & Tourism Competitiveness Index in detail ■ Competitive Advantage ■ Competitive Disadvantage
INDICATOR RANK/133
1st pillar: Policy rules and regulations1.01 Prevalence of foreign ownership .................................26 ...■1.02 Property rights..............................................................14 ...■1.03 Business impact of rules on FDI ..................................12 ...■1.04 Visa requirements* ......................................................40 ...■1.05 Openness of bilateral Air Service Agreements* ..........20 ...■1.06 Transparency of government policymaking..................13 ...■1.07 Time required to start a business*...............................25 ...■1.08 Cost to start a business* .............................................46 ...■
2nd pillar: Environmental sustainability2.01 Stringency of environmental regulation .........................3 ...■2.02 Enforcement of environmental regulation......................9 ...■2.03 Sustainability of T&T industry development.................36 ...■2.04 Carbon dioxide emissions* ..........................................98 ...■2.05 Particulate matter concentration* ................................62 ...■2.06 Threatened species* ....................................................12 ...■2.07 Environmental treaty ratification*...................................2 ...■
3rd pillar: Safety and security3.01 Business costs of terrorism .........................................83 ...■3.02 Reliability of police services .........................................11 ...■3.03 Business costs of crime and violence..........................62 ...■3.04 Road traffic accidents*.................................................55 ...■
4th pillar: Health and hygiene4.01 Physician density*........................................................11 ...■4.02 Access to improved sanitation* .....................................1 ...■4.03 Access to improved drinking water*..............................1 ...■4.04 Hospital beds*..............................................................35 ...■
5th pillar: Prioritization of Travel & Tourism5.01 Government prioritization of the T&T industry.............82 ...■5.02 T&T government expenditure* ....................................93 ...■5.03 Effectiveness of marketing and branding.....................42 ...■5.04 T&T fair attendance*....................................................81 ...■
6th pillar: Air transport infrastructure6.01 Quality of air transport infrastructure .............................9 ...■6.02 Available seat kilometers, domestic*...........................85 ...■6.03 Available seat kilometers, international* ......................15 ...■6.04 Departures per 1,000 population*................................24 ...■6.05 Airport density* ..........................................................103 ...■6.06 Number of operating airlines*......................................12 ...■6.07 International air transport network .................................5 ...■
7th pillar: Ground transport infrastructure7.01 Quality of roads ............................................................25 ...■7.02 Quality of railroad infrastructure...................................13 ...■7.03 Quality of port infrastructure ..........................................3 ...■7.04 Quality of ground transport network ............................14 ...■7.05 Road density*.................................................................7 ...■
INDICATOR RANK/133
8th pillar: Tourism infrastructure8.01 Hotel rooms*................................................................46 ...■8.02 Presence of major car rental companies*......................1 ...■8.03 ATMs accepting Visa cards* ........................................25 ...■
9th pillar: ICT infrastructure9.01 Extent of business Internet use...................................15 ...■9.02 Internet users* ...............................................................1 ...■9.03 Telephone lines*...........................................................22 ...■9.04 Broadband Internet subscribers* ...................................4 ...■9.05 Mobile telephone subscribers*....................................37 ...■
10th pillar: Price competitiveness in the T&T industry10.01 Ticket taxes and airport charges*.................................91 ...■10.02 Purchasing power parity*...........................................120 ...■10.03 Extent and effect of taxation........................................60 ...■10.04 Fuel price levels* .......................................................115 ...■10.05 Hotel price index* ........................................................93 ...■
11th pillar: Human resources11.01 Primary education enrollment* ....................................20 ...■11.02 Secondary education enrollment*..................................5 ...■11.03 Quality of the educational system................................13 ...■11.04 Local availability of research and training services.........3 ...■11.05 Extent of staff training....................................................8 ...■11.06 Hiring and firing practices...........................................123 ...■11.07 Ease of hiring foreign labor ..........................................49 ...■11.08 HIV prevalence* ...........................................................49 ...■11.09 Business impact of HIV/AIDS.......................................23 ...■11.10 Life expectancy* ..........................................................12 ...■
12th pillar: Affinity for Travel & Tourism12.01 Tourism openness* ......................................................79 ...■12.02 Attitude of population toward foreign visitors..............11 ...■12.03 Extension of business trips recommended .................70 ...■
13th pillar: Natural resources13.01 Number of World Heritage natural sites* ....................74 ...■13.02 Protected areas* ..........................................................38 ...■13.03 Quality of the natural environment...............................67 ...■13.04 Total known species*.................................................105 ...■
14th pillar: Cultural resources14.01 Number of World Heritage cultural sites* ...................26 ...■14.02 Sports stadiums* .........................................................40 ...■14.03 Number of international fairs and exhibitions* ..............7 ...■14.04 Creative industries exports*.........................................13 ...■
Netherlands
* Hard data
Note: For further details and explanation, please refer to the section “How toRead the Country/Economy Profiles” at the beginning of this chapter.
part2A_profiles.r2 2/26/09 4:01 AM Page 289
The Travel & Tourism Competitiveness Report 2009 © 2009 World Economic Forum

290
2.1:
Cou
ntry
/Eco
nom
y Pr
ofile
s
New ZealandKey indicatorsPopulation (millions), 2007..............................................................................4.1Surface area (1,000 square kilometers) ......................................................267.7
Gross domestic product (US$ billions), 2007 .............................................128.7Gross domestic product (PPP, US$) per capita, 2007 ...........................26,610.5Real GDP growth (percent), 2007...................................................................3.2
Environmental Performance Index, 2008 (out of 149 countries).......................7
Travel & Tourism indicators
T&T industry, 2008 estimatesGDP (US$ millions) .............................................................7,465...................6.0 ....................3.3Employment (1,000 jobs).......................................................135...................6.2 ....................0.6
T&T economy, 2008 estimatesGDP (US$ millions) ...........................................................16,225.................13.0 ....................3.0Employment (1,000 jobs).......................................................290.................13.4 ..................–0.1
Source: World Travel & Tourism Council, TSA Research 2008
International tourist arrivals (thousands), 2007...................2,466International tourism receipts (US$ millions), 2007 ...........5,400
Source: United Nations World Tourism Organization
Travel & Tourism Competitiveness Index
2009 Index......................................................................................................20 4.92008 Index............................................................................................................19 5.0T&T regulatory framework ..............................................................................14 5.6
Policy rules and regulations..........................................................................10 5.4Environmental sustainability..........................................................................22 5.2Safety and security .........................................................................................15 6.2Health and hygiene .........................................................................................31 6.0Prioritization of Travel & Tourism..................................................................36 5.0
T&T business environment and infrastructure ............................................30 4.6Air transport infrastructure ..........................................................................11 5.1Ground transport infrastructure....................................................................53 3.9Tourism infrastructure ....................................................................................29 4.7ICT infrastructure ............................................................................................18 5.0Price competitiveness in the T&T industry.................................................85 4.3
T&T human, cultural, and natural resources ...............................................25 4.7Human resources ............................................................................................17 5.7
Education and training .............................................................................20 5.7Availability of qualified labor...................................................................24 5.7
Affinity for Travel & Tourism ..........................................................................24 5.4Natural resources ...........................................................................................27 4.4Cultural resources...........................................................................................39 3.1
Note: For descriptions of variables and detailed sources, please refer to “How to the Read Country/Economy Profiles.”
Rank Score(out of 133) (1–7 scale)
International tourist arrivals (thousands)
International tourism receipts (US$ millions)
1995 1996 1997 1998 1999 2000 2001 2002 2003 2004 2005 2006 20071,000
2,000
3,000
4,000
5,000
6,000
1 2 3 4 5 6 7
2009–2018Percent annual growth of total (%, forecast)
part2A_profiles.r2 2/26/09 4:01 AM Page 290
The Travel & Tourism Competitiveness Report 2009 © 2009 World Economic Forum

291
2.1:
Cou
ntry
/Eco
nom
y Pr
ofile
s
The Travel & Tourism Competitiveness Index in detail ■ Competitive Advantage ■ Competitive Disadvantage
INDICATOR RANK/133
1st pillar: Policy rules and regulations1.01 Prevalence of foreign ownership .................................22 ...■1.02 Property rights..............................................................16 ...■1.03 Business impact of rules on FDI ..................................63 ...■1.04 Visa requirements* ......................................................68 ...■1.05 Openness of bilateral Air Service Agreements* ..........26 ...■1.06 Transparency of government policymaking..................11 ...■1.07 Time required to start a business*.................................1 ...■1.08 Cost to start a business* ...............................................4 ...■
2nd pillar: Environmental sustainability2.01 Stringency of environmental regulation .......................10 ...■2.02 Enforcement of environmental regulation....................11 ...■2.03 Sustainability of T&T industry development...................8 ...■2.04 Carbon dioxide emissions* ..........................................92 ...■2.05 Particulate matter concentration* ..................................7 ...■2.06 Threatened species* ..................................................133 ...■2.07 Environmental treaty ratification*...................................2 ...■
3rd pillar: Safety and security3.01 Business costs of terrorism .........................................29 ...■3.02 Reliability of police services .........................................23 ...■3.03 Business costs of crime and violence..........................25 ...■3.04 Road traffic accidents*.................................................38 ...■
4th pillar: Health and hygiene4.01 Physician density*........................................................50 ...■4.02 Access to improved sanitation* .....................................1 ...■4.03 Access to improved drinking water*..............................1 ...■4.04 Hospital beds*..............................................................25 ...■
5th pillar: Prioritization of Travel & Tourism5.01 Government prioritization of the T&T industry...............7 ...■5.02 T&T government expenditure* ....................................64 ...■5.03 Effectiveness of marketing and branding.......................7 ...■5.04 T&T fair attendance*....................................................41 ...■
6th pillar: Air transport infrastructure6.01 Quality of air transport infrastructure ...........................23 ...■6.02 Available seat kilometers, domestic*...........................28 ...■6.03 Available seat kilometers, international* ......................28 ...■6.04 Departures per 1,000 population*..................................5 ...■6.05 Airport density* ..............................................................6 ...■6.06 Number of operating airlines*......................................75 ...■6.07 International air transport network ...............................19 ...■
7th pillar: Ground transport infrastructure7.01 Quality of roads ............................................................50 ...■7.02 Quality of railroad infrastructure...................................44 ...■7.03 Quality of port infrastructure ........................................23 ...■7.04 Quality of ground transport network ............................57 ...■7.05 Road density*...............................................................58 ...■
INDICATOR RANK/133
8th pillar: Tourism infrastructure8.01 Hotel rooms*................................................................49 ...■8.02 Presence of major car rental companies*....................23 ...■8.03 ATMs accepting Visa cards* ........................................23 ...■
9th pillar: ICT infrastructure9.01 Extent of business Internet use...................................26 ...■9.02 Internet users* ...............................................................3 ...■9.03 Telephone lines*...........................................................29 ...■9.04 Broadband Internet subscribers* .................................17 ...■9.05 Mobile telephone subscribers*....................................40 ...■
10th pillar: Price competitiveness in the T&T industry10.01 Ticket taxes and airport charges*.................................66 ...■10.02 Purchasing power parity*...........................................116 ...■10.03 Extent and effect of taxation........................................89 ...■10.04 Fuel price levels* .........................................................45 ...■10.05 Hotel price index* ........................................................39 ...■
11th pillar: Human resources11.01 Primary education enrollment* ......................................8 ...■11.02 Secondary education enrollment*..................................2 ...■11.03 Quality of the educational system................................21 ...■11.04 Local availability of research and training services.......24 ...■11.05 Extent of staff training..................................................26 ...■11.06 Hiring and firing practices...........................................102 ...■11.07 Ease of hiring foreign labor ..........................................58 ...■11.08 HIV prevalence* ...........................................................22 ...■11.09 Business impact of HIV/AIDS.......................................18 ...■11.10 Life expectancy* ..........................................................12 ...■
12th pillar: Affinity for Travel & Tourism12.01 Tourism openness* ......................................................43 ...■12.02 Attitude of population toward foreign visitors................2 ...■12.03 Extension of business trips recommended ...................1 ...■
13th pillar: Natural resources13.01 Number of World Heritage natural sites* ....................16 ...■13.02 Protected areas* ..........................................................25 ...■13.03 Quality of the natural environment.................................3 ...■13.04 Total known species*.................................................124 ...■
14th pillar: Cultural resources14.01 Number of World Heritage cultural sites* ...................97 ...■14.02 Sports stadiums* .........................................................10 ...■14.03 Number of international fairs and exhibitions* ............46 ...■14.04 Creative industries exports*.........................................53 ...■
New Zealand
* Hard data
Note: For further details and explanation, please refer to the section “How toRead the Country/Economy Profiles” at the beginning of this chapter.
part2A_profiles.r2 2/26/09 4:01 AM Page 291
The Travel & Tourism Competitiveness Report 2009 © 2009 World Economic Forum

292
2.1:
Cou
ntry
/Eco
nom
y Pr
ofile
s
NicaraguaKey indicatorsPopulation (millions), 2007..............................................................................5.7Surface area (1,000 square kilometers) ......................................................130.0
Gross domestic product (US$ billions), 2007 .................................................5.7Gross domestic product (PPP, US$) per capita, 2007 .............................2,628.6Real GDP growth (percent), 2007...................................................................3.8
Environmental Performance Index, 2008 (out of 149 countries).....................77
Travel & Tourism indicators
T&T industry, 2008 estimatesGDP (US$ millions) ................................................................145...................2.4 ....................3.9Employment (1,000 jobs).........................................................37...................1.9 ....................3.2
T&T economy, 2008 estimatesGDP (US$ millions) ................................................................397...................6.5 ....................4.3Employment (1,000 jobs).......................................................102...................5.2 ....................3.7
Source: World Travel & Tourism Council, TSA Research 2008
International tourist arrivals (thousands), 2007......................800International tourism receipts (US$ millions), 2007 ..............255
Source: United Nations World Tourism Organization
Travel & Tourism Competitiveness Index
2009 Index....................................................................................................103 3.52008 Index............................................................................................................99 3.5T&T regulatory framework ..............................................................................98 4.0
Policy rules and regulations..........................................................................97 3.9Environmental sustainability..........................................................................41 4.9Safety and security .........................................................................................56 5.3Health and hygiene .......................................................................................109 2.6Prioritization of Travel & Tourism................................................................109 3.5
T&T business environment and infrastructure ..........................................101 2.8Air transport infrastructure ........................................................................103 2.4Ground transport infrastructure..................................................................133 2.0Tourism infrastructure ....................................................................................81 2.4ICT infrastructure ..........................................................................................111 1.9Price competitiveness in the T&T industry.................................................29 5.2
T&T human, cultural, and natural resources ...............................................93 3.6Human resources ............................................................................................91 4.8
Education and training ...........................................................................105 3.9Availability of qualified labor...................................................................17 5.8
Affinity for Travel & Tourism ..........................................................................86 4.6Natural resources ...........................................................................................53 3.6Cultural resources.........................................................................................101 1.6
Note: For descriptions of variables and detailed sources, please refer to “How to the Read Country/Economy Profiles.”
Rank Score(out of 133) (1–7 scale)
International tourist arrivals (thousands)
International tourism receipts (US$ millions)
1995 1996 1997 1998 1999 2000 2001 2002 2003 2004 2005 2006 20070
200
400
600
800
1 2 3 4 5 6 7
2009–2018Percent annual growth of total (%, forecast)
part2A_profiles.r2 2/26/09 4:01 AM Page 292
The Travel & Tourism Competitiveness Report 2009 © 2009 World Economic Forum
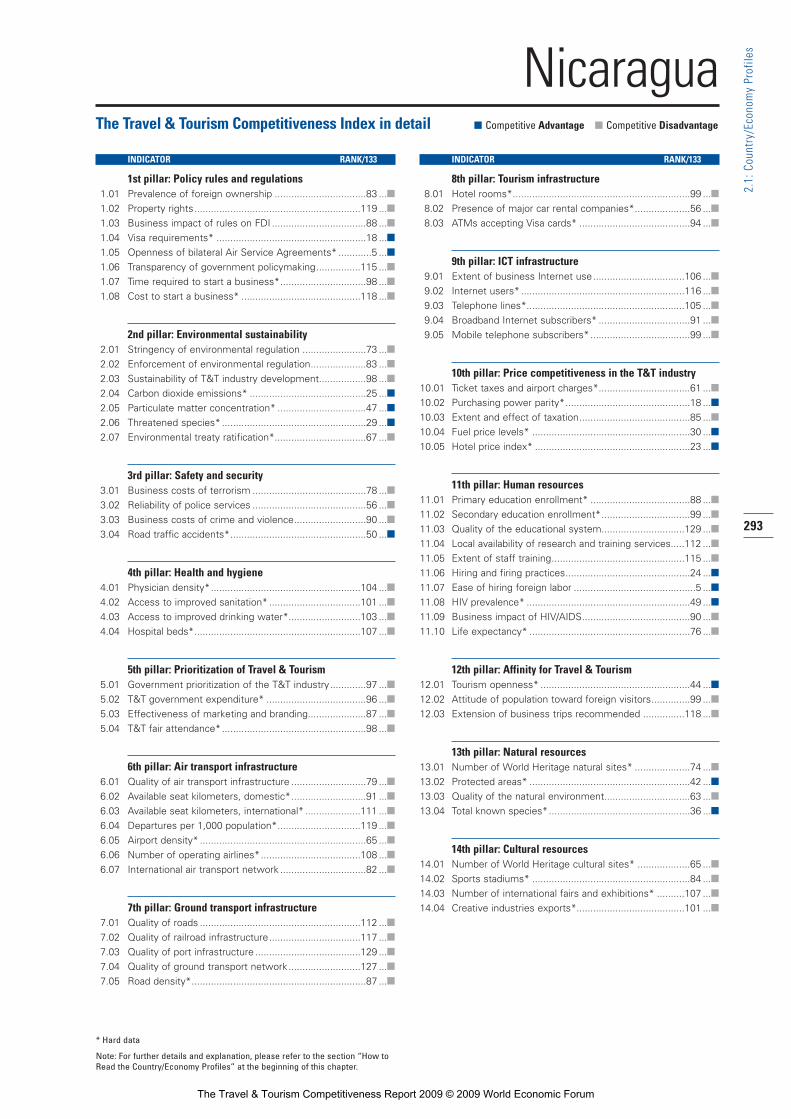
293
2.1:
Cou
ntry
/Eco
nom
y Pr
ofile
s
The Travel & Tourism Competitiveness Index in detail ■ Competitive Advantage ■ Competitive Disadvantage
INDICATOR RANK/133
1st pillar: Policy rules and regulations1.01 Prevalence of foreign ownership .................................83 ...■1.02 Property rights............................................................119 ...■1.03 Business impact of rules on FDI ..................................88 ...■1.04 Visa requirements* ......................................................18 ...■1.05 Openness of bilateral Air Service Agreements* ............5 ...■1.06 Transparency of government policymaking................115 ...■1.07 Time required to start a business*...............................98 ...■1.08 Cost to start a business* ...........................................118 ...■
2nd pillar: Environmental sustainability2.01 Stringency of environmental regulation .......................73 ...■2.02 Enforcement of environmental regulation....................83 ...■2.03 Sustainability of T&T industry development.................98 ...■2.04 Carbon dioxide emissions* ..........................................25 ...■2.05 Particulate matter concentration* ................................47 ...■2.06 Threatened species* ....................................................29 ...■2.07 Environmental treaty ratification*.................................67 ...■
3rd pillar: Safety and security3.01 Business costs of terrorism .........................................78 ...■3.02 Reliability of police services .........................................56 ...■3.03 Business costs of crime and violence..........................90 ...■3.04 Road traffic accidents*.................................................50 ...■
4th pillar: Health and hygiene4.01 Physician density*......................................................104 ...■4.02 Access to improved sanitation* .................................101 ...■4.03 Access to improved drinking water*..........................103 ...■4.04 Hospital beds*............................................................107 ...■
5th pillar: Prioritization of Travel & Tourism5.01 Government prioritization of the T&T industry.............97 ...■5.02 T&T government expenditure* ....................................96 ...■5.03 Effectiveness of marketing and branding.....................87 ...■5.04 T&T fair attendance*....................................................98 ...■
6th pillar: Air transport infrastructure6.01 Quality of air transport infrastructure ...........................79 ...■6.02 Available seat kilometers, domestic*...........................91 ...■6.03 Available seat kilometers, international* ....................111 ...■6.04 Departures per 1,000 population*..............................119 ...■6.05 Airport density* ............................................................65 ...■6.06 Number of operating airlines*....................................108 ...■6.07 International air transport network ...............................82 ...■
7th pillar: Ground transport infrastructure7.01 Quality of roads ..........................................................112 ...■7.02 Quality of railroad infrastructure.................................117 ...■7.03 Quality of port infrastructure ......................................129 ...■7.04 Quality of ground transport network..........................127 ...■7.05 Road density*...............................................................87 ...■
INDICATOR RANK/133
8th pillar: Tourism infrastructure8.01 Hotel rooms*................................................................99 ...■8.02 Presence of major car rental companies*....................56 ...■8.03 ATMs accepting Visa cards* ........................................94 ...■
9th pillar: ICT infrastructure9.01 Extent of business Internet use.................................106 ...■9.02 Internet users* ...........................................................116 ...■9.03 Telephone lines*.........................................................105 ...■9.04 Broadband Internet subscribers* .................................91 ...■9.05 Mobile telephone subscribers*....................................99 ...■
10th pillar: Price competitiveness in the T&T industry10.01 Ticket taxes and airport charges*.................................61 ...■10.02 Purchasing power parity*.............................................18 ...■10.03 Extent and effect of taxation........................................85 ...■10.04 Fuel price levels* .........................................................30 ...■10.05 Hotel price index* ........................................................23 ...■
11th pillar: Human resources11.01 Primary education enrollment* ....................................88 ...■11.02 Secondary education enrollment*................................99 ...■11.03 Quality of the educational system..............................129 ...■11.04 Local availability of research and training services.....112 ...■11.05 Extent of staff training................................................115 ...■11.06 Hiring and firing practices.............................................24 ...■11.07 Ease of hiring foreign labor ............................................5 ...■11.08 HIV prevalence* ...........................................................49 ...■11.09 Business impact of HIV/AIDS.......................................90 ...■11.10 Life expectancy* ..........................................................76 ...■
12th pillar: Affinity for Travel & Tourism12.01 Tourism openness* ......................................................44 ...■12.02 Attitude of population toward foreign visitors..............99 ...■12.03 Extension of business trips recommended ...............118 ...■
13th pillar: Natural resources13.01 Number of World Heritage natural sites* ....................74 ...■13.02 Protected areas* ..........................................................42 ...■13.03 Quality of the natural environment...............................63 ...■13.04 Total known species*...................................................36 ...■
14th pillar: Cultural resources14.01 Number of World Heritage cultural sites* ...................65 ...■14.02 Sports stadiums* .........................................................84 ...■14.03 Number of international fairs and exhibitions* ..........107 ...■14.04 Creative industries exports*.......................................101 ...■
Nicaragua
* Hard data
Note: For further details and explanation, please refer to the section “How toRead the Country/Economy Profiles” at the beginning of this chapter.
part2A_profiles.r2 2/26/09 4:01 AM Page 293
The Travel & Tourism Competitiveness Report 2009 © 2009 World Economic Forum

294
2.1:
Cou
ntry
/Eco
nom
y Pr
ofile
s
NigeriaKey indicatorsPopulation (millions), 2007..........................................................................137.2Surface area (1,000 square kilometers) ......................................................923.8
Gross domestic product (US$ billions), 2007 .............................................167.0Gross domestic product (PPP, US$) per capita, 2007 .............................2,027.8Real GDP growth (percent), 2007...................................................................5.9
Environmental Performance Index, 2008 (out of 149 countries)...................126
Travel & Tourism indicators
T&T industry, 2008 estimatesGDP (US$ millions) ................................................................976...................0.7 ....................2.5Employment (1,000 jobs).......................................................308...................0.6 ....................0.2
T&T economy, 2008 estimatesGDP (US$ millions) .............................................................7,745...................5.5 ..................–0.4Employment (1,000 jobs)....................................................2,381...................4.6 ..................–2.6
Source: World Travel & Tourism Council, TSA Research 2008
International tourist arrivals (thousands), 2006...................1,111International tourism receipts (US$ millions), 2006 ................21
Source: United Nations World Tourism Organization
Travel & Tourism Competitiveness Index
2009 Index....................................................................................................128 3.02008 Index..........................................................................................................125 3.0T&T regulatory framework ............................................................................132 3.1
Policy rules and regulations........................................................................113 3.6Environmental sustainability..........................................................................61 4.6Safety and security .......................................................................................133 2.9Health and hygiene .......................................................................................129 1.3Prioritization of Travel & Tourism................................................................122 3.1
T&T business environment and infrastructure ..........................................116 2.6Air transport infrastructure ..........................................................................95 2.5Ground transport infrastructure..................................................................118 2.4Tourism infrastructure ..................................................................................121 1.4ICT infrastructure ..........................................................................................108 1.9Price competitiveness in the T&T industry.................................................69 4.7
T&T human, cultural, and natural resources .............................................113 3.4Human resources ..........................................................................................113 4.2
Education and training ...........................................................................119 3.4Availability of qualified labor.................................................................107 5.0
Affinity for Travel & Tourism ........................................................................124 4.1Natural resources ...........................................................................................51 3.6Cultural resources.........................................................................................103 1.6
Note: For descriptions of variables and detailed sources, please refer to “How to the Read Country/Economy Profiles.”
Rank Score(out of 133) (1–7 scale)
International tourist arrivals (thousands)
International tourism receipts (US$ millions)
1995 1996 1997 1998 1999 2000 2001 2002 2003 2004 2005 2006 20070
200
400
600
800
1,000
1,200
1 2 3 4 5 6 7
2009–2018Percent annual growth of total (%, forecast)
part2A_profiles.r2 2/26/09 4:01 AM Page 294
The Travel & Tourism Competitiveness Report 2009 © 2009 World Economic Forum

295
2.1:
Cou
ntry
/Eco
nom
y Pr
ofile
s
The Travel & Tourism Competitiveness Index in detail ■ Competitive Advantage ■ Competitive Disadvantage
INDICATOR RANK/133
1st pillar: Policy rules and regulations1.01 Prevalence of foreign ownership .................................40 ...■1.02 Property rights..............................................................86 ...■1.03 Business impact of rules on FDI ..................................57 ...■1.04 Visa requirements* ....................................................108 ...■1.05 Openness of bilateral Air Service Agreements* ..........96 ...■1.06 Transparency of government policymaking..................54 ...■1.07 Time required to start a business*...............................85 ...■1.08 Cost to start a business* ...........................................115 ...■
2nd pillar: Environmental sustainability2.01 Stringency of environmental regulation .......................86 ...■2.02 Enforcement of environmental regulation....................94 ...■2.03 Sustainability of T&T industry development.................75 ...■2.04 Carbon dioxide emissions* ..........................................29 ...■2.05 Particulate matter concentration* ................................96 ...■2.06 Threatened species* ....................................................57 ...■2.07 Environmental treaty ratification*.................................34 ...■
3rd pillar: Safety and security3.01 Business costs of terrorism .......................................118 ...■3.02 Reliability of police services .......................................119 ...■3.03 Business costs of crime and violence........................123 ...■3.04 Road traffic accidents*...............................................122 ...■
4th pillar: Health and hygiene4.01 Physician density*......................................................109 ...■4.02 Access to improved sanitation* .................................114 ...■4.03 Access to improved drinking water*..........................124 ...■4.04 Hospital beds*............................................................120 ...■
5th pillar: Prioritization of Travel & Tourism5.01 Government prioritization of the T&T industry...........103 ...■5.02 T&T government expenditure* ..................................125 ...■5.03 Effectiveness of marketing and branding.....................68 ...■5.04 T&T fair attendance*..................................................115 ...■
6th pillar: Air transport infrastructure6.01 Quality of air transport infrastructure ...........................84 ...■6.02 Available seat kilometers, domestic*...........................36 ...■6.03 Available seat kilometers, international* ......................58 ...■6.04 Departures per 1,000 population*..............................116 ...■6.05 Airport density* ..........................................................127 ...■6.06 Number of operating airlines*......................................57 ...■6.07 International air transport network ...............................78 ...■
7th pillar: Ground transport infrastructure7.01 Quality of roads ..........................................................116 ...■7.02 Quality of railroad infrastructure.................................107 ...■7.03 Quality of port infrastructure ......................................120 ...■7.04 Quality of ground transport network ............................98 ...■7.05 Road density*...............................................................76 ...■
INDICATOR RANK/133
8th pillar: Tourism infrastructure8.01 Hotel rooms*..............................................................121 ...■8.02 Presence of major car rental companies*....................95 ...■8.03 ATMs accepting Visa cards* ......................................122 ...■
9th pillar: ICT infrastructure9.01 Extent of business Internet use...................................64 ...■9.02 Internet users* ...........................................................100 ...■9.03 Telephone lines*.........................................................119 ...■9.04 Broadband Internet subscribers* ...............................125 ...■9.05 Mobile telephone subscribers*..................................111 ...■
10th pillar: Price competitiveness in the T&T industry10.01 Ticket taxes and airport charges*.................................73 ...■10.02 Purchasing power parity*.............................................66 ...■10.03 Extent and effect of taxation........................................39 ...■10.04 Fuel price levels* .........................................................40 ...■10.05 Hotel price index* ........................................................99 ...■
11th pillar: Human resources11.01 Primary education enrollment* ..................................124 ...■11.02 Secondary education enrollment*..............................117 ...■11.03 Quality of the educational system................................60 ...■11.04 Local availability of research and training services.......52 ...■11.05 Extent of staff training..................................................88 ...■11.06 Hiring and firing practices.............................................10 ...■11.07 Ease of hiring foreign labor ..........................................21 ...■11.08 HIV prevalence* .........................................................119 ...■11.09 Business impact of HIV/AIDS.......................................79 ...■11.10 Life expectancy* ........................................................127 ...■
12th pillar: Affinity for Travel & Tourism12.01 Tourism openness* ....................................................127 ...■12.02 Attitude of population toward foreign visitors............109 ...■12.03 Extension of business trips recommended ...............111 ...■
13th pillar: Natural resources13.01 Number of World Heritage natural sites* ....................74 ...■13.02 Protected areas* ..........................................................38 ...■13.03 Quality of the natural environment.............................117 ...■13.04 Total known species*...................................................23 ...■
14th pillar: Cultural resources14.01 Number of World Heritage cultural sites* ...................54 ...■14.02 Sports stadiums* .......................................................118 ...■14.03 Number of international fairs and exhibitions* ............91 ...■14.04 Creative industries exports*.......................................104 ...■
Nigeria
* Hard data
Note: For further details and explanation, please refer to the section “How toRead the Country/Economy Profiles” at the beginning of this chapter.
part2A_profiles.r2 2/26/09 4:01 AM Page 295
The Travel & Tourism Competitiveness Report 2009 © 2009 World Economic Forum

296
2.1:
Cou
ntry
/Eco
nom
y Pr
ofile
s
NorwayKey indicatorsPopulation (millions), 2007..............................................................................4.7Surface area (1,000 square kilometers) ......................................................323.8
Gross domestic product (US$ billions), 2007 .............................................389.5Gross domestic product (PPP, US$) per capita, 2007 ...........................53,152.4Real GDP growth (percent), 2007...................................................................3.7
Environmental Performance Index, 2008 (out of 149 countries).......................3
Travel & Tourism indicators
T&T industry, 2008 estimatesGDP (US$ millions) .............................................................7,077...................1.7 ....................4.3Employment (1,000 jobs).........................................................44...................1.8 ....................1.0
T&T economy, 2008 estimatesGDP (US$ millions) ...........................................................25,938...................6.1 ....................4.0Employment (1,000 jobs).......................................................175...................7.1 ....................0.7
Source: World Travel & Tourism Council, TSA Research 2008
International tourist arrivals (thousands), 2007...................4,290International tourism receipts (US$ millions), 2007 ...........4,377
Source: United Nations World Tourism Organization
Travel & Tourism Competitiveness Index
2009 Index......................................................................................................19 5.02008 Index............................................................................................................17 5.1T&T regulatory framework ................................................................................9 5.6
Policy rules and regulations..........................................................................23 5.2Environmental sustainability..........................................................................19 5.3Safety and security ...........................................................................................3 6.6Health and hygiene .........................................................................................24 6.2Prioritization of Travel & Tourism..................................................................38 4.9
T&T business environment and infrastructure ............................................19 4.8Air transport infrastructure ............................................................................8 5.4Ground transport infrastructure....................................................................37 4.3Tourism infrastructure ....................................................................................19 5.7ICT infrastructure ..............................................................................................6 5.5Price competitiveness in the T&T industry...............................................129 3.3
T&T human, cultural, and natural resources ...............................................36 4.4Human resources ............................................................................................14 5.8
Education and training .............................................................................10 6.0Availability of qualified labor...................................................................38 5.6
Affinity for Travel & Tourism ..........................................................................82 4.6Natural resources ...........................................................................................72 3.0Cultural resources...........................................................................................28 4.2
Note: For descriptions of variables and detailed sources, please refer to “How to the Read Country/Economy Profiles.”
Rank Score(out of 133) (1–7 scale)
International tourist arrivals (thousands)
International tourism receipts (US$ millions)
1995 1996 1997 1998 1999 2000 2001 2002 2003 2004 2005 2006 20072,000
3,000
4,000
5,000
1 2 3 4 5 6 7
2009–2018Percent annual growth of total (%, forecast)
part2A_profiles.r2 2/26/09 4:01 AM Page 296
The Travel & Tourism Competitiveness Report 2009 © 2009 World Economic Forum

297
2.1:
Cou
ntry
/Eco
nom
y Pr
ofile
s
The Travel & Tourism Competitiveness Index in detail ■ Competitive Advantage ■ Competitive Disadvantage
INDICATOR RANK/133
1st pillar: Policy rules and regulations1.01 Prevalence of foreign ownership .................................56 ...■1.02 Property rights................................................................9 ...■1.03 Business impact of rules on FDI ..................................75 ...■1.04 Visa requirements* ......................................................40 ...■1.05 Openness of bilateral Air Service Agreements* ..........71 ...■1.06 Transparency of government policymaking....................8 ...■1.07 Time required to start a business*...............................25 ...■1.08 Cost to start a business* .............................................20 ...■
2nd pillar: Environmental sustainability2.01 Stringency of environmental regulation .........................6 ...■2.02 Enforcement of environmental regulation......................8 ...■2.03 Sustainability of T&T industry development.................43 ...■2.04 Carbon dioxide emissions* ........................................120 ...■2.05 Particulate matter concentration* ................................25 ...■2.06 Threatened species* ....................................................32 ...■2.07 Environmental treaty ratification*...................................2 ...■
3rd pillar: Safety and security3.01 Business costs of terrorism ...........................................3 ...■3.02 Reliability of police services .........................................10 ...■3.03 Business costs of crime and violence............................4 ...■3.04 Road traffic accidents*.................................................25 ...■
4th pillar: Health and hygiene4.01 Physician density*..........................................................9 ...■4.02 Access to improved sanitation* .....................................1 ...■4.03 Access to improved drinking water*..............................1 ...■4.04 Hospital beds*..............................................................41 ...■
5th pillar: Prioritization of Travel & Tourism5.01 Government prioritization of the T&T industry.............65 ...■5.02 T&T government expenditure* ....................................26 ...■5.03 Effectiveness of marketing and branding.....................45 ...■5.04 T&T fair attendance*....................................................41 ...■
6th pillar: Air transport infrastructure6.01 Quality of air transport infrastructure ...........................10 ...■6.02 Available seat kilometers, domestic*...........................22 ...■6.03 Available seat kilometers, international* ......................49 ...■6.04 Departures per 1,000 population*..................................4 ...■6.05 Airport density* ..............................................................2 ...■6.06 Number of operating airlines*......................................35 ...■6.07 International air transport network ...............................21 ...■
7th pillar: Ground transport infrastructure7.01 Quality of roads ............................................................48 ...■7.02 Quality of railroad infrastructure...................................31 ...■7.03 Quality of port infrastructure ........................................12 ...■7.04 Quality of ground transport network ............................24 ...■7.05 Road density*...............................................................67 ...■
INDICATOR RANK/133
8th pillar: Tourism infrastructure8.01 Hotel rooms*................................................................13 ...■8.02 Presence of major car rental companies*....................23 ...■8.03 ATMs accepting Visa cards* ........................................24 ...■
9th pillar: ICT infrastructure9.01 Extent of business Internet use...................................14 ...■9.02 Internet users* ...............................................................2 ...■9.03 Telephone lines*...........................................................26 ...■9.04 Broadband Internet subscribers* ...................................7 ...■9.05 Mobile telephone subscribers*....................................28 ...■
10th pillar: Price competitiveness in the T&T industry10.01 Ticket taxes and airport charges*.................................19 ...■10.02 Purchasing power parity*...........................................130 ...■10.03 Extent and effect of taxation........................................55 ...■10.04 Fuel price levels* .......................................................128 ...■10.05 Hotel price index* ........................................................88 ...■
11th pillar: Human resources11.01 Primary education enrollment* ....................................19 ...■11.02 Secondary education enrollment*..................................8 ...■11.03 Quality of the educational system................................11 ...■11.04 Local availability of research and training services.......18 ...■11.05 Extent of staff training....................................................7 ...■11.06 Hiring and firing practices...........................................121 ...■11.07 Ease of hiring foreign labor ..........................................40 ...■11.08 HIV prevalence* ...........................................................22 ...■11.09 Business impact of HIV/AIDS.........................................1 ...■11.10 Life expectancy* ..........................................................12 ...■
12th pillar: Affinity for Travel & Tourism12.01 Tourism openness* ......................................................68 ...■12.02 Attitude of population toward foreign visitors..............36 ...■12.03 Extension of business trips recommended ...............113 ...■
13th pillar: Natural resources13.01 Number of World Heritage natural sites* ....................40 ...■13.02 Protected areas* ..........................................................99 ...■13.03 Quality of the natural environment.................................7 ...■13.04 Total known species*.................................................112 ...■
14th pillar: Cultural resources14.01 Number of World Heritage cultural sites* ...................33 ...■14.02 Sports stadiums* .........................................................12 ...■14.03 Number of international fairs and exhibitions* ............29 ...■14.04 Creative industries exports*.........................................50 ...■
Norway
* Hard data
Note: For further details and explanation, please refer to the section “How toRead the Country/Economy Profiles” at the beginning of this chapter.
part2A_profiles.r2 2/26/09 4:01 AM Page 297
The Travel & Tourism Competitiveness Report 2009 © 2009 World Economic Forum

298
2.1:
Cou
ntry
/Eco
nom
y Pr
ofile
s
OmanKey indicatorsPopulation (millions), 2007..............................................................................2.7Surface area (1,000 square kilometers) ......................................................309.5
Gross domestic product (US$ billions), 2007 ...............................................40.4Gross domestic product (PPP, US$) per capita, 2007 ...........................23,987.1Real GDP growth (percent), 2007...................................................................6.4
Environmental Performance Index, 2008 (out of 149 countries).....................91
Travel & Tourism indicators
T&T industry, 2008 estimatesGDP (US$ millions) ................................................................944...................2.1 ....................7.5Employment (1,000 jobs).........................................................30...................3.0 ....................5.0
T&T economy, 2008 estimatesGDP (US$ millions) .............................................................4,366...................9.8 ....................5.0Employment (1,000 jobs).......................................................104.................10.2 ....................3.1
Source: World Travel & Tourism Council, TSA Research 2008
International tourist arrivals (thousands), 2004...................1,195International tourism receipts (US$ millions), 2006 ..............538
Source: United Nations World Tourism Organization
Travel & Tourism Competitiveness Index
2009 Index......................................................................................................68 4.02008 Index............................................................................................................76 3.8T&T regulatory framework ..............................................................................59 4.7
Policy rules and regulations..........................................................................49 4.7Environmental sustainability..........................................................................78 4.3Safety and security .........................................................................................16 6.1Health and hygiene .........................................................................................78 4.2Prioritization of Travel & Tourism..................................................................86 4.0
T&T business environment and infrastructure ............................................53 3.8Air transport infrastructure ..........................................................................57 3.3Ground transport infrastructure....................................................................46 4.1Tourism infrastructure ....................................................................................61 3.5ICT infrastructure ............................................................................................75 2.7Price competitiveness in the T&T industry.................................................17 5.4
T&T human, cultural, and natural resources ...............................................99 3.5Human resources ............................................................................................84 4.9
Education and training .............................................................................82 4.4Availability of qualified labor...................................................................79 5.4
Affinity for Travel & Tourism ........................................................................107 4.4Natural resources ...........................................................................................82 2.9Cultural resources...........................................................................................80 2.0
Note: For descriptions of variables and detailed sources, please refer to “How to the Read Country/Economy Profiles.”
Rank Score(out of 133) (1–7 scale)
International tourist arrivals (thousands)
International tourism receipts (US$ millions)
1995 1996 1997 1998 1999 2000 2001 2002 2003 2004 2005 2006 20070
200
400
600
800
1,000
1,200
1 2 3 4 5 6 7
2009–2018Percent annual growth of total (%, forecast)
part2A_profiles.r2 2/26/09 4:01 AM Page 298
The Travel & Tourism Competitiveness Report 2009 © 2009 World Economic Forum
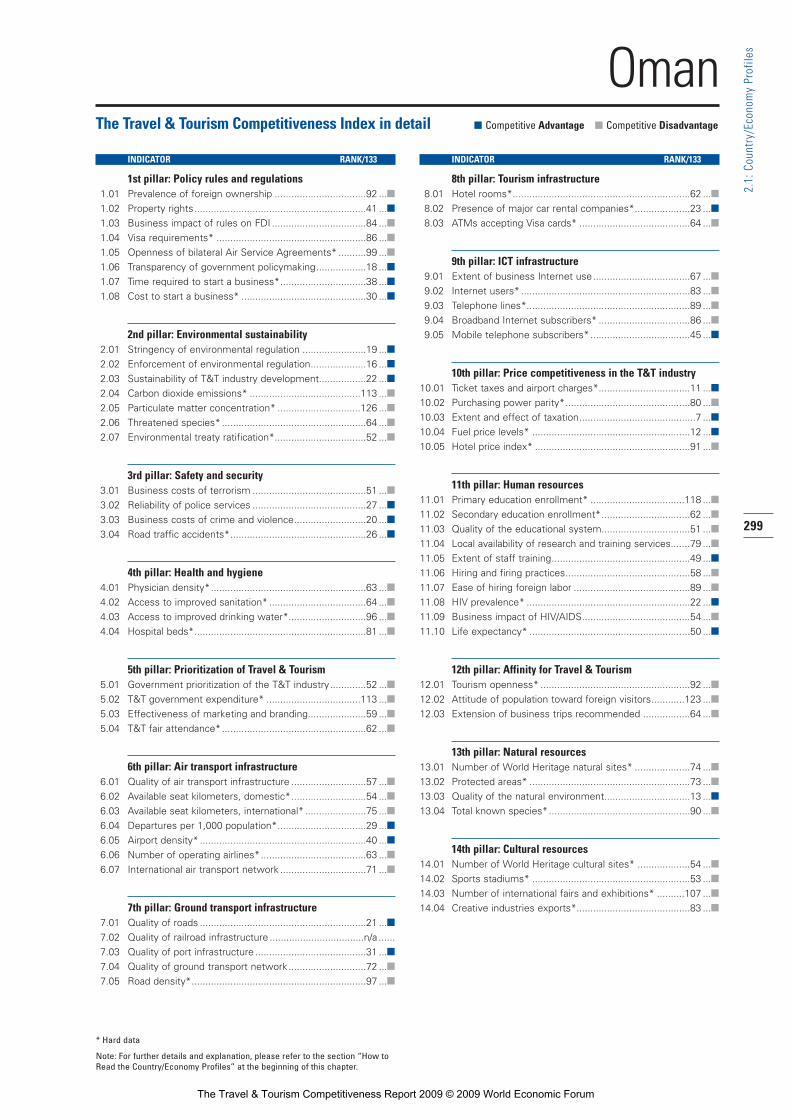
299
2.1:
Cou
ntry
/Eco
nom
y Pr
ofile
s
The Travel & Tourism Competitiveness Index in detail ■ Competitive Advantage ■ Competitive Disadvantage
INDICATOR RANK/133
1st pillar: Policy rules and regulations1.01 Prevalence of foreign ownership .................................92 ...■1.02 Property rights..............................................................41 ...■1.03 Business impact of rules on FDI ..................................84 ...■1.04 Visa requirements* ......................................................86 ...■1.05 Openness of bilateral Air Service Agreements* ..........99 ...■1.06 Transparency of government policymaking..................18 ...■1.07 Time required to start a business*...............................38 ...■1.08 Cost to start a business* .............................................30 ...■
2nd pillar: Environmental sustainability2.01 Stringency of environmental regulation .......................19 ...■2.02 Enforcement of environmental regulation....................16 ...■2.03 Sustainability of T&T industry development.................22 ...■2.04 Carbon dioxide emissions* ........................................113 ...■2.05 Particulate matter concentration* ..............................126 ...■2.06 Threatened species* ....................................................64 ...■2.07 Environmental treaty ratification*.................................52 ...■
3rd pillar: Safety and security3.01 Business costs of terrorism .........................................51 ...■3.02 Reliability of police services .........................................27 ...■3.03 Business costs of crime and violence..........................20 ...■3.04 Road traffic accidents*.................................................26 ...■
4th pillar: Health and hygiene4.01 Physician density*........................................................63 ...■4.02 Access to improved sanitation* ...................................64 ...■4.03 Access to improved drinking water*............................96 ...■4.04 Hospital beds*..............................................................81 ...■
5th pillar: Prioritization of Travel & Tourism5.01 Government prioritization of the T&T industry.............52 ...■5.02 T&T government expenditure* ..................................113 ...■5.03 Effectiveness of marketing and branding.....................59 ...■5.04 T&T fair attendance*....................................................62 ...■
6th pillar: Air transport infrastructure6.01 Quality of air transport infrastructure ...........................57 ...■6.02 Available seat kilometers, domestic*...........................54 ...■6.03 Available seat kilometers, international* ......................75 ...■6.04 Departures per 1,000 population*................................29 ...■6.05 Airport density* ............................................................40 ...■6.06 Number of operating airlines*......................................63 ...■6.07 International air transport network ...............................71 ...■
7th pillar: Ground transport infrastructure7.01 Quality of roads ............................................................21 ...■7.02 Quality of railroad infrastructure ..................................n/a ......7.03 Quality of port infrastructure ........................................31 ...■7.04 Quality of ground transport network ............................72 ...■7.05 Road density*...............................................................97 ...■
INDICATOR RANK/133
8th pillar: Tourism infrastructure8.01 Hotel rooms*................................................................62 ...■8.02 Presence of major car rental companies*....................23 ...■8.03 ATMs accepting Visa cards* ........................................64 ...■
9th pillar: ICT infrastructure9.01 Extent of business Internet use...................................67 ...■9.02 Internet users* .............................................................83 ...■9.03 Telephone lines*...........................................................89 ...■9.04 Broadband Internet subscribers* .................................86 ...■9.05 Mobile telephone subscribers*....................................45 ...■
10th pillar: Price competitiveness in the T&T industry10.01 Ticket taxes and airport charges*.................................11 ...■10.02 Purchasing power parity*.............................................80 ...■10.03 Extent and effect of taxation..........................................7 ...■10.04 Fuel price levels* .........................................................12 ...■10.05 Hotel price index* ........................................................91 ...■
11th pillar: Human resources11.01 Primary education enrollment* ..................................118 ...■11.02 Secondary education enrollment*................................62 ...■11.03 Quality of the educational system................................51 ...■11.04 Local availability of research and training services.......79 ...■11.05 Extent of staff training..................................................49 ...■11.06 Hiring and firing practices.............................................58 ...■11.07 Ease of hiring foreign labor ..........................................89 ...■11.08 HIV prevalence* ...........................................................22 ...■11.09 Business impact of HIV/AIDS.......................................54 ...■11.10 Life expectancy* ..........................................................50 ...■
12th pillar: Affinity for Travel & Tourism12.01 Tourism openness* ......................................................92 ...■12.02 Attitude of population toward foreign visitors............123 ...■12.03 Extension of business trips recommended .................64 ...■
13th pillar: Natural resources13.01 Number of World Heritage natural sites* ....................74 ...■13.02 Protected areas* ..........................................................73 ...■13.03 Quality of the natural environment...............................13 ...■13.04 Total known species*...................................................90 ...■
14th pillar: Cultural resources14.01 Number of World Heritage cultural sites* ...................54 ...■14.02 Sports stadiums* .........................................................53 ...■14.03 Number of international fairs and exhibitions* ..........107 ...■14.04 Creative industries exports*.........................................83 ...■
Oman
* Hard data
Note: For further details and explanation, please refer to the section “How toRead the Country/Economy Profiles” at the beginning of this chapter.
part2A_profiles.r2 2/26/09 4:01 AM Page 299
The Travel & Tourism Competitiveness Report 2009 © 2009 World Economic Forum

300
2.1:
Cou
ntry
/Eco
nom
y Pr
ofile
s
PakistanKey indicatorsPopulation (millions), 2007..........................................................................164.6Surface area (1,000 square kilometers) ......................................................796.1
Gross domestic product (US$ billions), 2007 .............................................143.8Gross domestic product (PPP, US$) per capita, 2007 .............................2,594.0Real GDP growth (percent), 2007...................................................................6.4
Environmental Performance Index, 2008 (out of 149 countries)...................124
Travel & Tourism indicators
T&T industry, 2008 estimatesGDP (US$ millions) .............................................................3,778...................2.3 ....................4.8Employment (1,000 jobs)....................................................1,056...................1.9 ....................2.7
T&T economy, 2008 estimatesGDP (US$ millions) .............................................................9,856...................6.1 ....................4.7Employment (1,000 jobs)....................................................2,809...................5.0 ....................2.6
Source: World Travel & Tourism Council, TSA Research 2008
International tourist arrivals (thousands), 2007......................840International tourism receipts (US$ millions), 2007 ..............276
Source: United Nations World Tourism Organization
Travel & Tourism Competitiveness Index
2009 Index....................................................................................................113 3.32008 Index..........................................................................................................111 3.4T&T regulatory framework ............................................................................124 3.6
Policy rules and regulations..........................................................................81 4.2Environmental sustainability........................................................................118 3.9Safety and security .......................................................................................132 3.1Health and hygiene .........................................................................................98 3.4Prioritization of Travel & Tourism................................................................113 3.5
T&T business environment and infrastructure ............................................94 3.0Air transport infrastructure ..........................................................................99 2.5Ground transport infrastructure....................................................................73 3.3Tourism infrastructure ..................................................................................102 1.8ICT infrastructure ..........................................................................................101 2.1Price competitiveness in the T&T industry.................................................35 5.1
T&T human, cultural, and natural resources .............................................108 3.5Human resources ..........................................................................................115 4.1
Education and training ...........................................................................126 3.0Availability of qualified labor...................................................................94 5.2
Affinity for Travel & Tourism ........................................................................129 4.0Natural resources ...........................................................................................83 2.9Cultural resources...........................................................................................44 2.9
Note: For descriptions of variables and detailed sources, please refer to “How to the Read Country/Economy Profiles.”
Rank Score(out of 133) (1–7 scale)
International tourist arrivals (thousands)
International tourism receipts (US$ millions)
1995 1996 1997 1998 1999 2000 2001 2002 2003 2004 2005 2006 20070
200
400
600
800
1,000
1 2 3 4 5 6 7
2009–2018Percent annual growth of total (%, forecast)
part2A_profiles.r2 2/26/09 4:01 AM Page 300
The Travel & Tourism Competitiveness Report 2009 © 2009 World Economic Forum

301
2.1:
Cou
ntry
/Eco
nom
y Pr
ofile
s
The Travel & Tourism Competitiveness Index in detail ■ Competitive Advantage ■ Competitive Disadvantage
INDICATOR RANK/133
1st pillar: Policy rules and regulations1.01 Prevalence of foreign ownership .................................73 ...■1.02 Property rights..............................................................93 ...■1.03 Business impact of rules on FDI ..................................29 ...■1.04 Visa requirements* ....................................................124 ...■1.05 Openness of bilateral Air Service Agreements* ..........65 ...■1.06 Transparency of government policymaking................109 ...■1.07 Time required to start a business*...............................68 ...■1.08 Cost to start a business* .............................................70 ...■
2nd pillar: Environmental sustainability2.01 Stringency of environmental regulation .......................91 ...■2.02 Enforcement of environmental regulation..................103 ...■2.03 Sustainability of T&T industry development...............117 ...■2.04 Carbon dioxide emissions* ..........................................30 ...■2.05 Particulate matter concentration* ..............................122 ...■2.06 Threatened species* ....................................................86 ...■2.07 Environmental treaty ratification*.................................52 ...■
3rd pillar: Safety and security3.01 Business costs of terrorism .......................................130 ...■3.02 Reliability of police services .......................................106 ...■3.03 Business costs of crime and violence........................110 ...■3.04 Road traffic accidents*...............................................118 ...■
4th pillar: Health and hygiene4.01 Physician density*........................................................91 ...■4.02 Access to improved sanitation* ...................................95 ...■4.03 Access to improved drinking water*............................79 ...■4.04 Hospital beds*..............................................................99 ...■
5th pillar: Prioritization of Travel & Tourism5.01 Government prioritization of the T&T industry...........114 ...■5.02 T&T government expenditure* ..................................101 ...■5.03 Effectiveness of marketing and branding...................117 ...■5.04 T&T fair attendance*....................................................62 ...■
6th pillar: Air transport infrastructure6.01 Quality of air transport infrastructure ...........................83 ...■6.02 Available seat kilometers, domestic*...........................29 ...■6.03 Available seat kilometers, international* ......................48 ...■6.04 Departures per 1,000 population*..............................112 ...■6.05 Airport density* ..........................................................119 ...■6.06 Number of operating airlines*......................................59 ...■6.07 International air transport network .............................108 ...■
7th pillar: Ground transport infrastructure7.01 Quality of roads ............................................................69 ...■7.02 Quality of railroad infrastructure...................................53 ...■7.03 Quality of port infrastructure ........................................78 ...■7.04 Quality of ground transport network ............................89 ...■7.05 Road density*...............................................................61 ...■
INDICATOR RANK/133
8th pillar: Tourism infrastructure8.01 Hotel rooms*..............................................................119 ...■8.02 Presence of major car rental companies*....................73 ...■8.03 ATMs accepting Visa cards* ......................................111 ...■
9th pillar: ICT infrastructure9.01 Extent of business Internet use...................................89 ...■9.02 Internet users* .............................................................90 ...■9.03 Telephone lines*.........................................................109 ...■9.04 Broadband Internet subscribers* ...............................102 ...■9.05 Mobile telephone subscribers*....................................90 ...■
10th pillar: Price competitiveness in the T&T industry10.01 Ticket taxes and airport charges*.................................77 ...■10.02 Purchasing power parity*.............................................13 ...■10.03 Extent and effect of taxation........................................42 ...■10.04 Fuel price levels* .........................................................36 ...■10.05 Hotel price index* ........................................................76 ...■
11th pillar: Human resources11.01 Primary education enrollment* ..................................121 ...■11.02 Secondary education enrollment*..............................120 ...■11.03 Quality of the educational system..............................104 ...■11.04 Local availability of research and training services.....103 ...■11.05 Extent of staff training................................................118 ...■11.06 Hiring and firing practices.............................................31 ...■11.07 Ease of hiring foreign labor ..........................................56 ...■11.08 HIV prevalence* ...........................................................22 ...■11.09 Business impact of HIV/AIDS.......................................94 ...■11.10 Life expectancy* ........................................................104 ...■
12th pillar: Affinity for Travel & Tourism12.01 Tourism openness* ....................................................125 ...■12.02 Attitude of population toward foreign visitors............127 ...■12.03 Extension of business trips recommended ...............114 ...■
13th pillar: Natural resources13.01 Number of World Heritage natural sites* ....................74 ...■13.02 Protected areas* ..........................................................69 ...■13.03 Quality of the natural environment.............................105 ...■13.04 Total known species*...................................................42 ...■
14th pillar: Cultural resources14.01 Number of World Heritage cultural sites* ...................33 ...■14.02 Sports stadiums* .......................................................120 ...■14.03 Number of international fairs and exhibitions* ............77 ...■14.04 Creative industries exports*.........................................27 ...■
Pakistan
* Hard data
Note: For further details and explanation, please refer to the section “How toRead the Country/Economy Profiles” at the beginning of this chapter.
part2A_profiles.r2 2/26/09 4:01 AM Page 301
The Travel & Tourism Competitiveness Report 2009 © 2009 World Economic Forum

302
2.1:
Cou
ntry
/Eco
nom
y Pr
ofile
s
PanamaKey indicatorsPopulation (millions), 2007..............................................................................3.3Surface area (1,000 square kilometers) ........................................................75.5
Gross domestic product (US$ billions), 2007 ...............................................19.7Gross domestic product (PPP, US$) per capita, 2007 ...........................10,351.4Real GDP growth (percent), 2007.................................................................11.5
Environmental Performance Index, 2008 (out of 149 countries).....................32
Travel & Tourism indicators
T&T industry, 2008 estimatesGDP (US$ millions) .............................................................1,071...................4.9 ....................5.3Employment (1,000 jobs).........................................................68...................4.9 ....................3.2
T&T economy, 2008 estimatesGDP (US$ millions) .............................................................2,650.................12.1 ....................4.7Employment (1,000 jobs).......................................................161.................11.6 ....................2.7
Source: World Travel & Tourism Council, TSA Research 2008
International tourist arrivals (thousands), 2007...................1,103International tourism receipts (US$ millions), 2007 ...........1,185
Source: United Nations World Tourism Organization
Travel & Tourism Competitiveness Index
2009 Index......................................................................................................55 4.22008 Index............................................................................................................50 4.3T&T regulatory framework ..............................................................................53 4.8
Policy rules and regulations..........................................................................30 5.1Environmental sustainability..........................................................................34 4.9Safety and security .........................................................................................70 5.1Health and hygiene .........................................................................................83 4.1Prioritization of Travel & Tourism..................................................................48 4.7
T&T business environment and infrastructure ............................................56 3.8Air transport infrastructure ..........................................................................36 4.2Ground transport infrastructure....................................................................74 3.3Tourism infrastructure ....................................................................................56 3.7ICT infrastructure ............................................................................................76 2.7Price competitiveness in the T&T industry.................................................33 5.1
T&T human, cultural, and natural resources ...............................................53 4.1Human resources ............................................................................................87 4.9
Education and training .............................................................................76 4.5Availability of qualified labor...................................................................93 5.2
Affinity for Travel & Tourism ..........................................................................58 4.9Natural resources .............................................................................................9 5.2Cultural resources...........................................................................................96 1.6
Note: For descriptions of variables and detailed sources, please refer to “How to the Read Country/Economy Profiles.”
Rank Score(out of 133) (1–7 scale)
International tourist arrivals (thousands)
International tourism receipts (US$ millions)
1995 1996 1997 1998 1999 2000 2001 2002 2003 2004 2005 2006 2007200
400
600
800
1,000
1,200
1 2 3 4 5 6 7
2009–2018Percent annual growth of total (%, forecast)
part2A_profiles.r2 2/26/09 4:01 AM Page 302
The Travel & Tourism Competitiveness Report 2009 © 2009 World Economic Forum
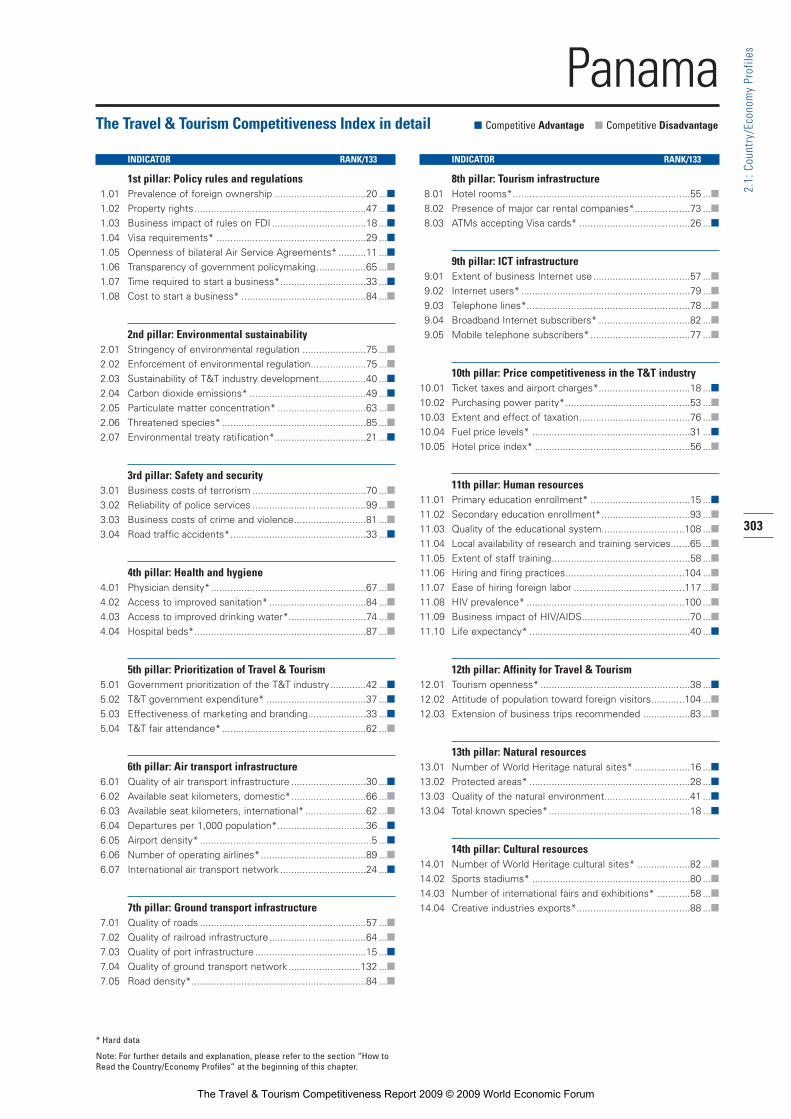
303
2.1:
Cou
ntry
/Eco
nom
y Pr
ofile
s
The Travel & Tourism Competitiveness Index in detail ■ Competitive Advantage ■ Competitive Disadvantage
INDICATOR RANK/133
1st pillar: Policy rules and regulations1.01 Prevalence of foreign ownership .................................20 ...■1.02 Property rights..............................................................47 ...■1.03 Business impact of rules on FDI ..................................18 ...■1.04 Visa requirements* ......................................................29 ...■1.05 Openness of bilateral Air Service Agreements* ..........11 ...■1.06 Transparency of government policymaking..................65 ...■1.07 Time required to start a business*...............................33 ...■1.08 Cost to start a business* .............................................84 ...■
2nd pillar: Environmental sustainability2.01 Stringency of environmental regulation .......................75 ...■2.02 Enforcement of environmental regulation....................75 ...■2.03 Sustainability of T&T industry development.................40 ...■2.04 Carbon dioxide emissions* ..........................................49 ...■2.05 Particulate matter concentration* ................................63 ...■2.06 Threatened species* ....................................................85 ...■2.07 Environmental treaty ratification*.................................21 ...■
3rd pillar: Safety and security3.01 Business costs of terrorism .........................................70 ...■3.02 Reliability of police services .........................................99 ...■3.03 Business costs of crime and violence..........................81 ...■3.04 Road traffic accidents*.................................................33 ...■
4th pillar: Health and hygiene4.01 Physician density*........................................................67 ...■4.02 Access to improved sanitation* ...................................84 ...■4.03 Access to improved drinking water*............................74 ...■4.04 Hospital beds*..............................................................87 ...■
5th pillar: Prioritization of Travel & Tourism5.01 Government prioritization of the T&T industry.............42 ...■5.02 T&T government expenditure* ....................................37 ...■5.03 Effectiveness of marketing and branding.....................33 ...■5.04 T&T fair attendance*....................................................62 ...■
6th pillar: Air transport infrastructure6.01 Quality of air transport infrastructure ...........................30 ...■6.02 Available seat kilometers, domestic*...........................66 ...■6.03 Available seat kilometers, international* ......................62 ...■6.04 Departures per 1,000 population*................................36 ...■6.05 Airport density* ..............................................................5 ...■6.06 Number of operating airlines*......................................89 ...■6.07 International air transport network ...............................24 ...■
7th pillar: Ground transport infrastructure7.01 Quality of roads ............................................................57 ...■7.02 Quality of railroad infrastructure...................................64 ...■7.03 Quality of port infrastructure ........................................15 ...■7.04 Quality of ground transport network..........................132 ...■7.05 Road density*...............................................................84 ...■
INDICATOR RANK/133
8th pillar: Tourism infrastructure8.01 Hotel rooms*................................................................55 ...■8.02 Presence of major car rental companies*....................73 ...■8.03 ATMs accepting Visa cards* ........................................26 ...■
9th pillar: ICT infrastructure9.01 Extent of business Internet use...................................57 ...■9.02 Internet users* .............................................................79 ...■9.03 Telephone lines*...........................................................78 ...■9.04 Broadband Internet subscribers* .................................82 ...■9.05 Mobile telephone subscribers*....................................77 ...■
10th pillar: Price competitiveness in the T&T industry10.01 Ticket taxes and airport charges*.................................18 ...■10.02 Purchasing power parity*.............................................53 ...■10.03 Extent and effect of taxation........................................76 ...■10.04 Fuel price levels* .........................................................31 ...■10.05 Hotel price index* ........................................................56 ...■
11th pillar: Human resources11.01 Primary education enrollment* ....................................15 ...■11.02 Secondary education enrollment*................................93 ...■11.03 Quality of the educational system..............................108 ...■11.04 Local availability of research and training services.......65 ...■11.05 Extent of staff training..................................................58 ...■11.06 Hiring and firing practices...........................................104 ...■11.07 Ease of hiring foreign labor ........................................117 ...■11.08 HIV prevalence* .........................................................100 ...■11.09 Business impact of HIV/AIDS.......................................70 ...■11.10 Life expectancy* ..........................................................40 ...■
12th pillar: Affinity for Travel & Tourism12.01 Tourism openness* ......................................................38 ...■12.02 Attitude of population toward foreign visitors............104 ...■12.03 Extension of business trips recommended .................83 ...■
13th pillar: Natural resources13.01 Number of World Heritage natural sites* ....................16 ...■13.02 Protected areas* ..........................................................28 ...■13.03 Quality of the natural environment...............................41 ...■13.04 Total known species*...................................................18 ...■
14th pillar: Cultural resources14.01 Number of World Heritage cultural sites* ...................82 ...■14.02 Sports stadiums* .........................................................80 ...■14.03 Number of international fairs and exhibitions* ............58 ...■14.04 Creative industries exports*.........................................88 ...■
Panama
* Hard data
Note: For further details and explanation, please refer to the section “How toRead the Country/Economy Profiles” at the beginning of this chapter.
part2A_profiles.r2 2/26/09 4:01 AM Page 303
The Travel & Tourism Competitiveness Report 2009 © 2009 World Economic Forum

304
2.1:
Cou
ntry
/Eco
nom
y Pr
ofile
s
ParaguayKey indicatorsPopulation (millions), 2007..............................................................................6.4Surface area (1,000 square kilometers) ......................................................406.8
Gross domestic product (US$ billions), 2007 ...............................................12.0Gross domestic product (PPP, US$) per capita, 2007 .............................4,509.7Real GDP growth (percent), 2007...................................................................6.8
Environmental Performance Index, 2008 (out of 149 countries).....................63
Travel & Tourism indicators
T&T industry, 2008 estimatesGDP (US$ millions) ................................................................165...................1.3 ....................2.3Employment (1,000 jobs).........................................................34...................1.2 ....................1.7
T&T economy, 2008 estimatesGDP (US$ millions) ................................................................582...................4.6 ....................2.9Employment (1,000 jobs).......................................................113...................4.0 ....................2.2
Source: World Travel & Tourism Council, TSA Research 2008
International tourist arrivals (thousands), 2007......................416International tourism receipts (US$ millions), 2007 ..............102
Source: United Nations World Tourism Organization
Travel & Tourism Competitiveness Index
2009 Index....................................................................................................122 3.22008 Index..........................................................................................................115 3.2T&T regulatory framework ............................................................................116 3.7
Policy rules and regulations........................................................................121 3.4Environmental sustainability........................................................................121 3.8Safety and security .......................................................................................105 4.4Health and hygiene .........................................................................................99 3.4Prioritization of Travel & Tourism..................................................................98 3.8
T&T business environment and infrastructure ..........................................130 2.4Air transport infrastructure ........................................................................133 1.6Ground transport infrastructure..................................................................132 2.1Tourism infrastructure ..................................................................................127 1.2ICT infrastructure ............................................................................................99 2.1Price competitiveness in the T&T industry.................................................25 5.2
T&T human, cultural, and natural resources .............................................122 3.3Human resources ............................................................................................97 4.6
Education and training ...........................................................................109 3.7Availability of qualified labor...................................................................51 5.5
Affinity for Travel & Tourism ........................................................................130 3.9Natural resources ...........................................................................................66 3.1Cultural resources.........................................................................................102 1.6
Note: For descriptions of variables and detailed sources, please refer to “How to the Read Country/Economy Profiles.”
Rank Score(out of 133) (1–7 scale)
International tourist arrivals (thousands)
International tourism receipts (US$ millions)
1995 1996 1997 1998 1999 2000 2001 2002 2003 2004 2005 2006 20070
100
200
300
400
500
1 2 3 4 5 6 7
2009–2018Percent annual growth of total (%, forecast)
part2A_profiles.r2 2/26/09 4:01 AM Page 304
The Travel & Tourism Competitiveness Report 2009 © 2009 World Economic Forum

305
2.1:
Cou
ntry
/Eco
nom
y Pr
ofile
s
The Travel & Tourism Competitiveness Index in detail ■ Competitive Advantage ■ Competitive Disadvantage
INDICATOR RANK/133
1st pillar: Policy rules and regulations1.01 Prevalence of foreign ownership ...............................115 ...■1.02 Property rights............................................................129 ...■1.03 Business impact of rules on FDI ................................119 ...■1.04 Visa requirements* ......................................................76 ...■1.05 Openness of bilateral Air Service Agreements* ..........36 ...■1.06 Transparency of government policymaking................126 ...■1.07 Time required to start a business*...............................93 ...■1.08 Cost to start a business* ...........................................110 ...■
2nd pillar: Environmental sustainability2.01 Stringency of environmental regulation .....................111 ...■2.02 Enforcement of environmental regulation..................126 ...■2.03 Sustainability of T&T industry development...............128 ...■2.04 Carbon dioxide emissions* ..........................................24 ...■2.05 Particulate matter concentration* ..............................110 ...■2.06 Threatened species* ....................................................52 ...■2.07 Environmental treaty ratification*.................................81 ...■
3rd pillar: Safety and security3.01 Business costs of terrorism .........................................66 ...■3.02 Reliability of police services .......................................132 ...■3.03 Business costs of crime and violence........................121 ...■3.04 Road traffic accidents*.................................................40 ...■
4th pillar: Health and hygiene4.01 Physician density*........................................................86 ...■4.02 Access to improved sanitation* ...................................88 ...■4.03 Access to improved drinking water*..........................106 ...■4.04 Hospital beds*..............................................................95 ...■
5th pillar: Prioritization of Travel & Tourism5.01 Government prioritization of the T&T industry...........130 ...■5.02 T&T government expenditure* ....................................15 ...■5.03 Effectiveness of marketing and branding...................129 ...■5.04 T&T fair attendance*....................................................81 ...■
6th pillar: Air transport infrastructure6.01 Quality of air transport infrastructure .........................133 ...■6.02 Available seat kilometers, domestic*...........................81 ...■6.03 Available seat kilometers, international* ....................116 ...■6.04 Departures per 1,000 population*................................80 ...■6.05 Airport density* ..........................................................100 ...■6.06 Number of operating airlines*....................................129 ...■6.07 International air transport network .............................132 ...■
7th pillar: Ground transport infrastructure7.01 Quality of roads ..........................................................129 ...■7.02 Quality of railroad infrastructure.................................119 ...■7.03 Quality of port infrastructure ........................................68 ...■7.04 Quality of ground transport network..........................133 ...■7.05 Road density*.............................................................112 ...■
INDICATOR RANK/133
8th pillar: Tourism infrastructure8.01 Hotel rooms*..............................................................105 ...■8.02 Presence of major car rental companies*..................122 ...■8.03 ATMs accepting Visa cards* ........................................97 ...■
9th pillar: ICT infrastructure9.01 Extent of business Internet use.................................127 ...■9.02 Internet users* ...........................................................109 ...■9.03 Telephone lines*...........................................................99 ...■9.04 Broadband Internet subscribers* .................................85 ...■9.05 Mobile telephone subscribers*....................................79 ...■
10th pillar: Price competitiveness in the T&T industry10.01 Ticket taxes and airport charges*.................................53 ...■10.02 Purchasing power parity*.............................................28 ...■10.03 Extent and effect of taxation........................................22 ...■10.04 Fuel price levels* .........................................................54 ...■10.05 Hotel price index* ........................................................44 ...■
11th pillar: Human resources11.01 Primary education enrollment* ....................................59 ...■11.02 Secondary education enrollment*................................98 ...■11.03 Quality of the educational system..............................133 ...■11.04 Local availability of research and training services.....131 ...■11.05 Extent of staff training................................................128 ...■11.06 Hiring and firing practices.............................................98 ...■11.07 Ease of hiring foreign labor ..........................................22 ...■11.08 HIV prevalence* ...........................................................85 ...■11.09 Business impact of HIV/AIDS.......................................89 ...■11.10 Life expectancy* ..........................................................42 ...■
12th pillar: Affinity for Travel & Tourism12.01 Tourism openness* ....................................................116 ...■12.02 Attitude of population toward foreign visitors..............97 ...■12.03 Extension of business trips recommended ...............131 ...■
13th pillar: Natural resources13.01 Number of World Heritage natural sites* ....................74 ...■13.02 Protected areas* ..........................................................89 ...■13.03 Quality of the natural environment...............................50 ...■13.04 Total known species*...................................................37 ...■
14th pillar: Cultural resources14.01 Number of World Heritage cultural sites* ...................97 ...■14.02 Sports stadiums* .........................................................59 ...■14.03 Number of international fairs and exhibitions* ............74 ...■14.04 Creative industries exports*.........................................99 ...■
Paraguay
* Hard data
Note: For further details and explanation, please refer to the section “How toRead the Country/Economy Profiles” at the beginning of this chapter.
part2A_profiles.r2 2/26/09 4:01 AM Page 305
The Travel & Tourism Competitiveness Report 2009 © 2009 World Economic Forum

306
2.1:
Cou
ntry
/Eco
nom
y Pr
ofile
s
PeruKey indicatorsPopulation (millions), 2007............................................................................28.8Surface area (1,000 square kilometers) ...................................................1,285.2
Gross domestic product (US$ billions), 2007 .............................................107.4Gross domestic product (PPP, US$) per capita, 2007 .............................7,809.4Real GDP growth (percent), 2007...................................................................8.9
Environmental Performance Index, 2008 (out of 149 countries).....................60
Travel & Tourism indicators
T&T industry, 2008 estimatesGDP (US$ millions) .............................................................3,240...................2.8 ....................4.3Employment (1,000 jobs).......................................................348...................2.7 ....................2.8
T&T economy, 2008 estimatesGDP (US$ millions) .............................................................8,701...................7.5 ....................4.1Employment (1,000 jobs).......................................................892...................6.9 ....................2.7
Source: World Travel & Tourism Council, TSA Research 2008
International tourist arrivals (thousands), 2007...................1,812International tourism receipts (US$ millions), 2007 ...........1,938
Source: United Nations World Tourism Organization
Travel & Tourism Competitiveness Index
2009 Index......................................................................................................74 3.92008 Index............................................................................................................70 3.9T&T regulatory framework ..............................................................................89 4.2
Policy rules and regulations..........................................................................63 4.5Environmental sustainability..........................................................................85 4.3Safety and security .......................................................................................108 4.3Health and hygiene .........................................................................................96 3.6Prioritization of Travel & Tourism..................................................................53 4.6
T&T business environment and infrastructure ............................................92 3.0Air transport infrastructure ..........................................................................92 2.6Ground transport infrastructure..................................................................125 2.2Tourism infrastructure ....................................................................................78 2.5ICT infrastructure ............................................................................................81 2.5Price competitiveness in the T&T industry.................................................47 4.9
T&T human, cultural, and natural resources ...............................................33 4.4Human resources ............................................................................................71 5.0
Education and training .............................................................................77 4.5Availability of qualified labor...................................................................50 5.5
Affinity for Travel & Tourism ..........................................................................85 4.6Natural resources .............................................................................................8 5.2Cultural resources...........................................................................................42 2.9
Note: For descriptions of variables and detailed sources, please refer to “How to the Read Country/Economy Profiles.”
Rank Score(out of 133) (1–7 scale)
International tourist arrivals (thousands)
International tourism receipts (US$ millions)
1995 1996 1997 1998 1999 2000 2001 2002 2003 2004 2005 2006 20070
500
1,000
1,500
2,000
1 2 3 4 5 6 7
2009–2018Percent annual growth of total (%, forecast)
part2A_profiles.r2 2/26/09 4:01 AM Page 306
The Travel & Tourism Competitiveness Report 2009 © 2009 World Economic Forum

307
2.1:
Cou
ntry
/Eco
nom
y Pr
ofile
s
The Travel & Tourism Competitiveness Index in detail ■ Competitive Advantage ■ Competitive Disadvantage
INDICATOR RANK/133
1st pillar: Policy rules and regulations1.01 Prevalence of foreign ownership .................................19 ...■1.02 Property rights............................................................102 ...■1.03 Business impact of rules on FDI ..................................30 ...■1.04 Visa requirements* ......................................................10 ...■1.05 Openness of bilateral Air Service Agreements* ............7 ...■1.06 Transparency of government policymaking..................96 ...■1.07 Time required to start a business*.............................117 ...■1.08 Cost to start a business* .............................................88 ...■
2nd pillar: Environmental sustainability2.01 Stringency of environmental regulation .......................95 ...■2.02 Enforcement of environmental regulation..................102 ...■2.03 Sustainability of T&T industry development.................70 ...■2.04 Carbon dioxide emissions* ..........................................38 ...■2.05 Particulate matter concentration* ................................93 ...■2.06 Threatened species* ..................................................112 ...■2.07 Environmental treaty ratification*.................................52 ...■
3rd pillar: Safety and security3.01 Business costs of terrorism .......................................102 ...■3.02 Reliability of police services .......................................122 ...■3.03 Business costs of crime and violence........................113 ...■3.04 Road traffic accidents*.................................................88 ...■
4th pillar: Health and hygiene4.01 Physician density*........................................................80 ...■4.02 Access to improved sanitation* ...................................85 ...■4.03 Access to improved drinking water*............................92 ...■4.04 Hospital beds*............................................................107 ...■
5th pillar: Prioritization of Travel & Tourism5.01 Government prioritization of the T&T industry.............59 ...■5.02 T&T government expenditure* ....................................81 ...■5.03 Effectiveness of marketing and branding.....................43 ...■5.04 T&T fair attendance*....................................................25 ...■
6th pillar: Air transport infrastructure6.01 Quality of air transport infrastructure ...........................94 ...■6.02 Available seat kilometers, domestic*...........................33 ...■6.03 Available seat kilometers, international* ......................47 ...■6.04 Departures per 1,000 population*................................75 ...■6.05 Airport density* ............................................................73 ...■6.06 Number of operating airlines*......................................78 ...■6.07 International air transport network ...............................90 ...■
7th pillar: Ground transport infrastructure7.01 Quality of roads ............................................................99 ...■7.02 Quality of railroad infrastructure...................................90 ...■7.03 Quality of port infrastructure ......................................127 ...■7.04 Quality of ground transport network..........................120 ...■7.05 Road density*.............................................................114 ...■
INDICATOR RANK/133
8th pillar: Tourism infrastructure8.01 Hotel rooms*................................................................54 ...■8.02 Presence of major car rental companies*....................73 ...■8.03 ATMs accepting Visa cards* ........................................92 ...■
9th pillar: ICT infrastructure9.01 Extent of business Internet use...................................90 ...■9.02 Internet users* .............................................................53 ...■9.03 Telephone lines*...........................................................92 ...■9.04 Broadband Internet subscribers* .................................68 ...■9.05 Mobile telephone subscribers*....................................87 ...■
10th pillar: Price competitiveness in the T&T industry10.01 Ticket taxes and airport charges*.................................86 ...■10.02 Purchasing power parity*.............................................44 ...■10.03 Extent and effect of taxation........................................74 ...■10.04 Fuel price levels* .........................................................66 ...■10.05 Hotel price index* ........................................................18 ...■
11th pillar: Human resources11.01 Primary education enrollment* ....................................42 ...■11.02 Secondary education enrollment*................................46 ...■11.03 Quality of the educational system..............................132 ...■11.04 Local availability of research and training services.......86 ...■11.05 Extent of staff training..................................................93 ...■11.06 Hiring and firing practices.............................................93 ...■11.07 Ease of hiring foreign labor ..........................................20 ...■11.08 HIV prevalence* ...........................................................78 ...■11.09 Business impact of HIV/AIDS.......................................81 ...■11.10 Life expectancy* ..........................................................55 ...■
12th pillar: Affinity for Travel & Tourism12.01 Tourism openness* ....................................................103 ...■12.02 Attitude of population toward foreign visitors..............85 ...■12.03 Extension of business trips recommended .................52 ...■
13th pillar: Natural resources13.01 Number of World Heritage natural sites* ....................10 ...■13.02 Protected areas* ..........................................................55 ...■13.03 Quality of the natural environment...............................76 ...■13.04 Total known species*.....................................................3 ...■
14th pillar: Cultural resources14.01 Number of World Heritage cultural sites* ...................19 ...■14.02 Sports stadiums* .........................................................73 ...■14.03 Number of international fairs and exhibitions* ............50 ...■14.04 Creative industries exports*.........................................49 ...■
Peru
* Hard data
Note: For further details and explanation, please refer to the section “How toRead the Country/Economy Profiles” at the beginning of this chapter.
part2A_profiles.r2 2/26/09 4:01 AM Page 307
The Travel & Tourism Competitiveness Report 2009 © 2009 World Economic Forum

308
2.1:
Cou
ntry
/Eco
nom
y Pr
ofile
s
PhilippinesKey indicatorsPopulation (millions), 2007............................................................................85.9Surface area (1,000 square kilometers) ......................................................300.0
Gross domestic product (US$ billions), 2007 .............................................144.1Gross domestic product (PPP, US$) per capita, 2007 .............................3,383.3Real GDP growth (percent), 2007...................................................................7.2
Environmental Performance Index, 2008 (out of 149 countries).....................61
Travel & Tourism indicators
T&T industry, 2008 estimatesGDP (US$ millions) .............................................................6,774...................3.9 ....................4.0Employment (1,000 jobs)....................................................1,377...................4.0 ....................1.3
T&T economy, 2008 estimatesGDP (US$ millions) ...........................................................15,115...................8.8 ....................4.5Employment (1,000 jobs)....................................................3,541.................10.3 ....................1.5
Source: World Travel & Tourism Council, TSA Research 2008
International tourist arrivals (thousands), 2007...................3,092International tourism receipts (US$ millions), 2007 ...........4,931
Source: United Nations World Tourism Organization
Travel & Tourism Competitiveness Index
2009 Index......................................................................................................86 3.72008 Index............................................................................................................81 3.7T&T regulatory framework ..............................................................................85 4.3
Policy rules and regulations..........................................................................72 4.3Environmental sustainability..........................................................................73 4.4Safety and security .......................................................................................113 4.1Health and hygiene .........................................................................................87 4.0Prioritization of Travel & Tourism..................................................................59 4.5
T&T business environment and infrastructure ............................................89 3.1Air transport infrastructure ..........................................................................73 2.9Ground transport infrastructure....................................................................90 3.0Tourism infrastructure ....................................................................................96 1.9ICT infrastructure ............................................................................................92 2.2Price competitiveness in the T&T industry.................................................16 5.4
T&T human, cultural, and natural resources ...............................................70 3.9Human resources ............................................................................................69 5.0
Education and training .............................................................................51 5.0Availability of qualified labor...................................................................98 5.1
Affinity for Travel & Tourism ..........................................................................53 4.9Natural resources ...........................................................................................65 3.1Cultural resources...........................................................................................63 2.4
Note: For descriptions of variables and detailed sources, please refer to “How to the Read Country/Economy Profiles.”
Rank Score(out of 133) (1–7 scale)
International tourist arrivals (thousands)
International tourism receipts (US$ millions)
1995 1996 1997 1998 1999 2000 2001 2002 2003 2004 2005 2006 20071,000
2,000
3,000
4,000
5,000
1 2 3 4 5 6 7
2009–2018Percent annual growth of total (%, forecast)
part2A_profiles.r2 2/26/09 4:01 AM Page 308
The Travel & Tourism Competitiveness Report 2009 © 2009 World Economic Forum

309
2.1:
Cou
ntry
/Eco
nom
y Pr
ofile
s
The Travel & Tourism Competitiveness Index in detail ■ Competitive Advantage ■ Competitive Disadvantage
INDICATOR RANK/133
1st pillar: Policy rules and regulations1.01 Prevalence of foreign ownership .................................98 ...■1.02 Property rights..............................................................92 ...■1.03 Business impact of rules on FDI ..................................97 ...■1.04 Visa requirements* ........................................................3 ...■1.05 Openness of bilateral Air Service Agreements* ..........28 ...■1.06 Transparency of government policymaking..................85 ...■1.07 Time required to start a business*.............................114 ...■1.08 Cost to start a business* .............................................94 ...■
2nd pillar: Environmental sustainability2.01 Stringency of environmental regulation .......................65 ...■2.02 Enforcement of environmental regulation....................97 ...■2.03 Sustainability of T&T industry development.................84 ...■2.04 Carbon dioxide emissions* ..........................................34 ...■2.05 Particulate matter concentration* ................................42 ...■2.06 Threatened species* ..................................................129 ...■2.07 Environmental treaty ratification*.................................34 ...■
3rd pillar: Safety and security3.01 Business costs of terrorism .......................................125 ...■3.02 Reliability of police services .........................................98 ...■3.03 Business costs of crime and violence..........................93 ...■3.04 Road traffic accidents*...............................................108 ...■
4th pillar: Health and hygiene4.01 Physician density*........................................................81 ...■4.02 Access to improved sanitation* ...................................80 ...■4.03 Access to improved drinking water*............................68 ...■4.04 Hospital beds*..............................................................95 ...■
5th pillar: Prioritization of Travel & Tourism5.01 Government prioritization of the T&T industry.............55 ...■5.02 T&T government expenditure* ....................................59 ...■5.03 Effectiveness of marketing and branding.....................70 ...■5.04 T&T fair attendance*....................................................41 ...■
6th pillar: Air transport infrastructure6.01 Quality of air transport infrastructure ...........................89 ...■6.02 Available seat kilometers, domestic*...........................23 ...■6.03 Available seat kilometers, international* ......................29 ...■6.04 Departures per 1,000 population*................................98 ...■6.05 Airport density* ............................................................86 ...■6.06 Number of operating airlines*......................................48 ...■6.07 International air transport network ...............................76 ...■
7th pillar: Ground transport infrastructure7.01 Quality of roads ............................................................94 ...■7.02 Quality of railroad infrastructure...................................85 ...■7.03 Quality of port infrastructure ......................................100 ...■7.04 Quality of ground transport network..........................115 ...■7.05 Road density*...............................................................44 ...■
INDICATOR RANK/133
8th pillar: Tourism infrastructure8.01 Hotel rooms*..............................................................118 ...■8.02 Presence of major car rental companies*....................73 ...■8.03 ATMs accepting Visa cards* ........................................93 ...■
9th pillar: ICT infrastructure9.01 Extent of business Internet use...................................75 ...■9.02 Internet users* ...........................................................103 ...■9.03 Telephone lines*.........................................................107 ...■9.04 Broadband Internet subscribers* .................................80 ...■9.05 Mobile telephone subscribers*....................................85 ...■
10th pillar: Price competitiveness in the T&T industry10.01 Ticket taxes and airport charges*.................................17 ...■10.02 Purchasing power parity*.............................................40 ...■10.03 Extent and effect of taxation........................................65 ...■10.04 Fuel price levels* .........................................................42 ...■10.05 Hotel price index* ........................................................12 ...■
11th pillar: Human resources11.01 Primary education enrollment* ....................................76 ...■11.02 Secondary education enrollment*................................79 ...■11.03 Quality of the educational system................................46 ...■11.04 Local availability of research and training services.......51 ...■11.05 Extent of staff training..................................................30 ...■11.06 Hiring and firing practices...........................................100 ...■11.07 Ease of hiring foreign labor ........................................116 ...■11.08 HIV prevalence* .............................................................1 ...■11.09 Business impact of HIV/AIDS.......................................61 ...■11.10 Life expectancy* ..........................................................89 ...■
12th pillar: Affinity for Travel & Tourism12.01 Tourism openness* ......................................................76 ...■12.02 Attitude of population toward foreign visitors..............46 ...■12.03 Extension of business trips recommended .................38 ...■
13th pillar: Natural resources13.01 Number of World Heritage natural sites* ....................23 ...■13.02 Protected areas* ........................................................104 ...■13.03 Quality of the natural environment.............................124 ...■13.04 Total known species*...................................................40 ...■
14th pillar: Cultural resources14.01 Number of World Heritage cultural sites* ...................45 ...■14.02 Sports stadiums* .......................................................124 ...■14.03 Number of international fairs and exhibitions* ............43 ...■14.04 Creative industries exports*.........................................37 ...■
Philippines
* Hard data
Note: For further details and explanation, please refer to the section “How toRead the Country/Economy Profiles” at the beginning of this chapter.
part2A_profiles.r2 2/26/09 4:01 AM Page 309
The Travel & Tourism Competitiveness Report 2009 © 2009 World Economic Forum

310
2.1:
Cou
ntry
/Eco
nom
y Pr
ofile
s
PolandKey indicatorsPopulation (millions), 2007............................................................................38.5Surface area (1,000 square kilometers) ......................................................312.7
Gross domestic product (US$ billions), 2007 .............................................422.1Gross domestic product (PPP, US$) per capita, 2007 ...........................16,316.2Real GDP growth (percent), 2007...................................................................6.6
Environmental Performance Index, 2008 (out of 149 countries).....................42
Travel & Tourism indicators
T&T industry, 2008 estimatesGDP (US$ millions) .............................................................7,962...................1.6 ....................4.8Employment (1,000 jobs).......................................................244...................1.6 ..................–0.1
T&T economy, 2008 estimatesGDP (US$ millions) ...........................................................38,780...................7.7 ....................5.7Employment (1,000 jobs)....................................................1,092...................7.1 ....................0.7
Source: World Travel & Tourism Council, TSA Research 2008
International tourist arrivals (thousands), 2007.................14,975International tourism receipts (US$ millions), 2007 .........10,627
Source: United Nations World Tourism Organization
Travel & Tourism Competitiveness Index
2009 Index......................................................................................................58 4.22008 Index............................................................................................................56 4.2T&T regulatory framework ..............................................................................72 4.4
Policy rules and regulations..........................................................................75 4.3Environmental sustainability..........................................................................63 4.6Safety and security .........................................................................................91 4.6Health and hygiene .........................................................................................67 4.5Prioritization of Travel & Tourism..................................................................82 4.1
T&T business environment and infrastructure ............................................68 3.5Air transport infrastructure ..........................................................................79 2.7Ground transport infrastructure....................................................................68 3.5Tourism infrastructure ....................................................................................59 3.5ICT infrastructure ............................................................................................41 3.8Price competitiveness in the T&T industry...............................................105 4.1
T&T human, cultural, and natural resources ...............................................29 4.6Human resources ............................................................................................56 5.2
Education and training .............................................................................41 5.0Availability of qualified labor...................................................................88 5.3
Affinity for Travel & Tourism ........................................................................102 4.5Natural resources ...........................................................................................54 3.5Cultural resources...........................................................................................21 5.1
Note: For descriptions of variables and detailed sources, please refer to “How to the Read Country/Economy Profiles.”
Rank Score(out of 133) (1–7 scale)
International tourist arrivals (thousands)
International tourism receipts (US$ millions)
1995 1996 1997 1998 1999 2000 2001 2002 2003 2004 2005 2006 20070
5,000
10,000
15,000
20,000
1 2 3 4 5 6 7
2009–2018Percent annual growth of total (%, forecast)
part2A_profiles.r2 2/26/09 4:01 AM Page 310
The Travel & Tourism Competitiveness Report 2009 © 2009 World Economic Forum

311
2.1:
Cou
ntry
/Eco
nom
y Pr
ofile
s
The Travel & Tourism Competitiveness Index in detail ■ Competitive Advantage ■ Competitive Disadvantage
INDICATOR RANK/133
1st pillar: Policy rules and regulations1.01 Prevalence of foreign ownership .................................77 ...■1.02 Property rights..............................................................94 ...■1.03 Business impact of rules on FDI ..................................99 ...■1.04 Visa requirements* ......................................................40 ...■1.05 Openness of bilateral Air Service Agreements* ..........12 ...■1.06 Transparency of government policymaking................127 ...■1.07 Time required to start a business*...............................85 ...■1.08 Cost to start a business* .............................................82 ...■
2nd pillar: Environmental sustainability2.01 Stringency of environmental regulation .......................72 ...■2.02 Enforcement of environmental regulation....................79 ...■2.03 Sustainability of T&T industry development...............118 ...■2.04 Carbon dioxide emissions* ..........................................95 ...■2.05 Particulate matter concentration* ................................69 ...■2.06 Threatened species* ....................................................34 ...■2.07 Environmental treaty ratification*.................................21 ...■
3rd pillar: Safety and security3.01 Business costs of terrorism .........................................85 ...■3.02 Reliability of police services .........................................86 ...■3.03 Business costs of crime and violence..........................95 ...■3.04 Road traffic accidents*.................................................98 ...■
4th pillar: Health and hygiene4.01 Physician density*........................................................56 ...■4.02 Access to improved sanitation* ..................................n/a ......4.03 Access to improved drinking water*...........................n/a ......4.04 Hospital beds*..............................................................33 ...■
5th pillar: Prioritization of Travel & Tourism5.01 Government prioritization of the T&T industry...........126 ...■5.02 T&T government expenditure* ....................................82 ...■5.03 Effectiveness of marketing and branding...................114 ...■5.04 T&T fair attendance*....................................................14 ...■
6th pillar: Air transport infrastructure6.01 Quality of air transport infrastructure .........................103 ...■6.02 Available seat kilometers, domestic*...........................50 ...■6.03 Available seat kilometers, international* ......................43 ...■6.04 Departures per 1,000 population*................................71 ...■6.05 Airport density* ..........................................................108 ...■6.06 Number of operating airlines*......................................32 ...■6.07 International air transport network ...............................92 ...■
7th pillar: Ground transport infrastructure7.01 Quality of roads ..........................................................127 ...■7.02 Quality of railroad infrastructure...................................61 ...■7.03 Quality of port infrastructure ......................................119 ...■7.04 Quality of ground transport network ............................90 ...■7.05 Road density*...............................................................25 ...■
INDICATOR RANK/133
8th pillar: Tourism infrastructure8.01 Hotel rooms*................................................................75 ...■8.02 Presence of major car rental companies*....................23 ...■8.03 ATMs accepting Visa cards* ........................................53 ...■
9th pillar: ICT infrastructure9.01 Extent of business Internet use...................................30 ...■9.02 Internet users* .............................................................38 ...■9.03 Telephone lines*...........................................................51 ...■9.04 Broadband Internet subscribers* .................................41 ...■9.05 Mobile telephone subscribers*....................................32 ...■
10th pillar: Price competitiveness in the T&T industry10.01 Ticket taxes and airport charges*.................................78 ...■10.02 Purchasing power parity*.............................................89 ...■10.03 Extent and effect of taxation......................................127 ...■10.04 Fuel price levels* .......................................................113 ...■10.05 Hotel price index* ........................................................47 ...■
11th pillar: Human resources11.01 Primary education enrollment* ....................................44 ...■11.02 Secondary education enrollment*................................28 ...■11.03 Quality of the educational system................................54 ...■11.04 Local availability of research and training services.......50 ...■11.05 Extent of staff training..................................................89 ...■11.06 Hiring and firing practices.............................................71 ...■11.07 Ease of hiring foreign labor ........................................114 ...■11.08 HIV prevalence* ...........................................................22 ...■11.09 Business impact of HIV/AIDS.......................................50 ...■11.10 Life expectancy* ..........................................................42 ...■
12th pillar: Affinity for Travel & Tourism12.01 Tourism openness* ......................................................75 ...■12.02 Attitude of population toward foreign visitors............125 ...■12.03 Extension of business trips recommended .................79 ...■
13th pillar: Natural resources13.01 Number of World Heritage natural sites* ....................40 ...■13.02 Protected areas* ..........................................................20 ...■13.03 Quality of the natural environment...............................92 ...■13.04 Total known species*...................................................94 ...■
14th pillar: Cultural resources14.01 Number of World Heritage cultural sites* ...................14 ...■14.02 Sports stadiums* .........................................................62 ...■14.03 Number of international fairs and exhibitions* ............25 ...■14.04 Creative industries exports*.........................................22 ...■
Poland
* Hard data
Note: For further details and explanation, please refer to the section “How toRead the Country/Economy Profiles” at the beginning of this chapter.
part2A_profiles.r2 2/26/09 4:01 AM Page 311
The Travel & Tourism Competitiveness Report 2009 © 2009 World Economic Forum

312
2.1:
Cou
ntry
/Eco
nom
y Pr
ofile
s
PortugalKey indicatorsPopulation (millions), 2007............................................................................10.6Surface area (1,000 square kilometers) ........................................................92.1
Gross domestic product (US$ billions), 2007 .............................................223.4Gross domestic product (PPP, US$) per capita, 2007 ...........................21,778.7Real GDP growth (percent), 2007...................................................................1.9
Environmental Performance Index, 2008 (out of 149 countries).....................18
Travel & Tourism indicators
T&T industry, 2008 estimatesGDP (US$ millions) ...........................................................15,768...................6.4 ....................4.2Employment (1,000 jobs).......................................................396...................7.6 ....................1.8
T&T economy, 2008 estimatesGDP (US$ millions) ...........................................................38,675.................15.7 ....................4.1Employment (1,000 jobs).......................................................989.................19.0 ....................1.9
Source: World Travel & Tourism Council, TSA Research 2008
International tourist arrivals (thousands), 2007.................12,321International tourism receipts (US$ millions), 2007 .........10,132
Source: United Nations World Tourism Organization
Travel & Tourism Competitiveness Index
2009 Index......................................................................................................17 5.02008 Index............................................................................................................15 5.1T&T regulatory framework ..............................................................................15 5.5
Policy rules and regulations..........................................................................29 5.1Environmental sustainability..........................................................................18 5.3Safety and security .........................................................................................22 6.0Health and hygiene .........................................................................................32 6.0Prioritization of Travel & Tourism..................................................................26 5.2
T&T business environment and infrastructure ............................................24 4.7Air transport infrastructure ..........................................................................38 4.1Ground transport infrastructure....................................................................26 4.9Tourism infrastructure ....................................................................................11 6.3ICT infrastructure ............................................................................................34 4.2Price competitiveness in the T&T industry.................................................99 4.2
T&T human, cultural, and natural resources ...............................................16 4.8Human resources ............................................................................................34 5.4
Education and training .............................................................................36 5.1Availability of qualified labor...................................................................26 5.7
Affinity for Travel & Tourism ..........................................................................39 5.0Natural resources ...........................................................................................86 2.8Cultural resources...........................................................................................12 5.8
Note: For descriptions of variables and detailed sources, please refer to “How to the Read Country/Economy Profiles.”
Rank Score(out of 133) (1–7 scale)
International tourist arrivals (thousands)
International tourism receipts (US$ millions)
1995 1996 1997 1998 1999 2000 2001 2002 2003 2004 2005 2006 20073,000
6,000
9,000
12,000
15,000
1 2 3 4 5 6 7
2009–2018Percent annual growth of total (%, forecast)
part2A_profiles.r2 2/26/09 4:01 AM Page 312
The Travel & Tourism Competitiveness Report 2009 © 2009 World Economic Forum

313
2.1:
Cou
ntry
/Eco
nom
y Pr
ofile
s
The Travel & Tourism Competitiveness Index in detail ■ Competitive Advantage ■ Competitive Disadvantage
INDICATOR RANK/133
1st pillar: Policy rules and regulations1.01 Prevalence of foreign ownership .................................71 ...■1.02 Property rights..............................................................35 ...■1.03 Business impact of rules on FDI ..................................34 ...■1.04 Visa requirements* ......................................................40 ...■1.05 Openness of bilateral Air Service Agreements* ..........19 ...■1.06 Transparency of government policymaking..................63 ...■1.07 Time required to start a business*.................................9 ...■1.08 Cost to start a business* .............................................27 ...■
2nd pillar: Environmental sustainability2.01 Stringency of environmental regulation .......................33 ...■2.02 Enforcement of environmental regulation....................33 ...■2.03 Sustainability of T&T industry development.................25 ...■2.04 Carbon dioxide emissions* ..........................................81 ...■2.05 Particulate matter concentration* ................................45 ...■2.06 Threatened species* ....................................................71 ...■2.07 Environmental treaty ratification*.................................10 ...■
3rd pillar: Safety and security3.01 Business costs of terrorism .........................................20 ...■3.02 Reliability of police services .........................................34 ...■3.03 Business costs of crime and violence..........................21 ...■3.04 Road traffic accidents*.................................................66 ...■
4th pillar: Health and hygiene4.01 Physician density*........................................................21 ...■4.02 Access to improved sanitation* ...................................34 ...■4.03 Access to improved drinking water*............................38 ...■4.04 Hospital beds*..............................................................48 ...■
5th pillar: Prioritization of Travel & Tourism5.01 Government prioritization of the T&T industry.............16 ...■5.02 T&T government expenditure* ....................................25 ...■5.03 Effectiveness of marketing and branding.....................29 ...■5.04 T&T fair attendance*....................................................41 ...■
6th pillar: Air transport infrastructure6.01 Quality of air transport infrastructure ...........................43 ...■6.02 Available seat kilometers, domestic*...........................31 ...■6.03 Available seat kilometers, international* ......................27 ...■6.04 Departures per 1,000 population*................................32 ...■6.05 Airport density* ............................................................30 ...■6.06 Number of operating airlines*......................................25 ...■6.07 International air transport network ...............................39 ...■
7th pillar: Ground transport infrastructure7.01 Quality of roads ............................................................14 ...■7.02 Quality of railroad infrastructure...................................25 ...■7.03 Quality of port infrastructure ........................................42 ...■7.04 Quality of ground transport network ............................25 ...■7.05 Road density*...............................................................37 ...■
INDICATOR RANK/133
8th pillar: Tourism infrastructure8.01 Hotel rooms*................................................................22 ...■8.02 Presence of major car rental companies*......................1 ...■8.03 ATMs accepting Visa cards* ..........................................3 ...■
9th pillar: ICT infrastructure9.01 Extent of business Internet use...................................38 ...■9.02 Internet users* .............................................................47 ...■9.03 Telephone lines*...........................................................33 ...■9.04 Broadband Internet subscribers* .................................31 ...■9.05 Mobile telephone subscribers*....................................13 ...■
10th pillar: Price competitiveness in the T&T industry10.01 Ticket taxes and airport charges*.................................69 ...■10.02 Purchasing power parity*...........................................106 ...■10.03 Extent and effect of taxation........................................94 ...■10.04 Fuel price levels* .........................................................91 ...■10.05 Hotel price index* ........................................................53 ...■
11th pillar: Human resources11.01 Primary education enrollment* ....................................21 ...■11.02 Secondary education enrollment*................................36 ...■11.03 Quality of the educational system................................73 ...■11.04 Local availability of research and training services.......34 ...■11.05 Extent of staff training..................................................70 ...■11.06 Hiring and firing practices...........................................124 ...■11.07 Ease of hiring foreign labor ..........................................10 ...■11.08 HIV prevalence* ...........................................................78 ...■11.09 Business impact of HIV/AIDS.......................................17 ...■11.10 Life expectancy* ..........................................................22 ...■
12th pillar: Affinity for Travel & Tourism12.01 Tourism openness* ......................................................45 ...■12.02 Attitude of population toward foreign visitors..............15 ...■12.03 Extension of business trips recommended .................49 ...■
13th pillar: Natural resources13.01 Number of World Heritage natural sites* ....................40 ...■13.02 Protected areas* ..........................................................97 ...■13.03 Quality of the natural environment...............................34 ...■13.04 Total known species*...................................................86 ...■
14th pillar: Cultural resources14.01 Number of World Heritage cultural sites* ...................14 ...■14.02 Sports stadiums* .........................................................14 ...■14.03 Number of international fairs and exhibitions* ............16 ...■14.04 Creative industries exports*.........................................33 ...■
Portugal
* Hard data
Note: For further details and explanation, please refer to the section “How toRead the Country/Economy Profiles” at the beginning of this chapter.
part2A_profiles.r2 2/26/09 4:01 AM Page 313
The Travel & Tourism Competitiveness Report 2009 © 2009 World Economic Forum

314
2.1:
Cou
ntry
/Eco
nom
y Pr
ofile
s
Puerto RicoKey indicatorsPopulation (millions), 2007..............................................................................4.0Surface area (1,000 square kilometers) ..........................................................9.0
Gross domestic product (US$ billions), 2007 ...............................................86.5Gross domestic product (PPP, US$) per capita, 2007.....................................n/aReal GDP growth (percent), 2007...................................................................n/a
Environmental Performance Index, 2008 (out of 149 countries) ....................n/a
Travel & Tourism indicators
T&T industry, 2008 estimatesGDP (US$ millions) .............................................................1,593...................1.6 ....................1.8Employment (1,000 jobs).........................................................23...................1.7 ....................0.7
T&T economy, 2008 estimatesGDP (US$ millions) .............................................................5,634...................5.6 ....................2.0Employment (1,000 jobs).........................................................77...................5.8 ....................0.8
Source: World Travel & Tourism Council, TSA Research 2008
International tourist arrivals (thousands), 2007...................3,687International tourism receipts (US$ millions), 2007 ...........3,414
Source: United Nations World Tourism Organization
Travel & Tourism Competitiveness Index
2009 Index......................................................................................................53 4.32008 Index............................................................................................................46 4.3T&T regulatory framework ..............................................................................44 5.0
Policy rules and regulations..........................................................................15 5.3Environmental sustainability..........................................................................11 5.5Safety and security .........................................................................................65 5.2Health and hygiene .........................................................................................63 4.7Prioritization of Travel & Tourism..................................................................71 4.2
T&T business environment and infrastructure ............................................41 4.1Air transport infrastructure ..........................................................................29 4.4Ground transport infrastructure....................................................................30 4.7Tourism infrastructure ....................................................................................48 3.9ICT infrastructure ............................................................................................52 3.3Price competitiveness in the T&T industry.................................................98 4.2
T&T human, cultural, and natural resources ...............................................84 3.7Human resources ............................................................................................35 5.4
Education and training .............................................................................32 5.3Availability of qualified labor...................................................................72 5.4
Affinity for Travel & Tourism ..........................................................................41 5.0Natural resources ...........................................................................................96 2.7Cultural resources...........................................................................................92 1.7
Note: For descriptions of variables and detailed sources, please refer to “How to the Read Country/Economy Profiles.”
Rank Score(out of 133) (1–7 scale)
International tourist arrivals (thousands)
International tourism receipts (US$ millions)
1995 1996 1997 1998 1999 2000 2001 2002 2003 2004 2005 2006 20071,500
2,000
2,500
3,000
3,500
4,000
1 2 3 4 5 6 7
2009–2018Percent annual growth of total (%, forecast)
part2A_profiles.r2 2/26/09 4:01 AM Page 314
The Travel & Tourism Competitiveness Report 2009 © 2009 World Economic Forum
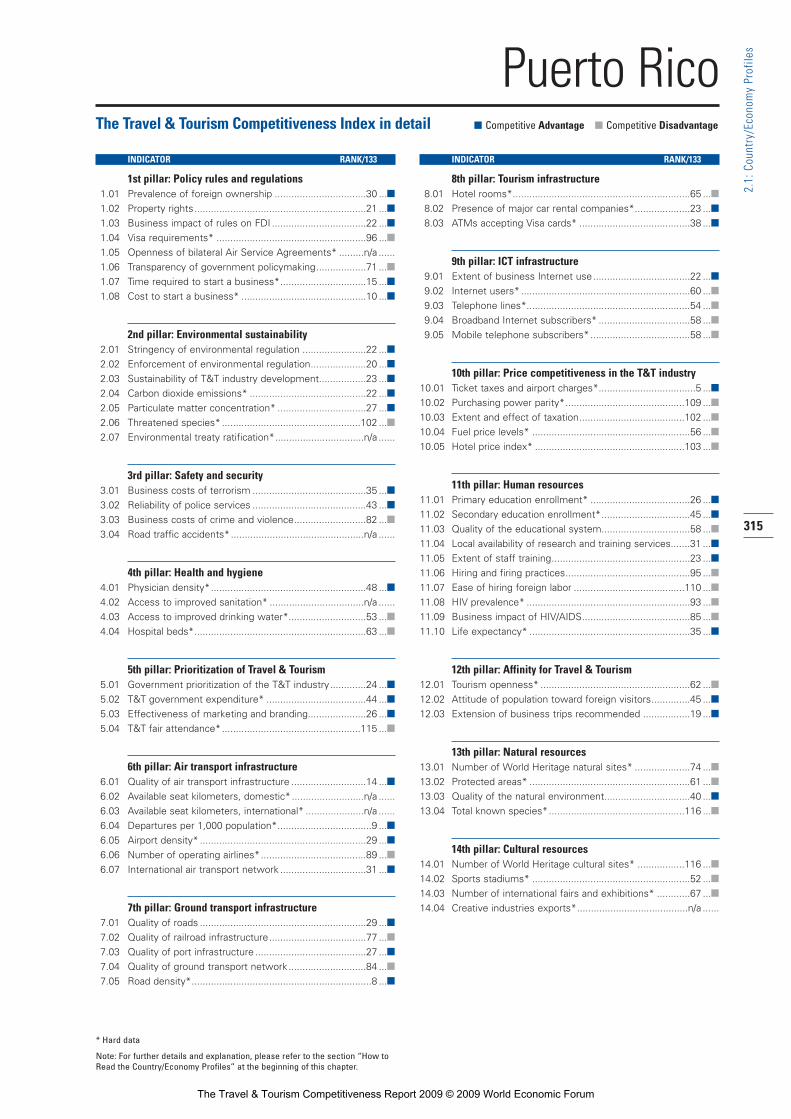
315
2.1:
Cou
ntry
/Eco
nom
y Pr
ofile
s
The Travel & Tourism Competitiveness Index in detail ■ Competitive Advantage ■ Competitive Disadvantage
INDICATOR RANK/133
1st pillar: Policy rules and regulations1.01 Prevalence of foreign ownership .................................30 ...■1.02 Property rights..............................................................21 ...■1.03 Business impact of rules on FDI ..................................22 ...■1.04 Visa requirements* ......................................................96 ...■1.05 Openness of bilateral Air Service Agreements* .........n/a ......1.06 Transparency of government policymaking..................71 ...■1.07 Time required to start a business*...............................15 ...■1.08 Cost to start a business* .............................................10 ...■
2nd pillar: Environmental sustainability2.01 Stringency of environmental regulation .......................22 ...■2.02 Enforcement of environmental regulation....................20 ...■2.03 Sustainability of T&T industry development.................23 ...■2.04 Carbon dioxide emissions* ..........................................22 ...■2.05 Particulate matter concentration* ................................27 ...■2.06 Threatened species* ..................................................102 ...■2.07 Environmental treaty ratification*................................n/a ......
3rd pillar: Safety and security3.01 Business costs of terrorism .........................................35 ...■3.02 Reliability of police services .........................................43 ...■3.03 Business costs of crime and violence..........................82 ...■3.04 Road traffic accidents*................................................n/a ......
4th pillar: Health and hygiene4.01 Physician density*........................................................48 ...■4.02 Access to improved sanitation* ..................................n/a ......4.03 Access to improved drinking water*............................53 ...■4.04 Hospital beds*..............................................................63 ...■
5th pillar: Prioritization of Travel & Tourism5.01 Government prioritization of the T&T industry.............24 ...■5.02 T&T government expenditure* ....................................44 ...■5.03 Effectiveness of marketing and branding.....................26 ...■5.04 T&T fair attendance*..................................................115 ...■
6th pillar: Air transport infrastructure6.01 Quality of air transport infrastructure ...........................14 ...■6.02 Available seat kilometers, domestic* ..........................n/a ......6.03 Available seat kilometers, international* .....................n/a ......6.04 Departures per 1,000 population*..................................9 ...■6.05 Airport density* ............................................................29 ...■6.06 Number of operating airlines*......................................89 ...■6.07 International air transport network ...............................31 ...■
7th pillar: Ground transport infrastructure7.01 Quality of roads ............................................................29 ...■7.02 Quality of railroad infrastructure...................................77 ...■7.03 Quality of port infrastructure ........................................27 ...■7.04 Quality of ground transport network ............................84 ...■7.05 Road density*.................................................................8 ...■
INDICATOR RANK/133
8th pillar: Tourism infrastructure8.01 Hotel rooms*................................................................65 ...■8.02 Presence of major car rental companies*....................23 ...■8.03 ATMs accepting Visa cards* ........................................38 ...■
9th pillar: ICT infrastructure9.01 Extent of business Internet use...................................22 ...■9.02 Internet users* .............................................................60 ...■9.03 Telephone lines*...........................................................54 ...■9.04 Broadband Internet subscribers* .................................58 ...■9.05 Mobile telephone subscribers*....................................58 ...■
10th pillar: Price competitiveness in the T&T industry10.01 Ticket taxes and airport charges*...................................5 ...■10.02 Purchasing power parity*...........................................109 ...■10.03 Extent and effect of taxation......................................102 ...■10.04 Fuel price levels* .........................................................56 ...■10.05 Hotel price index* ......................................................103 ...■
11th pillar: Human resources11.01 Primary education enrollment* ....................................26 ...■11.02 Secondary education enrollment*................................45 ...■11.03 Quality of the educational system................................58 ...■11.04 Local availability of research and training services.......31 ...■11.05 Extent of staff training..................................................23 ...■11.06 Hiring and firing practices.............................................95 ...■11.07 Ease of hiring foreign labor ........................................110 ...■11.08 HIV prevalence* ...........................................................93 ...■11.09 Business impact of HIV/AIDS.......................................85 ...■11.10 Life expectancy* ..........................................................35 ...■
12th pillar: Affinity for Travel & Tourism12.01 Tourism openness* ......................................................62 ...■12.02 Attitude of population toward foreign visitors..............45 ...■12.03 Extension of business trips recommended .................19 ...■
13th pillar: Natural resources13.01 Number of World Heritage natural sites* ....................74 ...■13.02 Protected areas* ..........................................................61 ...■13.03 Quality of the natural environment...............................40 ...■13.04 Total known species*.................................................116 ...■
14th pillar: Cultural resources14.01 Number of World Heritage cultural sites* .................116 ...■14.02 Sports stadiums* .........................................................52 ...■14.03 Number of international fairs and exhibitions* ............67 ...■14.04 Creative industries exports*........................................n/a ......
Puerto Rico
* Hard data
Note: For further details and explanation, please refer to the section “How toRead the Country/Economy Profiles” at the beginning of this chapter.
part2A_profiles.r2 2/26/09 4:01 AM Page 315
The Travel & Tourism Competitiveness Report 2009 © 2009 World Economic Forum

316
2.1:
Cou
ntry
/Eco
nom
y Pr
ofile
s
QatarKey indicatorsPopulation (millions), 2007..............................................................................0.9Surface area (1,000 square kilometers) ........................................................11.0
Gross domestic product (US$ billions), 2007 ...............................................73.3Gross domestic product (PPP, US$) per capita, 2007 ...........................85,638.0Real GDP growth (percent), 2007.................................................................15.9
Environmental Performance Index, 2008 (out of 149 countries) ....................n/a
Travel & Tourism indicators
T&T industry, 2008 estimatesGDP (US$ millions) ................................................................849...................1.2 ....................7.8Employment (1,000 jobs)...........................................................9...................1.7 ....................5.1
T&T economy, 2008 estimatesGDP (US$ millions) .............................................................8,754.................12.4 ....................6.0Employment (1,000 jobs).........................................................62.................12.1 ....................3.7
Source: World Travel & Tourism Council, TSA Research 2008
International tourist arrivals (thousands), 2007......................964International tourism receipts (US$ millions), 2006 ..............874
Source: United Nations World Tourism Organization
Travel & Tourism Competitiveness Index
2009 Index......................................................................................................37 4.52008 Index............................................................................................................37 4.4T&T regulatory framework ..............................................................................35 5.2
Policy rules and regulations..........................................................................47 4.7Environmental sustainability..........................................................................69 4.5Safety and security ...........................................................................................9 6.4Health and hygiene .........................................................................................49 5.5Prioritization of Travel & Tourism..................................................................45 4.7
T&T business environment and infrastructure ............................................34 4.5Air transport infrastructure ..........................................................................20 4.7Ground transport infrastructure....................................................................59 3.7Tourism infrastructure ....................................................................................28 4.9ICT infrastructure ............................................................................................37 4.0Price competitiveness in the T&T industry.................................................39 5.0
T&T human, cultural, and natural resources ...............................................75 3.8Human resources ............................................................................................22 5.6
Education and training .............................................................................24 5.5Availability of qualified labor...................................................................15 5.8
Affinity for Travel & Tourism ..........................................................................51 4.9Natural resources .........................................................................................119 2.2Cultural resources...........................................................................................58 2.5
Note: For descriptions of variables and detailed sources, please refer to “How to the Read Country/Economy Profiles.”
Rank Score(out of 133) (1–7 scale)
International tourist arrivals (thousands)
International tourism receipts (US$ millions)
1995 1996 1997 1998 1999 2000 2001 2002 2003 2004 2005 2006 20070
200
400
600
800
1,000
1 2 3 4 5 6 7
2009–2018Percent annual growth of total (%, forecast)
part2A_profiles.r2 2/26/09 4:01 AM Page 316
The Travel & Tourism Competitiveness Report 2009 © 2009 World Economic Forum

317
2.1:
Cou
ntry
/Eco
nom
y Pr
ofile
s
The Travel & Tourism Competitiveness Index in detail ■ Competitive Advantage ■ Competitive Disadvantage
INDICATOR RANK/133
1st pillar: Policy rules and regulations1.01 Prevalence of foreign ownership .................................97 ...■1.02 Property rights..............................................................31 ...■1.03 Business impact of rules on FDI ..................................71 ...■1.04 Visa requirements* ....................................................107 ...■1.05 Openness of bilateral Air Service Agreements* ..........52 ...■1.06 Transparency of government policymaking..................21 ...■1.07 Time required to start a business*.................................9 ...■1.08 Cost to start a business* .............................................61 ...■
2nd pillar: Environmental sustainability2.01 Stringency of environmental regulation .......................23 ...■2.02 Enforcement of environmental regulation....................18 ...■2.03 Sustainability of T&T industry development.................20 ...■2.04 Carbon dioxide emissions* ........................................129 ...■2.05 Particulate matter concentration* ................................89 ...■2.06 Threatened species* ....................................................27 ...■2.07 Environmental treaty ratification*.................................67 ...■
3rd pillar: Safety and security3.01 Business costs of terrorism .........................................55 ...■3.02 Reliability of police services .........................................15 ...■3.03 Business costs of crime and violence............................5 ...■3.04 Road traffic accidents*.................................................13 ...■
4th pillar: Health and hygiene4.01 Physician density*........................................................37 ...■4.02 Access to improved sanitation* .....................................1 ...■4.03 Access to improved drinking water*..............................1 ...■4.04 Hospital beds*..............................................................73 ...■
5th pillar: Prioritization of Travel & Tourism5.01 Government prioritization of the T&T industry.............53 ...■5.02 T&T government expenditure* ....................................29 ...■5.03 Effectiveness of marketing and branding.....................48 ...■5.04 T&T fair attendance*....................................................62 ...■
6th pillar: Air transport infrastructure6.01 Quality of air transport infrastructure ...........................22 ...■6.02 Available seat kilometers, domestic*.........................100 ...■6.03 Available seat kilometers, international* ......................35 ...■6.04 Departures per 1,000 population*..................................3 ...■6.05 Airport density* ............................................................18 ...■6.06 Number of operating airlines*......................................66 ...■6.07 International air transport network ...............................13 ...■
7th pillar: Ground transport infrastructure7.01 Quality of roads ............................................................46 ...■7.02 Quality of railroad infrastructure ..................................n/a ......7.03 Quality of port infrastructure ........................................51 ...■7.04 Quality of ground transport network ............................45 ...■7.05 Road density*...............................................................99 ...■
INDICATOR RANK/133
8th pillar: Tourism infrastructure8.01 Hotel rooms*................................................................47 ...■8.02 Presence of major car rental companies*....................23 ...■8.03 ATMs accepting Visa cards* ........................................22 ...■
9th pillar: ICT infrastructure9.01 Extent of business Internet use...................................53 ...■9.02 Internet users* .............................................................40 ...■9.03 Telephone lines*...........................................................48 ...■9.04 Broadband Internet subscribers* .................................39 ...■9.05 Mobile telephone subscribers*......................................2 ...■
10th pillar: Price competitiveness in the T&T industry10.01 Ticket taxes and airport charges*.................................10 ...■10.02 Purchasing power parity*...........................................105 ...■10.03 Extent and effect of taxation..........................................4 ...■10.04 Fuel price levels* ...........................................................7 ...■10.05 Hotel price index* ......................................................110 ...■
11th pillar: Human resources11.01 Primary education enrollment* ....................................66 ...■11.02 Secondary education enrollment*................................23 ...■11.03 Quality of the educational system................................16 ...■11.04 Local availability of research and training services.......45 ...■11.05 Extent of staff training..................................................33 ...■11.06 Hiring and firing practices.............................................48 ...■11.07 Ease of hiring foreign labor ..........................................17 ...■11.08 HIV prevalence* .............................................................1 ...■11.09 Business impact of HIV/AIDS.......................................30 ...■11.10 Life expectancy* ..........................................................37 ...■
12th pillar: Affinity for Travel & Tourism12.01 Tourism openness* ......................................................29 ...■12.02 Attitude of population toward foreign visitors..............80 ...■12.03 Extension of business trips recommended ...............108 ...■
13th pillar: Natural resources13.01 Number of World Heritage natural sites* ....................74 ...■13.02 Protected areas* ........................................................128 ...■13.03 Quality of the natural environment...............................23 ...■13.04 Total known species*.................................................130 ...■
14th pillar: Cultural resources14.01 Number of World Heritage cultural sites* .................116 ...■14.02 Sports stadiums* ...........................................................2 ...■14.03 Number of international fairs and exhibitions* ............82 ...■14.04 Creative industries exports*.........................................92 ...■
Qatar
* Hard data
Note: For further details and explanation, please refer to the section “How toRead the Country/Economy Profiles” at the beginning of this chapter.
part2A_profiles.r2 2/26/09 4:01 AM Page 317
The Travel & Tourism Competitiveness Report 2009 © 2009 World Economic Forum

318
2.1:
Cou
ntry
/Eco
nom
y Pr
ofile
s
RomaniaKey indicatorsPopulation (millions), 2007............................................................................21.5Surface area (1,000 square kilometers) ......................................................238.4
Gross domestic product (US$ billions), 2007 .............................................166.0Gross domestic product (PPP, US$) per capita, 2007 ...........................11,400.8Real GDP growth (percent), 2007...................................................................6.0
Environmental Performance Index, 2008 (out of 149 countries).....................83
Travel & Tourism indicators
T&T industry, 2008 estimatesGDP (US$ millions) .............................................................3,631...................2.2 ....................7.8Employment (1,000 jobs).......................................................304...................3.5 ....................2.2
T&T economy, 2008 estimatesGDP (US$ millions) .............................................................9,352...................5.8 ....................6.7Employment (1,000 jobs).......................................................600...................6.9 ....................1.6
Source: World Travel & Tourism Council, TSA Research 2008
International tourist arrivals (thousands), 2007...................1,551International tourism receipts (US$ millions), 2007 ...........1,464
Source: United Nations World Tourism Organization
Travel & Tourism Competitiveness Index
2009 Index......................................................................................................66 4.02008 Index............................................................................................................69 3.9T&T regulatory framework ..............................................................................61 4.7
Policy rules and regulations..........................................................................64 4.5Environmental sustainability..........................................................................37 4.9Safety and security .........................................................................................62 5.3Health and hygiene .........................................................................................54 5.1Prioritization of Travel & Tourism................................................................102 3.7
T&T business environment and infrastructure ............................................64 3.6Air transport infrastructure ..........................................................................81 2.7Ground transport infrastructure....................................................................83 3.1Tourism infrastructure ....................................................................................34 4.5ICT infrastructure ............................................................................................42 3.8Price competitiveness in the T&T industry...............................................110 4.0
T&T human, cultural, and natural resources ...............................................77 3.8Human resources ............................................................................................58 5.1
Education and training .............................................................................61 4.8Availability of qualified labor...................................................................59 5.5
Affinity for Travel & Tourism ........................................................................105 4.4Natural resources ...........................................................................................85 2.9Cultural resources...........................................................................................49 2.8
Note: For descriptions of variables and detailed sources, please refer to “How to the Read Country/Economy Profiles.”
Rank Score(out of 133) (1–7 scale)
International tourist arrivals (thousands)
International tourism receipts (US$ millions)
1995 1996 1997 1998 1999 2000 2001 2002 2003 2004 2005 2006 20070
500
1,000
1,500
2,000
1 2 3 4 5 6 7
2009–2018Percent annual growth of total (%, forecast)
part2A_profiles.r2 2/26/09 4:01 AM Page 318
The Travel & Tourism Competitiveness Report 2009 © 2009 World Economic Forum

319
2.1:
Cou
ntry
/Eco
nom
y Pr
ofile
s
The Travel & Tourism Competitiveness Index in detail ■ Competitive Advantage ■ Competitive Disadvantage
INDICATOR RANK/133
1st pillar: Policy rules and regulations1.01 Prevalence of foreign ownership .................................87 ...■1.02 Property rights..............................................................85 ...■1.03 Business impact of rules on FDI ..................................89 ...■1.04 Visa requirements* ......................................................40 ...■1.05 Openness of bilateral Air Service Agreements* ..........83 ...■1.06 Transparency of government policymaking................124 ...■1.07 Time required to start a business*...............................25 ...■1.08 Cost to start a business* .............................................30 ...■
2nd pillar: Environmental sustainability2.01 Stringency of environmental regulation .......................60 ...■2.02 Enforcement of environmental regulation....................67 ...■2.03 Sustainability of T&T industry development...............121 ...■2.04 Carbon dioxide emissions* ..........................................71 ...■2.05 Particulate matter concentration* ..................................6 ...■2.06 Threatened species* ....................................................62 ...■2.07 Environmental treaty ratification*.................................34 ...■
3rd pillar: Safety and security3.01 Business costs of terrorism .........................................57 ...■3.02 Reliability of police services .........................................74 ...■3.03 Business costs of crime and violence..........................69 ...■3.04 Road traffic accidents*.................................................80 ...■
4th pillar: Health and hygiene4.01 Physician density*........................................................58 ...■4.02 Access to improved sanitation* ...................................85 ...■4.03 Access to improved drinking water*............................87 ...■4.04 Hospital beds*..............................................................19 ...■
5th pillar: Prioritization of Travel & Tourism5.01 Government prioritization of the T&T industry...........121 ...■5.02 T&T government expenditure* ....................................42 ...■5.03 Effectiveness of marketing and branding...................119 ...■5.04 T&T fair attendance*....................................................62 ...■
6th pillar: Air transport infrastructure6.01 Quality of air transport infrastructure ...........................96 ...■6.02 Available seat kilometers, domestic*...........................52 ...■6.03 Available seat kilometers, international* ......................64 ...■6.04 Departures per 1,000 population*................................77 ...■6.05 Airport density* ............................................................67 ...■6.06 Number of operating airlines*......................................39 ...■6.07 International air transport network ...............................94 ...■
7th pillar: Ground transport infrastructure7.01 Quality of roads ..........................................................126 ...■7.02 Quality of railroad infrastructure...................................59 ...■7.03 Quality of port infrastructure ......................................102 ...■7.04 Quality of ground transport network..........................110 ...■7.05 Road density*...............................................................38 ...■
INDICATOR RANK/133
8th pillar: Tourism infrastructure8.01 Hotel rooms*................................................................53 ...■8.02 Presence of major car rental companies*......................1 ...■8.03 ATMs accepting Visa cards* ........................................43 ...■
9th pillar: ICT infrastructure9.01 Extent of business Internet use...................................69 ...■9.02 Internet users* .............................................................21 ...■9.03 Telephone lines*...........................................................65 ...■9.04 Broadband Internet subscribers* .................................36 ...■9.05 Mobile telephone subscribers*....................................35 ...■
10th pillar: Price competitiveness in the T&T industry10.01 Ticket taxes and airport charges*.................................97 ...■10.02 Purchasing power parity*.............................................84 ...■10.03 Extent and effect of taxation......................................109 ...■10.04 Fuel price levels* .......................................................104 ...■10.05 Hotel price index* ........................................................90 ...■
11th pillar: Human resources11.01 Primary education enrollment* ....................................67 ...■11.02 Secondary education enrollment*................................70 ...■11.03 Quality of the educational system................................71 ...■11.04 Local availability of research and training services.......63 ...■11.05 Extent of staff training..................................................54 ...■11.06 Hiring and firing practices.............................................59 ...■11.07 Ease of hiring foreign labor ..........................................62 ...■11.08 HIV prevalence* ...........................................................22 ...■11.09 Business impact of HIV/AIDS.......................................59 ...■11.10 Life expectancy* ..........................................................55 ...■
12th pillar: Affinity for Travel & Tourism12.01 Tourism openness* ....................................................118 ...■12.02 Attitude of population toward foreign visitors..............88 ...■12.03 Extension of business trips recommended .................65 ...■
13th pillar: Natural resources13.01 Number of World Heritage natural sites* ....................40 ...■13.02 Protected areas* ..........................................................58 ...■13.03 Quality of the natural environment.............................110 ...■13.04 Total known species*...................................................80 ...■
14th pillar: Cultural resources14.01 Number of World Heritage cultural sites* ...................26 ...■14.02 Sports stadiums* .........................................................57 ...■14.03 Number of international fairs and exhibitions* ............51 ...■14.04 Creative industries exports*.........................................39 ...■
Romania
* Hard data
Note: For further details and explanation, please refer to the section “How toRead the Country/Economy Profiles” at the beginning of this chapter.
part2A_profiles.r2 2/26/09 4:01 AM Page 319
The Travel & Tourism Competitiveness Report 2009 © 2009 World Economic Forum

320
2.1:
Cou
ntry
/Eco
nom
y Pr
ofile
s
Russian FederationKey indicatorsPopulation (millions), 2007..........................................................................141.9Surface area (1,000 square kilometers) .................................................17,098.2
Gross domestic product (US$ billions), 2007 ..........................................1,289.5Gross domestic product (PPP, US$) per capita, 2007 ...........................14,705.0Real GDP growth (percent), 2007...................................................................8.1
Environmental Performance Index, 2008 (out of 149 countries).....................28
Travel & Tourism indicators
T&T industry, 2008 estimatesGDP (US$ millions) ...........................................................17,922...................1.2 ....................5.7Employment (1,000 jobs).......................................................732...................1.0 ..................–0.1
T&T economy, 2008 estimatesGDP (US$ millions) .........................................................103,497...................6.9 ....................6.9Employment (1,000 jobs)....................................................4,126...................5.8 ....................1.0
Source: World Travel & Tourism Council, TSA Research 2008
International tourist arrivals (thousands), 2006.................20,199International tourism receipts (US$ millions), 2007 ...........9,607
Source: United Nations World Tourism Organization
Travel & Tourism Competitiveness Index
2009 Index......................................................................................................59 4.12008 Index............................................................................................................64 4.0T&T regulatory framework ..............................................................................79 4.3
Policy rules and regulations........................................................................114 3.5Environmental sustainability........................................................................114 3.9Safety and security .......................................................................................129 3.5Health and hygiene .........................................................................................10 6.7Prioritization of Travel & Tourism..................................................................75 4.2
T&T business environment and infrastructure ............................................61 3.7Air transport infrastructure ..........................................................................30 4.4Ground transport infrastructure....................................................................81 3.2Tourism infrastructure ....................................................................................60 3.5ICT infrastructure ............................................................................................50 3.4Price competitiveness in the T&T industry...............................................108 4.1
T&T human, cultural, and natural resources ...............................................38 4.4Human resources ............................................................................................88 4.8
Education and training .............................................................................64 4.8Availability of qualified labor.................................................................110 4.9
Affinity for Travel & Tourism ........................................................................123 4.1Natural resources ...........................................................................................23 4.6Cultural resources...........................................................................................30 3.9
Note: For descriptions of variables and detailed sources, please refer to “How to the Read Country/Economy Profiles.”
Rank Score(out of 133) (1–7 scale)
International tourist arrivals (thousands)
International tourism receipts (US$ millions)
1995 1996 1997 1998 1999 2000 2001 2002 2003 2004 2005 2006 20070
5,000
10,000
15,000
20,000
25,000
1 2 3 4 5 6 7
2009–2018Percent annual growth of total (%, forecast)
part2A_profiles.r2 2/26/09 4:01 AM Page 320
The Travel & Tourism Competitiveness Report 2009 © 2009 World Economic Forum

321
2.1:
Cou
ntry
/Eco
nom
y Pr
ofile
s
The Travel & Tourism Competitiveness Index in detail ■ Competitive Advantage ■ Competitive Disadvantage
INDICATOR RANK/133
1st pillar: Policy rules and regulations1.01 Prevalence of foreign ownership ...............................126 ...■1.02 Property rights............................................................122 ...■1.03 Business impact of rules on FDI ................................128 ...■1.04 Visa requirements* ....................................................120 ...■1.05 Openness of bilateral Air Service Agreements* ........121 ...■1.06 Transparency of government policymaking................119 ...■1.07 Time required to start a business*...............................81 ...■1.08 Cost to start a business* .............................................24 ...■
2nd pillar: Environmental sustainability2.01 Stringency of environmental regulation .......................89 ...■2.02 Enforcement of environmental regulation....................95 ...■2.03 Sustainability of T&T industry development...............123 ...■2.04 Carbon dioxide emissions* ........................................111 ...■2.05 Particulate matter concentration* ................................21 ...■2.06 Threatened species* ..................................................109 ...■2.07 Environmental treaty ratification*.................................94 ...■
3rd pillar: Safety and security3.01 Business costs of terrorism .......................................100 ...■3.02 Reliability of police services .......................................104 ...■3.03 Business costs of crime and violence..........................80 ...■3.04 Road traffic accidents*...............................................124 ...■
4th pillar: Health and hygiene4.01 Physician density*..........................................................3 ...■4.02 Access to improved sanitation* ...................................64 ...■4.03 Access to improved drinking water*............................53 ...■4.04 Hospital beds*................................................................2 ...■
5th pillar: Prioritization of Travel & Tourism5.01 Government prioritization of the T&T industry...........127 ...■5.02 T&T government expenditure* ....................................83 ...■5.03 Effectiveness of marketing and branding...................122 ...■5.04 T&T fair attendance*......................................................3 ...■
6th pillar: Air transport infrastructure6.01 Quality of air transport infrastructure ...........................88 ...■6.02 Available seat kilometers, domestic*.............................4 ...■6.03 Available seat kilometers, international* ......................19 ...■6.04 Departures per 1,000 population*................................63 ...■6.05 Airport density* ............................................................60 ...■6.06 Number of operating airlines*........................................8 ...■6.07 International air transport network ...............................79 ...■
7th pillar: Ground transport infrastructure7.01 Quality of roads ..........................................................104 ...■7.02 Quality of railroad infrastructure...................................32 ...■7.03 Quality of port infrastructure ........................................76 ...■7.04 Quality of ground transport network ............................65 ...■7.05 Road density*.............................................................126 ...■
INDICATOR RANK/133
8th pillar: Tourism infrastructure8.01 Hotel rooms*................................................................85 ...■8.02 Presence of major car rental companies*....................23 ...■8.03 ATMs accepting Visa cards* ........................................48 ...■
9th pillar: ICT infrastructure9.01 Extent of business Internet use...................................52 ...■9.02 Internet users* .............................................................67 ...■9.03 Telephone lines*...........................................................40 ...■9.04 Broadband Internet subscribers* .................................62 ...■9.05 Mobile telephone subscribers*....................................24 ...■
10th pillar: Price competitiveness in the T&T industry10.01 Ticket taxes and airport charges*.................................67 ...■10.02 Purchasing power parity*.............................................72 ...■10.03 Extent and effect of taxation........................................93 ...■10.04 Fuel price levels* .........................................................40 ...■10.05 Hotel price index* ......................................................115 ...■
11th pillar: Human resources11.01 Primary education enrollment* ....................................81 ...■11.02 Secondary education enrollment*................................76 ...■11.03 Quality of the educational system................................36 ...■11.04 Local availability of research and training services.......71 ...■11.05 Extent of staff training..................................................80 ...■11.06 Hiring and firing practices.............................................23 ...■11.07 Ease of hiring foreign labor ........................................128 ...■11.08 HIV prevalence* .........................................................102 ...■11.09 Business impact of HIV/AIDS.......................................28 ...■11.10 Life expectancy* ..........................................................96 ...■
12th pillar: Affinity for Travel & Tourism12.01 Tourism openness* ....................................................108 ...■12.02 Attitude of population toward foreign visitors............131 ...■12.03 Extension of business trips recommended .................55 ...■
13th pillar: Natural resources13.01 Number of World Heritage natural sites* ......................5 ...■13.02 Protected areas* ..........................................................67 ...■13.03 Quality of the natural environment.............................107 ...■13.04 Total known species*...................................................34 ...■
14th pillar: Cultural resources14.01 Number of World Heritage cultural sites* .....................9 ...■14.02 Sports stadiums* .......................................................114 ...■14.03 Number of international fairs and exhibitions* ............39 ...■14.04 Creative industries exports*.........................................29 ...■
Russian Federation
* Hard data
Note: For further details and explanation, please refer to the section “How toRead the Country/Economy Profiles” at the beginning of this chapter.
part2A_profiles.r2 2/26/09 4:01 AM Page 321
The Travel & Tourism Competitiveness Report 2009 © 2009 World Economic Forum

322
2.1:
Cou
ntry
/Eco
nom
y Pr
ofile
s
Saudi ArabiaKey indicatorsPopulation (millions), 2007............................................................................25.8Surface area (1,000 square kilometers) ...................................................2,000.0
Gross domestic product (US$ billions), 2007 .............................................381.9Gross domestic product (PPP, US$) per capita, 2007 ...........................22,851.8Real GDP growth (percent), 2007...................................................................3.5
Environmental Performance Index, 2008 (out of 149 countries).....................78
Travel & Tourism indicators
T&T industry, 2008 estimatesGDP (US$ millions) .............................................................7,920...................1.8 ....................5.0Employment (1,000 jobs).......................................................193...................2.5 ....................3.8
T&T economy, 2008 estimatesGDP (US$ millions) ...........................................................41,300...................9.2 ....................3.0Employment (1,000 jobs).......................................................732...................9.4 ....................2.3
Source: World Travel & Tourism Council, TSA Research 2008
International tourist arrivals (thousands), 2007.................11,531International tourism receipts (US$ millions), 2007 ...........5,228
Source: United Nations World Tourism Organization
Travel & Tourism Competitiveness Index
2009 Index......................................................................................................71 3.92008 Index............................................................................................................82 3.7T&T regulatory framework ............................................................................104 4.0
Policy rules and regulations..........................................................................73 4.3Environmental sustainability........................................................................123 3.7Safety and security .........................................................................................81 4.9Health and hygiene .........................................................................................93 3.8Prioritization of Travel & Tourism................................................................121 3.3
T&T business environment and infrastructure ............................................45 4.0Air transport infrastructure ..........................................................................48 3.6Ground transport infrastructure....................................................................61 3.7Tourism infrastructure ....................................................................................43 4.1ICT infrastructure ............................................................................................56 3.2Price competitiveness in the T&T industry...................................................8 5.6
T&T human, cultural, and natural resources ...............................................90 3.7Human resources ............................................................................................50 5.2
Education and training .............................................................................43 5.0Availability of qualified labor...................................................................82 5.4
Affinity for Travel & Tourism ........................................................................118 4.2Natural resources ...........................................................................................47 3.8Cultural resources.........................................................................................112 1.4
Note: For descriptions of variables and detailed sources, please refer to “How to the Read Country/Economy Profiles.”
Rank Score(out of 133) (1–7 scale)
International tourist arrivals (thousands)
International tourism receipts (US$ millions)
1995 1996 1997 1998 1999 2000 2001 2002 2003 2004 2005 2006 20072,000
4,000
6,000
8,000
10,000
12,000
1 2 3 4 5 6 7
2009–2018Percent annual growth of total (%, forecast)
part2A_profiles.r2 2/26/09 4:01 AM Page 322
The Travel & Tourism Competitiveness Report 2009 © 2009 World Economic Forum

323
2.1:
Cou
ntry
/Eco
nom
y Pr
ofile
s
The Travel & Tourism Competitiveness Index in detail ■ Competitive Advantage ■ Competitive Disadvantage
INDICATOR RANK/133
1st pillar: Policy rules and regulations1.01 Prevalence of foreign ownership ...............................114 ...■1.02 Property rights..............................................................44 ...■1.03 Business impact of rules on FDI ..................................92 ...■1.04 Visa requirements* ....................................................125 ...■1.05 Openness of bilateral Air Service Agreements* ..........75 ...■1.06 Transparency of government policymaking..................45 ...■1.07 Time required to start a business*...............................31 ...■1.08 Cost to start a business* .............................................74 ...■
2nd pillar: Environmental sustainability2.01 Stringency of environmental regulation .......................57 ...■2.02 Enforcement of environmental regulation....................46 ...■2.03 Sustainability of T&T industry development.................65 ...■2.04 Carbon dioxide emissions* ........................................117 ...■2.05 Particulate matter concentration* ..............................123 ...■2.06 Threatened species* ....................................................73 ...■2.07 Environmental treaty ratification*.................................81 ...■
3rd pillar: Safety and security3.01 Business costs of terrorism .......................................115 ...■3.02 Reliability of police services .........................................45 ...■3.03 Business costs of crime and violence..........................67 ...■3.04 Road traffic accidents*.................................................96 ...■
4th pillar: Health and hygiene4.01 Physician density*........................................................72 ...■4.02 Access to improved sanitation* ..................................n/a ......4.03 Access to improved drinking water*............................81 ...■4.04 Hospital beds*..............................................................75 ...■
5th pillar: Prioritization of Travel & Tourism5.01 Government prioritization of the T&T industry.............87 ...■5.02 T&T government expenditure* ..................................119 ...■5.03 Effectiveness of marketing and branding.....................84 ...■5.04 T&T fair attendance*..................................................115 ...■
6th pillar: Air transport infrastructure6.01 Quality of air transport infrastructure ...........................47 ...■6.02 Available seat kilometers, domestic*...........................18 ...■6.03 Available seat kilometers, international* ......................33 ...■6.04 Departures per 1,000 population*................................47 ...■6.05 Airport density* ............................................................43 ...■6.06 Number of operating airlines*......................................39 ...■6.07 International air transport network ...............................54 ...■
7th pillar: Ground transport infrastructure7.01 Quality of roads ............................................................37 ...■7.02 Quality of railroad infrastructure...................................57 ...■7.03 Quality of port infrastructure ........................................45 ...■7.04 Quality of ground transport network ............................46 ...■7.05 Road density*.............................................................111 ...■
INDICATOR RANK/133
8th pillar: Tourism infrastructure8.01 Hotel rooms*................................................................39 ...■8.02 Presence of major car rental companies*....................23 ...■8.03 ATMs accepting Visa cards* ........................................51 ...■
9th pillar: ICT infrastructure9.01 Extent of business Internet use...................................48 ...■9.02 Internet users* .............................................................59 ...■9.03 Telephone lines*...........................................................74 ...■9.04 Broadband Internet subscribers* .................................65 ...■9.05 Mobile telephone subscribers*....................................22 ...■
10th pillar: Price competitiveness in the T&T industry10.01 Ticket taxes and airport charges*.................................16 ...■10.02 Purchasing power parity*.............................................88 ...■10.03 Extent and effect of taxation..........................................9 ...■10.04 Fuel price levels* ...........................................................2 ...■10.05 Hotel price index* ........................................................81 ...■
11th pillar: Human resources11.01 Primary education enrollment* ....................................68 ...■11.02 Secondary education enrollment*................................39 ...■11.03 Quality of the educational system................................70 ...■11.04 Local availability of research and training services.......42 ...■11.05 Extent of staff training..................................................52 ...■11.06 Hiring and firing practices.............................................44 ...■11.07 Ease of hiring foreign labor ..........................................59 ...■11.08 HIV prevalence* .............................................................1 ...■11.09 Business impact of HIV/AIDS.......................................91 ...■11.10 Life expectancy* ..........................................................83 ...■
12th pillar: Affinity for Travel & Tourism12.01 Tourism openness* ....................................................105 ...■12.02 Attitude of population toward foreign visitors............124 ...■12.03 Extension of business trips recommended .................98 ...■
13th pillar: Natural resources13.01 Number of World Heritage natural sites* ....................74 ...■13.02 Protected areas* ............................................................6 ...■13.03 Quality of the natural environment...............................59 ...■13.04 Total known species*...................................................74 ...■
14th pillar: Cultural resources14.01 Number of World Heritage cultural sites* ...................97 ...■14.02 Sports stadiums* .......................................................103 ...■14.03 Number of international fairs and exhibitions* ............96 ...■14.04 Creative industries exports*.........................................47 ...■
Saudi Arabia
* Hard data
Note: For further details and explanation, please refer to the section “How toRead the Country/Economy Profiles” at the beginning of this chapter.
part2A_profiles.r2 2/26/09 4:01 AM Page 323
The Travel & Tourism Competitiveness Report 2009 © 2009 World Economic Forum

324
2.1:
Cou
ntry
/Eco
nom
y Pr
ofile
s
SenegalKey indicatorsPopulation (millions), 2007............................................................................12.2Surface area (1,000 square kilometers) ......................................................196.7
Gross domestic product (US$ billions), 2007 ...............................................11.2Gross domestic product (PPP, US$) per capita, 2007 .............................1,692.3Real GDP growth (percent), 2007...................................................................4.8
Environmental Performance Index, 2008 (out of 149 countries)...................115
Travel & Tourism indicators
T&T industry, 2008 estimatesGDP (US$ millions) ................................................................411...................3.2 ....................3.4Employment (1,000 jobs).........................................................68...................2.6 ....................1.4
T&T economy, 2008 estimatesGDP (US$ millions) ................................................................980...................7.6 ....................4.0Employment (1,000 jobs).......................................................162...................6.3 ....................2.0
Source: World Travel & Tourism Council, TSA Research 2008
International tourist arrivals (thousands), 2006......................866International tourism receipts (US$ millions), 2006 ..............250
Source: United Nations World Tourism Organization
Travel & Tourism Competitiveness Index
2009 Index....................................................................................................101 3.52008 Index..........................................................................................................108 3.4T&T regulatory framework ............................................................................101 4.0
Policy rules and regulations........................................................................103 3.8Environmental sustainability..........................................................................67 4.5Safety and security .........................................................................................43 5.7Health and hygiene .......................................................................................120 1.9Prioritization of Travel & Tourism..................................................................70 4.3
T&T business environment and infrastructure ..........................................108 2.7Air transport infrastructure ..........................................................................82 2.7Ground transport infrastructure....................................................................93 2.9Tourism infrastructure ....................................................................................94 2.0ICT infrastructure ..........................................................................................103 2.1Price competitiveness in the T&T industry...............................................115 3.9
T&T human, cultural, and natural resources ...............................................82 3.7Human resources ..........................................................................................105 4.4
Education and training ...........................................................................114 3.5Availability of qualified labor...................................................................86 5.3
Affinity for Travel & Tourism ..........................................................................87 4.6Natural resources ...........................................................................................33 4.2Cultural resources...........................................................................................90 1.8
Note: For descriptions of variables and detailed sources, please refer to “How to the Read Country/Economy Profiles.”
Rank Score(out of 133) (1–7 scale)
International tourist arrivals (thousands)
International tourism receipts (US$ millions)
1995 1996 1997 1998 1999 2000 2001 2002 2003 2004 2005 2006 20070
200
400
600
800
1,000
1 2 3 4 5 6 7
2009–2018Percent annual growth of total (%, forecast)
part2A_profiles.r2 2/26/09 4:01 AM Page 324
The Travel & Tourism Competitiveness Report 2009 © 2009 World Economic Forum

325
2.1:
Cou
ntry
/Eco
nom
y Pr
ofile
s
The Travel & Tourism Competitiveness Index in detail ■ Competitive Advantage ■ Competitive Disadvantage
INDICATOR RANK/133
1st pillar: Policy rules and regulations1.01 Prevalence of foreign ownership .................................55 ...■1.02 Property rights..............................................................76 ...■1.03 Business impact of rules on FDI ..................................66 ...■1.04 Visa requirements* ....................................................100 ...■1.05 Openness of bilateral Air Service Agreements* ..........86 ...■1.06 Transparency of government policymaking................118 ...■1.07 Time required to start a business*...............................20 ...■1.08 Cost to start a business* ...........................................113 ...■
2nd pillar: Environmental sustainability2.01 Stringency of environmental regulation .......................96 ...■2.02 Enforcement of environmental regulation....................87 ...■2.03 Sustainability of T&T industry development.................61 ...■2.04 Carbon dioxide emissions* ..........................................21 ...■2.05 Particulate matter concentration* ..............................115 ...■2.06 Threatened species* ....................................................41 ...■2.07 Environmental treaty ratification*.................................10 ...■
3rd pillar: Safety and security3.01 Business costs of terrorism .........................................32 ...■3.02 Reliability of police services .........................................36 ...■3.03 Business costs of crime and violence..........................51 ...■3.04 Road traffic accidents*.................................................83 ...■
4th pillar: Health and hygiene4.01 Physician density*......................................................123 ...■4.02 Access to improved sanitation* .................................116 ...■4.03 Access to improved drinking water*..........................106 ...■4.04 Hospital beds*............................................................130 ...■
5th pillar: Prioritization of Travel & Tourism5.01 Government prioritization of the T&T industry.............57 ...■5.02 T&T government expenditure* ....................................57 ...■5.03 Effectiveness of marketing and branding.....................52 ...■5.04 T&T fair attendance*....................................................81 ...■
6th pillar: Air transport infrastructure6.01 Quality of air transport infrastructure ...........................59 ...■6.02 Available seat kilometers, domestic*...........................87 ...■6.03 Available seat kilometers, international* ......................66 ...■6.04 Departures per 1,000 population*..............................103 ...■6.05 Airport density* ............................................................92 ...■6.06 Number of operating airlines*......................................73 ...■6.07 International air transport network ...............................51 ...■
7th pillar: Ground transport infrastructure7.01 Quality of roads ............................................................78 ...■7.02 Quality of railroad infrastructure...................................93 ...■7.03 Quality of port infrastructure ........................................73 ...■7.04 Quality of ground transport network ............................66 ...■7.05 Road density*.............................................................113 ...■
INDICATOR RANK/133
8th pillar: Tourism infrastructure8.01 Hotel rooms*................................................................89 ...■8.02 Presence of major car rental companies*....................73 ...■8.03 ATMs accepting Visa cards* ......................................106 ...■
9th pillar: ICT infrastructure9.01 Extent of business Internet use...................................43 ...■9.02 Internet users* ...........................................................101 ...■9.03 Telephone lines*.........................................................113 ...■9.04 Broadband Internet subscribers* .................................93 ...■9.05 Mobile telephone subscribers*..................................106 ...■
10th pillar: Price competitiveness in the T&T industry10.01 Ticket taxes and airport charges*...............................130 ...■10.02 Purchasing power parity*.............................................60 ...■10.03 Extent and effect of taxation........................................86 ...■10.04 Fuel price levels* .........................................................88 ...■10.05 Hotel price index* ........................................................59 ...■
11th pillar: Human resources11.01 Primary education enrollment* ..................................120 ...■11.02 Secondary education enrollment*..............................126 ...■11.03 Quality of the educational system................................59 ...■11.04 Local availability of research and training services.......30 ...■11.05 Extent of staff training................................................110 ...■11.06 Hiring and firing practices.............................................43 ...■11.07 Ease of hiring foreign labor ..........................................29 ...■11.08 HIV prevalence* .........................................................100 ...■11.09 Business impact of HIV/AIDS.......................................83 ...■11.10 Life expectancy* ........................................................110 ...■
12th pillar: Affinity for Travel & Tourism12.01 Tourism openness* ......................................................95 ...■12.02 Attitude of population toward foreign visitors................8 ...■12.03 Extension of business trips recommended ...............105 ...■
13th pillar: Natural resources13.01 Number of World Heritage natural sites* ....................23 ...■13.02 Protected areas* ..........................................................19 ...■13.03 Quality of the natural environment...............................97 ...■13.04 Total known species*...................................................45 ...■
14th pillar: Cultural resources14.01 Number of World Heritage cultural sites* ...................54 ...■14.02 Sports stadiums* .........................................................90 ...■14.03 Number of international fairs and exhibitions* ............76 ...■14.04 Creative industries exports*.........................................80 ...■
Senegal
* Hard data
Note: For further details and explanation, please refer to the section “How toRead the Country/Economy Profiles” at the beginning of this chapter.
part2A_profiles.r2 2/26/09 4:01 AM Page 325
The Travel & Tourism Competitiveness Report 2009 © 2009 World Economic Forum

326
2.1:
Cou
ntry
/Eco
nom
y Pr
ofile
s
SerbiaKey indicatorsPopulation (millions), 2007..............................................................................7.4Surface area (1,000 square kilometers) ........................................................88.4
Gross domestic product (US$ billions), 2007 ...............................................39.9Gross domestic product (PPP, US$) per capita, 2007 ...........................10,071.4Real GDP growth (percent), 2007...................................................................7.1
Environmental Performance Index, 2008 (out of 149 countries) ....................n/a
Travel & Tourism indicators
T&T industry, 2008 estimatesGDP (US$ millions) ................................................................445...................1.0 ....................4.4Employment (1,000 jobs).........................................................20...................0.9 ....................1.2
T&T economy, 2008 estimatesGDP (US$ millions) .............................................................2,090...................4.7 ....................5.1Employment (1,000 jobs).........................................................88...................4.1 ....................1.8
Source: World Travel & Tourism Council, TSA Research 2008
International tourist arrivals (thousands), 2007......................696International tourism receipts (US$ millions), 2007 ..............531
Source: United Nations World Tourism Organization
Travel & Tourism Competitiveness Index
2009 Index......................................................................................................88 3.72008 Index............................................................................................................78 3.8T&T regulatory framework ..............................................................................78 4.4
Policy rules and regulations..........................................................................67 4.4Environmental sustainability........................................................................127 3.6Safety and security .........................................................................................85 4.8Health and hygiene .........................................................................................44 5.6Prioritization of Travel & Tourism................................................................119 3.3
T&T business environment and infrastructure ............................................80 3.2Air transport infrastructure ........................................................................105 2.4Ground transport infrastructure....................................................................91 2.9Tourism infrastructure ....................................................................................58 3.5ICT infrastructure ............................................................................................63 2.9Price competitiveness in the T&T industry.................................................90 4.3
T&T human, cultural, and natural resources ...............................................96 3.6Human resources ............................................................................................54 5.2
Education and training .............................................................................66 4.7Availability of qualified labor...................................................................31 5.7
Affinity for Travel & Tourism ..........................................................................83 4.6Natural resources .........................................................................................126 2.1Cultural resources...........................................................................................64 2.4
Note: For descriptions of variables and detailed sources, please refer to “How to the Read Country/Economy Profiles.”
Rank Score(out of 133) (1–7 scale)
International tourist arrivals (thousands)
International tourism receipts (US$ millions)
1995 1996 1997 1998 1999 2000 2001 2002 2003 2004 2005 2006 2007200
300
400
500
600
700
800
1 2 3 4 5 6 7
2009–2018Percent annual growth of total (%, forecast)
part2A_profiles.r2 2/26/09 4:01 AM Page 326
The Travel & Tourism Competitiveness Report 2009 © 2009 World Economic Forum

327
2.1:
Cou
ntry
/Eco
nom
y Pr
ofile
s
The Travel & Tourism Competitiveness Index in detail ■ Competitive Advantage ■ Competitive Disadvantage
INDICATOR RANK/133
1st pillar: Policy rules and regulations1.01 Prevalence of foreign ownership ...............................109 ...■1.02 Property rights............................................................108 ...■1.03 Business impact of rules on FDI ................................112 ...■1.04 Visa requirements* ......................................................71 ...■1.05 Openness of bilateral Air Service Agreements* .........n/a ......1.06 Transparency of government policymaking..................82 ...■1.07 Time required to start a business*...............................66 ...■1.08 Cost to start a business* .............................................53 ...■
2nd pillar: Environmental sustainability2.01 Stringency of environmental regulation .....................126 ...■2.02 Enforcement of environmental regulation..................130 ...■2.03 Sustainability of T&T industry development...............106 ...■2.04 Carbon dioxide emissions* .........................................n/a ......2.05 Particulate matter concentration* ...............................n/a ......2.06 Threatened species* ....................................................58 ...■2.07 Environmental treaty ratification*.................................94 ...■
3rd pillar: Safety and security3.01 Business costs of terrorism .........................................90 ...■3.02 Reliability of police services .........................................67 ...■3.03 Business costs of crime and violence..........................64 ...■3.04 Road traffic accidents*................................................n/a ......
4th pillar: Health and hygiene4.01 Physician density*........................................................54 ...■4.02 Access to improved sanitation* ...................................55 ...■4.03 Access to improved drinking water*............................38 ...■4.04 Hospital beds*..............................................................31 ...■
5th pillar: Prioritization of Travel & Tourism5.01 Government prioritization of the T&T industry...........100 ...■5.02 T&T government expenditure* ..................................120 ...■5.03 Effectiveness of marketing and branding...................110 ...■5.04 T&T fair attendance*....................................................81 ...■
6th pillar: Air transport infrastructure6.01 Quality of air transport infrastructure ...........................98 ...■6.02 Available seat kilometers, domestic*.........................100 ...■6.03 Available seat kilometers, international* ......................93 ...■6.04 Departures per 1,000 population*................................65 ...■6.05 Airport density* ............................................................91 ...■6.06 Number of operating airlines*......................................59 ...■6.07 International air transport network .............................118 ...■
7th pillar: Ground transport infrastructure7.01 Quality of roads ..........................................................115 ...■7.02 Quality of railroad infrastructure...................................88 ...■7.03 Quality of port infrastructure ........................................84 ...■7.04 Quality of ground transport network ............................93 ...■7.05 Road density*...............................................................49 ...■
INDICATOR RANK/133
8th pillar: Tourism infrastructure8.01 Hotel rooms*................................................................68 ...■8.02 Presence of major car rental companies*....................23 ...■8.03 ATMs accepting Visa cards* ........................................61 ...■
9th pillar: ICT infrastructure9.01 Extent of business Internet use.................................109 ...■9.02 Internet users* .............................................................80 ...■9.03 Telephone lines*...........................................................41 ...■9.04 Broadband Internet subscribers* .................................56 ...■9.05 Mobile telephone subscribers*....................................57 ...■
10th pillar: Price competitiveness in the T&T industry10.01 Ticket taxes and airport charges*.................................72 ...■10.02 Purchasing power parity*.............................................61 ...■10.03 Extent and effect of taxation........................................73 ...■10.04 Fuel price levels*.........................................................n/a ......10.05 Hotel price index* ......................................................111 ...■
11th pillar: Human resources11.01 Primary education enrollment* ....................................34 ...■11.02 Secondary education enrollment*................................64 ...■11.03 Quality of the educational system................................49 ...■11.04 Local availability of research and training services.......74 ...■11.05 Extent of staff training................................................120 ...■11.06 Hiring and firing practices.............................................32 ...■11.07 Ease of hiring foreign labor ..........................................67 ...■11.08 HIV prevalence* ...........................................................22 ...■11.09 Business impact of HIV/AIDS.......................................55 ...■11.10 Life expectancy* ..........................................................55 ...■
12th pillar: Affinity for Travel & Tourism12.01 Tourism openness* ....................................................110 ...■12.02 Attitude of population toward foreign visitors..............47 ...■12.03 Extension of business trips recommended .................58 ...■
13th pillar: Natural resources13.01 Number of World Heritage natural sites* ....................74 ...■13.02 Protected areas* ........................................................110 ...■13.03 Quality of the natural environment.............................109 ...■13.04 Total known species*...................................................83 ...■
14th pillar: Cultural resources14.01 Number of World Heritage cultural sites* ...................54 ...■14.02 Sports stadiums* .........................................................55 ...■14.03 Number of international fairs and exhibitions* ............65 ...■14.04 Creative industries exports*........................................n/a ......
Serbia
* Hard data
Note: For further details and explanation, please refer to the section “How toRead the Country/Economy Profiles” at the beginning of this chapter.
part2A_profiles.r2 2/26/09 4:01 AM Page 327
The Travel & Tourism Competitiveness Report 2009 © 2009 World Economic Forum

328
2.1:
Cou
ntry
/Eco
nom
y Pr
ofile
s
SingaporeKey indicatorsPopulation (millions), 2007..............................................................................4.4Surface area (1,000 square kilometers) ..........................................................0.7
Gross domestic product (US$ billions), 2007 .............................................161.3Gross domestic product (PPP, US$) per capita, 2007 ...........................49,754.4Real GDP growth (percent), 2007...................................................................7.7
Environmental Performance Index, 2008 (out of 149 countries) ....................n/a
Travel & Tourism indicators
T&T industry, 2008 estimatesGDP (US$ millions) .............................................................4,117...................2.3 ....................1.6Employment (1,000 jobs).........................................................64...................2.3 ..................–1.5
T&T economy, 2008 estimatesGDP (US$ millions) ...........................................................15,380...................8.6 ....................2.9Employment (1,000 jobs).......................................................191...................7.0 ..................–0.2
Source: World Travel & Tourism Council, TSA Research 2008
International tourist arrivals (thousands), 2007...................7,957International tourism receipts (US$ millions), 2007 ...........8,664
Source: United Nations World Tourism Organization
Travel & Tourism Competitiveness Index
2009 Index......................................................................................................10 5.22008 Index............................................................................................................16 5.1T&T regulatory framework ................................................................................6 5.8
Policy rules and regulations............................................................................1 6.2Environmental sustainability..........................................................................42 4.9Safety and security .........................................................................................10 6.3Health and hygiene .........................................................................................53 5.2Prioritization of Travel & Tourism....................................................................2 6.3
T&T business environment and infrastructure ..............................................5 5.2Air transport infrastructure ..........................................................................15 5.0Ground transport infrastructure......................................................................4 6.5Tourism infrastructure ....................................................................................37 4.4ICT infrastructure ............................................................................................17 5.1Price competitiveness in the T&T industry.................................................27 5.2
T&T human, cultural, and natural resources ...............................................23 4.7Human resources ..............................................................................................1 6.3
Education and training ...............................................................................3 6.2Availability of qualified labor.....................................................................1 6.4
Affinity for Travel & Tourism ..........................................................................10 5.7Natural resources ...........................................................................................94 2.7Cultural resources...........................................................................................29 4.1
Note: For descriptions of variables and detailed sources, please refer to “How to the Read Country/Economy Profiles.”
Rank Score(out of 133) (1–7 scale)
International tourist arrivals (thousands)
International tourism receipts (US$ millions)
1995 1996 1997 1998 1999 2000 2001 2002 2003 2004 2005 2006 20072,000
4,000
6,000
8,000
10,000
1 2 3 4 5 6 7
2009–2018Percent annual growth of total (%, forecast)
part2A_profiles.r2 2/26/09 4:01 AM Page 328
The Travel & Tourism Competitiveness Report 2009 © 2009 World Economic Forum

329
2.1:
Cou
ntry
/Eco
nom
y Pr
ofile
s
The Travel & Tourism Competitiveness Index in detail ■ Competitive Advantage ■ Competitive Disadvantage
INDICATOR RANK/133
1st pillar: Policy rules and regulations1.01 Prevalence of foreign ownership ...................................3 ...■1.02 Property rights................................................................4 ...■1.03 Business impact of rules on FDI ....................................2 ...■1.04 Visa requirements* ........................................................2 ...■1.05 Openness of bilateral Air Service Agreements* ..........29 ...■1.06 Transparency of government policymaking....................1 ...■1.07 Time required to start a business*.................................4 ...■1.08 Cost to start a business* ...............................................8 ...■
2nd pillar: Environmental sustainability2.01 Stringency of environmental regulation .......................12 ...■2.02 Enforcement of environmental regulation......................7 ...■2.03 Sustainability of T&T industry development...................2 ...■2.04 Carbon dioxide emissions* ........................................114 ...■2.05 Particulate matter concentration* ................................74 ...■2.06 Threatened species* ....................................................82 ...■2.07 Environmental treaty ratification*...............................104 ...■
3rd pillar: Safety and security3.01 Business costs of terrorism .........................................76 ...■3.02 Reliability of police services ...........................................6 ...■3.03 Business costs of crime and violence............................9 ...■3.04 Road traffic accidents*.................................................19 ...■
4th pillar: Health and hygiene4.01 Physician density*........................................................67 ...■4.02 Access to improved sanitation* .....................................1 ...■4.03 Access to improved drinking water*..............................1 ...■4.04 Hospital beds*..............................................................54 ...■
5th pillar: Prioritization of Travel & Tourism5.01 Government prioritization of the T&T industry...............4 ...■5.02 T&T government expenditure* ......................................8 ...■5.03 Effectiveness of marketing and branding.......................3 ...■5.04 T&T fair attendance*....................................................25 ...■
6th pillar: Air transport infrastructure6.01 Quality of air transport infrastructure .............................1 ...■6.02 Available seat kilometers, domestic*.........................100 ...■6.03 Available seat kilometers, international* ......................10 ...■6.04 Departures per 1,000 population*................................18 ...■6.05 Airport density* ............................................................89 ...■6.06 Number of operating airlines*......................................28 ...■6.07 International air transport network .................................2 ...■
7th pillar: Ground transport infrastructure7.01 Quality of roads ..............................................................3 ...■7.02 Quality of railroad infrastructure...................................10 ...■7.03 Quality of port infrastructure ..........................................1 ...■7.04 Quality of ground transport network ..............................4 ...■7.05 Road density*.................................................................4 ...■
INDICATOR RANK/133
8th pillar: Tourism infrastructure8.01 Hotel rooms*................................................................34 ...■8.02 Presence of major car rental companies*....................56 ...■8.03 ATMs accepting Visa cards* ........................................30 ...■
9th pillar: ICT infrastructure9.01 Extent of business Internet use...................................18 ...■9.02 Internet users* ...............................................................9 ...■9.03 Telephone lines*...........................................................28 ...■9.04 Broadband Internet subscribers* .................................24 ...■9.05 Mobile telephone subscribers*....................................12 ...■
10th pillar: Price competitiveness in the T&T industry10.01 Ticket taxes and airport charges*.................................36 ...■10.02 Purchasing power parity*.............................................90 ...■10.03 Extent and effect of taxation..........................................5 ...■10.04 Fuel price levels* .........................................................35 ...■10.05 Hotel price index* ........................................................73 ...■
11th pillar: Human resources11.01 Primary education enrollment* ....................................38 ...■11.02 Secondary education enrollment*................................21 ...■11.03 Quality of the educational system..................................2 ...■11.04 Local availability of research and training services.......13 ...■11.05 Extent of staff training....................................................3 ...■11.06 Hiring and firing practices...............................................2 ...■11.07 Ease of hiring foreign labor ............................................4 ...■11.08 HIV prevalence* ...........................................................49 ...■11.09 Business impact of HIV/AIDS.......................................19 ...■11.10 Life expectancy* ..........................................................12 ...■
12th pillar: Affinity for Travel & Tourism12.01 Tourism openness* ......................................................16 ...■12.02 Attitude of population toward foreign visitors................7 ...■12.03 Extension of business trips recommended .................50 ...■
13th pillar: Natural resources13.01 Number of World Heritage natural sites* ....................74 ...■13.02 Protected areas* ........................................................105 ...■13.03 Quality of the natural environment...............................12 ...■13.04 Total known species*...................................................77 ...■
14th pillar: Cultural resources14.01 Number of World Heritage cultural sites* .................116 ...■14.02 Sports stadiums* .........................................................72 ...■14.03 Number of international fairs and exhibitions* ............18 ...■14.04 Creative industries exports*.........................................19 ...■
Singapore
* Hard data
Note: For further details and explanation, please refer to the section “How toRead the Country/Economy Profiles” at the beginning of this chapter.
part2A_profiles.r2 2/26/09 4:01 AM Page 329
The Travel & Tourism Competitiveness Report 2009 © 2009 World Economic Forum

330
2.1:
Cou
ntry
/Eco
nom
y Pr
ofile
s
Slovak RepublicKey indicatorsPopulation (millions), 2007..............................................................................5.4Surface area (1,000 square kilometers) ........................................................49.0
Gross domestic product (US$ billions), 2007 ...............................................75.0Gross domestic product (PPP, US$) per capita, 2007 ...........................20,267.8Real GDP growth (percent), 2007.................................................................10.4
Environmental Performance Index, 2008 (out of 149 countries).....................17
Travel & Tourism indicators
T&T industry, 2008 estimatesGDP (US$ millions) .............................................................1,312...................1.5 ....................2.3Employment (1,000 jobs).........................................................34...................1.4 ..................–1.9
T&T economy, 2008 estimatesGDP (US$ millions) ...........................................................11,324.................12.6 ....................4.9Employment (1,000 jobs).......................................................261.................11.1 ....................0.4
Source: World Travel & Tourism Council, TSA Research 2008
International tourist arrivals (thousands), 2007...................1,685International tourism receipts (US$ millions), 2007 ...........2,013
Source: United Nations World Tourism Organization
Travel & Tourism Competitiveness Index
2009 Index......................................................................................................46 4.32008 Index............................................................................................................38 4.4T&T regulatory framework ..............................................................................34 5.2
Policy rules and regulations..........................................................................33 5.0Environmental sustainability..........................................................................25 5.1Safety and security .........................................................................................46 5.6Health and hygiene .........................................................................................17 6.5Prioritization of Travel & Tourism................................................................103 3.7
T&T business environment and infrastructure ............................................54 3.8Air transport infrastructure ........................................................................108 2.3Ground transport infrastructure....................................................................50 4.0Tourism infrastructure ....................................................................................31 4.6ICT infrastructure ............................................................................................45 3.7Price competitiveness in the T&T industry.................................................88 4.3
T&T human, cultural, and natural resources ...............................................55 4.0Human resources ............................................................................................48 5.2
Education and training .............................................................................54 4.9Availability of qualified labor...................................................................53 5.5
Affinity for Travel & Tourism ..........................................................................91 4.5Natural resources ...........................................................................................48 3.7Cultural resources...........................................................................................53 2.7
Note: For descriptions of variables and detailed sources, please refer to “How to the Read Country/Economy Profiles.”
Rank Score(out of 133) (1–7 scale)
International tourist arrivals (thousands)
International tourism receipts (US$ millions)
1995 1996 1997 1998 1999 2000 2001 2002 2003 2004 2005 2006 20070
500
1,000
1,500
2,000
2,500
1 2 3 4 5 6 7
2009–2018Percent annual growth of total (%, forecast)
part2A_profiles.r2 2/26/09 4:01 AM Page 330
The Travel & Tourism Competitiveness Report 2009 © 2009 World Economic Forum

331
2.1:
Cou
ntry
/Eco
nom
y Pr
ofile
s
The Travel & Tourism Competitiveness Index in detail ■ Competitive Advantage ■ Competitive Disadvantage
INDICATOR RANK/133
1st pillar: Policy rules and regulations1.01 Prevalence of foreign ownership ...................................4 ...■1.02 Property rights..............................................................55 ...■1.03 Business impact of rules on FDI ....................................5 ...■1.04 Visa requirements* ......................................................40 ...■1.05 Openness of bilateral Air Service Agreements* ..........79 ...■1.06 Transparency of government policymaking..................50 ...■1.07 Time required to start a business*...............................45 ...■1.08 Cost to start a business* .............................................29 ...■
2nd pillar: Environmental sustainability2.01 Stringency of environmental regulation .......................27 ...■2.02 Enforcement of environmental regulation....................35 ...■2.03 Sustainability of T&T industry development...............122 ...■2.04 Carbon dioxide emissions* ..........................................88 ...■2.05 Particulate matter concentration* ................................12 ...■2.06 Threatened species* ....................................................25 ...■2.07 Environmental treaty ratification*.................................34 ...■
3rd pillar: Safety and security3.01 Business costs of terrorism ...........................................7 ...■3.02 Reliability of police services .......................................101 ...■3.03 Business costs of crime and violence..........................44 ...■3.04 Road traffic accidents*...................................................6 ...■
4th pillar: Health and hygiene4.01 Physician density*........................................................30 ...■4.02 Access to improved sanitation* .....................................1 ...■4.03 Access to improved drinking water*..............................1 ...■4.04 Hospital beds*..............................................................17 ...■
5th pillar: Prioritization of Travel & Tourism5.01 Government prioritization of the T&T industry...........115 ...■5.02 T&T government expenditure* ....................................94 ...■5.03 Effectiveness of marketing and branding...................126 ...■5.04 T&T fair attendance*....................................................25 ...■
6th pillar: Air transport infrastructure6.01 Quality of air transport infrastructure .........................109 ...■6.02 Available seat kilometers, domestic*...........................68 ...■6.03 Available seat kilometers, international* ....................101 ...■6.04 Departures per 1,000 population*................................64 ...■6.05 Airport density* ............................................................51 ...■6.06 Number of operating airlines*....................................118 ...■6.07 International air transport network .............................103 ...■
7th pillar: Ground transport infrastructure7.01 Quality of roads ............................................................82 ...■7.02 Quality of railroad infrastructure...................................29 ...■7.03 Quality of port infrastructure ........................................56 ...■7.04 Quality of ground transport network ............................70 ...■7.05 Road density*...............................................................36 ...■
INDICATOR RANK/133
8th pillar: Tourism infrastructure8.01 Hotel rooms*................................................................38 ...■8.02 Presence of major car rental companies*....................23 ...■8.03 ATMs accepting Visa cards* ........................................32 ...■
9th pillar: ICT infrastructure9.01 Extent of business Internet use...................................58 ...■9.02 Internet users* .............................................................36 ...■9.03 Telephone lines*...........................................................60 ...■9.04 Broadband Internet subscribers* .................................40 ...■9.05 Mobile telephone subscribers*....................................26 ...■
10th pillar: Price competitiveness in the T&T industry10.01 Ticket taxes and airport charges*...............................106 ...■10.02 Purchasing power parity*.............................................87 ...■10.03 Extent and effect of taxation........................................17 ...■10.04 Fuel price levels* .......................................................123 ...■10.05 Hotel price index* ........................................................85 ...■
11th pillar: Human resources11.01 Primary education enrollment* ....................................71 ...■11.02 Secondary education enrollment*................................47 ...■11.03 Quality of the educational system................................76 ...■11.04 Local availability of research and training services.......59 ...■11.05 Extent of staff training..................................................40 ...■11.06 Hiring and firing practices.............................................65 ...■11.07 Ease of hiring foreign labor ..........................................35 ...■11.08 HIV prevalence* .............................................................1 ...■11.09 Business impact of HIV/AIDS.......................................11 ...■11.10 Life expectancy* ..........................................................50 ...■
12th pillar: Affinity for Travel & Tourism12.01 Tourism openness* ......................................................71 ...■12.02 Attitude of population toward foreign visitors............120 ...■12.03 Extension of business trips recommended .................74 ...■
13th pillar: Natural resources13.01 Number of World Heritage natural sites* ....................23 ...■13.02 Protected areas* ..........................................................27 ...■13.03 Quality of the natural environment...............................73 ...■13.04 Total known species*...................................................92 ...■
14th pillar: Cultural resources14.01 Number of World Heritage cultural sites* ...................33 ...■14.02 Sports stadiums* .........................................................45 ...■14.03 Number of international fairs and exhibitions* ............60 ...■14.04 Creative industries exports*.........................................42 ...■
Slovak Republic
* Hard data
Note: For further details and explanation, please refer to the section “How toRead the Country/Economy Profiles” at the beginning of this chapter.
part2A_profiles.r2 2/26/09 4:01 AM Page 331
The Travel & Tourism Competitiveness Report 2009 © 2009 World Economic Forum

332
2.1:
Cou
ntry
/Eco
nom
y Pr
ofile
s
SloveniaKey indicatorsPopulation (millions), 2007..............................................................................2.0Surface area (1,000 square kilometers) ........................................................20.3
Gross domestic product (US$ billions), 2007 ...............................................46.1Gross domestic product (PPP, US$) per capita, 2007 ...........................27,227.2Real GDP growth (percent), 2007...................................................................6.1
Environmental Performance Index, 2008 (out of 149 countries).....................15
Travel & Tourism indicators
T&T industry, 2008 estimatesGDP (US$ millions) .............................................................1,238...................2.4 ....................4.8Employment (1,000 jobs).........................................................28...................3.3 ....................1.2
T&T economy, 2008 estimatesGDP (US$ millions) .............................................................6,101.................11.9 ....................4.8Employment (1,000 jobs).......................................................113.................13.2 ....................1.1
Source: World Travel & Tourism Council, TSA Research 2008
International tourist arrivals (thousands), 2007...................1,751International tourism receipts (US$ millions), 2007 ...........2,483
Source: United Nations World Tourism Organization
Travel & Tourism Competitiveness Index
2009 Index......................................................................................................35 4.52008 Index............................................................................................................36 4.5T&T regulatory framework ..............................................................................38 5.1
Policy rules and regulations..........................................................................66 4.4Environmental sustainability..........................................................................20 5.3Safety and security .........................................................................................24 5.9Health and hygiene .........................................................................................36 5.8Prioritization of Travel & Tourism..................................................................80 4.1
T&T business environment and infrastructure ............................................33 4.5Air transport infrastructure ..........................................................................70 2.9Ground transport infrastructure....................................................................23 4.9Tourism infrastructure ....................................................................................16 6.0ICT infrastructure ............................................................................................27 4.6Price competitiveness in the T&T industry.................................................94 4.2
T&T human, cultural, and natural resources ...............................................61 3.9Human resources ............................................................................................36 5.4
Education and training .............................................................................33 5.3Availability of qualified labor...................................................................66 5.5
Affinity for Travel & Tourism ..........................................................................70 4.7Natural resources ...........................................................................................79 3.0Cultural resources...........................................................................................54 2.7
Note: For descriptions of variables and detailed sources, please refer to “How to the Read Country/Economy Profiles.”
Rank Score(out of 133) (1–7 scale)
International tourist arrivals (thousands)
International tourism receipts (US$ millions)
1995 1996 1997 1998 1999 2000 2001 2002 2003 2004 2005 2006 2007500
1,000
1,500
2,000
2,500
1 2 3 4 5 6 7
2009–2018Percent annual growth of total (%, forecast)
part2A_profiles.r2 2/26/09 4:01 AM Page 332
The Travel & Tourism Competitiveness Report 2009 © 2009 World Economic Forum

333
2.1:
Cou
ntry
/Eco
nom
y Pr
ofile
s
The Travel & Tourism Competitiveness Index in detail ■ Competitive Advantage ■ Competitive Disadvantage
INDICATOR RANK/133
1st pillar: Policy rules and regulations1.01 Prevalence of foreign ownership ...............................107 ...■1.02 Property rights..............................................................57 ...■1.03 Business impact of rules on FDI ................................114 ...■1.04 Visa requirements* ......................................................40 ...■1.05 Openness of bilateral Air Service Agreements* ........122 ...■1.06 Transparency of government policymaking..................43 ...■1.07 Time required to start a business*...............................57 ...■1.08 Cost to start a business* ...............................................2 ...■
2nd pillar: Environmental sustainability2.01 Stringency of environmental regulation .......................25 ...■2.02 Enforcement of environmental regulation....................23 ...■2.03 Sustainability of T&T industry development.................92 ...■2.04 Carbon dioxide emissions* ..........................................96 ...■2.05 Particulate matter concentration* ................................49 ...■2.06 Threatened species* ....................................................26 ...■2.07 Environmental treaty ratification*.................................10 ...■
3rd pillar: Safety and security3.01 Business costs of terrorism .........................................25 ...■3.02 Reliability of police services .........................................57 ...■3.03 Business costs of crime and violence..........................22 ...■3.04 Road traffic accidents*.................................................21 ...■
4th pillar: Health and hygiene4.01 Physician density*........................................................44 ...■4.02 Access to improved sanitation* .....................................1 ...■4.03 Access to improved drinking water*..............................1 ...■4.04 Hospital beds*..............................................................36 ...■
5th pillar: Prioritization of Travel & Tourism5.01 Government prioritization of the T&T industry.............94 ...■5.02 T&T government expenditure* ....................................43 ...■5.03 Effectiveness of marketing and branding.....................92 ...■5.04 T&T fair attendance*....................................................62 ...■
6th pillar: Air transport infrastructure6.01 Quality of air transport infrastructure ...........................63 ...■6.02 Available seat kilometers, domestic*.........................100 ...■6.03 Available seat kilometers, international* ....................113 ...■6.04 Departures per 1,000 population*................................37 ...■6.05 Airport density* ............................................................47 ...■6.06 Number of operating airlines*....................................103 ...■6.07 International air transport network ...............................81 ...■
7th pillar: Ground transport infrastructure7.01 Quality of roads ............................................................41 ...■7.02 Quality of railroad infrastructure...................................43 ...■7.03 Quality of port infrastructure ........................................39 ...■7.04 Quality of ground transport network ............................40 ...■7.05 Road density*...............................................................11 ...■
INDICATOR RANK/133
8th pillar: Tourism infrastructure8.01 Hotel rooms*................................................................32 ...■8.02 Presence of major car rental companies*......................1 ...■8.03 ATMs accepting Visa cards* ..........................................7 ...■
9th pillar: ICT infrastructure9.01 Extent of business Internet use...................................35 ...■9.02 Internet users* .............................................................14 ...■9.03 Telephone lines*...........................................................25 ...■9.04 Broadband Internet subscribers* .................................28 ...■9.05 Mobile telephone subscribers*....................................44 ...■
10th pillar: Price competitiveness in the T&T industry10.01 Ticket taxes and airport charges*...............................103 ...■10.02 Purchasing power parity*...........................................102 ...■10.03 Extent and effect of taxation........................................95 ...■10.04 Fuel price levels* .........................................................99 ...■10.05 Hotel price index* ........................................................24 ...■
11th pillar: Human resources11.01 Primary education enrollment* ....................................49 ...■11.02 Secondary education enrollment*................................43 ...■11.03 Quality of the educational system................................35 ...■11.04 Local availability of research and training services.......33 ...■11.05 Extent of staff training..................................................43 ...■11.06 Hiring and firing practices...........................................117 ...■11.07 Ease of hiring foreign labor ..........................................68 ...■11.08 HIV prevalence* .............................................................1 ...■11.09 Business impact of HIV/AIDS.......................................25 ...■11.10 Life expectancy* ..........................................................29 ...■
12th pillar: Affinity for Travel & Tourism12.01 Tourism openness* ......................................................36 ...■12.02 Attitude of population toward foreign visitors..............68 ...■12.03 Extension of business trips recommended ...............124 ...■
13th pillar: Natural resources13.01 Number of World Heritage natural sites* ....................40 ...■13.02 Protected areas* ..........................................................82 ...■13.03 Quality of the natural environment...............................27 ...■13.04 Total known species*...................................................95 ...■
14th pillar: Cultural resources14.01 Number of World Heritage cultural sites* .................116 ...■14.02 Sports stadiums* .........................................................20 ...■14.03 Number of international fairs and exhibitions* ............38 ...■14.04 Creative industries exports*.........................................41 ...■
Slovenia
* Hard data
Note: For further details and explanation, please refer to the section “How toRead the Country/Economy Profiles” at the beginning of this chapter.
part2A_profiles.r2 2/26/09 4:01 AM Page 333
The Travel & Tourism Competitiveness Report 2009 © 2009 World Economic Forum

334
2.1:
Cou
ntry
/Eco
nom
y Pr
ofile
s
South AfricaKey indicatorsPopulation (millions), 2007............................................................................47.7Surface area (1,000 square kilometers) ...................................................1,219.1
Gross domestic product (US$ billions), 2007 .............................................283.1Gross domestic product (PPP, US$) per capita, 2007 .............................9,767.5Real GDP growth (percent), 2007...................................................................5.1
Environmental Performance Index, 2008 (out of 149 countries).....................97
Travel & Tourism indicators
T&T industry, 2008 estimatesGDP (US$ millions) .............................................................9,969...................3.3 ....................4.1Employment (1,000 jobs).......................................................445...................3.3 ....................2.2
T&T economy, 2008 estimatesGDP (US$ millions) ...........................................................25,234...................8.4 ....................4.2Employment (1,000 jobs)....................................................1,011...................7.6 ....................2.4
Source: World Travel & Tourism Council, TSA Research 2008
International tourist arrivals (thousands), 2007...................9,090International tourism receipts (US$ millions), 2007 ...........8,418
Source: United Nations World Tourism Organization
Travel & Tourism Competitiveness Index
2009 Index......................................................................................................61 4.12008 Index............................................................................................................60 4.1T&T regulatory framework ..............................................................................82 4.3
Policy rules and regulations..........................................................................36 5.0Environmental sustainability..........................................................................44 4.8Safety and security .......................................................................................128 3.5Health and hygiene .........................................................................................94 3.8Prioritization of Travel & Tourism..................................................................60 4.4
T&T business environment and infrastructure ............................................52 3.8Air transport infrastructure ..........................................................................43 3.9Ground transport infrastructure....................................................................64 3.6Tourism infrastructure ....................................................................................46 4.0ICT infrastructure ............................................................................................80 2.6Price competitiveness in the T&T industry.................................................38 5.0
T&T human, cultural, and natural resources ...............................................49 4.2Human resources ..........................................................................................112 4.2
Education and training .............................................................................48 5.0Availability of qualified labor.................................................................131 3.5
Affinity for Travel & Tourism ..........................................................................43 5.0Natural resources ...........................................................................................22 4.6Cultural resources...........................................................................................45 2.9
Note: For descriptions of variables and detailed sources, please refer to “How to the Read Country/Economy Profiles.”
Rank Score(out of 133) (1–7 scale)
International tourist arrivals (thousands)
International tourism receipts (US$ millions)
1995 1996 1997 1998 1999 2000 2001 2002 2003 2004 2005 2006 20072,000
4,000
6,000
8,000
10,000
1 2 3 4 5 6 7
2009–2018Percent annual growth of total (%, forecast)
part2A_profiles.r2 2/26/09 4:01 AM Page 334
The Travel & Tourism Competitiveness Report 2009 © 2009 World Economic Forum

335
2.1:
Cou
ntry
/Eco
nom
y Pr
ofile
s
The Travel & Tourism Competitiveness Index in detail ■ Competitive Advantage ■ Competitive Disadvantage
INDICATOR RANK/133
1st pillar: Policy rules and regulations1.01 Prevalence of foreign ownership .................................58 ...■1.02 Property rights..............................................................20 ...■1.03 Business impact of rules on FDI ..................................77 ...■1.04 Visa requirements* ......................................................28 ...■1.05 Openness of bilateral Air Service Agreements* ..........61 ...■1.06 Transparency of government policymaking..................29 ...■1.07 Time required to start a business*...............................65 ...■1.08 Cost to start a business* .............................................47 ...■
2nd pillar: Environmental sustainability2.01 Stringency of environmental regulation .......................47 ...■2.02 Enforcement of environmental regulation....................57 ...■2.03 Sustainability of T&T industry development.................16 ...■2.04 Carbon dioxide emissions* ........................................101 ...■2.05 Particulate matter concentration* ................................28 ...■2.06 Threatened species* ....................................................94 ...■2.07 Environmental treaty ratification*.................................34 ...■
3rd pillar: Safety and security3.01 Business costs of terrorism .........................................36 ...■3.02 Reliability of police services .......................................108 ...■3.03 Business costs of crime and violence........................133 ...■3.04 Road traffic accidents*...............................................117 ...■
4th pillar: Health and hygiene4.01 Physician density*........................................................93 ...■4.02 Access to improved sanitation* ...................................94 ...■4.03 Access to improved drinking water*............................68 ...■4.04 Hospital beds*..............................................................66 ...■
5th pillar: Prioritization of Travel & Tourism5.01 Government prioritization of the T&T industry.............18 ...■5.02 T&T government expenditure* ..................................124 ...■5.03 Effectiveness of marketing and branding.....................17 ...■5.04 T&T fair attendance*....................................................41 ...■
6th pillar: Air transport infrastructure6.01 Quality of air transport infrastructure ...........................25 ...■6.02 Available seat kilometers, domestic*...........................16 ...■6.03 Available seat kilometers, international* ......................24 ...■6.04 Departures per 1,000 population*................................60 ...■6.05 Airport density* ............................................................90 ...■6.06 Number of operating airlines*......................................30 ...■6.07 International air transport network ...............................12 ...■
7th pillar: Ground transport infrastructure7.01 Quality of roads ............................................................40 ...■7.02 Quality of railroad infrastructure...................................37 ...■7.03 Quality of port infrastructure ........................................49 ...■7.04 Quality of ground transport network..........................126 ...■7.05 Road density*...............................................................64 ...■
INDICATOR RANK/133
8th pillar: Tourism infrastructure8.01 Hotel rooms*................................................................91 ...■8.02 Presence of major car rental companies*......................1 ...■8.03 ATMs accepting Visa cards* ........................................45 ...■
9th pillar: ICT infrastructure9.01 Extent of business Internet use...................................47 ...■9.02 Internet users* .............................................................97 ...■9.03 Telephone lines*...........................................................93 ...■9.04 Broadband Internet subscribers* .................................87 ...■9.05 Mobile telephone subscribers*....................................55 ...■
10th pillar: Price competitiveness in the T&T industry10.01 Ticket taxes and airport charges*.................................70 ...■10.02 Purchasing power parity*.............................................69 ...■10.03 Extent and effect of taxation........................................25 ...■10.04 Fuel price levels* .........................................................62 ...■10.05 Hotel price index* ........................................................38 ...■
11th pillar: Human resources11.01 Primary education enrollment* ....................................97 ...■11.02 Secondary education enrollment*................................44 ...■11.03 Quality of the educational system..............................110 ...■11.04 Local availability of research and training services.......29 ...■11.05 Extent of staff training..................................................15 ...■11.06 Hiring and firing practices...........................................128 ...■11.07 Ease of hiring foreign labor ........................................122 ...■11.08 HIV prevalence* .........................................................131 ...■11.09 Business impact of HIV/AIDS.....................................132 ...■11.10 Life expectancy* ........................................................120 ...■
12th pillar: Affinity for Travel & Tourism12.01 Tourism openness* ......................................................78 ...■12.02 Attitude of population toward foreign visitors..............49 ...■12.03 Extension of business trips recommended ...................8 ...■
13th pillar: Natural resources13.01 Number of World Heritage natural sites* ....................10 ...■13.02 Protected areas* ..........................................................86 ...■13.03 Quality of the natural environment...............................51 ...■13.04 Total known species*...................................................24 ...■
14th pillar: Cultural resources14.01 Number of World Heritage cultural sites* ...................45 ...■14.02 Sports stadiums* .........................................................65 ...■14.03 Number of international fairs and exhibitions* ............35 ...■14.04 Creative industries exports*.........................................43 ...■
South Africa
* Hard data
Note: For further details and explanation, please refer to the section “How toRead the Country/Economy Profiles” at the beginning of this chapter.
part2A_profiles.r2 2/26/09 4:01 AM Page 335
The Travel & Tourism Competitiveness Report 2009 © 2009 World Economic Forum

336
2.1:
Cou
ntry
/Eco
nom
y Pr
ofile
s
SpainKey indicatorsPopulation (millions), 2007............................................................................43.6Surface area (1,000 square kilometers) ......................................................505.4
Gross domestic product (US$ billions), 2007 ..........................................1,440.0Gross domestic product (PPP, US$) per capita, 2007 ...........................30,118.4Real GDP growth (percent), 2007...................................................................3.7
Environmental Performance Index, 2008 (out of 149 countries).....................30
Travel & Tourism indicators
T&T industry, 2008 estimatesGDP (US$ millions) .........................................................102,483...................6.4 ....................2.4Employment (1,000 jobs)....................................................1,427...................6.9 ....................1.3
T&T economy, 2008 estimatesGDP (US$ millions) .........................................................276,740.................17.2 ....................2.9Employment (1,000 jobs)....................................................3,687.................17.7 ....................1.7
Source: World Travel & Tourism Council, TSA Research 2008
International tourist arrivals (thousands), 2007.................59,193International tourism receipts (US$ millions), 2007 .........57,795
Source: United Nations World Tourism Organization
Travel & Tourism Competitiveness Index
2009 Index........................................................................................................6 5.32008 Index..............................................................................................................5 5.3T&T regulatory framework ..............................................................................29 5.3
Policy rules and regulations..........................................................................74 4.3Environmental sustainability..........................................................................31 5.0Safety and security .........................................................................................66 5.2Health and hygiene .........................................................................................35 5.9Prioritization of Travel & Tourism....................................................................4 6.0
T&T business environment and infrastructure ..............................................8 5.2Air transport infrastructure ..........................................................................10 5.2Ground transport infrastructure....................................................................20 5.3Tourism infrastructure ......................................................................................1 7.0ICT infrastructure ............................................................................................31 4.3Price competitiveness in the T&T industry.................................................96 4.2
T&T human, cultural, and natural resources .................................................5 5.4Human resources ............................................................................................31 5.4
Education and training .............................................................................34 5.2Availability of qualified labor...................................................................32 5.7
Affinity for Travel & Tourism ..........................................................................48 4.9Natural resources ...........................................................................................30 4.3Cultural resources.............................................................................................1 6.8
Note: For descriptions of variables and detailed sources, please refer to “How to the Read Country/Economy Profiles.”
Rank Score(out of 133) (1–7 scale)
International tourist arrivals (thousands)
International tourism receipts (US$ millions)
1995 1996 1997 1998 1999 2000 2001 2002 2003 2004 2005 2006 200720,000
30,000
40,000
50,000
60,000
1 2 3 4 5 6 7
2009–2018Percent annual growth of total (%, forecast)
part2A_profiles.r2 2/26/09 4:01 AM Page 336
The Travel & Tourism Competitiveness Report 2009 © 2009 World Economic Forum

337
2.1:
Cou
ntry
/Eco
nom
y Pr
ofile
s
The Travel & Tourism Competitiveness Index in detail ■ Competitive Advantage ■ Competitive Disadvantage
INDICATOR RANK/133
1st pillar: Policy rules and regulations1.01 Prevalence of foreign ownership .................................63 ...■1.02 Property rights..............................................................42 ...■1.03 Business impact of rules on FDI ..................................76 ...■1.04 Visa requirements* ......................................................40 ...■1.05 Openness of bilateral Air Service Agreements* ..........84 ...■1.06 Transparency of government policymaking..................89 ...■1.07 Time required to start a business*.............................109 ...■1.08 Cost to start a business* .............................................74 ...■
2nd pillar: Environmental sustainability2.01 Stringency of environmental regulation .......................36 ...■2.02 Enforcement of environmental regulation....................37 ...■2.03 Sustainability of T&T industry development.................35 ...■2.04 Carbon dioxide emissions* ..........................................94 ...■2.05 Particulate matter concentration* ................................56 ...■2.06 Threatened species* ....................................................96 ...■2.07 Environmental treaty ratification*...................................2 ...■
3rd pillar: Safety and security3.01 Business costs of terrorism .......................................108 ...■3.02 Reliability of police services .........................................26 ...■3.03 Business costs of crime and violence..........................59 ...■3.04 Road traffic accidents*...............................................102 ...■
4th pillar: Health and hygiene4.01 Physician density*........................................................25 ...■4.02 Access to improved sanitation* .....................................1 ...■4.03 Access to improved drinking water*..............................1 ...■4.04 Hospital beds*..............................................................51 ...■
5th pillar: Prioritization of Travel & Tourism5.01 Government prioritization of the T&T industry.............13 ...■5.02 T&T government expenditure* ....................................21 ...■5.03 Effectiveness of marketing and branding.....................16 ...■5.04 T&T fair attendance*......................................................3 ...■
6th pillar: Air transport infrastructure6.01 Quality of air transport infrastructure ...........................34 ...■6.02 Available seat kilometers, domestic*...........................10 ...■6.03 Available seat kilometers, international* ........................6 ...■6.04 Departures per 1,000 population*................................26 ...■6.05 Airport density* ............................................................52 ...■6.06 Number of operating airlines*........................................6 ...■6.07 International air transport network ...............................41 ...■
7th pillar: Ground transport infrastructure7.01 Quality of roads ............................................................30 ...■7.02 Quality of railroad infrastructure...................................19 ...■7.03 Quality of port infrastructure ........................................33 ...■7.04 Quality of ground transport network ............................20 ...■7.05 Road density*...............................................................26 ...■
INDICATOR RANK/133
8th pillar: Tourism infrastructure8.01 Hotel rooms*..................................................................7 ...■8.02 Presence of major car rental companies*......................1 ...■8.03 ATMs accepting Visa cards* ..........................................1 ...■
9th pillar: ICT infrastructure9.01 Extent of business Internet use...................................62 ...■9.02 Internet users* .............................................................33 ...■9.03 Telephone lines*...........................................................27 ...■9.04 Broadband Internet subscribers* .................................27 ...■9.05 Mobile telephone subscribers*....................................30 ...■
10th pillar: Price competitiveness in the T&T industry10.01 Ticket taxes and airport charges*.................................30 ...■10.02 Purchasing power parity*...........................................111 ...■10.03 Extent and effect of taxation........................................75 ...■10.04 Fuel price levels* .........................................................91 ...■10.05 Hotel price index* ........................................................63 ...■
11th pillar: Human resources11.01 Primary education enrollment* ......................................4 ...■11.02 Secondary education enrollment*..................................4 ...■11.03 Quality of the educational system................................52 ...■11.04 Local availability of research and training services.......37 ...■11.05 Extent of staff training..................................................63 ...■11.06 Hiring and firing practices...........................................115 ...■11.07 Ease of hiring foreign labor ..........................................37 ...■11.08 HIV prevalence* ...........................................................78 ...■11.09 Business impact of HIV/AIDS.......................................41 ...■11.10 Life expectancy* ............................................................5 ...■
12th pillar: Affinity for Travel & Tourism12.01 Tourism openness* ......................................................61 ...■12.02 Attitude of population toward foreign visitors..............53 ...■12.03 Extension of business trips recommended .................33 ...■
13th pillar: Natural resources13.01 Number of World Heritage natural sites* ......................7 ...■13.02 Protected areas* ..........................................................69 ...■13.03 Quality of the natural environment...............................69 ...■13.04 Total known species*...................................................65 ...■
14th pillar: Cultural resources14.01 Number of World Heritage cultural sites* .....................2 ...■14.02 Sports stadiums* .........................................................15 ...■14.03 Number of international fairs and exhibitions* ..............4 ...■14.04 Creative industries exports*.........................................11 ...■
Spain
* Hard data
Note: For further details and explanation, please refer to the section “How toRead the Country/Economy Profiles” at the beginning of this chapter.
part2A_profiles.r2 2/26/09 4:01 AM Page 337
The Travel & Tourism Competitiveness Report 2009 © 2009 World Economic Forum

338
2.1:
Cou
ntry
/Eco
nom
y Pr
ofile
s
Sri LankaKey indicatorsPopulation (millions), 2007............................................................................21.1Surface area (1,000 square kilometers) ........................................................65.6
Gross domestic product (US$ billions), 2007 ...............................................32.3Gross domestic product (PPP, US$) per capita, 2007 .............................4,264.9Real GDP growth (percent), 2007...................................................................6.8
Environmental Performance Index, 2008 (out of 149 countries).....................50
Travel & Tourism indicators
T&T industry, 2008 estimatesGDP (US$ millions) .............................................................1,032...................2.9 ....................5.9Employment (1,000 jobs).......................................................195...................2.4 ....................2.3
T&T economy, 2008 estimatesGDP (US$ millions) .............................................................2,968...................8.4 ....................5.5Employment (1,000 jobs).......................................................567...................6.9 ....................1.9
Source: World Travel & Tourism Council, TSA Research 2008
International tourist arrivals (thousands), 2007......................494International tourism receipts (US$ millions), 2007 ..............385
Source: United Nations World Tourism Organization
Travel & Tourism Competitiveness Index
2009 Index......................................................................................................78 3.82008 Index............................................................................................................73 3.8T&T regulatory framework ..............................................................................86 4.3
Policy rules and regulations..........................................................................68 4.4Environmental sustainability........................................................................112 3.9Safety and security .......................................................................................107 4.4Health and hygiene .........................................................................................90 3.9Prioritization of Travel & Tourism..................................................................47 4.7
T&T business environment and infrastructure ............................................73 3.3Air transport infrastructure ..........................................................................87 2.7Ground transport infrastructure....................................................................32 4.5Tourism infrastructure ....................................................................................92 2.0ICT infrastructure ............................................................................................90 2.3Price competitiveness in the T&T industry.................................................28 5.2
T&T human, cultural, and natural resources ...............................................71 3.9Human resources ............................................................................................49 5.2
Education and training .............................................................................39 5.1Availability of qualified labor...................................................................80 5.4
Affinity for Travel & Tourism ..........................................................................65 4.8Natural resources ...........................................................................................59 3.4Cultural resources...........................................................................................75 2.0
Note: For descriptions of variables and detailed sources, please refer to “How to the Read Country/Economy Profiles.”
Rank Score(out of 133) (1–7 scale)
International tourist arrivals (thousands)
International tourism receipts (US$ millions)
1995 1996 1997 1998 1999 2000 2001 2002 2003 2004 2005 2006 2007100
200
300
400
500
600
1 2 3 4 5 6 7
2009–2018Percent annual growth of total (%, forecast)
part2A_profiles.r2 2/26/09 4:01 AM Page 338
The Travel & Tourism Competitiveness Report 2009 © 2009 World Economic Forum

339
2.1:
Cou
ntry
/Eco
nom
y Pr
ofile
s
The Travel & Tourism Competitiveness Index in detail ■ Competitive Advantage ■ Competitive Disadvantage
INDICATOR RANK/133
1st pillar: Policy rules and regulations1.01 Prevalence of foreign ownership .................................70 ...■1.02 Property rights..............................................................60 ...■1.03 Business impact of rules on FDI ..................................27 ...■1.04 Visa requirements* ......................................................90 ...■1.05 Openness of bilateral Air Service Agreements* ..........82 ...■1.06 Transparency of government policymaking..................88 ...■1.07 Time required to start a business*...............................97 ...■1.08 Cost to start a business* .............................................49 ...■
2nd pillar: Environmental sustainability2.01 Stringency of environmental regulation .......................51 ...■2.02 Enforcement of environmental regulation....................47 ...■2.03 Sustainability of T&T industry development.................44 ...■2.04 Carbon dioxide emissions* ..........................................23 ...■2.05 Particulate matter concentration* ..............................112 ...■2.06 Threatened species* ..................................................128 ...■2.07 Environmental treaty ratification*.................................52 ...■
3rd pillar: Safety and security3.01 Business costs of terrorism .......................................132 ...■3.02 Reliability of police services .........................................93 ...■3.03 Business costs of crime and violence..........................94 ...■3.04 Road traffic accidents*.................................................64 ...■
4th pillar: Health and hygiene4.01 Physician density*........................................................98 ...■4.02 Access to improved sanitation* ...................................66 ...■4.03 Access to improved drinking water*............................96 ...■4.04 Hospital beds*..............................................................64 ...■
5th pillar: Prioritization of Travel & Tourism5.01 Government prioritization of the T&T industry.............40 ...■5.02 T&T government expenditure* ....................................41 ...■5.03 Effectiveness of marketing and branding.....................56 ...■5.04 T&T fair attendance*....................................................41 ...■
6th pillar: Air transport infrastructure6.01 Quality of air transport infrastructure ...........................65 ...■6.02 Available seat kilometers, domestic*.........................100 ...■6.03 Available seat kilometers, international* ......................57 ...■6.04 Departures per 1,000 population*................................92 ...■6.05 Airport density* ..........................................................133 ...■6.06 Number of operating airlines*......................................78 ...■6.07 International air transport network ...............................49 ...■
7th pillar: Ground transport infrastructure7.01 Quality of roads ............................................................63 ...■7.02 Quality of railroad infrastructure...................................46 ...■7.03 Quality of port infrastructure ........................................44 ...■7.04 Quality of ground transport network ............................61 ...■7.05 Road density*...............................................................23 ...■
INDICATOR RANK/133
8th pillar: Tourism infrastructure8.01 Hotel rooms*..............................................................104 ...■8.02 Presence of major car rental companies*....................73 ...■8.03 ATMs accepting Visa cards* ........................................89 ...■
9th pillar: ICT infrastructure9.01 Extent of business Internet use...................................50 ...■9.02 Internet users* ...........................................................113 ...■9.03 Telephone lines*...........................................................81 ...■9.04 Broadband Internet subscribers* .................................92 ...■9.05 Mobile telephone subscribers*....................................93 ...■
10th pillar: Price competitiveness in the T&T industry10.01 Ticket taxes and airport charges*...............................118 ...■10.02 Purchasing power parity*.............................................16 ...■10.03 Extent and effect of taxation........................................59 ...■10.04 Fuel price levels* .........................................................26 ...■10.05 Hotel price index* ..........................................................5 ...■
11th pillar: Human resources11.01 Primary education enrollment* ....................................37 ...■11.02 Secondary education enrollment*................................66 ...■11.03 Quality of the educational system................................44 ...■11.04 Local availability of research and training services.......41 ...■11.05 Extent of staff training..................................................59 ...■11.06 Hiring and firing practices.............................................75 ...■11.07 Ease of hiring foreign labor ........................................102 ...■11.08 HIV prevalence* .............................................................1 ...■11.09 Business impact of HIV/AIDS.......................................39 ...■11.10 Life expectancy* ..........................................................66 ...■
12th pillar: Affinity for Travel & Tourism12.01 Tourism openness* ....................................................106 ...■12.02 Attitude of population toward foreign visitors..............60 ...■12.03 Extension of business trips recommended .................16 ...■
13th pillar: Natural resources13.01 Number of World Heritage natural sites* ....................40 ...■13.02 Protected areas* ..........................................................48 ...■13.03 Quality of the natural environment...............................60 ...■13.04 Total known species*...................................................60 ...■
14th pillar: Cultural resources14.01 Number of World Heritage cultural sites* ...................33 ...■14.02 Sports stadiums* .......................................................107 ...■14.03 Number of international fairs and exhibitions* ............68 ...■14.04 Creative industries exports*.........................................63 ...■
Sri Lanka
* Hard data
Note: For further details and explanation, please refer to the section “How toRead the Country/Economy Profiles” at the beginning of this chapter.
part2A_profiles.r2 2/26/09 4:01 AM Page 339
The Travel & Tourism Competitiveness Report 2009 © 2009 World Economic Forum

340
2.1:
Cou
ntry
/Eco
nom
y Pr
ofile
s
SurinameKey indicatorsPopulation (millions), 2007..............................................................................0.5Surface area (1,000 square kilometers) ......................................................163.3
Gross domestic product (US$ billions), 2007 .................................................2.4Gross domestic product (PPP, US$) per capita, 2007 .............................7,762.2Real GDP growth (percent), 2007...................................................................5.5
Environmental Performance Index, 2008 (out of 149 countries) ....................n/a
Travel & Tourism indicators
T&T industry, 2008 estimatesGDP (US$ millions) ..................................................................63...................2.9 ....................3.3Employment (1,000 jobs)...........................................................4...................2.8 ....................1.3
T&T economy, 2008 estimatesGDP (US$ millions) ................................................................157...................7.2 ....................4.0Employment (1,000 jobs).........................................................10...................6.6 ....................1.9
Source: World Travel & Tourism Council, TSA Research 2008
International tourist arrivals (thousands), 2007......................163International tourism receipts (US$ millions), 2007 ................67
Source: United Nations World Tourism Organization
Travel & Tourism Competitiveness Index
2009 Index......................................................................................................99 3.52008 Index............................................................................................................95 3.6T&T regulatory framework ............................................................................110 3.9
Policy rules and regulations........................................................................129 2.8Environmental sustainability..........................................................................77 4.3Safety and security .........................................................................................61 5.3Health and hygiene .........................................................................................82 4.2Prioritization of Travel & Tourism................................................................130 2.7
T&T business environment and infrastructure ............................................91 3.0Air transport infrastructure ..........................................................................91 2.6Ground transport infrastructure..................................................................120 2.3Tourism infrastructure ....................................................................................67 3.2ICT infrastructure ............................................................................................86 2.4Price competitiveness in the T&T industry.................................................80 4.5
T&T human, cultural, and natural resources ...............................................79 3.8Human resources ............................................................................................99 4.6
Education and training .............................................................................91 4.3Availability of qualified labor.................................................................115 4.8
Affinity for Travel & Tourism ........................................................................103 4.4Natural resources ...........................................................................................43 3.9Cultural resources...........................................................................................72 2.2
Note: For descriptions of variables and detailed sources, please refer to “How to the Read Country/Economy Profiles.”
Rank Score(out of 133) (1–7 scale)
International tourist arrivals (thousands)
International tourism receipts (US$ millions)
1995 1996 1997 1998 1999 2000 2001 2002 2003 2004 2005 2006 20070
50
100
150
200
1 2 3 4 5 6 7
2009–2018Percent annual growth of total (%, forecast)
part2A_profiles.r2 2/26/09 4:01 AM Page 340
The Travel & Tourism Competitiveness Report 2009 © 2009 World Economic Forum

341
2.1:
Cou
ntry
/Eco
nom
y Pr
ofile
s
The Travel & Tourism Competitiveness Index in detail ■ Competitive Advantage ■ Competitive Disadvantage
INDICATOR RANK/133
1st pillar: Policy rules and regulations1.01 Prevalence of foreign ownership ...............................108 ...■1.02 Property rights............................................................106 ...■1.03 Business impact of rules on FDI ................................126 ...■1.04 Visa requirements* ......................................................98 ...■1.05 Openness of bilateral Air Service Agreements* ..........24 ...■1.06 Transparency of government policymaking................123 ...■1.07 Time required to start a business*.............................129 ...■1.08 Cost to start a business* ...........................................120 ...■
2nd pillar: Environmental sustainability2.01 Stringency of environmental regulation .....................127 ...■2.02 Enforcement of environmental regulation..................124 ...■2.03 Sustainability of T&T industry development...............111 ...■2.04 Carbon dioxide emissions* ..........................................75 ...■2.05 Particulate matter concentration* ................................54 ...■2.06 Threatened species* ......................................................2 ...■2.07 Environmental treaty ratification*.................................94 ...■
3rd pillar: Safety and security3.01 Business costs of terrorism .........................................77 ...■3.02 Reliability of police services .........................................55 ...■3.03 Business costs of crime and violence........................100 ...■3.04 Road traffic accidents*.................................................11 ...■
4th pillar: Health and hygiene4.01 Physician density*......................................................102 ...■4.02 Access to improved sanitation* ...................................74 ...■4.03 Access to improved drinking water*............................74 ...■4.04 Hospital beds*..............................................................56 ...■
5th pillar: Prioritization of Travel & Tourism5.01 Government prioritization of the T&T industry...........119 ...■5.02 T&T government expenditure* ..................................105 ...■5.03 Effectiveness of marketing and branding...................112 ...■5.04 T&T fair attendance*..................................................126 ...■
6th pillar: Air transport infrastructure6.01 Quality of air transport infrastructure .........................124 ...■6.02 Available seat kilometers, domestic*.........................100 ...■6.03 Available seat kilometers, international* ....................105 ...■6.04 Departures per 1,000 population*................................34 ...■6.05 Airport density* ............................................................22 ...■6.06 Number of operating airlines*....................................126 ...■6.07 International air transport network .............................131 ...■
7th pillar: Ground transport infrastructure7.01 Quality of roads ............................................................84 ...■7.02 Quality of railroad infrastructure.................................105 ...■7.03 Quality of port infrastructure ......................................106 ...■7.04 Quality of ground transport network..........................124 ...■7.05 Road density*.............................................................127 ...■
INDICATOR RANK/133
8th pillar: Tourism infrastructure8.01 Hotel rooms*................................................................31 ...■8.02 Presence of major car rental companies*....................56 ...■8.03 ATMs accepting Visa cards* ......................................124 ...■
9th pillar: ICT infrastructure9.01 Extent of business Internet use.................................111 ...■9.02 Internet users* .............................................................95 ...■9.03 Telephone lines*...........................................................70 ...■9.04 Broadband Internet subscribers* .................................88 ...■9.05 Mobile telephone subscribers*....................................78 ...■
10th pillar: Price competitiveness in the T&T industry10.01 Ticket taxes and airport charges*...............................105 ...■10.02 Purchasing power parity*.............................................75 ...■10.03 Extent and effect of taxation......................................107 ...■10.04 Fuel price levels*.........................................................n/a ......10.05 Hotel price index* .......................................................n/a ......
11th pillar: Human resources11.01 Primary education enrollment* ....................................40 ...■11.02 Secondary education enrollment*................................86 ...■11.03 Quality of the educational system..............................101 ...■11.04 Local availability of research and training services.....123 ...■11.05 Extent of staff training................................................108 ...■11.06 Hiring and firing practices...........................................131 ...■11.07 Ease of hiring foreign labor ..........................................80 ...■11.08 HIV prevalence* .........................................................117 ...■11.09 Business impact of HIV/AIDS.....................................106 ...■11.10 Life expectancy* ..........................................................89 ...■
12th pillar: Affinity for Travel & Tourism12.01 Tourism openness* ......................................................88 ...■12.02 Attitude of population toward foreign visitors............102 ...■12.03 Extension of business trips recommended .................97 ...■
13th pillar: Natural resources13.01 Number of World Heritage natural sites* ....................40 ...■13.02 Protected areas* ..........................................................55 ...■13.03 Quality of the natural environment...............................43 ...■13.04 Total known species*...................................................32 ...■
14th pillar: Cultural resources14.01 Number of World Heritage cultural sites* ...................97 ...■14.02 Sports stadiums* .........................................................31 ...■14.03 Number of international fairs and exhibitions*............n/a ......14.04 Creative industries exports*.......................................118 ...■
Suriname
* Hard data
Note: For further details and explanation, please refer to the section “How toRead the Country/Economy Profiles” at the beginning of this chapter.
part2A_profiles.r2 2/26/09 4:01 AM Page 341
The Travel & Tourism Competitiveness Report 2009 © 2009 World Economic Forum

342
2.1:
Cou
ntry
/Eco
nom
y Pr
ofile
s
SwedenKey indicatorsPopulation (millions), 2007..............................................................................9.1Surface area (1,000 square kilometers) ......................................................450.3
Gross domestic product (US$ billions), 2007 .............................................454.8Gross domestic product (PPP, US$) per capita, 2007 ...........................36,577.7Real GDP growth (percent), 2007...................................................................2.7
Environmental Performance Index, 2008 (out of 149 countries).......................2
Travel & Tourism indicators
T&T industry, 2008 estimatesGDP (US$ millions) ...........................................................12,000...................2.4 ....................3.8Employment (1,000 jobs).......................................................110...................2.4 ....................1.8
T&T economy, 2008 estimatesGDP (US$ millions) ...........................................................35,496...................7.1 ....................3.5Employment (1,000 jobs).......................................................315...................6.9 ....................1.4
Source: World Travel & Tourism Council, TSA Research 2008
International tourist arrivals (thousands), 2007...................5,224International tourism receipts (US$ millions), 2007 .........12,002
Source: United Nations World Tourism Organization
Travel & Tourism Competitiveness Index
2009 Index........................................................................................................7 5.32008 Index..............................................................................................................8 5.3T&T regulatory framework ..............................................................................12 5.6
Policy rules and regulations............................................................................7 5.4Environmental sustainability............................................................................1 6.2Safety and security .........................................................................................13 6.2Health and hygiene .........................................................................................38 5.8Prioritization of Travel & Tourism..................................................................73 4.2
T&T business environment and infrastructure ............................................14 5.0Air transport infrastructure ............................................................................9 5.3Ground transport infrastructure....................................................................14 5.5Tourism infrastructure ....................................................................................26 4.9ICT infrastructure ..............................................................................................1 6.0Price competitiveness in the T&T industry...............................................127 3.4
T&T human, cultural, and natural resources .................................................8 5.2Human resources ..............................................................................................8 5.9
Education and training ...............................................................................6 6.0Availability of qualified labor...................................................................21 5.7
Affinity for Travel & Tourism ..........................................................................62 4.8Natural resources ...........................................................................................50 3.7Cultural resources.............................................................................................2 6.6
Note: For descriptions of variables and detailed sources, please refer to “How to the Read Country/Economy Profiles.”
Rank Score(out of 133) (1–7 scale)
International tourist arrivals (thousands)
International tourism receipts (US$ millions)
1995 1996 1997 1998 1999 2000 2001 2002 2003 2004 2005 2006 20070
3,000
6,000
9,000
12,000
15,000
1 2 3 4 5 6 7
2009–2018Percent annual growth of total (%, forecast)
part2A_profiles.r2 2/26/09 4:01 AM Page 342
The Travel & Tourism Competitiveness Report 2009 © 2009 World Economic Forum

343
2.1:
Cou
ntry
/Eco
nom
y Pr
ofile
s
The Travel & Tourism Competitiveness Index in detail ■ Competitive Advantage ■ Competitive Disadvantage
INDICATOR RANK/133
1st pillar: Policy rules and regulations1.01 Prevalence of foreign ownership ...................................6 ...■1.02 Property rights................................................................7 ...■1.03 Business impact of rules on FDI ....................................9 ...■1.04 Visa requirements* ......................................................40 ...■1.05 Openness of bilateral Air Service Agreements* ..........76 ...■1.06 Transparency of government policymaking....................3 ...■1.07 Time required to start a business*...............................41 ...■1.08 Cost to start a business* ...............................................6 ...■
2nd pillar: Environmental sustainability2.01 Stringency of environmental regulation .........................1 ...■2.02 Enforcement of environmental regulation......................2 ...■2.03 Sustainability of T&T industry development.................29 ...■2.04 Carbon dioxide emissions* ..........................................83 ...■2.05 Particulate matter concentration* ..................................2 ...■2.06 Threatened species* ......................................................3 ...■2.07 Environmental treaty ratification*...................................1 ...■
3rd pillar: Safety and security3.01 Business costs of terrorism .........................................40 ...■3.02 Reliability of police services .........................................12 ...■3.03 Business costs of crime and violence..........................26 ...■3.04 Road traffic accidents*.................................................41 ...■
4th pillar: Health and hygiene4.01 Physician density*........................................................27 ...■4.02 Access to improved sanitation* .....................................1 ...■4.03 Access to improved drinking water*..............................1 ...■4.04 Hospital beds*..............................................................57 ...■
5th pillar: Prioritization of Travel & Tourism5.01 Government prioritization of the T&T industry.............68 ...■5.02 T&T government expenditure* ....................................92 ...■5.03 Effectiveness of marketing and branding.....................51 ...■5.04 T&T fair attendance*....................................................62 ...■
6th pillar: Air transport infrastructure6.01 Quality of air transport infrastructure ...........................18 ...■6.02 Available seat kilometers, domestic*...........................30 ...■6.03 Available seat kilometers, international* ......................40 ...■6.04 Departures per 1,000 population*................................17 ...■6.05 Airport density* ..............................................................9 ...■6.06 Number of operating airlines*......................................22 ...■6.07 International air transport network ...............................22 ...■
7th pillar: Ground transport infrastructure7.01 Quality of roads ............................................................18 ...■7.02 Quality of railroad infrastructure...................................11 ...■7.03 Quality of port infrastructure ........................................13 ...■7.04 Quality of ground transport network ..............................8 ...■7.05 Road density*...............................................................34 ...■
INDICATOR RANK/133
8th pillar: Tourism infrastructure8.01 Hotel rooms*................................................................20 ...■8.02 Presence of major car rental companies*....................23 ...■8.03 ATMs accepting Visa cards* ........................................36 ...■
9th pillar: ICT infrastructure9.01 Extent of business Internet use.....................................2 ...■9.02 Internet users* ...............................................................5 ...■9.03 Telephone lines*.............................................................5 ...■9.04 Broadband Internet subscribers* ...................................3 ...■9.05 Mobile telephone subscribers*....................................25 ...■
10th pillar: Price competitiveness in the T&T industry10.01 Ticket taxes and airport charges*.................................26 ...■10.02 Purchasing power parity*...........................................126 ...■10.03 Extent and effect of taxation......................................125 ...■10.04 Fuel price levels* .......................................................124 ...■10.05 Hotel price index* ........................................................77 ...■
11th pillar: Human resources11.01 Primary education enrollment* ....................................52 ...■11.02 Secondary education enrollment*................................16 ...■11.03 Quality of the educational system................................12 ...■11.04 Local availability of research and training services.........7 ...■11.05 Extent of staff training....................................................4 ...■11.06 Hiring and firing practices...........................................101 ...■11.07 Ease of hiring foreign labor ..........................................53 ...■11.08 HIV prevalence* ...........................................................22 ...■11.09 Business impact of HIV/AIDS.........................................5 ...■11.10 Life expectancy* ............................................................5 ...■
12th pillar: Affinity for Travel & Tourism12.01 Tourism openness* ......................................................56 ...■12.02 Attitude of population toward foreign visitors................9 ...■12.03 Extension of business trips recommended ...............104 ...■
13th pillar: Natural resources13.01 Number of World Heritage natural sites* ....................23 ...■13.02 Protected areas* ..........................................................63 ...■13.03 Quality of the natural environment.................................2 ...■13.04 Total known species*.................................................105 ...■
14th pillar: Cultural resources14.01 Number of World Heritage cultural sites* ...................12 ...■14.02 Sports stadiums* .........................................................18 ...■14.03 Number of international fairs and exhibitions* ............15 ...■14.04 Creative industries exports*.........................................18 ...■
Sweden
* Hard data
Note: For further details and explanation, please refer to the section “How toRead the Country/Economy Profiles” at the beginning of this chapter.
part2A_profiles.r2 2/26/09 4:01 AM Page 343
The Travel & Tourism Competitiveness Report 2009 © 2009 World Economic Forum

344
2.1:
Cou
ntry
/Eco
nom
y Pr
ofile
s
SwitzerlandKey indicatorsPopulation (millions), 2007..............................................................................7.3Surface area (1,000 square kilometers) ........................................................41.3
Gross domestic product (US$ billions), 2007 .............................................427.1Gross domestic product (PPP, US$) per capita, 2007 ...........................41,264.7Real GDP growth (percent), 2007...................................................................3.3
Environmental Performance Index, 2008 (out of 149 countries).......................1
Travel & Tourism indicators
T&T industry, 2008 estimatesGDP (US$ millions) ...........................................................24,652...................5.3 ....................1.8Employment (1,000 jobs).......................................................316...................7.1 ....................1.2
T&T economy, 2008 estimatesGDP (US$ millions) ...........................................................58,120.................12.6 ....................1.7Employment (1,000 jobs).......................................................712.................16.0 ....................1.0
Source: World Travel & Tourism Council, TSA Research 2008
International tourist arrivals (thousands), 2007...................8,448International tourism receipts (US$ millions), 2007 .........12,182
Source: United Nations World Tourism Organization
Travel & Tourism Competitiveness Index
2009 Index........................................................................................................1 5.72008 Index..............................................................................................................1 5.6T&T regulatory framework ................................................................................1 6.0
Policy rules and regulations..........................................................................18 5.3Environmental sustainability............................................................................2 5.9Safety and security ...........................................................................................8 6.4Health and hygiene .........................................................................................13 6.6Prioritization of Travel & Tourism....................................................................7 5.9
T&T business environment and infrastructure ..............................................1 5.5Air transport infrastructure ..........................................................................17 4.9Ground transport infrastructure......................................................................1 6.6Tourism infrastructure ......................................................................................7 6.6ICT infrastructure ..............................................................................................3 5.8Price competitiveness in the T&T industry...............................................123 3.6
T&T human, cultural, and natural resources .................................................2 5.5Human resources ..............................................................................................4 6.1
Education and training ...............................................................................8 6.0Availability of qualified labor.....................................................................3 6.3
Affinity for Travel & Tourism ..........................................................................34 5.1Natural resources ...........................................................................................15 4.9Cultural resources.............................................................................................6 6.0
Note: For descriptions of variables and detailed sources, please refer to “How to the Read Country/Economy Profiles.”
Rank Score(out of 133) (1–7 scale)
International tourist arrivals (thousands)
International tourism receipts (US$ millions)
1995 1996 1997 1998 1999 2000 2001 2002 2003 2004 2005 2006 20076,000
9,000
12,000
15,000
1 2 3 4 5 6 7
2009–2018Percent annual growth of total (%, forecast)
part2A_profiles.r2 2/26/09 4:01 AM Page 344
The Travel & Tourism Competitiveness Report 2009 © 2009 World Economic Forum

345
2.1:
Cou
ntry
/Eco
nom
y Pr
ofile
s
The Travel & Tourism Competitiveness Index in detail ■ Competitive Advantage ■ Competitive Disadvantage
INDICATOR RANK/133
1st pillar: Policy rules and regulations1.01 Prevalence of foreign ownership .................................32 ...■1.02 Property rights................................................................1 ...■1.03 Business impact of rules on FDI ..................................23 ...■1.04 Visa requirements* ......................................................39 ...■1.05 Openness of bilateral Air Service Agreements* ..........64 ...■1.06 Transparency of government policymaking....................7 ...■1.07 Time required to start a business*...............................61 ...■1.08 Cost to start a business* .............................................20 ...■
2nd pillar: Environmental sustainability2.01 Stringency of environmental regulation .........................8 ...■2.02 Enforcement of environmental regulation......................4 ...■2.03 Sustainability of T&T industry development.................15 ...■2.04 Carbon dioxide emissions* ..........................................79 ...■2.05 Particulate matter concentration* ................................39 ...■2.06 Threatened species* ......................................................6 ...■2.07 Environmental treaty ratification*.................................21 ...■
3rd pillar: Safety and security3.01 Business costs of terrorism .........................................37 ...■3.02 Reliability of police services ...........................................3 ...■3.03 Business costs of crime and violence..........................17 ...■3.04 Road traffic accidents*.................................................32 ...■
4th pillar: Health and hygiene4.01 Physician density*..........................................................5 ...■4.02 Access to improved sanitation* .....................................1 ...■4.03 Access to improved drinking water*..............................1 ...■4.04 Hospital beds*..............................................................27 ...■
5th pillar: Prioritization of Travel & Tourism5.01 Government prioritization of the T&T industry.............36 ...■5.02 T&T government expenditure* ....................................18 ...■5.03 Effectiveness of marketing and branding.....................15 ...■5.04 T&T fair attendance*....................................................14 ...■
6th pillar: Air transport infrastructure6.01 Quality of air transport infrastructure .............................6 ...■6.02 Available seat kilometers, domestic*...........................56 ...■6.03 Available seat kilometers, international* ......................22 ...■6.04 Departures per 1,000 population*................................23 ...■6.05 Airport density* ............................................................56 ...■6.06 Number of operating airlines*........................................9 ...■6.07 International air transport network .................................9 ...■
7th pillar: Ground transport infrastructure7.01 Quality of roads ..............................................................2 ...■7.02 Quality of railroad infrastructure.....................................1 ...■7.03 Quality of port infrastructure ........................................17 ...■7.04 Quality of ground transport network ..............................1 ...■7.05 Road density*...............................................................13 ...■
INDICATOR RANK/133
8th pillar: Tourism infrastructure8.01 Hotel rooms*................................................................10 ...■8.02 Presence of major car rental companies*....................23 ...■8.03 ATMs accepting Visa cards* ..........................................5 ...■
9th pillar: ICT infrastructure9.01 Extent of business Internet use.....................................7 ...■9.02 Internet users* .............................................................17 ...■9.03 Telephone lines*.............................................................1 ...■9.04 Broadband Internet subscribers* ...................................5 ...■9.05 Mobile telephone subscribers*....................................33 ...■
10th pillar: Price competitiveness in the T&T industry10.01 Ticket taxes and airport charges*.................................94 ...■10.02 Purchasing power parity*...........................................129 ...■10.03 Extent and effect of taxation........................................15 ...■10.04 Fuel price levels* .......................................................120 ...■10.05 Hotel price index* ......................................................100 ...■
11th pillar: Human resources11.01 Primary education enrollment* ....................................92 ...■11.02 Secondary education enrollment*................................52 ...■11.03 Quality of the educational system..................................3 ...■11.04 Local availability of research and training services.........2 ...■11.05 Extent of staff training....................................................2 ...■11.06 Hiring and firing practices...............................................3 ...■11.07 Ease of hiring foreign labor ..........................................19 ...■11.08 HIV prevalence* ...........................................................85 ...■11.09 Business impact of HIV/AIDS.......................................20 ...■11.10 Life expectancy* ............................................................2 ...■
12th pillar: Affinity for Travel & Tourism12.01 Tourism openness* ......................................................63 ...■12.02 Attitude of population toward foreign visitors..............33 ...■12.03 Extension of business trips recommended ...................4 ...■
13th pillar: Natural resources13.01 Number of World Heritage natural sites* ....................16 ...■13.02 Protected areas* ..........................................................16 ...■13.03 Quality of the natural environment.................................9 ...■13.04 Total known species*...................................................98 ...■
14th pillar: Cultural resources14.01 Number of World Heritage cultural sites* ...................33 ...■14.02 Sports stadiums* .........................................................16 ...■14.03 Number of international fairs and exhibitions* ............14 ...■14.04 Creative industries exports*...........................................9 ...■
Switzerland
* Hard data
Note: For further details and explanation, please refer to the section “How toRead the Country/Economy Profiles” at the beginning of this chapter.
part2A_profiles.r2 2/26/09 4:01 AM Page 345
The Travel & Tourism Competitiveness Report 2009 © 2009 World Economic Forum

346
2.1:
Cou
ntry
/Eco
nom
y Pr
ofile
s
SyriaKey indicatorsPopulation (millions), 2007............................................................................20.0Surface area (1,000 square kilometers) ......................................................185.2
Gross domestic product (US$ billions), 2007 ...............................................39.0Gross domestic product (PPP, US$) per capita, 2007 .............................4,491.8Real GDP growth (percent), 2007...................................................................3.9
Environmental Performance Index, 2008 (out of 149 countries).....................99
Travel & Tourism indicators
T&T industry, 2008 estimatesGDP (US$ millions) .............................................................2,044...................6.1 ....................5.7Employment (1,000 jobs).......................................................512...................6.9 ....................6.4
T&T economy, 2008 estimatesGDP (US$ millions) .............................................................4,885.................14.5 ....................4.7Employment (1,000 jobs)....................................................1,130.................15.2 ....................5.6
Source: World Travel & Tourism Council, TSA Research 2008
International tourist arrivals (thousands), 2007...................4,566International tourism receipts (US$ millions), 2006 ...........2,025
Source: United Nations World Tourism Organization
Travel & Tourism Competitiveness Index
2009 Index......................................................................................................85 3.72008 Index............................................................................................................94 3.6T&T regulatory framework ..............................................................................68 4.5
Policy rules and regulations..........................................................................93 4.0Environmental sustainability........................................................................111 4.0Safety and security .........................................................................................23 6.0Health and hygiene .........................................................................................89 4.0Prioritization of Travel & Tourism..................................................................58 4.5
T&T business environment and infrastructure ............................................82 3.2Air transport infrastructure ..........................................................................98 2.5Ground transport infrastructure....................................................................63 3.6Tourism infrastructure ....................................................................................97 1.9ICT infrastructure ............................................................................................94 2.2Price competitiveness in the T&T industry...................................................5 5.8
T&T human, cultural, and natural resources .............................................100 3.5Human resources ............................................................................................93 4.8
Education and training .............................................................................89 4.3Availability of qualified labor...................................................................90 5.3
Affinity for Travel & Tourism ..........................................................................32 5.2Natural resources .........................................................................................128 2.1Cultural resources...........................................................................................78 2.0
Note: For descriptions of variables and detailed sources, please refer to “How to the Read Country/Economy Profiles.”
Rank Score(out of 133) (1–7 scale)
International tourist arrivals (thousands)
International tourism receipts (US$ millions)
1995 1996 1997 1998 1999 2000 2001 2002 2003 2004 2005 2006 20070
1,000
2,000
3,000
4,000
5,000
1 2 3 4 5 6 7
2009–2018Percent annual growth of total (%, forecast)
part2A_profiles.r2 2/26/09 4:01 AM Page 346
The Travel & Tourism Competitiveness Report 2009 © 2009 World Economic Forum

347
2.1:
Cou
ntry
/Eco
nom
y Pr
ofile
s
The Travel & Tourism Competitiveness Index in detail ■ Competitive Advantage ■ Competitive Disadvantage
INDICATOR RANK/133
1st pillar: Policy rules and regulations1.01 Prevalence of foreign ownership ...............................127 ...■1.02 Property rights..............................................................30 ...■1.03 Business impact of rules on FDI ................................108 ...■1.04 Visa requirements* ....................................................132 ...■1.05 Openness of bilateral Air Service Agreements* ..........86 ...■1.06 Transparency of government policymaking................106 ...■1.07 Time required to start a business*...............................50 ...■1.08 Cost to start a business* .............................................79 ...■
2nd pillar: Environmental sustainability2.01 Stringency of environmental regulation .......................80 ...■2.02 Enforcement of environmental regulation....................81 ...■2.03 Sustainability of T&T industry development.................87 ...■2.04 Carbon dioxide emissions* ..........................................64 ...■2.05 Particulate matter concentration* ..............................109 ...■2.06 Threatened species* ..................................................101 ...■2.07 Environmental treaty ratification*.................................81 ...■
3rd pillar: Safety and security3.01 Business costs of terrorism .........................................10 ...■3.02 Reliability of police services .........................................69 ...■3.03 Business costs of crime and violence............................1 ...■3.04 Road traffic accidents*.................................................74 ...■
4th pillar: Health and hygiene4.01 Physician density*........................................................99 ...■4.02 Access to improved sanitation* ...................................55 ...■4.03 Access to improved drinking water*............................81 ...■4.04 Hospital beds*..............................................................93 ...■
5th pillar: Prioritization of Travel & Tourism5.01 Government prioritization of the T&T industry.............56 ...■5.02 T&T government expenditure* ....................................69 ...■5.03 Effectiveness of marketing and branding.....................86 ...■5.04 T&T fair attendance*....................................................25 ...■
6th pillar: Air transport infrastructure6.01 Quality of air transport infrastructure ...........................90 ...■6.02 Available seat kilometers, domestic*...........................64 ...■6.03 Available seat kilometers, international* ......................76 ...■6.04 Departures per 1,000 population*................................95 ...■6.05 Airport density* ..........................................................113 ...■6.06 Number of operating airlines*......................................51 ...■6.07 International air transport network .............................100 ...■
7th pillar: Ground transport infrastructure7.01 Quality of roads ............................................................65 ...■7.02 Quality of railroad infrastructure...................................49 ...■7.03 Quality of port infrastructure ........................................97 ...■7.04 Quality of ground transport network ............................28 ...■7.05 Road density*...............................................................50 ...■
INDICATOR RANK/133
8th pillar: Tourism infrastructure8.01 Hotel rooms*..............................................................100 ...■8.02 Presence of major car rental companies*....................73 ...■8.03 ATMs accepting Visa cards* ......................................110 ...■
9th pillar: ICT infrastructure9.01 Extent of business Internet use.................................123 ...■9.02 Internet users* .............................................................75 ...■9.03 Telephone lines*...........................................................71 ...■9.04 Broadband Internet subscribers* ...............................110 ...■9.05 Mobile telephone subscribers*..................................105 ...■
10th pillar: Price competitiveness in the T&T industry10.01 Ticket taxes and airport charges*.................................45 ...■10.02 Purchasing power parity*.............................................21 ...■10.03 Extent and effect of taxation........................................29 ...■10.04 Fuel price levels* ...........................................................4 ...■10.05 Hotel price index* ........................................................17 ...■
11th pillar: Human resources11.01 Primary education enrollment* ....................................56 ...■11.02 Secondary education enrollment*................................94 ...■11.03 Quality of the educational system................................91 ...■11.04 Local availability of research and training services.......95 ...■11.05 Extent of staff training................................................112 ...■11.06 Hiring and firing practices...........................................105 ...■11.07 Ease of hiring foreign labor ........................................112 ...■11.08 HIV prevalence* .............................................................1 ...■11.09 Business impact of HIV/AIDS.........................................4 ...■11.10 Life expectancy* ..........................................................66 ...■
12th pillar: Affinity for Travel & Tourism12.01 Tourism openness* ......................................................39 ...■12.02 Attitude of population toward foreign visitors..............29 ...■12.03 Extension of business trips recommended .................18 ...■
13th pillar: Natural resources13.01 Number of World Heritage natural sites* ....................74 ...■13.02 Protected areas* ........................................................126 ...■13.03 Quality of the natural environment...............................83 ...■13.04 Total known species*.................................................102 ...■
14th pillar: Cultural resources14.01 Number of World Heritage cultural sites* ...................45 ...■14.02 Sports stadiums* .......................................................102 ...■14.03 Number of international fairs and exhibitions* ..........101 ...■14.04 Creative industries exports*........................................n/a ......
Syria
* Hard data
Note: For further details and explanation, please refer to the section “How toRead the Country/Economy Profiles” at the beginning of this chapter.
part2A_profiles.r2 2/26/09 4:01 AM Page 347
The Travel & Tourism Competitiveness Report 2009 © 2009 World Economic Forum

348
2.1:
Cou
ntry
/Eco
nom
y Pr
ofile
s
Taiwan, ChinaKey indicatorsPopulation (millions), 2007............................................................................22.7Surface area (1,000 square kilometers) ..........................................................0.0
Gross domestic product (US$ billions), 2007 .............................................383.3Gross domestic product (PPP, US$) per capita, 2007 ...........................30,321.7Real GDP growth (percent), 2007...................................................................5.7
Environmental Performance Index, 2008 (out of 149 countries).....................40
Travel & Tourism indicators
T&T industry, 2008 estimatesGDP (US$ millions) .............................................................4,776...................1.1 ....................1.5Employment (1,000 jobs).......................................................165...................1.6 ..................–1.1
T&T economy, 2008 estimatesGDP (US$ millions) ...........................................................19,727...................4.7 ....................3.0Employment (1,000 jobs).......................................................547...................5.2 ....................0.0
Source: World Travel & Tourism Council, TSA Research 2008
International tourist arrivals (thousands), 2007...................3,716International tourism receipts (US$ millions), 2007 ...........5,137
Source: United Nations World Tourism Organization
Travel & Tourism Competitiveness Index
2009 Index......................................................................................................43 4.42008 Index............................................................................................................52 4.2T&T regulatory framework ..............................................................................75 4.4
Policy rules and regulations..........................................................................42 4.8Environmental sustainability..........................................................................92 4.2Safety and security .........................................................................................51 5.5Health and hygiene .......................................................................................101 3.3Prioritization of Travel & Tourism..................................................................74 4.2
T&T business environment and infrastructure ............................................18 4.9Air transport infrastructure ..........................................................................45 3.8Ground transport infrastructure....................................................................11 5.7Tourism infrastructure ....................................................................................35 4.4ICT infrastructure ............................................................................................12 5.3Price competitiveness in the T&T industry.................................................34 5.1
T&T human, cultural, and natural resources ...............................................65 3.9Human resources ............................................................................................16 5.7
Education and training .............................................................................19 5.7Availability of qualified labor...................................................................23 5.7
Affinity for Travel & Tourism ..........................................................................77 4.6Natural resources .........................................................................................110 2.4Cultural resources...........................................................................................47 2.9
Note: For descriptions of variables and detailed sources, please refer to “How to the Read Country/Economy Profiles.”
Rank Score(out of 133) (1–7 scale)
International tourist arrivals (thousands)
International tourism receipts (US$ millions)
1995 1996 1997 1998 1999 2000 2001 2002 2003 2004 2005 2006 20072,000
3,000
4,000
5,000
6,000
1 2 3 4 5 6 7
2009–2018Percent annual growth of total (%, forecast)
part2A_profiles.r2 2/26/09 4:01 AM Page 348
The Travel & Tourism Competitiveness Report 2009 © 2009 World Economic Forum

349
2.1:
Cou
ntry
/Eco
nom
y Pr
ofile
s
The Travel & Tourism Competitiveness Index in detail ■ Competitive Advantage ■ Competitive Disadvantage
INDICATOR RANK/133
1st pillar: Policy rules and regulations1.01 Prevalence of foreign ownership .................................62 ...■1.02 Property rights..............................................................34 ...■1.03 Business impact of rules on FDI ..................................64 ...■1.04 Visa requirements* ......................................................93 ...■1.05 Openness of bilateral Air Service Agreements* .........n/a ......1.06 Transparency of government policymaking..................23 ...■1.07 Time required to start a business*.............................105 ...■1.08 Cost to start a business* .............................................36 ...■
2nd pillar: Environmental sustainability2.01 Stringency of environmental regulation .......................29 ...■2.02 Enforcement of environmental regulation....................31 ...■2.03 Sustainability of T&T industry development.................62 ...■2.04 Carbon dioxide emissions* .........................................n/a ......2.05 Particulate matter concentration* ..............................104 ...■2.06 Threatened species* ..................................................107 ...■2.07 Environmental treaty ratification*................................n/a ......
3rd pillar: Safety and security3.01 Business costs of terrorism .........................................60 ...■3.02 Reliability of police services .........................................40 ...■3.03 Business costs of crime and violence..........................35 ...■3.04 Road traffic accidents*................................................n/a ......
4th pillar: Health and hygiene4.01 Physician density*........................................................66 ...■4.02 Access to improved sanitation* ..................................n/a ......4.03 Access to improved drinking water*...........................n/a ......4.04 Hospital beds*.............................................................n/a ......
5th pillar: Prioritization of Travel & Tourism5.01 Government prioritization of the T&T industry.............64 ...■5.02 T&T government expenditure* ..................................106 ...■5.03 Effectiveness of marketing and branding.....................76 ...■5.04 T&T fair attendance*....................................................41 ...■
6th pillar: Air transport infrastructure6.01 Quality of air transport infrastructure ...........................32 ...■6.02 Available seat kilometers, domestic*...........................39 ...■6.03 Available seat kilometers, international* ......................21 ...■6.04 Departures per 1,000 population*...............................n/a ......6.05 Airport density* ............................................................57 ...■6.06 Number of operating airlines*......................................57 ...■6.07 International air transport network ...............................50 ...■
7th pillar: Ground transport infrastructure7.01 Quality of roads ............................................................20 ...■7.02 Quality of railroad infrastructure.....................................9 ...■7.03 Quality of port infrastructure ........................................18 ...■7.04 Quality of ground transport network ............................11 ...■7.05 Road density*..............................................................n/a ......
INDICATOR RANK/133
8th pillar: Tourism infrastructure8.01 Hotel rooms*................................................................50 ...■8.02 Presence of major car rental companies*....................73 ...■8.03 ATMs accepting Visa cards* ........................................12 ...■
9th pillar: ICT infrastructure9.01 Extent of business Internet use...................................12 ...■9.02 Internet users* .............................................................15 ...■9.03 Telephone lines*.............................................................3 ...■9.04 Broadband Internet subscribers* .................................21 ...■9.05 Mobile telephone subscribers*....................................36 ...■
10th pillar: Price competitiveness in the T&T industry10.01 Ticket taxes and airport charges*.................................14 ...■10.02 Purchasing power parity*.............................................63 ...■10.03 Extent and effect of taxation........................................26 ...■10.04 Fuel price levels* .........................................................46 ...■10.05 Hotel price index* ........................................................80 ...■
11th pillar: Human resources11.01 Primary education enrollment* ......................................9 ...■11.02 Secondary education enrollment*................................31 ...■11.03 Quality of the educational system................................25 ...■11.04 Local availability of research and training services.......19 ...■11.05 Extent of staff training..................................................16 ...■11.06 Hiring and firing practices.............................................25 ...■11.07 Ease of hiring foreign labor ........................................104 ...■11.08 HIV prevalence* ...........................................................48 ...■11.09 Business impact of HIV/AIDS.......................................47 ...■11.10 Life expectancy* ..........................................................36 ...■
12th pillar: Affinity for Travel & Tourism12.01 Tourism openness* ......................................................87 ...■12.02 Attitude of population toward foreign visitors..............62 ...■12.03 Extension of business trips recommended .................76 ...■
13th pillar: Natural resources13.01 Number of World Heritage natural sites* ....................74 ...■13.02 Protected areas* ..........................................................88 ...■13.03 Quality of the natural environment...............................96 ...■13.04 Total known species*...................................................66 ...■
14th pillar: Cultural resources14.01 Number of World Heritage cultural sites* .................116 ...■14.02 Sports stadiums* .........................................................69 ...■14.03 Number of international fairs and exhibitions* ............34 ...■14.04 Creative industries exports*.........................................30 ...■
Taiwan, China
* Hard data
Note: For further details and explanation, please refer to the section “How toRead the Country/Economy Profiles” at the beginning of this chapter.
part2A_profiles.r2 2/26/09 4:01 AM Page 349
The Travel & Tourism Competitiveness Report 2009 © 2009 World Economic Forum

350
2.1:
Cou
ntry
/Eco
nom
y Pr
ofile
s
TajikistanKey indicatorsPopulation (millions), 2007..............................................................................6.7Surface area (1,000 square kilometers) ......................................................142.6
Gross domestic product (US$ billions), 2007 .................................................3.7Gross domestic product (PPP, US$) per capita, 2007 .............................1,842.7Real GDP growth (percent), 2007...................................................................7.8
Environmental Performance Index, 2008 (out of 149 countries).....................79
Travel & Tourism indicators
T&T industry, 2008 estimatesGDP (US$ millions) .................................................................n/a ...................n/a ....................n/aEmployment (1,000 jobs)........................................................n/a ...................n/a ....................n/a
T&T economy, 2008 estimatesGDP (US$ millions) .................................................................n/a ...................n/a ....................n/aEmployment (1,000 jobs)........................................................n/a ...................n/a ....................n/a
Source: World Travel & Tourism Council, TSA Research 2008
International tourist arrivals (thousands), 2001..........................4International tourism receipts (US$ millions), 2007 ..................3
Source: United Nations World Tourism Organization
Travel & Tourism Competitiveness Index
2009 Index....................................................................................................109 3.42008 Index..........................................................................................................114 3.2T&T regulatory framework ..............................................................................84 4.3
Policy rules and regulations........................................................................109 3.7Environmental sustainability..........................................................................97 4.2Safety and security .........................................................................................54 5.3Health and hygiene .........................................................................................61 4.8Prioritization of Travel & Tourism................................................................112 3.5
T&T business environment and infrastructure ..........................................117 2.6Air transport infrastructure ........................................................................117 2.2Ground transport infrastructure..................................................................102 2.7Tourism infrastructure ..................................................................................120 1.5ICT infrastructure ..........................................................................................121 1.6Price competitiveness in the T&T industry.................................................49 4.9
T&T human, cultural, and natural resources .............................................117 3.4Human resources ............................................................................................86 4.9
Education and training .............................................................................86 4.3Availability of qualified labor...................................................................70 5.4
Affinity for Travel & Tourism ........................................................................113 4.3Natural resources ...........................................................................................78 3.0Cultural resources.........................................................................................125 1.3
Note: For descriptions of variables and detailed sources, please refer to “How to the Read Country/Economy Profiles.”
Rank Score(out of 133) (1–7 scale)
International tourist arrivals (thousands)
International tourism receipts (US$ millions)
1995 1996 1997 1998 1999 2000 2001 2002 2003 2004 2005 2006 20071.0
1.5
2.0
2.5
3.0
3.5
4.0
1 2 3 4 5 6 7
2009–2018Percent annual growth of total (%, forecast)
part2A_profiles.r2 2/26/09 4:01 AM Page 350
The Travel & Tourism Competitiveness Report 2009 © 2009 World Economic Forum

351
2.1:
Cou
ntry
/Eco
nom
y Pr
ofile
s
The Travel & Tourism Competitiveness Index in detail ■ Competitive Advantage ■ Competitive Disadvantage
INDICATOR RANK/133
1st pillar: Policy rules and regulations1.01 Prevalence of foreign ownership ...............................112 ...■1.02 Property rights..............................................................88 ...■1.03 Business impact of rules on FDI ................................110 ...■1.04 Visa requirements* ....................................................117 ...■1.05 Openness of bilateral Air Service Agreements* .........n/a ......1.06 Transparency of government policymaking................102 ...■1.07 Time required to start a business*.............................110 ...■1.08 Cost to start a business* .............................................92 ...■
2nd pillar: Environmental sustainability2.01 Stringency of environmental regulation .....................101 ...■2.02 Enforcement of environmental regulation....................65 ...■2.03 Sustainability of T&T industry development.................72 ...■2.04 Carbon dioxide emissions* ..........................................26 ...■2.05 Particulate matter concentration* ................................87 ...■2.06 Threatened species* ....................................................61 ...■2.07 Environmental treaty ratification*...............................129 ...■
3rd pillar: Safety and security3.01 Business costs of terrorism .........................................88 ...■3.02 Reliability of police services .........................................75 ...■3.03 Business costs of crime and violence..........................60 ...■3.04 Road traffic accidents*.................................................20 ...■
4th pillar: Health and hygiene4.01 Physician density*........................................................53 ...■4.02 Access to improved sanitation* ...................................55 ...■4.03 Access to improved drinking water*..........................114 ...■4.04 Hospital beds*..............................................................24 ...■
5th pillar: Prioritization of Travel & Tourism5.01 Government prioritization of the T&T industry.............88 ...■5.02 T&T government expenditure* ...................................n/a ......5.03 Effectiveness of marketing and branding...................100 ...■5.04 T&T fair attendance*..................................................126 ...■
6th pillar: Air transport infrastructure6.01 Quality of air transport infrastructure .........................112 ...■6.02 Available seat kilometers, domestic*.........................100 ...■6.03 Available seat kilometers, international* ....................100 ...■6.04 Departures per 1,000 population*..............................107 ...■6.05 Airport density* ............................................................88 ...■6.06 Number of operating airlines*......................................86 ...■6.07 International air transport network .............................113 ...■
7th pillar: Ground transport infrastructure7.01 Quality of roads ..........................................................103 ...■7.02 Quality of railroad infrastructure...................................42 ...■7.03 Quality of port infrastructure ......................................132 ...■7.04 Quality of ground transport network ............................68 ...■7.05 Road density*...............................................................81 ...■
INDICATOR RANK/133
8th pillar: Tourism infrastructure8.01 Hotel rooms*..............................................................124 ...■8.02 Presence of major car rental companies*....................95 ...■8.03 ATMs accepting Visa cards* ......................................104 ...■
9th pillar: ICT infrastructure9.01 Extent of business Internet use...................................93 ...■9.02 Internet users* ...........................................................133 ...■9.03 Telephone lines*.........................................................106 ...■9.04 Broadband Internet subscribers* ...............................124 ...■9.05 Mobile telephone subscribers*..................................131 ...■
10th pillar: Price competitiveness in the T&T industry10.01 Ticket taxes and airport charges*...............................109 ...■10.02 Purchasing power parity*...............................................2 ...■10.03 Extent and effect of taxation......................................100 ...■10.04 Fuel price levels* .........................................................49 ...■10.05 Hotel price index* .......................................................n/a ......
11th pillar: Human resources11.01 Primary education enrollment* ....................................29 ...■11.02 Secondary education enrollment*................................81 ...■11.03 Quality of the educational system................................96 ...■11.04 Local availability of research and training services.....132 ...■11.05 Extent of staff training................................................105 ...■11.06 Hiring and firing practices.............................................13 ...■11.07 Ease of hiring foreign labor ..........................................54 ...■11.08 HIV prevalence* ...........................................................67 ...■11.09 Business impact of HIV/AIDS.......................................84 ...■11.10 Life expectancy* ........................................................100 ...■
12th pillar: Affinity for Travel & Tourism12.01 Tourism openness* ....................................................133 ...■12.02 Attitude of population toward foreign visitors..............87 ...■12.03 Extension of business trips recommended .................54 ...■
13th pillar: Natural resources13.01 Number of World Heritage natural sites* ....................74 ...■13.02 Protected areas* ..........................................................54 ...■13.03 Quality of the natural environment...............................37 ...■13.04 Total known species*...................................................97 ...■
14th pillar: Cultural resources14.01 Number of World Heritage cultural sites* ...................97 ...■14.02 Sports stadiums* .......................................................130 ...■14.03 Number of international fairs and exhibitions*............n/a ......14.04 Creative industries exports*........................................n/a ......
Tajikistan
* Hard data
Note: For further details and explanation, please refer to the section “How toRead the Country/Economy Profiles” at the beginning of this chapter.
part2A_profiles.r2 2/26/09 4:01 AM Page 351
The Travel & Tourism Competitiveness Report 2009 © 2009 World Economic Forum

352
2.1:
Cou
ntry
/Eco
nom
y Pr
ofile
s
TanzaniaKey indicatorsPopulation (millions), 2007............................................................................39.7Surface area (1,000 square kilometers) ......................................................947.3
Gross domestic product (US$ billions), 2007 ...............................................16.7Gross domestic product (PPP, US$) per capita, 2007 .............................1,255.6Real GDP growth (percent), 2007...................................................................7.1
Environmental Performance Index, 2008 (out of 149 countries)...................113
Travel & Tourism indicators
T&T industry, 2008 estimatesGDP (US$ millions) ................................................................680...................4.2 ....................3.6Employment (1,000 jobs).......................................................308...................3.3 ....................1.2
T&T economy, 2008 estimatesGDP (US$ millions) .............................................................1,552...................9.7 ....................3.9Employment (1,000 jobs).......................................................719...................7.7 ....................1.4
Source: World Travel & Tourism Council, TSA Research 2008
International tourist arrivals (thousands), 2007......................692International tourism receipts (US$ millions), 2007 ...........1,037
Source: United Nations World Tourism Organization
Travel & Tourism Competitiveness Index
2009 Index......................................................................................................98 3.62008 Index............................................................................................................88 3.7T&T regulatory framework ............................................................................102 4.0
Policy rules and regulations..........................................................................89 4.0Environmental sustainability..........................................................................32 5.0Safety and security .........................................................................................98 4.6Health and hygiene .......................................................................................127 1.5Prioritization of Travel & Tourism..................................................................33 5.1
T&T business environment and infrastructure ..........................................118 2.6Air transport infrastructure ........................................................................113 2.2Ground transport infrastructure..................................................................116 2.5Tourism infrastructure ..................................................................................118 1.5ICT infrastructure ..........................................................................................120 1.6Price competitiveness in the T&T industry.................................................43 5.0
T&T human, cultural, and natural resources ...............................................50 4.2Human resources ..........................................................................................122 3.9
Education and training ...........................................................................115 3.5Availability of qualified labor.................................................................125 4.3
Affinity for Travel & Tourism ..........................................................................33 5.2Natural resources .............................................................................................3 6.1Cultural resources.........................................................................................108 1.5
Note: For descriptions of variables and detailed sources, please refer to “How to the Read Country/Economy Profiles.”
Rank Score(out of 133) (1–7 scale)
International tourist arrivals (thousands)
International tourism receipts (US$ millions)
1995 1996 1997 1998 1999 2000 2001 2002 2003 2004 2005 2006 2007200
400
600
800
1,000
1,200
1 2 3 4 5 6 7
2009–2018Percent annual growth of total (%, forecast)
part2A_profiles.r2 2/26/09 4:01 AM Page 352
The Travel & Tourism Competitiveness Report 2009 © 2009 World Economic Forum

353
2.1:
Cou
ntry
/Eco
nom
y Pr
ofile
s
The Travel & Tourism Competitiveness Index in detail ■ Competitive Advantage ■ Competitive Disadvantage
INDICATOR RANK/133
1st pillar: Policy rules and regulations1.01 Prevalence of foreign ownership .................................68 ...■1.02 Property rights............................................................100 ...■1.03 Business impact of rules on FDI ..................................41 ...■1.04 Visa requirements* ......................................................80 ...■1.05 Openness of bilateral Air Service Agreements* ........109 ...■1.06 Transparency of government policymaking..................74 ...■1.07 Time required to start a business*...............................81 ...■1.08 Cost to start a business* ...........................................102 ...■
2nd pillar: Environmental sustainability2.01 Stringency of environmental regulation .......................69 ...■2.02 Enforcement of environmental regulation....................62 ...■2.03 Sustainability of T&T industry development.................47 ...■2.04 Carbon dioxide emissions* ..........................................11 ...■2.05 Particulate matter concentration* ................................37 ...■2.06 Threatened species* ..................................................104 ...■2.07 Environmental treaty ratification*.................................34 ...■
3rd pillar: Safety and security3.01 Business costs of terrorism .........................................64 ...■3.02 Reliability of police services .........................................70 ...■3.03 Business costs of crime and violence..........................86 ...■3.04 Road traffic accidents*...............................................112 ...■
4th pillar: Health and hygiene4.01 Physician density*......................................................131 ...■4.02 Access to improved sanitation* .................................111 ...■4.03 Access to improved drinking water*..........................122 ...■4.04 Hospital beds*............................................................101 ...■
5th pillar: Prioritization of Travel & Tourism5.01 Government prioritization of the T&T industry.............39 ...■5.02 T&T government expenditure* ....................................28 ...■5.03 Effectiveness of marketing and branding.....................65 ...■5.04 T&T fair attendance*....................................................25 ...■
6th pillar: Air transport infrastructure6.01 Quality of air transport infrastructure .........................111 ...■6.02 Available seat kilometers, domestic*...........................49 ...■6.03 Available seat kilometers, international* ......................90 ...■6.04 Departures per 1,000 population*..............................115 ...■6.05 Airport density* ..........................................................101 ...■6.06 Number of operating airlines*......................................80 ...■6.07 International air transport network ...............................98 ...■
7th pillar: Ground transport infrastructure7.01 Quality of roads ..........................................................109 ...■7.02 Quality of railroad infrastructure...................................79 ...■7.03 Quality of port infrastructure ......................................113 ...■7.04 Quality of ground transport network..........................102 ...■7.05 Road density*.............................................................109 ...■
INDICATOR RANK/133
8th pillar: Tourism infrastructure8.01 Hotel rooms*..............................................................106 ...■8.02 Presence of major car rental companies*....................95 ...■8.03 ATMs accepting Visa cards* ......................................124 ...■
9th pillar: ICT infrastructure9.01 Extent of business Internet use.................................102 ...■9.02 Internet users* ...........................................................122 ...■9.03 Telephone lines*.........................................................128 ...■9.04 Broadband Internet subscribers* ...............................127 ...■9.05 Mobile telephone subscribers*..................................119 ...■
10th pillar: Price competitiveness in the T&T industry10.01 Ticket taxes and airport charges*.................................71 ...■10.02 Purchasing power parity*...............................................7 ...■10.03 Extent and effect of taxation........................................71 ...■10.04 Fuel price levels* .........................................................78 ...■10.05 Hotel price index* ........................................................35 ...■
11th pillar: Human resources11.01 Primary education enrollment* ....................................22 ...■11.02 Secondary education enrollment*..............................133 ...■11.03 Quality of the educational system................................95 ...■11.04 Local availability of research and training services.....107 ...■11.05 Extent of staff training..................................................95 ...■11.06 Hiring and firing practices.............................................97 ...■11.07 Ease of hiring foreign labor ........................................120 ...■11.08 HIV prevalence* .........................................................125 ...■11.09 Business impact of HIV/AIDS.....................................122 ...■11.10 Life expectancy* ........................................................122 ...■
12th pillar: Affinity for Travel & Tourism12.01 Tourism openness* ......................................................22 ...■12.02 Attitude of population toward foreign visitors..............63 ...■12.03 Extension of business trips recommended ...............100 ...■
13th pillar: Natural resources13.01 Number of World Heritage natural sites* ....................10 ...■13.02 Protected areas* ............................................................5 ...■13.03 Quality of the natural environment...............................54 ...■13.04 Total known species*...................................................12 ...■
14th pillar: Cultural resources14.01 Number of World Heritage cultural sites* ...................65 ...■14.02 Sports stadiums* .......................................................111 ...■14.03 Number of international fairs and exhibitions* ............83 ...■14.04 Creative industries exports*.........................................94 ...■
Tanzania
* Hard data
Note: For further details and explanation, please refer to the section “How toRead the Country/Economy Profiles” at the beginning of this chapter.
part2A_profiles.r2 2/26/09 4:01 AM Page 353
The Travel & Tourism Competitiveness Report 2009 © 2009 World Economic Forum

354
2.1:
Cou
ntry
/Eco
nom
y Pr
ofile
s
ThailandKey indicatorsPopulation (millions), 2007............................................................................65.3Surface area (1,000 square kilometers) ......................................................513.1
Gross domestic product (US$ billions), 2007 .............................................245.4Gross domestic product (PPP, US$) per capita, 2007 .............................7,906.7Real GDP growth (percent), 2007...................................................................4.8
Environmental Performance Index, 2008 (out of 149 countries).....................53
Travel & Tourism indicators
T&T industry, 2008 estimatesGDP (US$ millions) ...........................................................17,338...................6.4 ....................5.6Employment (1,000 jobs)....................................................1,858...................5.0 ....................1.9
T&T economy, 2008 estimatesGDP (US$ millions) ...........................................................38,340.................14.1 ....................5.9Employment (1,000 jobs)....................................................3,911.................10.6 ....................2.2
Source: World Travel & Tourism Council, TSA Research 2008
International tourist arrivals (thousands), 2007.................14,464International tourism receipts (US$ millions), 2007 .........15,573
Source: United Nations World Tourism Organization
Travel & Tourism Competitiveness Index
2009 Index......................................................................................................39 4.42008 Index............................................................................................................42 4.4T&T regulatory framework ..............................................................................70 4.5
Policy rules and regulations..........................................................................62 4.5Environmental sustainability..........................................................................99 4.1Safety and security .......................................................................................118 3.9Health and hygiene .........................................................................................71 4.4Prioritization of Travel & Tourism..................................................................22 5.3
T&T business environment and infrastructure ............................................40 4.1Air transport infrastructure ..........................................................................25 4.5Ground transport infrastructure....................................................................56 3.8Tourism infrastructure ....................................................................................39 4.3ICT infrastructure ............................................................................................71 2.7Price competitiveness in the T&T industry.................................................19 5.4
T&T human, cultural, and natural resources ...............................................19 4.7Human resources ............................................................................................57 5.2
Education and training .............................................................................60 4.8Availability of qualified labor...................................................................56 5.5
Affinity for Travel & Tourism ..........................................................................22 5.4Natural resources ...........................................................................................24 4.5Cultural resources...........................................................................................33 3.8
Note: For descriptions of variables and detailed sources, please refer to “How to the Read Country/Economy Profiles.”
Rank Score(out of 133) (1–7 scale)
International tourist arrivals (thousands)
International tourism receipts (US$ millions)
1995 1996 1997 1998 1999 2000 2001 2002 2003 2004 2005 2006 20075,000
10,000
15,000
20,000
1 2 3 4 5 6 7
2009–2018Percent annual growth of total (%, forecast)
part2A_profiles.r2 2/26/09 4:01 AM Page 354
The Travel & Tourism Competitiveness Report 2009 © 2009 World Economic Forum

355
2.1:
Cou
ntry
/Eco
nom
y Pr
ofile
s
The Travel & Tourism Competitiveness Index in detail ■ Competitive Advantage ■ Competitive Disadvantage
INDICATOR RANK/133
1st pillar: Policy rules and regulations1.01 Prevalence of foreign ownership .................................89 ...■1.02 Property rights..............................................................61 ...■1.03 Business impact of rules on FDI ..................................68 ...■1.04 Visa requirements* ......................................................75 ...■1.05 Openness of bilateral Air Service Agreements* ..........60 ...■1.06 Transparency of government policymaking..................60 ...■1.07 Time required to start a business*...............................90 ...■1.08 Cost to start a business* .............................................39 ...■
2nd pillar: Environmental sustainability2.01 Stringency of environmental regulation .......................54 ...■2.02 Enforcement of environmental regulation....................53 ...■2.03 Sustainability of T&T industry development.................21 ...■2.04 Carbon dioxide emissions* ..........................................72 ...■2.05 Particulate matter concentration* ..............................108 ...■2.06 Threatened species* ..................................................103 ...■2.07 Environmental treaty ratification*...............................104 ...■
3rd pillar: Safety and security3.01 Business costs of terrorism .......................................107 ...■3.02 Reliability of police services .........................................71 ...■3.03 Business costs of crime and violence..........................50 ...■3.04 Road traffic accidents*...............................................120 ...■
4th pillar: Health and hygiene4.01 Physician density*......................................................104 ...■4.02 Access to improved sanitation* ...................................44 ...■4.03 Access to improved drinking water*............................47 ...■4.04 Hospital beds*..............................................................77 ...■
5th pillar: Prioritization of Travel & Tourism5.01 Government prioritization of the T&T industry.............12 ...■5.02 T&T government expenditure* ....................................79 ...■5.03 Effectiveness of marketing and branding.....................14 ...■5.04 T&T fair attendance*....................................................14 ...■
6th pillar: Air transport infrastructure6.01 Quality of air transport infrastructure ...........................28 ...■6.02 Available seat kilometers, domestic*...........................20 ...■6.03 Available seat kilometers, international* ......................11 ...■6.04 Departures per 1,000 population*................................76 ...■6.05 Airport density* ............................................................85 ...■6.06 Number of operating airlines*......................................13 ...■6.07 International air transport network ...............................26 ...■
7th pillar: Ground transport infrastructure7.01 Quality of roads ............................................................32 ...■7.02 Quality of railroad infrastructure...................................48 ...■7.03 Quality of port infrastructure ........................................48 ...■7.04 Quality of ground transport network ............................31 ...■7.05 Road density*...............................................................98 ...■
INDICATOR RANK/133
8th pillar: Tourism infrastructure8.01 Hotel rooms*................................................................48 ...■8.02 Presence of major car rental companies*....................23 ...■8.03 ATMs accepting Visa cards* ........................................34 ...■
9th pillar: ICT infrastructure9.01 Extent of business Internet use...................................56 ...■9.02 Internet users* .............................................................68 ...■9.03 Telephone lines*...........................................................87 ...■9.04 Broadband Internet subscribers* .................................75 ...■9.05 Mobile telephone subscribers*....................................66 ...■
10th pillar: Price competitiveness in the T&T industry10.01 Ticket taxes and airport charges*.................................29 ...■10.02 Purchasing power parity*.............................................39 ...■10.03 Extent and effect of taxation........................................27 ...■10.04 Fuel price levels* .........................................................39 ...■10.05 Hotel price index* ........................................................27 ...■
11th pillar: Human resources11.01 Primary education enrollment* ....................................61 ...■11.02 Secondary education enrollment*................................85 ...■11.03 Quality of the educational system................................53 ...■11.04 Local availability of research and training services.......58 ...■11.05 Extent of staff training..................................................51 ...■11.06 Hiring and firing practices.............................................39 ...■11.07 Ease of hiring foreign labor ........................................100 ...■11.08 HIV prevalence* .........................................................107 ...■11.09 Business impact of HIV/AIDS.......................................97 ...■11.10 Life expectancy* ..........................................................66 ...■
12th pillar: Affinity for Travel & Tourism12.01 Tourism openness* ......................................................31 ...■12.02 Attitude of population toward foreign visitors..............13 ...■12.03 Extension of business trips recommended .................11 ...■
13th pillar: Natural resources13.01 Number of World Heritage natural sites* ....................23 ...■13.02 Protected areas* ..........................................................30 ...■13.03 Quality of the natural environment.............................104 ...■13.04 Total known species*...................................................17 ...■
14th pillar: Cultural resources14.01 Number of World Heritage cultural sites* ...................65 ...■14.02 Sports stadiums* .......................................................110 ...■14.03 Number of international fairs and exhibitions* ............27 ...■14.04 Creative industries exports*.........................................15 ...■
Thailand
* Hard data
Note: For further details and explanation, please refer to the section “How toRead the Country/Economy Profiles” at the beginning of this chapter.
part2A_profiles.r2 2/26/09 4:01 AM Page 355
The Travel & Tourism Competitiveness Report 2009 © 2009 World Economic Forum

356
2.1:
Cou
ntry
/Eco
nom
y Pr
ofile
s
Trinidad and TobagoKey indicatorsPopulation (millions), 2007..............................................................................1.3Surface area (1,000 square kilometers) ..........................................................5.1
Gross domestic product (US$ billions), 2007 ...............................................20.9Gross domestic product (PPP, US$) per capita, 2007 ...........................18,384.9Real GDP growth (percent), 2007...................................................................5.5
Environmental Performance Index, 2008 (out of 149 countries).....................89
Travel & Tourism indicators
T&T industry, 2008 estimatesGDP (US$ millions) .............................................................1,116...................4.4 ....................5.4Employment (1,000 jobs).........................................................35...................5.0 ....................3.3
T&T economy, 2008 estimatesGDP (US$ millions) .............................................................4,619.................18.0 ....................2.9Employment (1,000 jobs).......................................................146.................20.9 ....................0.9
Source: World Travel & Tourism Council, TSA Research 2008
International tourist arrivals (thousands), 2007......................486International tourism receipts (US$ millions), 2007 ..............464
Source: United Nations World Tourism Organization
Travel & Tourism Competitiveness Index
2009 Index......................................................................................................84 3.72008 Index............................................................................................................74 3.8T&T regulatory framework ............................................................................100 4.0
Policy rules and regulations..........................................................................52 4.7Environmental sustainability........................................................................132 3.2Safety and security .......................................................................................110 4.2Health and hygiene .........................................................................................70 4.5Prioritization of Travel & Tourism................................................................105 3.7
T&T business environment and infrastructure ............................................51 3.8Air transport infrastructure ..........................................................................61 3.2Ground transport infrastructure....................................................................38 4.2Tourism infrastructure ....................................................................................66 3.3ICT infrastructure ............................................................................................62 2.9Price competitiveness in the T&T industry.................................................12 5.5
T&T human, cultural, and natural resources .............................................112 3.4Human resources ............................................................................................89 4.8
Education and training .............................................................................80 4.5Availability of qualified labor...................................................................95 5.2
Affinity for Travel & Tourism ........................................................................122 4.1Natural resources .........................................................................................100 2.6Cultural resources...........................................................................................85 1.9
Note: For descriptions of variables and detailed sources, please refer to “How to the Read Country/Economy Profiles.”
Rank Score(out of 133) (1–7 scale)
International tourist arrivals (thousands)
International tourism receipts (US$ millions)
1995 1996 1997 1998 1999 2000 2001 2002 2003 2004 2005 2006 20070
100
200
300
400
500
1 2 3 4 5 6 7
2009–2018Percent annual growth of total (%, forecast)
part2A_profiles.r2 2/26/09 4:01 AM Page 356
The Travel & Tourism Competitiveness Report 2009 © 2009 World Economic Forum

357
2.1:
Cou
ntry
/Eco
nom
y Pr
ofile
s
The Travel & Tourism Competitiveness Index in detail ■ Competitive Advantage ■ Competitive Disadvantage
INDICATOR RANK/133
1st pillar: Policy rules and regulations1.01 Prevalence of foreign ownership .................................49 ...■1.02 Property rights..............................................................68 ...■1.03 Business impact of rules on FDI ..................................26 ...■1.04 Visa requirements* ......................................................25 ...■1.05 Openness of bilateral Air Service Agreements* ..........43 ...■1.06 Transparency of government policymaking..................62 ...■1.07 Time required to start a business*.............................106 ...■1.08 Cost to start a business* .............................................13 ...■
2nd pillar: Environmental sustainability2.01 Stringency of environmental regulation .....................100 ...■2.02 Enforcement of environmental regulation..................117 ...■2.03 Sustainability of T&T industry development...............109 ...■2.04 Carbon dioxide emissions* ........................................125 ...■2.05 Particulate matter concentration* ..............................121 ...■2.06 Threatened species* ....................................................21 ...■2.07 Environmental treaty ratification*.................................67 ...■
3rd pillar: Safety and security3.01 Business costs of terrorism .........................................97 ...■3.02 Reliability of police services .......................................124 ...■3.03 Business costs of crime and violence........................129 ...■3.04 Road traffic accidents*.................................................14 ...■
4th pillar: Health and hygiene4.01 Physician density*........................................................92 ...■4.02 Access to improved sanitation* ...................................55 ...■4.03 Access to improved drinking water*............................66 ...■4.04 Hospital beds*..............................................................70 ...■
5th pillar: Prioritization of Travel & Tourism5.01 Government prioritization of the T&T industry...........105 ...■5.02 T&T government expenditure* ....................................31 ...■5.03 Effectiveness of marketing and branding...................102 ...■5.04 T&T fair attendance*..................................................115 ...■
6th pillar: Air transport infrastructure6.01 Quality of air transport infrastructure ...........................67 ...■6.02 Available seat kilometers, domestic*...........................77 ...■6.03 Available seat kilometers, international* ......................83 ...■6.04 Departures per 1,000 population*................................35 ...■6.05 Airport density* ............................................................31 ...■6.06 Number of operating airlines*......................................86 ...■6.07 International air transport network ...............................70 ...■
7th pillar: Ground transport infrastructure7.01 Quality of roads ............................................................71 ...■7.02 Quality of railroad infrastructure ..................................n/a ......7.03 Quality of port infrastructure ........................................89 ...■7.04 Quality of ground transport network..........................125 ...■7.05 Road density*...............................................................18 ...■
INDICATOR RANK/133
8th pillar: Tourism infrastructure8.01 Hotel rooms*................................................................57 ...■8.02 Presence of major car rental companies*....................56 ...■8.03 ATMs accepting Visa cards* ........................................59 ...■
9th pillar: ICT infrastructure9.01 Extent of business Internet use...................................92 ...■9.02 Internet users* .............................................................49 ...■9.03 Telephone lines*...........................................................56 ...■9.04 Broadband Internet subscribers* .................................78 ...■9.05 Mobile telephone subscribers*....................................72 ...■
10th pillar: Price competitiveness in the T&T industry10.01 Ticket taxes and airport charges*.................................56 ...■10.02 Purchasing power parity*.............................................78 ...■10.03 Extent and effect of taxation........................................23 ...■10.04 Fuel price levels* .........................................................10 ...■10.05 Hotel price index* ........................................................34 ...■
11th pillar: Human resources11.01 Primary education enrollment* ..................................106 ...■11.02 Secondary education enrollment*................................90 ...■11.03 Quality of the educational system................................42 ...■11.04 Local availability of research and training services.......91 ...■11.05 Extent of staff training..................................................65 ...■11.06 Hiring and firing practices.............................................80 ...■11.07 Ease of hiring foreign labor ..........................................63 ...■11.08 HIV prevalence* .........................................................108 ...■11.09 Business impact of HIV/AIDS.....................................120 ...■11.10 Life expectancy* ..........................................................87 ...■
12th pillar: Affinity for Travel & Tourism12.01 Tourism openness* ....................................................104 ...■12.02 Attitude of population toward foreign visitors............113 ...■12.03 Extension of business trips recommended ...............120 ...■
13th pillar: Natural resources13.01 Number of World Heritage natural sites* ....................74 ...■13.02 Protected areas* ..........................................................71 ...■13.03 Quality of the natural environment...............................98 ...■13.04 Total known species*...................................................62 ...■
14th pillar: Cultural resources14.01 Number of World Heritage cultural sites* .................116 ...■14.02 Sports stadiums* .........................................................25 ...■14.03 Number of international fairs and exhibitions* ............91 ...■14.04 Creative industries exports*.........................................91 ...■
Trinidad and Tobago
* Hard data
Note: For further details and explanation, please refer to the section “How toRead the Country/Economy Profiles” at the beginning of this chapter.
part2A_profiles.r2 2/26/09 4:01 AM Page 357
The Travel & Tourism Competitiveness Report 2009 © 2009 World Economic Forum