The topology of social influence and the dynamics of...
15
Design Computing and Cognition DCC’16. J.S. Gero (ed), pp. 653-665. © Springer 2016 653 The topology of social influence and the dynamics of design product adoption Somwrita Sarkar 1 and John S. Gero 2 1 University of Sydney, Australia 2 George Mason University and University of North Carolina at Charlotte, USA This paper presents the results of studies on how the dynamics of design product adoption is affected by the topological structure of social commu- nication and influence between consumers, without any changes in the de- signed product. The dynamics of product adoption are studied over ran- dom, modular small world, and scale free social network structures, under local rules of communication. Results show global behaviors emerging from these local agent communication rules, including states where popu- lations completely accept or reject products, starting from similar initial states, as well as regimes and cycles of synchronized behaviors of adoption and rejection. It is claimed that without modeling consumer interactions, understanding and modeling of innovation in design will remain inade- quate. Since there could be fundamental limitations to the predictability of adoption behaviors under social influence, innovation strategies could fare better when they focus on the quality, novelty, and technological advances they could bring instead of being guided only by social popularity and in- fluence. Introduction Traditionally design research has focused on the design processes of the individual designer [1-3]. This was followed by research into the design behavior of teams of designers, whether collocated or remotely located [4- 6]. More recently the product’s consumer has been brought within the am- bit of product design and innovation through feedback of consumer behav-
Transcript of The topology of social influence and the dynamics of...

Design Computing and Cognition DCC’16. J.S. Gero (ed), pp. 653-665. © Springer 2016
653
The topology of social influence and the dynamics of design product adoption
Somwrita Sarkar1 and John S. Gero2 1University of Sydney, Australia 2George Mason University and University of North Carolina at Charlotte, USA
This paper presents the results of studies on how the dynamics of design product adoption is affected by the topological structure of social commu-nication and influence between consumers, without any changes in the de-signed product. The dynamics of product adoption are studied over ran-dom, modular small world, and scale free social network structures, under local rules of communication. Results show global behaviors emerging from these local agent communication rules, including states where popu-lations completely accept or reject products, starting from similar initial states, as well as regimes and cycles of synchronized behaviors of adoption and rejection. It is claimed that without modeling consumer interactions, understanding and modeling of innovation in design will remain inade-quate. Since there could be fundamental limitations to the predictability of adoption behaviors under social influence, innovation strategies could fare better when they focus on the quality, novelty, and technological advances they could bring instead of being guided only by social popularity and in-fluence.
Introduction
Traditionally design research has focused on the design processes of the individual designer [1-3]. This was followed by research into the design behavior of teams of designers, whether collocated or remotely located [4-6]. More recently the product’s consumer has been brought within the am-bit of product design and innovation through feedback of consumer behav-

S Sarkar and J S Gero
ior and its effect on product design cycles. Information about consumer behavior is becoming increasingly available through their use of social media as they search for and decide to consume products [7,8]. As a con-sequence the consumers’ behavior is increasingly taken into account as part of an expanded view of the design activity.
Designing, then, ceases to be a linear activity in which an individual or group of producers generate products, deliver it to consumers, who then consume the product. It also ceases to be an iterative feedback based cyclic activity in which the feedback from consumers is used to improve or inno-vate on products for the next cycle of generation. Instead, designing be-comes a networked social activity, where the dynamics of social commu-nication between the actors (producers and consumers) governs whether or not and how a product is adopted.
It has been shown in live Web based social experiments, for example, that with the quality of the products remaining exactly the same, the pres-ence, absence and degree of social communication between agents could lead to completely different regimes of adoption [9]. While product quality did matter, in that while the best products rarely did poorly and the worst ones nearly always suffered, but with a large margin, increasing the strength of social influence amongst consumers made the rankings both more unequal and unpredictable. Thus, predicting exactly how successful a product will be, and how a producer must change their innovation or pro-duction strategy becomes a particularly hard problem to solve, given that even chance communication on social networks could change the out-comes dramatically, with no change in the profile of products competing in the market.
Further, social influence may or may not always be positive. For exam-ple, the networked structures of technological innovation diffusion that are too deeply influenced by a majority supported social communication could actually end up limiting, hindering, or slowing down innovation [10]. Thus, to understand the scenarios under which innovations succeed or fail, it will be important to understand the structure of topological social inter-actions between consumers, even if one possible emerging policy from such studies is to weight personal values and opinions more than the pre-vailing social opinion in specific cases in order to meaningfully advance innovation.
As part of a larger scale project that covers the interactions between de-signers, the interactions between designers and consumers and the interac-tions between consumers, in this paper we present a preliminary effort to model the diffusion of social influence by consumers over social networks and study how this affects the dynamics of product adoption over time. In

Topology of social recommendations and dynamics of product adoption
particular, under simple and standard local rules of social interactions be-tween consumers, we empirically study whether the topology of the social network has any significant effect on global adoption behaviors for the en-tire population of consumers.
We study whether under a specific network structure, there is any cer-tainty of a product failing or succeeding, without changing its design quali-ty. We note here that in this preliminary model, we consider design quality and other factors as constant. This allows us to focus on a simple model of social communication and its effect on adoption. Since (real) adoption be-haviors are dependent on both design quality as well as social communica-tion, along with host of other factors such as production and distribution strategies, marketing techniques, and demographics, we believe it will be useful to focus on a simple model where all else is held constant. This al-lows us to specifically focus on the question of social communication in order to understand whether the structure of the network on which social communication occurs has any significant role in the set of emerging be-haviors.
This research is part of a larger project that treats designing as an activi-ty that includes the social behavior of both designers and consumers as groups and their interactions within each group and across each group through designed products within its ambit. Social behavior involves both interactions and the consequential change of the values of designers and consumers. It is claimed that without modeling such interactions it is not possible to adequately model innovation. We find that there could be fun-damental limitations to the predictability of adoption behaviors under so-cial influence, innovation strategies could fare better when they focus on the quality, novelty, and technological advances they could bring instead of being guided by social popularity and influence. Since it has been ob-served in the Salganik study that good products rarely do poorly [9], but there is a sufficient level of uncertainty added on account of social influ-ence, the state of the design field could progress faster when innovation or advancement of quality becomes a major focus (reflecting ultimately in the quality of the product, making it one of those good products that would rarely fail).
However, the inherent unpredictability of product adoption leads also to a more counter-intuitive observation: if, holding design quality constant, adoption behaviors are fundamentally unpredictable, then a lazy designer or producer could simply aim to produce many below standard products rather than a few well designed products, in the hopes that at least some of them would succeed purely by contingency. This more counter-intuitive behavior is also empirically observed. For example, in the case of online

S Sarkar and J S Gero
products such as songs and dances, where people post multiple videos (e.g. on YouTube) that are not of sufficiently high artistic quality, but very large in number. The hope is that at least one of them will become “viral” purely by contingency, making the artist famous, after which even sub-standard work will continue to be adopted. However, we argue, that while such be-havior may ensure a short-term advantage to the producer, it may actually hinder real innovation or advancement of the design field.
We model random, small world modular (clustered), and scale free networks of social relationships between consumers, with consumers who could either be excitatory (send out positive influence about the product), or inhibitory (send out negative influence about the product) for the popu-lation of consumers. Each consumer has a state, that is, adopt or reject. This state is a decision for the consumer to make at each time step as so-cially connected neighbors send out influence messages. Then, we study the dynamics that evolve over several time steps as consumers send out messages to their neighbors. Each consumer receives a positive or negative influence from its neighbors, which helps to inform their state, but the con-sumer also listens to “itself”, that is, its own recommendation. While the current system has no history, the same framework could incorporate his-tory of use as a factor informing the consumer’s decision for the next time step in future work.
We report several expected as well as unexpected results on the dynam-ics, their attractor states, and implications for product adoption behaviors that can emerge out of social communication over networks.
Significance
In its most general form, the problem addressed in this paper has histori-cally been addressed in both biology and the physical sciences [11,12], as well as social sciences and economics [13-16]. It could be described as the problem of predicting how a system’s elements would behave as a collec-tive when local information transfer occurs between the elements. Not all approaches have adopted network based analyses, (for example, game the-ory and information theory have been widely employed to study the prob-lem), and the network based modeling approach shows the fundamental importance that networks of social communication play in deciding con-sensus emergence, information cascades, or targeting and identification of most influential customers to maximize adoption of innovations and prod-ucts.
Here we show empirically that while different types of social network structures have different forms of adoption behaviors, (modular and clus-

Topology of social recommendations and dynamics of product adoption
tered networks, for example, could enter into regimes where groups of cus-tomers collectively adopt or reject products, and sparse random networks could demonstrate synchronized or cyclic behaviors of adoption and rejec-tion). There is an inherent unpredictability associated with the dynamics even with all network parameters remaining constant. While the model presented here is abstract, and we do not treat the properties of the model analytically, or make any claims or comparisons about the empirical simi-larity of the model’s behavior with real world regimes (which is out of scope for this first preliminary paper), the inherent unpredictability of dy-namics suggests an interesting, albeit debatable, finding about innovation strategies by designers. This is to do with the decision on the degree to which social popularity and influence should be used as a guiding basis for driving innovations. If there is inherent unpredictability of dynamics in the system, with system structure, initial conditions, and the parameters re-maining constant, an innovation could fare better by focusing on the quali-ty, novelty, and technological advances that it could bring instead of being guided only by social popularity and influence. That is, as discussed above, focusing on design quality lends a higher chance of advancing the design field as well as success of adoption, whereas the strategy of many sub-standard products being introduced in hope of success, could lead to short term gains, but not necessarily advancement of the field.
Method
A network of consumers is defined as a graph 𝐺 = (𝑉,𝐸), where 𝑉 = 𝑛 is the number of consumers, and 𝐸 is a set of edges connecting two con-sumers 𝑖 and 𝑗 from 𝑉. The graph 𝐺 is represented as an 𝑛 × 𝑛 matrix 𝐴, where 𝐴!" = 1 if consumers 𝑖 and 𝑗 are connected, and 𝐴!" = 0 otherwise. The set 𝐸 could be constructed in several ways, which will affect the re-sulting social network structure of 𝐺. Here we consider three such models: random, small world modular, and scale free connectivity. We note that the construction of the social network could be motivated from several ba-ses, but a common one is patterns of co-usage of a product. That is, a link exists between consumers 𝑖 and 𝑗 if they have used common products be-fore.
Random connectivity between consumers
Random connectivity between consumers is modeled as an Erdos-Renyi (ER) random network, where a link exists between each pair of consumers

S Sarkar and J S Gero
with an independent probability of 𝑝. That is 𝐺! = (𝑉,𝐸!), with 𝐴! repre-senting the adjacency matrix for the random graph. While 𝑝 can take any value from 0 to 1, we choose 𝑝 to be low, as most product customer usage networks are very sparse. The lowest values of 𝑝 could be chosen based on the criteria that a value of 𝑝 > ! !"!
! would produce a connected graph. A 𝑝
lower than this limit would likely produce disconnected components. We will consider values of 𝑝 above and below this limit.
Under conditions of random connectivity, a consumer is equally likely to receive social messages from any other customer in the population.
Small world modular connectivity between consumers
Different from random connectivity is the idea of small world modular connectivity. Modular social networks capture the idea that consumers are likely to have tightly clustered social interaction groups, where a group of customers could be using a product and passing recommendations to only a small part of the entire population with large probability, and to the rest of the network with lower probability. This models the situation where people may recommend to close friends or other consumers similar to themselves more than they do to distant friends and acquaintances or other dissimilar consumers in different social groups.
It has been shown that modular networks are likely to be small world [17]. That is, modular networks will have the properties of high clustering coefficients and low average path lengths between nodes. A modular net-work is modeled using a stochastic block model [18-20]. A modular net-work is modeled as a graph 𝐺! = (𝑉,𝐸!), where the set of edges 𝐸! rep-resents the links between two nodes from 𝑉. The graph is represented by its adjacency matrix 𝐴!, and has a special structure to represent modulari-ty. Let there be 𝑞 communities of size 𝑧 nodes each, such that the number of communities 𝑀 = 𝑛/𝑧. Thus, each node has a label from the set {1, 2,… , 𝑞}. If two nodes 𝑖 and 𝑗 have the same label, then they are con-nected with a probability of 𝑝!", and if they have different labels, they are connected with a probability of 𝑝!"#. Since the probability of connection within a module is higher than that between modules, we have 𝑝!" > 𝑝!"#. Further, we model sparse networks with the total number of edges scaling as 𝑂(𝑛), since most real world social networks have sparse connectivity.
In a modular network, each consumer has a higher probability of com-municating with members of its own group than members of other groups.

Topology of social recommendations and dynamics of product adoption
Scale free connectivity between consumers
Another basis of connectivity between consumers could arise from the idea of influential consumers in the network, that is consumers who are enthu-siastic adopters, and therefore use lots of products, and consequently are connected to lots of other consumers through commonality of product use. We model a situation where there are a low number of these influential well connected customers, amongst many more consumers who are not as well connected (i.e., the not so well connected consumers use few prod-ucts, and therefore are connected to only a few others). Since this network is a mix of a low number of well connected and a high number of not so well connected consumers, it is likely that each well connected consumer will be connected to lots of other consumers themselves who will have low connectivity. The ideal situation in this condition would be a “star” net-work with one consumer in the middle, connected to and recommending a product all the other consumers in the network.
But, to model a more realistic situation with the above properties, we use the Barabasi-Albert scale free network structure model [21]. The scale free connectivity network is modeled by a graph 𝐺! = (𝑉,𝐸!), where 𝐸! represents the set edges between any two consumers from 𝑉. In this model, the network is built in successive time steps, where each new incoming node 𝑗 is connected to an existing node 𝑖 with a probability 𝑝! proportional to the existing degree of node 𝑖. That is, a “rich get richer” model, where nodes with high connectivity keep receiving a high proportion of the con-nectivity from incoming nodes, resulting in a situation where the network has a low number of highly connected nodes and a high number of nodes with low connectivity, at each stage (hence the name scale free, since re-cursively removing all the top degree nodes, one would again see the same scale free structure of degree distribution).
A scale free network models the situation where a low number of very influential customers are able to influence and send recommendations to many customers who are “influenced”.
A simple model of dynamics of social communication
On each of the network types described above, each consumer has a state 𝑠, with 𝑠 = +1, if a consumer has adopted a product, 𝑠 = −1, if they re-ject the product, and 𝑠 = 0, if they are in an undecided state (equally likely to adopt or reject). Further, the current state of each consumer is the social
S Sarkar and J S Gero
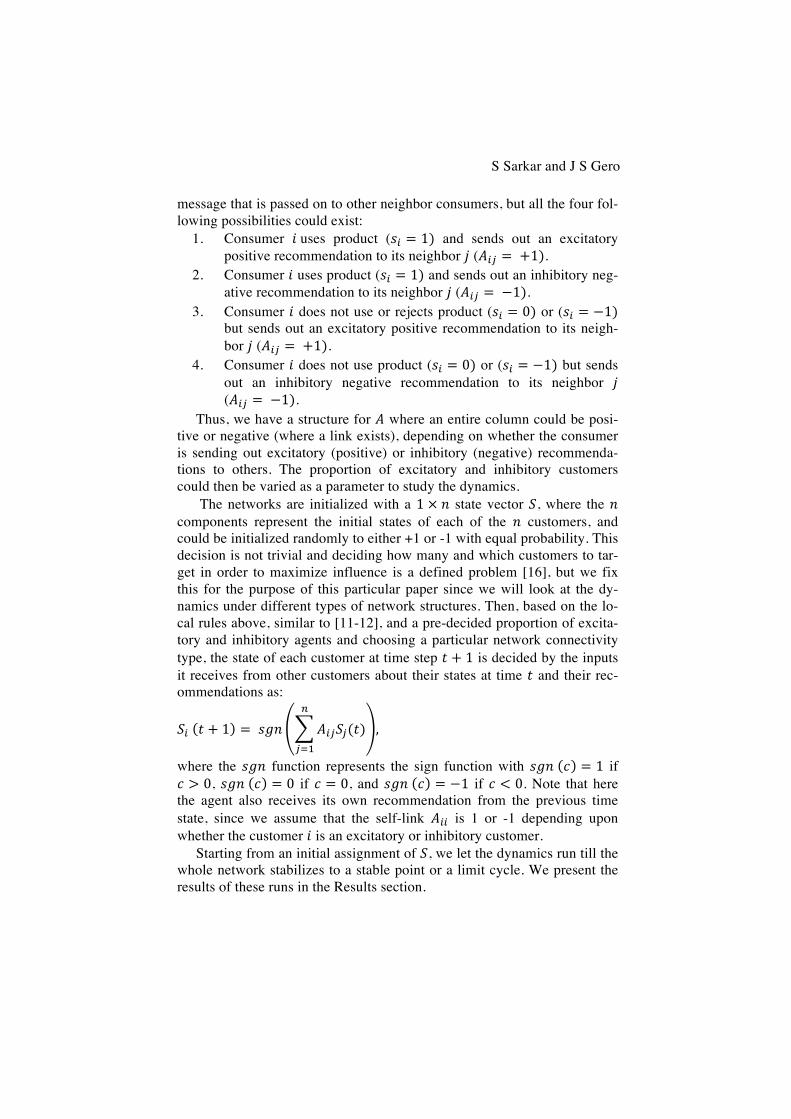
message that is passed on to other neighbor consumers, but all the four fol-lowing possibilities could exist:
1. Consumer 𝑖 uses product (𝑠! = 1) and sends out an excitatory positive recommendation to its neighbor 𝑗 (𝐴!" = +1).
2. Consumer 𝑖 uses product (𝑠! = 1) and sends out an inhibitory neg-ative recommendation to its neighbor 𝑗 (𝐴!" = −1).
3. Consumer 𝑖 does not use or rejects product (𝑠! = 0) or (𝑠! = −1) but sends out an excitatory positive recommendation to its neigh-bor 𝑗 (𝐴!" = +1).
4. Consumer 𝑖 does not use product (𝑠! = 0) or (𝑠! = −1) but sends out an inhibitory negative recommendation to its neighbor 𝑗 (𝐴!" = −1).
Thus, we have a structure for 𝐴 where an entire column could be posi-tive or negative (where a link exists), depending on whether the consumer is sending out excitatory (positive) or inhibitory (negative) recommenda-tions to others. The proportion of excitatory and inhibitory customers could then be varied as a parameter to study the dynamics.
The networks are initialized with a 1 × 𝑛 state vector 𝑆, where the 𝑛 components represent the initial states of each of the 𝑛 customers, and could be initialized randomly to either +1 or -1 with equal probability. This decision is not trivial and deciding how many and which customers to tar-get in order to maximize influence is a defined problem [16], but we fix this for the purpose of this particular paper since we will look at the dy-namics under different types of network structures. Then, based on the lo-cal rules above, similar to [11-12], and a pre-decided proportion of excita-tory and inhibitory agents and choosing a particular network connectivity type, the state of each customer at time step 𝑡 + 1 is decided by the inputs it receives from other customers about their states at time 𝑡 and their rec-ommendations as:
𝑆! 𝑡 + 1 = 𝑠𝑔𝑛 𝐴!"𝑆!(𝑡)!
!!!
,
where the 𝑠𝑔𝑛 function represents the sign function with 𝑠𝑔𝑛 𝑐 = 1 if 𝑐 > 0, 𝑠𝑔𝑛 𝑐 = 0 if 𝑐 = 0, and 𝑠𝑔𝑛 𝑐 = −1 if 𝑐 < 0. Note that here the agent also receives its own recommendation from the previous time state, since we assume that the self-link 𝐴!! is 1 or -1 depending upon whether the customer 𝑖 is an excitatory or inhibitory customer.
Starting from an initial assignment of 𝑆, we let the dynamics run till the whole network stabilizes to a stable point or a limit cycle. We present the results of these runs in the Results section.
Topology of social recommendations and dynamics of product adoption
Results: Random connectivity dynamics
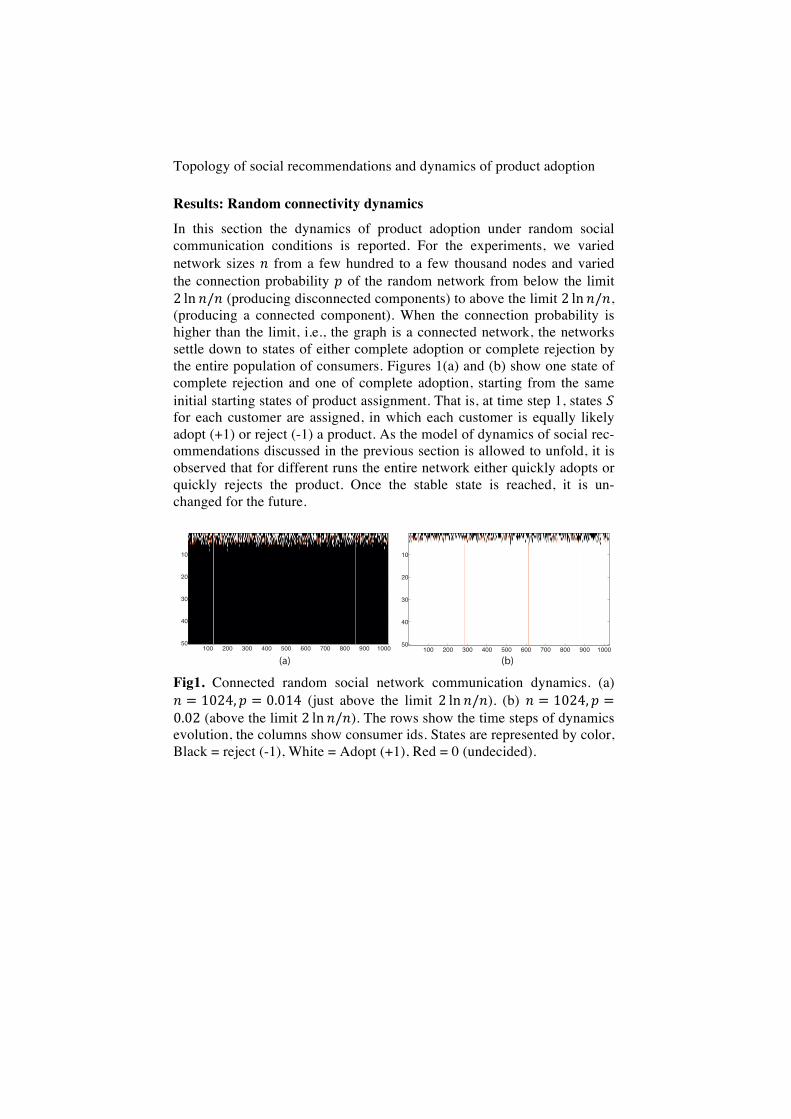
In this section the dynamics of product adoption under random social communication conditions is reported. For the experiments, we varied network sizes 𝑛 from a few hundred to a few thousand nodes and varied the connection probability 𝑝 of the random network from below the limit 2 ln 𝑛/𝑛 (producing disconnected components) to above the limit 2 ln 𝑛/𝑛, (producing a connected component). When the connection probability is higher than the limit, i.e., the graph is a connected network, the networks settle down to states of either complete adoption or complete rejection by the entire population of consumers. Figures 1(a) and (b) show one state of complete rejection and one of complete adoption, starting from the same initial starting states of product assignment. That is, at time step 1, states 𝑆 for each customer are assigned, in which each customer is equally likely adopt (+1) or reject (-1) a product. As the model of dynamics of social rec-ommendations discussed in the previous section is allowed to unfold, it is observed that for different runs the entire network either quickly adopts or quickly rejects the product. Once the stable state is reached, it is un-changed for the future.
Fig1. Connected random social network communication dynamics. (a) 𝑛 = 1024, 𝑝 = 0.014 (just above the limit 2 ln 𝑛/𝑛). (b) 𝑛 = 1024, 𝑝 =0.02 (above the limit 2 ln 𝑛/𝑛). The rows show the time steps of dynamics evolution, the columns show consumer ids. States are represented by color, Black = reject (-1), White = Adopt (+1), Red = 0 (undecided).
100 200 300 400 500 600 700 800 900 1000
10
20
30
40
50100 200 300 400 500 600 700 800 900 1000
10
20
30
40
50
(a) (b)

S Sarkar and J S Gero
Fig2. Disconnected components random social network communication dynamics, 𝑛 = 1024, 𝑝 = 0.003 (below the limit 2 ln 𝑛/𝑛). (a) Most consumers adopt the product (b) Most consumers reject the product (c) Bands of synchronized adoption and rejection behaviors through time. The rows show the time steps of dynamics evolution, the columns show consumer ids. States are represented by color, Black = reject (-1), White = Adopt (+1), Red = 0 (undecided). (f) A plot of the average activity of each agent over all the time steps from (e).
Results: Modular connectivity dynamics
In this section the dynamics of product adoption under sparse modular so-cial communication conditions is presented. Figure 3 shows examples of the dynamic behavior that unfolds. Once again, with similar initial state as-signments 𝑆, two final states of near complete adoption and near complete rejection are observed in a few runs; i.e., a final state of in which either all modules adopt the project or reject the product. However, it is also seen that different modules can reach different stable states, with a few modules in states of adoption co-existing with other modules in states of rejection.
200 400 600 800 1000
100
200
300
400
500200 400 600 800 1000
100
200
300
400
500
200 400 600 800 1000
100
200
300
400
500200 400 600 800 1000
100
200
300
400
500
200 400 600 800 1000
100
200
300
400
500
0 200 400 600 800 1000
−0.4
−0.2
0
0.2
0.4
0.6
(a) (b)
(c) (d)
(e) (f )

Topology of social recommendations and dynamics of product adoption
Particularly interesting is the behavior of a few individual customers who cycle between the combinations adopt-undecided, adopt-reject, and reject-undecided. Another interesting observation is that the primary intra-module global behavior can continue for long spans of time, but can sud-denly switch to another state, Figure 3(d). The mean activity of consumers over 100 time steps in Fig. 3(e) is shown in Fig. 3(f), where the difference between global behaviors in different modules is clearly observed.
Fig3. Modular social network communication dynamics, 𝑛 = 1024, 𝑝!" =0.1 to 0.005, 𝑝!"# = 0.005 to 0.001, results from several combinations are shown and discussed in the main text. (a)-(e) Dynamics of modular adoption and rejection behavior over time, some modules completely re-ject while some others completely adopt the product. The rows show the time steps of dynamics evolution, the columns show consumer ids. States are represented by color, Black = reject (-1), White = Adopt (+1), Red = 0 (undecided). (f) A plot of the average activity of each agent over all the time steps from (e).
100 200 300 400 500 600 700 800 900 1000
20
40
60
80
100
100 200 300 400 500 600 700 800 900 1000
20
40
60
80
100
100 200 300 400 500 600 700 800 900 1000
20
40
60
80
100100 200 300 400 500 600 700 800 900 1000
20
40
60
80
100
100 200 300 400 500 600 700 800 900 1000
20
40
60
80
100
0 200 400 600 800 1000 1200−1
−0.5
0
0.5
1
(a) (b)
(c) (d)
(e) (f )

S Sarkar and J S Gero
The probability of intra and inter modular connectivities, 𝑝!" and 𝑝!"# have a similar unexpected effect as observed for the random case: more complex behavior is seen for sparser cases. When 𝑝!" is high, for example, 𝑝!" = 0.1, 𝑝!"# = 0.005 in Fig. 3(e), leading to denser networks, the most common outcomes are consumers confirming strongly to the global behav-ior of their module. Adoption is strong, but so is rejection, and once a state of rejection sets in it is impossible to change it to adoption. However, when 𝑝!" is low [for example, 𝑝!" = 0.05, 𝑝!"# = 0.001 in Figs 3(a)-(d)], leading to sparser networks, outcomes are more unpredictable, rich and varied. This is unexpected, because it shows richer product adoption dy-namics occur when networks are sparser: long spans of rejection could still flip and show regimes of adoption behavior.
Results: Scale free connectivity dynamics
In this section the dynamics of product adoption under scale free social communication conditions is reported. While in the modular case entire modules or groups of consumers show similar behaviors, in the scale free case, the global behavior is more individual and governed by each con-sumer’s connectivity to highly connected influential consumers.
Fig4. Modular social network communication dynamics, 𝑛 = 1024, 𝑝!" =0.1 to 0.005, 𝑝!"# = 0.005 to 0.001, results from several combinations are shown and discussed in the main text. (a)-(e) Dynamics of modular adoption and rejection behavior over time. The rows show the time steps
100 200 300 400 500 600 700 800 900 1000
10
20
30
40
50100 200 300 400 500 600 700 800 900 1000
10
20
30
40
50
0 200 400 600 800 1000−1
−0.5
0
0.5
1
0 200 400 600 800 1000−1
−0.5
0
0.5
1(a) (b)
(c) (d)

Topology of social recommendations and dynamics of product adoption
of dynamics evolution, the columns show consumer ids. States are repre-sented by color, Black = reject (-1), White = Adopt (+1), Red = 0 (unde-cided). (f) A plot of the average activity of each agent over all the time steps from (e).
In this case, an interesting result emerges, where starting from the same initial state assignments 𝑆, a majority of consumers in the population settle to a stable adoption or rejection state, but a few customers show persistent strong behaviors that are opposite to the main population behavior. Figures 4(a) and (b) show a primarily adopting and primarily rejecting population, but a few individuals (not negligible in number) continue to show the op-posite stable behavior. Figures 4(c) and (d) show the corresponding mean activity states for each consumer in (a) and (b) respectively.
Similar to the modular case, a significant number of consumers also show cyclical behaviors, switching between the combinations adopt-undecided, adopt-reject, and reject-undecided. This cyclical behavior emerges as stable, continuing indefinitely. Further, the patterns of the cy-cles (the numbers of time steps over which one state lasts followed by an-other) show a rich diversity.
Conclusions
In this paper, we modeled the diffusion of social influence by consumers over social networks and studied how this affects the dynamics of product adoption over time. In particular, under simple and standard local rules of social interactions between consumers, we empirically studied whether the topology of the social network has any significant effect on global adop-tion behaviors for the entire population of consumers.
Using a simple model of social influence, the dynamics of product adoption are studied over random, modular small world, and scale free so-cial network structures, under local rules of communication. Results show global behaviors emerging from these local agent communication rules, including states where populations completely accept or reject products, starting from similar initial states, as well as regimes and cycles of syn-chronized behaviors of adoption and rejection. Even with very simple so-cial communication structures, inherently unpredictable complex global behaviors of agents emerged, and the nature of the structure of social communication played an extremely significant role even with the struc-ture or attributes of a designed product remaining unchanged and constant. An analytical assessment of the model was out of scope for this paper, but in future work, we will study both the model the different regimes of re-sults analytically. In future work we will extend the model with data from real world recommendation systems and product adoption records, in order

S Sarkar and J S Gero
to test the findings and make the abstract model presented here closer to empirical observations of real product adoption and social communication over networks.
In particular, we observe that with unchanged parameters and initial states, different runs produce a rich variety of behaviors, suggesting that any pattern of adoptions and rejections is possible. We also observed that denser networks were rigid and necessitated quick convergence to stable behaviors for entire populations, whereas sparser networks demonstrated much richer diversity of outcomes. Without modeling such interactions, understanding and modeling of innovation in design would remain inade-quate. Since there appear to be fundamental limitations to the predictability of adoption behaviors under social influence, in order to advance the de-sign field, innovation strategies could fare better when they focus on the quality, novelty, and technological advances they could bring instead of being heavily guided by fragile collective behavior, social popularity and influence.
References
This work is partly supported by a grant from the US National Science Foundation, Grant No. CMMI-1404466 to the second author.
References
1. Bayazit, N. (2004). Investigating design: A review of forty years of de-sign research. Design issues, 20(1), 16-29.
2. Cross, N., 2008, Engineering design methods: strategies for product de-sign. John Wiley & Sons.
3. Dym, C and Brown, D, 2012, Engineering Design: Representation and Reasoning, Cambridge University Press
4. Badke-Schaub, P., Neumann, A., Lauche, K., & Mohammed, S., 2007, Mental models in design teams: a valid approach to performance in de-sign collaboration?. CoDesign, 3(1), 5-20.
5. Singh, V, Dong, A and Gero, JS, 2013, Social learning in design teams: The importance of direct and indirect communication , AIEDAM 27(2): 167-182.
6. Stempfle, J., & Badke-Schaub, P., 2002, Thinking in design teams- an analysis of team communication. Design studies, 23(5), 473-496.
7. Forbes, L. P., & Forbes, L. P., 2013, Does social media influence con-sumer buying behavior? An investigation of recommendations and pur-

Topology of social recommendations and dynamics of product adoption
chases. Journal of Business & Economics Research (JBER), 11(2), 107-112.
8. Solomon, M. R., Dahl, D. W., White, K., Zaichkowsky, J. L., & Polega-to, R., 2014, Consumer Behavior: Buying, Having, and Being. Upper Saddle River, NJ: Prentice Hall.
9. Salganik M J, Dodds P S, Watts D J, 2006, "Experimental study of inequality and unpredictability in an artificial cultural market" Science 311 854-856
10. Robertson M, Swan J, Newell S, 2007, "The Role of Networks In the Diffusion of Technological Innovation" Journal of Management Studies 33(3) 333-359
11. Bornholdt S, Rohlf T, 2000, "Topological Evolution of Dynamical Networks: Global Criticality from Local Dynamics" Physical Review Letters 84(26) 6114-6117
12. Gong P, Van-Leeuwen C, 2004, "Evolution to a small world network with chaotic units" Europhysics Letters 67(2) 328-333
13. Anderson L R, Holt C A, 1997, "Information Cascades in the Laboratory" American Economic Review 87(5) 847-862
14. Bikhchandani S, Hirshleifer D, Welch I, 1992, "A Theory of Fads, Fashion, Custom, and Cultural Change as Informational Cascades" Journal of Political Economy 100(5) 992-1026
15. Friedkin N E, Johnsen E C, 1999, "Social Influence Networks and Opinion Change" Advances in Group Processes 16 1-29
16. Kempe D, Kleinberg J, Tardos E, 2003, "Maximizing the Spread of Influence through a Social Network", in ACM SIGKDD, Knowledge Discovery and Data Mining Conference (ACM, Washington DC, USA)
17. Pan, R.K. and S. Sinha, Modularity produces small-world networks with dynamical time-scale separation. Europhysics Letters, 2009. 85(6): p. 68006.
18. Sarkar, S. and A. Dong, Community detection in graphs using Singular Value Decomposition. Physical Review E, 2011. 83(4): p. 046114.
19. Sarkar, S., et al., Spectral characterization of hierarchical modularity in product architectures. Journal of Mechanical Design, 2013. 136(1): p. 011006.
20. Sarkar, S., J.A. Henderson, and P.A. Robinson, Spectral characterization of hierarchical network modularity and limits of modularity detection. PLoS One, 2013. 8(1): p. e54383.
21. Barabasi A L, Albert R, 1999, "Emergence of Scaling in Random Networks" Science 286 509-512.