MANAGING URBAN TRAFFIC CONGESTION MANAGING URBAN TRAFFIC CONGESTION

The TomTom Manifesto – Reducing Congestion for All Big traffic data for smart mobility,
traffic planning and traffic management
Ralf-Peter Schäfer Fellow & VP Traffic and Travel Information Product Unit
1 Copyrights: TomTom Internaational BV 2015

2
A B
2

3

Traffic Flow Measurement Beginnings
4
Measurements and Modeling started in the 1930s
Greenshields, 1935

5
• Induction loops or infra-red
sensors • Measurement at cross-sections • Aggregated e.g. over 1 min • Flow and/or speed measurements • Infrastructural installation • Expensive maintenance
Measured Data from Stationary Detectors

Real-time Traffic: From Modeling to Measuring
6
Classical tools for observing traffic flow: Simulation and Data from Loop-Detectors
Simulated elementary traffic jam patterns:
Interpolated and smoothed data from loop detectors:

7
Change

Smart vehicles start exchanging data And they will change the way traffic is managed

Facebook Social Activity Graph (friend interactions)

A Driver Community of 400M users globally • ~10 billion measurement per day • ~13 trillion measurements since 2007
A Traffic Community of 350M users
10

Speeds Over Time (City, e.g. Berlin)
11
Sun Mon Tue Wed Thu Fri Sat
spee
d

Speed Frequencies Weekdays (City e.g. Berlin)
12
6 km/h 43 km/h
num
ber
of p
robe
s

13
Highway DE, A13 Direction Dresden

14
Highway (A13 Direction Dresden)
V km/h
hour

15
Highway A100 Berlin, Direction Junction “Funkturm” V km/h
hour

16
Construction Impact Berlin Hauptstr. Direction Treptower Park

Road Traffic Analytics
17
Traffic Index City performance analysis
Route Travel Times Area Analysis Segments Speeds in an area
Origin-Destination Relations between zones
Speed Profiles Speeds for navigation
Relative Probe Vehicle Flow Proxy for traffic density

IQ Routes Speed Profiles
18

19
Storage Requirements For Speed Profiles
The NL road network map: ~2 Mio. road stretches European map: ~50 Mio. stretches in the graph 50 Mio. Stretches X 7 weekdays X 24 hours X 12 (to gain a 5 minute resolution)
Difficult on sparse PND storage resources

20
Find n reference profiles out of m real speed measurement profiles
n: <100 m: 2-50 Mio. road stretches of a map graph

21
IQ Routes Historic Speed Profile - Example
A 13 Rotterdam -> Delft

22
Compression of speed profiles per road stretch
Each road stretch in the network graph holds a pointer to the best fitting reference profile (surrogate) for each weekday (7xInteger between {1..100}) Instead of a measurement matrix 7dx24hx12 (5 minute resolution) for each road stretch of the graph
• For each surogate profile (~100) 24h+12 data sets for the speed have
only be stored • Surrogate reference profiles are created in a training run on demand
• Done

TomTom Congestion Traveltime delays compared to free flow situation at night hours
23
http://www.tomtom.com/trafficindex

24
Traffc Index – Minniapolis/St Paul (1/2015)
26 May 2015

26
Route Analysis 2014

Selected link: links to links Selected link: zones to zones
A BA 30 5B 10 20
OD Matrix
Traffic Demand and Flow Analysis (Origin Destination)
Route choice

WHERE DO THE TRAFFIC COME FROM ?
28
Site owners want to know where customers come from that visit or pass by their location

29
IQ Routes
REAL-TIME TRAFFIC GPS PROBE DATA SOURCES

Traffic Incidents and Traffic Flow
• File contains information ONLY for the road stretches affected by incident/congestion
• Accurate delay, start and end location
• Current speed information on all relevant roads – both congested and freeflow
19 May 2015 6:52

Traffic Incidents and Traffic Flow
• File contains information ONLY for the road stretches affected by incident/congestion
• Accurate delay, start and end location
• Current speed information on all relevant roads – both congested and freeflow
19 May 2015 8:10
32
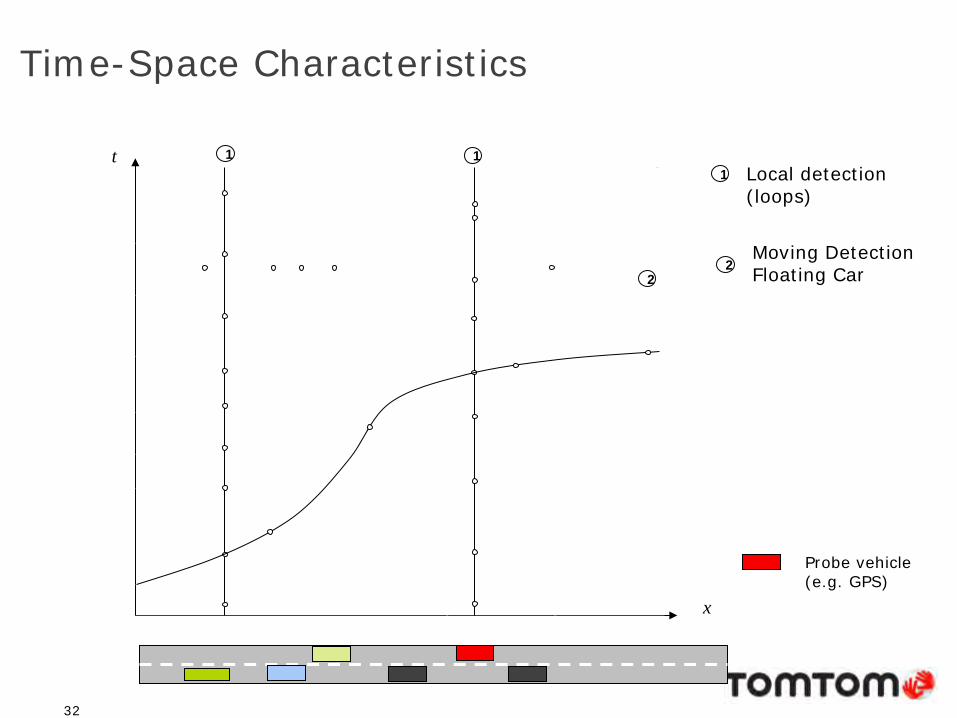
Time-Space Characteristics
t
x
4
Local detection (loops)
Moving Detection Floating Car
1 1
2
1
2
Probe vehicle (e.g. GPS)
33
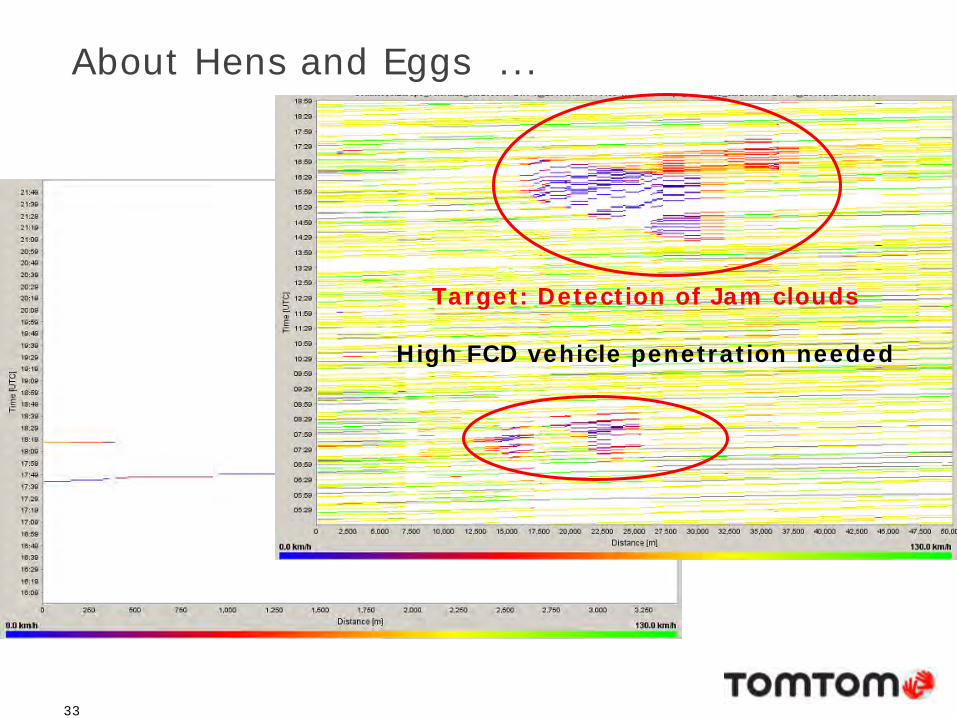
About Hens and Eggs ...
Target: Detection of Jam clouds
High FCD vehicle penetration needed

Probe Data as the Input Source
34
Equipment percentage and traffic flow determine data density
Data amount grew expontially
Avg. Interval
100/h 500/h 1000/h 2000/h 5000/h
0.1% 600 min 120 min 60 min 30 min 12 min 1% 60 min 12 min 6 min 3 min 1.2 min 10% 10 min 1.2 min 0.6 min 1.2 min 0.12 min

Real-time Traffic
35
Highly granular traffic based on GPS probe data
• GPS data allows traffic observation everywhere
• Independent from stationary devices
• High Sampling rate

Static Location Referencing TMC (Traffic Message Channel) Data Compression and map independency
A
B
12345 (TomTom map ID)
12346
12349
12362
12675
Positive direction
TMC link ID 09876
Offset of +200 m from start of link
Offset of -150 m from end of link
X
Incident Description
• TMC link ID • Positive or negative
direction on road • Offset from start of link • Offset from end of link Example: • TMC ID = 09876 • Positive direction • + 200m from start • - 150m from end
12348

TMC vs Dynamic Location referencing with OpenLR™
TMC OpenLR addressable roads
Coverage increase with OpenLR™ in London urban area Compared to TMC • OpenLR covers the whole network
• OpenLR works using different maps for encoding and decoding
• Open Source and royalty free
• Compact and on-the fly processing (no pre-compilation with the map)

38
OpenLR Location Referencing
Encoder • Lat, long • FRC • FOW • Bearing • length
Decoder • Lat, long • FRC • FOW • Bearing • length
Location reference Lo
cation
Location
111100011 000110110 011000111 100111001
111100011 000110110 011000111 100111001
Sender map Receiver map

39
Queue End Warnings
Traffic Flow and jam prediction
Automatic road closure detection on
lower FRCs HOV lane handler
Automatic road work detection
TomTom Traffic

Queue End Warnings Detection of queue ends for a safety warning in the navigation unit
• Over 35% of drivers have admitted to experiencing an accident caused by sudden or unexpected traffic holdups
• Jam ahead warning messages in traffic output can be used to create these safety messages with great accuracy
40

41
Impacts of Weather on Traffic
● Road network capacity changes ● Head way distance increases,
driver behaviour
● Demand changes
● Average speed reduction
● ETA diviation
● Extreme situations/danger
● Icy roads, snow, heavy rain, sand storm

42
Moreover...
~30% of severe accidents are caused by critical weather!

Traffic and Weather Snow & delay impact

Weather related traffic information (device)
44
• Bad weather that impacts traffic such as heavy rain, snow or hail is displayed by using weather data in our fusion engine
• Weather information will be used for improving traffic prediction

Connected, Smarter Car – TomTom components offer a seamless experience
45
Navigation Portal
Companion App NavKit & NavApp

ADAS features gradually realize the HAD vision
46
Level 1
Level 2
Level 3
Level 4
Level 5
Anti-lock Braking System
Level 0
Level 1
Level 2
Level 3
Level 4
Level 5
Adaptive Cruise Control
Park Assist
Traffic Jam Chauffeur
Highway Pilot
Full Automation
Examples

TomTom enables HAD cars to see beyond their sensors
47
Connected Services Advanced Traffic
Advanced Weather
…
Real-Time Maps 3D Lane Model
Behavioral Data
…
Software Components Positioning
eHorizon
…

48
The TomTom Traffic Manifesto
If 10% of the road drivers use HD Traffic guided navigation in conurbations there is a
1. Individual journey time reduction for informed users by up to 15%
2. A collective journey time reduction for ALL by up to 5%
http://www.tomtom.com/trafficmanifesto

49
10% 10%
How to estimate the journey time reduction claims in the TomTom Manifesto? • Use of traffic modelling and simulation in a simplified road network • Assume a share of equipped navigation users (e.g. traffic guided
drivers) • Assume high acceptance rate for detour choices when approaching a
traffic jam! • Results from simulation below for medium and high traffic flow
Source: F. Leurent, T. Nguyen, TRB 2010.

The (future) Collective Traffic Management Challenge Load balanced vs unbalanced routing system using dynamic route guidance
vs.

Construction Management Mobile VMS for Travel time Display
Seestrasse in Zürich, Schweiz Usage of Flow Data for two routes towards Zürich. Data gets updated every 30 seconds The main route faces delays due to construction works By using Flow data and adding the traveltimes of the relevant segments together a accurate travel time is calculated This travel time is displayed on the VMS sign and gets updated every 5 minutes.

Junction Analyzer Statistics about junction delays
Analyze the performance of a intersection Compare before with after a intersection upgrade Rank the performance of a (set of) intersection (KPI’s) Output information about: • travel time ratio • total delay time • delay per junction • stops per junction • duration per stop • number of
measurements • intersection ranking

Educated Guess 1st – Probe Data Source?
53

Educated Guess 2nd – Probe Data Source?
54