The Timeliness of Write-downs by U.S. Financial …krish/vyas.pdf1 The Timeliness of Write-downs by...
54
The Timeliness of Write-downs by U.S. Financial Institutions during the Financial Crisis of 2007-2008* DUSHYANTKUMAR VYAS Rotman School of Management University of Toronto [email protected] December, 2009 ABSTRACT This study examines the timeliness of write-downs taken by U.S. financial institutions during the current financial crisis. The timeliness of write-downs is measured by benchmarking the quarterly accounting write-down schedule with the devaluation schedule implied by credit indices such as the ABX. The results show that accounting write-downs are less timely than the devaluations implied by credit indices. In a cross-sectional analysis of the determinants of the timeliness of write-downs, I document that higher corporate governance quality is positively related to timelier write-downs. Furthermore, I observe that regulatory investigations and litigation pressure are positively related to the timeliness of write-downs, whereas the write- downs by firms with more complex exposures and higher financial leverage are less timely. Regarding the consequences of timeliness, this study finds that the exposure to risky assets is reflected faster in stock returns for firms with timelier write-downs. *This paper is based on my dissertation at the Rotman School of Management, University of Toronto. A prior version of this paper was entitled ―Financial Reporting Transparency of U.S. Financial Institutions during the Current Economic Crisis.‖ I thank the members of my dissertation committee: Jeffrey Callen (Co-Supervisor), Gordon Richardson (Co-Supervisor), Alan White, and Franco Wong. I also thank Gauri Bhat, Francesco Bova, Gus De Franco, Ole-Kristian Hope, Lew Johnson, Stephannie Larocque, Alastair Lawrence, Hai Lu, Matt Lyle, Hamed Mahmudi, Miguel Minutti, Steve Ryan, Regina Wittenberg-Moerman, Baohua Xin, and workshop participants at the AAA-FARS meeting (San Diego), and the University of Toronto for their helpful suggestions.
Transcript of The Timeliness of Write-downs by U.S. Financial …krish/vyas.pdf1 The Timeliness of Write-downs by...

The Timeliness of Write-downs by U.S. Financial Institutions during the
Financial Crisis of 2007-2008*
DUSHYANTKUMAR VYAS
Rotman School of Management
University of Toronto
December, 2009
ABSTRACT
This study examines the timeliness of write-downs taken by U.S. financial institutions during the
current financial crisis. The timeliness of write-downs is measured by benchmarking the
quarterly accounting write-down schedule with the devaluation schedule implied by credit
indices such as the ABX. The results show that accounting write-downs are less timely than the
devaluations implied by credit indices. In a cross-sectional analysis of the determinants of the
timeliness of write-downs, I document that higher corporate governance quality is positively
related to timelier write-downs. Furthermore, I observe that regulatory investigations and
litigation pressure are positively related to the timeliness of write-downs, whereas the write-
downs by firms with more complex exposures and higher financial leverage are less timely.
Regarding the consequences of timeliness, this study finds that the exposure to risky assets is
reflected faster in stock returns for firms with timelier write-downs.
*This paper is based on my dissertation at the Rotman School of Management, University of Toronto. A prior
version of this paper was entitled ―Financial Reporting Transparency of U.S. Financial Institutions during the
Current Economic Crisis.‖ I thank the members of my dissertation committee: Jeffrey Callen (Co-Supervisor),
Gordon Richardson (Co-Supervisor), Alan White, and Franco Wong. I also thank Gauri Bhat, Francesco Bova, Gus
De Franco, Ole-Kristian Hope, Lew Johnson, Stephannie Larocque, Alastair Lawrence, Hai Lu, Matt Lyle, Hamed
Mahmudi, Miguel Minutti, Steve Ryan, Regina Wittenberg-Moerman, Baohua Xin, and workshop participants at the
AAA-FARS meeting (San Diego), and the University of Toronto for their helpful suggestions.
1
The Timeliness of Write-downs by U.S Financial Institutions during the Financial Crisis of
2007-2008
1. Introduction
The subprime crisis that began in February 2007 has evolved into a full-blown financial
crisis, and continues to rattle the global financial system. Problems in the U.S. subprime
mortgage loans sector have developed into a wide-spread credit crunch that spans various asset
markets throughout the world — making this the worst economic crisis since the Great
Depression of the 1930s. Prior to the crisis, financial institutions took on large exposures to
subprime mortgage-backed assets and other complex structured finance instruments, and
undertook billions of dollars worth of write-downs as the risks unraveled during 2007 and 2008.
Given the extent and complexity of these exposures, transparent financial reporting can
help the various stakeholders of financial institutions understand the risks associated with these
exposures. Transparent financial reporting involves timely asset write-downs as the losses
become apparent to institutions. However, if for the time period studied, the incentives of
managers and shareholders are not aligned, or corporate governance quality is inadequate (as
argued by Bicksler 2008, Borio 2008, Strebel 2008, Hull 2009, and Kirkpatrick 2009), then one
would expect, given agency theory, to observe an opportunistic lack of timeliness in the write-
downs taken by financial institutions. Managers who took on exposure to risky instruments
would be motivated to conceal these risks to avoid potential labor and capital market penalties,
despite the demand for transparency by shareholders. Indeed, as the crisis evolved, a plethora of
shareholder lawsuits were filed against financial institutions alleging that, inter alia, the write-
downs of subprime and structured finance exposures were not timely enough.
In this study, the timeliness of write-downs is measured as the difference between the
cumulative quarterly accounting write-downs taken by the financial institutions in the sample
2
and the write-downs implied by credit indices (such as the ABX, CMBX and LCDX indices
constructed by Markit Partners).1 I find that the quarterly accounting write-downs lagged the
write-down schedule implied by the credit indices. This result reflects inadequate financial
reporting transparency by financial institutions during the crisis. Among other things, this lack of
timeliness could be a manifestation of ineffective corporate governance. I explore this argument
further by examining the cross-sectional determinants of the timeliness of write-downs.
Consistent with my predictions, I find that corporate governance quality is positively related to
the timeliness of write-downs. Further, I document that firms with exposure to regulatory
investigations and credit-crisis-related litigation take more timely write-downs, while firms with
greater financial leverage and more complex exposures are less timely in their write-downs.
These results highlight the role of internal and external oversight mechanisms, financing
constraints, and litigation pressure in influencing the loss recognition policies of financial
institutions during the crisis.
My primary capital market result is that the differences between the cumulative quarterly
accounting write-downs and the write-downs implied by the credit indices are informative in
explaining the cumulative quarterly stock returns during 2007 and 2008. Specifically, I find that
the stock market reflects risk exposure faster for firms with timelier write-downs (i.e., for firms
with write-down schedules that are closer to the schedule implied by the credit indices). These
results are robust to incorporating additional indices for specific asset classes (e.g., using the
TABX index as a reference for CDOs).
Such a result is far from tautological: critics of those who would use credit indices such
as the ABX as a ―Level 2‖ market observable to guide what would otherwise be ―Level 3‖ fair
1 Market participants such as Citigroup, UBS, and Morgan Stanley have cited the use of indices such as the ABX as
an input for their write-downs. See ―A subprime gauge in many ways?‖ The Wall Street Journal, Dec 12, 2007.

3
value write-downs claim that: a) these indices are an unreliable guide to fair value write-downs
due to a lack of liquidity in the trading of these indices, and b) these indices are not
representative of the exact exposures faced by a particular financial institution (Fender and
Scheicher 2008, Stanton and Wallace 2009).2 These claims imply the null of my hypothesis: if
the credit indices are unreliable, then the differences between the cumulative quarterly
accounting write-downs and the index-implied write-downs should be un-informative in
explaining the temporal pattern of firm stock returns over the eight quarters of 2007 and 2008
examined in this study.
My rejection of the null in favor of the usefulness of my measure for the timeliness of
write-downs lends support to the argument that credit indices such as the ABX provide a useful
check for firms to benchmark their losses on risky exposures during the crisis. This finding is
consistent with the claim made by the American Institute of Certified Public Accountants’
Centre for Audit Quality (2007) that indices such as the ABX are useful as ―Level 2‖ inputs for
firms that are fair-valuing illiquid subprime mortgage-backed assets and other structured finance
instruments.
In additional analyses, I examine the footnotes and MD&A disclosures from fiscal 2006
annual reports. Using a disclosure index, I show that for firms that are ex ante more transparent
about their exposure to risky assets, the stock market reflects risk exposure on a timelier basis. In
other words, financial institutions that provide timelier information about their risk positions
enable their investors to ―mark down‖ these positions on a timelier basis. This research suggests
that financial institutions that provide investors with better information about their risk positions
and losses may be able to prevent managers ex ante from taking excessive exposure to risky
positions that are not in the shareholder interest (e.g., Laux and Leuz 2009b).
2 See also, ―Valuing securities: Don’t mark to Markit.‖ The Economist, March 6, 2008.
4
The next section develops my hypotheses. Section 3 describes the data and sample.
Section 4 explains the measurement of the key variables. Section 5 discusses the empirical tests
and results. Section 6 concludes.
2. Hypotheses Development
2.1. Lack of Timeliness in Write-downs taken by Financial Institutions
Background
A key feature of the current crisis is that financial institutions amassed large exposures to
risky subprime and structured finance instruments, and took large accounting write-downs when
the losses on these exposures became apparent during 2007 and 2008. These write-downs are a
result of the application of impairment or fair value accounting. Accounting standards such as
the Statement of Financial Accounting Standards (SFAS) 157 emphasize the use of market-based
measures in arriving at fair value estimates of financial instruments. During the crisis, however,
the markets for structured finance securities dried up. It became difficult for firms to observe
direct market quotes (―Level 1‖ estimates) for these securities. As a result, financial institutions,
to varying degrees, had to rely upon other market observables (―Level 2‖ estimates), including
credit indices such as the ABX. As the crisis progressed, these indices crashed — leading many
to argue that the prices of these indices reflected market fear and panic rather than ―real‖ credit
losses, and that fair value accounting that relied on these market observables was producing asset
valuation estimates that were substantially lower than the ―true‖ fundamental values (see Laux
and Leuz 2009a, 2009b for a detailed account of this debate).
Concurrently, a number of shareholder lawsuits were launched against institutions
affected by the crisis. Among other things, these lawsuits alleged that the accounting write-
downs taken by financial institutions were insufficiently timely compared with the devaluations

5
implied by credit indices such as the ABX. For example, in a summary article on subprime
litigation trends, Dickey, King, and Shih (2008) argue that:
―In most of the cases filed to date, in one form or another, plaintiffs’ counsel
challenges the integrity of the issuer’s financial statements. At its core, the
accounting issue is whether the issuer used appropriate methodologies to establish
the ―fair value‖ of the securities or instruments under the relevant provisions of
GAAP, and whether it failed to take impairment charges or other write-downs on
a timely basis.‖
Predictions based on Agency Theory
I empirically examine the timeliness of write-downs (or lack thereof) during the crisis by
appealing to agency theory, which predicts that managers might not always act in the best
interests of shareholders, and that they can make sub-optimal or self-maximizing decisions
(Jensen and Meckling 1976). In a world where the interests of managers and shareholders are
perfectly aligned and corporate governance is effective, there should be no reason to expect a
delay in informing the shareholders about exposure to risky assets. In such a perfect scenario,
managers would not have an incentive to conceal the losses when they become apparent, and
would undertake timely asset write-downs. However, if the incentive structures prevalent in
financial institutions create a wedge between the interests of managers and shareholders, and
corporate governance quality is inadequate, then one would expect to observe opportunism in the
timeliness with which impaired or non-performing assets are written down by financial
institutions.
In a particularly prescient article, Rajan (2006) argues that the incentive structures of
investment and bank managers in the period leading up to the crisis induced them to take on risk
— particularly risk that was concealed from investors. Consistent with Rajan’s assertion,
financial institutions took on large exposures to risky, highly complex, and opaque financial

6
instruments.3 More generally, the literature in financial accounting documents that agency costs
affect the financial reporting practices of managers. For example, Healy (1985) documents that
executives manage earnings to maximize bonus payments. Recent studies on segment disclosures
document that managers face agency costs of disclosure and opportunistically conceal negative
segment information (Berger and Hann 2007, Hope and Thomas 2008). As Berger and Hann
(2007) argue, if greater transparency reveals information about the extent of value-destruction at
a firm, managers might have an incentive to conceal that information. In another context, Ali,
Chen, and Radhakrishnan (2007) argue that family firms face lower compensation-related
agency costs, and as a result, have better financial reporting quality. Relevant to my study, Ali et
al. present evidence that firms with lower agency costs (family firms in their context) are more
likely to warn investors about bad news.
This incentive for concealment can be curtailed by effective corporate governance. In the
wake of the Enron accounting scandal, regulators and policy makers have been wary of corporate
financial reporting practices and have advocated stronger corporate governance mechanisms to
increase financial reporting quality. For example, the Sarbanes-Oxley Act is intended, at least in
part, to enhance the role of corporate governance in improving the quality of financial reporting
(Hutton 2007). Similarly, international accounting and finance research has documented that
better corporate governance is related to higher quality disclosure and greater transparency (Ball,
Robin and Wu 2003, Bushman, Piotroski and Smith 2004, Khanna, Palepu and Srinivasan 2004).
At the firm-level, Ajinkya, Bhojraj and Sengupta (2005) find that better governed firms (with
more outside directors and director ownership) are more likely to issue management forecasts.
Further, firms with better governance issue more frequent and more accurate forecasts. Similarly,
3 In Appendix 3, I provide some corroborative evidence on the existence of incentive-related problems during the
crisis by demonstrating that excess CEO compensation is positively related to the extent of exposure to risky assets.
7
Karamanou and Vafaes (2005) find that firms with more effective board and audit committee
structures are more likely to make or update earnings forecasts, and issue more accurate
forecasts. In the context of the current crisis, however, it has been argued that corporate
governance mechanisms in financial institutions were ineffective (Strebel 2008, Bicksler 2008).
The discussion above indicates that inadequate corporate governance in financial
institutions during the crisis could be related to the timeliness with which the institutions took
their write-downs. 4
I predict that firms with better corporate governance quality will be timelier
in their write-downs. As stated earlier, I measure the timeliness of write-downs by benchmarking
the quarterly accounting write-down schedule with the devaluation schedule implied by credit
indices such as the ABX. Based on the above discussion, my first set of hypotheses (in alternate
form) is as follows:
H1(a): The quarterly accounting write-downs by financial institutions were less timely
than the devaluations implied by the credit indices.
H1(b): Ceteris paribus, corporate governance quality is positively related to the
timeliness of write-downs.
2.2. Consequences of Lack of Timeliness
While academic accounting and finance literature has long focused on the relation
between financial reporting transparency and the cost of capital, this crisis points us more
specifically towards the role of financial reporting in revealing value-relevant cash flow
information concerning potential asset impairment. Thus, the relevant construct for my study is
the timeliness with which the capital markets are able to adjust for potential impairment losses. A
number of academic studies in finance and accounting examine the timeliness of stock-price
4 There are other potential reasons why accounting write-downs could be less timely than the index-implied
devaluations, such as the argument that the payoff structures of complex structured securities are non-linear, while
accounting practices are often linear and additive.

8
adjustments to information in different settings.5 I focus on the role of timely write-downs in
informing capital markets about a firm’s risk positions, and thereby enabling timelier price
adjustments to the firm’s exposure to risky assets.
Given concerns about asset quality, the crisis has led to a general decline in the stock
prices of many financial institutions. To the extent that the stock price decline during the crisis is
due to poor asset quality, it should be related to a shift in the market’s expectations about
exposure to risky assets. The timelier the write-downs, the more informed the capital markets
would be about risk exposure, and consequently, the stock price should adjust faster to the
potential losses that stem from these exposures. In other words, the market is able to ―mark
down‖ the firm’s risky exposures faster. Note that eventually, over 2007 and 2008, a
considerable extent of these losses is recognized through write-downs. I predict that more timely
write-downs will help the market adjust for potential losses on a timelier basis since the total
credit value at risk becomes evident earlier.6 This prediction implies that at any given point in
time, the stock market reflects firms’ exposure to risky assets more accurately for firms with
timelier write-downs.7
Anecdotal evidence supports my prediction about the relation between the timeliness of
write-downs and timely capital market refection of risk exposure. Consider the case of Lehman
Brothers. On March 18, 2008, Lehman Brothers reported a positive earnings surprise of $0.09
/share for the first quarter of 2008.8 Given the magnitude of the impending crisis, Lehman’s
5 See for example, Ball and Brown (1968), Fama, Fischer, Jensen and Roll (1969), Alford, Jones, Leftwich and
Zmijewski (1993), Kasznik and Lev (1995), Hou and Moskowitz (2005), Butler, Kraft and Weiss (2007), Bushman,
Smith and Wittenberg-Moerman (2008), and Callen, Khan and Lu (2009). 6 As will be evident in the empirical tests section, timelier capital market reflection of risk exposure entails a more
negative cumulative stock market return (for a given dollar amount of write-downs) for any interim period during
2007 and 2008. 7 This prediction requires the assumption that the stock-market is semi-strong form efficient. That is, stock prices
should reflect publicly available information, but not information privately held by managers. 8 ―Lehman Brothers stronger than feared.‖ The Guardian, March 18, 2008.

9
write-down at the end of first quarter 2008 was clearly insufficient.9 In fact, Lehman’s subprime-
related problems were so extensive that it filed for bankruptcy on September 15, 2008. Despite
Lehman’s deficient transparency, the stock market generously rewarded its positive earnings
surprise. On the announcement date, Lehman’s stock price jumped 46.4 percent from
$31.37/share to $45.93/share. In other words, consistent with semi-strong-form market
efficiency, Lehman’s lack of transparency delayed its stock price decline. Given the discussion
above, Hypothesis 2 (in alternate form) is:
H2: The stock market reflects exposure to risky assets on a timelier basis for firms with
timelier write-downs.
The prediction in Hypothesis 2 is far from obvious. Credit indices such as the ABX have
been used by market participants (such as Citigroup, Morgan Stanley and UBS) to mark down
the values of their structured products during the crisis.10
However, as the values of these indices
kept plummeting during the crisis, some participants argued that the index price levels were
merely reflecting panic in the markets, and that their positions were being marked too low.
Critics argued that credit indices such as the ABX are an unreliable guide to fair value write-
downs because: a) there is a lack of liquidity in the trading of these indices, and b) these indices
are not representative of the exact exposures faced by a particular institution (Fender and
Scheicher 2008, Stanton and Wallace 2009).11
If the stock market views the asset valuation
linked to credit indices as uninformative, then it would imply the null of Hypothesis 2.
3. Data and Sample
9 Lehman’s ―timeliness of write-down‖ score (explained later) at the end of the first quarter of 2008 was −0.46
compared to an average score of −0.36 for the sample of 68 financial firms at the end of first quarter 2008. In terms
of ranking based on this score, Lehman’s timeliness rank was 44th
out of 68. 10
See for example, ―A subprime gauge in many ways?‖ The Wall Street Journal, December 12, 2007. 11
See also ―Valuing securities: Don’t mark to Markit.‖ The Economist, March 6, 2008.

10
The current crisis has most severely affected financial institutions; hence, I limit my
sample to those institutions. The sample is obtained from Bloomberg,12
which provides an
ongoing updated list of financial institutions that have undertaken accounting write-downs of
subprime-related and structured finance exposures from 2007 onwards. The sample includes
bank holding companies, insurance companies, investment banks, and government sponsored
enterprises (GSEs) such as Freddie Mac and Fannie Mae. From this Bloomberg list, I collect
quarterly accounting write-down data for 68 U.S. financial institutions. Appendix 1 provides
details of the categories of write-downs by exposure type. These write-downs encompass losses
pertaining to a wide range of exposures, including subprime mortgages, structured finance
instruments, leveraged loans, and exposure to monoline insurance companies, among others.
I measure the governance and incentive variables at the end of fiscal 2006. Write-downs
and stock returns are measured over 2007 and 2008. The limited availability of corporate
governance index data reduces the number of observations available for the multivariate
analyses. Panel A of Table 1 summarizes the various sources of data used in this study. Panel B
of Table 1 provides the definitions of selected variables, while Panel C provides a break-down of
the sample by institution type. The measurement of key variables is discussed in the next section.
4. Measurement of Key Variables
4.1. Timeliness of Write-downs
One of the channels through which the inherent risk in subprime-related assets became
apparent is the ABX.HE index (―ABX‖). Since its launch by Markit Partners in January 2006,
the ABX has become a barometer of the health of subprime mortgage-backed assets, and it
12
The Bloomberg WDCI functionality is extremely popular among practitioners monitoring the current crisis. See
for example, ―Counting write-downs replaces deals won as Wall Street's ritual.‖ Bloomberg.com, September 2,
2008.
11
serves as a key benchmark of the market for securities backed by home loans issued to borrowers
with weak credit (Gorton 2008). In simple terms, the ABX is series of indices of credit default
swaps written on subprime residential mortgage-backed securities of various credit qualities.13
To the extent that the index price changes are indicative of changes in the perceived credit risk of
the underlying mortgage-backed securities (―MBS‖), a decline in the price of the index implies
the impairment of securities that are similar to, or belong to the same asset class as, the securities
underlying the index.
Some of the criticisms of the use of credit indices such as the ABX are that trading in
indexed derivative markets is not liquid enough, and that these indices are not representative of
the securities being marked (Stanton and Wallace 2009, Fender and Scheicher 2008). These
criticisms, however, are potentially muted for the approach followed in this study. As explained
in greater detail below, I do not benchmark the absolute dollar amounts of quarterly write-downs,
but rather the cumulative quarterly write-down as a percentage of total write-downs over 2007
and 2008. In other words, I compare the temporal distribution of accounting write-downs to the
temporal distribution of the index-implied write-downs. Further, the aim of this study is to
analyze cross-sectional differences in the timeliness of write-downs measured in the manner
described below, and not to look at any single firm in isolation. Thus, my study merely assumes
that transparent firms use inputs that are correlated with the credit indices in their valuation
exercise.
13
Specifically, each ABX series consists of a group of equally-weighted, static portfolios of CDSs referencing 20
subprime MBS transactions. There are four major series currently in use — 2006-01, 2006-02, 2007-01 and 2007-
02. Each series references twenty new subprime MBS deals issued during the six-month period prior to index
initiation. Each index series, consists of five sub-indices, each referencing different tranche levels (AAA, AA, A,
BBB, and BBB–) of the same 20 underlying MBS deals. Index prices reflect investors’ willingness to buy or sell
protection on the basis of their views of the risk of the underlying subprime loans; these prices are quoted as a
percentage of par.

12
In addition, these indices were and continue to be widely used by market participants.
Notably, the ABX index is probably the only aggregated view on the value of subprime assets
available to managers and investors alike (Gorton 2008). Further, there is ample anecdotal
evidence to suggest that firms used the ABX for marking losses on subprime asset positions.14
Thus, I argue that the market indicators (in this case, the credit indices) can be used by firms as
top-down checks for recording asset impairment losses. Also, while I consider the benchmarking
of asset write-downs against these indices to be an innovation of my study, the general idea is
consistent with Ryan (2008), who considers the lead-lag relation between ABX indices and
write-downs as an issue worthy of investigation by researchers.
While the devaluation factors constructed using the ABX are reasonable proxies for
implied losses on subprime-backed assets such as Residential Mortgage-Backed Securities
(RMBS) and subprime-referenced Collateralized Debt Obligations (CDOs), other indices are
more suitable for marking non-subprime-referenced assets that underwent significant devaluation
during the crisis. In particular, I use the spreads on the CMBX index to imply impairments for
commercial real-estate-backed assets, and the LCDX index for marking down exposures
referenced to leveraged commercial loans (such as collateralized loan obligations). In sensitivity
analyses, I expand the list of benchmark indices to include separate indices for CDOs and
unspecified mortgage loans. The expanded list is provided in Appendix 1 alongside the main list.
Further, since it is not possible to deconstruct the exact exposure of each financial institution to
either of the tranches (such as BBB or AAA), I use the average price (spread) across all the
tranches for the ABX and the CMBX indices, and across all available versions at a given point in
time. However, the results of my study are unaltered if only the BBB and BBB- tranches are
14
See for example, ―A subprime gauge in many ways?‖ The Wall Street Journal, December 12, 2007.
13
used for these indices. For the CMBX, which does not have readily available prices during my
sample period, I use spreads as an inverse proxy for prices.
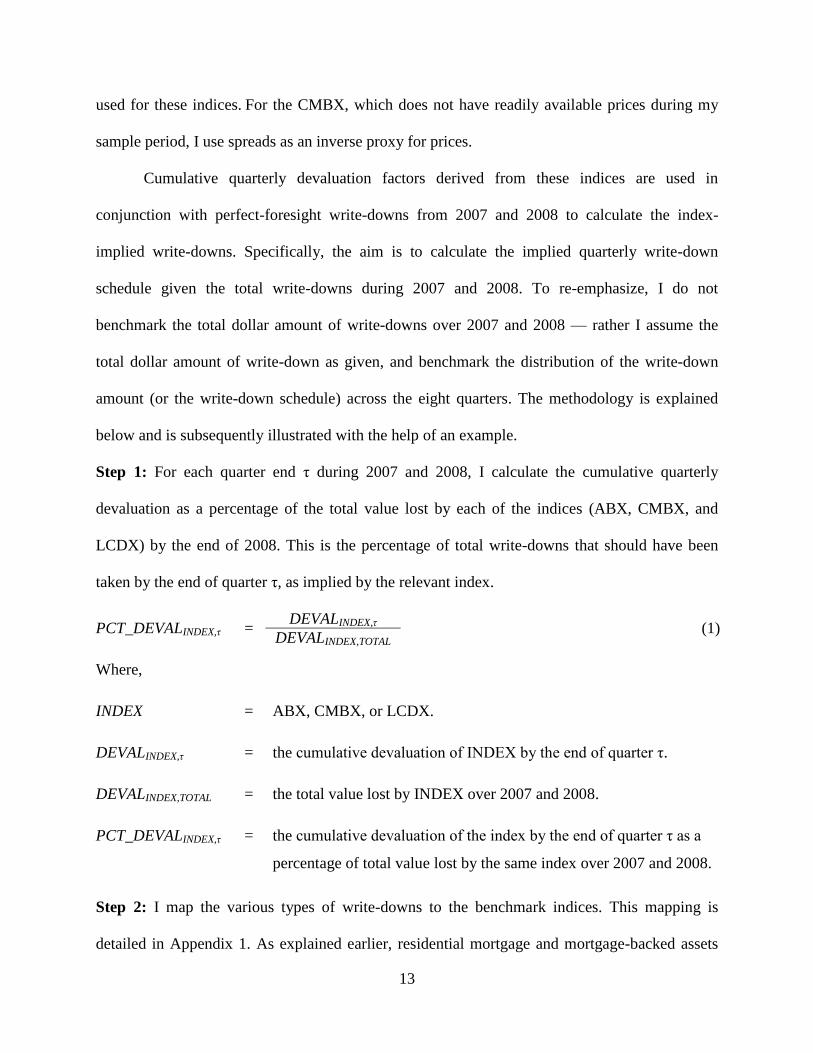
Cumulative quarterly devaluation factors derived from these indices are used in
conjunction with perfect-foresight write-downs from 2007 and 2008 to calculate the index-
implied write-downs. Specifically, the aim is to calculate the implied quarterly write-down
schedule given the total write-downs during 2007 and 2008. To re-emphasize, I do not
benchmark the total dollar amount of write-downs over 2007 and 2008 — rather I assume the
total dollar amount of write-down as given, and benchmark the distribution of the write-down
amount (or the write-down schedule) across the eight quarters. The methodology is explained
below and is subsequently illustrated with the help of an example.
Step 1: For each quarter end τ during 2007 and 2008, I calculate the cumulative quarterly
devaluation as a percentage of the total value lost by each of the indices (ABX, CMBX, and
LCDX) by the end of 2008. This is the percentage of total write-downs that should have been
taken by the end of quarter τ, as implied by the relevant index.
PCT_DEVALINDEX,τ = DEVALINDEX,τ
(1) DEVALINDEX,TOTAL
Where,
INDEX = ABX, CMBX, or LCDX.
DEVALINDEX,τ = the cumulative devaluation of INDEX by the end of quarter τ.
DEVALINDEX,TOTAL = the total value lost by INDEX over 2007 and 2008.
PCT_DEVALINDEX,τ = the cumulative devaluation of the index by the end of quarter τ as a
percentage of total value lost by the same index over 2007 and 2008.
Step 2: I map the various types of write-downs to the benchmark indices. This mapping is
detailed in Appendix 1. As explained earlier, residential mortgage and mortgage-backed assets

14
are benchmarked to the ABX index, while commercial mortgage-backed assets and assets
backed by leveraged commercial loans are benchmarked to the CMBX and LCDX indices
respectively. One caveat of this mapping is that I use the ABX devaluation schedule to
benchmark the write-down schedules of all residential mortgage-backed securities. The use of
ABX is reasonable if it is assumed that the impairment of residential mortgage securities other
than subprime are positively related to the impairment of subprime mortgage-backed securities.
Hence, even though the ABX is not a perfect benchmark for the write-downs of non-subprime
mortgage securities, I consider it to be a reasonable proxy for the quarterly write-down schedule
(the proportion of total write-down taken in each quarter). However, in additional analyses
(Section 5.4), I use an additional benchmark for unspecified mortgage loans — the Barclays
Home Equity Price Index.
Step 3: Cumulative quarterly write-downs for each firm implied by each of the indices are
calculated as:
INDEX-implied cumulative quarterly write-down = (Percentage quarterly INDEX devaluation) ×
(Total write-down benchmarked to INDEX)
WDINDEX,τ = PCT_DEVALINDEX,τ × WDTOT_INDEX (2)
Where,
WDINDEX,τ = the cumulative write-down implied by INDEX at end of quarter τ.
WDTOT_INDEX = the total write-down during 2007 and 2008 benchmarked to INDEX.
Step 4: For those write-down categories that are not benchmarked against any of the indices
above, I use the average write-down schedule of all firms in the sample as a benchmark. Thus,
for each firm, the implied ―other‖ write-down is computed as follows:
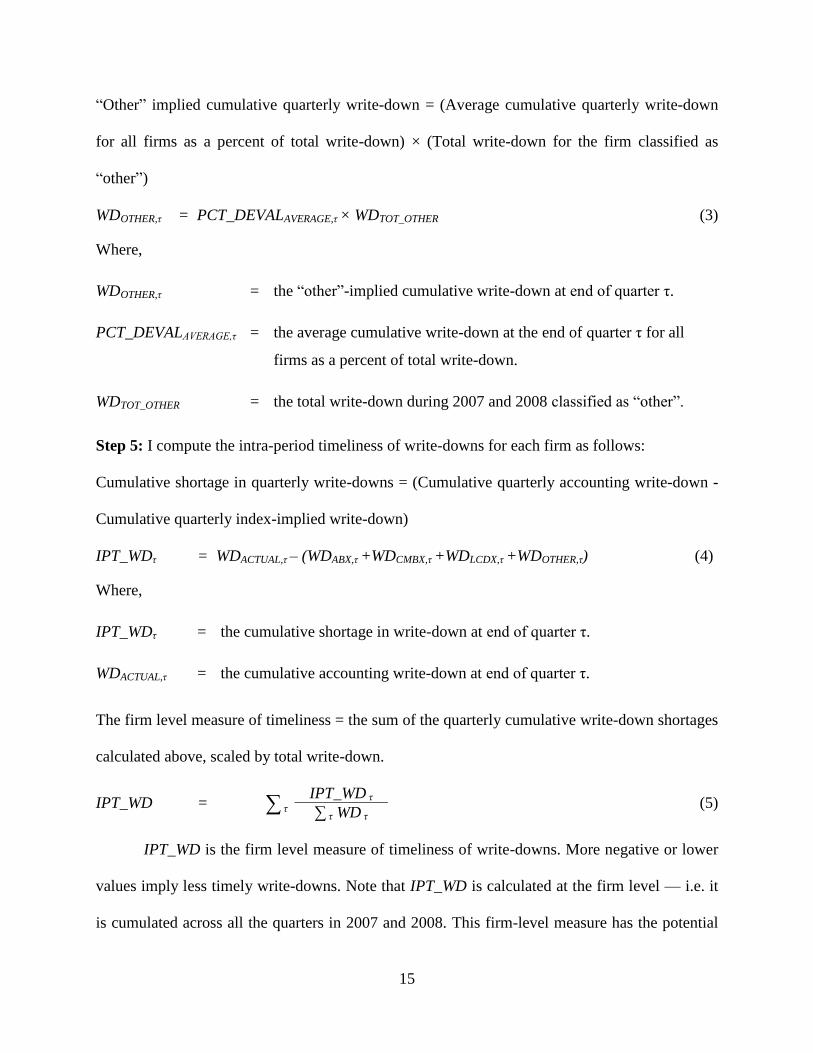
15
―Other‖ implied cumulative quarterly write-down = (Average cumulative quarterly write-down
for all firms as a percent of total write-down) × (Total write-down for the firm classified as
―other‖)
WDOTHER,τ = PCT_DEVALAVERAGE,τ × WDTOT_OTHER (3)
Where,
WDOTHER,τ = the ―other‖-implied cumulative write-down at end of quarter τ.
PCT_DEVALAVERAGE,τ = the average cumulative write-down at the end of quarter τ for all
firms as a percent of total write-down.
WDTOT_OTHER = the total write-down during 2007 and 2008 classified as ―other‖.
Step 5: I compute the intra-period timeliness of write-downs for each firm as follows:
Cumulative shortage in quarterly write-downs = (Cumulative quarterly accounting write-down -
Cumulative quarterly index-implied write-down)
IPT_WDτ = WDACTUAL,τ – (WDABX,τ +WDCMBX,τ +WDLCDX,τ +WDOTHER,τ) (4)
Where,
IPT_WDτ = the cumulative shortage in write-down at end of quarter τ.
WDACTUAL,τ = the cumulative accounting write-down at end of quarter τ.
The firm level measure of timeliness = the sum of the quarterly cumulative write-down shortages
calculated above, scaled by total write-down.
IPT_WD = ∑ τ IPT_WD τ
(5) ∑ τ WD τ
IPT_WD is the firm level measure of timeliness of write-downs. More negative or lower
values imply less timely write-downs. Note that IPT_WD is calculated at the firm level — i.e. it
is cumulated across all the quarters in 2007 and 2008. This firm-level measure has the potential
16
to give rise to a ―look-ahead bias.‖ Hence, in sensitivity analyses, I also consider an alternate
measure at the firm-quarter level.
IPT_QTR τ = IPT_WD τ
(6) ∑ τ WD τ
Where, IPT_QTR is the firm-quarter level measure of timeliness of write-downs.
Illustration: The methodology for calculating the timeliness of write-downs is explained below
with the help of an example. Consider a hypothetical firm that has exposure only to subprime
residential mortgage-backed securities (i.e., the write-downs for this firm map only to the ABX).
Assume that the total write-down for this firm during 2007 and 2008 was $100 million. Further,
assume the following cumulative accounting write-down schedule for quarters 1 through 8: $0
million, $10 million, $30 million, $40 million, $50 million, $ 60 million, $70 million, and $100
million respectively.
Step 1: The ABX (average across all series and tranches) lost 79% of its value by end of 2008.
Hence,
DEVALABX_TOTAL = 0.79
At the end of the first quarter of 2007, the ABX had devalued by 12%. Hence, as a percentage of
the total devaluation of 79%, the devaluation at the end of the first quarter of 2007 was 12%
divided by 79% = 15%. Hence,
PCT_DEVALABX,1 = 0.15
For the purposes of our example, consider the following quarterly ABX devaluation factors for
quarters 1 to 8: 15%, 12%, 45%, 72%, 88%, 84%, 90%, and 100% respectively.
Step 2: For our hypothetical firm, all the write-downs map to the ABX index.
Step 3: Calculate the index-implied cumulative write-downs at the end of each quarter. As
observed in Step 1, by the end of the first quarter, the ABX implied a write-down of 15% (as a

17
percentage of total write-down during 2007 and 2008). Thus, the ABX-implied cumulative write-
down at the end of the first quarter is:
WDABX,1 = PCT_DEVALABX,1×WDTOT_ABX
= 0.15 ×100 = $15 million.
Similar calculations for the remaining quarters respectively yield the following implied write-
down schedule for quarters 1 through 8: $15 million, $12 million, $45 million, $72 million, $88
million, $84 million, $90 million and $100 million.
Step 4: This step is not required in this example, as the entire write-down amount is
benchmarked to the ABX index.
Step 5: In our example, the cumulative quarterly shortages in accounting write-downs are $15
million, $2 million, $15 million, $32 million, $38 million, $24 million, $20 million and $0
million for quarters 1 to 8 respectively.
Thus, the firm-level timeliness score is − (15+2+15+32+38+24+20+0)/100 = −1.46.
The firm-quarter level timeliness scores are: −0.15, −0.02, −0.15, −0.32, −0.38, −0.24, −0.20,
and 0 respectively, for quarters 1 to 8.
In other words, for this hypothetical firm, the accounting write-downs lag the write-
downs implied by the ABX. As discussed below in Section 5, the hypothetical firm above is
representative of a typical firm in my sample, which also has accounting write-downs that lag the
index-implied write-down schedule.
4.2. Incentives and Corporate Governance
The tests for the determinants of timeliness of write-downs require proxies for corporate
governance quality, and incentive problems between managers and investors. To measure
corporate governance quality, I use the data compiled by Institutional Shareholder Services (ISS)
18
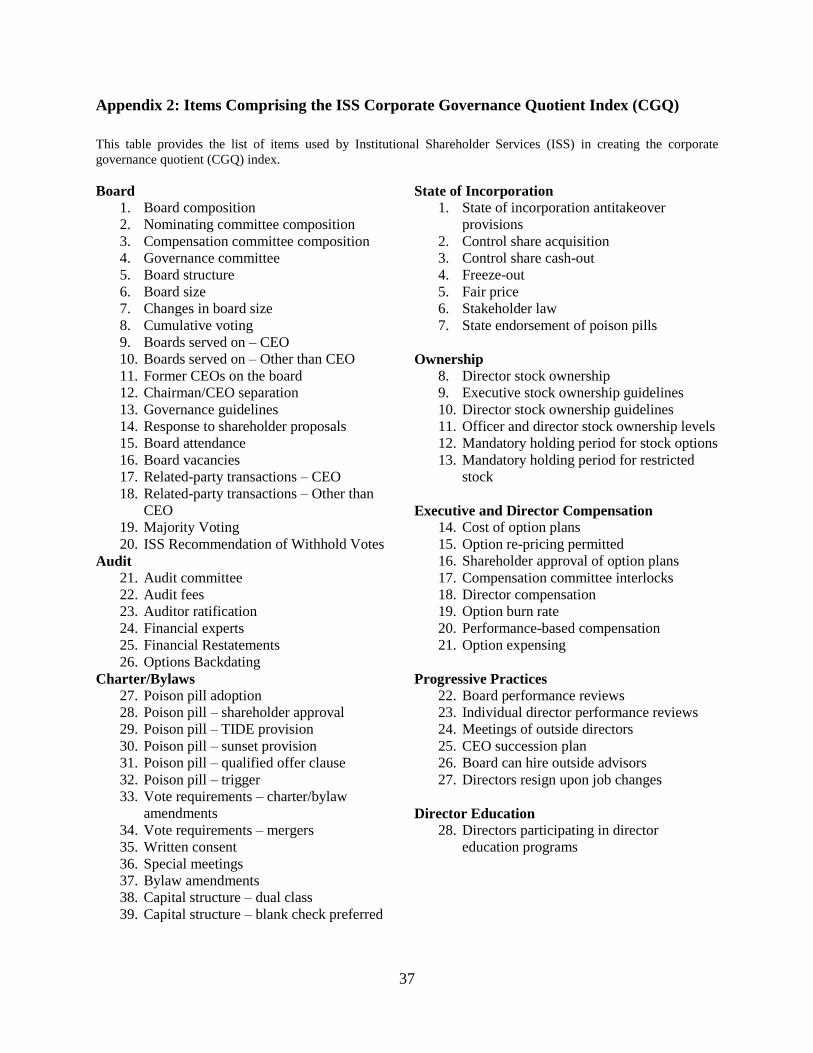
as of fiscal year end 2006. In particular, I use the ISS Corporate Governance Quotient (CGQ).
The CGQ comprises the following eight categories: (a) board structure and composition, (b)
audit-related issues, (c) charter and by-law provisions, (d) state of incorporation, (e) executive
and director compensation, (f) progressive practices, and (g) director education. The variables
used in creating the CGQ are detailed in the Appendix 2.
To measure incentive-alignment-related problems, I use excess annual compensation for
CEOs. CEOs have a high likelihood of setting the ―tone at the top‖ as far as risk taking and
management practices are concerned. The ―excess‖ component is measured using the residuals
of a cross-sectional regression of annual CEO compensation on firm size (logarithm of total
assets), return on equity, market-to-book ratio, annual stock returns, corporate governance
indicators, and industry type indicator variables. This approach is a modified version of that
followed by Core, Holthausen, and Larcker (1999). All variables are measured for the 2006
fiscal year. The following regression is estimated.
Log(COMP ) i = α + β1Log(TA)i + β2ROEi + β3MBi + β4RETi + β5INDEX_CGQi +
β6TYPEi + εi (7)
Where,
Log(COMP)i = logarithm of total CEO compensation in fiscal 2006 for firm i.
Log(TA)i = logarithm of total assets at the end of fiscal 2006 for firm i.
ROEi = the return on equity in fiscal 2006 for firm i.
MBi = the market-to-book value of equity ratio at the end of fiscal
2006 for firm i.
RETi = the annual stock return in fiscal 2006 for firm i.
INDEX_CGQi = the corporate governance index (CGQ) from Institutional
Shareholder’s Survey.
TYPEi = an indicator variable to control for the sub-industry of the firm
(bank holding company, investment bank, insurance company,

19
GSE, or other category).
EX_COMPi = the residual of the above regression (εi) scaled by Log(COMP)i,,
used as a proxy for excess CEO compensation in 2006.
5. Empirical Tests
Panel A in Table 2 provides descriptive statistics for selected variables. The firm-level
measure of the timeliness of write-downs (IPT_WD) is negative on average (−1.27). As
explained in Section 4.1, this implies that the accounting write-downs lagged the index-implied
write-downs. The average firm in the sample is highly leveraged (83%). In addition,
approximately 35% of the sample was exposed to crisis-related class action litigation during
2007 and 2008.
Panel B in Table 2 shows the Pearson correlations. Excess CEO Compensation
(EX_COMP) and total write-downs (WD) are positively and significantly correlated. There is a
significant positive correlation between corporate governance quality (INDEX_CGQ),
shareholder lawsuits (SUIT), regulatory investigations (SEC), and the timeliness of write-downs
(IPT_WD). Further, size (LogTA), leverage (LEV), and complexity of exposures (COMPLEX) are
negatively correlated with IPT_WD. As expected, we find a negative correlation between buy-
and-hold abnormal returns (BHAR) and total write-downs (WD). The following sections present
the empirical tests for H1 and H2.
Since the predictions in this study are based on agency theory, I provide an initial
consistency check for the existence of agency problems during the crisis (see Appendix 3 for
details). In particular, I examine the relation between excess CEO compensation, corporate
governance quality, and the extent of exposure to risky assets. The extent of exposure to risky
assets is proxied by the total write-downs during 2007 and 2008. The results in Appendix 3

20
(Table A1) show that firms with greater excess CEO compensation have greater write-downs
over 2007 and 2008. These results provide corroborative evidence that incentive problems were,
to some extent, related to the exposure to risky assets. The results also lend support to the
arguments that the extant corporate governance and risk management mechanisms were
ineffective in constraining exposure to risky assets before the crisis.
5.1. Lack of Timeliness in Write-downs
Hypothesis 1(a) predicts that the write-downs undertaken by financial institutions during
the crisis were not timely enough compared with the devaluations implied by the credit indices.
Figure 1 compares the aggregate accounting write-down schedule (cumulative quarterly) for all
the firms in the sample, with a hypothetical write-down schedule based on devaluations implied
by the credit indices. Note that the total dollar amount of write-downs over 2007 and 2008 is
assumed to be the same under both the schedules. The only difference between the two schedules
is the quarterly distribution of the total write-down. Consistent with H1(a), I find that for each
quarter between the first quarter of 2007 and the last quarter of 2008, the cumulative index-
implied write-downs are greater than the cumulative accounting write-downs. Figure 1 visually
manifests that the credit indices implied the same write-down level as the accounting write-
downs approximately two fiscal quarters in advance.
Consistent with the observations from Figure 1, Panel A in Table 2 shows that the
measure for the timeliness of write-downs, IPT_WD, is negative on average (−1.27).
Furthermore, Table 3 provides a statistical test for the lack of timeliness predicted by H1(a).
Consistent with the patterns observed in Figure 1, the differences in means of the cumulative
quarterly accounting write-downs and the index-implied write-downs are negative for each of the
interim quarters during 2007 and 2008. Two-tailed t-tests for the differences in means are
21
significant at the 5% level for each cumulative quarter under consideration. To summarize the
discussion above, the accounting write-downs by financial institutions in my sample lagged the
index-implied write-downs.
5.2. Cross-sectional Determinants of the Timeliness of Write-downs
Hypothesis 1(b) predicts that corporate governance quality is positively related to the
timeliness of write-downs. Consistent with H1(b), in Panel B of Table 2, I observe a significant
positive correlation between the timeliness of write-downs (IPT_WD) and corporate governance
quality (INDEX_CGQ).
I use multivariate regression analysis to further examine the factors related to the
timeliness of write-downs. I estimate the following cross-sectional regression:
IPT_WDi = α +β1WDi + β2LEVi + β3Log(TA)i + β4COMPLEXi + β5EX_COMPi +
β6INDEX_CGQi + β7SECi + β8SUITi + γTYPEi + εi (8)
Where,
IPT_WDi = the timeliness of write-downs, calculated using the procedure outlined in
Section 4.1.
WDi = the total write-downs scaled by total assets for each firm i; write-downs are
cumulated over 2007 and 2008, while total assets are measured on fiscal
year end 2006.
LEVi = financial leverage, defined as total liabilities divided by total assets.
Log(TA)i = logarithm of total assets at 2006 fiscal year end.
COMPLEXi = an indicator variable that takes on a value of one if the institution has
exposure to Collateralized Debt Obligations (CDOs), or Structured
Investment Vehicles (SIVs), and zero otherwise.
EX_COMPi = the excess CEO compensation measure for fiscal year 2006 (refer Section
4.2 for details).
INDEX_CGQi = the corporate governance quotient (CGQ) index from Institutional
22
Shareholder Services.
SECi = an indicator variable that takes on a value of one if the institution is subject
to a subprime-related investigation by the Securities Exchange Commission
(SEC) during 2007-2008, and zero otherwise.
SUITi = an indicator variable that takes on a value of one if the institution is subject
to credit-crisis related class action litigation during 2007-2008, and zero
otherwise.
TYPEi = indicator variables for the type of institution (or the sub-industry to which
the firm belonged), at the end of fiscal 2006 (bank holding company,
insurance company, investment bank, GSE or other categories).
In addition to corporate governance quality, I include a number of control variables that
are potentially related to the timeliness of write-downs. Table 4 presents the results of estimating
Equation (8). Columns I to V show the results of sequentially introducing the explanatory
variables in the regression. In Columns II to V, consistent with the prediction in H1(b), the
coefficient on corporate governance quality (β6) is positive and significant. The coefficients on
the other explanatory variables reveal the following. In Columns I to V, I observe a significant
negative relation between financial leverage (LEV) and IPT_WD, reflecting the role of financing
constraints in determining the write-down policies of firms.15
Similarly, the coefficient on
COMPLEX is negative and significant, implying that complex and opaque exposures such as
CDOs and SIVs provided firms with an opportunity to delay their write-downs. Further, in
Column III, the coefficient on the variable for a subprime-related investigation by the SEC is
positive and significant, potentially reflecting the role played by regulators in flushing out the
write-downs for some of the institutions.16
Finally, in Column V, I find that litigation pressure, as
proxied by the existence of a crisis-related shareholder lawsuit (SUIT), is significantly and
15
An alternative interpretation could be that leverage proxies for capital adequacy constraints, since 57 out of 68
firms in my sample are regulated institutions. 16
However, this result is not robust to the inclusion of other control variables in Column V. A closer examination of
the SEC variable reveals that it is entirely subsumed by shareholder lawsuits (SUIT) and institution type indicators.

23
positively related to the timeliness of write-downs. Consistent with Skinner (1997), the positive
relation between SUIT and IPT_WD could reflect the fact that firms increase their transparency
by taking more timely write-downs in order to limit potential litigation settlement costs.
5.3. Timeliness of Stock Market Adjustments
The second hypothesis tests whether stock returns reflect risk exposure on a timelier basis
for firms with more timely write-downs. I use the total dollar amount of write-downs during
2007 and 2008 as a perfect foresight proxy for exposure to risky assets.17
For a given amount of
total asset write-downs, more timely adjustment involves a faster price decline, controlling for
other factors. In other words, for each cumulative quarter beginning the first fiscal quarter of
2007, I expect firms with timelier write-downs to have greater price declines per unit of write-
down. Empirically, the following regression is estimated for each cumulative fiscal quarter-end:
BHARi,τ = α + β1WDi + β2IPT_WDi + β3WDi×IPT_WDi + β4OISτ + β5Log(TA)i + εi,τ (9)
Where,
BHARi,τ = the buy-and-hold abnormal return for firm i up to the end of quarter τ (τ = 1,
2,....8); abnormal returns are calculated as the raw returns minus the return
on the value-weighted CRSP market portfolio.
WDi = the total write-downs scaled by total assets for each firm i; write-downs are
cumulated over 2007 and 2008, while total assets are measured as of fiscal
year end 2006.
IPT_WDi = the timeliness of write-downs, calculated using the procedure outlined in
Section 4.1.
OISτ = the change in the OIS spread over the BHAR computation window; defined
in Table 1, Panel B as the spread between the 3-month LIBOR and the
comparable overnight index swap rates (OIS), i.e. future expected policy
17
In sensitivity analyses (Section 5.4), I repeat the tests using an ex ante measure of exposure to subprime risk using
the sensitivity of stock returns to ABX index price changes.

24
rates (the Federal Funds rate in the U.S.) over the same horizon; OIS is used
as a proxy for general counterparty risk and liquidity factors in inter-bank
lending.
Log(TA)i = logarithm of total assets at 2006 fiscal year end
In Equation (9), a negative coefficient on the interaction term between IPT_WD and WD
(β3) implies that on any quarter-end (τ) during 2007 and 2008, the cumulative stock returns
reflect a greater portion of institutions’ exposure to risky assets for firms with more timely write-
downs. In other words, the market is able to reflect the risk exposure of firms (proxied by total
write-downs during 2007 and 2008) on a timelier basis. Thus, under H2, I expect β3 to be
negative for each of the cumulative quarterly regressions.
Given the research design in Equation (9), pooling the observations results in the
dependent variable (BHAR) being measured using overlapping time horizons. This gives rise to
correlation in residuals at the firm level across all the cumulative quarters. Further, the residuals
could also potentially be correlated across different firms for a given cumulative quarter. Due to
potentially correlated residuals across observations at the firm level and the cumulative quarter
level, ordinary least squares (OLS) standard errors may be biased. Hence, the standard-errors of
the pooled regressions are clustered by firm and quarter to correct for both time-series and cross-
sectional dependence (Petersen 2009).
The results of estimating equation (9) are presented in Table 5. Panel A presents
cumulative quarterly and pooled regressions using Ordinary Least Squares (OLS) regressions.
The results reveal that the estimated coefficient on the interaction term between IPT_WD and
WD (β3) is negative and statistically significant, indicating that timely write-downs enable the
stock market to assess the riskiness of these institutions’ exposures, and to mark down the
exposures on a timely basis. Specifically, β3 is negative and significant in 7 out of 8 cumulative

25
quarterly regressions in Panel A. Further, β3 is negative and statistically significant in the pooled
specification as well. Also note the negative and significant coefficient on the main effect of
write-downs (β1) in all the panels. In other words, the results in Panel A of Table 5 confirm my
prediction that cumulative stock returns on a given quarter end are more negative for firms with
greater exposure to risky assets, and are even more negative for firms with timelier write-downs.
Finally, in the pooled regression, the negative and significant coefficient (β4) on OIS implies that
inter-bank liquidity and general risk factors are related in a predictable way to stock returns
during the period.18
One of the concerns with the research design outlined in Equation (9) is the potential
endogeneity between stock returns, timeliness of write-downs, and total write-downs. In other
words, BHAR, IPT_WD and WD could be driven by the same unobserved factors. To address this
concern, I conduct a two-stage least squares (2SLS) analysis. I first obtain the predicted values
for write-downs and transparency, using Equation (A1) in Appendix 3 and Equation (8)
respectively. The regression results for these two equations constitute the first stage of the 2SLS
analysis, and are presented in Table A1 (discussed in Appendix 3) and Table 4 (discussed in
Section 5.1). The second stage involves estimating Equation (9) using the predicted values of
WD and IPT_WD. The results of the second stage are presented in Panel B of Table 5. We
observe that the coefficient β3 remains negative and significant in 5 out of 8 cumulative quarterly
regressions, as well as in the pooled regression. In other words, the result that timely write-
downs aid the stock market in reflecting the risk exposure of firms on a timelier basis is robust to
18
Note that the variable OIS is measured at the cumulative quarter level and takes on the same value for all firms in
cumulative quarterly regressions. Hence, in cumulative quarterly regressions, including OIS has the effect of merely
adding a constant to the intercept. In the pooled regressions, OIS varies over time and has the same effect as does
including quarter fixed effects. Thus, OIS is dropped from the cumulative quarterly regressions, but included in the
pooled regressions.
26
this alternative estimation technique. These results are also robust to using the three-stage least
squares (3SLS) technique. 19
5.4. Additional Analyses
Ex ante Measure of Transparency Constructed using the 2006 Annual Report Disclosures
This study focuses on timely write-downs by financial institutions as an indicator of
financial reporting transparency. An alternate way of informing investors about exposure to risky
assets is through ex ante disclosures in annual reports. Hence, in additional analyses, I employ a
self-constructed disclosure index based on best practices observed by the SSG report (Senior
Supervisors Group’s report to the Chairman of the Financial Stability Forum, 2008). This report
was prepared for and submitted to the Chairman of the Financial Stability Forum of the Bank of
International Settlements in 2008. SSG comprises senior financial supervisors from seven
countries (United States, Canada, France, Germany, Japan, Switzerland, and the United
Kingdom). The U.S. is represented by the Securities and Exchange Commission (SEC) and the
Federal Reserve Board of New York (FRBNY). This index is made possible through data
collected from 2006 fiscal year end annual reports.20
The items used in the index are listed in
Appendix 4.
The broad categories comprise disclosures pertaining to special purpose entities (SPEs),
collateralized debt obligations (CDOs), exposure to other subprime and Alt-A securities not in
19
Using the standard 2SLS method (plugging fitted values from the first stage into the second stage) in a model with
interaction terms between endogenous variables could result in inconsistent estimates (Wooldridge 2002). To
address this concern, I re-estimate the system by including the interaction between IPT_WD and WD itself as an
endogenous variable, and employing as instruments either of the following sets of variables: (a) all the exogenous
variables and the multiplicative terms formed using the continuous exogenous variables, or (b) all the exogenous
variables and the predicted value for the interaction term constructed by multiplying the first stage fitted values of
IPT_WD and WD. The results are robust to these alternative estimation methods. Furthermore, the results are
unaltered if the interaction term is treated as an exogenous variable. 20
The approach used is similar to that followed by Bhat (2008a, 2008b). However, Bhat focuses on disclosures
concerning risk exposure for the bank as a whole, while I concentrate solely on the institutions’ disclosure pertaining
to selected credit exposures.

27
CDOs, commercial mortgage-backed securities (CMBS), and leveraged finance. Within each of
these categories, firms are evaluated on the basis of the granularity of disclosures about the
nature of the exposure and the underlying collateral. If the relevant information is available
(unavailable) in the 2006 annual report, a score of one (zero) is assigned to a line item.
Individual line item scores are then summed to calculate the raw score for each firm. In some
cases, non-disclosure could imply that the item is not applicable to that firm. Hence, I convert the
raw scores into percentages by dividing the raw scores by the maximum possible score for each
firm given the nature of its exposures (revealed ex post through various types of write-downs).
Table 6 presents the results of estimating equation (9) using the disclosure index
(DISCL2006) as a measure of transparency instead of IPT_WD. The results show that the
estimated coefficient on the interaction term between DISCL2006 and WD (β3) is negative and
statistically significant, indicating that improved disclosure enables the stock market to reflect
the risk positions of firms on a timelier basis. Specifically, β3 is significantly negative in 6 out of
8 cumulative quarterly regressions, and is significantly negative in the pooled specification as
well. To summarize, the results in Table 6 corroborate my prediction that transparent financial
reporting helps the stock market to reflect risk exposure on a timely basis.21
Ex ante Measure of Exposure to Risky Assets
The main proxy for exposure to risky assets is a perfect foresight proxy — total ex post
write-downs during 2007 and 2008. In additional analyses, I use an ex ante measure of subprime-
related risk, proxied by the sensitivity of stock returns to percentage changes in price of the ABX
index (average of all versions and tranches). The regression approach to calculate this sensitivity
measure (ABX_BETA) is outlined in Appendix 5, and is similar to Knaup and Wagner (2008),
21
Note that higher values of both the variables, IPT_WD (in Table 5), and DISCL2006 (in Table 6), imply greater
financial reporting transparency.

28
who use the more general CDX investment grade and cross-over indices to arrive at a market-
based measure of credit risk. This method is based on the information about credit quality
impounded in share prices. As a market-based measure of credit quality, this measure is forward-
looking and incorporates information quickly. Thus, in the context of my study, the sensitivity of
stock returns to changes in the ABX index can be interpreted as the stock market’s ex ante
assessment of a firm’s exposure to subprime-related risk. For each firm in the sample, I estimate
the sensitivities (ABX_BETA) on a rolling basis using data from (and including) the fourth
quarter of 2006 up to quarter τ-1 (quarter τ being the quarter under consideration for which we
want to measure the ex ante risk exposure). Using ABX_BETA as a measure of exposure to risk, I
estimate the following regression:
BHARi,τ = α + β1ABX_BETAi,τ-1 + β2IPT_WDi + β3 ABX_BETAi,τ-1×IPT_WDi +
β4OISτ + β5Log(TA)i + εi,τ (10)
Equation (10) is similar to Equation (9), except that WD is replaced by ABX_BETA. The
cumulative quarterly and pooled regression results are presented in Table 7. If the stock market is
semi-strong form (but not strong form) efficient, I predict that IPT_WD will increase the ability
of ABX_BETA to imply decline in stock prices. In other words, ABX_BETA is more informative
(about exposure to risky assets) for firms with timelier write-downs. Consistent with my
predictions, I find that timely write-downs enhance the relation between cumulative stock returns
and the ex ante market-based measure of risk, as borne out by the negative coefficient β3 (the
interaction term between IPT_WD and ABX_BETA) in Table 7. However, the evidence is
statistically weak as β3 is significant in only 3 out of 8 cumulative quarterly regressions, and is
insignificant in the pooled regression. In summary, there is some evidence, though it is
statistically weak, that timely write-downs improve the market participants’ assessment of the
riskiness of the institution’s asset portfolio. Hence, the market-based measure of exposure to
29
risky assets is more useful in predicting the stock price decline for transparent firms. This finding
contributes to the literature on the association between financial reporting disclosures and
market-based measures of risk (Beaver, Kettler, and Scholes 1970, Wong 2000, Jorion 2002).
Firm-Quarter-Level Measure of Timeliness of Write-downs
The main analysis in this study was conducted using a firm-level measure of timeliness of
write-downs (IPT_WD). While this firm-level measure has intuitive appeal, as explained in
Section 4.1, I also construct a firm-quarter-level variable for the timeliness of write-downs
(IPT_QTR). As a robustness check, I estimate Equations (8) and (9) using this alternate measure.
In un-tabulated analyses, I find that no inferences are altered. Hence, the results in this study are
not likely to have been affected by a look-ahead bias.
Additional Benchmark Indices
The main analysis of the timeliness of write-downs uses three benchmark indices — the
ABX, CMBX and LCDX. In other words, I assume that these indices reflect the extent of credit
risk of a broader category of asset classes (such as CDOs and unspecified mortgage loans). I
check the robustness of my results by using additional benchmark indices for certain asset
classes. In particular, I include the following additional benchmark indices:
a) The Markit TABX index for benchmarking write-downs pertaining to CDOs.
b) The Barclays Home Equity Price Index for benchmarking general mortgage loans.
The methodology for estimating the measures of timeliness of write-downs using this
expanded set of indices is identical to that which is outlined in Section 4. In un-tabulated results,
I find that no inferences are altered by including the additional benchmarks.
30
6. Conclusions
This study empirically examines the timeliness of write-downs by U.S. financial
institutions affected by the ongoing financial crisis. Timeliness of write-downs is measured by
benchmarking the quarterly accounting write-down schedule with the devaluation schedule
implied by credit indices such as the ABX. The empirical tests reveal the following. First, I find
that accounting write-downs are less timely than the devaluations implied by credit indices.
Second, I examine the cross-sectional determinants of the timeliness of write-downs and
document that corporate governance quality is positively related to the timeliness of write-
downs. Third, I show that for firms with timelier write-downs, exposure to risky assets is
reflected faster in stock returns. This result lends support to the claim that credit indices such as
the ABX provide a useful check for firms to benchmark their losses on risky exposures during
the crisis. In supplementary analysis, I document that the stock market reflects risk exposure on a
timelier basis for firms that are ex ante more transparent about their exposure to risky assets
(using a disclosure index based on 2006 annual report disclosures).
This study makes a number of contributions to the academic and practitioner literatures.
First, I contribute to the ongoing debate concerning financial reporting transparency during the
current financial crisis. While the empirical tests are specific to the crisis, the conclusions drawn
from this study may have a wider relevance, particularly to researchers and policy makers
interested in analyzing transparency and risk management in financial institutions. Second, I add
to the literature on the consequences of financial reporting transparency by examining the effect
of a specific transparency measure (the timeliness of write-downs) on a specific outcome
variable (the timeliness of stock price adjustment). Third, this article represents a contribution to
the literature on the timeliness of capital market adjustments to accounting information, and to
31
the literature on timely loss recognition (or conditional conservatism). Finally, my finding that
the stock-market reflects subprime exposure on a timelier basis for firms with timelier write-
downs contributes to the literature that analyzes the relation between financial disclosures and
market-based measures of risk.

32
References
Ajinkya, B., S. Bhojraj, and P. Sengupta. 2005. ―The association between outside directors,
institutional investors and the properties of management earnings forecasts.‖ Journal of
Accounting Research 43(3): 343-376.
Alford, A., R. Leftwich, and M. Zmijewski. 1993. ―The relative informativeness of accounting
disclosures in different countries.‖ Journal of Accounting Research 31: 183-223.
Ali, A., T. Chen, and S. Radhakrishnan. 2007. ―Corporate disclosures by family firms.‖ Journal
of Accounting and Economics 44: 238-286.
Ball, R., and P. Brown. 1968. ―An empirical evaluation of accounting income numbers.‖ Journal
of Accounting Research 6: 159-178
Ball, R., A. Robin and J. Wu. 2003. ―Incentives versus standards: Properties of accounting
income in four East Asia countries.‖ Journal of Accounting and Economics 36: 235–270
Ball, R., and L. Shivakumar. 2005. ―The role of accruals in asymmetrically timely gain and loss
recognition.‖ Journal of Accounting Research 44(2): 207-242
Basu, S. 1997. ―The Conservatism principle and the asymmetric timeliness of earnings.‖ Journal
of Accounting and Economics 24: 3-37.
Beaver, W., P. Kettler, and M. Scholes. 1970. ―The association between market determined and
accounting determined risk measures.‖ The Accounting Review 45 (October): 654-82.
Bebchuk, L. , and J. Fried. 2003.―Executive compensation as an agency problem.‖ Journal of
Economic Perspectives 17: 71–92.
Berger, P., and R. Hann. 2007. ―Segment profitability and the proprietary and agency costs of
disclosure.‖ The Accounting Review 82: 869–906.
Bernanke, B. 2009. Financial innovation and consumer protection: A speech at the Federal
Reserve System's Sixth Biennial Community Affairs Research Conference, Washington,
DC, April 17. 2009.
Bhat, G. 2008a. ―Risk relevance of fair value gains and losses, and the impact of disclosure and
corporate governance.‖ Working Paper, Washington University.
Bhat, G. 2008b. ―Impact of disclosure and corporate governance on the association between fair
value gains and losses and stock returns in the commercial banking industry.‖ Working
Paper, Washington University.
Bicksler, J. 2008. ―The subprime mortgage debacle and its linkages to corporate governance.‖
International Journal of Disclosure and Governance 5: 295–300.

33
Bushman, R., J. Piotroski and A. Smith. 2004. ―What determines corporate transparency?‖
Journal of Accounting Research 42: 207–252
Bushman R., A. Smith. and R. Wittenberg-Moerman. 2008. ―Price discovery and dissemination
of private information by loan syndicate participants.‖ Working Paper, University of
Chicago.
Butler, M., A. Kraft, and I. Weiss. 2007. ―The effect of reporting frequency on the timeliness of
earnings: the cases of voluntary and mandatory interim reports.‖ Journal of Accounting
and Economics 43:181-217
Callen, J., M. Khan, and H. Lu. 2009. ―Accounting quality, stock price delay and future stock
returns.‖ Working Paper, University of Toronto.
American Institute of Certified Public Accountants — Center for Audit Quality. 2007.
―Measurements of fair value in illiquid (or less liquid) markets.‖ October 3, 2007.
Core, J., R. Holthausen., and D. Larcker. 1999. ―Corporate governance, CEO compensation, and
firm performance.‖ Journal of Financial Economics 51: 371-406.
Davidson, W., P. Jiraporn, Y. Kim, and M. Singh. 2006. ―Corporate governance, shareholder
rights and firm diversification: An empirical analysis.‖ Journal of Banking and Finance
30: 947–63.
Dickey, J., M. King, and K. Shih. 2008. ―Subprime-related securities litigation: Where do we go
from here?‖ Insights: The Corporate Securities and Law Advisor 22(4): 2-10.
The Economist. 2008. ―Valuing securities: Don’t mark to Markit.‖ March 6, 2008.
Fama, E., L. Fischer, M. Jensen and R. Roll. 1969. ―The adjustment of stock prices to new
information.‖ International Economic Review 10: 1-21.
Fender, I. and M Scheicher.2008. ―The ABX: How do the markets price subprime risk?‖ BIS
Quarterly Review September: 67-81.
Financial Accounting Standards Board. Continuously Updated. FASB Pronouncements and EITF
Abstracts, Norwalk, CT. http://72.3.243.42/st/.
Gorton, G. 2008. ―The Subprime Panic.‖ European Financial Management, forthcoming.
Healy, P. 1985. ―The effect of bonus schemes on accounting decisions.‖ Journal of Accounting
and Economics 7: 85–107.
Hope, O., and W. Thomas. 2008. ―Managerial empire building and firm disclosure.‖ Journal of
Accounting Research Vol. 46 (3): 591-626.
34
Hou, K. and T. Moskowitz. 2005. ―Market frictions, price delay and the cross-section of
expected returns.‖ Review of Financial Studies 18 (3): 981-1020.
Hull, J. 2009. ―The Credit Crunch of 2007: What went wrong? Why? What lessons can be
learned‖ Journal of Credit Risk, forthcoming.
Hutton, A. 2007. ―A discussion of corporate disclosures by family firms.‖ Journal of Accounting
and Economics 44: 287-297.
Jorion, P. 2002. ―How informative are Value-at-Risk disclosures?‖ The Accounting Review
77(4): 911-931.
Jensen, M., and W. Meckling. 1976. ―Theory of the firm: Managerial behavior, agency costs and
ownership structure.‖ Journal of Financial Economics 3: 305-360.
Karamanou, I., and N. Vafeas. 2005. ―The association between corporate boards, audit
committees, and management earnings forecasts: An empirical analysis.‖ Journal of
Accounting Research 43(3): 453–486.
Kasznik, R., and B. Lev. 1995. ―To warn or not to warn: Management disclosures in the face of
an earnings surprise.‖ The Accounting Review 70: 113-34.
Khanna, T., K. Palepu and S. Srinivasan. 2004. ―Disclosure practices of foreign companies
interacting with US markets.‖ Journal of Accounting Research 42: 475–508
Kirkpatrick, G. 2009. ―The corporate governance lessons from the financial crisis.‖ Working
Paper, OECD.
Knaup, M., and W. Wagner. 2008. ―Market-based measure of credit quality and banks’
Performance during the Subprime Crisis.‖ Working Paper.
Laux, C. and C. Leuz. 2009a. ―The crisis of fair-value accounting: Making sense of the recent
debate.‖ Accounting, Organizations and Society, forthcoming.
Laux, C. and C. Leuz. 2009b. ―Did fair-value accounting contribute to the crisis.‖ NBER
Working Paper No. w15515.
Mollenkamp, C., S. Ng, and S. Patterson, ―A subprime gauge in many ways?‖ The Wall Street
Journal December 12, 2007.
Onaran, Y. 2008. ―Counting write-downs replaces deals won as Wall Street's ritual.‖
Bloomberg.com September 2, 2008.
Petersen, M. 2009. ―Estimating standard errors in finance panel data sets: Comparing
approaches.‖ Review of Financial Studies 22: 435-480.

35
Rajan, R. 2006. ―Has finance made the world riskier?‖ European Financial Management 12(4):
499-533.
Ryan, S. 2008. ―Accounting in and for the Subprime Crisis.‖ The Accounting Review 83: 1605-
1639.
Senior Supervisors Group. ―Leading-practice disclosures on selected exposures.‖ Report to the
Financial Stability Forum, April 11, 2008.
Skinner, D. 1997. ―Earnings disclosures and stockholder law suits.‖ Journal of Accounting and
Economics 23: 249-82.
Stanton, R. and N. Wallace. 2009. ―ABX.HE indexed credit default swaps and the valuation of
subprime MBS.‖ Fisher Center for Real Estate & Urban Economics. Fisher Center
Working Papers: Paper 312.
Strebel, P. 2008. ―Boards out of depth in subprime? What bank boards need to avoid lending
excesses.‖ Mimeo, IMD, Switzerland.
Wooldridge, J .2002. ―Econometric analysis of cross section and panel data.‖ Cambridge, MA:
MIT Press.
Wong, F. 2000. ―The association between SFAS No. 119 derivatives disclosures and the foreign
exchange risk exposure of manufacturing firms.‖ Journal of Accounting Research 38:
387-417
Wray, R. 2008. ―Lehman Brothers stronger than feared‖ The Guardian March 18, 2008.

36
Appendix 1: Mapping between Types of Write-downs and Credit Index Benchmarks
This table provides a list of the types of write-downs, and their mapping to the corresponding benchmark indices. A
particular type of write-down is mapped to an index if the securities underlying the index are similar to the written-
down assets.
Write-down Type
(based on underlying exposure)
Benchmark Index
(Main List)
Benchmark Index
(Expanded List)
ABS: non-mortgage asset backed
securities
ABX ABX
ALT: Alt-A securities ABX ABX
ARS: Auction rate securities OTHER OTHER
CDO: collateralized debt obligations ABX TABX
CDS: credit default swaps and other
derivatives
ABX ABX
CMBS: commercial mortgage-backed
securities, commercial real estate
CMBX CMBX
CORP: subsidiaries, investments in
other firms, corporate debt
OTHER OTHER
COST: credit costs, loan charge-offs,
increased provisions
ABX ABX
LEV: leveraged loans, CLOs LCDX LCDX
MONO: monolines ABX ABX
MTGE: other, uncategorized mortgages
/mortgage related securities
ABX Barclays HE
OCI: revaluation reserve, OCI OTHER OTHER
PRI: prime mortgages, securities ABX ABX
RES: uncategorized residential
mortgage securities
ABX ABX
SIV: structured investment vehicles,
asset backed commercial paper
ABX ABX
SUB: subprime RMBS ABX ABX
TNA: trading losses OTHER OTHER
UNS: other, unspecified, not broken
down
OTHER OTHER
37
Appendix 2: Items Comprising the ISS Corporate Governance Quotient Index (CGQ)
This table provides the list of items used by Institutional Shareholder Services (ISS) in creating the corporate
governance quotient (CGQ) index.
Board
1. Board composition
2. Nominating committee composition
3. Compensation committee composition
4. Governance committee
5. Board structure
6. Board size
7. Changes in board size
8. Cumulative voting
9. Boards served on – CEO
10. Boards served on – Other than CEO
11. Former CEOs on the board
12. Chairman/CEO separation
13. Governance guidelines
14. Response to shareholder proposals
15. Board attendance
16. Board vacancies
17. Related-party transactions – CEO
18. Related-party transactions – Other than
CEO
19. Majority Voting
20. ISS Recommendation of Withhold Votes
Audit
21. Audit committee
22. Audit fees
23. Auditor ratification
24. Financial experts
25. Financial Restatements
26. Options Backdating
Charter/Bylaws
27. Poison pill adoption
28. Poison pill – shareholder approval
29. Poison pill – TIDE provision
30. Poison pill – sunset provision
31. Poison pill – qualified offer clause
32. Poison pill – trigger
33. Vote requirements – charter/bylaw
amendments
34. Vote requirements – mergers
35. Written consent
36. Special meetings
37. Bylaw amendments
38. Capital structure – dual class
39. Capital structure – blank check preferred
State of Incorporation
1. State of incorporation antitakeover
provisions
2. Control share acquisition
3. Control share cash-out
4. Freeze-out
5. Fair price
6. Stakeholder law
7. State endorsement of poison pills
Ownership
8. Director stock ownership
9. Executive stock ownership guidelines
10. Director stock ownership guidelines
11. Officer and director stock ownership levels
12. Mandatory holding period for stock options
13. Mandatory holding period for restricted
stock
Executive and Director Compensation
14. Cost of option plans
15. Option re-pricing permitted
16. Shareholder approval of option plans
17. Compensation committee interlocks
18. Director compensation
19. Option burn rate
20. Performance-based compensation
21. Option expensing
Progressive Practices
22. Board performance reviews
23. Individual director performance reviews
24. Meetings of outside directors
25. CEO succession plan
26. Board can hire outside advisors
27. Directors resign upon job changes
Director Education
28. Directors participating in director
education programs
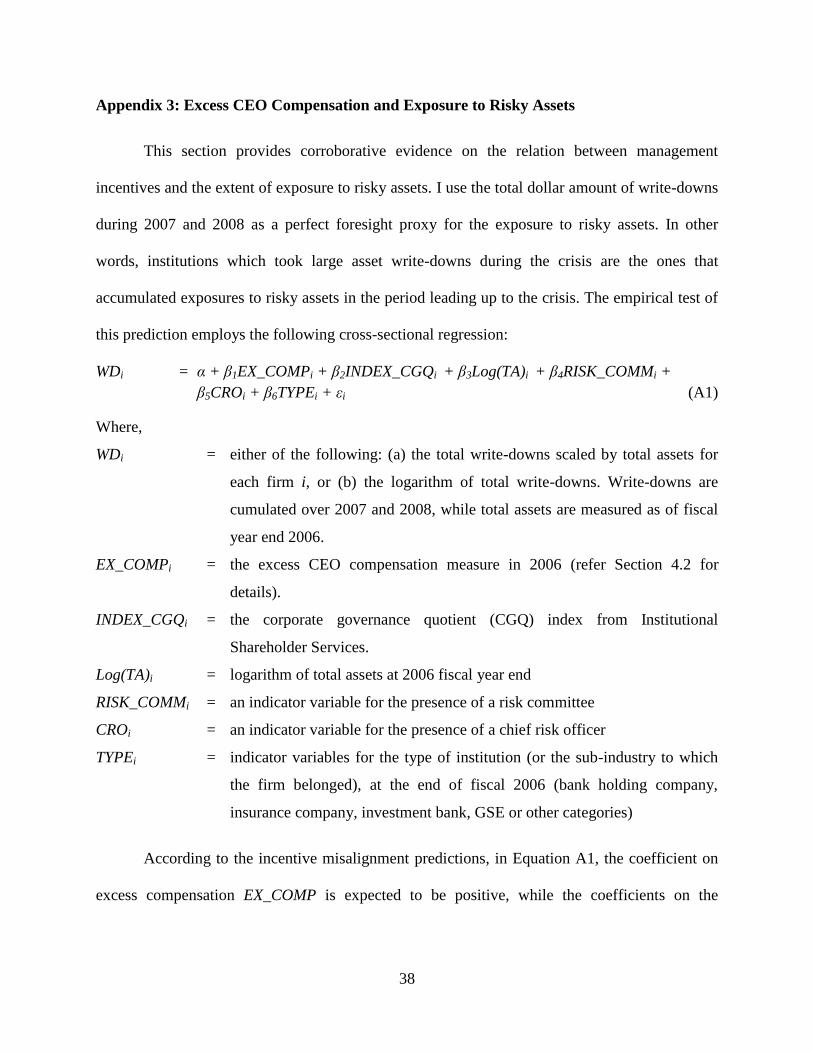
38
Appendix 3: Excess CEO Compensation and Exposure to Risky Assets
This section provides corroborative evidence on the relation between management
incentives and the extent of exposure to risky assets. I use the total dollar amount of write-downs
during 2007 and 2008 as a perfect foresight proxy for the exposure to risky assets. In other
words, institutions which took large asset write-downs during the crisis are the ones that
accumulated exposures to risky assets in the period leading up to the crisis. The empirical test of
this prediction employs the following cross-sectional regression:
WDi = α + β1EX_COMPi + β2INDEX_CGQi + β3Log(TA)i + β4RISK_COMMi +
β5CROi + β6TYPEi + εi (A1)
Where,
WDi = either of the following: (a) the total write-downs scaled by total assets for
each firm i, or (b) the logarithm of total write-downs. Write-downs are
cumulated over 2007 and 2008, while total assets are measured as of fiscal
year end 2006.
EX_COMPi = the excess CEO compensation measure in 2006 (refer Section 4.2 for
details).
INDEX_CGQi = the corporate governance quotient (CGQ) index from Institutional
Shareholder Services.
Log(TA)i = logarithm of total assets at 2006 fiscal year end
RISK_COMMi = an indicator variable for the presence of a risk committee
CROi = an indicator variable for the presence of a chief risk officer
TYPEi = indicator variables for the type of institution (or the sub-industry to which
the firm belonged), at the end of fiscal 2006 (bank holding company,
insurance company, investment bank, GSE or other categories)
According to the incentive misalignment predictions, in Equation A1, the coefficient on
excess compensation EX_COMP is expected to be positive, while the coefficients on the

39
governance and risk management variables (INDEX_CGQ, RISK_COMM, and CRO), if they are
effective, are expected to be negative.
The table below presents the results of estimating Equation (A1). Columns I and II
respectively present the results with the scaled and logged measures of total write-downs.
Table A1: Excess CEO Compensation and Total Write-downs during 2007 and 2008
I. II.
Dep. Var. = WD/TA Dep. Var. = Log(WD)
EX_COMP 0.316* 3.720**
[0.189] [1.852]
INDEX_CGQ 0.001 0.008
[0.000] [0.006]
LOG(TA) -0.016* 0.904***
[0.009] [0.101]
RISK_COMM -0.037 -0.212
[0.043] [0.443]
CRO 0.078* 0.871**
[0.045] [0.382]
Constant 0.087** -3.473***
[0.044] [0.632]
Observations 59 59
Institution Type Indicators YES YES
Adj. R−squared 0.04 0.15
Robust standard errors are in brackets. Standard errors are bootstrapped with 1,000 replications.
As expected, the coefficient on EX_COMP is positive and significant (at > 10% level
using a two-tailed test) in both specifications, indicating that write-downs are larger in firms with
greater excess CEO compensation. The coefficients on INDEX_CGQ and RISK_COMM are
insignificant, while the coefficient on CRO is significant but contrary to the expected direction.
Taken together, the results in this table provide some corroborative evidence that incentive
problems were, to some extent, related to the exposure to risky assets. The results also lend
support to the arguments that the extant corporate governance and risk management mechanisms
were ineffective in constraining exposure to risky assets before the crisis.
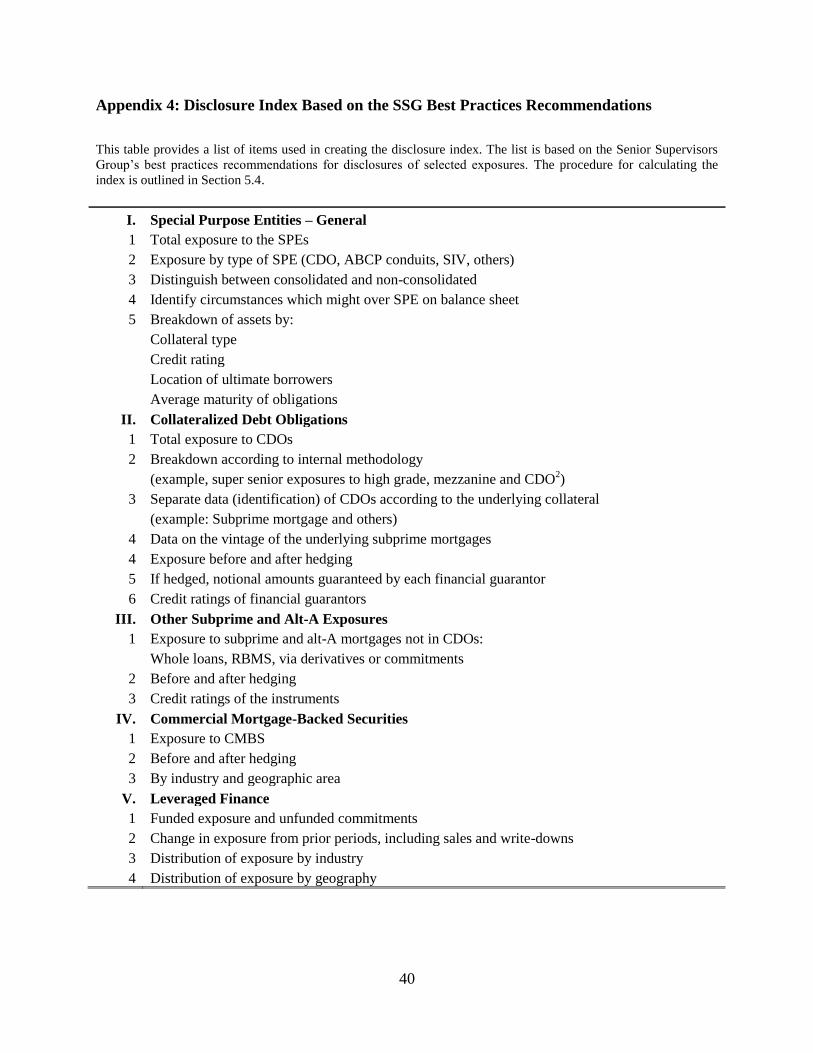
40
Appendix 4: Disclosure Index Based on the SSG Best Practices Recommendations
This table provides a list of items used in creating the disclosure index. The list is based on the Senior Supervisors
Group’s best practices recommendations for disclosures of selected exposures. The procedure for calculating the
index is outlined in Section 5.4.
I. Special Purpose Entities – General
1 Total exposure to the SPEs
2 Exposure by type of SPE (CDO, ABCP conduits, SIV, others)
3 Distinguish between consolidated and non-consolidated
4 Identify circumstances which might over SPE on balance sheet
5 Breakdown of assets by:
Collateral type
Credit rating
Location of ultimate borrowers
Average maturity of obligations
II. Collateralized Debt Obligations
1 Total exposure to CDOs
2 Breakdown according to internal methodology
(example, super senior exposures to high grade, mezzanine and CDO2)
3 Separate data (identification) of CDOs according to the underlying collateral
(example: Subprime mortgage and others)
4 Data on the vintage of the underlying subprime mortgages
4 Exposure before and after hedging
5 If hedged, notional amounts guaranteed by each financial guarantor
6 Credit ratings of financial guarantors
III. Other Subprime and Alt-A Exposures
1 Exposure to subprime and alt-A mortgages not in CDOs:
Whole loans, RBMS, via derivatives or commitments
2 Before and after hedging
3 Credit ratings of the instruments
IV. Commercial Mortgage-Backed Securities
1 Exposure to CMBS
2 Before and after hedging
3 By industry and geographic area
V. Leveraged Finance
1 Funded exposure and unfunded commitments
2 Change in exposure from prior periods, including sales and write-downs
3 Distribution of exposure by industry
4 Distribution of exposure by geography
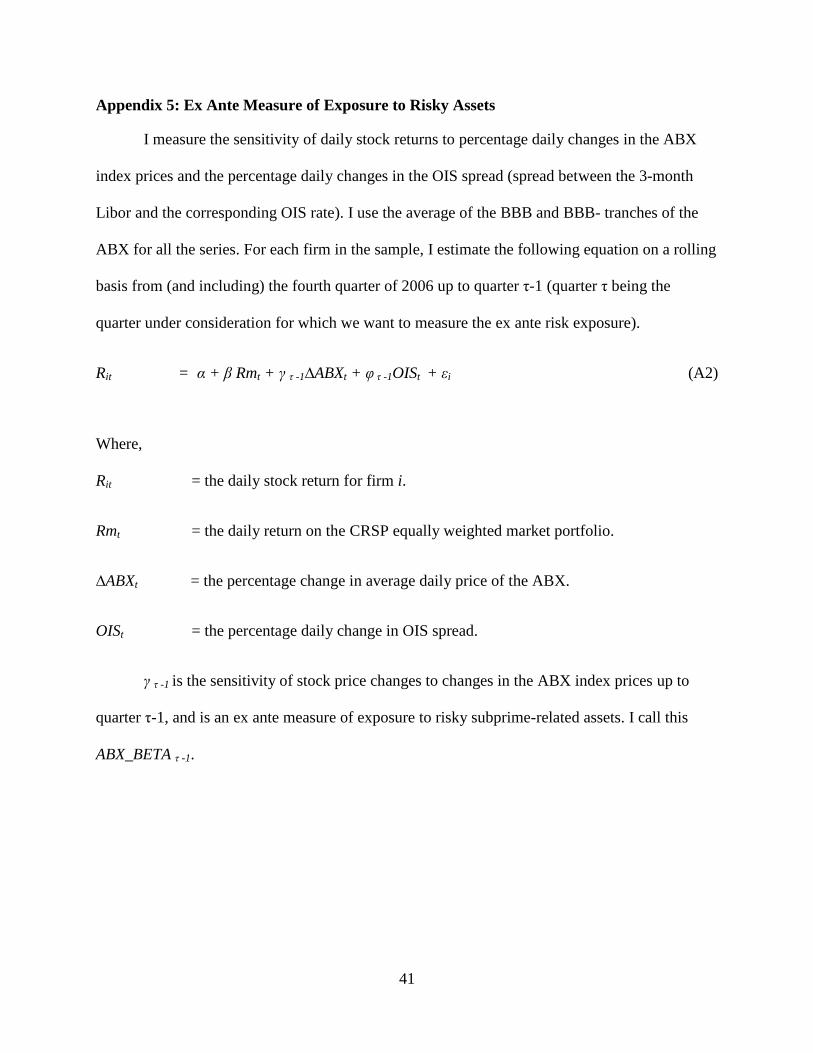
41
Appendix 5: Ex Ante Measure of Exposure to Risky Assets
I measure the sensitivity of daily stock returns to percentage daily changes in the ABX
index prices and the percentage daily changes in the OIS spread (spread between the 3-month
Libor and the corresponding OIS rate). I use the average of the BBB and BBB- tranches of the
ABX for all the series. For each firm in the sample, I estimate the following equation on a rolling
basis from (and including) the fourth quarter of 2006 up to quarter τ-1 (quarter τ being the
quarter under consideration for which we want to measure the ex ante risk exposure).
Rit = α + β Rmt + γ τ -1∆ABXt + φ τ -1OISt + εi (A2)
Where,
Rit = the daily stock return for firm i.
Rmt = the daily return on the CRSP equally weighted market portfolio.
∆ABXt = the percentage change in average daily price of the ABX.
OISt = the percentage daily change in OIS spread.
γ τ -1 is the sensitivity of stock price changes to changes in the ABX index prices up to
quarter τ-1, and is an ex ante measure of exposure to risky subprime-related assets. I call this
ABX_BETA τ -1.
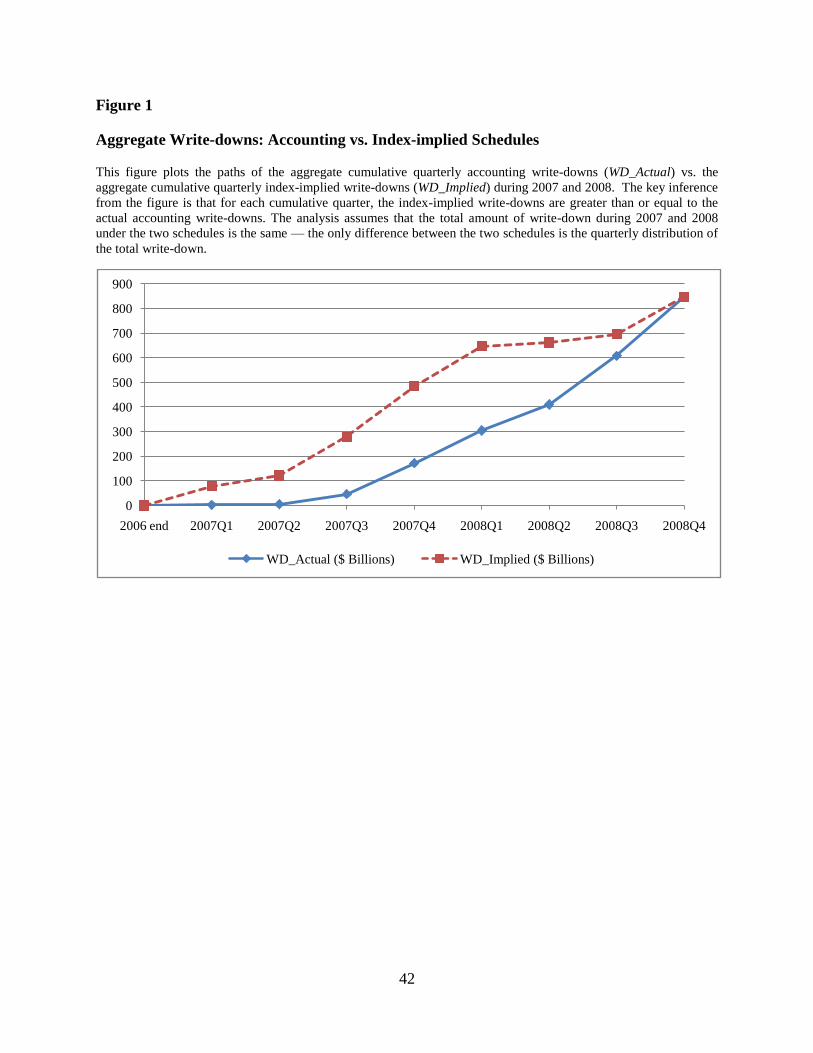
42
Figure 1
Aggregate Write-downs: Accounting vs. Index-implied Schedules
This figure plots the paths of the aggregate cumulative quarterly accounting write-downs (WD_Actual) vs. the
aggregate cumulative quarterly index-implied write-downs (WD_Implied) during 2007 and 2008. The key inference
from the figure is that for each cumulative quarter, the index-implied write-downs are greater than or equal to the
actual accounting write-downs. The analysis assumes that the total amount of write-down during 2007 and 2008
under the two schedules is the same — the only difference between the two schedules is the quarterly distribution of
the total write-down.
0
100
200
300
400
500
600
700
800
900
2006 end 2007Q1 2007Q2 2007Q3 2007Q4 2008Q1 2008Q2 2008Q3 2008Q4
WD_Actual ($ Billions) WD_Implied ($ Billions)
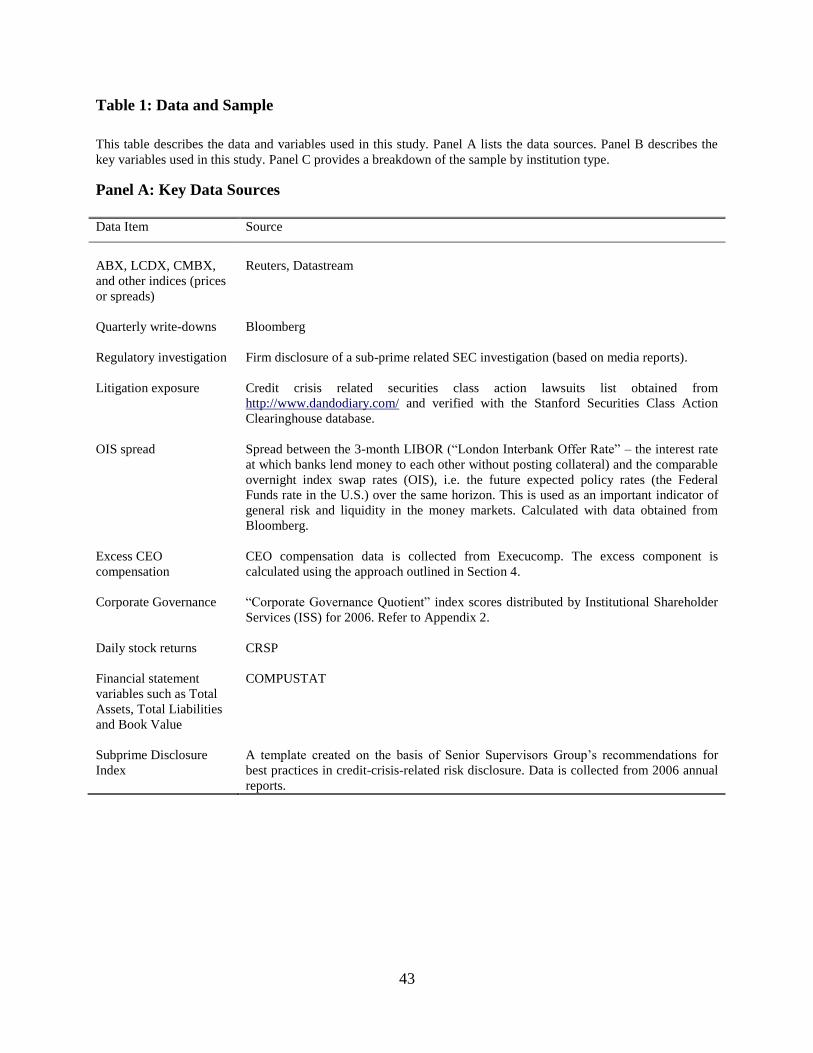
43
Table 1: Data and Sample
This table describes the data and variables used in this study. Panel A lists the data sources. Panel B describes the
key variables used in this study. Panel C provides a breakdown of the sample by institution type.
Panel A: Key Data Sources
Data Item Source
ABX, LCDX, CMBX,
and other indices (prices
or spreads)
Reuters, Datastream
Quarterly write-downs Bloomberg
Regulatory investigation Firm disclosure of a sub-prime related SEC investigation (based on media reports).
Litigation exposure Credit crisis related securities class action lawsuits list obtained from
http://www.dandodiary.com/ and verified with the Stanford Securities Class Action
Clearinghouse database.
OIS spread Spread between the 3-month LIBOR (―London Interbank Offer Rate‖ – the interest rate
at which banks lend money to each other without posting collateral) and the comparable
overnight index swap rates (OIS), i.e. the future expected policy rates (the Federal
Funds rate in the U.S.) over the same horizon. This is used as an important indicator of
general risk and liquidity in the money markets. Calculated with data obtained from
Bloomberg.
Excess CEO
compensation
CEO compensation data is collected from Execucomp. The excess component is
calculated using the approach outlined in Section 4.
Corporate Governance ―Corporate Governance Quotient‖ index scores distributed by Institutional Shareholder
Services (ISS) for 2006. Refer to Appendix 2.
Daily stock returns CRSP
Financial statement
variables such as Total
Assets, Total Liabilities
and Book Value
COMPUSTAT
Subprime Disclosure
Index
A template created on the basis of Senior Supervisors Group’s recommendations for
best practices in credit-crisis-related risk disclosure. Data is collected from 2006 annual
reports.
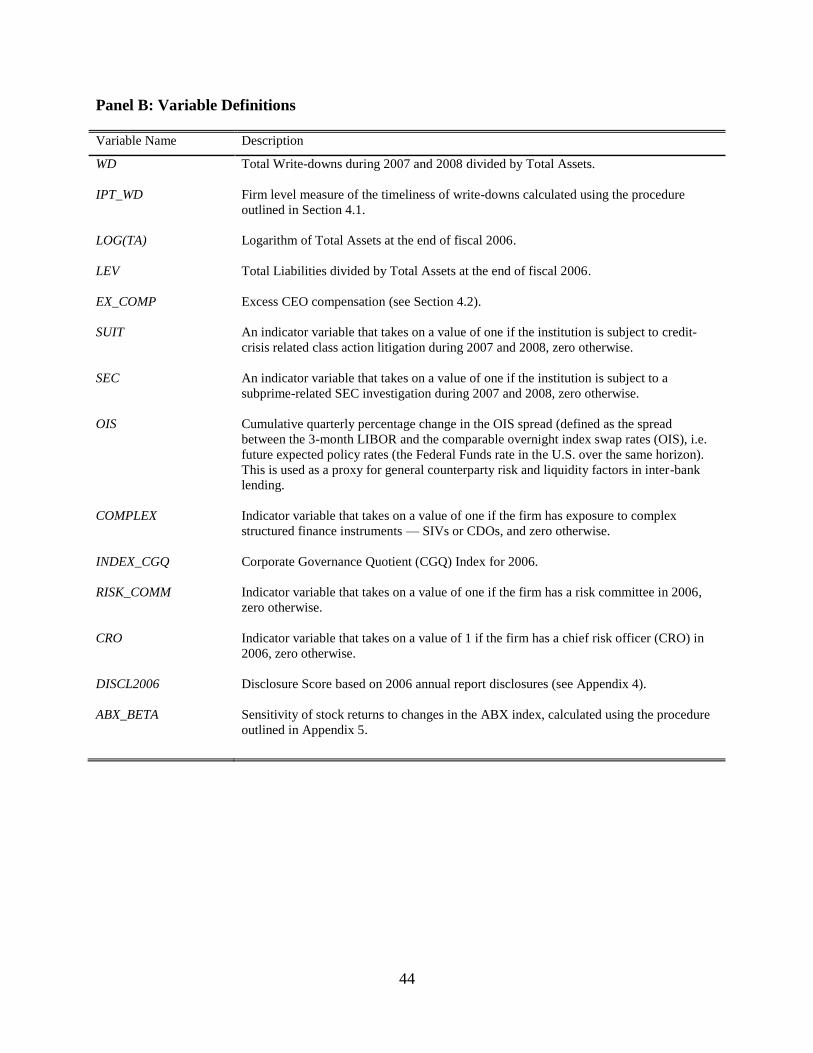
44
Panel B: Variable Definitions
Variable Name Description
WD Total Write-downs during 2007 and 2008 divided by Total Assets.
IPT_WD Firm level measure of the timeliness of write-downs calculated using the procedure
outlined in Section 4.1.
LOG(TA) Logarithm of Total Assets at the end of fiscal 2006.
LEV Total Liabilities divided by Total Assets at the end of fiscal 2006.
EX_COMP Excess CEO compensation (see Section 4.2).
SUIT An indicator variable that takes on a value of one if the institution is subject to credit-
crisis related class action litigation during 2007 and 2008, zero otherwise.
SEC An indicator variable that takes on a value of one if the institution is subject to a
subprime-related SEC investigation during 2007 and 2008, zero otherwise.
OIS Cumulative quarterly percentage change in the OIS spread (defined as the spread
between the 3-month LIBOR and the comparable overnight index swap rates (OIS), i.e.
future expected policy rates (the Federal Funds rate in the U.S. over the same horizon).
This is used as a proxy for general counterparty risk and liquidity factors in inter-bank
lending.
COMPLEX Indicator variable that takes on a value of one if the firm has exposure to complex
structured finance instruments — SIVs or CDOs, and zero otherwise.
INDEX_CGQ Corporate Governance Quotient (CGQ) Index for 2006.
RISK_COMM Indicator variable that takes on a value of one if the firm has a risk committee in 2006,
zero otherwise.
CRO Indicator variable that takes on a value of 1 if the firm has a chief risk officer (CRO) in
2006, zero otherwise.
DISCL2006 Disclosure Score based on 2006 annual report disclosures (see Appendix 4).
ABX_BETA Sensitivity of stock returns to changes in the ABX index, calculated using the procedure
outlined in Appendix 5.
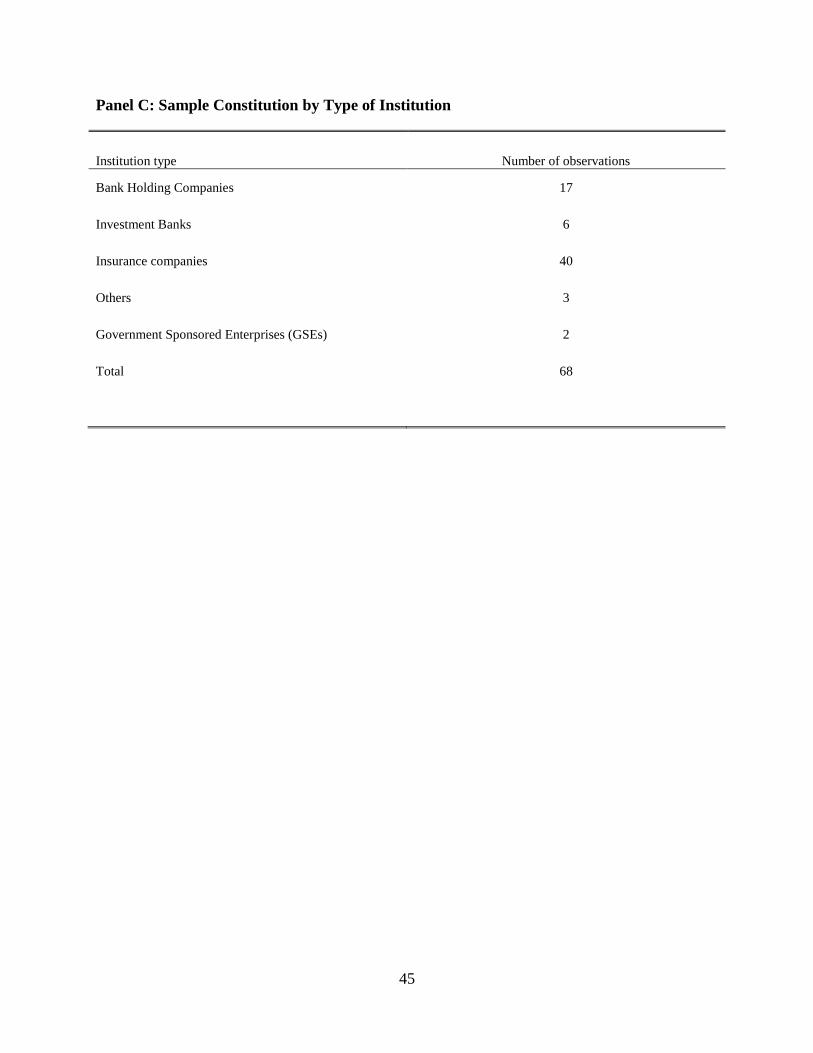
45
Panel C: Sample Constitution by Type of Institution
Institution type Number of observations
Bank Holding Companies 17
Investment Banks 6
Insurance companies 40
Others 3
Government Sponsored Enterprises (GSEs) 2
Total 68
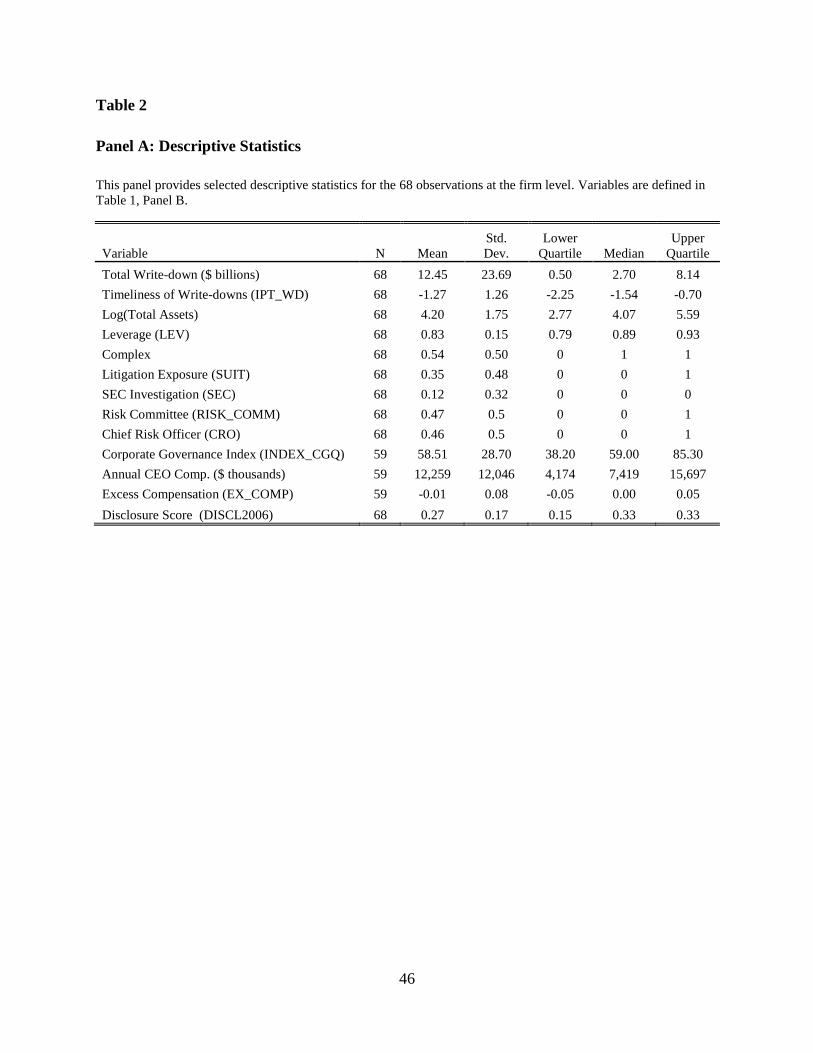
46
Table 2
Panel A: Descriptive Statistics
This panel provides selected descriptive statistics for the 68 observations at the firm level. Variables are defined in
Table 1, Panel B.
Variable N Mean
Std.
Dev.
Lower
Quartile Median
Upper
Quartile
Total Write-down ($ billions) 68 12.45 23.69 0.50 2.70 8.14
Timeliness of Write-downs (IPT_WD) 68 -1.27 1.26 -2.25 -1.54 -0.70
Log(Total Assets) 68 4.20 1.75 2.77 4.07 5.59
Leverage (LEV) 68 0.83 0.15 0.79 0.89 0.93
Complex 68 0.54 0.50 0 1 1
Litigation Exposure (SUIT) 68 0.35 0.48 0 0 1
SEC Investigation (SEC) 68 0.12 0.32 0 0 0
Risk Committee (RISK_COMM) 68 0.47 0.5 0 0 1
Chief Risk Officer (CRO) 68 0.46 0.5 0 0 1
Corporate Governance Index (INDEX_CGQ) 59 58.51 28.70 38.20 59.00 85.30
Annual CEO Comp. ($ thousands) 59 12,259 12,046 4,174 7,419 15,697
Excess Compensation (EX_COMP) 59 -0.01 0.08 -0.05 0.00 0.05
Disclosure Score (DISCL2006) 68 0.27 0.17 0.15 0.33 0.33
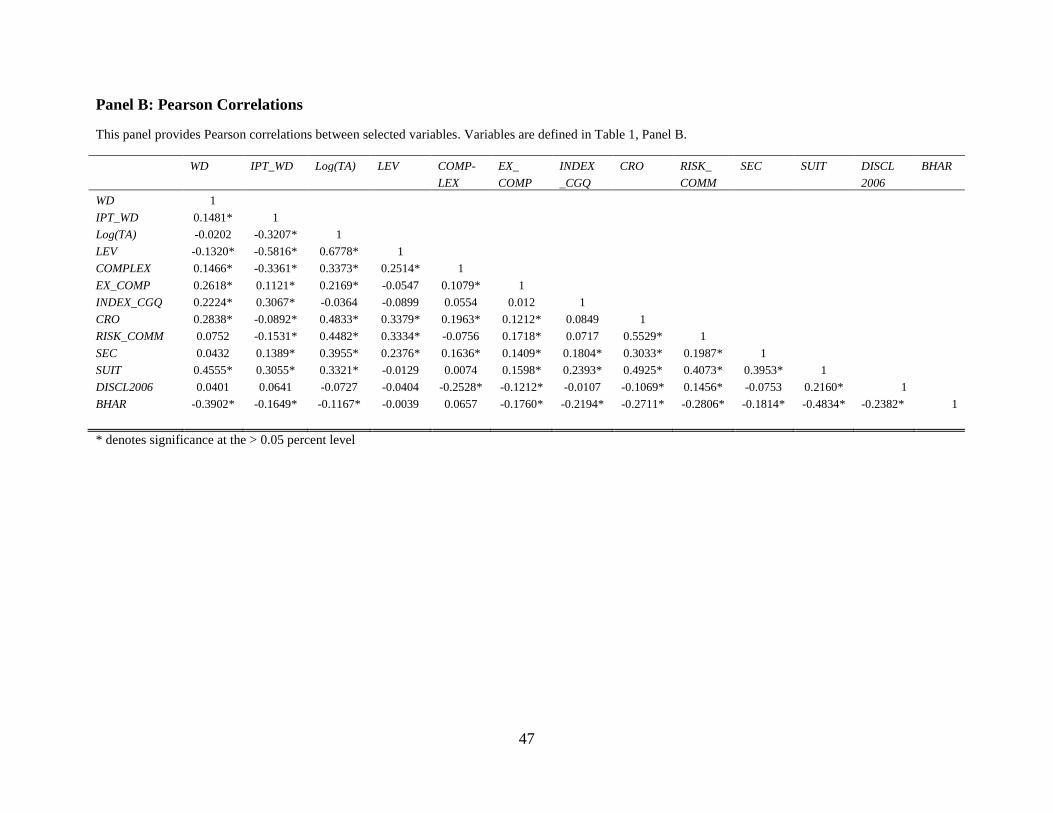
47
Panel B: Pearson Correlations
This panel provides Pearson correlations between selected variables. Variables are defined in Table 1, Panel B.
WD IPT_WD Log(TA) LEV COMP- EX_ INDEX CRO RISK_ SEC SUIT DISCL BHAR
LEX COMP _CGQ COMM 2006
WD 1
IPT_WD 0.1481* 1
Log(TA) -0.0202 -0.3207* 1
LEV -0.1320* -0.5816* 0.6778* 1
COMPLEX 0.1466* -0.3361* 0.3373* 0.2514* 1
EX_COMP 0.2618* 0.1121* 0.2169* -0.0547 0.1079* 1
INDEX_CGQ 0.2224* 0.3067* -0.0364 -0.0899 0.0554 0.012 1
CRO 0.2838* -0.0892* 0.4833* 0.3379* 0.1963* 0.1212* 0.0849 1
RISK_COMM 0.0752 -0.1531* 0.4482* 0.3334* -0.0756 0.1718* 0.0717 0.5529* 1
SEC 0.0432 0.1389* 0.3955* 0.2376* 0.1636* 0.1409* 0.1804* 0.3033* 0.1987* 1
SUIT 0.4555* 0.3055* 0.3321* -0.0129 0.0074 0.1598* 0.2393* 0.4925* 0.4073* 0.3953* 1
DISCL2006 0.0401 0.0641 -0.0727 -0.0404 -0.2528* -0.1212* -0.0107 -0.1069* 0.1456* -0.0753 0.2160* 1
BHAR -0.3902* -0.1649* -0.1167* -0.0039 0.0657 -0.1760* -0.2194* -0.2711* -0.2806* -0.1814* -0.4834* -0.2382* 1
* denotes significance at the > 0.05 percent level
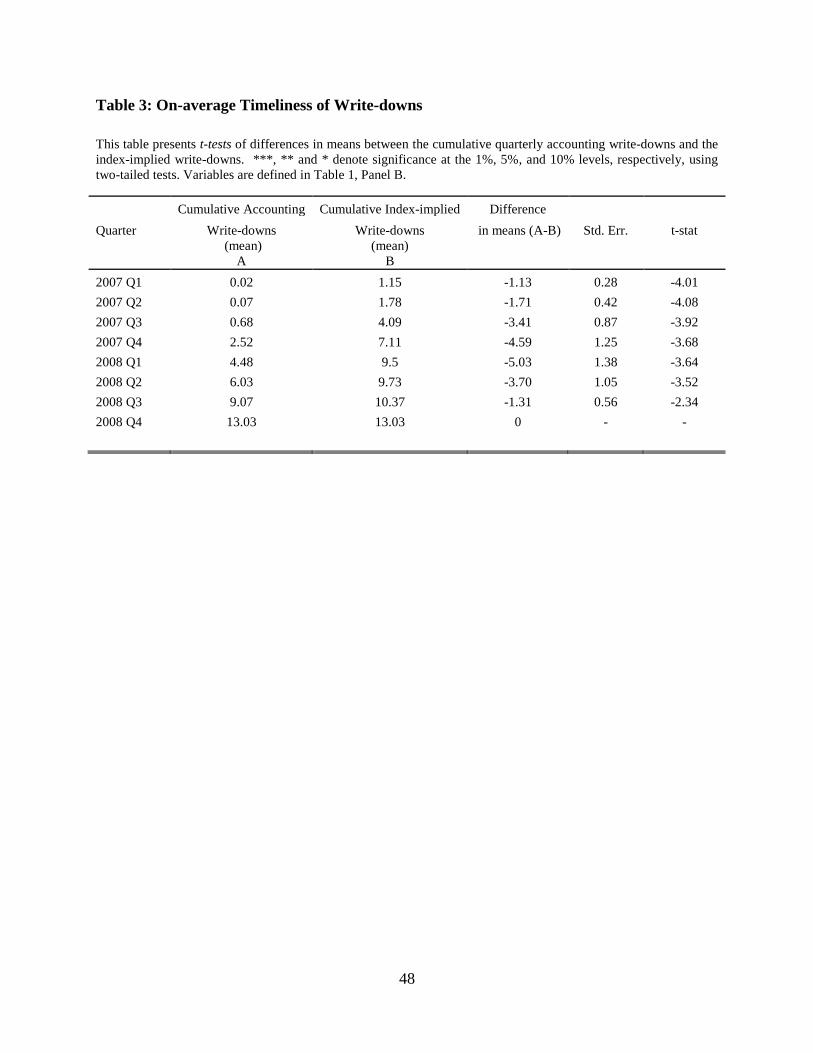
48
Table 3: On-average Timeliness of Write-downs
This table presents t-tests of differences in means between the cumulative quarterly accounting write-downs and the
index-implied write-downs. ***, ** and * denote significance at the 1%, 5%, and 10% levels, respectively, using
two-tailed tests. Variables are defined in Table 1, Panel B.
Quarter
Cumulative Accounting Cumulative Index-implied Difference
Std. Err. t-stat Write-downs Write-downs in means (A-B)
(mean)
A
(mean)
B
2007 Q1 0.02 1.15 -1.13 0.28 -4.01
2007 Q2 0.07 1.78 -1.71 0.42 -4.08
2007 Q3 0.68 4.09 -3.41 0.87 -3.92
2007 Q4 2.52 7.11 -4.59 1.25 -3.68
2008 Q1 4.48 9.5 -5.03 1.38 -3.64
2008 Q2 6.03 9.73 -3.70 1.05 -3.52
2008 Q3 9.07 10.37 -1.31 0.56 -2.34
2008 Q4 13.03 13.03 0 - -

49
Table 4: Cross-sectional Determinants of the Timeliness of Write-downs
This table presents a multivariate analysis of the factors related to the timeliness of write-downs. Columns I to V
present the results of sequentially introducing the explanatory variables in the regressions. Standard errors (in
brackets) are heteroskedasticity-robust, and are bootstrapped using 1000 replications. ***, ** and * denote
significance at the 1%, 5%, and 10% levels, respectively, using two-tailed tests. Variables are defined in Table 1,
Panel B.
IPT_WDi = α +β1WDi + β2LEVi + β3Log(TA)i + β4COMPLEXi + β5EX_COMPi + β6INDEX_CGQi
+ β7SECi + β8SUITi + γTypei + εi
I. II. III. IV. V.
WD 1.722 0.773 0.677 -1.068 -0.936
[3.039] [3.451] [3.549] [3.264] [4.010]
Log(TA) 0.139 0.091 0.027 -0.08 -0.123
[0.097] [0.093] [0.089] [0.105] [0.121]
LEV -5.235*** -4.876*** -4.847*** -3.902*** -2.825*
[1.392] [1.519] [1.523] [1.394] [1.540]
COMPLEX -0.666** -0.535* -0.562* -0.433 -0.514*
[0.289] [0.309] [0.302] [0.283] [0.312]
EX_COMP
0.731 0.583 1.03 1.423
[1.825] [1.881] [1.796] [1.949]
INDEX_CGQ
0.011*** 0.009** 0.008** 0.008*
[0.004] [0.004] [0.004] [0.004]
SEC
0.881** 0.607 -0.057
[0.384] [0.439] [0.503]
SUIT
0.709* 0.989***
[0.376] [0.381]
Institution Type Indicators NO NO NO NO YES
Constant 2.773*** 2.000* 2.279* 1.812* 0.77
[0.951] [1.180] [1.209] [1.072] [1.204]
Observations 68 59 59 59 59
Adj. R-squared 0.36 0.42 0.42 0.46 0.49

50
Table 5 Panel A: Timeliness of Stock Market Adjustment: OLS Regressions
This panel presents the results of cumulative quarterly and pooled regressions of buy-and-hold abnormal returns (from beginning of 2007 to the end of quarter τ)
on total write-downs during 2007 and 2008 (scaled by total assets), timeliness of write-downs and the interaction between them. The key variable of interest is
the interaction between WD and IPT_WD. A negative coefficient on the interaction term implies that credit losses are incorporated into stock returns on a timelier
basis for firms with timelier write-downs. Standard errors in the cumulative quarterly regressions are heteroskedasticity-robust. In the pooled regression, the
standard errors are clustered at the firm level and at the quarter level. Standard errors are in brackets. ***, ** and * denote significance at the 1%, 5%, and 10%
levels, respectively, using two-tailed tests. Variables are defined in Table 1, Panel B.
BHARi,τ = α + β1WDi + β2IPT_WDi + β3WDi×IPT_WDi + β4OISτ + β5Log(TA)i + εi,τ
OLS Regressions
2007 Q1 2007 Q2 2007 Q3 2007 Q4 2008 Q1 2008 Q2 2008 Q3 2008 Q4 Pooled
WD -0.344 -0.774*** -1.400*** -2.739*** -3.060*** -2.922*** -3.354*** -3.594*** -2.248***
[0.245] [0.249] [0.278] [0.379] [0.413] [0.485] [0.705] [0.827] [0.528]
IPT_WD 0.003 0.025 0.014 0.035 0.012 0.017 0.006 0.009 0.015
[0.015] [0.015] [0.022] [0.029] [0.032] [0.042] [0.056] [0.065] [0.025]
WD* IPT_WD -0.152 -0.423** -0.691*** -1.084*** -1.005*** -1.028*** -0.931** -1.256** -0.805***
[0.177] [0.180] [0.210] [0.258] [0.269] [0.323] [0.461] [0.573] [0.228]
OIS
-0.020***
[0.003]
Log(TA) -0.007 -0.012** -0.010 -0.026** -0.038*** -0.047*** -0.065*** -0.101*** -0.038**
[0.005] [0.006] [0.007] [0.012] [0.014] [0.017] [0.024] [0.027] [0.015]
Constant −0.006 0.023 −0.071* −0.02 0.006 −0.093 0.097 0.341** 0.204**
[0.036] [0.030] [0.039] [0.054] [0.068] [0.085] [0.129] [0.162] [0.084]
Observations 68 68 68 68 68 68 67 65 540
Adj. R−squared 0.12 0.17 0.33 0.41 0.45 0.33 0.3 0.31 0.35

51
Table 5 Panel B: Timeliness of Stock Market Adjustment: 2SLS Regressions
This panel presents the second stage of two-stage least squares (2SLS) analysis of the impact of timeliness of write-downs on the relation between buy-and-hold
abnormal returns and total write-downs during 2007 and 2008. In the first stage, the predicted values of total write-downs and timeliness of write-downs are
generated using the regressions shown below. The second stage is similar to the regressions in Panel A of Table 5, except that the variables WD and IPT_WD
predicted values from the first stage. The key variable of interest in the second stage is the interaction between the predicted values of WD and IPT_WD. A
negative coefficient on the interaction term implies that credit losses are incorporated into stock returns on a timelier basis for firms with timelier write-downs.
Standard errors are bootstrapped using 100 replications. Standard errors are in brackets. ***, ** and * denote significance at the 1%, 5%, and 10% levels,
respectively, using two-tailed tests. Variables are defined in Table 1, Panel B.
First Stage (1): WDi = α + β1EX_COMPi + β2INDEX_CGQi + β3Log(TA)i + β4RISK_COMMi + β5CROi + β6Typei + εi
First Stage (2): IPT_WDi = α +β1WDi + β2LEVi + β3Log(TA)i + β4COMPLEXi + β5EX_COMPi + β6INDEX_CGQi + β7SECi + β8SUITi + β9Typei + εi
Second Stage: BHARi,τ = α + β1WDi + β2IPT_WDi + β3WDi×IPT_WDi + β4OISτ + β5Log(TA)i + εi,τ
2SLS Regressions
2007 Q1 2007 Q2 2007 Q3 2007 Q4 2008 Q1 2008 Q2 2008 Q3 2008 Q4 Pooled
WD -0.542 -1.371** -2.288*** -5.138*** -5.599*** -6.338*** -5.395** -2.912 -3.844***
[0.404] [0.555] [0.807] [1.445] [1.605] [1.924] [2.303] [2.485] [0.585]
IPT_WD 0.03 0.082** 0.061 0.182* 0.144 0.197 0.049 -0.099 0.089**
[0.029] [0.040] [0.058] [0.104] [0.115] [0.138] [0.165] [0.177] [0.042]
WD* IPT_WD -0.34 -0.862** -1.173** -2.507*** -2.419** -2.910** -1.818 -0.612 -1.664***
[0.262] [0.359] [0.523] [0.936] [1.040] [1.246] [1.492] [1.697] [0.381]
OIS
-0.021***
[0.002]
Log(TA) -0.007 -0.008 -0.005 -0.026 -0.043* -0.056** -0.078** -0.102*** -0.041***
[0.006] [0.008] [0.011] [0.021] [0.023] [0.027] [0.033] [0.033] [0.008]
Constant 0.048 0.102 -0.015 0.236 0.278 0.295 0.278 0.074 0.381***
[0.059] [0.081] [0.118] [0.212] [0.235] [0.282] [0.337] [0.349] [0.088]
Observations 59 59 59 59 59 59 59 57 470
Adj. R−squared 0.18 0.15 0.27 0.23 0.3 0.14 0.24 0.33 0.29

52
Table 6: Timeliness of Stock Market Adjustment: 2006 Annual Report Disclosures as an Ex Ante Transparency Measure
This panel presents the results of the cumulative quarterly and pooled regressions of buy-and-hold abnormal returns (from beginning of 2007 to the end of
quarter τ) on total asset write-downs during 2007 and 2008 scaled by total assets, disclosure scores and the interaction between them. The key variable of interest
is the interaction between total write-downs and disclosure scores. A negative coefficient on the interaction term implies that credit losses are incorporated into
stock returns on a timelier basis for firms with higher disclosure scores. Standard errors in the cumulative quarterly regressions are heteroskedasticity-robust. In
the pooled regressions, the standard errors are clustered at the firm and quarter levels. Standard errors are in brackets. ***, ** and * denote significance at the
1%, 5%, and 10% levels, respectively, using two-tailed tests. Variables are defined in Table 1, Panel B.
BHARi,τ = α + β1WDi + β2DISCL2006i + β3WDi×DISCL2006i + β4OISτ + β5Log(TA)i + εi,τ
2007 Q1 2007 Q2 2007 Q3 2007 Q4 2008 Q1 2008 Q2 2008 Q3 2008 Q4 Pooled
WD 0.039 -0.085 -0.349* -0.985** -1.363*** -1.197** -1.436** -1.248** -0.840***
[0.128] [0.171] [0.204] [0.418] [0.478] [0.460] [0.678] [0.555] [0.324]
DISCL2006 0.072 -0.01 -0.062 -0.181 -0.216 -0.233 -0.198 -0.217 -0.137
[0.061] [0.081] [0.112] [0.175] [0.177] [0.229] [0.279] [0.314] [0.122]
WD*DISCL2006 -1.343 -1.455 -2.277** -3.942*** -4.251*** -4.225*** -5.857*** -6.648*** -3.612***
[0.917] [0.947] [0.866] [1.476] [1.407] [1.568] [2.036] [2.387] [1.037]
OIS
-0.020***
[0.003]
Log(TA) -0.004 -0.009 0.001 -0.013 -0.022 -0.032** -0.050** -0.079*** -0.026**
[0.004] [0.006] [0.009] [0.012] [0.013] [0.015] [0.022] [0.025] [0.013]
Constant -0.02 0.005 -0.101 -0.045 0.009 -0.089 0.105 0.218 0.200**
[0.027] [0.038] [0.060] [0.077] [0.086] [0.103] [0.125] [0.155] [0.083]
Observations 68 68 68 68 68 68 67 65 540
Adj. R−squared 0.14 0.14 0.24 0.41 0.46 0.35 0.36 0.34 0.37

53
Table 7: Timeliness of Stock Market Adjustment: Using an Ex Ante Measure of Exposure to Risky Assets
This table presents a multivariate analysis of the impact of the timeliness of write-downs on the relation between buy-and-hold abnormal returns (from beginning
of 2007 to the end of quarter τ) and an ex ante measure of exposure to risky assets (ABX_BETA). The measurement of the ex ante risk variable is detailed in
Appendix 5. The key variable of interest is the interaction between ABX_BETA and IPT_WD. A negative coefficient on the interaction term implies that the ex
ante risk measure is more informative of the risk exposure for firms with timelier write-downs. Standard errors in the quarterly regressions are heteroskedasticity-
robust standard errors. In the pooled regressions, the standard errors are clustered at the firm and quarter levels. Standard errors are in brackets. ***, ** and *
denote significance at the 1%, 5%, and 10% levels, respectively, using two-tailed tests. Variables are defined in Table 1, Panel B.
BHARi,τ = α + β1ABX_BETAi,τ-1 + β2IPT_WDi + β3ABX_BETAi,τ-1×IPT_WDi + β4OISτ + β5Log(TA)i + εi,τ
2007 Q1 2007 Q2 2007 Q3 2007 Q4 2008 Q1 2008 Q2 2008 Q3 2008 Q4 Pooled
ABX_BETA -0.008 0.246** -0.556*** -1.023*** -1.373*** -1.384*** -1.912*** -1.833*** -0.053
[0.007] [0.112] [0.115] [0.157] [0.357] [0.143] [0.560] [0.374] [0.041]
IPT_WD -0.012 0.001 -0.005 0.004 -0.02 0.018 -0.059 -0.004 -0.058**
[0.010] [0.013] [0.015] [0.021] [0.049] [0.034] [0.067] [0.050] [0.026]
ABX_BETA*IPT_WD -0.002 0.091 -0.316*** -0.535*** -0.125 -0.073 0.261 -0.564*** -0.026
[0.004] [0.066] [0.068] [0.109] [0.187] [0.097] [0.312] [0.180] [0.019]
OIS
-0.019***
[0.003]
Log(TA) -0.005 -0.015** -0.003 -0.023 -0.025 -0.025* -0.040* -0.093*** -0.034**
[0.004] [0.007] [0.010] [0.014] [0.016] [0.015] [0.023] [0.027] [0.016]
Constant -0.035 0.005 -0.148*** -0.120* -0.139 -0.184** -0.136 0.099 0.009
[0.023] [0.034] [0.041] [0.062] [0.109] [0.079] [0.143] [0.132] [0.063]
Observations 68 68 68 68 68 68 67 65 540
Adj. R−squared 0.01 0.11 0.25 0.31 0.36 0.46 0.31 0.26 0.19