The time evolution of the viscoelastic retardation in...
29
Accepted Manuscript The time evolution of the viscoelastic retardation in starch pastes with guar gum Pawel Ptaszek, Anna Ptaszek PII: S0260-8774(10)00567-4 DOI: 10.1016/j.jfoodeng.2010.11.020 Reference: JFOE 6320 To appear in: Journal of Food Engineering Received Date: 9 July 2010 Revised Date: 25 October 2010 Accepted Date: 22 November 2010 Please cite this article as: Ptaszek, P., Ptaszek, A., The time evolution of the viscoelastic retardation in starch pastes with guar gum, Journal of Food Engineering (2010), doi: 10.1016/j.jfoodeng.2010.11.020 This is a PDF file of an unedited manuscript that has been accepted for publication. As a service to our customers we are providing this early version of the manuscript. The manuscript will undergo copyediting, typesetting, and review of the resulting proof before it is published in its final form. Please note that during the production process errors may be discovered which could affect the content, and all legal disclaimers that apply to the journal pertain.
Transcript of The time evolution of the viscoelastic retardation in...

Accepted Manuscript
The time evolution of the viscoelastic retardation in starch pastes with guar gum
Pawel Ptaszek, Anna Ptaszek
PII: S0260-8774(10)00567-4
DOI: 10.1016/j.jfoodeng.2010.11.020
Reference: JFOE 6320
To appear in: Journal of Food Engineering
Received Date: 9 July 2010
Revised Date: 25 October 2010
Accepted Date: 22 November 2010
Please cite this article as: Ptaszek, P., Ptaszek, A., The time evolution of the viscoelastic retardation in starch pastes
with guar gum, Journal of Food Engineering (2010), doi: 10.1016/j.jfoodeng.2010.11.020
This is a PDF file of an unedited manuscript that has been accepted for publication. As a service to our customers
we are providing this early version of the manuscript. The manuscript will undergo copyediting, typesetting, and
review of the resulting proof before it is published in its final form. Please note that during the production process
errors may be discovered which could affect the content, and all legal disclaimers that apply to the journal pertain.

The time evolution of the viscoelastic retardation in starch 1
pastes with guar gum 2
Pawel Ptaszek*, Anna Ptaszek 3
Agricultural University of Cracow, Faculty of Food Technology, Department of Engineering 4
and Machinery for Food Industry, Balicka 122, PL-30-149 Krakow, Poland 5 *corresponding author: [email protected], fax: +48126624761, tel. +48126634768 6
Abstract The aim of the present study was to determine the viscoelastic properties of the 7
model mixtures of selected pasted polysaccharides. The initial material used were water 8
pastes of waxy corn and normal corn starch, mixed with guar gum. The rheological tests were 9
performed in a time domain. The theoretical analysis covered the adaptation of some 10
achievements of the phenomenological theory of viscoelasticity, which were applied during 11
the interpretation of the results obtained for the aforementioned mixtures of biopolymers. The 12
emphasis was placed on the description of the retardation behaviours with the aim to develop 13
a continuous rheological Burger model. 14
Keywords 15
retardation spectra, Tikhonov regularisation, starch paste, viscoelasticity 16
Introduction 17
A creep test is very frequently used in the studies of rheological properties. In this test the 18
material is subject to a suitable constant in the time stress τ(t)=τ0, and the resulting 19
deformation γ(t) is observed. This phenomenon is called creep. The quantitative value 20
describing this phenomenon is a creep compliance J(t) defined as follows Tschoegl 1989: 21
o
ttJ
τγ )(
)( = (1) 22
For the sake of the mathematical modelling of the linear phenomena of creep 23
phenomenological models are used. They are composed of a suitable combination of dashpots 24
and springs. There are two time scales which are used in these models: a real time scale (the 25
duration of the time of the experiment, the technological process, etc.) and an artificially 26
created time scale called a retardation scale (the scale of an elastic retardation). The most 27

universal model describing the creep phenomenon is the continuous Burger model. It 28
comprises a single Maxwell element and a continuous Kelvin-Voigt element (Tschoegl 1989, 29
Ferry 1980): 30
���� ����� �������
elementsVoigtKelvinelementsMaxwell
g dt
LtJtJ
'
0'
exp1)(1
)(
−
∞
� ��
���
��
��
−−+⋅+= λλ
λη
(2) 31
Where t is a real time of experiment and λ is a retardation time, both values having the time 32
dimension, s. Jg describes an instantaneous compliance with the applied stress, and η 33
corresponds to the Newtonian viscosity. The subintegral function L(λ) called a retardation 34
spectrum or a distribution of the retardation times is characteristic of a given material. λ, the 35
retardation time, is defined as a quotient of the spring constant and the dashpot viscosity in the 36
Kelvin-Voigt ( K-V ) element, whereas the dashpot and the spring are placed in parallel to 37
each other. The stress applied causes an equal deformation of the dashpot and the spring in a 38
single K-V element. The size of this deformation depends on the mechanical properties of the 39
spring and the viscous properties of the dashpot. Placed in a series, Kelvin-Voight elements 40
can be characterized by various retardation times because of the corresponding properties of 41
the springs and the dashpots which constitute them. L(λ) provides an extremely important 42
item of information regarding the rheological behaviour of the systems investigated, because 43
it describes the intensity of the given retardation processes (retardation times) in the 44
phenomenon. The accumulation of the retardation processes characterized by similar 45
parameters is manifested by the appearance of characteristic peaks in the L(λ) spectrum. The 46
presence of peaks in the range of high retardation times is evidence of the participation of 47
viscous contributions in the process of the phenomenon formation. A similar accumulation of 48
peaks in the domain of short times can be evidence of a phenomenological advantage of 49
elastic properties. The knowledge of the distribution of the retardation times gives insight into 50
the structure of the retardation and the relaxation phenomena occurring in real materials. This 51
knowledge can be used directly for the modelling of technological process, or it can be a 52
starting point for a discussion about molecular interactions. Moreover, the knowledge of this 53
function makes it possible to determine all the remaining rheological functions pertaining to 54
the linear viscoelasticity (Ferry 1980). 55
Continuous rheological models have been known for a long time, but are rarely used in 56
practice. It is so due to great difficulties with obtaining subintegral functions estimators based 57
on the experimental data. In the case discussed, the estimator of the retardation spectrum L(λ) 58

is unknown. The direct use of the method of least squares in equation (2) does not give the 59
expected results because of the ill-posed of calculation problem. The systems are very 60
sensitive to small variations in the measurement values and these, as a result, lead to 61
enormous variations in the values of the calculated estimators or to the formation of 62
singularity. The solution for the ill-posed problem was found following the formulation of the 63
regularisation method by Tikhonov and proving the theorem of the existence of an 64
unequivocal solution (Tikhonov et al. 1995, Engl et al. 1996). This method presents some 65
golden mean between the quality of the match in the sense of least squares and the shape of 66
the estimated function which, in the case discussed, can be written as follows: 67
( ) ( ) ( )( ) 0
1,0,0
2
1
2
2 min1
≥≥≥=→+−=�
ηλ
σ λασ
αgJL
n
iii
i
LDJJV (3) 68
where: 69
( ) λλ
λη
dt
LtJJ iigi �
+∞
��
���
��
��
−−⋅+⋅+=0
exp11 70
L(λ), η1
,gJ are unknown estimators. The first element of the sum in eq. (3a) is responsible for 71
the error minimisation and the second one, called the regulariser, is responsible for the shape 72
of the function L(λ) (Tikhonov et al. 1995, Weese 1992, Weese and Friedrich 1994). The 73
value of the regularisation parameter α determines the relationship between the accuracy of 74
fitting and the form of the function. If α =0, then the regularisation methods becomes a 75
classical least squares methods. The search for this parameter is combined with the main 76
minimisation problem (Honerkampf and Weese 1990). 77
Starch and non-starch hydrocolloids 78
Polysaccharides are the main ingredient of human food. They are used also as food texturing 79
agents and in order to provide food with proper resistance. Due to their biodegradability and 80
renewability polysaccharides have found wide applications in the pharmaceutical, ceramic, 81
and textile industries, as well as in biotechnology (Phillips and Williams 2000). The discussed 82
compounds are characterized by a very complicated structure, and from a practical point of 83
view, they exhibit many interesting rheological phenomena. The complex hydrodynamic 84
behaviour of polysaccharides and their solutions allows for their application as pilot testing 85
materials in the emerging technologies. 86

Starch is a plant storage material which is composed of two alpha glucans: an essentially 87
linear amylose and a branched amylopectin. It is deposited in the plant’s storage organ in the 88
form of granules whose size and dimensions are determined by their botanical origin. The 89
linear amylose demonstrates a small degree of branching but it is predominantly regarded as a 90
single chain. The chain length (500 to 6000 glucose units) can vary depending on the 91
botanical origin of the starch. Due to its simpler polymeric structure, amylose has a greater 92
propensity to deposit in the shape of crystals formed in a regular manner. The chain of 93
amylopectin contains only up to 30000 glucose units. However, the large quantity of 94
branching in amylopectin gives it a molecular weight that is 1000 times as high as that of 95
amylose. Amylopectin is one of the largest biopolymers with a molecular weight of 400 96
million (Whistle and Bemiller 1994, Tester et al. 2004, Dumitriu 2005). 97
The production of guar gum is based on its extraction from the leguminous shrub Cyamopsis 98
tetragonoloba, which utilizes it as a food and/or water storage. Due to its chemical compound 99
guar is a galactomannan with (1 4)-linked β-D-mannopyranose backbone with branch 100
points stemming from their 6-positions linked to α-D-galactose (i.e. 1 6-linked-α-D-101
galactopyranose). It is known that for every galactose unit there are 1,5 to 2 mannose residues 102
(Phillips and Williams 2000). Starch and guar gum are used in many types of food in order to 103
improve their stability and texture (Dumitriu 2005). The application of the above-mentioned 104
polysaccharide hydrocolloids is linked with obtaining the required physical properties of food. 105
As regards their diverse application in the food industry, the knowledge of their mechanical 106
properties is required at the stage of designing both a new food product and new technological 107
lines (Slattery et al. 2000, Jobling 2004). From the technological point of view, the 108
viscoelastic behaviour is essential, as it makes it possible to observe various phenomena 109
occurring in food, such as stress relaxation, ageing, phase transitions, etc. 110
Application of the creep test and the regularisation methods in the analysis of the 111
viscoelastic properties of aqueous solutions of polysaccharides hydrocolloids 112
The regularisation method has been successfully used for the estimation of the parameters of 113
rheological functions for synthetic polymers in a melted state, as well as in their solutions 114
(Weese and Friedrich 1994, Tan et al. 2000). The empirical data collected during the analysis 115
of the viscoelastic properties of synthetic polymers opened a new way to the application of 116
regularisation in biopolymers science. They enabled scientists to find the estimators of the 117
rheological functions which describe the behaviour of e.g. dough and pastes of various types. 118
Mao et al. (2000) carried out tests on polysaccharide gels containing gellan gum and/ or 119

carrageenan. In their study, the influence of the concentration and the addition of polyvalent 120
salts under the normal stress relaxation was assessed. The continuous spectra of relaxation 121
were determined with the help of the regularisation method. The authors discussed the process 122
of the development of the relaxation spectrum in time. Moreover, they compared the results 123
obtained by means of the adjustment of several discrete elements with the continuous 124
relaxation spectrum. 125
Ptaszek and Grzesik (2007) analysed the viscoelastic properties of starch which contained 126
pastes of various botanical origin as well as non-starch hydrocolloids. The studies were 127
carried out with the help of the oscillatory shear flow. The data analysis followed the principle 128
of the time and the temperature superposition. Then, the continuous spectra of the stress 129
relaxation were determined by means of the Maxwell model and the regularisation method. 130
There are also a number of research projects devoted to the studies of the creep of starch paste 131
and gels. 132
Xu et al. (2008) analysed the viscoelastic properties of rice starch pastes. They used the 133
discrete Burger model in their data analysis. As a result, the most likely time of the 134
viscoelastic retardation and the immediate compliance as well as the Newtonian viscosity 135
were determined. The authors found a correlation between the parameters of the adjusted 136
model and the fat and amylose content in the starch tested. 137
Onyango et al. (2009) analysed the phenomenon of creep and recovery in the bread dough of 138
sorgo starch (sorhgum) and manioc (cassava) blended with plasticizers. The authors 139
determined the basic viscoelastic parameters resulting from the Burger model. 140
Sodhi et al. (2010) were used continuous Maxwell model to described viscoelastic properties 141
of rice starch gels. Authors were estimated continuous relaxation spectra by Tikhonov 142
regularization methods. 143
As mentioned above, the conducted studies relate both to the analysis of the shear stress and 144
the normal stress. They offer a complete picture of the linear relaxation phenomena occurring 145
in the analysed materials. However, there is a shortage of an analogical description of the 146
retardation properties with the use of the continuous rheological models. Moreover, the 147
analysis of the evolution of the retardation phenomenon during the experiment is lacking. The 148
authors do not search for variations and the amount of the most likely retardation times 149
originating from the discrete models. The analysis of the time evolution of the retardation 150
processes in the function of an experimental time can provide valuable information regarding 151
the formation and the evolution of these phenomena. Such analysis is possible only when the 152
continuous retardation spectra are used. 153

The aim 154
The aim of this study was to determine the retardation spectra of the corn starch - guar gum 155
and the waxy starch - guar gum systems on the basis of the continuous Burger model. In order 156
to solve this problem, the Tikhonov regularization method was used. The evolution of the 157
retardation spectra in the function of experimental time was analysed. 158
Materials and methods 159
A waxy corn starch (WS) and a regular corn starch (CS) produced by the National Starch 160
(New Jersey, USA) were used in this research. The guar gum (GG) was supplied by Regis 161
(Krakow, Poland). As the control samples are used: waxy corn starch paste (4.00% wt.), 162
regular corn starch paste (4.00% wt.) and guar gum (1.00% wt.) water solution. The starch 163
paste was prepared in the following way: the starch was dispersed in a proper amount of water 164
and mixed at 30˚C for 15 min. Further, the suspension was transferred to a water bath 165
(95oC±1oC) and mixed for 30 min. In the case of the starch (concentrations range 3.00% wt.-166
3.75% wt.) – hydrocolloid (1.00% wt.-0.25% wt.) mixture, firstly, the hydrocolloid solution 167
was prepared, then starch was added, and the whole mixture was placed in a water bath 168
(95oC±1oC) for 30 min. 169
The rheological measurements 170
The rheological measurements were performed with the help of the rheometer RS-150 Haake 171
(Karlsruhe, Germany) equipped with a cone (angle 2o, din=35mm) - plate sensor. The 172
temperature was controlled by ultrathermostate F6 (Haake, Germany) with a 0.1oC accuracy. 173
The principle of the rheological measurements was to search for a linear viscoelastic area by 174
means of the step function, and finally to create the creep curves. This investigation involved 175
conducting a few deformation measurements in the time function for different stress 176
τo values. Further, the function of creep compliance was calculated according to the 177
following formula: o
ttJ
τγ )(
)( = and if the obtained curves matched each other, it was indicated 178
on the linear viscoelasticity of the system. The curves, also known as the creep compliance 179
curves, obtained in such way were used for further analysis. In the course of the preliminary 180
tests, the value of τo equal to 0.01Pa was determined, for which all the creep tests were 181
performed. The measurements were executed in the following manner: the starch paste or the 182
hydrocolloids solution (95oC), prepared as described above, were placed in a measuring 183

system previously heated to 95oC. Subsequently, the sensor was cooled down to the desired 184
temperature within one hour, and was kept at this temperature for the next 30 min. Then the 185
measurement was taken. The signal was sampled with the frequency of 2 samples per second. 186
In the course of the initial tests, the time creep test was determined as t=300s. The 187
measurements were repeated 5 times for each tested set. All the measurements were taken at 188
t=25oC. 189
Estimation of the retardation spectra 190
In the present publication the continuous retardation spectra for the experimental data were 191
determined on the basis of the Burger model eq. (2), using the Tikhonov regularisation 192
method. 193
The minimisation of equation (3) and the search for the regularisation parameter was carried 194
out on the basis of the method proposed by Weese (1992) or Honerkamp and Weese (1990). 195
The numerical calculations were carried out with the use of the custom computer programmes 196
written in the C++ language. 197
The retardation spectra L(λ, t) in the experimental time function were determined as follows: 198
the creep curve J(t) was divided into fragments of length varying from 0 to ti, where ti was 199
calculated from the following relation: ti=ti-1+∆t. Thus, a set of the creep curves was obtained 200
(fig.1). Further, the Burger model was adjusted to each of the curves by means of the 201
regularisation method. As a result, it was possible to collect a set of the retardation spectra 202
L(λ, t) in the retardation time function and the experimental time function. In this publication 203
the total time of the experiment was assumed to be equal to t=300s with the time step ∆t=1s. 204
The shortest time for which an interpretable spectrum was successfully obtained was equal to 205
t0=5s. On this basis the plots of the retardation spectra in the experimental time function were 206
obtained and presented in this study. 207
Results and discussion 208
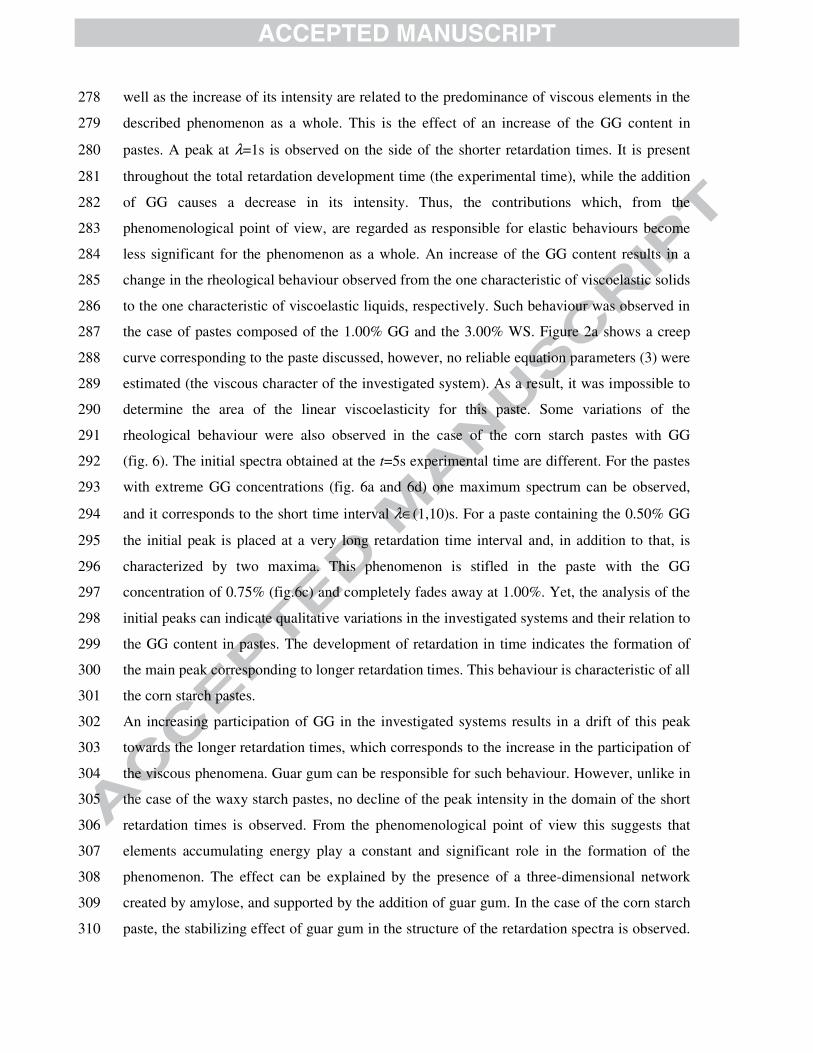
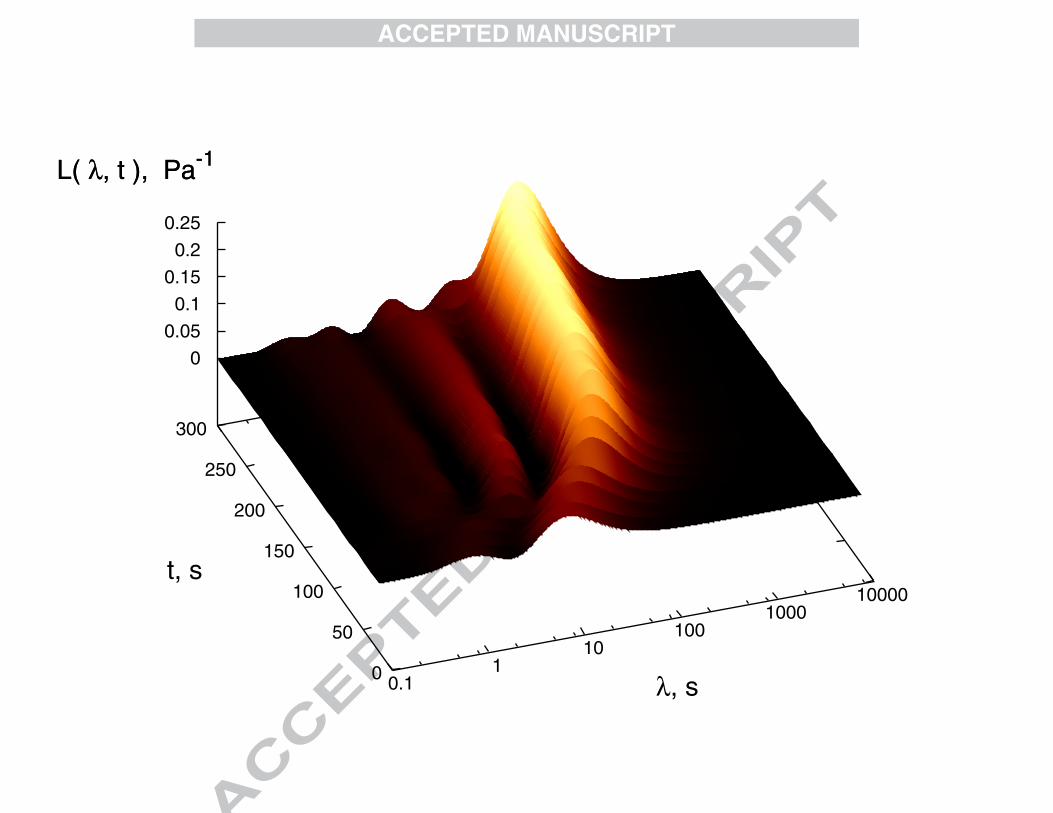
The pure starches pastes 209
The development of the viscoelastic retardation in the case of the application of the 4.00% 210
waxy starch paste (fig. 2a) indicates the complexity of this phenomenon. The initial behaviour 211
of the system is illustrated by one peak with two maxima, which visibly separates into three 212
maxima at about t=140s. At the experimental time equal to t=170s it disintegrates into three 213

separate peaks. A further development of the phenomenon involves an increase of the 214
intensity of these peaks, and the greatest participation in their formation is observed with the 215
peak in the domain of high retardation times. A similar outline of the evolution of the 216
retardation spectrum was observed during the analysis of the behaviour of the 4.00% corn 217
paste (fig. 2b). At the time t=5s the spectrum is composed of one peak with two maxima, and 218
their progression in time is parallel to each other. These maxima do not change their intensity 219
along with the experimental time, whereas the time range λ for which they occur broadens. At 220
the experimental time equal to t=230s this paramodal peak is separated into three clearly 221
visible ones, and their intensity increases. Both starches behave in a similar way, yet the waxy 222
starch peak disintegrates earlier. This phenomenon results from the fact that the accumulation 223
of mechanical energy by the waxy starch containing amylopectin molecules is impossible 224
during the experiment. Also, the three-dimensional network created by the hydrogen bonds is 225
much less complex than in the case of the normal corn starch. Such behaviour can be 226
explained by the presence of amylose and a less branched amylopectin, which molecules can 227
accumulate mechanical energy by means of the elongation of helices in a three-dimensional 228
hydrogen bonds stabilized net. The comparison of the spectra of both pastes indicates that in 229
the case of the waxy starch paste the viscous phenomena contribute greatly to the formation of 230
the rheological behaviour (the peaks in the range of the long retardation times). 231
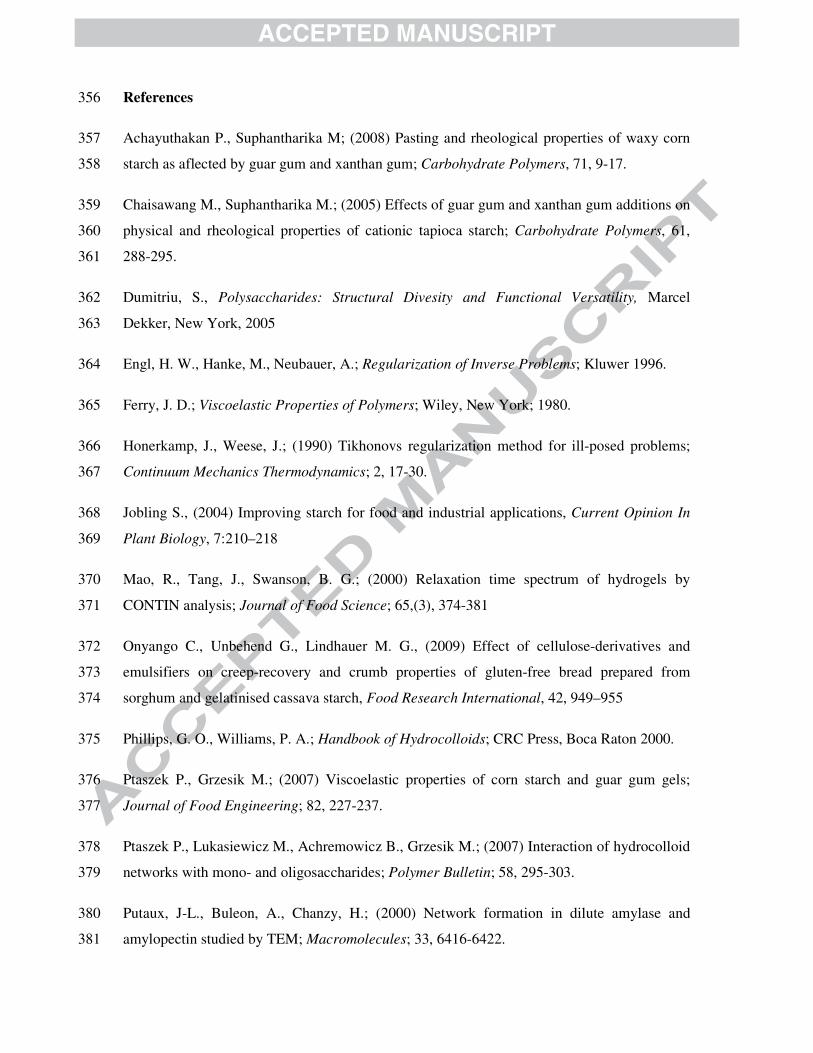
The influence of guar gum on rheological properties of starch pastes 232
The addition of guar gum to the waxy starch paste induced changes in the rheological 233
behaviour. In comparison to the pure starch paste, the value of the instantaneous compliance 234
Jg dropped more than twice (table 1). Moreover, the value of the Newtonian viscosity was 235
estimated. The increase in the concentration of GG caused fluidification of the paste, which 236
was manifested by a decrease in the viscosity value in the pastes concentration function. As a 237
result, in the time domain observed, the creep curves grew steeper (fig. 3a). This results from 238
the fact that in the time domain analysed the rheological behaviour of guar gum is far more 239
viscous than elastic (fig.3b). The nature of this phenomenon can be explained by reference to 240
the creep curve determined for the 1.00% guar gum aqueous solution, where the development 241
is, in fact, represented by a straight line with no retardation zone. The molecular make up of 242
the waxy starch and guar gum should be considered as a source of these developments 243
(Chaisawang and Suphantharika 2005). The waxy starch, which is basically composed of pure 244
amylopectin, shows a weak tendency for aggregation, and these processes occur very slowly 245

in solutions (Tester et al. 2004, Ptaszek et al. 2007, Putaux et al. 2000). On the other hand, 246
guar gum quickly creates very weak three-dimensional structures in solutions, and they are 247
based on a network of entanglements (Achayuthakan and Suphantharika 2008). This causes a 248
decrease in the mobility and the blockage of the aggregation possibilities for large 249
amylopectin molecules. As a result, the decrease in the Newtonian viscosity and the increase 250
of the creep compliance value are observed, moreover, the retardation zone grows steeper. A 251
slightly different situation occurs in the case of normal corn pastes with GG (fig. 4). The 252
creep compliance values decrease almost 100 times more than in the previous case. 253
This phenomenon can be explained by the presence of amylose in the system. This 254
biopolymer creates a three-dimensional hydrogen bonds based network much more quickly 255
than in the case of amylopectin, which makes the system less creep compliance. This is 256
additionally intensified by guar gum, which, in fact, demonstrates interaction with amylose. 257
The higher the content of GG, the lower the creep compliance, which additionally proves the 258
existence of an interaction between the mentioned biopolymers. The structure created is more 259
elastic and, as a result, it accumulates energy more easily. 260
The change of the instantaneous compliance Jg and the Newtonian viscosity in the function of 261
compounds of starch paste (table 1) are also noteworthy. With the increase of the GG 262
concentration, the first value decreases down to a complete disappearance. However, the 263
value of the second parameter (η) for the first three concentrations of GG reaches an infinite 264
value (in the conditions of the experimental time), and only at 1.00% GG concentration a 265
large finite value of the Newtonian viscosity is observed. 266
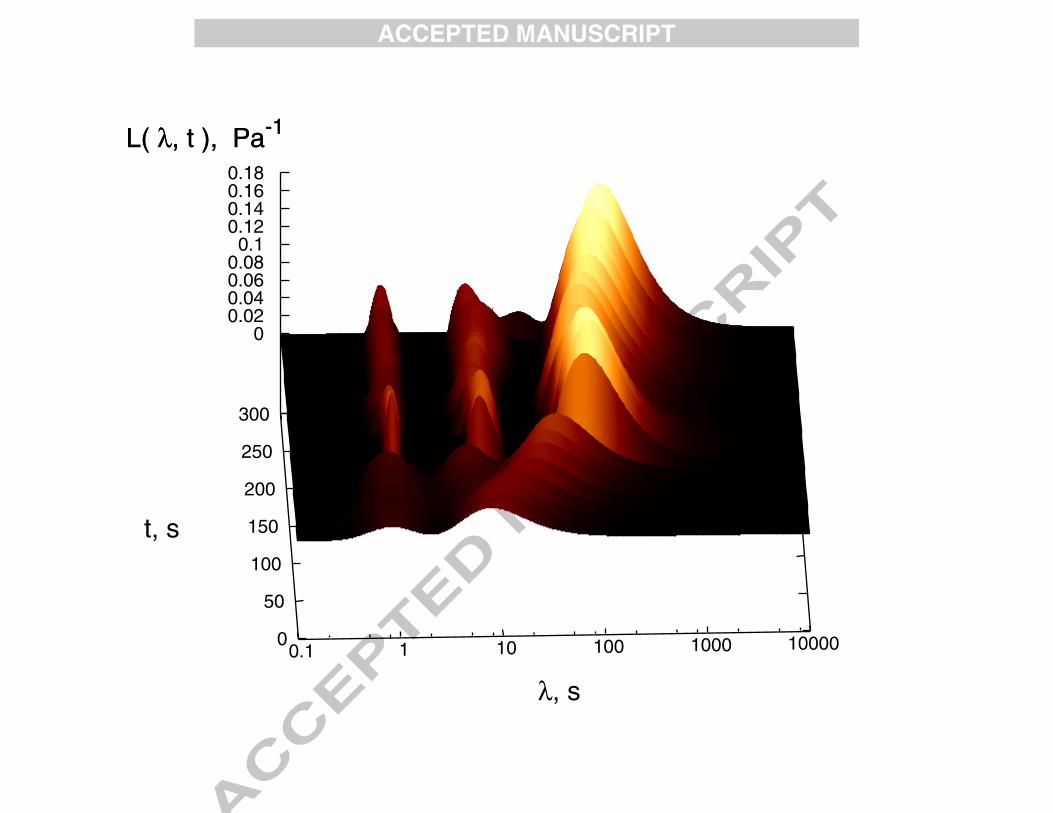
Analysis of retardations spectra 267
The development of the retardation spectra of stresses in the experimental time function for 268
the guar gum waxy starch system is shown in fig. 5. The initial retardation spectrum is similar 269
in all the cases. It is composed of one peak with a maximum at approx. λ=10s. With time, this 270
maximum separates into two, out of which two independent peaks originate. The peak 271
corresponding to the longer retardation times increases its area and drifts towards the longer 272
times. At the experimental time t=150s this peak separates. On the side of the shorter 273
retardation times the peak does not show any drifting tendency on the material time scale and 274
only its height increases. This provides evidence for the increase of the phenomenon intensity 275
and, from the phenomenological point of view, the elements of the shorter characteristic times 276
are responsible for it. The presence of a peak on the side of the longer retardation times as 277
well as the increase of its intensity are related to the predominance of viscous elements in the 278
described phenomenon as a whole. This is the effect of an increase of the GG content in 279
pastes. A peak at λ=1s is observed on the side of the shorter retardation times. It is present 280
throughout the total retardation development time (the experimental time), while the addition 281
of GG causes a decrease in its intensity. Thus, the contributions which, from the 282
phenomenological point of view, are regarded as responsible for elastic behaviours become 283
less significant for the phenomenon as a whole. An increase of the GG content results in a 284
change in the rheological behaviour observed from the one characteristic of viscoelastic solids 285
to the one characteristic of viscoelastic liquids, respectively. Such behaviour was observed in 286
the case of pastes composed of the 1.00% GG and the 3.00% WS. Figure 2a shows a creep 287
curve corresponding to the paste discussed, however, no reliable equation parameters (3) were 288
estimated (the viscous character of the investigated system). As a result, it was impossible to 289
determine the area of the linear viscoelasticity for this paste. Some variations of the 290
rheological behaviour were also observed in the case of the corn starch pastes with GG 291
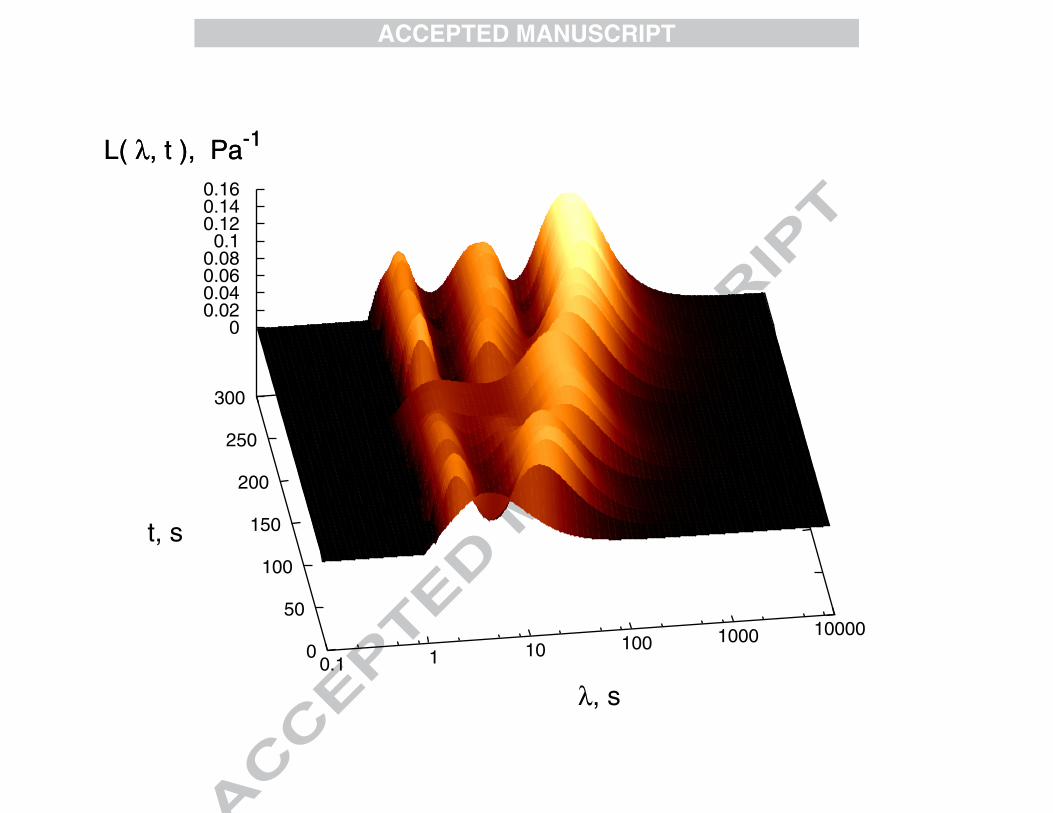
(fig. 6). The initial spectra obtained at the t=5s experimental time are different. For the pastes 292
with extreme GG concentrations (fig. 6a and 6d) one maximum spectrum can be observed, 293
and it corresponds to the short time interval λ∈(1,10)s. For a paste containing the 0.50% GG 294
the initial peak is placed at a very long retardation time interval and, in addition to that, is 295
characterized by two maxima. This phenomenon is stifled in the paste with the GG 296
concentration of 0.75% (fig.6c) and completely fades away at 1.00%. Yet, the analysis of the 297
initial peaks can indicate qualitative variations in the investigated systems and their relation to 298
the GG content in pastes. The development of retardation in time indicates the formation of 299
the main peak corresponding to longer retardation times. This behaviour is characteristic of all 300
the corn starch pastes. 301
An increasing participation of GG in the investigated systems results in a drift of this peak 302
towards the longer retardation times, which corresponds to the increase in the participation of 303
the viscous phenomena. Guar gum can be responsible for such behaviour. However, unlike in 304
the case of the waxy starch pastes, no decline of the peak intensity in the domain of the short 305
retardation times is observed. From the phenomenological point of view this suggests that 306
elements accumulating energy play a constant and significant role in the formation of the 307
phenomenon. The effect can be explained by the presence of a three-dimensional network 308
created by amylose, and supported by the addition of guar gum. In the case of the corn starch 309
paste, the stabilizing effect of guar gum in the structure of the retardation spectra is observed. 310

A visible reduction in the maxima and an increase in the distances between them occur along 311
with an larger content of GG in the system. 312
In the domain of the short retardation times the replacement of starch with GG involves a 313
characteristic decrease in the intensity of some bands, or their decline, which is a result of the 314
partial substitution of starch by GG in the hydrocolloids blend guar gum content in the 315
hydrocolloid blend. Also, an increase in the intensity of the peak placed in the domain of the 316
long retardation times is observed. Moreover, in all the cases a drift of this peak towards the 317
longer retardation times is observed. This effect becomes more visible with the increase of the 318
guar gum content in the system. 319
Conclusions 320
The continuous Burger model and the regularisation method can be successfully applied in the 321
analysis of the creep experimental data for starch and guar gum solutions. In the course of 322
study it was determined that the retardation spectrum is not constant over the experimental 323
time. The evolution of the spectrum is of both a quantitative and a qualitative nature. The 324
quantitative development is manifested as an increase in the peaks intensity at the 325
experimental time. The qualitative variations are associated with the formation of new peaks 326
during the experiment as well as a drift of the existing ones. It shows that with time some 327
new, hitherto unrelated elements begin to occur in the retardation process. The peaks 328
evolution can be explained on the basis of the structure of the phenomenological model. The 329
Burger model is composed of the Kelvin-Voigt elements series. It has been established that 330
the dashpot and the spring deform equally under the influence of the stress applied. Thus, the 331
evolution of the retardation times development in the function of the experimental time can 332
originate from various mechanical properties of the K-V elements. The stress operating at a 333
real time results in the accumulation of some energy in these elements. 334
Initially, all the K-V elements in the experiment react in a similar way to the stress applied, 335
because they accumulate small amounts of energy. It becomes clear with time that each 336
element can accumulate a different amount of energy. This is caused by the fact that each 337
element shows a different ratio of a dashpot viscosity to the spring constant, and thus a 338
different retardation time. 339
The viscoelastic behaviour of the waxy and the corn starch pastes is very complex. The 340
retardation spectra developing during the experiment undergo a visible evolution, which 341
includes a decomposition and a formation of new peaks. The replacement of corn starch with 342

guar gum results in a visible decrease of the creep compliance and a change in the nature of 343
the system, from a viscoelastic solid to a viscoelastic liquid. In the retardation spectra it is 344
marked by a drift of the main peak towards the longer retardation times. The interaction 345
between amylose from corn starch and GG is also reflected in the structure of the retardation 346
spectra. It is possible to observe a peak independently of the GG concentration and the 347
experimental time, and it corresponds to the short relaxation times. The replacement of waxy 348
starch with guar gum causes the reduction of peaks in the domain of the shorter retardation 349
times. 350
As demonstrated in the above picture of the retardation behaviour, the replacement of starch 351
(normal and waxy) with guar gum results in a visible peak drift towards the longer retardation 352
times, which can be explained by the aforementioned more viscous character of the systems. 353
The analysis of the development of the retardation phenomenon with the help of the 354
continuous retardation spectra allows for a thorough assessment of this phenomenon. 355
References 356
Achayuthakan P., Suphantharika M; (2008) Pasting and rheological properties of waxy corn 357
starch as aflected by guar gum and xanthan gum; Carbohydrate Polymers, 71, 9-17. 358
Chaisawang M., Suphantharika M.; (2005) Effects of guar gum and xanthan gum additions on 359
physical and rheological properties of cationic tapioca starch; Carbohydrate Polymers, 61, 360
288-295. 361
Dumitriu, S., Polysaccharides: Structural Divesity and Functional Versatility, Marcel 362
Dekker, New York, 2005 363
Engl, H. W., Hanke, M., Neubauer, A.; Regularization of Inverse Problems; Kluwer 1996. 364
Ferry, J. D.; Viscoelastic Properties of Polymers; Wiley, New York; 1980. 365
Honerkamp, J., Weese, J.; (1990) Tikhonovs regularization method for ill-posed problems; 366
Continuum Mechanics Thermodynamics; 2, 17-30. 367
Jobling S., (2004) Improving starch for food and industrial applications, Current Opinion In 368
Plant Biology, 7:210–218 369
Mao, R., Tang, J., Swanson, B. G.; (2000) Relaxation time spectrum of hydrogels by 370
CONTIN analysis; Journal of Food Science; 65,(3), 374-381 371
Onyango C., Unbehend G., Lindhauer M. G., (2009) Effect of cellulose-derivatives and 372
emulsifiers on creep-recovery and crumb properties of gluten-free bread prepared from 373
sorghum and gelatinised cassava starch, Food Research International, 42, 949–955 374
Phillips, G. O., Williams, P. A.; Handbook of Hydrocolloids; CRC Press, Boca Raton 2000. 375
Ptaszek P., Grzesik M.; (2007) Viscoelastic properties of corn starch and guar gum gels; 376
Journal of Food Engineering; 82, 227-237. 377
Ptaszek P., Lukasiewicz M., Achremowicz B., Grzesik M.; (2007) Interaction of hydrocolloid 378
networks with mono- and oligosaccharides; Polymer Bulletin; 58, 295-303. 379
Putaux, J-L., Buleon, A., Chanzy, H.; (2000) Network formation in dilute amylase and 380
amylopectin studied by TEM; Macromolecules; 33, 6416-6422. 381

Slattery C. J., Kavakli I. H., Okida W. T., (2000) Engineering starch for increased quantity 382 and quality. Trends in Plant Science, 5:291–298. 383
Sodhi, N. S., Sasaki, T., Lu, Z-H & Kohyama, K.; (2010) Phenomenological viscoelasticity of 384 some rice starch gels; Food Hydrocolloids, In Press, Available online 6 January 2010 385
Tan, H., Tam, K. C., Jenkins, R. D.; (2000) Relaxation spectra and viscoelastic behaviour of a 386
model hydrophobically modified alkali-soluble emulsion (HASE) polymer in salt/SDS 387
solutions, Journal of Colloid and Interface Science; 231, 52-58. 388
Tester R. F., Karkalas J., Qi X.; (2004) Starch composition, fine structure and architecture; 389
Journal of Cereal Science; 39, 151-165. 390
Tikhonov, A. N., Goncharsky, A. V., Stepanov, V. V., Yagola, A. G.;Numerical Methods for 391
the Solution of Ill-Posed Problems; Kluwer 1995. 392
Tschoegl, N. W.; The Phenomenological Theory of Linear Viscoelastic Behaviour; Springer 393
1989. 394
Weese J.; (1992) A reliable and fast method for solution of Fredholm integral equations of the 395
first kind based on Tikhonov regularization. Computer Physics Communications, 69, 99-111. 396
Weese, J., Friedrich Chr.; (1994) Relaxation Time Spectra in Rheology: Calculation and 397
Examples. Rheology, 6, 69-76 398
Whistle R. L.,Bemiller J. N.; Starch: Chemistry and Technology; Academic Press 1994. 399
Xu Y-L., Xiong S-B., Li Y-B., Zhao S-M., (2008), Study on creep properties of indica rice 400
gel, Journal of Food Engineering, 86, 10–16 401
Fig.1. Exemplary set of creep curves. 402
Fig. 2. Evolution of retardation spectra and creep curves for 4.00% a) waxy starch pastes b) corn starch pastes. 403
Fig.3.Creep curves for a) waxy starch pastes with GG b) aqueous solution of guar gum. 404
Fig. 4. Creep curves of 4.00% corn starch pastes with guar gum. 405
Fig. 5. Evolution of retardation spectra of waxy starch pastes with guar gum a) 0.25% GG 3.75% WS, b) 0.50% 406 GG 3.50% WS, c) 0.75% GG 3.25% WS. 407
Fig.6. Evolution of retardation spectra of corn starch pastes with guar gum: a) 0.25% GG 3.75% CS, b) 0.50% 408 GG 3.50% CS, c) 0.75% GG 3.25% CS, d) 1.00% GG 3.00% CS. 409

0
0.05
0.1
0.15
0.2
0.25
0.3
0 50 100 150 200 250 300
J,
Pa
-1
t, s
tk=10s 0
0.05
0.1
0.15
0.2
0.25
0.3
0 50 100 150 200 250 300
J, P
a-1
t, s
tk=70s
0
0.05
0.1
0.15
0.2
0.25
0.3
0 50 100 150 200 250 300
J,
Pa
-1
t, s
tk=170s 0
0.05
0.1
0.15
0.2
0.25
0.3
0 50 100 150 200 250 300
J, P
a-1
t, s
tk=300s

0.3
0.4
0.5
0.6
0.7
0.8
0.9
1
1.1
0 50 100 150 200 250 300
J, P
a-1
t, s
WS 4.00%Model
0.1 1 10 100 1000 10000
0 50
100 150
200 250
300
0 0.2 0.4 0.6 0.8
1 1.2
L( λ, t ), Pa-1
λ, s
t, s
L( λ, t ), Pa-1
0.124
0.126
0.128
0.13
0.132
0.134
0.136
0.138
0 50 100 150 200 250 300
J,
Pa
-1
t, s
MS 4.00%Model
0.1 1 10 100 1000 10000 0 50
100 150
200 250
300
0 0.05
0.1 0.15
0.2 0.25
0.3
L( λ, t ), Pa-1
λ, s
t, s
L( λ, t ), Pa-1
0
0.2
0.4
0.6
0.8
1
1.2
1.4
1.6
1.8
0 50 100 150 200 250 300
J,
Pa
-1
t, s
GG 0.25% WS 3.75%GG 0.50% WS 3.50%GG 0.75% WS 3.25%GG 1.00% WS 3.00%
Model

0
5
10
15
20
25
30
35
40
0 50 100 150 200 250 300
J, P
a-1
t, s
GG 1.00%Model

0
0.05
0.1
0.15
0.2
0.25
0.3
0.35
0 50 100 150 200 250 300
J, P
a-1
t, s
GG 0.25% CS 3.75%GG 0.50% CS 3.50%GG 0.75% CS 3.25%GG 1.00% CS 3.00%
Model
0.1 1 10 100 1000 10000 0
50
100
150
200
250
300
0 0.02 0.04 0.06 0.08
0.1 0.12 0.14 0.16
L( λ, t ), Pa-1
λ, s
t, s
L( λ, t ), Pa-1
0.1 1 10 100 1000 10000 0
50
100
150
200
250
300
0 0.02 0.04 0.06 0.08
0.1 0.12 0.14 0.16 0.18
L( λ, t ), Pa-1
λ, s
t, s
L( λ, t ), Pa-1
0.1 1
10 100
1000 10000
0
50
100
150
200
250
300
0
0.05
0.1
0.15
0.2
0.25
L( λ, t ), Pa-1
λ, s
t, s
L( λ, t ), Pa-1

0.1 1
10 100
1000 10000
0 50
100 150
200 250
300
0 0.005
0.01 0.015
0.02 0.025
0.03 0.035
0.04
L( λ, t ), Pa-1
λ, s
t, s
L( λ, t ), Pa-1

0.1 1 10 100 1000 10000 0
50
100
150
200
250
300
0 0.01 0.02 0.03 0.04 0.05 0.06
L( λ, t ), Pa-1
λ, s
t, s
L( λ, t ), Pa-1

0.1 1
10 100
1000 10000
0
50
100
150
200
250
300
0 0.01 0.02 0.03 0.04 0.05 0.06 0.07 0.08 0.09
L( λ, t ), Pa-1
λ, s
t, s
L( λ, t ), Pa-1

0.1 1 10 100 1000 10000 0
50
100
150
200
250
300
0 0.01 0.02 0.03 0.04 0.05 0.06 0.07
L( λ, t ), Pa-1
λ, s
t, s
L( λ, t ), Pa-1
Table 1. The values of Burger’s model parameters 410
,gJ Pa-1 ,η Pas
Guar gum* 0.407±0.004 8.575±0.002
Waxy starch 0.369±0.003 -
Corn starch 0.139±0.001 -
0.25% GG 0.182±0.020 16949±21
0.50% GG 0.088±0.010 2257±16
0.75% GG 0.061±0.011 1508±14
Guar gum-
waxy starch
system
1.00% GG** 0.063 320
0.25% GG (3.255±0.001)�10-2 -
0.50% GG (1.180±0.001)�10-2 -
0.75% GG (0.710±0.001)�10-2 -
Guar gum-
corn starch
system
1.00% GG - 4166±18
*values estimated for one Maxwell’s element 411
**values approximated for experimental data 412
413