The Ties That Bind: Measuring the Strength of · The Ties That Bind: Measuring the Strength of THE...
15
The Ties That Bind: Measuring the Strength of Consumers’ Emotional Attachments to Brands THE TIES THAT BIND THOMSON, MACINNIS, PARK Matthew Thomson Queen’s School of Business, Queen’s University Deborah J. MacInnis and C. Whan Park Marshall School of Business, University of Southern California. Extant research suggests that consumers can become emotionally attached to consumption ob- jects, including brands. However, a scale to measure the strength of consumers’ emotional at- tachments to brands has yet to be devised. We develop such a scale in Studies 1 and 2. Study 3 validates the scale’s internal consistency and dimensional structure. Study 4 examines its con- vergent validity with respect to four behavioral indicators of attachments. Study 5 demonstrates discriminant validity, showing that the scale is differentiated from measures of satisfaction, in- volvement, and brand attitudes. That study also examines the scale’s predictive validity, show- ing that it is positively associated with indicators of both commitment and investment. The lim- itations of the scale and the boundary conditions of its applicability are also discussed. Although consumers interact with thousands of products and brands in their lives, they develop an intense emotional at- tachment (EA) to only a small subset of these objects (e.g., Schouten & McAlexander, 1995). The possibility that con- sumers can develop strong emotional attachments to brands is interesting as attachment theory in psychology (Bowlby, 1979) suggests that the degree of emotional attachment to an object predicts the nature of an individual’s interaction with the object. For example, individuals who are strongly at- tached to a person are more likely to be committed to, invest in, and make sacrifices for that person (Bowlby, 1980; Hazan & Shaver, 1994). Analogously, consumers’emotional attach- ments to a brand might predict their commitment to the brand (e.g., brand loyalty) and their willingness to make financial sacrifices in order to obtain it (e.g., to pay a price premium). Unfortunately, no empirically tested measure of consumers’ emotional attachment to brands is available. Consequently, it has been difficult for both researchers and practitioners to ap- praise the strength of the relationship between consumers and brands. In this article, we (a) develop a psychometrically reliable measure of the strength of consumers’ emotional attachments to brands and (b) demonstrate its validity (discriminant, con- vergent, and predictive). Following procedures recom- mended by Churchill (1979a, 1979b), we specify the domain of a construct that reflects consumers’EA to brands. Items in the domain are reduced to a parsimonious set based on results from two measure-development studies. Three subsequent studies are designed to assess the reliability and validity of this scale. Study 3 validates the internal consistency and structure of the EA scale using a new sample of respondents. Study 4 assesses its convergent validity, appraising the extent to which it maps onto four attachment behaviors identified in the psychology literature. Study 5 assesses the scale’s discriminant validity, assessing the extent to which it is dif- ferentiated from potentially related constructs commonly studied in the marketing discipline (e.g., attitude favorability, satisfaction, and involvement). Study 5 also investigates the scale’s predictive validity, examining the extent to which it predicts outcomes purported to emerge from strong emo- tional attachments such as commitment (brand loyalty) and investment (willingness to pay a price premium). THEORETICAL BACKGROUND What Is an Attachment? The pioneering work on attachment was conducted by Bowlby (1979, 1980) in the realm of parent–infant relation- ships. According to Bowlby, an attachment is an emo- JOURNAL OF CONSUMER PSYCHOLOGY, 15(1), 77–91 Copyright © 2005, Lawrence Erlbaum Associates, Inc. Requests for reprints should be sent to Matthew Thomson, Queen’s School of Business, 143 Union Street, Goodes Hall, Kingston, Ontario, Can- ada, K7L 3N6. E-mail: [email protected]
Transcript of The Ties That Bind: Measuring the Strength of · The Ties That Bind: Measuring the Strength of THE...
The Ties That Bind: Measuring the Strength ofConsumers’ Emotional Attachments to BrandsTHE TIES THAT BINDTHOMSON, MACINNIS, PARK
Matthew ThomsonQueen’s School of Business, Queen’s University
Deborah J. MacInnis and C. Whan ParkMarshall School of Business, University of Southern California.
Extant research suggests that consumers can become emotionally attached to consumption ob-jects, including brands. However, a scale to measure the strength of consumers’ emotional at-tachments to brands has yet to be devised. We develop such a scale in Studies 1 and 2. Study 3validates the scale’s internal consistency and dimensional structure. Study 4 examines its con-vergent validity with respect to four behavioral indicators of attachments. Study 5 demonstratesdiscriminant validity, showing that the scale is differentiated from measures of satisfaction, in-volvement, and brand attitudes. That study also examines the scale’s predictive validity, show-ing that it is positively associated with indicators of both commitment and investment. The lim-itations of the scale and the boundary conditions of its applicability are also discussed.
Although consumers interact with thousands of products andbrands in their lives, they develop an intense emotional at-tachment (EA) to only a small subset of these objects (e.g.,Schouten & McAlexander, 1995). The possibility that con-sumers can develop strong emotional attachments to brandsis interesting as attachment theory in psychology (Bowlby,1979) suggests that the degree of emotional attachment to anobject predicts the nature of an individual’s interaction withthe object. For example, individuals who are strongly at-tached to a person are more likely to be committed to, investin, and make sacrifices for that person (Bowlby, 1980; Hazan& Shaver, 1994). Analogously, consumers’emotional attach-ments to a brand might predict their commitment to the brand(e.g., brand loyalty) and their willingness to make financialsacrifices in order to obtain it (e.g., to pay a price premium).Unfortunately, no empirically tested measure of consumers’emotional attachment to brands is available. Consequently, ithas been difficult for both researchers and practitioners to ap-praise the strength of the relationship between consumersand brands.
In this article, we (a) develop a psychometrically reliablemeasure of the strength of consumers’emotional attachmentsto brands and (b) demonstrate its validity (discriminant, con-
vergent, and predictive). Following procedures recom-mended by Churchill (1979a, 1979b), we specify the domainof a construct that reflects consumers’EA to brands. Items inthe domain are reduced to a parsimonious set based on resultsfrom two measure-development studies. Three subsequentstudies are designed to assess the reliability and validity ofthis scale. Study 3 validates the internal consistency andstructure of the EA scale using a new sample of respondents.Study 4 assesses its convergent validity, appraising the extentto which it maps onto four attachment behaviors identified inthe psychology literature. Study 5 assesses the scale’sdiscriminant validity, assessing the extent to which it is dif-ferentiated from potentially related constructs commonlystudied in the marketing discipline (e.g., attitude favorability,satisfaction, and involvement). Study 5 also investigates thescale’s predictive validity, examining the extent to which itpredicts outcomes purported to emerge from strong emo-tional attachments such as commitment (brand loyalty) andinvestment (willingness to pay a price premium).
THEORETICAL BACKGROUND
What Is an Attachment?
The pioneering work on attachment was conducted byBowlby (1979, 1980) in the realm of parent–infant relation-ships. According to Bowlby, an attachment is an emo-
JOURNAL OF CONSUMER PSYCHOLOGY, 15(1), 77–91Copyright © 2005, Lawrence Erlbaum Associates, Inc.
Requests for reprints should be sent to Matthew Thomson, Queen’sSchool of Business, 143 Union Street, Goodes Hall, Kingston, Ontario, Can-ada, K7L 3N6. E-mail: [email protected]
tion-laden target-specific bond between a person and a spe-cific object. Attachments vary in strength, and strongerattachments are associated with stronger feelings of connec-tion, affection, love, and passion (cf. Aron & Westbay, 1996;Bowlby, 1979; Brennan, Clark, & Shaver, 1998; Collins &Read, 1990, 1994; Feeney & Noller, 1996; Fehr & Russell,1991; Sternberg, 1987). The desire to make strong emotionalattachments to particular others serves a basic human need(Ainsworth, Blehar, Waters, & Wall, 1978; Bowlby, 1980),beginning from a child’s attachment to his or her mother(Bowlby, 1979, 1980) and continuing through the adult stagewith romantic relationships (Hazan & Shaver, 1994), kin-ships, and friendships (Trinke & Bartholomew, 1997; Weiss,1988).
Various behaviors reveal the existence of strong attach-ments (Bowlby, 1980; Hazan & Zeifman, 1999). The stron-ger one’s attachment to an object, the more likely one is tomaintain proximity to the object. When people experiencestress in the external environment, they often seek physical orpsychological protection from the attachment object. More-over, when individuals experience real or threatened separa-tion from the attachment object, distress can result.
The intensity of an attachment has typically been inferredfrom the aforementioned attachment behaviors, particularlyin the context of mother-child relationships. The use of theseobservational indicators is understandable as infants andsmall children are unable to articulate attachment-relatedfeelings. Unfortunately, these indicators are often imperfect.Hazan and Zeifman (1999), for example, noted that “proxim-ity maintenance and separation distress, as well as safe-havenand secure-base behaviors are the data from which the exis-tence and regulatory role of the attachment behavioral sys-tem are inferred” (p. 351). In studying adults and their attach-ments to brands, it should be possible to measure directly theintensity of the emotional attachment itself.
The Relevance of Attachment Constructto Consumer Behavior
People can form emotional attachments to a variety of ob-jects, including pets (Hirschman, 1994; Sable, 1995), places(Rubinstein & Parmelee, 1992), and celebrities (Ad-ams-Price & Greene, 1990; Alperstein, 1991). Similarly, re-search in marketing (Belk, 1988; Kamptner, 1991; R. E.Kleine, Kleine, & Kernan, 1993; S. S. Kleine, Kleine, &Kernan, 1989; Mehta & Belk, 1991) suggests that consumerscan develop attachments to gifts (Mick & DeMoss, 1990),collectibles (Slater, 2000), places of residence (Hill &Stamey, 1990), brands (Schouten & McAlexander, 1995), orother types of special or favorite objects (Ball & Tasaki,1992; Kleine, Kleine, & Allen, 1995; Price, Arnould, &Curasi, 2000; Richins, 1994a, 1994b; Wallendorf & Arnould,1988). The notion that such attachments reflect an emotionalbond is also suggested by research in consumer behavior(e.g., Shimp & Madden, 1988). For example, Slater (2000)
documented that a variety of emotions (e.g., love, warm feel-ings) characterize collectors’ emotional attachments to Cokeand Hallmark. Related work on consumption objects sug-gests that emotions like love (cf. S. S. Kleine, Kleine, & Al-len, 1995; Richins, 1994a, 1994b; Schultz, Kleine, &Kernan, 1989) characterize consumers’ feelings toward spe-cial consumption objects.
Individuals’ emotional attachments to a person predicttheir commitment to the relationship with this person(Drigotas & Rusbult, 1992; Rusbult, 1983). Commitment isdefined as the degree to which an individual views the rela-tionship from a long-term perspective and has a willingnessto stay with the relationship even when things are difficult(van Lange, Rusbult, Drigotas, & Arriaga, 1997). A numberof researchers view commitment as a measure of marketingeffectiveness (Dwyer, Schurr, & Oh, 1987; Moorman,Desphande, & Zaltman, 1993; Morgan & Hunt, 1994). In amarketing context, a relevant indicator of commitment is theextent to which the individual remains loyal to the brand(Garbarino & Johnson, 1999). Given the previous, one mightpropose that a valid measure of emotional attachment shouldpredict consumers’ commitment to a brand, such as their loy-alty to that brand.
Finally, the strength of emotional attachment to an objectmay be associated with investment in the object, that is, thewillingness to forego immediate self-interest to promote a re-lationship (van Lange et al., 1997). To this extent, a validmeasure of emotional attachment should predict consumers’investment in a brand, such as their willingness to pay a pricepremium to obtain it.
Differences Between Emotional Attachmentand Other Marketing Constructs
Emotional attachment should be distinguished from otherconstructs with which it might be correlated, such as brandattitude favorability, satisfaction, and involvement.
Brand attitudes. Consumers who are emotionally at-tached to a brand are also likely to have a favorable attitudetoward it. However, although favorable brand attitudes areoften reflected in strong attachments, the constructs differ inseveral critical ways. First, strong attachments develop overtime and are often based on interactions between an individ-ual and an attachment object (Baldwin, Keelan, Fehr, Enns,& Koh-Rangarajoo, 1996). These interactions encourage thedevelopment of meaning and invoke strong emotions in ref-erence to the attachment object. Attitudes reflect one’sevaluative reactions to an object and these reactions can de-velop without any direct contact with it. Thus, a consumermight have a positive attitude toward an object without everhaving had any experience with it at all.
Second, consumers can have favorable attitudes towardany number of consumption objects and toward objects thathave little centrality or importance to their lives. The objects
78 THOMSON, MACINNIS, PARK
to which consumers are emotionally attached, however, arefew in number and are generally regarded as profound andsignificant (cf. Ball & Tasaki, 1992; Richins, 1994a).
Third, strong attachments are attended by a rich set ofschemas and affectively laden memories that link the objectto the self (Holmes, 2000; Mikulincer, Hirschberger,Nachmias, & Gillath, 2001). In contrast, favorable attitudesdo not necessarily link the object to the self and theself-concept.
Fourth, individuals who are strongly emotionally attachedto an object also display specific behaviors such as proximitymaintenance and separation distress (cf. Bowlby, 1979).These behavioral manifestations are not characteristic of fa-vorable attitudes, the impact of which is highly situation- andcontext-dependent (Sheppard, Hartwick, & Warshaw, 1988).
Finally, individuals who are strongly attached to a personor object are generally committed to preserving their rela-tionship with it (cf. Johnson & Rusbult, 1989; Miller, 1997).This is not necessarily characteristic of favorable attitudes.For example, it would be unusual for a consumer with only afavorable attitude toward a brand to stay committed to it (e.g.,brand loyalty) or pay more for it (e.g., price premium) if amore attractive alternative were introduced. In a similar vein,a strong emotional attachment is characterized by a percep-tion that the object is irreplaceable. In contrast, a consumerwith a positive attitude toward an object may be willing to re-place it with another object that has equally desirable fea-tures.
Satisfaction. An individual who is emotionally at-tached to a brand is likely to be satisfied with it. This satisfac-tion might provide a basis for emotional attachment. Never-theless, satisfaction and attachment are not synonymous.Although two consumers are equally satisfied with a brand’sperformance, they may vary greatly in the extent to whichthey are emotionally attached to it. Satisfaction does not im-ply behavioral manifestations such as proximity mainte-nance and separation distress. Moreover, although satisfac-tion can occur immediately following consumption,emotional attachments tend to develop over time with multi-ple interactions. Finally, satisfaction is an evaluative judg-ment and hence different from the emotionally laden attach-ment construct (cf. Mano & Oliver, 1993).
Involvement. Emotional attachment can also be con-ceptually distinguished from involvement. Involvement is astate of mental readiness that typically influences the alloca-tion of cognitive resources to a consumption object, decision,or action (Park & Mittal, 1985). Emotional attachment goesbeyond mental readiness and resource allocation as it is oftenbeyond one’s volitional control. Further, emotional attach-ments to brands are clearly relevant to the realm of emotions,whereas the concept of involvement arguably taps the realmof cognition.
The previous discussion leads to the idea that a valid scaleof consumers’ emotional attachments to brands should becorrelated with measures of attitude favorability, satisfaction,and involvement as it subsumes these constructs. Neverthe-less, attachment is conceptually distinct from these con-structs and hence should be empirically distinct from them aswell.
Summary
In this article, we advance a reliable and valid scale that re-flects consumers’ emotional attachments to brands. We firstdescribe the construction of the scale on the basis of emotionterms that reflect the strength of consumers’ attachments to abrand. Second, we demonstrate its convergent validity, show-ing that it maps onto measures of proximity maintenance, se-curity seeking, experiencing separation distress, and findinga safe haven in the object under conditions of distress(Bowlby, 1980; Hazan & Zeifman, 1999; see Study 4 later).Third, we demonstrate discriminant validity, showing thatthe measure is empirically distinct from measures of brandattitude favorability, satisfaction, and involvement. Finally,we provide evidence of predictive validity, showing that thescale predicts outcomes such as commitment to (loyalty to-ward) the brand and willingness to invest in it (to pay a pre-mium price for it).
STUDY 1
To develop a parsimonious yet representative scale of thestrength of consumers’ emotional attachments to brands, wefollowed procedures for scale development advocated byChurchill (1979a, 1979b). Our first goal was to identify a setof items designed to tap the construct of emotional attach-ment.
To attain this objective, we asked 68 students to identify abrand to which they were strongly emotionally attached. Par-ticipants then completed a survey composed of 39 adjectivesthat were potentially relevant, based on the literature on bothperson attachments (e.g., Ball & Tasaki, 1992; Bowlby,1979; Brennan et al., 1998, Collins & Read, 1990, 1994;Feeney & Noller, 1996; Hazan & Shaver, 1994; Hazan &Zeifman, 1994; Schultz et al., 1989), object attachments(e.g., S. S. Kleine, Kleine, & Allen, 1995; Richins, 1994a,1994b) and love (e.g., Aron & Westbay, 1996; Aron, Aron, &Allen, 1998; Fehr & Russell, 1991; Hazan & Shaver, 1987,1994; Hendrick & Hendrick, 1989; Shaver, Schwartz,Kirson, & O’Connor, 1987; Sternberg, 1986, 1987).
Respondents used a 7-point rating scale, ranging from 1(not at all) to 7 (very well), to describe “the extent to whichthe following words describe your typical feelings toward thebrand.” Respondents received one of three versions of thesurvey, each of which presented the items in a different order.Additionally, respondents were asked to list any other emo-
THE TIES THAT BIND 79
tions characterizing their attachments not included in theoriginal list. A total of 10 additional items were named,bringing the list to 49 items.
To reduce the pool, items with mean ratings of less than4.0 along the 7-point Likert scale were eliminated along withwords that respondents free-listed that were synonymouswith those on the original list. We also deleted items that twoindependent judges, blind to the objectives of the research,rated as nonemotional (e.g., “living up to your word”). As aresult, we retained 35 items.
STUDY 2
To reduce further the items identified in Study 1, we asked120 students to think about a brand to which they werestrongly emotionally attached and then to indicate which ofthe items identified in the first study described their feelingsabout it along a scale ranging from 1 (describes poorly) to 7(describes very well). Based on these ratings, we rejecteditems that had both mean ratings below the scale midpointand limited variance (SDs < 1.5). Further, we eliminateditems that over 10% of participants did not rate under the as-sumption that the items were confusing or poorly under-stood.
The remaining items were subjected to a set of explor-atory factor analyses using an oblique rotation. Based on oursample size, any factor loading greater than 0.5 was assumedto have practical significance (Hair, 1995). The final set ofitems reflected a three-factor solution (eigenvalues > 1) andcontained 10 items (see Table 1). The first factor, labeled Af-fection, included the items affectionate, loved, friendly, andpeaceful. Items in this factor reflect the warm-feelings a con-sumer has toward a brand. A second factor, labeled Passionincluded the items passionate, delighted, and captivated. Thisfactor reflects intense and aroused positive feelings toward abrand. A third factor labeled Connection included the items
connected, bonded, and attached. These three items describea consumer’s feelings of being joined with the brand. Thecorrelations between dimensions were all positive and signif-icant (Affection–Connection, r = 0.48; Affection–Passion, r= 0.24; Passion–Connection, r = 0.24). The correlationsamong dimensions increased somewhat in subsequent stud-ies, probably due to the later studies’ larger sample sizes andmore focused instructions to respondents. The alpha reliabil-ity coefficient score for the global EA scale, obtained by av-eraging scores on Affection, Passion, and Connection, wasadequate (α = 0.77) and within Nunnally’s (1978) guidelinesfor scale development.
Although we had not anticipated that the scale would ex-hibit a three dimensional factor structure, the results suggestthe possibility that the items represent three first-order fac-tors that are all linked to a higher second-order factor Emo-tional Attachment. We explore this notion next in Study 3.
STUDY 3
Objectives and Method
Study 3 was designed to confirm the stability of the EA scaleusing a different sample of respondents and to assess the rela-tion among the three factors as first order factor underlyingthe emotional attachment construct.
Sixty-five undergraduate and graduate students wereasked to think about a brand to which they had “some degreeof emotional attachment” and to complete the 10-item EAscale with this brand in mind. Scores on the EA items variedfrom a low of 1 to a high of 7, with item means ranging from4.00 (loved) to 5.10 (delighted) and standard deviations rang-ing from 1.54 (bonded) to 1.74 (passionate). Cronbach’s al-pha reliability coefficient for the EA scale was 0.88.
Results
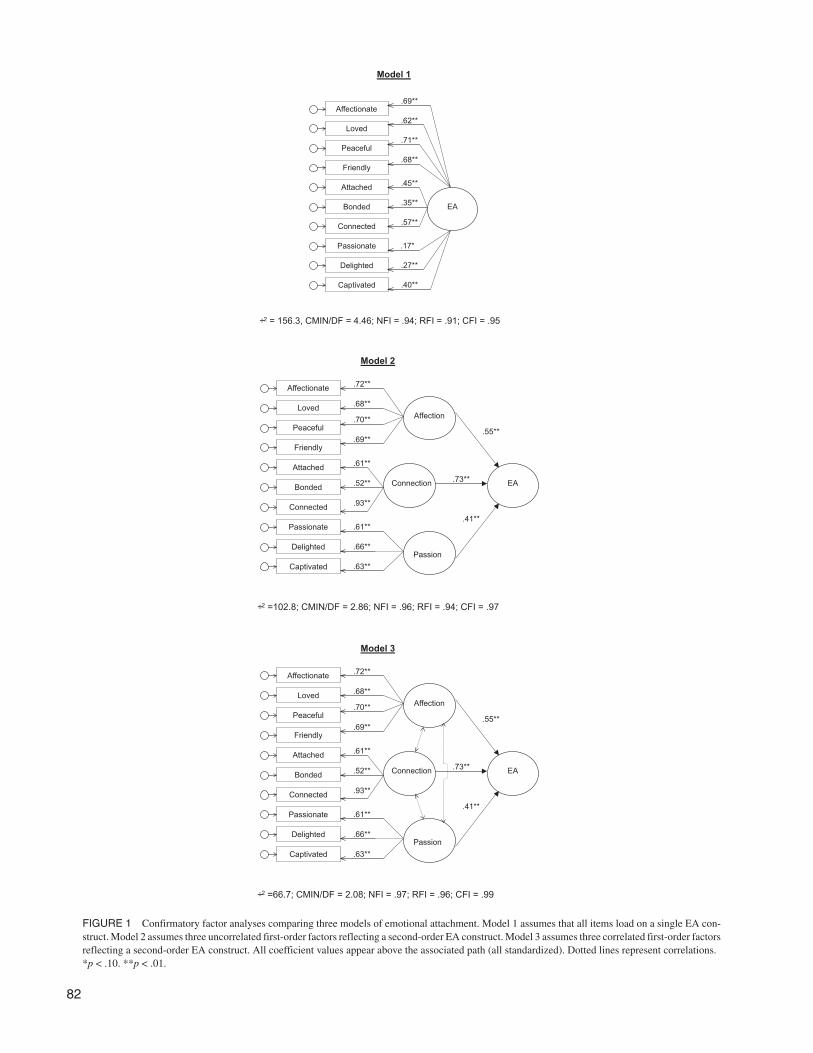
To assess the relation of the scale items to the emotional at-tachment construct, we used structural equation modelingand conducted a set of confirmatory factor analyses corre-sponding to the three models shown in Figure 1.
Model 1 assumes that all 10 items load directly onto a sin-gle latent EA construct. Model 2 assumes three equallyweighted first-order latent factors, labeled Affection, Pas-sion, and Connection, reflecting a single second-order factor(EA) with no correlations permitted among the first-order la-tent factors. (This is analogous to a varimax rotation in an ex-ploratory factor analysis.) Model 3 is similar to Model 2 ex-cept that the first-order factors are modeled as correlated(somewhat comparable to conducting an oblique rotation).The purpose of this model is to test the notion that the threedimensions can be conceptualized as interrelated first orderfactors loading onto a global EA latent construct.
80 THOMSON, MACINNIS, PARK
TABLE 1Study 2: Emotional Attachment Dimensions
Revealed by Exploratory Factor Analysis
Factor
Emotion Item Affection Passion Connection
Affectionate 0.80 0.00 0.27Friendly 0.78 0.17 0.27Loved 0.76 0.18 0.11Peaceful 0.76 0.30 0.23Passionate 0.05 0.80 0.01Delighted 0.26 0.73 0.04Captivated 0.34 0.68 0.42Connected 0.40 –0.07 0.85Bonded 0.07 0.42 0.78Attached 0.25 –0.10 0.73
Note. Factor analysis uses an oblique rotation. Bold values indicate thefactor on which each item predominantly loads.

All three models show that each path is positive and sig-nificant, suggesting that each indicator contributes to the EAconstruct directly (Model 1) or to the first-order factors (Af-fection, Passion, Connection), which are themselves signifi-cantly tied to EA (Models 2 and 3). The fit statistics of eachmodel were subsequently examined to assess which modelbest fits the data. In general, a CMIN/DF (minimum discrep-ancy divided by the degrees of freedom) statistic of less than5 is considered adequate, with lower values being superior.For NFI, RFI and CFI statistics, higher values are superior,with the generally acceptable cutoff point being 0.90 foreach. According to these criteria, any of the three models isacceptable, because each possesses CMIN/DF statistics be-low 5 and NFI (normed fit index), RFI (relative fit index), andCFI (comparative fit index) statistics above 0.90. Howeverthe chi-square statistics that explicitly compare models sug-gest that Model 3 (χ2 = 66.7) is significantly better than bothModels 1 (χ2 = 156.3) and 2 (χ2 = 102.8, ps < 0.01). Model 3holds that Affection, Passion, and Connection are threenonorthogonal first-order factors that correspond with ahigher order EA construct. The similar factor structure foundin both Studies 2 and 3 suggests a stable underlying structureto the EA scale.
STUDY 4
Study 4 was designed to assess the convergent validity of theEA scale. As noted previously, emotional attachments aretheoretically associated with specific behaviors (Bowlby,1980; Hazan & Zeifman, 1999). Specifically, the strength ofan attachment is revealed by the degree of proximity mainte-nance to the attachment object. Proximity confers securityand facilitates successful functioning in the environment. En-vironmental stress triggers a search for the attachment objectas a safe haven from and protector against stress. Finally, be-haviors reflective of psychological distress are observed ifreal or threatened separation from the attachment object oc-curs. Generally, the intensity of an attachment can be inferredfrom the levels of these four attachment behaviors. If the EAmeasure adequately assesses attachment strength, it shouldbe strongly related to these behaviors. This study also exam-ined the relation of each of the three component dimensionsof the EA construct to each of the four attachment behaviors.
Method
One hundred and eighty-four undergraduate students, partic-ipating for class credit, completed one of two versions of asurvey. To create variance on the EA measure, we asked re-spondents to report on a brand to which they had either a“weak” or a “strong attachment.” Respondents were thenasked to report on how they feel about the brand when theythink about it and their relationship with it. Respondents indi-
cated the extent to which each EA item described their emo-tional attachment to the brand.
Next, respondents answered a series of questions based onHazan and colleagues’multi-item measures of the four attach-ment behaviors (Hazan & Shaver, 1994; Hazan & Zeifman,1999) thatwereadapted inpretesting tobesuitable to thebrandrelation context. These measures are multi-item Likert scales,ranging from 1 (strongly disagree) to 7 (strongly agree)wherein respondents rate the extent of their agreement con-cerning how a particular brand makes them feel.
Results
The internal consistencies of scales reflecting emotional at-tachment and the four attachment behaviors were good, withall Cronbach alpha scores at or above 0.87. A set of manipu-lation checks confirmed a significant difference in thestrength of emotional attachment between strong (M = 4.06)and weak (M = 1.96, p < 0.01) attachment conditions, verify-ing that we had created variance in emotional attachmentthrough our manipulation.
Dimensional and item analyses revealed considerablevariance in the 10 indicators of emotional attachment.However, all indicators of EA were significantly greater inthe strong-attachment condition (Ms = 4.35, 3.85, and 3.63,for Connection, Passion, and Affection, respectively) thanin the weak-attachment condition (1.73, 2.02, and 2.10, re-spectively (p < .001, in all cases). There was also consider-able variance in the indicators of attachment behaviors. Allbehaviors were rated more highly in the strong-attachmentcondition (M = 4.35, 3.84, 3.63, and 4.23, for proximity, se-cure base, safe haven, and separation distress, respectively)than in the weak-attachment condition (1.80, 1.56, 1.45,and 1.60, respectively (p < 0.01, in all cases). As shown inTable 2, the three EA dimensions were significantly corre-lated (r > 0.72, p < 0.01), providing ancillary support forStudy 3’s finding of three oblique dimensions. As Table 2also shows, the correlations between each of EA’s three di-mensions and the 4 attachment behaviors were also highlysignificant (all rs 0.66–0.80, ps < 0.01).
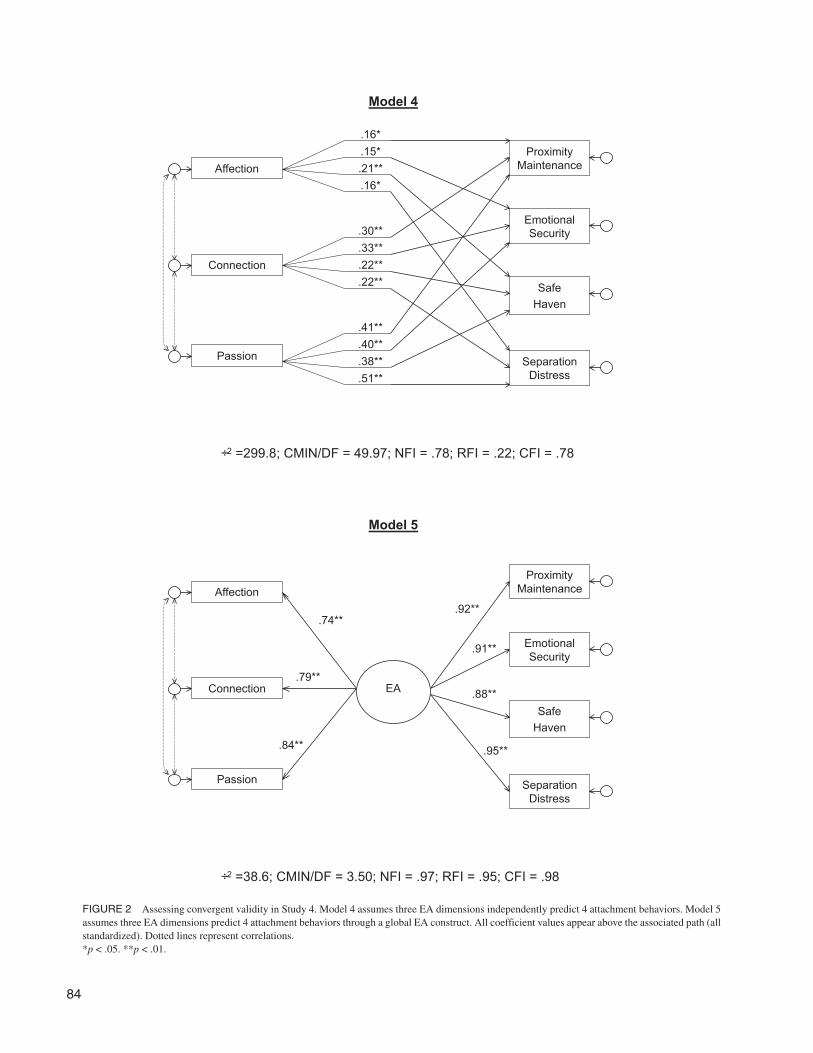
Based on the assumption that EA is composed of threefirst-order factors (see Study 3), we used structural equationmodeling to examine the two models shown in Figure 2.Model 4 tests the independent contribution of each EA di-mension to the prediction of the four attachment behaviors.This structure addresses whether each of the three EA dimen-sions makes an independent contribution to the prediction ofthe dependent variables. The significant coefficients betweenthe three EA dimensions with the four attachment behaviorssuggest they do (see the Model 4 in Figure 2).
However, Model 4 suffers from poor fit. The CMIN/DFstatistic exceeds the rule-of-thumb cutoff of 5, whereaseach of the other fit statistics lies below the acceptable0.90 value. We therefore revisited the approach taken inModel 3 (see Figure 1), which assumes that Affection, Pas-
THE TIES THAT BIND 81
82
FIGURE 1 Confirmatory factor analyses comparing three models of emotional attachment. Model 1 assumes that all items load on a single EA con-struct. Model 2 assumes three uncorrelated first-order factors reflecting a second-order EA construct. Model 3 assumes three correlated first-order factorsreflecting a second-order EA construct. All coefficient values appear above the associated path (all standardized). Dotted lines represent correlations.*p < .10. **p < .01.

sion, and Connection each load onto a latent EA construct.This model, shown as Model 5 in Figure 2, reveals that allpaths are significant and positive. EA is significantly re-lated to proximity (γ = 0.92, p < 0.01), seeking a securebase (γ = 0.91, p < 0.01), finding a safe haven (γ = 0.88, p <0.01), and separation distress (γ =0.95, p < 0.01). Further-more, all of Model 5’s fit statistics are acceptable(CMIN/DF = 3.50; NFI = 0.97; RFI = 0.95; CFI = 0.98).The chi-square value (χ2 = 38.6) also suggests the fit ofModel 5 is significantly better than the fit of Model 4 (χ2 =299.8, p < 0.01). The joint effects of Affection, Passion,and Connection, captured in Model 5 by a single latent EAconstruct, better represent the data than Model 4, whereeach EA component independently predicts the criterionvariables. These results provide good evidence of conver-gent validity for the EA scale and the representation of thethree dimensions as first-order factors that load onto theglobal EA construct.
Discussion
Study 4 supports the convergent validity for the EA measure,as it relates strongly to each of the four attachment behaviors.Although attachment researchers in allied disciplines typi-cally assess the attachment bond based on the existence ofthese behaviors, EA seems to capture the strength of this bondin a manner that is theoretically and empirically consistentwith these behaviors, without the need to resort to the infer-ence of emotional attachment from behaviors. Furthermore,while Model 4 suggests that each of the EA dimensions makesan important contribution to the outcome variables, Model 5proposes that these factors are best represented as first-orderfactors indicating the latent EA construct.
STUDY 5
Study 5 had several objectives. First, we sought to assessthe discriminant validity of the EA scale, showing that it isempirically distinguishable from similar constructs such asattitude favorability, satisfaction, and involvement. The sec-
ond was to assess its predictive validity, showing that varia-tion in EA scores correspond in theoretically consistentways to outcome measures of strong brand attachmentssuch as brand loyalty and willingness to pay a price pre-mium. Finally, we sought to collect data from a more di-verse sample of respondents to address issues ofgeneralizability and external validity.
Method
One hundred and seventy-nine nonstudent respondents weresolicited at a science museum and outside a restaurant andpaid $5 for participating in a study designed to assess “con-sumers’ reactions to brands.” The design was a 1 × 3 be-tween-subjects design with approximately one third of therespondents asked to report on a brand to which they were“strongly,” “moderately,” or “weakly emotionally attached.”Reporting on brands varying in strength of emotional attach-ment served to create variation in EA scores, necessary forexamining its relation to constructs like satisfaction and atti-tude favorability. Respondents varied in age from 16 to 63,with a mean age of 27.
Measures Designed to Assess Convergent andDiscriminant Validity
Support for the convergent validity of the EA scale would beprovided by evidence that the measure is related to, but dif-ferentiated from, such constructs as attitude favorability, sat-isfaction, and involvement. These latter constructs were mea-sured (in the following order) using items derived from priorresearch in marketing.
Brand attitude favorability. We adapted a measure ofbrand attitude (α = 0.94) from Batra and Stayman (1990).Respondents used a four item, 7-point semantic differentialscale ranging from 1 (bad) to 7 (good), 1 (unfavorable) to 7(favorable), 1 (dislikeable) to 7 (likeable), and 1 (disagree-able) to 7 (agreeable) to describe their attitude favorability.
THE TIES THAT BIND 83
TABLE 2Study 4: Correlations Between Emotional Attachment Dimensions and Attachment Behaviors
Subscale 1 2 3 4 5 6 7
1. Connection — 0.79 0.72 0.75 0.75 0.68 0.742. Passion — 0.75 0.77 0.77 0.72 0.803. Affection — 0.69 0.68 0.66 0.704. Proximity maintenance — 0.82 0.77 0.905. Emotional security — 0.86 0.856. Safe haven — 0.847. Separation distress —
Note. ps < 0.01.
84
FIGURE 2 Assessing convergent validity in Study 4. Model 4 assumes three EA dimensions independently predict 4 attachment behaviors. Model 5assumes three EA dimensions predict 4 attachment behaviors through a global EA construct. All coefficient values appear above the associated path (allstandardized). Dotted lines represent correlations.*p < .05. **p < .01.
Satisfaction. We employed an 8-item subset of Manoand Oliver’s (1993) measure of satisfaction (α = 0.90). Thescale uses a 7-point agreement scale and includes such itemsas “If I could do it again, I’d buy a different brand” and “Thisbrand is exactly what I need.”
Involvement. To measure involvement, we employed asubset of items from Zaichkowsky’s (1985) involvementscale (α = 0.94). Specifically, we asked respondents to use a7-point semantic differential scale to rate their self-selectedbrand from 1 (unimportant to me) to 7 (important to me), 1(of no concern to me) to 7 (of concern to me), 1 (irrelevant tome) to 7 (relevant to me), 1 (means nothing to me) to 7(means a lot to me), 1 (useless to me) to 7 (useful to me), and1 (insignificant to me) to 7 (significant to me).
Measures Designed to Assess Predictive Validity
Brand loyalty. We measured brand loyalty (α = 0.86)with a metric adapted from Sirgy, Johar, Samli, andClairborne (1991). Specifically, respondents used a 7-pointsemantic differential scale to answer the following threequestions: (a) “How often have you bought this brand in thepast?” on a scale of 1 (never) to 7 (always), (b) “How wouldyou characterize your loyalty toward this brand?” on a scaleof 1 (very weak) to 7 (very strong), and (c) “How does thisbrand compare to your ‘ideal’ brand?” on a scale of 1 (it isvery far from my ideal brand) to 7 (it is very close to my idealbrand).
Willingness to pay a price premium. Finally, to de-termine if there was a relation between the strength of re-spondents’emotional attachment to a brand and their willing-ness to pay a price premium for that brand, we asked “Yourbrand is one of many brands in the product category. What doyou estimate is the average price of brands in the product cat-egory?” Next, we asked what price respondents were willingto pay for their self-selected brand. Using these two datapoints, we calculated the percentage above or below the aver-age price and used this figure as a measure of the willingnessto pay a price premium. Responses across conditions rangedfrom approximately half to double the average price in thecategory.
Control Variables and Manipulation Checks
To control for the possibility that reported emotional attach-ment scores are affected by age, gender, or mood, we includethree measures of these constructs. None were significant inthe subsequently reported analyses and are not discussed fur-ther. To check whether respondents were reporting on abrand for which they had weak, moderate, or strong emo-tional attachment, we examined responses to a 3-item mea-sure (α = 0.94): “My emotional attachment to the brand is 1
(weak) to 7 (strong), 1 (low) to 7 (high), and 1 (little) to 7 (alot).
Results
Scale stability. The Cronbach’s alpha reliability coeffi-cient for this scale was 0.93. We conducted a confirmatoryfactor analysis identical to Model 3 that represented EA as asecond-order factor indicated by three interrelated first orderfactors, and obtained an identical pattern of results. Spe-cifically, all paths were positive and significant, with good fitstatistics (CMIN/DF = 3.38; NFI = 0.97; RFI = 0.95; CFI =0.98). Overall, these results suggest a good fit of the data andprovide additional support for Model 3’s conceptualizationof the EA construct.
Manipulation check. Consumers’ reported emotionalattachment to the brand averaged 3.04, 4.03, and 5.18 whenthe manipulated levels were weak, moderate, and strong, re-spectively. All means were significantly different from oneanother (p < 0.01). Similarly, an analysis using the EA scaleas the dependent variable revealed that respondents in theweak-attachment condition had lower EA scores (M = 2.86)than those in the moderate-attachment condition (M = 3.48; p< .01), and that respondents in the moderate-attachment con-dition had lower EA scores than those in the strong-attach-ment condition (M = 4.49; p < 0.01).
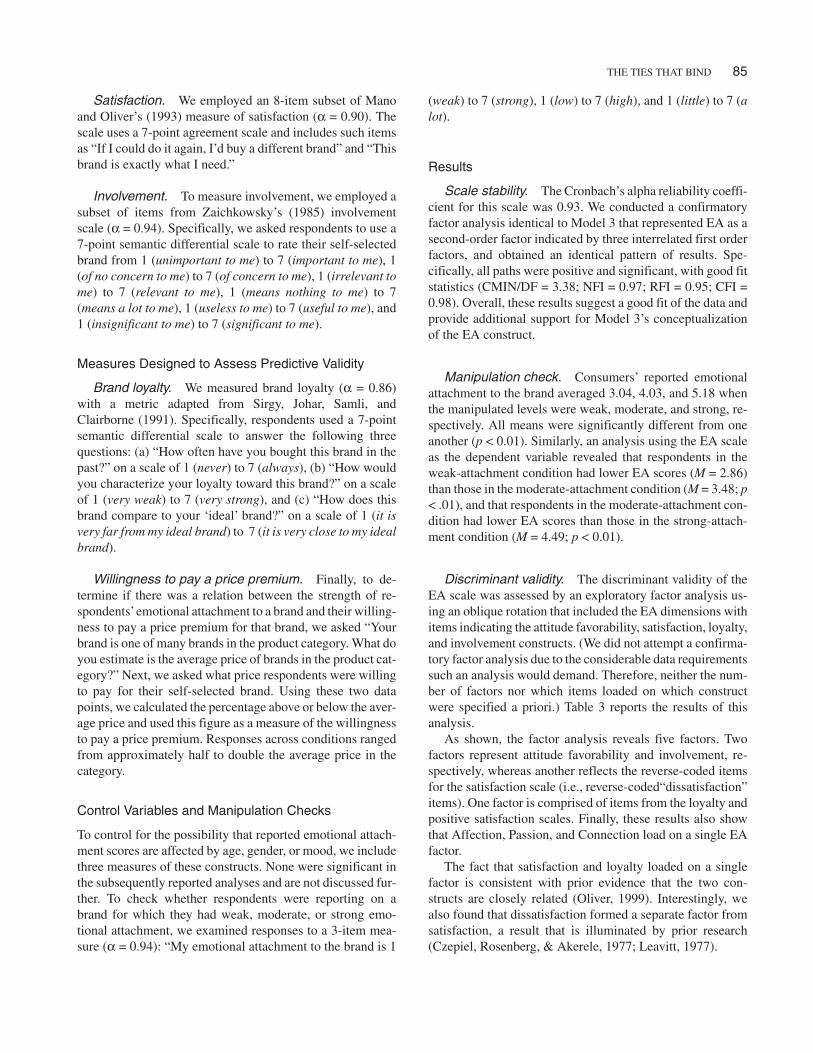
Discriminant validity. The discriminant validity of theEA scale was assessed by an exploratory factor analysis us-ing an oblique rotation that included the EA dimensions withitems indicating the attitude favorability, satisfaction, loyalty,and involvement constructs. (We did not attempt a confirma-tory factor analysis due to the considerable data requirementssuch an analysis would demand. Therefore, neither the num-ber of factors nor which items loaded on which constructwere specified a priori.) Table 3 reports the results of thisanalysis.
As shown, the factor analysis reveals five factors. Twofactors represent attitude favorability and involvement, re-spectively, whereas another reflects the reverse-coded itemsfor the satisfaction scale (i.e., reverse-coded“dissatisfaction”items). One factor is comprised of items from the loyalty andpositive satisfaction scales. Finally, these results also showthat Affection, Passion, and Connection load on a single EAfactor.
The fact that satisfaction and loyalty loaded on a singlefactor is consistent with prior evidence that the two con-structs are closely related (Oliver, 1999). Interestingly, wealso found that dissatisfaction formed a separate factor fromsatisfaction, a result that is illuminated by prior research(Czepiel, Rosenberg, & Akerele, 1977; Leavitt, 1977).
THE TIES THAT BIND 85
Convergent validity. Table 4 shows the correlationsbetween EA and the revealed factors from this analysis. Asexpected, correlations of these factors with the EA scale weresignificant but generally modest in size.
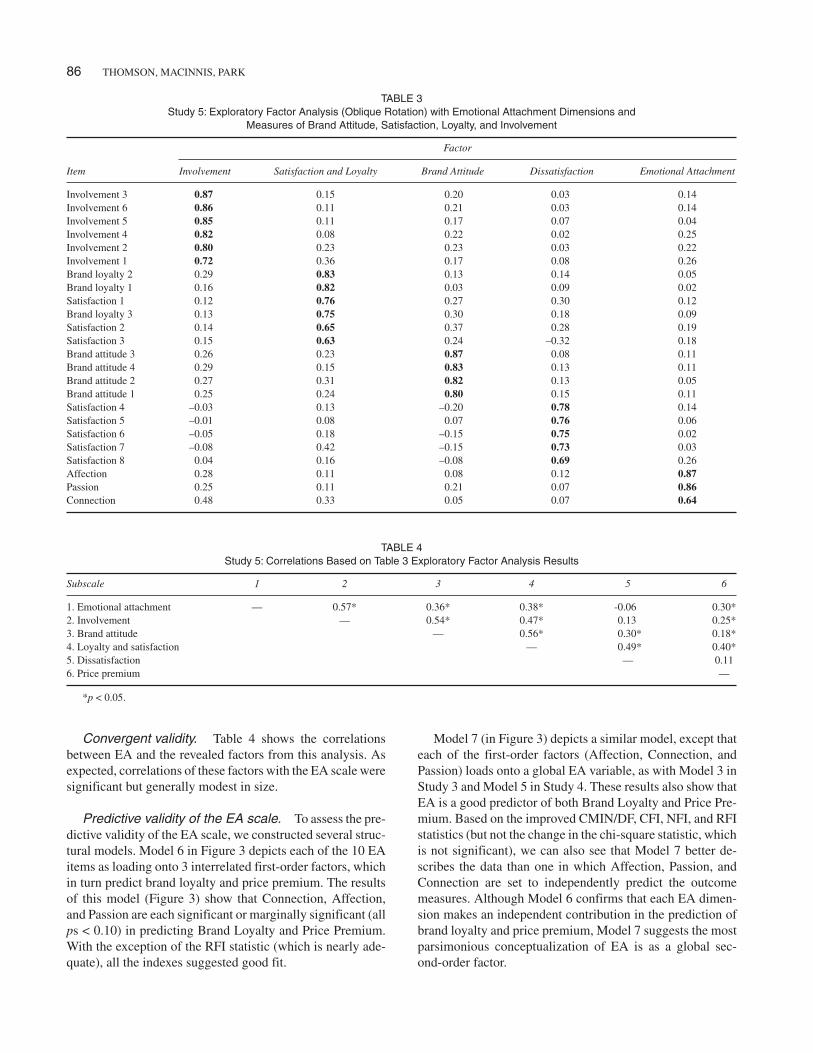
Predictive validity of the EA scale. To assess the pre-dictive validity of the EA scale, we constructed several struc-tural models. Model 6 in Figure 3 depicts each of the 10 EAitems as loading onto 3 interrelated first-order factors, whichin turn predict brand loyalty and price premium. The resultsof this model (Figure 3) show that Connection, Affection,and Passion are each significant or marginally significant (allps < 0.10) in predicting Brand Loyalty and Price Premium.With the exception of the RFI statistic (which is nearly ade-quate), all the indexes suggested good fit.
Model 7 (in Figure 3) depicts a similar model, except thateach of the first-order factors (Affection, Connection, andPassion) loads onto a global EA variable, as with Model 3 inStudy 3 and Model 5 in Study 4. These results also show thatEA is a good predictor of both Brand Loyalty and Price Pre-mium. Based on the improved CMIN/DF, CFI, NFI, and RFIstatistics (but not the change in the chi-square statistic, whichis not significant), we can also see that Model 7 better de-scribes the data than one in which Affection, Passion, andConnection are set to independently predict the outcomemeasures. Although Model 6 confirms that each EA dimen-sion makes an independent contribution in the prediction ofbrand loyalty and price premium, Model 7 suggests the mostparsimonious conceptualization of EA is as a global sec-ond-order factor.
86 THOMSON, MACINNIS, PARK
TABLE 3Study 5: Exploratory Factor Analysis (Oblique Rotation) with Emotional Attachment Dimensions and
Measures of Brand Attitude, Satisfaction, Loyalty, and Involvement
Factor
Item Involvement Satisfaction and Loyalty Brand Attitude Dissatisfaction Emotional Attachment
Involvement 3 0.87 0.15 0.20 0.03 0.14Involvement 6 0.86 0.11 0.21 0.03 0.14Involvement 5 0.85 0.11 0.17 0.07 0.04Involvement 4 0.82 0.08 0.22 0.02 0.25Involvement 2 0.80 0.23 0.23 0.03 0.22Involvement 1 0.72 0.36 0.17 0.08 0.26Brand loyalty 2 0.29 0.83 0.13 0.14 0.05Brand loyalty 1 0.16 0.82 0.03 0.09 0.02Satisfaction 1 0.12 0.76 0.27 0.30 0.12Brand loyalty 3 0.13 0.75 0.30 0.18 0.09Satisfaction 2 0.14 0.65 0.37 0.28 0.19Satisfaction 3 0.15 0.63 0.24 –0.32 0.18Brand attitude 3 0.26 0.23 0.87 0.08 0.11Brand attitude 4 0.29 0.15 0.83 0.13 0.11Brand attitude 2 0.27 0.31 0.82 0.13 0.05Brand attitude 1 0.25 0.24 0.80 0.15 0.11Satisfaction 4 –0.03 0.13 –0.20 0.78 0.14Satisfaction 5 –0.01 0.08 0.07 0.76 0.06Satisfaction 6 –0.05 0.18 –0.15 0.75 0.02Satisfaction 7 –0.08 0.42 –0.15 0.73 0.03Satisfaction 8 0.04 0.16 –0.08 0.69 0.26Affection 0.28 0.11 0.08 0.12 0.87Passion 0.25 0.11 0.21 0.07 0.86Connection 0.48 0.33 0.05 0.07 0.64
TABLE 4Study 5: Correlations Based on Table 3 Exploratory Factor Analysis Results
Subscale 1 2 3 4 5 6
1. Emotional attachment — 0.57* 0.36* 0.38* -0.06 0.30*2. Involvement — 0.54* 0.47* 0.13 0.25*3. Brand attitude — 0.56* 0.30* 0.18*4. Loyalty and satisfaction — 0.49* 0.40*5. Dissatisfaction — 0.116. Price premium —
*p < 0.05.

87
FIGURE 3 Three models from Study 5 assessing predictive validity of EA scale. Model 6 assumes three interrelated EA dimensions predict brand loy-alty and price premium directly. Model 7 assumes three interrelated EA dimensions predict brand loyalty and price premium through a second-order EAconstruct. Model 8 illustrates that EA predicts two outcome measures in a model also including measures of attitude, satisfaction, and involvement. Allcoefficient values appear above the associated path (all standarized). Dotted lines represent correlations. Model 8: predictor variable error terms are mod-eled as correlated, and insignificant paths are shown by dotted lines.
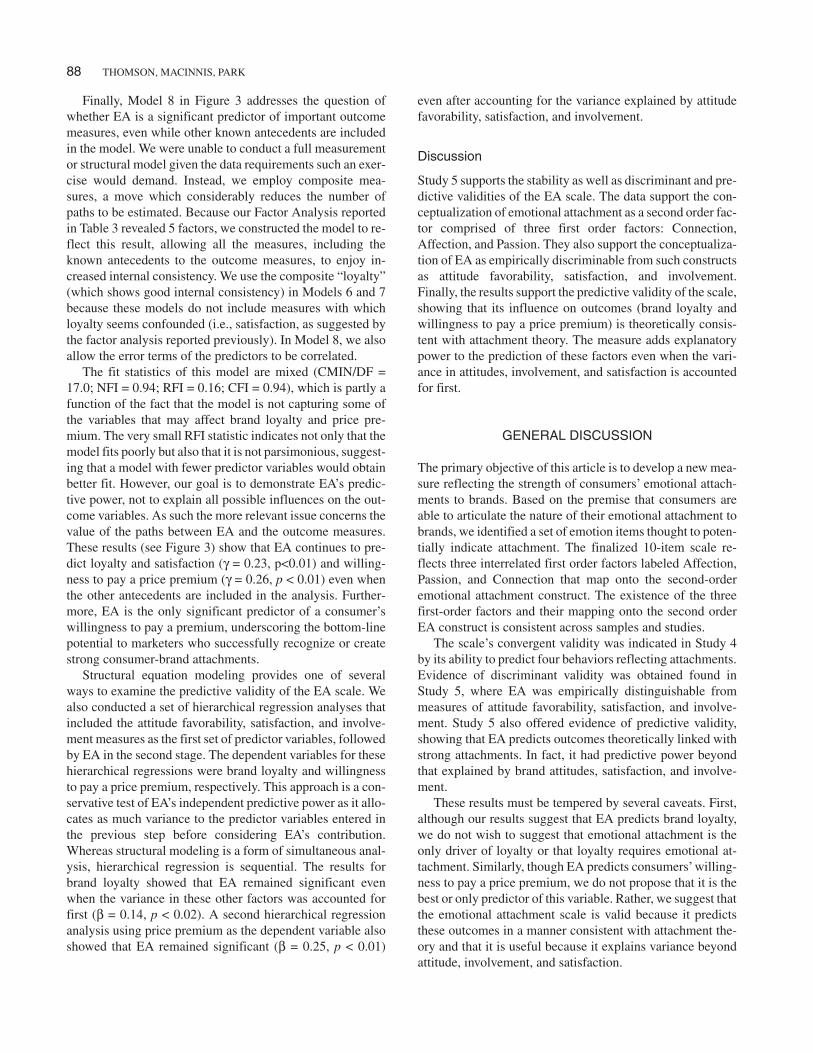
Finally, Model 8 in Figure 3 addresses the question ofwhether EA is a significant predictor of important outcomemeasures, even while other known antecedents are includedin the model. We were unable to conduct a full measurementor structural model given the data requirements such an exer-cise would demand. Instead, we employ composite mea-sures, a move which considerably reduces the number ofpaths to be estimated. Because our Factor Analysis reportedin Table 3 revealed 5 factors, we constructed the model to re-flect this result, allowing all the measures, including theknown antecedents to the outcome measures, to enjoy in-creased internal consistency. We use the composite “loyalty”(which shows good internal consistency) in Models 6 and 7because these models do not include measures with whichloyalty seems confounded (i.e., satisfaction, as suggested bythe factor analysis reported previously). In Model 8, we alsoallow the error terms of the predictors to be correlated.
The fit statistics of this model are mixed (CMIN/DF =17.0; NFI = 0.94; RFI = 0.16; CFI = 0.94), which is partly afunction of the fact that the model is not capturing some ofthe variables that may affect brand loyalty and price pre-mium. The very small RFI statistic indicates not only that themodel fits poorly but also that it is not parsimonious, suggest-ing that a model with fewer predictor variables would obtainbetter fit. However, our goal is to demonstrate EA’s predic-tive power, not to explain all possible influences on the out-come variables. As such the more relevant issue concerns thevalue of the paths between EA and the outcome measures.These results (see Figure 3) show that EA continues to pre-dict loyalty and satisfaction (γ = 0.23, p<0.01) and willing-ness to pay a price premium (γ = 0.26, p < 0.01) even whenthe other antecedents are included in the analysis. Further-more, EA is the only significant predictor of a consumer’swillingness to pay a premium, underscoring the bottom-linepotential to marketers who successfully recognize or createstrong consumer-brand attachments.
Structural equation modeling provides one of severalways to examine the predictive validity of the EA scale. Wealso conducted a set of hierarchical regression analyses thatincluded the attitude favorability, satisfaction, and involve-ment measures as the first set of predictor variables, followedby EA in the second stage. The dependent variables for thesehierarchical regressions were brand loyalty and willingnessto pay a price premium, respectively. This approach is a con-servative test of EA’s independent predictive power as it allo-cates as much variance to the predictor variables entered inthe previous step before considering EA’s contribution.Whereas structural modeling is a form of simultaneous anal-ysis, hierarchical regression is sequential. The results forbrand loyalty showed that EA remained significant evenwhen the variance in these other factors was accounted forfirst (β = 0.14, p < 0.02). A second hierarchical regressionanalysis using price premium as the dependent variable alsoshowed that EA remained significant (β = 0.25, p < 0.01)
even after accounting for the variance explained by attitudefavorability, satisfaction, and involvement.
Discussion
Study 5 supports the stability as well as discriminant and pre-dictive validities of the EA scale. The data support the con-ceptualization of emotional attachment as a second order fac-tor comprised of three first order factors: Connection,Affection, and Passion. They also support the conceptualiza-tion of EA as empirically discriminable from such constructsas attitude favorability, satisfaction, and involvement.Finally, the results support the predictive validity of the scale,showing that its influence on outcomes (brand loyalty andwillingness to pay a price premium) is theoretically consis-tent with attachment theory. The measure adds explanatorypower to the prediction of these factors even when the vari-ance in attitudes, involvement, and satisfaction is accountedfor first.
GENERAL DISCUSSION
The primary objective of this article is to develop a new mea-sure reflecting the strength of consumers’ emotional attach-ments to brands. Based on the premise that consumers areable to articulate the nature of their emotional attachment tobrands, we identified a set of emotion items thought to poten-tially indicate attachment. The finalized 10-item scale re-flects three interrelated first order factors labeled Affection,Passion, and Connection that map onto the second-orderemotional attachment construct. The existence of the threefirst-order factors and their mapping onto the second orderEA construct is consistent across samples and studies.
The scale’s convergent validity was indicated in Study 4by its ability to predict four behaviors reflecting attachments.Evidence of discriminant validity was obtained found inStudy 5, where EA was empirically distinguishable frommeasures of attitude favorability, satisfaction, and involve-ment. Study 5 also offered evidence of predictive validity,showing that EA predicts outcomes theoretically linked withstrong attachments. In fact, it had predictive power beyondthat explained by brand attitudes, satisfaction, and involve-ment.
These results must be tempered by several caveats. First,although our results suggest that EA predicts brand loyalty,we do not wish to suggest that emotional attachment is theonly driver of loyalty or that loyalty requires emotional at-tachment. Similarly, though EA predicts consumers’ willing-ness to pay a price premium, we do not propose that it is thebest or only predictor of this variable. Rather, we suggest thatthe emotional attachment scale is valid because it predictsthese outcomes in a manner consistent with attachment the-ory and that it is useful because it explains variance beyondattitude, involvement, and satisfaction.
88 THOMSON, MACINNIS, PARK

Second, although we were successful in creating variancein emotional attachment, we were not successful in havingrespondents report on brands reflecting extreme levels ofemotional attachment. In the strong attachment conditions ofStudies 4 and 5, means on EA were approximately 4.0 to 4.5on a 7-point scale. Though the standard deviations in re-ported attachment scores in these conditions were relativelyhigh, the attachment scores are best characterized as “rela-tively strong” compared to the weaker attachment condi-tions. The results may suggest that (a) extremely strong at-tachments are rare in a brand context or that (b) managershave considerable leeway to enhance the strength of consum-ers’ emotional attachments to brands.
Future Research
In this research, consumers were asked to self-select a brand,corresponding to varying degrees of emotional attachment asdirected by the respective instrument condition that they re-ceived. An alternative data collection methodology would beto use a common brand (e.g., Coca-Cola) and ask consumersto report their emotional attachment to only that specificbrand. One advantage of this methodology is that the brandwould be constant across all emotional attachment condi-tions. We attempted such a data collection effort in severalpretests, but results had too little variation and predominantlyweak attachment scores to efficiently examine the realm ofstrong attachments. This was probably due to the fact that weemployed a relatively homogeneous population of respon-dents (students) who had similarly weak attachments to thecommon brands selected. Nevertheless, extensions to thisstudy could examine the generalizability of our results topopulations that are more heterogeneous and for whom therewould be variation in emotional attachment to a commonbrand.
Additional work on the EA construct requires future re-search into its boundary conditions and the diagnosticity ofthe EA measure to marketers. One boundary condition con-cerns the types of brands and purchase situations most ger-mane to emotional attachment. Although our studies werenot designed to directly assess boundary conditions, indirectevidence from Study 5 suggests brands in the strong emo-tional attachment condition tended to be more high involve-ment and symbolically or hedonically related (e.g., the BodyShop, Hermet Lang, BMW, BeBe, Prada, and Oakley) thanlow involvement or functionally related (e.g., AT&T, All,Ziploc).
We did not design our studies to examine differences be-tween functional brands and symbolic or hedonic ones. How-ever, the possibility that one would find higher emotional at-tachment scores for symbolic brands is perhaps notsurprising because the notion of an attachment implies a con-nection with the self, and symbolic products are valued forwhat they say about the self. Moreover, such brands are likelyto be characterized as “high involvement” products as they
are meaningful and significant to individuals (Zaichkowsky,1985). Further research should systematically assess whetherstrong emotional attachments are specific to brands that meetcertain types of needs and whether they require a certain levelof product involvement.
The relation of emotional attachment to product involve-ment is not surprising given the relation of involvement toemotional attachment discussed conceptually and demon-strated empirically. One might therefore surmise that the EAscale provides a more diagnostic indicator of attachment forhigh involvement products, as it can separate those brands forwhich involvement is high but emotional attachment is lowfrom those for which both involvement and emotional attach-ment are high. It might only be in the latter case that brandloyalty and willingness to pay a price premium are bothstrong.
It is also interesting that the brands respondents chose inStudy 5 tended to be at the level of the company brand, as op-posed to a specific product-brand. It is possible that corporatebrands are more salient, memorable, and hence more likelyto be reported (irrespective of the level of attachment). How-ever, further research is needed to determine whether thelevel of the brand (individual product or corporate) is rele-vant to the level of emotional attachment that consumers de-velop.
A final issue concerns the types of purchase situations forwhich each emotional attachment dimension might be mostrelevant. For example, a consumer whose brand attachmentis characterized as high in affection might choose to give thebrand as a gift to significant others, as the affection character-izing the brand may symbolize the affection the consumerhas toward the gift recipient. A consumer whose attachmentis characterized as high in passion, however, might be likelyto purchase the brand impulsively and to exceed the budgetallocated for purchase. Finally, a consumer whose brand at-tachment is characterized as high in connection might ex-pend considerable effort to preserve that brand, perhapsthrough brand collections and ritualized care of the brand.The purchase situations relevant to each dimension of attach-ment therefore deserve additional attention.
REFERENCES
Adams-Price, C., & Greene, A. L. (1990). Secondary attachments and ado-lescent self concept. Sex Roles, 22, 187–198.
Ainsworth, M. D. S., Blehar, M., Waters, E., & Wall, S. (1978). Patterns ofattachment: A psychological study of the strange situation. Hillsdale, NJ:Lawrence Erlbaum Associates, Inc.
Alperstein, N. M. (1991). Imaginary social relationships with celebrities ap-pearing in television commercials. Journal of Broadcasting and Elec-tronic Media, 35, 43–58.
Aron, A., Aron, E. N., & Allen, J. (1998). Motivations for unreciprocatedlove. Personality and Social Psychology Bulletin, 24, 787–797.
Aron, A., & Westbay, L. (1996). Dimensions of the prototype of love. Jour-nal of Personality and Social Psychology, 70, 535–551.
THE TIES THAT BIND 89
Baldwin, M. W., Keelan, J. P. R., Fehr, B., Enns, V., & Koh-Rangarajoo, E.(1996). Social-cognitive conceptualization of attachment working mod-els: Availability and accessibility effects. Journal of Personality and So-cial Psychology, 71, 94–109
Ball, A. D., & Tasaki, L. H. (1992). The role and measurement of attachmentin consumer behavior. Journal of Consumer Psychology, 1, 155–172.
Batra, R., & Stayman, D. M. (1990). The role of mood in advertising effec-tiveness. Journal of Consumer Research, 17, 203–214.
Belk, R. (1988). Possessions and the extended self. Journal of Consumer Re-search, 15, 139–168.
Bowlby, J. (1979). The making and breaking of affectional bonds. London:Tavistock.
Bowlby, J. (1980). Loss: Sadness and depression. New York: Basic Books.Brennan, K. A., Clark, C. L., & Shaver, P. R. (1998). Self-report measure-
ment of adult attachment: An integrative overview. In J. A. Simpson & W.S. Rholes (Eds.), Attachment theory and close relationships (pp. 46–76).New York: Guilford Press.
Churchill, G. A., Jr. (1979a). Marketing research: Methodological founda-tions. Hinsdale, IL: The Dryden Press.
Churchill, G. A., Jr. (1979b). A paradigm for developing better measures ofmarketing constructs. Journal of Marketing Research, 16, 64–73.
Collins, N. L., & Read, S. J. (1990). Adult attachment, working models andrelationship quality in dating couples. Journal of Personality and SocialPsychology, 58, 644–663.
Collins, N. L., & Read, S. J. (1994). Cognitive representations of attach-ment: The structure and function of working models. In K. Bartholomew& D. Perlman (Eds.), Advances in personal relationships (pp. 53–90).London: Jessica Kingsley.
Czepiel, J. A., Rosenberg, L. J., & Akerele, A. (1977). The study of con-sumer satisfaction: Addressing the “so what” questions. In H. K. Hunt(Ed.), Conceptualization and measurement of customer satisfaction anddissatisfaction (pp. 92–119). Cambridge, MA: Marketing Science Insti-tute and National Science Foundation.
Drigotas, S. M., & Rusbult, C. E. (1992). Should I stay or should I go? A de-pendence model of breakups. Journal of Personality and Social Psychol-ogy, 62, 62–87.
Dwyer, R. F., Schurr, P. H., & Oh, S. (1987). Developing buyer-seller rela-tionships. Journal of Marketing, 51, 11–28.
Feeney, J. A., & Noller, P. (1996). Adult attachment. London: Sage.Fehr, B., & Russell, J. A. (1991). The concept of love viewed from a prototype
perspective. Journal of Personality and Social Psychology, 60, 425–438.Garbarino, E., & Johnson, M. S. (1999). The different roles of satisfaction,
trust, and commitment in customer relationships. Journal of Marketing,63, 70–87.
Hair, J. F. (1995). Multivariate data analysis. New York: Macmillan.Hazan, C., & Shaver, P. R. (1987). Romantic love conceptualized as an at-
tachment process. Journal of Personality and Social Psychology, 52,511–524.
Hazan, C., & Shaver, P. R. (1994). Attachment as an organizational frame-work for research on close relationships. Psychological Inquiry, 5, 1–22.
Hazan, C., & Zeifman, D. (1994). Sex and the psychological tether. In K.Bartholomew & D. Perlman (Eds.), Advance in personal relationships:Vol. 5. Attachment processes in adulthood (pp. 151–177). London: JessicaKingsley.
Hazan, C., & Zeifman, D. (1999). Pair bonds as attachments. In J. Cassidy &P. R. Shaver (Eds.), Handbook of attachment (pp. 336–354) New York:Guilford.
Hendrick, C., & Hendrick, S. S. (1989). Research on love: does it measureup? Journal of Personality and Social Psychology, 56, 784–794.
Hill, R. P., & Stamey, M. (1990). The homeless in America: An examinationof possessions and consumption behaviors. Journal of Consumer Re-search, 17, 303–322.
Hirschman, E. C. (1994). Consumers and their animal companions. Journalof Consumer Research, 20, 616–633.
Holmes, J. G. (2000). Social relationships: The nature and function of rela-tional schemas. European Journal of Social Psychology, 30, 447–495.
Johnson, D., & Rusbult, C. E. (1989). Resisting temptation: Devaluation ofalternative partners as a means of maintaining commitment in close rela-tionships. Journal of Personality and Social Psychology, 57, 967–980.
Kamptner, N. L. (1991). Personal possessions and their meanings—Alife-span perspective. Journal of Social Behavior and Personality, 6,209–228.
Kleine, R. E., III, Kleine, S. S., & Kernan, J. B. (1993). Mundane consump-tion and the self: A social identity perspective. Journal of Consumer Psy-chology, 2, 209–235.
Kleine, S. S., Kleine, R. E., III, & Allen, C. T. (1995). How is a possession“me” or “not me”: Characterizing types and an antecedent of materialpossession attachment. Journal of Consumer Research, 22, 327–343.
Kleine, S., Kleine, R. E., & Kernan, J. B. (1989). These are a few of my fa-vorite things—Toward an explication of attachment as a consumer-behav-ior construct. Advances in Consumer Research, 16, 359–366.
Leavitt, C. (1977). Consumer satisfaction and dissatisfaction: Bipolar or in-dependent. In K. Hunt (Ed.), Conceptualization and measurement of cus-tomer satisfaction and dissatisfaction (pp. 120–128). Cambridge, MA:Marketing Science Institute.
Mano, H., & Oliver, R. L. (1993). Assessing the dimensionality and struc-ture of the consumption experience: Evaluation, feeling and satisfaction.Journal of Consumer Research, 20, 451–466.
Mehta, A. R., & Belk, R. W. (1991). Artifacts, identity and transition—Fa-vorite possessions of Indians and Indian immigrants to the United States.Journal of Consumer Research, 17, 398–411.
Mick, D. G., & DeMoss, M. (1990). Self-gifts: Phenomenological insightsfrom four contexts. Journal of Consumer Research, 17, 322–333.
Mikulincer, M., Hirschberger, G., Nachmias, O., & Gillath, O. (2001). Theaffective component of the secure base schema: affective priming withrepresentations of proximity maintenance. Journal of Personality and So-cial Psychology, 81, 305–321.
Miller, R. S. (1997). Inattentive and contented: Relationship commitmentand attention to alternatives. Journal of Personality and Social Psychol-ogy, 73, 758–766.
Moorman, C., Deshpande, R., & Zaltman, G. (1993). Factors affecting trustin market research relationships. Journal of Marketing, 57, 81–102.
Morgan, R. M., & Hunt, S. D. (1994). The commitment-trust theory of rela-tionship marketing. Journal of Marketing, 58, 20–39.
Nunally, J. C. (1978). Psychometrictheory. New York: McGraw-HillOliver, R. (1999). Whence consumer loyalty? Journal of Marketing, 63,
33–44.Park, C. W., & Mittal, B. (1985). A Theory of involvement in consumer be-
havior: Problems and issues. Research in Consumer Behavior, 1,201–232.
Richins, M. L. (1994a). Special possessions and the expression of materialvalues. Journal of Consumer Research, 21, 522–533.
Richins, M. L. (1994b). Valuing things: The public and private meanings ofpossessions. Journal of Consumer Research, 21, 504–521.
Rubinstein, R. L., & Parmelee, P. A. (1992). Attachment to place and therepresentation of the life course by the elderly. In I. Altman & S. M. Low(Eds.), Place attachment (pp. 139–163). New York: Plenum.
Rusbult, C. (1983). A longitudinal test of the investment model: The devel-opment (and deterioration) of satisfaction and commitment in hetrosexualinvolvements. Journal of Personality and Social Psychology, 45,172–186.
Sable, P. (1995). Pets, attachments, and well-being across the life cycle. So-cial Work, 40, 334–341.
Schouten, J. W., & McAlexander, J. H. (1995). Subcultures of consumption:An ethnography of the new bikers. Journal of Consumer Research, 22,43–61.
Schultz, S. E., Kleine, R. E., & Kernan, J. B. (1989). These are a few of myfavorite things: Toward an explication of attachment as a consumer behav-ior construct. Advances in Consumer Research, 16, 359–366.
Shaver, P. R., Schwartz, J., Kirson, D., & O’Conner, C. (1987). Emotionknowledge: Further exploration of a prototype approach. Journal of Per-sonality and Social Psychology, 52, 1061–1086.
90 THOMSON, MACINNIS, PARK

Sheppard, B. H., Hartwick, J., & Warshaw, P. R. (1988). The theory of rea-soned action: A meta-analysis of past research with recommendations formodifications and future research. Journal of Consumer Research, 15,325–343.
Shimp, T. A., & Madden, T. J. (1988). Consumer-object relations: A concep-tual framework based analogously on sternberg’s triangular theory oflove. Advances in Consumer Research, 15, 163–168.
Sirgy, J. M., Johar, J. S., Samli, A. C., & Claiborne, C. B. (1991). Self-con-gruity versus functional congruity: Predictors of consumer behavior.Journal of the Academy of Marketing Science, 19, 363–375.
Slater, J. S. (2000, October). Collecting brand loyalty: A comparative analy-sis of how Coca-Cola and Hallmark use collecting behavior to enhancebrand loyalty. Paper presented at the Annual Conference of the Associa-tion of Consumer Research, Salt Lake City, UT.
Sternberg, R. J. (1986). A triangular theory of love. Psychological Review,93, 119–135.
Sternberg, R. J. (1987). Liking vs. loving: A comparative evaluation of theo-ries. Psychological Bulletin, 102, 331–345.
Trinke, S. J., & Bartholomew, K. (1997). Hierarchies of attachment relation-ships in young adulthood. Journal of Social and Personal Relationships,15, 603–625.
van Lange, P. A. M., Rusbult, C. E., Drigotas, S. M., & Arriaga, X. B. (1997).Willingness to sacrifice in close relationships. Journal of Personality andSocial Psychology, 72, 1373–1396.
Wallendorf, M., & Arnould, E. J. (1988). “My favorite things”: A cross-cul-tural inquiry into object attachment, possessiveness and social linkage.Journal of Consumer Research, 14, 531–547.
Weiss, R. S. (1988). Loss and recovery. Journal of Social Issues, 44, 37–52.Zaichkowsky, J. L. (1985). Measuring the involvement construct. Journal of
Consumer Research, 12, 3441–352.
Received: February 4, 2003Revision received: November 4, 2003Accepted: January 30, 2004
THE TIES THAT BIND 91