
The Threat Detection System That Cried Wolf: … · Cried Wolf: Reconciling Operators with...
23
IDA Document NS D-5689 December 2015 The Threat Detection System That Cried Wolf: Reconciling Operators with Developers Shelley M. Cazares Log: H 15-001234 INSTITUTE FOR DEFENSE ANALYSES INSTITUTE FOR DEFENSE ANALYSES 4850 Mark Center Drive Alexandria, Virginia 22311-1882 Approved for public release; distribution is unlimited.
Transcript of The Threat Detection System That Cried Wolf: … · Cried Wolf: Reconciling Operators with...

IDA Document NS D-5689
December 2015
The Threat Detection System ThatCried Wolf: Reconciling Operators
with Developers
Shelley M. Cazares
Log: H 15-001234
I N S T I T U T E F O R D E F E N S E A N A L Y S E S
INSTITUTE FOR DEFENSE ANALYSES4850 Mark Center Drive
Alexandria, Virginia 22311-1882
Approved for public release; distribution is unlimited.

About this Publication This work was conducted under IDA’s independent research program (C2194). The views, opinions, and findings should not be construed as representing the official position of either the Department of Defense.
Copyright Notice© 2016 Institute for Defense Analyses4850 Mark Center Drive, Alexandria, Virginia 22311-1882 • (703) 845-2000.
This material may be reproduced by or for the U.S. Government pursuant to the copyright license under the clause at DFARS 252.227-7013 (a)(16) [Jun 2013].

I N S T I T U T E F O R D E F E N S E A N A L Y S E S
IDA Document NS D-5689
The Threat Detection System ThatCried Wolf: Reconciling Operators
with Developers
Shelley M. Cazares


Running head: THE THREAT DETECTION SYSTEM THAT CRIED WOLF
The Threat Detection System That Cried Wolf: Reconciling Developers with Operators
Abstract
The Department of Defense and Department of Homeland Security use many threat detection systems, such as air
cargo screeners and counter-Improvised Explosive Device systems. Threat detection systems that perform well during
testing are not always well-received by the system operators, however. Some systems may frequently “cry wolf,”
generating alarms even when true threats are not present. As a result, operators may lose faith in the systems—ignoring
them or even turning them off and taking the chance that a true threat will not appear. This paper reviews statistical
concepts to reconcile the performance metrics that summarize a developer’s view of a system during testing with the
metrics that describe an operator’s view of the system during real-world missions. Program managers can still make
use of systems that “cry wolf” by arranging them into a tiered system that, overall, exhibits better performance than
any individual system alone.
Summary
Threat detection systems that perform well in testing can “cry wolf” during operation. Program managers can still use
these systems as part of a tiered system that, overall, exhibits better performance than any individual system alone.
Keywords
Probability of Detection (Pd), Probability of False Alarm (Pfa), Positive Predictive Value (PPV), Negative Predictive
Value (NPV), Prevalence (Prev)

THE THREAT DETECTION SYSTEM THAT CRIED WOLF 2
The Threat Detection System That Cried Wolf: Reconciling Operators with Developers
The Department of Defense (DOD) and Department of Homeland Security (DHS) operate many threat detection
systems. Examples include counter-mine and counter-Improvised Explosive Device (IED) systems and airplane cargo
screening systems (Daniels, 2006; L3 Communications, Security & Detection Systems, Inc., 2011, 2013, 2014; L3
Communications Cyterra, 2012; Niitek, n.d.; Transportation Security Administration, 2013; Wilson, Gader, Lee,
Frigui, & Ho, 2007; U.S. Army, n.d.). All of these systems share a common purpose: to detect threats among clutter.
Threat detection systems are often assessed based upon their Probability of Detection (Pd) and Probability of False
Alarm (Pfa) (Urkowitz, 1967). Pd describes the percent of true threats for which the system correctly declares an alarm.
Conversely, Pfa describes the percent of true clutter (true non-threats) for which the system incorrectly declares an
alarm. A perfect system will exhibit a Pd of 1 and a Pfa of 0.
Threat detection systems with good Pd and Pfa performance metrics are not always well-received by the system’s
operators, however. Some systems may frequently “cry wolf,” generating alarms even when true threats are not
present. As a result, operators may lose faith in the systems, delaying their response to alarms (Getty, Swets, Pickett,
& Gonthier, 1995) or ignoring them altogether (Bliss, Gilson, & Deaton, 1995), potentially leading to disastrous
consequences (Cushman, 1987; Stuart, 1987; Oldham, 2006; MacKinnon, 2007).
This issue arises from the fact that while Pd and Pfa encapsulate the developer’s perspective, they do not
encapsulate the operator’s perspective. The operator’s view can be better summarized with other performance metrics,
namely Positive Predictive Value (PPV) and Negative Predictive Value (NPV) (Altman & Bland, 1994b). PPV
describes the percent of all alarms that correctly turn out to be true threats—a measure of how often the system “cries
wolf.” Similarly, NPV describes the percent of all lack of alarms that correctly turn out to be true clutter. From the
operator’s perspective, a perfect system will have PPV and NPV values that are both equal to 1.
Interestingly enough, the very same threat detection system that satisfies the developer’s desire to detect as much
truth as possible can also disappoint the operator by “crying wolf” too often (Scheaffer & McClave, 1995). A system
can exhibit excellent Pd and Pfa values while also exhibiting a poor PPV value. Unfortunately, low PPV values
naturally occur when the prevalence of true threat among true clutter is extremely low (Scheaffer & McClave, 1995;
Parasuraman, 1997), as is often the case in defense and homeland security scenarios. As a result, the developer’s and
operator’s views can differ when assessing the performance of threat detection systems in the DOD and DHS.

THE THREAT DETECTION SYSTEM THAT CRIED WOLF 3
In this paper, we reconcile the performance metrics used to quantify the developer’s vs. operator’s views of threat
detection systems. Although these concepts are already well-known within the statistics and human factors
communities, they are not often immediately understood in the DOD and DHS science and technology (S&T)
acquisition communities. This review is intended for program managers of threat detection systems in the DOD and
DHS. First, we review how to calculate Pd, Pfa, PPV, and NPV using a notional air cargo screening system as our
example. Then, we illustrate how a program manager can still make use of a system that frequently “cries wolf” by
incorporating it into a tiered system that, overall, exhibits better performance than any individual system alone. Next,
we explain how the term “threat detection system” can be a misnomer since it is often used to refer to both threat
detection and threat classification systems. While Pfa and NPV can be used to describe threat classification systems,
threat detection systems must be described using other metrics, such as False Alarm Rate (FAR). Finally, we comment
on other metrics that can further describe the operator’s experience, such as throughput, usability, and workload.
Testing a Threat Detection System
We use a notional air cargo screening system to illustrate our discussion of performance metrics for threat
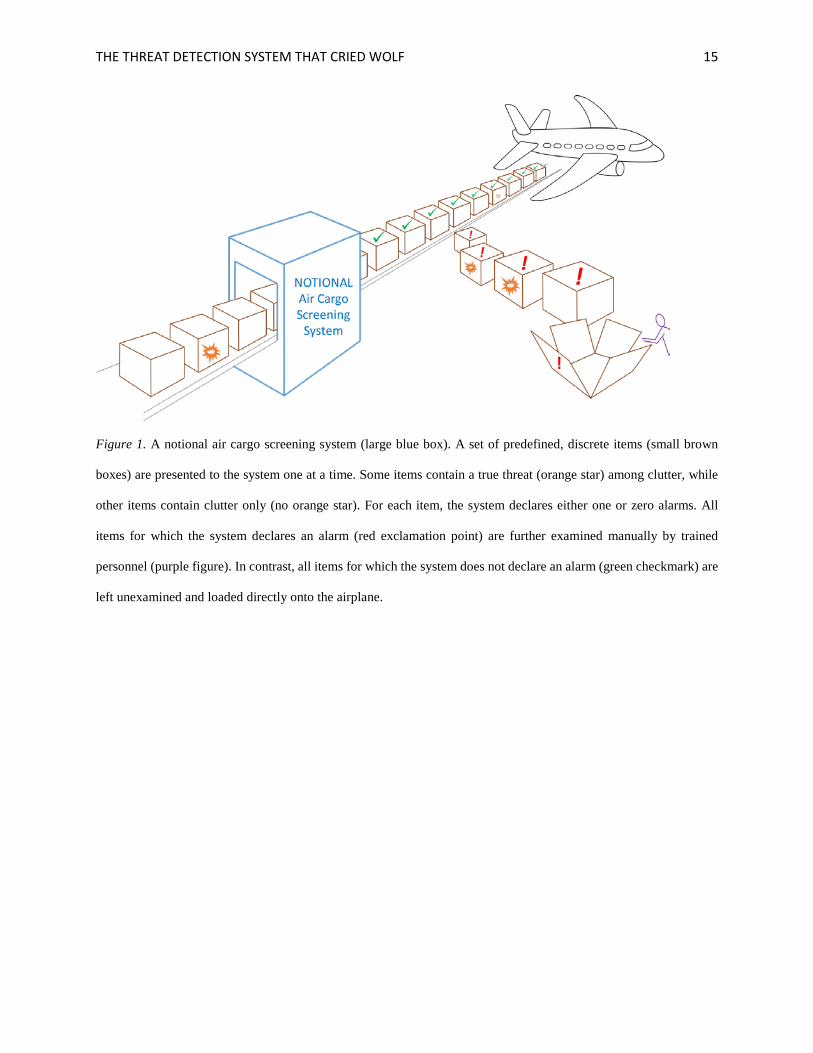
detection systems. As illustrated by Figure 1, the purpose of this notional system is to detect explosive threats packed
inside items that are about to be loaded into the cargo hold of an airplane. To determine how well this system meets
capability requirements, its performance must be quantified. A large number of items can be input into the system,
and each item’s ground truth (whether the item contained a true threat) can be compared to the system’s output
(whether the system declared an alarm). The items must be representative of the items that the system would likely
encounter in an operational setting. At the end of the test, the number of True Positive (TP), False Positive (FP), False
Negative (FN), and True Negative (TN) items can be counted. Figure 2 tallies these counts in a 2×2 confusion matrix:
• A TP is an item that contained a true threat and for which the system correctly declared an alarm.
• A FP is an item that did not contain a true threat but for which the system incorrectly declared an alarm (a
Type I error).
• A FN is an item that contained a true threat but for which the system incorrectly did not declare an alarm (a
Type II error).
• A TN is an item that did not contain a true threat and for which the system correctly did not declare an alarm.
The developer’s view: Pd and Pfa

THE THREAT DETECTION SYSTEM THAT CRIED WOLF 4
A program manager must consider how much of the truth the threat detection system is able to alarm. This can
be done by considering the following questions: For those items that contain a true threat, for what percent does the
system correctly declare an alarm? And, for those items that do not contain a true threat, for what percent does the
system incorrectly declare an alarm? These questions often guide developers during the research and development
phase of the threat detection system.
Pd and Pfa can be easily calculated from the 2×2 confusion matrix to answer these questions. From a developer’s
perspective, our notional air cargo screening system exhibits excellent performance:
Pd = TPTP+FN
= 9090+10
= 0.90 (compared to 1 for a perfect system) (1)
Pfa = FPFP+TN
= 500500+9500
= 0.05 (compared to 0 for a perfect system). (2)
Equation (1) shows that of all items that contained a true threat (TP + FN = 90 + 10), a large subset (TP = 90) correctly
caused an alarm. These counts resulted in Pd = 0.90, close to the value of 1 that would be exhibited by a perfect system.
Based on this Pd value, the program manager can conclude that 90% of items that contained a true threat correctly
caused an alarm. Furthermore, Equation (2) shows that of all items that did not contain a true threat (FP + TN = 500
+ 9500), only a small subset (FP = 500) incorrectly caused an alarm. These counts led to Pfa = 0.05, close to the value
of 0 that would be exhibited by a perfect system. In other words, only 5% of items that did not contain a true threat
incorrectly caused an alarm.
The operator’s view: PPV and NPV
The program manager must also consider the operator’s view of the threat detection system. One way to consider
the operator’s view is to answer the following questions: For those items that caused an alarm, what percent turned
out to contain a true threat? And, for those items that did not cause an alarm, what percent turned out to not contain a
true threat? On the surface, these questions seem similar to those posed previously for Pd and Pfa. Upon closer
examination, however, they are quite different. While Pd and Pfa summarize how much of the truth can be alarmed,
PPV and NPV summarize how many alarms turn out to be true.
PPV and NPV can also be easily calculated from the 2×2 confusion matrix. From an operator’s perspective, our
notional air cargo screening system exhibits a conflicting performance:
NPV = TNTN+FN
= 95009500+10
≈ 1 (compared to 1 for a perfect system) (3)
PPV = TPTP+FP
= 9090+500
= 0.15 (compared to 1 for a perfect system). (4)

THE THREAT DETECTION SYSTEM THAT CRIED WOLF 5
Equation (3) shows that of all items that did not cause an alarm (TN + FN = 9500 + 10), a very large subset (TN =
9500) correctly turned out to not contain a true threat. These counts resulted in NPV ≈ 1, close to the 1 value that
would be exhibited by a perfect system. In the absence of an alarm, the operator could rest assured that a threat was
highly unlikely. However, Equation (4) shows that of all items that did indeed cause an alarm (TP + FP = 90 + 500),
only a small subset (TP = 90) turned out to contain a true threat. These counts unfortunately led to PPV = 0.15, much
lower than the 1 value that would be exhibited by a perfect system. When an alarm was declared, the operator could
not trust that a threat was present, since the system “cried wolf” so often.
Reconciling developers with operators: Pd and Pfa versus PPV and NPV
The discrepancy between PPV and NPV vs. Pd and Pfa reflects the discrepancy between the operator’s and
developer’s views of a threat detection system. Developers are often primarily interested in how much of the truth can
be correctly alarmed—concepts quantified by Pd and Pfa. In contrast, operators are often primarily concerned with how
many alarms turn out to be true—concepts quantified by PPV and NPV. As shown in Figure 2, the very same system
that exhibits excellent values for Pd, Pfa, and NPV can also exhibit poor values for PPV.
Poor PPV values should not be unexpected for threat detection systems in the DOD and DHS. Such performance
is often merely a reflection of the low Prevalence (Prev) of true threat among true clutter that often occurs in defense
and homeland security scenarios.1 Prev describes the percent of all items that contain a true threat, including those
that did and did not cause an alarm. In the case of our notional air cargo screening system, Prev is very low:
Prev = TP+FNTP+FN+FP+TN
= 90+1090+10+500+9500
= 0.01. (5)
Of all items (TP + FN + FP + TN = 90 + 10 +500 + 9500), only a very small subset (TP + FN = 90 + 10) contained a
true threat, leading to Prev = 0.01. When true threats are rare, most alarms turn out to be false, even for an otherwise
strong threat detection system, which leads to a low value for PPV. In fact, to achieve a high value of PPV when Prev
is extremely low, a threat detection system must exhibit so few FPs as to make Pfa approximately zero.
Recognizing this phenomenon, program managers should not necessarily dismiss a threat detection system simply
because it exhibits a poor PPV, provided that it also exhibits an excellent Pd and Pfa. Instead, program managers can
estimate Prev to help determine how to guide such a system through development. Prev does not depend upon the
1 Conversely, when Prev is high, threat detection systems often exhibit poor values for NPV, even while exhibiting excellent values for Pd, Pfa, and PPV. Such cases are not discussed in this paper, since fewer scenarios in the DOD and DHS involve a high prevalence of threat among clutter.

THE THREAT DETECTION SYSTEM THAT CRIED WOLF 6
threat detection system and can, in fact, be calculated in the absence of the system. Knowledge of ground truth (which
items contain a true threat) is all that is needed to calculate Prev (Scheaffer & McClave, 1995).
Of course, ground truth is not known a priori in an operational setting. However, it may be possible for program
managers to use historical data or intelligence tips to roughly estimate whether Prev is likely to be particularly low in
operation. A Prev that is estimated to be very low can cue the program manager to anticipate discrepancies in Pd and
Pfa vs. PPV, forecasting the inevitable discrepancy between the developer’s and operator’s views early in the system’s
development, while there are still time and opportunity to make adjustments. At that point, the program manager can
identify concepts of operations (CONOPS) in which the system can still provide value to the operator for his or her
mission. A tiered system may provide one such opportunity.
A Tiered System for Threat Detection
Tiered systems consist of multiple systems used in series. The first system cues the use of the second system and
so on. Tiered systems provide program managers the opportunity to leverage multiple threat detection systems that,
individually, do not satisfy both developers and operators simultaneously. Figure 3 shows two 2×2 confusion matrices
that represent a notional tiered system that makes use of two individual threat detection systems. One system is
relatively simple (and inexpensive) while the other is more complex (and expensive). Other tiered systems can consist
of three or more individual systems.
The first system in Figure 3 (top) is the notional air cargo screening system discussed previously. Although this
system exhibits excellent performance from the developer’s perspective (high Pd and low Pfa), it exhibits conflicting
performance from the operator’s perspective (high NPV but low PPV). Rather than using this system to classify items
as either “Alarm (Threat)” vs. “No Alarm (No Threat),” the operator can use this system to screen items as either “Cue
Second System (Maybe Threat)” vs. “Do Not Cue Second System (No Threat)”. The first system’s extremely high
NPV (approximately equal to 1) indicates that the operator can rest assured that a lack of a cue correctly indicates the
very low likelihood of a true threat. Therefore, any item that fails to elicit a cue can be loaded onto the airplane,
bypassing the second system and avoiding its unnecessary complexities and expense.2 In contrast, the first system’s
low PPV indicates that the operator cannot trust that a cue indicates a true threat. Any item that elicits a cue from the
2 Such an item can be considered safe within the risk calculus of the system’s capability requirements. Of course, it is always possible that some true threats might get through, such as the 10 FNs at the top of Figure 3. Appropriately setting a system’s capability requirements requires a frank assessment of the costs—financial and intangible—of the consequences of FNs vs. FPs.

THE THREAT DETECTION SYSTEM THAT CRIED WOLF 7
first system may or may not contain a true threat and must therefore pass through the second system for further
analysis.
The second system in Figure 3 (bottom) exhibits a higher Pd and lower Pfa than the first system. In addition, its
PPV value is also much higher. The second system’s higher PPV may be due to its higher complexity or may simply
be due to the fact that the second system encounters a higher Prev of true threat among true clutter than the first system.
By the very nature in which the tiered system was assembled, the first system’s very high NPV indicates its strong
ability to correctly screen out those items that do not contain a true threat, leaving only those questionable items for
the second system to process. Since the second system encounters only those items that are questionable, it encounters
a much higher Prev and therefore has the opportunity to exhibit higher PPV values. Since the percentage of true threats
among true clutter is higher for the second system, it has less relative opportunity to “cry wolf.”
The performance of the tiered system as a whole must be assessed, in addition to the performance of each of the
two individual systems that compose it. As with any individual system, Pd, Pfa, PPV, and NPV can be calculated for
the tiered system overall. These calculations must be based on all items encountered by the tiered system as a whole,
taking care to not double count those TP, FN, FP, and TN items from the first tier that are passed to the second:
Pd = 𝑇𝑇𝑇𝑇2𝑇𝑇𝑇𝑇2+(𝐹𝐹𝐹𝐹1+𝐹𝐹𝐹𝐹2)
= 8888+(10+2)
= 0.88 (compared to 1 for a perfect system) (6)
Pfa = 𝐹𝐹𝑇𝑇2𝐹𝐹𝑇𝑇2+(𝑇𝑇𝐹𝐹1+𝑇𝑇𝐹𝐹2)
= 2525+(9500+475)
≈ 0 (compared to 0 for a perfect system) (7)
NPV = (𝑇𝑇𝐹𝐹1+𝑇𝑇𝐹𝐹2)(𝑇𝑇𝐹𝐹1+𝑇𝑇𝐹𝐹2)+(𝐹𝐹𝐹𝐹1+𝐹𝐹𝐹𝐹2)
= (9500+475)(9500+475)+(10+2)
≈ 1 (compared to 1 for a perfect system) (8)
PPV = 𝑇𝑇𝑇𝑇1𝑇𝑇𝑇𝑇1+𝑇𝑇𝑇𝑇2
= 8888+25
= 0.78 (compared to 1 for a perfect system). (9)
Overall, the tiered system exhibits good performance from the developer’s perspective. Equation (6) shows that
of all items that contained a true threat (TP2 + (FN1 + FN2) = 88 + (10 + 2)), a large subset (TP2 = 88) correctly caused
an alarm, resulting in an overall value of Pd = 0.88. The program manager can conclude that 88% of items containing
a true threat correctly led to a final alarm from the tiered system as a whole. Although this overall Pd is slightly lower
than the Pd of each of the two individual systems, the overall value is still close to the value of 1 for a perfect system.3
Similarly, Equation (7) shows that of all items that did not contain a true threat (FP2 + (TN1 + TN2) = 25 + (9500 +
3 Statistical tests can show which differences are statistically significant (Fleiss, Levin, & Paik (2013) while subject matter expertise can determine which differences are operationally significant.

THE THREAT DETECTION SYSTEM THAT CRIED WOLF 8
475)), only a very small subset (FP2 = 25) incorrectly caused an alarm, leading to an overall value of Pfa ≈ 0.
Approximately 0% of items not containing a true threat incorrectly caused an alarm.
The tiered system also exhibits good overall performance from the operator’s perspective. Equation (8) shows
that of all items that did not cause an alarm ((TN1 + TN2) + (FN1 + FN2) = (9500 + 475) + (10 + 2)), a very large subset
((TN1 + TN2) = (9500 + 475)) correctly turned out to not contain a true threat, resulting in an overall value of NPV ≈
1. The operator could rest assured that a threat was highly unlikely in the absence of an alarm. More interesting,
though, is the overall PPV value. Equation (9) shows that of all items that did indeed cause a final alarm ((TP2 + FP2)
= (88 + 25)), a large subset correctly turned out to contain a true threat (TP2 = 88). These counts resulted in an overall
value of PPV = 0.78, much closer to the 1 value of a perfect system and much higher than the PPV of the first system
alone.4 When a final alarm was declared, the operator could trust that a true threat was indeed present since, overall,
the tiered system did not “cry wolf” very often.
Of course, the program manager must compare the overall performance of the tiered system to capability
requirements in order to assess its appropriateness for the envisioned mission (Department of Defense 2015;
Department of Homeland Security, 2008). The overall values of Pd = 0.88, Pfa ≈ 0, NPV ≈ 1, and PPV = 0.78 may or
may not be adequate once these values are compared to such requirements. Statistical tests can determine whether the
overall values of the tiered system are significantly less than required (Fleiss, Levin, & Paik, 2013). Although the
overall values of Pd and PPV are both high, these values may not be high enough, depending on the envisioned mission
for the system. Requirements should be set for all four metrics based on this envisioned mission. Setting metrics for
only Pd and Pfa effectively ignores the operator’s view, while setting metrics for only PPV and NPV effectively ignores
the developer’s view.5 Setting the appropriate requirements for a particular mission is a complex process and is beyond
the scope of this paper.
4 Ibid. 5 All four of these metrics are correlated, since all four metrics depend upon the system’s threshold for alarm. For example, tuning a system to lower its alarm threshold will increase its Pd at the cost of also increasing its Pfa. Thus, Pd cannot be considered in the absence of Pfa and vice versa. To examine this correlation, Pd and Pfa are often plotted against each other while the system’s alarm threshold is systematically varied, creating a Receiver-Operating Characteristic (ROC) curve (Urkowitz, 1967). Similarly, lowering the system’s alarm threshold will also decrease its PPV. To explore the correlation between Pd and PPV, these metrics can be plotted against each other while the system’s alarm threshold is systematically varied in order to form a Precision-Recall curve (Powers, 2011). (Note that PPV and Pd are often referred to as Precision and Recall in the information retrieval community (Powers, 2011). Also, Pd and Pfa are often referred to as Sensitivity and One Minus Specificity in the medical community (Altman & Bland, 1994a).) Furthermore, although Pd and Pfa do not depend upon Prev, PPV and NPV do. Therefore, program managers must take Prev into account when testing the system. Such considerations can be done in a cost-effective

THE THREAT DETECTION SYSTEM THAT CRIED WOLF 9
Threat Detection vs. Threat Classification
The term “threat detection system” can be a misnomer since it is often used to refer to threat detection and threat
classification systems. Threat classification systems are those that are presented with a set of predefined, discrete
items. The system’s task is to classify each item as either “Alarm (Threat)” or “No Alarm (No Threat).” Our notional
air cargo screening system is actually an example of a threat classification system, despite the fact that we have
repeatedly referred to it as threat detection system throughout the first half of this paper. In contrast, genuine threat
detection systems are those that are not presented with a set of predefined, discrete items. The system’s task is to first
detect the discrete items from a continuous stream of data and then classify each detected item as either “Alarm
(Threat)” or “No Alarm (No Threat).” An example of a genuine threat detection system is the notional counter-IED
system illustrated in Figure 4.
This issue is more than semantics. Proper labeling of a system’s task helps to ensure that the appropriate
performance metrics are used to assess the system. In particular, while Pfa and NPV can be used to describe threat
classification systems, they cannot be used to describe genuine threat detection systems. For example, Equation (2)
shows that Pfa depends on FP and TN counts, items that did not contain a true threat. While a FP is an item that
incorrectly caused an alarm, a TN is an item that correctly did not cause an alarm. FPs and TNs can be counted for
threat classification systems and used to calculate Pfa, as described earlier for our notional air cargo screening system.
This story changes for genuine threat detection systems, however. While FPs can be counted for genuine threat
detection systems, TNs cannot.
Program managers must carefully consider the definition of TNs for their systems. For our notional counter-IED
system, a FP is a location on the road for which a true IED is not buried but for which the system incorrectly declared
an alarm. Unfortunately, a converse definition for TNs does not make sense: How should one count the number of
locations on the road for which a true IED is not buried and for which the system correctly does not declare an alarm?
That is, how often should the system get credit for declaring nothing when nothing was truly there? To answer these
questions, it may be possible to divide the road into sections and count the number of sections for which a true IED is
not buried and for which the system correctly does not declare an alarm. However, such a method simply converts the
counter-IED detection problem into a counter-IED classification problem, in which discrete items (sections of road)
way by designing the test to have an artificial prevalence of 0.5 and then calculating PPV and NPV from the Pd and Pfa values calculated during the test and the Prev value estimated for operational settings (Altman & Bland, 1994a).
THE THREAT DETECTION SYSTEM THAT CRIED WOLF 10
are predefined and the system’s task is to merely classify each item (each section of road) as either “Alarm (IED)” or
“No Alarm (No IED).” This method imposes an artificial definition on the item (section of road) under classification:
How long should each section of road be? 10 meters long? 1 meter long? 1 centimeter long? Such definitions can
seem artificial, which highlights the fact that the concept of a TN does not exist for genuine threat detection systems.
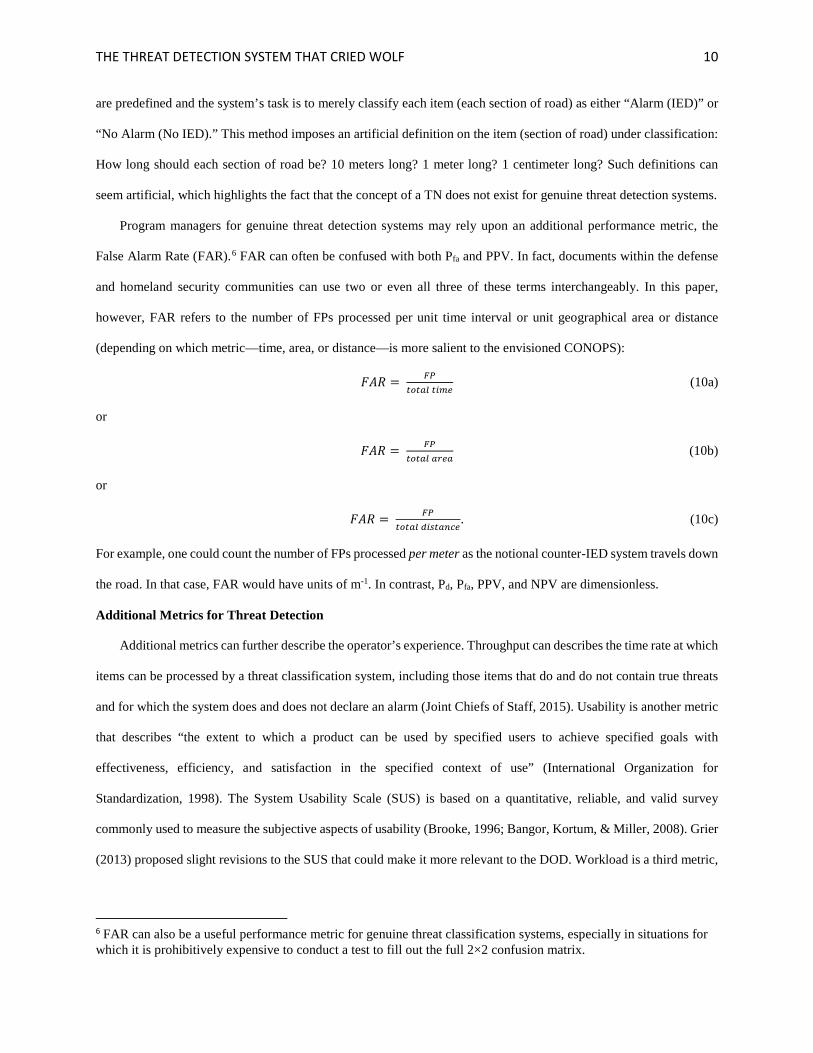
Program managers for genuine threat detection systems may rely upon an additional performance metric, the
False Alarm Rate (FAR).6 FAR can often be confused with both Pfa and PPV. In fact, documents within the defense
and homeland security communities can use two or even all three of these terms interchangeably. In this paper,
however, FAR refers to the number of FPs processed per unit time interval or unit geographical area or distance
(depending on which metric—time, area, or distance—is more salient to the envisioned CONOPS):
𝐹𝐹𝐹𝐹𝐹𝐹 = 𝐹𝐹𝑇𝑇𝑡𝑡𝑡𝑡𝑡𝑡𝑡𝑡𝑡𝑡 𝑡𝑡𝑡𝑡𝑡𝑡𝑡𝑡
(10a)
or
𝐹𝐹𝐹𝐹𝐹𝐹 = 𝐹𝐹𝑇𝑇𝑡𝑡𝑡𝑡𝑡𝑡𝑡𝑡𝑡𝑡 𝑡𝑡𝑎𝑎𝑡𝑡𝑡𝑡
(10b)
or
𝐹𝐹𝐹𝐹𝐹𝐹 = 𝐹𝐹𝑇𝑇𝑡𝑡𝑡𝑡𝑡𝑡𝑡𝑡𝑡𝑡 𝑑𝑑𝑡𝑡𝑑𝑑𝑡𝑡𝑡𝑡𝑑𝑑𝑑𝑑𝑡𝑡
. (10c)
For example, one could count the number of FPs processed per meter as the notional counter-IED system travels down
the road. In that case, FAR would have units of m-1. In contrast, Pd, Pfa, PPV, and NPV are dimensionless.
Additional Metrics for Threat Detection
Additional metrics can further describe the operator’s experience. Throughput can describes the time rate at which
items can be processed by a threat classification system, including those items that do and do not contain true threats
and for which the system does and does not declare an alarm (Joint Chiefs of Staff, 2015). Usability is another metric
that describes “the extent to which a product can be used by specified users to achieve specified goals with
effectiveness, efficiency, and satisfaction in the specified context of use” (International Organization for
Standardization, 1998). The System Usability Scale (SUS) is based on a quantitative, reliable, and valid survey
commonly used to measure the subjective aspects of usability (Brooke, 1996; Bangor, Kortum, & Miller, 2008). Grier
(2013) proposed slight revisions to the SUS that could make it more relevant to the DOD. Workload is a third metric,
6 FAR can also be a useful performance metric for genuine threat classification systems, especially in situations for which it is prohibitively expensive to conduct a test to fill out the full 2×2 confusion matrix.

THE THREAT DETECTION SYSTEM THAT CRIED WOLF 11
defined as “the cost incurred by a human operator to achieve a particular level of performance” (Hart & Staveland,
1988). The NASA Task Load Index (NASA-TLX) is a quantitative, valid, and reliable survey that is commonly used
to measure mental workload in the human factors community (Hart & Staveland, 1988). Program managers can
conduct a test in which operators are asked to fill out the SUS and NASA-TLX surveys soon after operating a threat
detection system in an operationally relevant setting. The results of these surveys could augment the more standard
performance metrics of Pd, Pfa, NPV, PPV, FAR, and/or throughput, thereby anticipating the operator’s view of the
threat detection system early in the system’s development.

THE THREAT DETECTION SYSTEM THAT CRIED WOLF 12
References
Altman, D. G., & Bland, J. M. (1994a). Diagnostic tests 1: Sensitivity and specificity. BMJ, 308(6943), 1552.
doi:http://dx.doi.org/10.1136/bmj.308.6943.1552
Altman, D. G. & Bland, J. M. (1994b). Diagnostic tests 2: Predictive values. BMJ, 309(6947), 102.
doi:http://dx.doi.org/10.1136/bmj.309.6947.102
Bangor, A., Kortum, P. T., & Miller, J. T. (2008). An empirical evaluation of the system usability scale.
International Journal of Human-Computer Interaction, 24(6), 574–594. doi:10.1080/10447310802205776
Bliss, J. P., Gilson, R. D., & Deaton, J. E. (1995). Human probability matching behavior in response to alarms of
varying reliability. Ergonomics, 38(11), 2300–2312. doi:10.1080/00140139508925269
Brooke, J. (1996). SUS: a ‘quick and dirty’ usability scale. In P. W. Jordan, B. Thomas, B. A. Weerdmeester, & I. L.
McClelland (Eds.) Usability evaluation in industry (pp. 189–194). Philadelphia, PA: Taylor & Francis, Inc.
Cushman, J. H. (1987, June 21). Making arms fighting men can use. The New York Times. Retrieved from
http://www.nytimes.com/1987/06/21/business/making-arms-fighting-men-can-use.html?pagewanted=all
Daniels, D. J. (2006). A review of GPR for landmine detection. Sensing and Imaging: An International Journal,
7(3), 90–123. Retrieved from http://link.springer.com/article/10.1007%2Fs11220-006-0024-5
Department of Defense. (2015, January 7). Operation of the defense acquisition system (Department of Defense
Instruction (DoDI) 5000.02). Washington, DC: USD(AT&L). Retrieved from
http://bbp.dau.mil/docs/500002p.pdf
Department of Homeland Security. (2008, November 7). Acquisition instruction/guidebook (DHS Publication
No. 102-01-001, Interim, Version 1.9). Retrieved from http://www.it-
aac.org/images/Acquisition_Instruction_102-01-001_-_Interim_v1.9_dtd_11-07-08.pdf
Fleiss, J. L., Levin, B., & Paik, M. C. (2013). Statistical methods for rates and proportions (3rd ed.). Hoboken, NJ:
John Wiley & Sons, Inc.
Getty, D. J., Swets, J. A., Pickett, R. M., & Gonthier, D. (1995). System operator response to warnings of danger: A
laboratory investigation of the effects of the predictive value of a warning on human response time. Journal of
Experimental Psychology: Applied, 1(1): 19–33.
THE THREAT DETECTION SYSTEM THAT CRIED WOLF 13
Grier, R. A. (2013). The potential utility of the system usability scale in U.S. military acquisition. Proceedings of the
Human Factors and Ergonomics Society 57th Annual Meeting, 206–209. Retrieved from
http://pro.sagepub.com/content/57/1/206.full.pdf
Hart, S. G., & Staveland, L. E. (1988). Development of NASA-TLX (Task Load Index): Results of empirical and
theoretical research. Advances in Psychology, 52, 139–183. doi:10.1016/S0166-4115(08)62386-9
International Organization for Standardization. (1998). Ergonomic requirements for office work with visual display
terminals (VDTs) -- Part 11: Guidance on usability (ISO Publication No. 9241-11). Geneva, Switzerland:
Technical Committee ISO/TC 159, Ergonomics, Subcommittee SC 4, Ergonomics of Human-System
Interaction.
Joint Chiefs of Staff. 2015. Department of Defense dictionary of military and associated terms. Joint Publication
1-02. Washington, DC: Department of Defense, November 2010 (as amended through 15 November 2015).
Retrieved from http://www.dtic.mil/doctrine/new_pubs/jp1_02.pdf
L3 Communications Cyterra. (2012). AN/PSS-14 mine detection. Orlando, FL: Author. Retrieved from
http://cyterra.com/products/anpss14.htm
L3 Communications, Security & Detection Systems, Inc. (2011). Fact sheet: Examiner 3DX explosives detection
system. Woburn, MA: Author. Retrieved from http://www.sds.l-3com.com/forms/English-
pdfdownload.htm?DownloadFile=PDF-13
L3 Communications, Security & Detection Systems, Inc. (2013). Fact sheet: Air cargo screening solutions:
Regulator-qualified detection systems. Woburn, MA: Author. Retrieved from http://www.sds.l-
3com.com/forms/English-pdfdownload.htm?DownloadFile=PDF-50
L3 Communications, Security & Detection Systems, Inc. (2014). Fact sheet: Explosives detection systems:
Regulator-approved checked baggage solutions. Woburn, MA: Author. Retrieved from http://www.sds.l-
3com.com/forms/English-pdfdownload.htm?DownloadFile=PDF-17
MacKinnon, I. (2007, June 7). Aceh residents disable tsunami warning system after false alarm. The Guardian.
Retrieved from http://www.theguardian.com/world/2007/jun/07/indonesia.ianmackinnon
Niitek. (n.d.). Counter IED | Husky Mounted Detection System (HMDS). Sterling, VA: Author. Retrieved from
http://www.niitek.com/~/media/Files/N/Niitek/documents/hmds.pdf

THE THREAT DETECTION SYSTEM THAT CRIED WOLF 14
Oldham, J. (2006, October 3). Outages highlight internal FAA rift. The Los Angeles Times. Retrieved from
http://articles.latimes.com/2006/oct/03/local/me-faa3
Parasuraman, R. (1997). Humans and automation: Use, misuse, disuse, abuse. Human Factors, 39(2), 230–253.
Retrieved from http://hfs.sagepub.com/content/39/2/230.short?rss=1&ssource=mfc
Powers, D. M. W. (2011). Evaluation: From precision, recall and F-measure to ROC, informedness, markedness &
correlation. Journal of Machine Learning Technologies, 2(1), 37–63.
Scheaffer, R. L., & McClave, J. T. (1995). Conditional probability and independence: Narrowing the table. In
Probability and statistics for engineers (4th ed.) (pp. 85–92). Belmont, CA: Duxbury Press.
Stuart, R. (1987, January 8). U.S. cites Amtrak for not conducting drug tests. The New York Times. Retrieved from
http://www.nytimes.com/1987/01/08/us/us-cites-amtrak-for-not-conducting-drug-tests.html
Transportation Security Administration. (2013). TSA Air Cargo Screening Technology List (ACSTL) (Version 8.4 as
of 01/31/2013). Washington, DC: Author. Retrieved from http://www.cargosecurity.nl/wp-
content/uploads/2013/04/nonssi_acstl_8_4_jan312013_compliant.pdf
Wilson, J. N., Gader, P., Lee, W-H., Frigui, H., and Ho, K. C. (2007). A large-scale systematic evaluation of
algorithms using ground-penetrating radar for landmine detection and discrimination. IEEE Transactions on
Geoscience and Remote Sensing, 45(8), 2560–2572. doi:10.1109/TGRS.2007.900993
Urkowitz, Harry. 1967. Energy detection of unknown deterministic signals. Proceedings of the IEEE, 55(4),
523–531. doi:10.1109/PROC.1967.5573
U.S. Army. (n.d.) PdM counter explosive hazard: Countermine systems. Picatinny Arsenal, NJ: Project Manager
Close Combat Systems, SFAE-AMO-CCS. Retrieved from
http://www.pica.army.mil/pmccs/pmcountermine/CounterMineSys.html#nogo02
THE THREAT DETECTION SYSTEM THAT CRIED WOLF 15
Figure 1. A notional air cargo screening system (large blue box). A set of predefined, discrete items (small brown
boxes) are presented to the system one at a time. Some items contain a true threat (orange star) among clutter, while
other items contain clutter only (no orange star). For each item, the system declares either one or zero alarms. All
items for which the system declares an alarm (red exclamation point) are further examined manually by trained
personnel (purple figure). In contrast, all items for which the system does not declare an alarm (green checkmark) are
left unexamined and loaded directly onto the airplane.

THE THREAT DETECTION SYSTEM THAT CRIED WOLF 16
Figure 2. A 2×2 confusion matrix of a notional air cargo screening system, counting the number of TP, FN, FP, and
TN items processed by the system. Pd and Pfa summarize the developer’s perspective of the system’s performance
while PPV and NPV summarize the operator’s perspective. In this notional example, the low PPV of 15% indicates a
poor operator experience (the system often “cries wolf”, since only 15% of alarms turn out to be true threats) even
though the excellent Pd and Pfa are well-received by developers.
THE THREAT DETECTION SYSTEM THAT CRIED WOLF 17
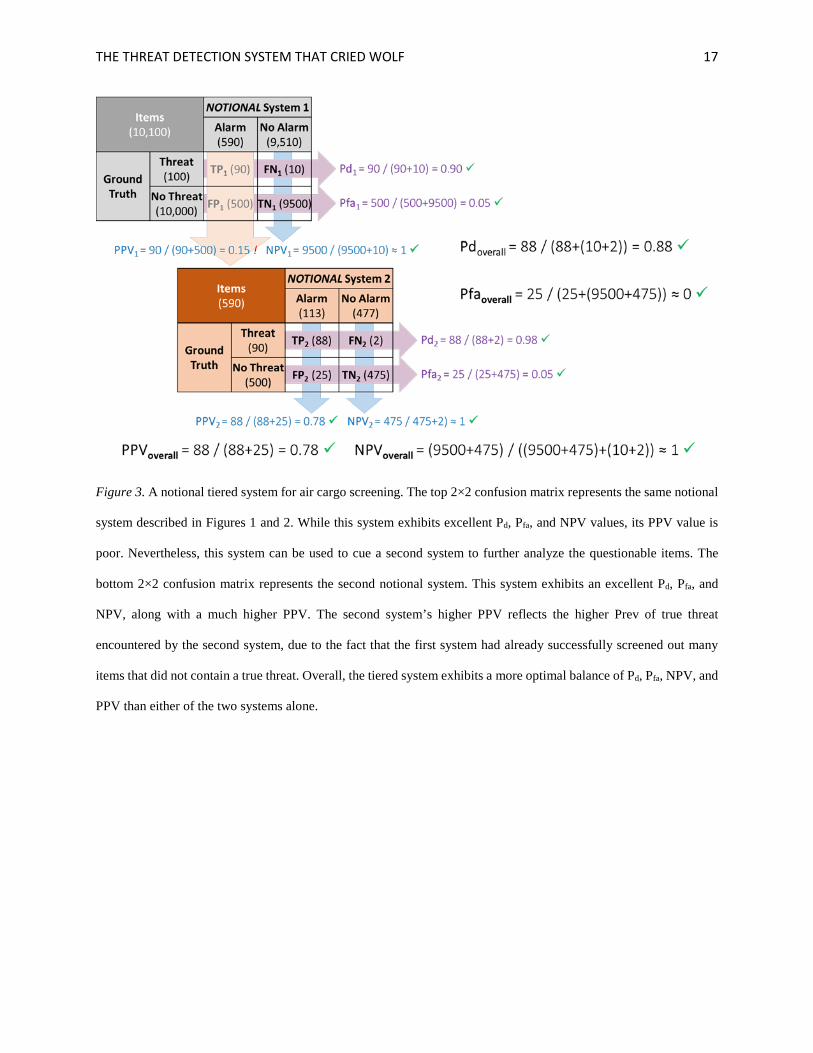
Figure 3. A notional tiered system for air cargo screening. The top 2×2 confusion matrix represents the same notional
system described in Figures 1 and 2. While this system exhibits excellent Pd, Pfa, and NPV values, its PPV value is
poor. Nevertheless, this system can be used to cue a second system to further analyze the questionable items. The
bottom 2×2 confusion matrix represents the second notional system. This system exhibits an excellent Pd, Pfa, and
NPV, along with a much higher PPV. The second system’s higher PPV reflects the higher Prev of true threat
encountered by the second system, due to the fact that the first system had already successfully screened out many
items that did not contain a true threat. Overall, the tiered system exhibits a more optimal balance of Pd, Pfa, NPV, and
PPV than either of the two systems alone.

THE THREAT DETECTION SYSTEM THAT CRIED WOLF 18
Figure 4. A notional counter-IED system. Several items are buried in a road often traveled by a U.S. convoy. Some
items are IEDs (orange stars), while others are simply rocks, trash, or other discarded items. The system continuously
collects data while traveling over the road ahead of the convoy and declares one alarm (red exclamation point) for
each location at which it detects a buried IED. All locations for which the system declares an alarm are further
examined with robotic systems operated remotely by trained personnel (purple arm). In contrast, all parts of the road
for which the system does not declare an alarm are left unexamined and are directly traveled over by the U.S. convoy.

REPORT DOCUMENTATION PAGE Form Approved
OMB No. 0704-0188 The public reporting burden for this collection of information is estimated to average 1 hour per response, including the time for reviewing instructions, searching existing data sources, gathering and maintaining the data needed, and completing and reviewing the collection of information. Send comments regarding this burden estimate or any other aspect of this collection of information, including suggestions for reducing the burden, to Department of Defense, Washington Headquarters Services, Directorate for Information Operations and Reports (0704-0188), 1215 Jefferson Davis Highway, Suite 1204, Arlington, VA 22202-4302. Respondents should be aware that notwithstanding any other provision of law, no person shall be subject to any penalty for failing to comply with a collection of information if it does not display a currently valid OMB control number. PLEASE DO NOT RETURN YOUR FORM TO THE ABOVE ADDRESS. 1. REPORT DATE
December 2015 2. REPORT TYPE
Final 3. DATES COVERED (From–To)
November 2015 – December 20154. TITLE AND SUBTITLE
The Threat Detection System That Cried Wolf: Reconciling Operators with Developers
5a. CONTRACT NUMBER N/A
5b. GRANT NUMBER
5c. PROGRAM ELEMENT NUMBER
6. AUTHOR(S)
Shelley Cazares
5d. PROJECT NUMBER
5e. TASK NUMBER AE-2-2194
5f. WORK UNIT NUMBER
7. PERFORMING ORGANIZATION NAME(S) AND ADDRESS(ES)
Institute for Defense Analyses 4850 Mark Center Drive Alexandria, VA 22311-1882
8. PERFORMING ORGANIZATION REPORTNUMBER
IDA Documepnt NS D-5689 Log: H 15-001234
9. SPONSORING / MONITORING AGENCY NAME(S) ANDADDRESS(ES)
Institute for Defense Analyses 4850 Mark Center Drive Alexandria, VA 22311-1882
10. SPONSOR/MONITOR’S ACRONYM(S)
IDA 11. SPONSOR/MONITOR’S REPORT
NUMBER(S)
12. DISTRIBUTION/AVAILABILITY STATEMENT
Approved for public release; distribution is unlimited (24 February 2016).
13. SUPPLEMENTARY NOTES
14. ABSTRACT
The Department of Defense and Department of Homeland Security use many threat detection systems, such as air cargo screeners and counter-Improvised Explosive Device systems. Threat detection systems that perform well during testing are not always well-received by the system operators, however. Some systems may frequently “cry wolf,” generating alarms even when true threats are not present. As a result, operators may lose faith in the systems—ignoring them or even turning them off and taking the chance that a true threat will not appear. This paper reviews statistical concepts to reconcile the performance metrics that summarize a developer’s view of a system during testing with the metrics that describe an operator’s view of the system during real-world missions. Program managers can still make use of systems that “cry wolf” by arranging them into a tiered system that, overall, exhibits better performance than any individual system alone.
15. SUBJECT TERMS
Probability of Detection (Pd), Probability of False Alarm (Pfa), Positive Predictive Value (PPV), Negative Predictive Value (NPV), Prevalence (Prev)
16. SECURITY CLASSIFICATION OF: 17. LIMITATION OF
ABSTRACT
SAR
18. NUMBER OF
PAGES
21
19a. NAME OF RESPONSIBLE PERSONPhilip Major
a. REPORTUncl.
b. ABSTRACTUncl.
c. THIS PAGEUncl.
19b. TELEPHONE NUMBER (include area code)
(703) 845-2201Standard Form 298 (Rev. 8-98) Prescribed by ANSI Std. Z39.18


