The Theory of planned behaviour and the Entrepreneurial ...
105
THE THEORY OF PLANNED BEHAVIOUR AND THE ENTREPRENEURIAL EVENT MODEL AS PREDICTIVE MODELS OF ENTREPRENEURIAL INTENTION Fawwaaz Davids (DVDFAW001) A dissertation submitted in partial fulfilment of the requirements for the award of the degree of Master of Social Science in Organisational Psychology Faculty of the Humanities University of Cape Town 2017 Supervisor: Dr Jeff Bagraim COMPULSORY DECLARATION This work has not been previously submitted in whole, or in part, for the award of any degree. This is my own work. Each contribution to, and quotation in this dissertation from the work, or works, of other people has been attributed, and has been cited and referenced accordingly. Signature: Date: 13/03/2017 Signature removed
Transcript of The Theory of planned behaviour and the Entrepreneurial ...

THE THEORY OF PLANNED BEHAVIOUR AND THE ENTREPRENEURIAL EVENT
MODEL AS PREDICTIVE MODELS OF ENTREPRENEURIAL INTENTION
Fawwaaz Davids
(DVDFAW001)
A dissertation submitted in partial fulfilment of the requirements for the award of the degree
of Master of Social Science in Organisational Psychology
Faculty of the Humanities
University of Cape Town
2017
Supervisor: Dr Jeff Bagraim
COMPULSORY DECLARATION
This work has not been previously submitted in whole, or in part, for the award of any
degree. This is my own work. Each contribution to, and quotation in this dissertation from the
work, or works, of other people has been attributed, and has been cited and referenced
accordingly.
Signature: Date: 13/03/2017 Signature removed

The copyright of this thesis vests in the author. No quotation from it or information derived from it is to be published without full acknowledgement of the source.
The thesis is to be used for private study or non-commercial research purposes only. Published by the University of Cape Town (UCT) in terms of the non-exclusive license granted to UCT by the author.

i
Abstract
The Theory of Planned Behaviour and The Entrepreneurial Event Model were used as
models to predict entrepreneurial intention amongst final year students. The sufficiency of
this paradigm was compared with the aim of determining which model predicts
entrepreneurial intention the most within a South African context. A sample of 186 students
was used to determine the sufficiency of the Theory of Planned Behaviour. As part of our
methodology, a sub-set (n = 123) of the sample was used to determine the sufficiency of the
Entrepreneurial Event Model. The sample consisted of final year commerce and engineering
students. The results of the regression analysis indicated that the Theory of Planned
Behaviour explained 58% of the variance in entrepreneurial intention. The Entrepreneurial
Event Model was found to be less sufficient than the Theory of Planned Behaviour and only
explained 38% of the variance in entrepreneurial intention. Therefore, when predicting
entrepreneurial intention in a South African context, the Theory of Planned Behaviour can be
considered the more sufficient model of prediction. Future research should consider using the
Theory of Planned Behaviour, rather than Entrepreneurial Event Model, for entrepreneurial
intention prediction among students in South Africa.

ii
Table of Contents
1. Introduction………………………………………………………………..........................1
2. Literature Review…………………………………………………………………….........5
2.1. Entrepreneurial Intention……………………………………………………………..6
2.2. The Theory of Planned Behaviour………………………………………………........9
2.3. The Theory of Planned Behaviour as a Predictor of Entrepreneurial Intention…......12
2.4. The Model of the Entrepreneurial Event…………………………………………….16
2.5. The Entrepreneurial Event Model as a predictor of Entrepreneurial Intention……...20
2.6. Comparing and contrasting the Theory of Planned Behaviour and the Entrepreneurial
Event Model…………………………………………………………………………24
2.7. Literature on comparing the Theory of Planned Behaviour and the Entrepreneurial
Event Model…………………………………………………………………………25
3. Methods………………………………………………………………………………......28
3.1. Research Design……………………………………………………………………..28
3.2. Participants and Sampling…………………………………………………………...28
3.3. Procedure…………………………………………………………………………….30
3.4. Measures…………………………………………………………………………….31
3.4.1. Entrepreneurial Intention……………………………………………………..31
3.4.2. Attitude toward behaviour……………………………………………………32
3.4.3. Subjective Norms…………………………………………………………….33
3.4.4. Perceived Behavioural Control………………………………………………33
3.4.5. Perceived Desirability………………………………………………………..33
3.4.6. Perceived Feasibility…………………………………………………………34
3.4.7. Propensity to act……………………………………………………………...34
3.4.8. Demographic Characteristics……………………………………………...…35
3.5. Statistical Analyses………………………………………………………………….35
4. Results……………………………………………………………………………………36
4.1. Structure and Reliability of Measurement Scales…………………………………...36
4.1.1. Entrepreneurial Intention……………………………………...……………...39
4.1.2. Attitude toward behaviour……………………………………………...…….39
4.1.3. Subjective Norms…………………………………………………………….40
4.1.4. Perceived Behavioural Control………………………………...…………….40
4.1.5. Perceived Desirability………………………………………………………..41

iii
4.1.6. Perceived Feasibility…………………………………………………………42
4.1.7. Propensity of act…...…………………………………………………………43
4.2. Descriptive Statistics………………………………………………………………...44
4.3. Correlation Analysis…………………………………………………………………45
4.4. Regression Analysis…………………………………………………………………47
4.4.1. The Theory of Planned Behaviour…………………………………………...48
4.4.2. The Entrepreneurial Event Model……………………………………………49
4.5. Outliers and influential cases………………………………………………………..50
4.6. Multiple Regression Analysis Assumptions………………………………………...51
4.7. Power Analysis……………………………………………………………………...52
4.8. Comparing the Predicting Models of Entrepreneurial Intention…………………….53
5. Discussion………………………………………………………………………………..54
5.1. Summary of Main Findings…………………………………………………………54
5.2. The Theory of Planned Behaviour…………………………………………………..54
5.2.1. Attitude toward behaviour……………………………………………………55
5.2.2. Subjective Norms………………………………………………………….....56
5.2.3. Perceived Behavioural Control………………………………………………57
5.3. The Entrepreneurial Event Model…………………………………………………..58
5.3.1. Perceived Desirability……………………………………………………..…58
5.3.2. Perceived Feasibility…………………………………………………………59
5.3.3. Propensity to act……………………………………………………………...60
5.4. Theoretical Implications…………………………………………………………..…61
5.5. Practical Implications………………………………………………………………..62
5.6. Limitations…………………………………………………………………………..63
5.6.1. Sampling Limitations………………………………………………………...63
5.6.2. Measurement Limitations…………………………………………………….63
5.6.3. Entrepreneurial Event Model………………………………………………...64
5.7. Suggestions for future research……………………………………………………...65
5.8. Conclusion…………………………………………………………………………...66
6. References………………………………………………………………………………..68
7. Appendices
7.1. Appendix 1: Summary of Original Scales…………………………………………..75
7.2. Appendix 2: The Questionnaire……………………………………………………..78
7.3. Appendix 3: Box plots………………………………………………………………91

iv
7.4. Appendix 4: Factor Loadings and Inter-Item Correlation Tables for Propensity to Act
Items…………………………………………………………………………………93
7.5. Appendix 5: Assumptions of the Theory of Planned Behaviour regression model…94
7.6. Appendix 6: Assumptions of the Entrepreneurial Event Model regression analysis..96

v
List of Tables
Table 1 Research articles that used the antecedents of the Theory of Planned
Behaviour to predict Entrepreneurial Intention …13
Table 2 Research articles that used the antecedent(s) of the Entrepreneurial
Event Model to predict Entrepreneurial Intention …21
Table 3 Demographic Characteristics of sample …30
Table 4 Factor loadings for the Entrepreneurial Intention Scale Items …39
Table 5 Factor loadings for the Subjective Norms Scale Items …40
Table 6 Factor loadings for the Perceived Behavioural Control Items …41
Table 7 Factor loadings for the Perceived Desirability Items …42
Table 8 Factor loadings for the Perceived Feasibility Items …42
Table 9 Descriptive Statistics (Variables of the TPB and EEM) …44
Table 10 Correlation Matrix for the components of the Theory of Planned
Behaviour …46
Table 11 Correlation Matrix for the components of the Entrepreneurial Event
Model …47
Table 12 Regression Model Summary for the Theory of Planned Behaviour
Model …49
Table 13 Regression Model Summary for the Entrepreneurial Event Model …50

vi
List of Figures
Figure 1 The Theory of Planned Behaviour …10
Figure 2 The Model of the Entrepreneurial Event …18

1
Introduction
Entrepreneurship has been identified as a possible solution to alleviate unemployment
and promote economic growth within South Africa (Mmesi, 2015; Oosthuizen & Cassim,
2015). This is particularly important for South Africa as the unemployment rate, as well as
slow economic development, are among the country’s major concerns (Rogan & Reynolds,
2015). Categorised as an upper middle-income country, South Africa needs to improve the
state of its economy if the country is to remain competitive in the global economy (Mmesi,
2015). Developing the economy is challenging, especially when roughly one quarter of the
workforce remains unemployed due to the lack of employment opportunities. However, the
establishment of new ventures, businesses and organisations, whether formal or informal,
small or medium enterprises, can create these much needed employment opportunities. Job
creation would, in turn, allow more working class South Africans to become involved in
contributing to the country’s economy (Mmesi, 2015; Oosthuizen & Cassim, 2015).
Hisrich, Peters and Shepard (2005) have defined entrepreneurship as the capacity of
an individual to form and manage an enterprise or venture which usually involves
considerable risk and reward. It was entrepreneurship that changed the state of Europe, Asia
and America, allowing these nations to emerge as forerunners in the global economy
(Kamua, 2013). This identifies the importance of entrepreneurs and their ability to bring
about positive change for the individual and a nation. Unfortunately, South Africa lacks the
required level of entrepreneurial activity to bring about positive change such as economic
growth (Mmesi, 2015; Oosthuizen & Cassim, 2015). After establishing a democracy, South
Africa recognised the critical role of entrepreneurship in addressing unemployment and has
thus sought to encourage their citizens, especially the youth of the country in starting new
businesses (Mmesi, 2015; Tabane, 2016). However, planning to develop the level of

2
entrepreneurial activity within a country is a difficult task as it would mean changing
attitudes and behaviour. This quickly attracted the interest of academic researchers.
Some of the first research conducted relating to entrepreneurship involved examining
the personality and characteristics of already established entrepreneurs (Hornaday & Aboud,
1971; McClelland, Atkinson, Clark & Lowell, 1953; McClelland, 1961). This research
developed a foundation for future entrepreneurship research, as researchers identified some of
the personality traits and attributes that set entrepreneurs apart from other individuals.
However, this did not mean that individuals who had these personality traits and attributes
were all going to become entrepreneurs. Therefore, personality traits and attributes could not
be considered as efficient predictors of whether or not individuals would engage in
entrepreneurial activity. This then sparked further enquiry and entrepreneurship research
shifted toward investigating the antecedents which lead to entrepreneurial behaviour.
There are many predictors of behaviour and this varies depending on the type of
behaviour. However, Ajzen and Fishbein (1977) theorised that intention to perform a
behaviour is the most effective predictor. Ajzen and Fishbein’s (1977) theory of reasoned
action (TRA) gained popularity when it was found to be a sufficient predictor of intention
(Ajzen & Madden, 1985). The intention to perform a behaviour was then applied within
entrepreneurial research. Researchers started focusing on entrepreneurial intention (EI) and
the factors that could affect EI, rather than studying the entrepreneurs themselves (Bird &
Jelinek, 1988). EI refers to the inclination an individual has to form or create new ventures
(Bird & Jelinek, 1988). This research flourished as it gave an indication of the factors which
could potentially increase EI and in turn lead to entrepreneurial behaviour. Among the factors
identified were attitudes, subjective norms, education and social support, to mention a few
(Ajzen & Fishbein, 1977).

3
Earlier research found results that support these notions. Tkachev and Kolvereid
(1999) suggested that if universities educate their students about entrepreneurship and give
them opportunities to actually practice their entrepreneurial skills, these students become
more inclined to starting their own business. Similarly, more recent research reports that
providing platforms for students, whereby they are able to network and build relationships
with established entrepreneurs, also fosters EI (Buttar, 2015). Lastly, incorporating
programmes within the curriculum that changes the attitudes and perceptions of
entrepreneurship with regard to the feasibility of being self-employed is another factor that
was found to be beneficial for increasing EI among students (Luthje & Frank, 2003).
Promoting entrepreneurship at this level is exactly what South Africa requires to plan for
future economic development. Unfortunately, the majority of the research on EI has been
investigated abroad and due to cultural differences amongst nations the results may not have
the same implications for South Africa (Gurel, Altinay & Daniele, 2010). This indicates the
need for further investigation of EI among South African students due to the benefits of this
research, which can be seen in other countries. This study intends on contributing to this area
of research.
A number of theories has been applied to EI research. Nonetheless, one theory
remains dominant. Currently, Ajzen’s (1991) theory of planned behaviour (TPB) is now the
most common theoretical framework applied in entrepreneurial research today due to its
sufficiency in predicting EI (Schlaegel & Koenig, 2013). The TPB is an extension of the
TRA, as it manages to address a limitation of behaviour prediction of the prior model (Ajzen
& Fishbein, 1977; Ajzen & Fishbein, 1980). The TPB proposed that the intentions to perform
behaviours are predicted by three components; the attitude toward the behaviour, the
subjective norm and the perceived behavioural control. The attitude toward behaviour refers
to the favourable, or unfavourable, evaluation an individual has toward a behaviour. The

4
subjective norm refers to the social pressures experienced by the individual to perform a
behaviour. Lastly, perceived behavioural control refers to an individual’s ability to perform a
behaviour, and also includes if an individual is facing challenges, or has resources to perform
the behaviour. These three components determine the strength of the intention and the
stronger the intention, the more likely it will be for an individual to engage in a particular
behaviour (Azjen, 1991).
Similarly to the TPB, another model which has been applied within this area of
research is Shapero and Sokol’s (1982) Entrepreneurial Event Model (EEM). The EEM has
not been as extensively applied within EI research compared to the TPB, however where it
has been applied the model has also shown sufficiency in predicting EI. This model also has
three antecedents that predict EI which are namely; perceived desirability, perceived
feasibility and propensity to act. Perceived desirability refers to the degree in which an
individual finds the prospect of starting a business as attractive. Perceived feasibility refers to
whether an individual believes that he or she is capable of starting a business (Shapero &
Sokol, 1975). Lastly, propensity to act refers to an individual’s disposition on acting upon
their decisions (Shapero, 1975).
These competing models have opened debate to which is more sufficient in predicting
EI. The majority of EI research applies the TPB as a framework for predicting EI, however
Krueger, Reilly and Carsrud (2000) conducted a study that found the EEM as a more
sufficient model for predicting EI. On the other hand, a meta-analysis conducted by Schlaegel
and Koenig (2013) found the TPB to be the better predictive framework of EI. Unfortunately,
the research conducted by Krueger et al. (2000), or the research included in the meta-analysis
which compared the models, was not conducted within a South African context (Schlaegel &
Koenig, 2013). Therefore, this leaves a gap in literature regarding which is the better model
of EI prediction within a South African context. This is an important debate as cultural

5
differences within countries across the world play a fundamental role in determining which
antecedents of each model are more responsible in predicting EI, or if they in fact have any
effect (Autio, Keeley, Klofsten, Parker & Hay, 2001; Schlaegel & Koenig, 2013). Finding an
appropriate model to apply within a South African context would contribute vastly to this
area of research as the determinants of EI can be understood to a greater extent. It will also
provide future South African researchers with an appropriate model to apply in EI studies.
The TPB and EEM will be used in this study to determine the EI among final year
students. These two models will be compared in order to evaluate which model is more
sufficient in predicting EI among the South African students. The study will then draw a
conclusion regarding which model should be applied when conducting EI research within a
South African context. Furthermore, the differences and similarities of each model will be
discussed with the aim of building an understanding of how exactly these models predict EI
and to what degree they are limited.
Literature Review
The literature review will proceed to analyse existing research relating to this study.
This literature will be used to substantiate the claim that the TPB and EEM predicts EI.
Firstly, the literature on EI will be reviewed to understand how this variable leads to
behaviour and what type of contexts it has been applied in. Thereafter, research which has
made use of either the TPB or EEM will be reviewed in order to understand the sufficiency of
each model in predicting EI. Lastly, literature which has compared the two models will be
reviewed and discussed.
Research papers were gathered during March 2016, using a mixture of online
databases such as EBSCO host, Emerald, SAGE and JSTOR. Additionally, the snowball
effect was used with more renowned research papers within the field, these papers include

6
studies conducted by Ajzen (1991), Autio (2001), Ajzen and Fishbein (1977) and Krueger
(1993).
Entrepreneurial Intention
Ajzen and Fishbein (1977), researchers studying behaviour, beliefs and attitudes,
suggested that intention is an immediate antecedent of performing a behaviour. Intention
refers to the state of mind which guides an individual’s attention, experiences and actions
toward a specific object, goal or path (Bird & Jelinek, 1988). It was also theorised that the
greater the degree of intention, the more likely it would be for a behaviour to occur (Ajzen &
Fishbein, 1977). The relationship between intention and behaviour was tested by Ajzen and
Madden (1985) whereby the class attendance among students was recorded and the students
were asked to complete measures of intention. The results indicated that intention was indeed
a significant predictor of behaviour. Similarly, Bagozzi, Baumgartner and Yi (1989) found
similar results within their research which investigated the mediating effect of intention
between attitude and behaviour. The establishment of the intention-behaviour relationship
then led to the inclusion of intention within a wide range of behaviour research, including
entrepreneurship studies.
The components of TPB demonstrated that intention had antecedents (Ajzen, 1991).
Likewise, Bird and Jelinak (1988) stated that EI is developed through an individual’s
personal needs, wants, values and habits. Thus guided, EI studies and researchers began
developing theories relating to the antecedents of EI. Among these researchers was Shapero
and Sokol (1982) who formulated the EEM, one of the first theoretical frameworks
specifically designed to predict EI by using three predicting variables. Other researchers
found antecedents such as perceived barriers and perceived support to also have the
predictive ability of determining EI (Luthje & Frank, 2003). Perceived barriers negatively

7
correlated with EI and referred to any factor that restricted an individual from starting a
business, such as the availability of finances. Conversely, perceived support positively
correlated with EI and referred to any individuals that offered a form of assistance to an
individual starting a business (Luthje & Frank, 2003).
Buttar (2015) demonstrated that social capital, which refers to the personal
relationships affecting an individual’s behaviour, has been found indirectly to predict EI by
being associated with the components of the TPB. Lastly, past entrepreneurial work
experience and entrepreneurial education has also shown to indirectly influence the
prediction EI by being related to some of the components of the TPB (Yang, 2013).
Entrepreneurial work experience, entrepreneurial education, social capital, perceived barriers
and support can all be recognised as predictors of EI. Therefore, it can be concluded that
there are other antecedents other than those outlined by Ajzen (1991) as well as Shapero and
Sokol (1982). Nonetheless, these variables will not be included in this study.
Across the above mentioned EI research, one aspect of the research which should be
taken into account is the operationalisation and measurement of EI. Using different scales
across research can create inconsistencies in the results observed and create barriers when
comparisons are made between studies. For example, Krueger (1993) viewed EI as a
dichotomous variable, and only used one item to measure EI. Participants chose either ‘yes’
or ‘no’ and were asked if they would ever start their own business. Other researchers believed
that measuring EI as a dichotomous variable created issues in measurement due to the
variable being operationalised poorly (Autio et al., 2001). A few years later EI was again
measured using one item, however the question was posed differently and participants were
asked the possibility of starting a business. Instead of having respondents answer ‘yes’ or
‘no’, participants chose a number between 0 -100, but this still did not capture the essence of
EI (Krueger et al., 2000).

8
The operationalisation of EI changed when Davidsson (1995) measured EI with three
items, which posed similar questions to past research such as “have you ever thought about
founding your own firm?”. The key difference was that participants had three options for
each item and responses categories, including, “never occurred to me” to “have seriously
considered”. Autio et al. (2001) agreed with this newly found operationalisation of EI.
Seeking to improve measurement of EI further, Autio et al. (2001) developed a five point
Likert scale consisting of four items which focused on part time and full time entrepreneurial
intent. This scale is currently the most commonly used scale to date within EI research. The
operationalisation of EI has evolved over time, most researchers believing that measuring EI
by using a few items and response categories captures the essence of EI to a greater extent
(Schlaegel & Koenig, 2013).
Apart from the difference in the operationalisation of EI across research, two other
factors that should be reviewed are the description of the variable and the context EI research
has been applied in. EI has almost always considered to be a dependent variable, where
researchers manipulate the antecedents of EI and measure the effect thereafter (Krueger et al.,
2000; Luthje & Frank, 2003; Yang, 2013). The reason why research focuses on measuring
intention rather than actual behaviour within EI research is due to the fact that performing
longitudinal studying and tracking the behaviour of high volumes of participants is usually
costly. Researchers conduct their studies under the assumption that intention predicts
behaviour as this has been concluded in past research (Ajzen and Madden, 1985; Bagozzi et
al., 1989). However, when behaviour is measured, EI then becomes recognised as the
independent variable and behaviour becomes the dependent variable (Ajzen and Madden,
1985; Bagozzi et al., 1989). This study will measure investigate the influence of antecedents
and therefore, EI will be a dependent variable.

9
The context EI research has most commonly been applied to have been studying the
EI among students across the world (Autio et al., 2001; Buttar, 2015; Krueger et al, 2000;
Luthje & Frank, 2003; Tkachev & Kolvereid, 1999; Turker & Selcuk, 2008). Students are
considered the most suitable candidates for EI, as these individuals have likely been exposed
to some form of entrepreneurial education, or have developed entrepreneurial knowledge
through other courses they have completed. Moreover, students are likely to enter the work
market within the following year, or next few years. Lastly, students are in the perfect
environment where EI can be developed, thus it makes sense to perform the studies using a
sample of students (Krueger et al., 2000).
The Theory of Planned Behaviour
The TPB was developed as an extension of the TRA as mentioned above. Ajzen and
Fishbein (1970) collaborated to study behaviour and outcomes, they proposed the TRA as a
theoretical framework for behaviour prediction. They sought to understand behaviour and
claimed that individuals are rational, and consider the implications of their actions before
performing any action (Ajzen & Fishbein, 1980). However, it was realised that the TRA was
not a sufficient model to predict behaviour due to one major limitation. It was concluded that
the TRA model only functions well when the behaviour is under an individual’s volitional
control (Ajzen, 1988). Perceived behavioural control was introduced into the model as an
indicator of the degree of control an individual has over the behaviour.
The new extended model was coined the TPB. This model sought to achieve the same
goal as the TRA (Ajzen, 1988; Ajzen, 1991). The TPB was recognised as a general model
which could be applied to any behaviour. The main aim of the model was to not only predict,
but also understand any motivational factors which influenced behaviour that was not under
the individual’s volitional control. Madden, Ellen and Ajzen (1992) demonstrated in their

10
study that the additional component accounted for more of the variance in behavioural
intention, and thus improved behavioural intent prediction. Understanding behaviour meant
identifying and manipulating the antecedents of behaviour, if this could be achieved then
behaviour could be changed. (Ajzen, 1988; Ajzen, 1991).
The TPB suggests that an individual’s beliefs about performing a behaviour
influences their behavioural intentions (Ajzen, 2005). The theory is underlined by the
following assumptions; intention is an immediate antecedent of the actual behaviour.
Intention is determined by attitudes toward a behaviour, subjective norms and perceived
behavioural control. These determinants are formed by an individual’s set of beliefs relating
to each component respectively. Lastly, behavioural, normative and control beliefs are
determined by an individual’s background, culture, demographics and experiences (Ajzen,
1991; Ajzen, 2005). Another important aspect of the TPB is that attitudes toward behaviour,
subjective norms and perceived behavioural control are related to one another. Perceived
behavioural control is the only component directly related to the actual behaviour (Ajzen,
1991). Each predictor of the model will be discussed below.
Figure 1
The Theory of Planned Behaviour
Attitudes toward
behaviour
Subjective norms
Perceived
Behavioural Control
Intention Behaviour

11
Behavioural beliefs refer to the connection an individual establishes between a given
behaviour and the outcome that behaviour produces. Ajzen (1991) suggests that an individual
may have many beliefs regarding a behaviour, though only some of those beliefs are readily
accessible. The accessible beliefs function in tandem with the subjective understanding of the
outcomes, which are believed to be produced by the behaviour, and in turn develop that
individual’s attitude toward a specific behaviour. Therefore, depending on the strength of
behavioural beliefs of an individual, the attitude toward behaviour is usually positively or
negatively shaped (Ajzen, 1991). The attitude toward behaviour has a direct influence on an
individual’s behavioural intention, where a more positive orientated attitude results in a
stronger behavioural intention, and a more negative orientated attitude results in a weaker
behavioural intention.
Normative beliefs refers to the individual’s perception of other closely associated
individuals and groups’ beliefs regarding a specific behaviour. These individuals may include
friends and family, as well as role models, work colleagues, or any other relevant individual
or group, dependent on the behaviour. An individual’s motivation to perform a behaviour is
reliant on this perception and respectively this establishes an individual’s subjective norms.
An individual has strong subjective norms and is highly likely to have strong behavioural
intention when these referents are for the behaviour. However, an individual whose referents
do not approve the given behaviour usually have weak subjective norms and are less
motivated, in turn also exhibit lower levels of behavioural intention (Ajzen, 1991).
Control beliefs refer to those factors an individual believes to either facilitate, or
impede, a behaviour. The perceived behavioural control is determined by the individual’s
beliefs regarding the degree of power that individual exerts over those factors which may
facilitate, or impede, the performance of a behaviour. Stronger control beliefs and perceived
power allows an individual to believe that he/she has the ability to perform a behaviour.

12
Weaker control beliefs and perceived power will impede an individual’s performance of a
behaviour (Azjen, 1991). Apart from being the only component related to the actual
behaviour, perceived behavioural control has been the only component that has been
conceptualized as another variable throughout the research. It has been argued that the
conceptualisation of self-efficacy and perceived behavioural control are similar. Bandura
(1977) defined self-efficacy as an individual’s beliefs in his/her abilities to accomplish a task.
Ajzen (2005) has concluded due to its similarity, self-efficacy is an acceptable alternative to
perceived behavioural control within the model of the TPB.
Ajzen (2005) explains that each of these antecedents play a role in predicting
behavioural intention. Attitudes toward the behaviour, subjective norms and perceived
behavioural control should be measured as they are directly associated with behavioural
intention. Measuring the beliefs is not recommended, as they are antecedents of attitude
towards behaviour, subjective norms and perceived behavioural control, thus they are
indirectly associated with behavioural intention (Ajzen, 2005). To assess the sufficiency of
the model in predicting behavioural intent, the data of the antecedents of intention are
gathered from measurement, and should be put into a regression analysis. If the regression
analysis provides significant results of prediction for one or more of the antecedents, this
concludes that the model is sufficient to predict behavioural intent within the context of that
specific study. However, if one or more antecedents reveal insignificant results, this means
these antecedents are not significant predictors of intent within the context of the study
(Ajzen, 2005).
The Theory of Planned Behaviour as a Predictor of Entrepreneurial Intention
Previous studies investigating the TPB as a predictor of EI have found significant
results. The following studies have all been conducted within different countries. This

13
confirms that the TPB can be applied within different cultural contexts, and remain sufficient
in predicting EI. University or higher education students were used as participants and the
sample size varied within each study (Autio et al., 2001; Karimi, Biemans, Lans, Chizari &
Mulder, 2013; Tkachev & Kolvereid, 1999; Varamaki, Joensuu, Tornikoski & Viljamaa,
2013). The table below contains a summary of the studies and each study will be discussed
thereafter. The popular studies will be discussed firstly, followed by more recent work.
Table 1
Research articles that used the antecedents of the Theory of Planned Behaviour to predict
Entrepreneurial Intention
Author and Year Variables Results
Tkachev and Kolvereid
(1999) Employment status
choice intentions
Antecedents of the
TPB
Role models
Gender
Past entrepreneurial
work experience
Self-employment attitude,
subjective norms, perceived
behavioural control and self-
employment experience
were significant predictors
of employment status choice
intentions
Autio, Keeley, Klofsten,
Parker and Hay (2001) Entrepreneurial
Intention
Antecedents of the
TPB
Work experience
Employment status
Gender
Age
Attitude toward behaviour,
subjective norms, perceived
behavioural control, age and
work experience were
significant predictors of
entrepreneurial intention
Varamaki, Joensuu,
Tornikoski and Viljamaa,
(2013)
Entrepreneurial
Intention
Antecedents of the
TPB
Entrepreneurial
education pedagogy
Attitude toward behaviour,
subjective norms and
perceived behavioural
control were significant
predictors of entrepreneurial
intention. Entrepreneurship
education pedagogy shared a
significant positive
relationship with attitudes
toward entrepreneurship.

14
Karimi, Biemans, Lans,
Chizari and Mulder (2013) Entrepreneurial
Intention
Antecedents of the
TPB
Role models
Attitude toward behaviour,
subjective norms and
perceived behavioural
control were significant
predictors of entrepreneurial
intention. Role models were
positively related to each
antecedent of the TPB.
Tkachev and Kolvereid (1999) investigated the employment status choice intentions
and tested the TPB on a sample of 512 Russian students from three different universities.
Employment choices consisted of either salaried work, or being self-employed. Furthermore,
demographics such as parents being entrepreneurs, gender and past entrepreneurial work
experience, were also examined in order to understand the role they played in determining the
intention to become self-employed (Tkachev & Kolvereid, 1999). Each variable was
measured on a 7-point Likert scale, other than self-employment attitude which was calculated
by adding index scores of the reasons for becoming self-employed. Future employment
preference and subjective norms were measured with six items, whereas perceived
behavioural control was measured with six items. Employment choice only consisted of three
items where the students were asked the likelihood of either becoming self-employed,
preferring to work for an organisation or if they were still undecided (Tkachev & Kolvereid,
1999). Results indicated that the self-employment attitude, subjective norms, perceived
behavioural control as well as self-employment experience are significant predictors of
employment status choice intentions. The predictors nearly accounted for half the variance
observed within employment status choice intentions (Tkachev & Kolvereid, 1999).
Autio et al. (2001) applied the TPB to student samples from four different countries to
assess the model’s sufficiency across international borders. The relationship of each

15
antecedent and EI was tested, it was proposed each antecedent share a significant relationship
with EI and perceived behavioural control having the strongest relationship out of the three
antecedents. Demographic factors such as work experience, employment status and gender
were also considered to determine the influence these variables had on EI (Autio et al., 2001).
The sample consisted of 3,445 university students across the four countries and were chosen
randomly from the general student population. The three antecedents of intention were
measure with 5-point Likert scale. Only likelihood to change jobs had was measured on a 4-
point scale, other demographics were dichotomous variables (Autio, 2001). Results varied
across countries, all of the TPB predictors were usually significant with subjective norms
commonly being the weakest predictor. Demographic findings were inconsistent, with the
likelihood to change jobs being the strongest predictor of EI (Autio et al., 2001).
A more recent study conducted by Varamaki et al. (2013), who used the TPB as a
framework for their study, investigated the relationship with entrepreneurial education,
pedagogy and the antecedents of EI. This study collected data from university students at two
points in time; during 2008, when 534 students responded and completed the self-report
measure, and 2010, when only 197 students responded to the follow up. Data was collected at
two points in time to measure the influence entrepreneurial education had on EI (Varamaki et
al., 2013). Attitudes towards work, subjective norms, perceived behavioural control and EI,
were measured with a 7-point Likert scale and consisted of nine, three, five and eight items
respectively. Students were separated into two groups, which were dependent on the teaching
method of entrepreneurial education they received. This was done to conclude which method
of teaching entrepreneurial education was more effective in indirectly influencing EI
(Varamaki et al., 2013). The main findings suggest that the TPB model was sufficient in
predicting EI, and that entrepreneurship education pedagogy shared a significant positive
relationship with attitudes toward entrepreneurship.

16
Similarly, a study conducted by Karimi et al. (2013) also used the TPB as a
framework, and instead of investigating the relationship of entrepreneurial education
pedagogy with the antecedents, role models were rather considered. The sample consisted of
400 science students across seven different universities, who had participated in
entrepreneurship courses. Likewise, this study also used 7-point Likert scales for variables
other than demographics. Attitudes toward work was measured with five items, while
subjective norm, perceived behavioural control and EI were each measured with six items.
Only role models were measured with items where students were asked if any parents,
relatives or friends were successful entrepreneurs (Karimi et al., 2013). Again, the model of
the TPB revealed significant findings and the antecedents predicted EI. Role models were
positively related to each antecedent as well, and thus, it was concluded that role models
indirectly predict EI (Karimi et al., 2013).
According to the literature, the TPB has been a consistent predictor of EI, therefore it
will be tested if the model is sufficient to predict EI within this study. One trend recognised
across these research papers is the evolution of measurement regarding the components of the
model of the TPB. This has been especially significant for EI, which was measured with a
single item within older research (Krueger et al., 2000; Tkachev & Kolvereid, 1999)
compared to recent research, which usually uses five or more items (Karimi et al., 2013;
Varamaki et al., 2013).
The Model of the Entrepreneurial Event
As mentioned above, the EEM was developed by Shapero and Sokol (1982) as
framework used specifically for determining EI, rather than predict any intention. The theory
of the Entrepreneurial Event assumes that two prerequisites should be met before starting a
new business. Firstly, an individual must perceive the idea of starting a business as credible,

17
that is, he or she finds this idea as both attractive and achievable. Secondly, starting a
business is initiated by some type of displacing event which can take the form of neutral,
negative or positive experiences. Neutral events may take the form of graduating from
university. Negative events may include losing one’s job, or getting a divorce. Whereas,
positive events may include receiving an inheritance or venture capital from a stakeholder
(Krueger et al. 2000; Shapero and Sokol, 1982). The displacement experienced will bring
about a change in behaviour, and if the individual views the idea of starting a business as
credible, he or she will act upon this feeling. This is known as the Entrepreneurial Event,
where perceived feasibility, perceived desirability and propensity to act influence the
intention and in turn the behaviour of an individual to start a business (Shapero & Sokol,
1982).
Shapero (1984) explains that the underlying mechanisms of the EEM are more
complicated than they appear. In particular cases only perceived feasibility and perceived
desirability will be a sufficient indication of EI, whereas other cases may account for variance
explained by all three predictors. Another interesting aspect of this model is the complex
nature of propensity to act. This predictor not only has a direct effect in determining EI, but
also has moderating effects between the other variables within the EEM. Propensity to act
will be discussed in more detail below. Perceived feasibility and perceived desirability are
also shaped by situational variables, social factors, individual characteristics and the cultural
environment (Shapero & Sokol, 1982). Thus the sufficiency of the model will vary according
to the context and environment where it is applied. Each predictor of the model will be
discussed below.

18
Figure 2
The Model of the Entrepreneurial Event
Perceived desirability has been found to play a fundamental role in determining EI.
This perception is usually shaped through the attitudes and beliefs of an individual starting a
business (Krueger, 1993). These attitudes and beliefs can be shaped through various factors,
for example, entrepreneurship education has been found to encourage a favourable attitude
toward starting a business (Gorman, Hanlon & King, 1997). Other research shows that role
models, or successful business people could also increase the attractiveness of
entrepreneurship if these individuals inspire others through knowledge and sharing their
positive experiences (Wilson, Marlino & Kickul, 2004). In cases where individuals have
favourable attitudes toward entrepreneurship and have positive beliefs about
entrepreneurship, they will perceive entrepreneurship as a desired career choice. Higher
levels of perceived desirability are associated with higher level of EI (Shapero & Sokol,
1982).
Perceived feasibility has also been identified as another important determinant of EI.
The key factor that shapes this perception is the evaluation of an individual with regard to
whether they have the skill and capability necessary to start a business (Krueger, 1993;
Shapero & Sokol, 1982). Godsey and Sebora (2010) explain that an individual’s level of
Perceived
Desirability
Perceived
Feasibility
Propensity
to act
Entrepreneurial
Intention

19
perceived feasibility is positively influenced by their entrepreneurial self-efficacy.
Entrepreneurial self-efficacy is defined by an individual’s evaluation of his or her ability, as
well as how to effectively use available resources in order to start a business (Godsey &
Sebora, 2010). The idea of self-efficacy is that individuals usually avoid tasks, or behaviours,
that they perceive to be out of their skill set or capability. However, when this characteristic
is shaped through external factors, it may result in positive outcomes. For example, education
could allow individuals learn the skills required to start a business. When an individual has
knowledge about business operation and understands entrepreneurship, this may increase
entrepreneurial self-efficacy, and in turn, change his or her perceptions. Individuals who
possess the necessary skills often feel that starting a business is a feasible event (Godsey &
Sebora, 2010). Thus individuals who perceive starting a business as feasible are more likely
to demonstrate strong EI.
Propensity to act was actually identified as a key personality characteristic of
entrepreneurs before the perceptions of feasibility and desirability were considered in the
EEM (Shapero, 1975). Shapero (1975) associates this variable to internal locus of control and
has even suggested that using an internal locus of control scale as a proxy in the absence of
appropriate measures. According to Rotter (1966) the internal locus of control refers to the
individual’s perception of his/her ability to influence the events within their lives. Individuals
who have an internal locus of control believe that they dictate their own lives opposed to
individuals you have an external locus of control and attribute events within their lives to
external factors (Begley & Boyd, 1987). The type of control determines whether an
individual has the ability within themselves to execute a plan of action independently (Gurel
et al., 2010). Therefore, an individual who does not have an appropriate level of propensity
to act cannot be an entrepreneur, as he/she will not be able to initiate new venture creation

20
(Shapero, 1982). The conceptualisation of propensity to act has varied to a certain extent
through research, and this has also resulted in measurement errors of the variable.
Propensity to act is also recognised as the most complex predictor within the model.
As mentioned above Shapero and Sokol (1982) argue that propensity to act not only has a
direct effect on EI, but also acts as a moderating variable between the other predictors and EI.
This emphasises the importance of propensity to act within this model. For example if
propensity to act is low, an individual’s attitude toward entrepreneurship may be less
favourable (Krueger, 1993).
Perceived desirability, perceived feasibility and propensity to act have been found to
correlate with one another, and are used collectively in the EEM to predict EI (Krueger,
1993). The predictive validity of the model can be determined by a regression analysis where
all variables are entered. Alternatively, researchers have also used structural equation
modelling to determine whether or not the EEM shows a good fit as a model of EI prediction
(Schlaegel & Koenig, 2013). As outlined by Shapero and Sokol (1982) the results obtained
from the analysis may differ depending on the context and not all variables may have a
significant effect on EI. The fact that not all predictors may be significant does not entail that
the EEM is not a sufficient predictor of EI within the context of that study. Rather, it explains
which predictors are more important in predicting EI within that context.
The Entrepreneurial Event Model as a predictor of Entrepreneurial Intention
Previous studies which have applied the entire EEM, or just one or two of the
antecedents of the EEM, have found these antecedents to be significant predictors of EI. The
following studies have all been conducted in different countries, this suggests that like the
TPB, the EEM can also be applied within different cultural contexts and remain sufficient in
predicting EI. University or higher education students were used as participants and the

21
sample size varied within each study (Byabashaija & Katono, 2011; Frank, Lueger &
Korunka, 2007; Garg, Matshediso & Garg, 2011; Krueger, 1993; Godsey & Sebora, 2010).
The table below contains a summary of the studies and each study will be discussed
thereafter. The popular studies will be discussed firstly, followed by more recent work.
Table 2
Research articles that used the antecedent(s) of the Entrepreneurial Event Model to predict
Entrepreneurial Intention
Author and Year Variables Results
Krueger (1993) Entrepreneurial
Intention
Antecedents of the
EEM
Perceived desirability,
perceived feasibility and
propensity to act were
significant predictors of
entrepreneurial intention.
Byabashija and Katono
(2011) Entrepreneurial
Intention
Perceived
desirability
Perceived feasibility
Perceived self-
efficacy
Perceived desirability and
perceived feasibility were
significant predictors of
entrepreneurial intention.
Ang and Hong (2000) Entrepreneurial
Intention
(conceptualized as
entrepreneurial
spirit)
Risk taking
propensity
Internal locus of
control
Innovativeness
Persistence
Achievement
Orientation
Independence
Love for money
Desire for security
and status
Risk taking propensity,
internal locus of control,
persistence, the love for
money and desire for
security were significant
predictors of entrepreneurial
intention.
Frank, Lueger and Korunka,
(2007) Entrepreneurial
Intention
Internal locus of
Among university students
all personality traits,
education, contextual factors

22
control
Need for
achievement
Risk taking
propensity
Social support
Innovativeness
Education
Role models
and role models were
significant predictors of
entrepreneurial intention.
Krueger, Reilly and Carsrud
(2000) Entrepreneurial
Intention
Antecedents of the
TPB
Antecedents of the
EEM
Attitude toward behaviour,
perceived behavioural
control, perceived
desirability, perceived
feasibility and propensity to
act were significant
predictors of entrepreneurial
intention.
Krueger (1993) conducted a study which aimed to assess the sufficiency of the EEM.
This study used a sample of 126 upper-division business university students. The study tested
all three of the predicting variables of the EEM in a regression analysis. Furthermore, a t-test
was conducted within the sample to measure the differences between students who the
researcher believed to have entrepreneurial intent, and who did not have entrepreneurial
intent. Apart from entrepreneurial intention which was measured by a single item where
participants had the option of choosing ‘yes’ or ‘no’, all other variables were measured on a
7-point Likert scale. The only differences between the measures was the number of items
where perceived desirability was measured with three items, perceived feasibility was
measured with five items and propensity to act was measured with 20 items. The responses of
these scales also differed across items (Krueger, 1993). The results indicated that all
components of the EEM were significantly correlated with one another, and that perceived
desirability, perceived feasibility and propensity to act significantly predicted EI. Moreover,
Krueger (1993) found significant differences in the levels of perceived desirability, perceived

23
feasibility and propensity to act of students who had entrepreneurial intent compared to those
who did not.
Byabashija and Katono (2011) studied the extent of perceived desirability, perceived
feasibility and perceived self-efficacy in predicting EI among 167 college students. These
researchers used an adapted version of Krueger’s (1993) scales where they added items
relating to perceptions of success and opportunities. Their results indicated that both
perceived desirability and perceived feasibility are significant predictors of EI. Furthermore,
perceived feasibility was found to be a stronger predictor of EI than perceived desirability. In
a similar study, Godsey and Sebora (2010) also only considered the effects of perceived
desirability and perceived feasibility on EI. Their study used a sample of students from
schools, and the results indicated that both perceived desirability and perceived feasibility
were significant predictors of EI as well.
Frank et al. (2007) conducted a study that investigated the role of personality traits,
resources and process factors in business start-up intentions, start-up success and business
success. Business start-up intentions can be conceptualised as EI. Among the personality
traits used in the study was internal locus of control. The study used a sample of 875 students
from secondary schools and universities in Australia. Internal locus of control was measured
using a 5-point Likert scale, which taps into internal and social-external control styles.
Findings suggested that internal locus of control was a significant predictor of business start-
up intentions. A similar result was found in a study conducted by Ang and Hong (2000) who
examined whether personality traits were significant predictors of entrepreneurial spirit. Their
sample consisted of 205 undergraduate students from Hong Kong and Singapore. Their
findings revealed internal locus of control as a significant predictor of entrepreneurial spirit
among the students from Singapore.

24
Thus the antecedents of the model of EEM have been found significant predictors of
EI among students. Only Krueger (1993) conducted a study using all three predicting
variables. However, other studies support the notion that these variables can also
independently predict EI among students. In a later study Krueger et al. (2000) again
collectively tested all components of the EEM. This study will be discussed in the next
section. The results from these studies suggest that like the TPB, the EEM can also be
considered a sufficient framework for predicting EI.
Comparing and contrasting the Theory of Planned Behaviour and the Entrepreneurial
Event Model
The TPB and EEM share a two similarities which are, namely, the association
between their predicting variables and how these models control for the effects of extraneous
variables. Researchers have argued that perceived behavioural control and perceived
feasibility are both conceptually associated with perceived self-efficacy. Both perceived
behavioural control and perceived feasibility conceptually measure a similar construct, that is
whether an individual perceives if he or she is capable, and has the necessary skills to start a
business (Krueger, 1993; Krueger et al. 2000; Schlaegel & Koenig, 2013). Attitude towards
behaviour and perceived desirability have also been argued to be associated with each
another. Attitudes towards behaviour usually shape perceived desirability, and the degree in
which an individual finds the idea of starting a business as attractive, may influence his or her
attitude (Krueger et al. 2000). It is for this reason researchers have often mixed the
antecedents of these models, or substituted one predictor for another within the other model.
This depends on the researcher, and how the predictors are conceptualised within their
studies.

25
Many researchers are also sceptical about these models’ sufficiency in predicting EI
due to the role of control variables. However, Ajzen (2005) claims that the TPB takes
external factors into account, such as demographics, contextual factors and personality traits
or attributes. These control variables influence the antecedents of behavioural intention
instead of being directly the latter. Therefore, these variables should not be included within
the regression analysis, but rather independently have their relationship tested with the
antecedents (Ajzen, 2005). Similarly, Shapero and Sokol (1982) argue that external variables
are also taken into account by the EEM. The predicting variables are shaped by these external
variables, and thus it is not required to include additional variables within the model analysis
and testing. Yang (2013) demonstrated that this claim is supported when his research found a
significant relationship between the antecedents and demographics such as past
entrepreneurial work experience. Other researchers argue that the components of these
models may not be the sole predictors of EI, and when additional variables are added to the
model, more variance can be explained in EI (Luthje & Frank, 2003; Schlaegel & Koenig,
2013; Turker & Selcuk, 2009). This is still open to further enquiry.
Literature on comparing the Theory of Planned Behaviour and the Entrepreneurial
Event Model
The most popular research which is referred to when comparing these models has
been conducted by Krueger et al. (2000). These researchers compared the TPB and EEM to
evaluate which model is a more sufficient predictor of EI. Both models were applied to a
sample of 97 senior university business students (Krueger et al. 2000). The study made use of
various scales which either had just one item or only a few. The response categories were
either a 7-point Likert scale, or ranged from 0-100. Krueger et al. (2000) concluded that the
EEM was a more sufficient predictor of EI than the TPB. However, it should be noted that
one antecedent of the TPB was found not to be a significant predictor within this sample,

26
whereas all components of the EEM were found to be significant predictors, and thus this
model tended to explain more of the variance in EI.
Schlaegel and Koenig (2013) conducted a meta-analysis which had the aim of
comparing the results of 98 studies. The studies included in the analysis either applied
variables from the TPB and EEM, the entire model of the TPB or EEM, or compared the
models. Schlaegel and Koenig (2013) used statistical meta-analysis correlation and model
structuring to determine which model was a more sufficient predictor of EI. Their results
indicate that when including all the predicting variables into one model, attitude towards
behaviour, subjective norms and perceived behavioural control revealed higher correlation
coefficients with EI. However, perceived desirability, perceived feasibility and propensity to
act showed significantly larger effect sizes.
This study intends to contribute to this area of research by investigating which model
is a more sufficient predictor of EI within a South African context. The study will thus test
the following hypotheses:
The Theory of Planned Behaviour:
H1a: There is a positive relationship between the attitude toward behaviour, subjective norms,
perceived behavioural control and entrepreneurial intention.
H1b: Attitude toward behaviour predicts entrepreneurial intention.
H1c: Subjective norms predicts entrepreneurial intention.
H1d: Perceived behavioural control predicts entrepreneurial intention.
The Entrepreneurial Event Model:
H2a: There is a positive relationship between perceived desirability, perceived feasibility,
propensity to act and entrepreneurial intention.

27
H2b: Perceived desirability predicts entrepreneurial intention.
H2c: Perceived feasibility predicts entrepreneurial intention.
H2d: Propensity to act predicts entrepreneurial intention.

28
Methods
This chapter describes the research design, participants, sampling technique and data
collection procedure used in the study. Furthermore, each instrument that was used to
measure the constructs of this study will be discussed.
Research Design
A descriptive cross-sectional design was used for this study. The data collected is
quantitative in nature, and was collected by the use of a self-report questionnaire. This
questionnaire was administered to students at the University of Cape Town as a hard copy, as
well as electronically, via an online platform.
Participants and Sampling
The South African government has identified that the country’s socioeconomic issues,
such as unemployment, can be overcome by encouraging the youth of the country to become
entrepreneurs. This is particularly important for those young South Africans who attend
universities or other tertiary education institutions. As mentioned above, these individuals are
in an environment where they can be more easily taught and guided in relation to starting and
operating their own businesses (Mmesi, 2015). The use of final year students as participants
has also been extensively applied within EI research. Researchers argue that these are the
individuals which are at the point of making decisions regarding entering the work place
or/and starting a business in the near future (Autio, Keeley, Klofsten, Parker & Hay, 2001;
Krueger, Reilly & Carsrud, 2000; Varamaki, Joensuu, Tornikoski, & Viljammaa, 2013).
Furthermore, researchers have narrowed the faculty type of these students down to commerce
and engineering students. The justification behind this choice is due to the nature of
commerce and engineering programmes, which usually consist of various business-related
courses (Luthje, C., & Franke, N, 2003). In addition to these students, data will also be

29
collected from the students enrolled in the University of Cape Town’s post graduate
entrepreneurship programme. The entrepreneurship programme is categorised as a commerce
programme, so these students are still recognised as commerce students. In conclusion, only
final year commerce and engineering students at the University of Cape Town were asked to
participate in this study. These students were not selected randomly, and instead, were
approached and asked to voluntarily participate in the study. Therefore, this study
implemented purposive sampling for the following reasons; firstly, randomly selecting
students could not be accomplished in the given time for data collection. Secondly, this study
required specific students (commerce and engineering) to participate in the research.
This study’s sample (n = 192) consisted of 80 engineering and 104 commerce
students. Among the 104 commerce students, 33 were enrolled in the post graduate
entrepreneurship programme. The sample predominantly comprised of South African
students (82%) and the rest were international students studying at the University of Cape
Town (18%). One interesting statistic was obtained from the question “what is your plan for
next year?” in the demographic section. This was a forced choice question where students
could choose more than one of the four options which were namely; further your education,
look for a job, start your own business or other (and asked to specify their plan). Missing data
for this question accumulated to 23%. However, only 6% of students chose the option of
starting their own businesses compared to 25% of students who wanted to further their
education, and 30% who were planning on looking for a job. Students who chose other
options (16%) were planning on travelling, or taking time off before making a decision. Other
demographic descriptive statistics including current business ownership is listed in Table 3.

30
Table 3
Demographic Characteristics of sample (n = 192)
Demographic Characteristics Number of Students % of Students
Gender Male 125 65.1
Female 65 33.9
Race Black 53 27.6
Chinese 1 .5
Coloured 17 8.9
Indian 24 12.5
White 88 45.8
Prefer not to
answer
7 3.6
Age 20 - 22 125 65.3
23 - 24 51 27
25+ 13 6.8
Currently own a business Yes 38 20.1
No 151 79.9
Procedure
The research was firstly proposed to the Faculty of Commerce Research Ethics
Committee whereby the committee granted approval. Additionally, the research was also sent
for approval to the Research Committee of the University of Cape Town. Once again, the
research was approved, and therefore, the university’s students could be used as the sample.
Thereafter, the respective lecturers - or course conveners of final year commerce and
engineering courses - were approached. These individuals were asked permission if the
researcher could administer the questionnaire within their classes. This had to be completed
within a 15 minute window. During these 15 minutes, the researcher informed the students
about the study, and encouraged them to voluntarily participate in the research. Those
students who were willing to participate were then handed the questionnaire, and were
instructed how the questionnaire was to be completed. However, because only three lecturers
allowing access to their students during their teaching time, a total of 126 students were
sampled. Many lecturers and course conveners could not lend their teaching time due to the
amount of course material which was still required to be covered.

31
A decision was then made to use an additional sampling method with the aim of
increasing the sample size. Qualtrics, an online survey platform which provides survey
creation, distribution and data analysis was used. The questionnaire was then uploaded to
Qualtrics and could be distributed as a web link. Those same lecturers and course conveners
were approached again and asked to upload the web link on the online student support
platform, or send the web link as an email to their students. An agreement was reached with
the lecturers and course conveners, and the questionnaire was distributed electronically. The
lecturers encouraged students to then complete the questionnaire within their free time. The
addition of this sampling method increased the sample size to 192 students.
Measures
Participating students were required to choose an answer for each statement, then
complete a demographic section at the end of the questionnaire. The response format differed
across the scales and ranged from a 3-point to 7-point Likert scale. For example; students
would have to select not “likely at all” (1) to “very likely” (5) when evaluating their attitude
towards behaviour. Whereas, when answering statements regarding their subjective norm,
each student would choose between “not desirable” (1) to “desirable” (3). Each scale as well
as the demographic section will be discussed below (See Appendix 1 for summary of scales
and Appendix 2 for the Questionnaire used).
Entrepreneurial Intention. Autio, Keeley, Klosten, Parker and Hay’s (2001) 5-point
Likert scale, which consists of four items, was used to measure the EI among the students.
Responses ranges from “not likely at all” (1) to “already started a business” (5). These items
aim to measure the likelihood of an individual starting a firm within one or five years, as well
as on a part time or full time basis. Each item is answered in correspondence with the
following statement “how likely is it that you will start a new firm of your own or with

32
friends?”. An example item is “start a business on a full time basis within one year from
now”. The EI of an individual is then measured by calculating the mean of these four items.
Autio et al. (2001) reported a Cronbach’s α of .82 for this measure when used to measure the
EI among students from Finland, USA, UK and Sweden. Furthermore, Gird and Bagraim
(2005) observed a Cronbach’s α of .71 in their study which measured the EI among students
from South African universities.
The antecedents of the TPB was measured with Autio et al. (2001) scales. All items
for the subjective norm and perceived behavioural control scales were used while only one
item for attitude toward behaviour was used.
Attitude toward behaviour. This variable was measured with one item, which aimed
to measure the individual’s attitude towards starting his own business. This item is measured
on a 5-point Likert scale with responses ranging from “not likely at all” (1) to “very likely”
(5). The item states, “How likely is it that you will move into an entrepreneurial career?”
Originally, this scale consisted of four items where participants were asked the likelihood of
when they moved into various careers, would it include an entrepreneurial one. However,
Autio et al. (2001) as well as Gird and Bagraim (2005) observed poor factorial validity when
using all these items within their study. Attitude towards behaviour was then measured using
the one item mentioned above. Sackett and Larson (1990) argue that using a single item
measure is acceptable when the construct being measured is one-dimensional, and appears
unambiguous to the respondent. Furthermore, it was also argued that using a single item does
not undermine the analysis if evidence of reliability and validity can be provided (Autio et al.,
2001). All four items were still included in the questionnaire, despite only using the one item
to measure this construct.

33
Subjective Norm. Across the scales used within Autio et al. (2001) research, this was
the only one that was measured on a 3-point Likert scale. The subjective norm scale consisted
of three statements, which measured an individual’s perception of how their family and
friends felt about him/her starting their own business. Autio et al. (2001) as well as Gird and
Bagraim (2005) reported high Cronbach’s α’s of .70 and .88 respectively.
Perceived behavioural Control. This construct was measured using four items on a
5-point Likert scale with responses ranging from “strongly disagree” (1) to “strongly agree”
(5). According to Autio et al. (2001) this scale measures an individual’s confidence in
performing a specific behaviour. In this case, it refers to whether an individual is confident in
starting a business. An example item is “I am confident that I would succeed if I started my
own business”. A Cronbach’s α of .75 was observed for this scale (Autio et al., 2001).
Gird and Bagraim (2005) conducted a factor analysis for the EI, attitude towards
behaviour, subjective norm and perceived behavioural control measures. All constructs
significantly loaded on one factor with the exception of perceived behavioural control.
However, Varamaki, Joensuu, Tornikoski and Viljamaa (2014) report evidence of factorial
validity for Autio et al’s. (2001) perceived behavioural control measure in a study conducted
on university students in Finland. These evidences of validity support the use of Autio et al.
(2001) scales within the context of this study.
Perceived Desirability. Krueger’s (1993) 7-point Likert scale was used to measure
the degree of desirability, and an individual’s experiences in relation to starting his or her
own business. This scale was adapted so that items specifically relate to the idea of starting a
business. The scale consists of three items and the responses differ for each item. For
example, item one states “I would love starting my own business”, responses range from “I
would hate doing it” (1) to “I would love doing it” (7). Whereas item two “how tense would

34
you be starting your own business” responses rather ranged from “very tense” (1) to “not
tense at all” (7). Krueger (1993) used this scale in a study conducted on university business
students and observed a Cronbach’s α of .77. Furthermore, a factor analysis revealed that all
items significantly loaded onto one factor, which was assumed to be perceived desirability.
Perceived Feasibility. This was measured using another one of Krueger’s (1993) 7-
point Likert scales. This scale consisted of five items, which collectively measured the degree
to which an individual believes he can start his own business. Similarly, to the perceived
desirability scale, responses for this scale also differed from item to item (See Appendix 1).
Krueger’s (1993) study also reported a Cronbach’s α of .52 for this measure and a factor
analysis revealed that all items significantly loaded onto one factor which was assumed to be
perceived feasibility.
Propensity to act. Lee and Tsang’s (2001) 5-point Likert scale, which measures the
internal locus of control was used. As mentioned above, Shapero (1975) stated that an
individuals’ propensity to act can be conceptualised as one’s internal locus of control, thus it
was considered acceptable to use this measure. The scale consists of three items, which
measure the perceived ability of individuals’ to control events within their lives. Responses
range from “disagree” (1) to “agree” (5) for this measure. Lee and Tsang (2001) observed a
Cronbach’s α of .85 in a study conducted on Chinese entrepreneurs. A factor analysis
conducted by Gird and Bagraim (2005) revealed that all items of this scale significantly
loaded onto one factor. Thus it is concluded that the reliability and factorial structure of the
scale is acceptable.

35
Demographic characteristics
Participating students were asked questions regarding gender, age, race, home
language, faculty, current degree registration, their plan for the future, and whether or not
they currently owned a business.
Statistical Analyses
The statistical analyses were performed using IBM SPSS Statistics 22. The factorial
validity for each scale was assessed using principal axis factoring. Thereafter, the Cronbach’s
α was used to measure the internal consistency for each scale, and in turn evaluate the
reliability of the scale. Once the validity and reliability were determined for each scale,
descriptive statistics were then reported before the hypotheses were tested. Hypotheses
testing used two correlation and multiple regression analyses, one for each model being
tested.

36
Results
The aim of this research was to determine the sufficiency of two models which predict
EI. These models will be tested once the structure and internal consistency of the scales are
evaluated. Therefore, this chapter firstly provides a description of the structure analysis and
reliability analysis for each scale. Thereafter, statistical testing will be conducted.
There is one important point of interest that must be mentioned before proceeding
with this section. The data for the Entrepreneurial Event Model was only collected using the
first sampling method, thus only 126 (sub-set of the sample) of the 192 students will be
analysed when considering the Entrepreneurial Event Model. Whereas, the analyses for the
TPB model will include the entire sample of 192 students. This was a result of technical
problems encountered when uploading the questionnaire onto Qualtrics.
Structure and Reliability of Measurement Scales
Explanatory factor analysis (EFA) were conducted for this study as this type of
multivariate analysis explores the underlying dimensions of both measured and latent
variables (Norris & Lecavalier, 2010). The exploration of data is advantageous for two
reasons; it may lead to the refinement of theories and/or it may result in the development of
new theories. These ideas are usually achieved by observing the unexpected correlations
within each variable’s measurement model, or between the variables themselves (Williams,
Onsman & Brown, 2010). When using EFA, decisions concerning extraction and rotation
method must also be considered. Moreover, before conducting the analyses, three
assumptions should be met regarding scale type and the existence of outliers within the data
set and sample size.
Various methods of extraction exist nevertheless, and Principal Axis Factoring (PAF)
was considered the most suitable method of analysis for this study. PAF is an extraction

37
method that aims to extract the least amount of factors by comparing squared multiple
correlations between all items included in the analysis. This method is among the more
commonly used methods of extraction, and is considered the best method of extraction for
determining the underlying factors related to a set of items (Burton & Mazerolle, 2011). Once
the method of extraction was determined, which rotation method to employ was then
considered. This study used Varimax rotation, as it would assume that the factors were
uncorrelated (Williams, Onsman and Brown, 2010). Rotation can only used if the factor
analysis extracts more than one factor. By using rotation, the axes would shift, whereby the
factor loadings for each item would change. The new set of factor loadings made it easier to
determine which items were more offensive, and thus could be removed (Williams, Onsman
and Brown, 2010). Factor loadings were interpreted according to Merenda (1997) who
suggested that factor loadings >.30 can be considered as acceptable for social science
research. If one factor could not be extracted from any one of these scales, even after
iterations, the scales factorial structure would be considered questionable, and the measured
variable would not be used in statistical analyses.
Three assumptions were checked before conducting the EFA. Firstly, it was
established that all scales used to measure the dependent and independent variables were
interval scales. Secondly, outliers were identified using box plots whereby a total of nine
outliers were found. Six were deleted from the data set (n = 186) (See Appendix 3, Figure 3.1
– 3.4). It was decided not to remove cases 2, 55 and 72. When these participant’s responses
were screened, it appeared that they only scored low on perceived desirability, responding
normally across other scales. All this meant was that these participants had little or no desire
to start their own business. This was further supported as these participants tended to also
score low on the attitude toward behaviour measure.

38
Lastly, the assumption of having an adequate sample for factor analysis will be
discussed. Sample size is recognised as an important requirement for factor analysis. In spite
of this, it remains a topic many researchers tend to disagree upon. Earlier in the 19th century
researchers would use a rule of thumb to determine the adequacy of sample size; 100
participants was considered poor, 200 participants was considered fair, 300 participants was
considered good, 500 participants was considered very good, and 1,000 or more participants
was considered as excellent (Comrey, 1973). MacCallum, Widaman, Zhang, and Hong
(1999) argue that these rules can be misleading. Determining the appropriate sample size is
more complicated than following such rules, thus other methods were implemented for this
study. Two commonly used and accepted methods which take these complexities into
account are the sample to variable ratio method or the Kaiser-Meyer-Olkin (KMO) Measure
of Sampling Adequacy/Bartlett's Test of Sphericity. For this study, the KMO Measure of
Sampling Adequacy/Bartlett's Test of Sphericity will be used to test if the sample size is
suitable for factor analysis. If the KMO index is more than .05 and Bartlett's Test of
Sphericity is significant (p < .05) then the sample size is suitable for factor analysis
(Williams, Onsman & Brown).
Once the structure of each scale was established, a reliability analysis was then run on
each scale. Reliability was determined by using the Cronbach’s α which is a measure of
internal consistency. Thus it measures how well items of a scale group together, or are
correlated with each other (Field, 2009). This study will interpret the Cronbach’s α according
to Nunnally (1978), who argued when the α is below .50 the is scale considered unreliable,
when the α is greater than .50, but less than .60, the reliability is questionable - and if the α
greater than .60, the scale can be considered as reliable. Therefore, in the case where the α for
a scale is below .50, the variable measured by that scale will not be used in hypothesis
testing.

39
Entrepreneurial Intention. PAFs were firstly conducted on the Entrepreneurial
Intention scale. The analysis revealed sufficient KMO indexes of .57. Bartlett’s test of
sphericity results were regarded as acceptable as well (F6 = 276.90; p < .001), thus indicating
that it was appropriate to conduct a factor analysis. The four items also loaded onto one
factor. The factor accounted for 60.53% of the explained variance and had an eigenvalue of
2.42 (see Table 4 for factor loadings). This factors was assumed to be EI. The reliability
analysis revealed a sufficient Cronbach’s α of .78, and according to Nunnally (1978) this
implies the scale has good reliability. The mean of the four items could thus be calculated.
Table 4
Factor loadings for the Entrepreneurial Intention Scale Items
Note: Factors were extracted using Principal Axis Factoring. n = 186
Attitude toward Behaviour. No validity, or reliability analyses, were performed on
attitude toward behaviour as this variable was measured using a single item. However,
evidence should still be provided to support the use of a single item measure. Autio et al.
(2001) argue that reliability is a prerequisite for validity, therefore, if validity can be
demonstrated, the item can be considered reliable. Validity was demonstrated when Autio et
al. (2001) observed a significant relationship between attitude toward behaviour and
perceived behavioural control in their study. This suggested evidence of criterion and
construct validity. Furthermore, no correlation was observed between Attitude toward
Items Factor Loadings
1. Start a business on a full-time basis within one
year from now.
.53
2. Start a business on a full-time basis within five
years.
.77
3. Start a business on a part-time basis within one
year from now.
.80
4. Start a business on a part-time basis within five
years.
.66

40
Behaviour and age. Whereas on the other hand, a significant correlation between Perceived
Behavioural Control and age was observed, thus suggesting evidence of discriminant validity.
According to Autio et al. (2001) these findings suggest that the reliability should then also be
sufficient for this single item measure.
Subjective Norms. A PAF was conducted on the Subjective Norms scale. The factor
analysis was considered appropriate as a KMO index of .63 was observed, and Bartlett’s test
of sphericity revealed acceptable results (F6 = 73.63; p < .001). PAF extracted one factor that
accounted for 39.40% of the explained variance and had an eigenvalue of 1.18 (see Table 5
for factor loadings). All three items loaded onto the one factor which was assumed to be
subjective norms. The reliability analysis revealed a Cronbach’s α = .64 which is regarded as
acceptable reliability (Nunnally, 1978). The mean of the four items could thus be calculated.
Table 5
Factor loadings for the Subjective Norms Scale Items
Note: Factors were extracted using Principal Axis Factoring. n = 186
Perceived Behavioural Control. The next PAF was conducted on the Perceived
Behavioural Control scale. A KMO index of .71 along with Bartlett’s test of sphericity results
(F6 = 139.20; p < .001) indicate that it is appropriate to conduct a factor analysis. The
analysis revealed one factor which all four items loaded onto (see Table 6 for factor
loadings). The factor accounted for 39.33% of the explained variance, and had an eigenvalue
Items Factor
Loadings
1. If I became an entrepreneur my family would
consider it to be…
.52
2. If I became an entrepreneur my friends would
consider it to be…
.54
3. If I became an entrepreneur other people close to
me would consider it to be…
.78

41
of 1.57. It was assumed this factor was Perceived Behavioural Control. The reliability
analysis revealed a Cronbach’s 𝛼 = .70, which is considered to be good reliability (Nunnally,
1978). A mean was then calculated per student which represented their overall score for this
variable.
Table 6
Factor loadings for the Perceived Behavioural Control Items
Note: Factors were extracted using Principal Axis Factoring. n = 186
Perceived Desirability. Using a PAF, factorial validity was established for the
Perceived Desirability scale. An acceptable KMO index (.56), as well as significant results
for Bartlett’s test of sphericity (F3 = 73.93; p < .001) meant conducting a factor analysis was
considered appropriate. The analysis revealed one factor which accounted for 60.33% of the
explained variance, and had an eigenvalue of 1.81. All three items loaded onto this factor,
which was assumed to be Perceived Desirability (see Table 7 for factor loadings). Thereafter,
a reliability analysis found a Cronbach’s α = .66 and the scale was then considered to be
reliable (Nunnally, 1978). A mean for each student was then calculated in order to represent
their Perceived Desirability.
Items Factor Loadings
1. I am confident that I would succeed if I started my
own business.
.78
2. It would be easy for me to start my own business. .57
3. To start my own business would probably be the
best way for me to take advantage of my
education.
.50
4. I have the skills and capabilities required to
succeed as an entrepreneur.
.62

42
Table 7
Factor loadings for the Perceived Desirability Items
Note: Factors were extracted using Principal Axis Factoring. n = 123
Perceived Feasibility. A PAF was conducted on the Perceived Feasibility scale. A
KMO index of .71 and Bartlett’s test of sphericity results (F10 = 127.39; p < .001) indicate
that it is appropriate to conduct a factor analysis. The factor analysis only revealed one factor.
This factor accounted for 48.11% of the explained variance and had an eigenvalue of 2.41.
All four of the remaining items loaded onto the factor, which was assumed to be Perceived
Feasibility (see Table 8 for factor loadings). The reliability analysis was then conducted and
it found a Cronbach’s α = .72, which was considered acceptable (Nunnally, 1978).
Table 8
Factor loadings for the Perceived Feasibility Items
Note: Factors were extracted using Principal Axis Factoring. n = 123
Items Factor
Loadings
1. I would love doing starting my own business .90
2. How tense would you be starting your own
business
.33
3. How enthusiastic would you be starting your
own business
.71
Items Factor
Loadings
1. How hard do you think it would be starting your
own business?
.48
2. How certain of success are you? .80
4. How overworked would you be if you started
your own business?
.46
5. Do you know enough to start your own business .60
6. How sure are you of yourself? .61

43
Propensity to Act. A PAF was conducted on the Propensity to Act scale. The
analysis revealed that both the KMO index (.54) and the results from Bartlett’s test of
sphericity (F3 = 19.57; p < .001) was considered appropriate for a factor analysis to be
conducted. One factor was found which accounted for 48.16% of the explained variance, and
had an eigenvalue of 1.44. This factor was assumed to be Propensity to Act. However, item
one and three showed weak factor loadings (see Appendix 4, Table 4.1). When a reliability
analysis was conducted, the scale revealed a Cronbach’s α = .44. This implies that the scale
demonstrates poor reliability and the variable measured should not be used in hypothesis
testing (Field, 2009; Nunnally, 1978). Moreover, the scales inter-item correlations were
below .30 which serves as further evidence that the scale should be considered as unreliable
(see Appendix 4, Table 4.2 for inter-item correlations) (Pallant, 2004). Therefore, Propensity
to Act was not used in any further analyses.

44
Descriptive Statistics
The following section contains descriptive statistics for each scale that will be used
for hypothesis testing. Using SPSS, the minimum (Min), maximum (Max), mean and
standard deviation (SD) was calculated for each variable (see Table 9).
Table 9
Descriptive Statistics (Variables of the TPB and EEM)
n Min Max Mean SD
Entrepreneurial
Intention
186 1.00 4.50 2.43 .81
Subjective
Norm
186 1.67 3.00 2.65 .40
Attitude
toward
behaviour
186 1.00 5.00 3.32 1.20
Perceived
behavioural
control
186 1.50 5.00 3.30 .73
Perceived
Desirability
123 1.00 7.00 4.66 1.34
Perceived
Feasibility
123 2.00 6.40 3.92 1.01
Note: Subjective Norm measured on 3-point Likert scale. Attitude toward behaviour, perceived behaviour
control measured on 5-point Likert scale. Perfeceived desirability and feasilbility measured on 7-point Likert
scale.
The means for each scale tends to be above the midpoint on each scale, this indicates
that students tended to score quite highly on each scale. Table 9 shows that the
entrepreneurial intention scale was the only measure where students tended to score below
the scales midpoint. This statistic is aligned with the demographic characteristic where only
6% of students indicated they were planning on starting their own business the following
year. However, when the students were categorised according to their faculty affiliation, a

45
difference between means appeared. Students who were enrolled in the entrepreneurship
programme had a mean score of 3.13, whereas commerce and engineering students had mean
scores of 2.34. This indicates that students who are enrolled in the entrepreneurship
programme may be inclined toward starting their own business.
Correlation Analysis
A Pearson correlation was used to analyse the association between the variables. Two
sets of correlation analyses were conducted, one for each model. The only variable that was
not included in the analysis was propensity to act due to the scale demonstrating poor
reliability. The analyses tested the following hypotheses:
H1a: There is a positive relationship between the attitude toward behaviour, subjective norms,
perceived behavioural control and entrepreneurial intention.
H2a: There is a positive relationship between perceived desirability, perceived feasibility and
entrepreneurial intention.
As seen in Table 10 the Pearson correlation analysis revealed positive significant
relationships between attitude toward behaviour, subjective norms, perceived behavioural
control and EI. All relationships had a p < .001 other than the relationship between EI and
subjective norms which had a p < .05. The relationship between EI and subjective norms also
had the weakest correlation (r = .17) among this set of variables. Nonetheless, H1a is
supported.

46
Table 10
Correlation Matrix for the components of the Theory of Planned Behaviour
1 2 3 4
Entrepreneurial
Intention (1)
.78
Attitude
toward
Behaviour (2)
.73***
Subjective
Norms (3)
.17* 28*** .64
Perceived
Behaviorual
Control (4)
.65*** .65*** .31*** .70
Note: Scale interval consistencies (Cronbachs Alpha) on the diagonal. The internal consistency for Attitude
for behaviour has not been provided as a single item was used to measure this variable.
*** represent a correlation that has significance level of p < .001.
** represent a correlation that has significance level of p < .01.
* represent a correlation that has significance level of p < .05.
Table 11 shows the Pearson correlation analysis, which was conducted on perceived
desirability, perceived feasibility and EI. The Pearson correlation analysis revealed
significant positive relationships between each of these variables. Similar to the relationships
between the variables in the TPB, all relationships between the variables of the EEM had
significance levels of p < .001. Thus H2a is also supported.

47
Table 11
Correlation Matrix for the components of the Entrepreneurial Event Model
1 2 3
Entrepreneurial
Intention (1)
.78
Perceived
Desirability (2)
.51*** .66
Perceived
Feasibility (3)
.55*** .65*** .72
Note: Scale interval consistencies (Cronbachs Alpha) on the diagonal.
*** represent a correlation that has significance level of p < .001.
** represent a correlation that has significance level of p < .01.
* represent a correlation that has significance level of p < .05.
These relationships provide evidence that multicollinearity exists between the
antecedents of each model. Multicollinearity refers to the correlation between predicting
variables, and where they are able to linearly predict a dependent variable with more
accuracy (George & Mallery, 2010). The existence of low to moderate multicollinearity is a
criterion which defines a successful regression model. However, when predicting variables
are highly correlated with each other, it tends to increase the variance of the coefficient
estimates. This may violate the structure of a multiple regression model (Field, 2009).
Regression Analysis
This section will discuss the two linear multiple regression analyses that were
conducted. The first analysis addresses H1b, H1c and H1d, which includes attitude toward
behaviour, subjective norms and perceived behavioural control as the predictors of EI. This
will test the sufficiency of the TPB as a model for EI prediction. The second analysis will test
H2b and H2c, which includes perceived desirability and perceived feasibility as predictors of

48
EI. These two predictors will test the sufficiency of the EEM as a model for predicting EI.
H2d was the only hypothesis not tested. Both regression analyses will use EI as the dependent
variable.
Once the regression analyses were run, the data was screened for outliers, and to
determine whether assumptions were met. According to Field (2009) five assumptions should
be met for each regression model. If these assumptions are not met, they may violate the
parameters of the regression model. These assumptions include; no or low multicollinearity,
independent errors, sample size, normality, homoscedasticity and linearity. Firstly, the results
will be interpreted and discussed. Thereafter, outliers and assumptions will be discussed. The
analyses will test the following hypotheses:
H1b: Attitude toward behaviour predicts entrepreneurial intention.
H1c: Subjective norms predicts entrepreneurial intention.
H1d: Perceived behavioural control predicts entrepreneurial intention.
H2b: Perceived desirability predicts entrepreneurial intention.
H2c: Perceived feasibility predicts entrepreneurial intention.
The Theory of Planned Behaviour (n = 186)
Significant results (F185 = 86.49, p < .001) was found by the multiple regression
analysis where R2 = .59 and the adjusted R2 = .58 (see Table 12). However, only attitude
toward behaviour (M = 3.32, SD = 1.19, n = 186) and perceived behavioural control (M =
3.30, SD = .73, n = 186) were the revealed to be significant predictors of EI (M = 2.43, SD =
.81, n = 186) in this model. The analysis also indicated that attitude toward behaviour (β =
.55) was a stronger predictor than perceived behavioural control (β = .31). Subjective norms
(M = 2.65, SD = .40, n = 186) did not significantly predict EI. As mentioned above the

49
correlation between subjective norms and EI (r = .17) was also the weakest compared to the
other relationships within the TPB model. The correlation statistic offered a certain degree of
reason as to why subjective norms were not found to be a significant predictor of EI. Thus
final year UCT commerce and engineering students’ EI is significantly predicted only by
attitude toward behaviour and perceived behavioural control. The model of the TPB only
achieves certain degree of sufficiency in predicting EI and therefore, only H1b and H1d is
supported.
Table 12
Regression Model Summary for the Theory of Planned Behaviour Model
Variable β SE t(182) p
Attitude toward behaviour .55 .04 8.62 .000
Subjective Norm -.08 .10 -1.68 .094
Perceived Behavioural Control .31 .07 4.92 .000 Note: n = 186, R = .76, R2 = .58, F (3,182) = 86.48. Post hoc power analysis revealed a power of 1 and effect
size (f2) of 1.38 at a significance level of.05
The Entrepreneurial Event Model (n = 123)
Significant results (F122 = 37.96, p < .001) were found for this multiple regression as
well, where R2 = .39 and the adjusted R2 = .38 (see Table 13). Perceived desirability (M =
4.66, SD = 1.34, n = 123) and perceived feasibility (M = 3.92, SD = 1.01, n = 123) both
significantly predicted EI (M = 2.46, SD = .81, n = 123). Moreover, perceived desirability (β
= .36) was found to be stronger predictor of EI than perceived feasibility (β = .32). These
results suggest that the EI of final year UCT commerce and engineering students can be
significantly predicted by perceived desirability and perceived feasibility. Therefore both H2b
and H2c are supported.

50
Table 13
Regression Model Summary for the Entrepreneurial Event Model
Variable β SE t(121) p
Perceived Desirability .36 .06 3.85 .001
Perceived Feasibility .32 .07 3.43 .000 Note: n = 124, R = .67, R2 = .45, F (2,121) = 49.77. Post hoc power analysis revealed a power of 1 and effect
size (f2) of 0.81 at a significance level of.05
Outliers and influential cases
Standardized residuals and Cook’s distance were the statistics used to screen for
outliers and influential cases. Outliers and influential cases usually have extreme scores,
which tend to lead to bias estimates within a regression model. It is important that these cases
are removed before conducting the analysis. Standardized residuals refer to when residuals
are converted to standard deviation units (Field, 2009). By using standardized residuals, any
score can be converted into a value that can be compared to universal guidelines. These
guidelines are used as a framework, which indicates what is considered an acceptable value,
and thus not categorised as an outlier. Normally distributed samples should have 95% of the
scores fall between -1.96 and +1.96, 99% of scores fall between -2.58 and +2.58, and 99.90%
of scores fall between -3.29 and +3.29. Cases where the standardized residual is greater than
3, may be of concern and this case should be removed from the data set (Field, 2009). The
standardised residuals of the dataset all fell in the range of -2.58 and +2.58. Therefore, no
outliers were identified. Cook’s distance added further supporting evidence that no outliers
and influential cases existed within the data sets. According to Cook and Weisberg (1982),
Cook’s distance statistic is used to identify outliers and influential cases by measuring each
observations effect on linearity and residual values. A Cook’s distance statistic greater than 1
is an indication that a case has a substantial influence on the parameters of a regression

51
model. This study had no Cook’s distance values greater than 1, therefore concluding that no
outliers or influential cases existed within the data sets.
Multiple Regression Analysis Assumptions
The data from variables included in the regression analyses was firstly screened in
order to test the assumptions mentioned above. Multicollinearity was tested according to
Field (2009) who suggested using the Variance Inflation Factor (VIF) and Tolerance Values
(TV). A VIF greater than 10 and a TV below .1 indicates that this assumption is not met
(Field, 2009). The variables of Group 1, attitude toward behaviour (VIF = 1.77, TV = .56),
subjective norms (VIF = 1.12, TV = .89) and perceived behavioural control (VIF = 1.80, TV
= .55) all had revealed acceptable results for the testing of this assumption. The variables of
Group 2, perceived desirability (VIF = 1.73, TV = .58) and perceived feasibility (VIF = 1.73,
TV = .58) also met met Field’s (2009) criteria. Therefore, the assumption of no
multicollinearity was met for both groups.
Independent errors were evaluated using the Durbin-Watson statistic. Field (2009)
recommended using the Durbin-Watson statistic as an indicator for independent errors. If the
Durbin-Watson statistic is between the values of 1 and 3 then the assumption of independent
errors is met (Durbin & Watson, 1951). EI revealed a Durbin-Watson statistic of 1.96 for the
regression model of the TPB and 1.73 for the regression model of the EEM. Thus supporting
that the assumption of independent errors for both groups is met. The assumption of
calculating an appropriate sample size will be estimated using Tabachnick and Fidell (2001)
formula. According to Tabachnick and Fidell (2001) the assumption of sample size can be
met if the sample is greater than 8 multiplied by the number of independent variables (n >
8m). The analysis for the TPB used three independent variables, therefore 186 > 74. The

52
analysis for EEM used two independent variables where 123 > 66. This indicates that the
sample size is greater and that this assumption is also met for both groups.
Normality was tested using histograms and P-P plots. Field (2009) suggests that the
assumption of normality is met when a histogram forms a bell curve, and when data points
form a linear pattern on a P-P plot. This assumption was met for both regression models as
the graphs adhered to this criteria (see Appendix 5, Figure 5.1 and 5.2 and Appendix 6,
Figure 6.1 and 6.2). Lastly, homoscedasticity and linearity was tested using a scatterplot
which displayed the points of standardised predicted values against standardised residuals.
When the points on this scatterplot are randomly dispersed and do not form any sort of
pattern then this assumption is met (Field, 2009). Appendix 5, Figure 5.3 displays the
scatterplot for the regression model of the TPB and Appendix 6, Figure 6.3 displays the
scatterplot for the regression model of the EEM. The scores are randomly dispersed on both
scatterplots, thus supporting that this assumption is met for both regression models.
Power Analysis
A post hoc power analysis was conducted using G*Power for each regression
analysis. The statistical power refers to the probability that the null hypothesis will be
rejected when it is false (Faul, Erdfelder, Lang & Buchner, 2007). Cohen (1965)
recommended that a power statistic greater than .80 at a significance level of .05 can be
considered as an acceptable probability for correctly rejecting the null hypothesis. According
to Cohen (1988) when analysing the findings of a regression analysis (R2), effect sizes (f2) of
.02, .15 and .35 can be recognised as small, medium and large respectively. The findings of
the power analysis conducted in this study is described below where a significance level of
.05 was used. The regression analysis for the TPB, which tested if attitude toward behaviour,
subjective norms and perceived behavioural control predicted EI had an effect size (f2) of

53
1.38 and a power of 1. This indicates that the results of the regression analysis for the TPB
has a medium effect size (f2). The regression analysis for the EEM, which tested perceived
desirability and perceived feasibility, predicted EI had an effect size (f2) of 0.61 and a power
of 1. Thus the results of the regression analysis for the EEM also had a medium effect size
(f2). Both statistical tests yielded acceptable power, so it can be assumed that the null
hypotheses for both models were correctly rejected.
Comparing the Predicting Models of Entrepreneurial Intention
When comparing the results from the two regression analyses of this study, the TPB
model (Adjusted R2 = .58, f2 = 1.38) predicts EI to a greater extent than the EEM (Adjusted
R2 = .38, f2 = 0.61). This comparison can only be recognised as a descriptive statistic, rather
than a significant difference as no statistical test was performed to analyse the difference
between the two regression coefficients. Furthermore, only two predictors were found to be
significant within the TPB model, and only two predictors were included within the EEM due
to one scale revealing low reliability. This should also be taken into consideration in future
research and will be discussed in more detail in the following section.

54
Discussion
The aim of this study was to test the sufficiency of the TPB and EEM in predicting EI
among final year university students. The test results of the two models would then be
compared in order to draw a conclusion regarding which model is more sufficient in
predicting EI. This chapter will provide an overview of the findings and discuss these test
results. Thereafter the limitations and practical implications of the study will be provided.
Summary of Main Findings
The results of this study show that only H1b, H1d, H2b and H2c is supported. Both the
TPB and EEM significantly predict EI among final year students. Each model was found to
have two significant predictors, instead of the expected three predictors. When comparing the
two models, the results of this study indicate that the TPB (Adjusted R2 = .58, p < .001) is
more sufficient in predicting EI than the EEM (Adjusted R2 = .38, p < .001). This finding
contradicts Krueger et al. (2000) found the EEM (Adjusted R2 = .41, p < .001) to be the
stronger predicting model of EI over the TPB (Adjusted R2 = .35, p < .001). Subjective norms
was also found not to be a significant predictor of EI, however all three independent variables
of the EEM were revealed to be significant predictors (Krueger et al., 2000).
The Theory of Planned Behaviour
Attitude toward behaviour, subjective norms and perceived behavioural control were
all found to significantly correlate with each other, thus H1a was supported. This result is
consistent with Ajzen (1985) who suggested that the components of the TPB are related to
one another. Only attitude toward behaviour and perceived behavioural control significantly
explained some of the variance in EI (Adjusted R2 = .58, p < .001). However, the importance
of attitude toward behaviour, subjective norms and perceived behavioural control can differ
between behaviours and situations (Ajzen, 1991). Therefore, regardless of subjective norms

55
not being a significant predictor, the TPB can still be considered a viable model of EI
prediction in this study.
Attitude toward behaviour
Across the three predictors of the TPB, attitude toward behaviour explained the most
variance in EI (β = .55, p < .001). Among this sample of final year students at the University
of Cape Town, attitude toward behaviour can be recognised as more important than perceived
behavioural control in determining their level of EI. These students were more concerned
about having a favourable appraisal of engaging in entrepreneurial behaviour, rather than
having the ability to start a business. When their appraisal of starting a business is favourable
they are likely to show higher levels of EI. This result differs from both Autio et al. (2001)
and Krueger et al. (2000), who report perceived behavioural control as being the strongest
predictor of EI. Perceived behavioural control accounted for more of the variance in EI over
and above attitude toward behaviour in their research. The reasons why their results may
differ could be due to their sample, the context of the study and socio-cultural factors. For
example, the sample Autio et al. (2000) used in their study mainly consisted of technology
students, whereas this study considered engineering and commerce students. Technology
students may perceive the ability to start a business as important, whereas commerce and
engineering students find a favourable appraisal of a business as more important.
On the other hand, Gird and Bagraim (2005) found similar results to this study, where
attitude toward behaviour (β = .55, p < .001) explained more variance than perceived
behavioural control (β = .21, p < .05). This offers an explanation as to why the results
differed from earlier studies. Their study was also conducted in South Africa and used a
similar sample which consisted of commerce students. So it makes sense that their results

56
would be similar to the results found in this study. The findings could be due to the similar
cultural and contextual factors experienced by these students in South Africa.
Subjective Norms
This was the only predictor of the TPB that was not found to have a significant effect
and had the weakest correlation with EI (r = .17), thus revealing that the students did not
perceive social pressure from friends and family to start a business as important. These
normative beliefs, therefore, did not have an influence on determining their level of EI. This
result has also been reported by Krueger et al. (2000) and Autio et al. (2001) who found
subjective norms to not be a significant predictor of EI. Whereas, Gird and Bagraim (2005)
report that subjective norms (β = .13, p < .05) is in fact a significant predictor of EI.
However, in the study conducted by Gird and Bagraim (2005), subjective norms was reported
to be the weakest predictor of EI. Consequently, it is not unusual for this component of the
TPB model to demonstrate minor, or no influence, in determining the level of EI among
university students.
Krueger et al. (2000) explain that subjective norms may be influenced by the
personality and nature of an entrepreneur. Entrepreneurs are known to be more individualist
and have a tendency toward inner-directness. Therefore, an entrepreneur can perform
behaviours without the concern of others, such as friends and family. Furthermore, Buttar
(2015) reported that it is not unusual for the influence of subjective norms to differ across
samples from different countries. For example, a sample of Pakistani students revealed that
subjective norm had a greater influence on EI compared to a sample of Turkish students. This
result may be due to the cultural differences within these countries where socio-cultural
structures within Pakistan are collectivist, whereas Turkish students tend to be more
individualist.
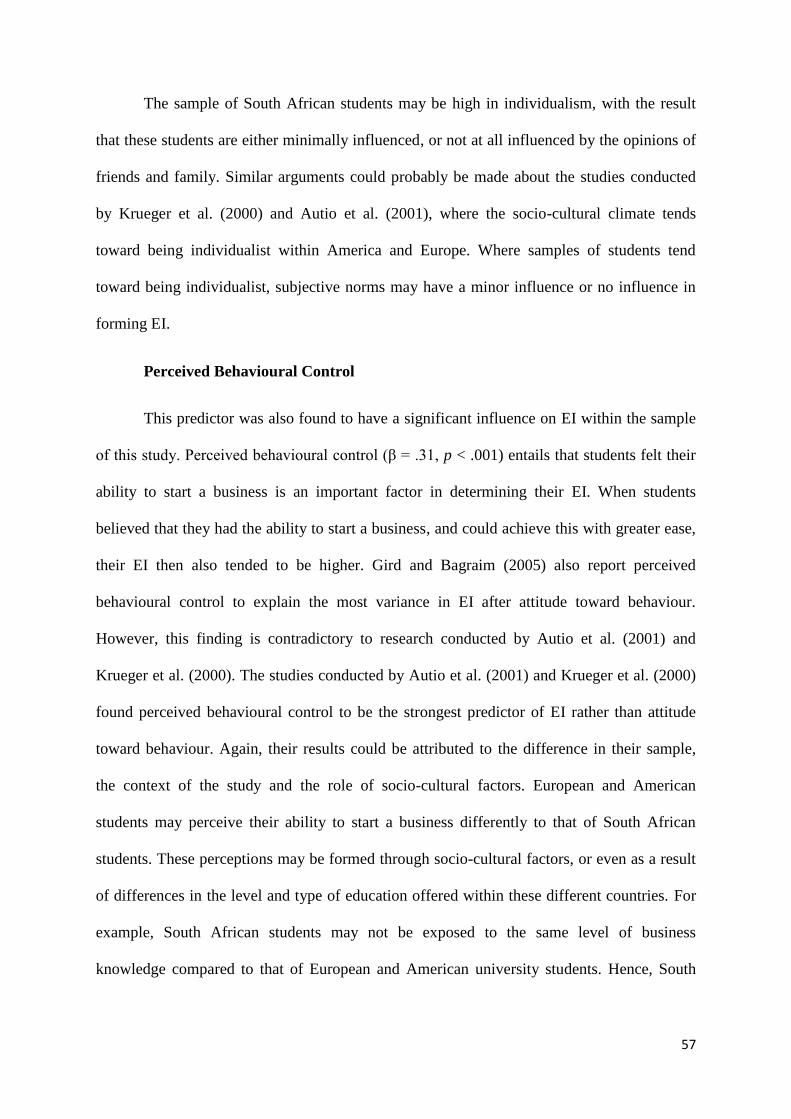
57
The sample of South African students may be high in individualism, with the result
that these students are either minimally influenced, or not at all influenced by the opinions of
friends and family. Similar arguments could probably be made about the studies conducted
by Krueger et al. (2000) and Autio et al. (2001), where the socio-cultural climate tends
toward being individualist within America and Europe. Where samples of students tend
toward being individualist, subjective norms may have a minor influence or no influence in
forming EI.
Perceived Behavioural Control
This predictor was also found to have a significant influence on EI within the sample
of this study. Perceived behavioural control (β = .31, p < .001) entails that students felt their
ability to start a business is an important factor in determining their EI. When students
believed that they had the ability to start a business, and could achieve this with greater ease,
their EI then also tended to be higher. Gird and Bagraim (2005) also report perceived
behavioural control to explain the most variance in EI after attitude toward behaviour.
However, this finding is contradictory to research conducted by Autio et al. (2001) and
Krueger et al. (2000). The studies conducted by Autio et al. (2001) and Krueger et al. (2000)
found perceived behavioural control to be the strongest predictor of EI rather than attitude
toward behaviour. Again, their results could be attributed to the difference in their sample,
the context of the study and the role of socio-cultural factors. European and American
students may perceive their ability to start a business differently to that of South African
students. These perceptions may be formed through socio-cultural factors, or even as a result
of differences in the level and type of education offered within these different countries. For
example, South African students may not be exposed to the same level of business
knowledge compared to that of European and American university students. Hence, South

58
African students may understand the skills involved in starting a business differently to that
of European and American university students.
The Entrepreneurial Event Model
The EEM consists of three predicting variables, but as mentioned above, only two
were considered when conducting the statistical analyses. The propensity to act scale
revealed poor psychometric properties, and so the variable propensity to act was not used in
any further analyses. Perceived desirability and perceived feasibility were found to be
significantly correlated with each other. Thus H2a was supported. Similarly to the TPB, all
components of the EEM collectively predict EI (Shapero, 1975, Shapero, 1982). This
supports the findings of the correlation analysis as predictors should be correlated with each
other in order to collectively explain variance in a dependent variable. Collectively, perceived
desirability and perceived feasibility did significantly explain some of the variance of EI in
this study (Adjusted R2 = .38, p < .001).
Perceived Desirability
This component of the EEM was found to be the strongest predictor of EI within this
model (β = .36, p < .001). As a result, the attractiveness of the idea of starting a business is
considered the most important determinant of EI within the context of this study. When
students find the idea of starting a business appealing, they are likely to have higher levels of
EI. Krueger (1993) found a similar result when he applied the EEM model to a sample of
business students. Krueger (1993) concluded that external factors have the strongest influence
on perceived desirability, thus identifying this variable as being the more important
determinant of EI. External factors could be recognised as culture and other socio-economic
variables. Perceived desirability is also conceptually associated with attitude toward
behaviour from the TPB. Therefore, it makes theoretical sense that perceived desirability

59
would explain more of the variance in EI in this study as attitude toward behaviour was also
the strongest predictor of EI in the TPB (Krueger et al., 2000).
But in a later study, Krueger et al. (2000) found that perceived desirability explained
less variance in EI than perceived feasibility. The second study conducted by Krueger et al.
(2000) used a different sample of business students, and was conducted seven years after the
first study. The desirability of starting a business may have changed during this time, and
students may have been less influenced by external factors. Alternatively, the new sample of
students may have just perceived their ability to start a business as being more important.
This differs from the perceptions of South African students, who seem to be more influenced
by external factors - such as culture and other socio-economic variables. Therefore, perceived
desirability would tend to play a larger role in determining EI over their confidence in
starting a business. For example, South African students may be more influenced by
economic factors, as these students live in a developing country. European and American
students live in developed countries, which have stronger economies. Consequently, they
may be less concerned about their businesses not being successful due to economic reasons.
Perceived Feasibility
This component of the EEM was also found to be a significant predictor of EI (β =
.32, p < .001). Students who felt personally capable of starting a business would then show
high levels of EI. Similarly to the conceptualisation of perceived desirability, perceived
feasibility is conceptually associated with perceived behavioural control. Perceived
behavioural control was found to explain less variance than attitude toward behaviour. This
can be related to the finding within this model where perceived feasibility explains less
variance than perceived desirability. This finding is however consistent with the results of

60
Krueger’s (1993) study, where he also found perceived desirability to explain more variance
in EI than perceived feasibility.
As mentioned above, this finding is not consistent with research conducted by
Krueger et al. (2000). South African students weigh their ability to start a business as less
important than their desire to start a business. This may be a result of the sample of South
African students being comprised of both engineering and commerce students, whereas the
sample used in the study conducted by Krueger et al. (2000) only consisted of business
students. It could be possible that engineering students are not as confident in their ability to
start a business compared to commerce and business students. For that reason, the overall
perceived feasibility of the sample was lowered. Another reason extending to the discussion
above is where a difference exists regarding the influence of culture and other socio-
economic variables between South African and American students. This cultural and socio-
economical difference may be an explanation as to why the sample of South African students
find perceived feasibility to be the weaker predictor of their EI.
Propensity to act
Excluded from the statistical testing due to the scale revealing poor internal
consistency, this study was not able to demonstrate the influence of propensity to act on EI.
Propensity to act was conceptualised as the internal locus of control in this study. Shapero
(1982) suggested that the internal locus of control scale could be used as a possible proxy
measure in the absence of better measures. However, Lee and Tsang’s (2001) scale revealed
low internal consistency when considering the sample used in this study. This finding did not
correspond with previous research that found the scale to be reliable measure within a similar
sample of South African students (Gird & Bagraim, 2005). The possibility exists that
participants of this study could have misinterpreted the items, which could have led to

61
inconsistent responses among participants. Furthermore, the items should have been tailored
to specifically measure achievement-orientated behaviour in relation to starting a business,
rather than a general conception an individual has in controlling events within his life.
Conceptualising propensity to act as the internal locus of control may have caused issues in
measurement.
Theoretical Implications
The first theoretical implication is that this research contributes to the area of research
testing models that predict EI. It provides further evidence that the TPB can be applied within
EI research. More importantly, it provides support that the TPB can be applied within a South
African context. This is an important finding as a limited amount of literature exists where
the TPB has been applied in South Africa (Gird & Bagraim, 2005). Relatively similar
findings to Gird and Bagraim (2005) provide further support to which are the most important
determinants of EI among South African students. Unfortunately, no South African literature
is available that has made use of the EEM to predict EI. So this research is the first to
provide findings of this model within a South African context. Understanding an alternative
model of EI prediction may allow EI to be better understood, and possibly, to be more
accurately predicted within further research (Krueger, 1993).
The results also offer an explanation as to why the TPB has been applied in EI
research more so than the EEM. This research has found the TPB to be the more sufficient
predictor of EI, but this is not consistent with earlier research. Krueger et al. (2000)
conducted the only research that has compared these two models, and their findings
contradict the results of this study. This research contributes to the understanding on the
choice of model which should be used to predict EI. The difference of results between this
study and Krueger et al. (2000) may be due to socio-cultural characteristics of the sample,

62
and the exclusion of propensity to act. Nonetheless, it still builds onto the knowledge base of
EI prediction and what model could be considered more important in explaining variance. It
also provides evidence that the TPB is the more appropriate model to apply within a South
African context than the EEM.
Practical Implications
Intention has been found to be one of the best predictors of behaviour (Ajzen, 1991).
Thus understanding the determinants of EI will provide schools, universities and
governments with the opportunity to increase entrepreneurial activity within a country. For
example, this study has found attitude toward behaviour and perceived desirability to be the
strongest predictors of EI. This raises the point of discussion on what universities can do to
change the perceptions and attitudes of these students. Luthje and Frank (2003) suggest that
entrepreneurial attitudes may be influenced by educators and powerful role models.
Universities and schools could inform educators to assume their roles as advocates and bring
about this change. Allowing successful business people as guest speakers, where they share
their success stories, may also increase the attractiveness of starting a business among
students. Furthermore, other authors suggest that universities should create an atmosphere
that encourages students to become entrepreneurs (De Jorge-Moreno, Castillo & Trigueri,
2011). Understanding that determinants - such as perceived feasibility and perceived
behavioural control have a significant influence on EI provide further opportunity for
increasing entrepreneurial activity. If universities can advance entrepreneurial thinking by
incorporating relevant learning material into courses, this could change the perceptions of
students. These students may feel more encouraged and confident about starting a business
(Klapper & Tegtmeier, 2010).

63
Limitations
This research has limitations regarding sampling, variable measurement and
understanding the influence of EEM. These limitations will be discussed below.
Sampling Limitations
There were three sampling issues in this study. Firstly, using purposive sampling
meant that variability and bias could not be controlled within the sample. The sample of
students was not chosen randomly, and therefore, the results of the study cannot be
generalised beyond the sample (Acharya, Prakash & Nigam, 2013). Secondly, using cross
sectional research design meant that the data collected would only be a representation of the
time period it was collected in. De Jorge-Moreno et al. (2011) suggest using a longitudinal
study, as this would provide more richness to the results, and would capture EI in more depth.
Thus the results of this study are only relevant at the time the data was collected. The EI
among these students may change over time, and for a more accurate assessment of the EI,
these students should be revaluated. Lastly, the use of a sub-group or sub-set of the sample
within this study is another limitation. The variance explained in EI can be compared across
the sample and the sub-set, and it would be preferable to consider the entire sample when
comparing the two models of EI prediction. Using the entire sample for hypothesis testing
should allow the results to be more consistent between the two models. Taking into account
the 186 students for the analysis of the EEM may reveal different findings compared to only
considering a sub-set of the sample.
Measurement Limitations
Attitude towards behaviour was measured using one item in this study. The use of one
item is widely accepted across different research fields. Despite this, using one item does

64
result in limitations. Researchers argue that using a single item may not offer as much detail
and depth as multiple item measures do (Oshangbemi, 1999). Sloan, Aaronson, Cappelleri
and Varricchio (2002) suggest that single item measures can be used according to the context
of the research. For example, it is considered appropriate to use a single item for global
measures. These researchers do go on to suggest that using a single item may not capture the
richness of a construct, and that single item measures must be carefully considered before
being used. As a consequence, attitude toward behaviour may have been captured in limited
depth and detail within the context of this study.
The other measurement issue, which has been a limitation to this study, has been the
use of Lee and Tsang’s (2001) internal locus of control scale. Propensity to act is
conceptualised as the desire to gain control through action (Shapero, 1982). It may be more
appropriate to use a scale aimed at measuring desirability of control, rather than the internal
locus of control. Krueger (1993) recommends using Burger’s (1985) desirability of control
scale. This scale has revealed sound psychometric properties in previous studies. The main
reason why the Lee and Tsang’s (2001) internal locus of control scale was used in this study
is because the scale revealed sound psychometric properties when used in an earlier South
African study (Gird & Bagraim, 2005).
Entrepreneurial Event Model.
The full sufficiency of this model could not be tested, as the scale used to measure
propensity to act revealed a poor internal consistency. Unlike the TPB, where subjective
norms were found not to be a significant predictor of EI, all components of this model were
still tested. The possibility exists that by using an alternative scale to measure propensity to
act, all components of the EEM can then be included in the analysis. If this is done, the
effectiveness of the model can be tested to a greater extent.

65
Suggestions for future research
When measuring the components of these models it is recommended that other scales
be used for propensity to act, attitude toward behaviour and subjective norms. As discussed it
may be more appropriate to measure propensity to act using a scale that aims to measure
desirability of control. Using a proxy scale, such as a scale which measures the internal locus
of control, should be avoided. Preference should be given to a scale that captures the
conceptualisation of the construct to a greater degree (Krueger, 1993). Attitude toward
behaviour could still be measured using a single item, but including another multiple item
scale could offer finding richer results (Sloan et al., 2002). The multiple measure could also
be compared to the single item measure with the aim of evaluating the measurement
properties of using a single item to measure attitude toward behaviour. Using two scales to
measure attitude toward behaviour may add value to future research. Lastly, it is
recommended to measure subjective norms in greater depth. Autio et al. (2001) used a scale
consisting of three items that only probed an individual’s perception of family, friends and
other people that the individual regarded as close. However, Krueger et al. (2000) suggest
that including items relating to an individual’s broader network and social capital may offer
further insight into measuring subjective norms. A scale, which considers an individual’s
broader network and social capital, in addition to friends and family, could be a more
accurate measurement conceptualisation of this construct.
Descriptive statistics also suggest that there may be an influence of education and past
experience on EI. Ajzen (1991) explains that the TPB accounts for other variables that may
influence intention, such as personality traits and past experiences. However, many
researchers argue against this, and insist that other extraneous variables do play a role in
determining EI (Luthje & Frank, 2003). Hence, education and past experiences could be
included in future studies, as both models may not explicitly account for these variables.
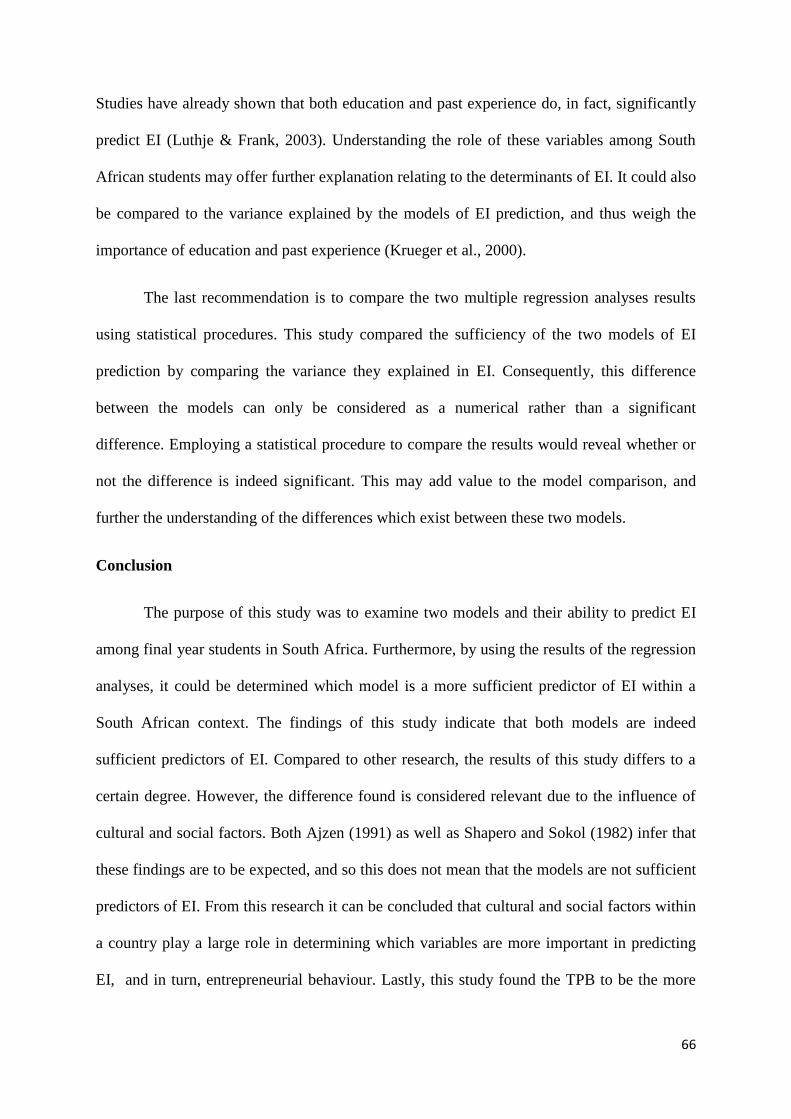
66
Studies have already shown that both education and past experience do, in fact, significantly
predict EI (Luthje & Frank, 2003). Understanding the role of these variables among South
African students may offer further explanation relating to the determinants of EI. It could also
be compared to the variance explained by the models of EI prediction, and thus weigh the
importance of education and past experience (Krueger et al., 2000).
The last recommendation is to compare the two multiple regression analyses results
using statistical procedures. This study compared the sufficiency of the two models of EI
prediction by comparing the variance they explained in EI. Consequently, this difference
between the models can only be considered as a numerical rather than a significant
difference. Employing a statistical procedure to compare the results would reveal whether or
not the difference is indeed significant. This may add value to the model comparison, and
further the understanding of the differences which exist between these two models.
Conclusion
The purpose of this study was to examine two models and their ability to predict EI
among final year students in South Africa. Furthermore, by using the results of the regression
analyses, it could be determined which model is a more sufficient predictor of EI within a
South African context. The findings of this study indicate that both models are indeed
sufficient predictors of EI. Compared to other research, the results of this study differs to a
certain degree. However, the difference found is considered relevant due to the influence of
cultural and social factors. Both Ajzen (1991) as well as Shapero and Sokol (1982) infer that
these findings are to be expected, and so this does not mean that the models are not sufficient
predictors of EI. From this research it can be concluded that cultural and social factors within
a country play a large role in determining which variables are more important in predicting
EI, and in turn, entrepreneurial behaviour. Lastly, this study found the TPB to be the more

67
sufficient predictor of EI. Again, this does not mean that the EEM is not sufficient in
predicting EI, only that it explains less variance than the TPB. Future research on EI within
South Africa should, nonetheless, consider applying the TPB rather than the EEM.

68
References
Acharya, A. S., Prakash, A., & Nigam, A. (2013). Sampling: Why and How of it? Indian
Journal of Medical Specialities, 4(2), 330-333.
Ajzen, I., & Fishbein, M. (1980). Understanding Attitudes and Predicting Social Behaviour.
Englewood Cliffs: Prentice-Hall.
Ajzen, I. (1988). Attitudes, personality, and behavior. Chicago: Dorsey Press.
Ajzen, I. (1991). The theory of planned behavior. Organizational Behavior and Human
Decision Processes, 50, 179-211.
Ajzen, I. (2005). Attitudes, personality, and behavior. Milton-Keynes: Open University Press
/ McGraw- Hill.
Ang, S.H. & Hong, D.G. (2000). Entrepreneurial spirit among east Asian Chinese.
Thunderbird International Business Review, 42(3), 285–309.
Autio, E., Keeley, R H., Klofsten, M., Parker, G. C., & Hay, M. (2001). Entrepreneurial
intent among students in Scandinavia and in the USA. Enterprise and Innovation
Management Studies, 2, 145-160.
Begley, T. M., & Boyd, D. (1987). Psychological characteristics associated with performance
in entrepreneurial firms and small businesses. Journal of Business Venturing, 2, 79–
93.
Bird, B., & Jelinek, M. (1988). The operation of entrepreneurial intentions. Entrepreneurship
Theory and Practice, 13, 21-29.
Burger, J. (1985). Desire for control and achievement-related behaviours. Journal of
Personality and Social Psychology, 48, 1520-1533.
Buttar, H. M. (2015). Formation of entrepreneurial career intentions: the role of
sociocognitive factors. Journal of Eemployment Counseling, 53, 1-17.

69
Byabashaija, W. & Katono, I. (2011). The impact of college entrepreneurial education on
entrepreneurial attitudes and intention to start a business in Uganda. Journal of
Developmental Entrepreneurship, 16(2), 127–144.
Cohen, J. (1988). Statistical power analysis for the behavioral sciences (2nd ed.). Hillsdale:
Erlbaum.
Comrey A. L.(1973). A First Course in Factor Analysis. New York: Academic Press Inc.
Cook, R. D., & Weisberg, S. (1982). Residuals and influence in regression. New York:
Chapman & Hall.
Davidsson, P. (1995). Determinants of Entrepreneurial Intentions. RENT IX Workshop in
Entrepreneurship Research, Piacenza.
De Jorge-Moreno, J., Castillo, L. L., & Triguero, M. S. (2011). The effect of business and
economics education programs on students’ entrepreneurial intention. European
Journal of Training and Development, 36(4), 409-425.
Doll, J., & Ajzen, I. (1992). Accessibility and Stability of Predictors in the Theory of Planned
Behavior. Journal of Personality and Social Psychology, 63(5), 754-765.
Drucker, P. (1985). Innovation and entrepreneurship: Practice and principles. New York:
Harper and Row.
Durbin, J., & Watson, G. S. (1951). Testing for serial correlation in least squares regression,
II. Biometrika, 30, 159-178.
Faul, F., Erdfelder, E., Lang, A., & Buchner, A. (2007). G*Power 3: A flexible statistical
power analysis program for the social, behavioral, and biomedical sciences.
Behaviour Research Methods, 39(2), 175-191.
Field, A. (2009). Discovering statistics using SPSS. London: Sage Publications.
Fishbein, M., & Ajzen, I. (2010). Predicting and changing behaviour. New York: Taylor and
Francis Group.

70
Frank, H., Lueger, M., & Korunka, C. (2007). The significance of personality in business
start-up intentions, start-up realization and business success. Entrepreneurship and
Regional Development, 19(3), 227–251.
Geldhof, G. J., Weiner, M., Agnas, J. P., Mueller, M. K., & Lerner, R. M. (2013).
Understanding entrepreneurial intent in late adolescence: The role of intentional self-
regulation and innovation. Youth Adolescence, 43, 81-91.
George, D., & Mallery, M. (2010). SPSS for Windows Step by Step: A Simple Guide and
Reference (10th ed.). Boston: Pearson.
Gird, A., & Bagraim, J. (2005). The theory of planned behaviour as predictor of
entrepreneurial intent amongst final-year university students. South African Journal of
Psychology, 38(4), 711-724.
Godsey, M.L. & Sebora, T.C. (2010). Entrepreneur role models and high school
entrepreneurship career choice: Results of a field experiment. Small Business Institute
Journal, 5(1), 83–125.
Gorman, G., Hanlon, D., & King, W. (1997). Some research perspectives on entrepreneurship
education, enterprise education and education for small business management: A ten-
year literature review. International Small Business Journal, 15(3), 56 - 77.
Gurol, Y., & Atsan, N. (2006). Entrepreneurial characteristics amongst university students:
Some insights for entrepreneurship education and training in Turkey. Education and
Training, 48(1), 25–38.
Gurel, E., Altinay, L., & Daniele, R. (2010). Tourism students’ entrepreneurial intentions.
Annals of Tourism Research, 37(3), 646-669.
Hisrich, R., Peters, M., & Shepherd, D. (2005). Entrepreneurship with OLC. Illinois:
McGraw Hill.
Hornaday, J. A., & Aboud, J. (1971). Characteristics of successful entrepreneurs. Personnel
Psychology, 24, 141-153.
Kamau, E. W. (2013). Entrepreneurship will cut youth unemployment across Africa, says
Manuel. Business Day.

71
Klapper, R., & Tegtmeier, S. (2010). Innovating entrepreneurial pedagogy: examples from
France and Germany. Journal of Small Business and Enterprise Development, 17(4),
562-568.
Koh, H.C. (1996). Testing hypotheses of entrepreneurial characteristics. Journal of
Managerial Psychology, 11(3), 12-25.
Kolvereid, L., & Isaksen, E. (2006). New business start-up and subsequent entry into self-
employment. Journal of Business Venturing, 21, 866–885.
Krueger, N. (1993). The impact of prior entrepreneurial exposure on perceptions of new
venture feasibility and desirability. Entrepreneurship: Theory and Practice, 18(1), 5-
21.
Krueger, N., Reilly, M. D., & Carsrud, A. L. (2000). Competing models of entrepreneurial
intentions. Journal of Business Venturing, 15, 411-432.
Luthje, C., & Franke, N. (2003). The making of an entrepreneur: Testing a model of
entrepreneurial intent among engineering students at MIT. R&D Management, 33,
135-147.
MacCallum, R. C., Widaman, K. F., Zhang, S., & Hong, S. (1999). Sample size in factor
analysis. Psychological Methods, 4(1), 84-90.
McClellmd, D. C, Atkinson, J. W., Clark, R. A., & Lowell, E. L. (1953). The Achievement
Motive. New York: Appleton Century Crofts.
Merenda, Peter F. (1997). ``A Guide to the Proper Use of Factor Analysis in the Conduct and
Reporting of Research: Pitfalls to Avoid,'' Measurement and Evaluation in Counseling
and Development 30, 156±164.
Mmesi, M. (2015). South Africa’s youth unemployment problem: What we need to know. In
on Africa.
Mueller, S. L., & Thomas, A. S. (2001). Culture and entrepreneurial potential: A nine country
study of locus of control and innovativeness. Journal of Business Venturing, 16, 51–
55.

72
Norris, M., & Lecavalier, L. (2010). Evaluating the Use of Exploratory Factor Analysis in
Developmental Disability Psychological Research. Journal of Autism and
Development Disorders, 40(8), 8-20.
Nunnally, J, C. (1978). Psychometric theory (2nd ed.). New York: McGraw-Hill
Publications.
Oosthuizen, M., & Cassim, A. (2015). The state of youth unemployment in South Africa.
Brookings.
Oshangbemi, T. (1999). Overall job satisfaction: how good are single versus multiple-item
measures? Journal of Managerial Psychology, 14(5), 388-403.
Pallant, J. (2004). SPSS survival manual (2nd ed.). New York, NY: Open University Press,
McGraw Hill Education.
Rogan, M., & Reynolds, J. (2015). How high unemployment has eclipsed the plight if SA’s
working poor. Mail and Guardian.
Rotter, J. B. (1966). Generalized expectations for internal versus external control of
reinforcement. Psychological Monographs: General and Applied, 80(609), 1–28.
Sackett, P. R., & Larson, J. (1990). Research strategies and tactics in I/O psychology. In M.
D. Dunnette, & L. Hough (Eds.), Handbook of Industrial and Organizational
Psychology (2nd). Palo Alto, CA: Consulting Psychologists Press.
Schumpeter, J.A. (1934). The theory of economic development. Cambridge, MA: Harvard
Press.
Shapero, A. (1975). The displaced, uncomfortable entrepreneur. Psychology Today, 9, 83–88.
Shapero, A. & Sokol, L. (1982). Social dimensions of entrepreneurship. In C.A. Kent, D.L.
Sexton, & K.H. Vesper (Eds.), The encyclopaedia of entrepreneurship (pp. 72–90).
Englewood Cliffs, NJ: Prentice-Hall.

73
Sloan, J. A., Aaronson, N., Cappelleri, J. C., & Varricchio, C. (2002). Assessing the Clinical
Significance of Single Items Relative to Summated Scores. Mayo Clinic
Proceedings, 77(5), 479-487.
Tabachnick, B. G., & Fidell, L. S. (2001). Using multivariate statistics (4th ed.). Needham
Heights, MA: Allyn & Bacon.
Tabane, M. (2016). Small businesses are the backbone of SA’s economy: Ramaphosa. SABC
News.
Timmons, J. A., Smollen, J. E., & Dingee, A. L. M. (1977). New Venture Creation. Irwin:
Homewood III.
Tkachev, A., & Kolvereid, L. (1999). Self-employment intentions among Russian students.
Entrepreneurship & Regional Development, 11, 269-281.
Turker, D., & Selcuk. S. S. (2008). Which factors affect entrepreneurial intention of
university students. Journal of European Industrial Training, 33(2), 142-159.
Varamaki, E., Joensuu, S., Tornikoski, E., & Viljammaa, A. (2013). The development of
entrepreneurial potential among higher education students. Journal of Small Business
and Enterprise Development, 22(3), 563-589.
Williams, B., Onsman, A., & Brown, T. (2010). Exploratory factor analysis: A five-step
guide for novices. Journal of Emergency Primary Health Care, 8(3), 1-13.
Wilson, F., Marlino, D., & Kickul, J. (2004). Our entrepreneurial future: Examining the
diverse attitudesand motivations of teens across gender and ethnic identity. Journal of
Developmental Entrepreneurship, 9(3), 178-197.
Wood, R., & Bandura, A. (1989). Social cognitive theory of organizational management.
Academy of Management Review, 14(3), 361 - 384.
Yang, J. (2013). The theory of planned behaviour and prediction of entrepreneurial intention
among Chinese undergraduates. Social behaviour and Personality, 41(3), 367-376.
Yeong, E., & Lofius, E. F. (1998). Attitudes toward law and prisoners, conservative
authoritarianism, attribution, and internal-external locus of control: Korean and

74
American law students and undergraduates. Journal of Cross-Cultural Psychology,
29, 595–615.

75
Appendix 1: Summary of Original Scales
Entrepreneurial Intention
Autio, Keeley, Klosten, Parker and Hay’s (2001). All statements are rated on a 5-point Likert
scale ranging from 1 (not at all likely) to 5 (already started a business).
1. Start a business on a full-time basis within one year from now.
2. Start a business on a full-time basis within five years.
3. Start a business on a part-time basis within one year from now.
4. Start a business on a part-time basis within five years.
Attitude toward behaviour
Autio, Keeley, Klosten, Parker and Hay’s (2001). All statements are rated on a 5-point Likert
scale ranging from 1 (not at all likely) to 5 (very likely).
1. Corporate career (working for a large, established, private sector employer).
2. Civil servant career (working for a government agency or other public agency).
3. Entrepreneurial career (starting up and or managing a business of my own or with
family or friends, self-employed).
4. Academic career (working at a university or a research institution).
Subjective Norm
Autio, Keeley, Klosten, Parker and Hay’s (2001). All statements are rated on a 3-point Likert
scale ranging from 1 (not desirable) to 3 (desirable).
1. If I became an entrepreneur my family would consider it to be…
2. If I became an entrepreneur my friends would consider it to be…
3. If I became an entrepreneur other people close to me would consider it to be…

76
Perceived Behavioural Control
Autio, Keeley, Klosten, Parker and Hay’s (2001). All statements are rated on a 5-point Likert
scale ranging from 1 (strongly disagree) to 5 (strongly agree).
1. I am confident that I would succeed if I started my own business.
2. It would be easy for me to start my own business.
3. To start my own business would probably be the best way for me to take advantage of
my education.
4. I have the skills and capabilities required to succeed as an entrepreneur.
Perceived Feasibility
Krueger (1993). All statements are rated on a 7-point Likert scale. Each item has a different
response.
1. How hard do you think it would be (very hard—very easy).
2. How certain of success are you (very certain of success—very certain of failing).
3. How overworked would you be (very overworked—not overworked at all).
4. Do you know enough to start a business (know everything—know nothing).
5. How sure of yourself (very sure of myself—very unsure of myself).
Perceived Desirability
Krueger (1993). All statements are rated on a 7-point Likert scale. Each item has a different
response.
1. I would love doing it (I would love doing it—I would hate doing it).
2. How tense would you be (very tense—not tense at all).
3. How enthusiastic would you be (very enthused—very unenthusiastic).

77
Propensity to Act
Lee and Tsang (2001). All statements are rated on a 5-point Likert scale ranging from 1
(strongly disagree) to 5 (strongly agree).
1. When I get what I want, it is usually because I have worked for it.
2. My life is mostly determined by my own actions.
3. I can pretty much control what will happen in my life.

78
Appendix 2: The Questionnaire
Are you a final year student? I need your input!
I’m completing my Masters degree and want to find out the
entrepreneurial intention among final year students at the University
of Cape Town.
It is only with your help that my research can make a positive
contribution. I hope to build on the understanding of what drives
young individuals to become entrepreneurs within our country.
The study has ethics approval and your participation is completely
voluntary and anonymous. You may withdraw at anytime.
The survey will take approximately 12 minutes to complete.
Thanks for your help
Fawwaaz Davids
Are you a final year student?
Yes
No

79
If you are not a final year student, thank you for your time and please
return this questionnaire.
Let’s begin! Help me understand your entrepreneurial intention by answering the
following questions.
Read the two statements below and rate your intention to start your own
business by choosing a number between 0 (low) to 100 (high). Write this number
in the space provided.
1. Estimate the probability that you will start a new business in the next 5
years?
_____
2. How desirable do you think it would be for you to start your own business
within the next 5 years?
_____
For each statement below tick () the box which best represents how you feel.
How likely is it that you will start a new firm of your own or with friends? Please assess the option of starting different types of businesses (part time and full time) using this scale.
No
t at
all
likel
y
No
t ve
ry li
kely
Like
ly
Ver
y lik
ely
Alr
ead
y st
arte
d a
fi
rm
3. Start a business on a full-time basis within one year from now
4. Start a business on a full-time basis within five years from now
5. Start a business on a part-time basis within one year from now
6. Start a business on a part-time basis within five years

80
For each statement below tick () the box which best represents how you feel.
How likely is it that you will move into these business sectors? Please assess the option of different businesses sectors using this scale.
No
t at
all
likel
y
No
t ve
ry li
kely
Neu
tral
Like
ly
Ver
y lik
ely
7. Corporate career (working for a large, established, private sector employer)
8. Civil servant career (working for a government agency or other public agency)
9. Entrepreneurial career (starting up and or managing a business of my own or with family or friends, self-employed)
10. Academic career (working at a university or a research institution)
For each statement below tick () the box which best represents how you feel.
If I became an entrepreneur…
No
t d
esir
able
Neu
tral
Des
irab
le
11. my family would consider it to be…
12. my friends would consider it to be…

81
13. other people close to me would consider it to be…
For each statement below tick () the box which best represents how you feel.
Consider the following options:
Stro
ngl
y d
isag
ree
Dis
agre
e
Neu
tral
Agr
ee
Stro
ngl
y ag
ree
14. I am confident that I would succeed if I started my own business
15. It would be easy for me to start my own business
16. To start my own business would probably be the best way for me to take advantage of my education
17. I have the skills and capabilities required to succeed as an entrepreneur
18. When I get what I want, it is usually because I have worked for it
19. My life is mostly determined by my own actions
20. I can pretty much control what will happen in my life
21. I search out new technologies, processes, techniques and/or product ideas
22. I generate creative ideas
23. I promote and champion ideas to others
24. I investigate and secure funds needed to implement ideas
25. I develop adequate plans and schedules for the implementation of new ideas
26. I am innovative

82
27. I have access to capital to start a business
For each statement below tick () the box which best represents how you feel.
Consider the following options:
Stro
ngl
y D
isag
ree
Dis
agre
e
Neu
tral
Agr
ee
Stro
ngl
y ag
ree
28. I have good social networks that could be utilised if I decide to start a business
29. I have access to supporting information to help me start a business
How much confidence do you have in your ability to…? St
ron
gly
Dis
agre
e
Dis
agre
e
Neu
tral
Agr
ee
Stro
ngl
y ag
ree
30. Come up with a new idea for a product or service
31. Identify the need for a new product or service
32. Design a product or service that will satisfy customer needs and wants
33. Estimate customer demand for a new product or service
34. Determine a competitive price for a new product or service
35. Estimate the amount of start-up funds and working capital necessary to start my business
36. Design an effective marketing/advertising campaign for a new product or service
37. Get others to identify with and believe in my vision and plans for a new business
38. Network — i.e. make contact with and exchange information with others

83
For each statement below tick () the box which best represents how you feel.
How much confidence do you have in your ability to…?
Stro
ngl
y D
isag
ree
Dis
agre
e
Neu
tral
Agr
ee
Stro
ngl
y ag
ree
39. Clearly and concisely explain verbally/in writing my business idea in everyday terms
40. Supervise employees
41. Recruit and hire employees
42. Delegate tasks and responsibilities to employees in my business
43. Deal effectively with day-to-day problems and crises
44. Inspire, encourage, and motivate my employee
45. Train employees
46. Organize and maintain the financial records of my business
47. Manage the financial assets of my business
48. Read and interpret financial statements

84
For each statement below tick () the box which best represents how you feel.
Consider the following options
Stro
ngl
y D
isag
ree
Dis
agre
e
Fair
ly
dis
agre
e
Fair
ly
agre
e
Agr
ee
Stro
ngl
y ag
ree
49. I like to increase my status and prestige
50. I have high ambition
51. I like to achieve something and get recognition for it
For each statement below tick () the box which best represents how you feel.
Consider the following options:
No
t tr
ue
at a
ll
Fair
ly t
rue
Mo
stly
tr
ue
Exac
tly
tru
e
52. I become easily discouraged by failures
53. I have access to resources to help me start a business
54. When my performance does not satisfy, I start to question my abilities
55. I often feel unable to deal with problems
56. Failures can shake my self-confidence for a long time
57. When I am confronted with unusual demands, I feel helpless
58. When I do not immediately succeed in a project, I quickly lose hope for a good outcome

85
For each question below tick () the box which best represents how you feel by choosing between the numbers 1 (weak) and 7 (strong).
65. How hard do you think it would be to start your own business?
66. How certain of success are you?
For each statement below tick () the box which best represents how you feel.
Consider the following options:
No
t tr
ue
at a
ll
Fair
ly
tru
e
Mo
stly
tr
ue
Exac
tly
tru
e
59. When I can’t solve a task, I blame my lack of abilities
60. When I fail at something, I tend to give up
61. When my work is criticized, I feel depressed
62. I often feel overpowered by obstacles or troubles
63. I lose faith in myself when I make mistakes
64. If I do not instantly succeed in a matter, I am at a loss
Very hard
1 2 3 4 5 6 7 Very easy
Very certain of failing
1 2 3 4 5 6 7 Very certain of success

86
For each question below tick () the box which best represents how you feel by choosing between the numbers 1 (weak) and 7 (strong).
67. How overworked would you be if you started your own business?
68. Do you know enough to start a business?
69. How sure are you of yourself?
70. I would love starting my own business?
71. How tense would you be to start your own business?
Very overworked
1 2 3 4 5 6 7 Not overworked at all
Know nothing
1 2 3 4 5 6 7 Know everything
Very unsure of myself
1 2 3 4 5 6 7 Very sure of myself
I would hate doing it
1 2 3 4 5 6 7 I would love doing it
Very tense
1 2 3 4 5 6 7 Not tense at all

87
For each question below tick () the box which best represents how you feel by choosing between the numbers 1 (weak) and 7 (strong).
72. How enthusiastic would you be to start your own business?
For each statement below tick () the box which best represents how you feel by choosing between the numbers 1 (strongly agree) and 9 (strongly disagree).
73. Safety first
74. I do not take risks with my health
75. I prefer to avoid risks
76. I take risks regularly
Very unenthusiastic
1 2 3 4 5 6 7 Very enthused
Strongly agree
1 2 3 4 5 6 7 8 9 Strongly disagree
Strongly agree
1 2 3 4 5 6 7 8 9 Strongly disagree
Strongly agree
1 2 3 4 5 6 7 8 9 Strongly disagree
Strongly agree
1 2 3 4 5 6 7 8 9 Strongly disagree

88
For each of the statement below tick () the box which best represents how you feel by choosing between the numbers 1 (strongly agree) and 9 (strongly disagree).
77. I really dislike not knowing what is going to happen
78. I usually view risks as a challenge
79. I view myself as a…
For each statement below choose one word out of the two that best describes how you feel about starting a business and then tick () the box.
80. □ Worthless OR □ Worthwhile
81. □ Disappointing OR □ Rewarding
82. □ Negative OR □ Positive
Strongly agree
1 2 3 4 5 6 7 8 9 Strongly disagree
Strongly agree
1 2 3 4 5 6 7 8 9 Strongly disagree
Risk avoider
1 2 3 4 5 6 7 8 9 Risk taker
For each statement below tick () the box if you currently are engaging in that behaviour or have engaged in that behaviour in the past.

89
83. Attending a “start your own business planning” seminar or conference □
84. Writing a business plan or participating in seminars that focus on writing a business plan □
85. Putting together a start-up team □
86. Looking for a building or equipment for the business □
87. Saving money to invest in the business □
88. Developing a product or service □

90
Tell me about yourself:
89. Your gender?
Male Female Other
90. Your race?
Black Chinese Coloured Indian White Prefer not to answer
91. Your home language?
Afrikaans English Xhosa Other, please specify
________________
92. Your nationality?
___________________________
93. Your age (in years)?
___________________________
6. 94. Your faculty?
Commerce
Engineering
Humanities
Science
Law
Other, please specify____________
95. What degree are you registered for?
____________________________________
96. What is your plan for next year?
Further your education Look for a job Start your own business Other, please specify_____________
97. Do you currently own your own business?
Yes
No
If yes, what type of business do you own?
_________________________________
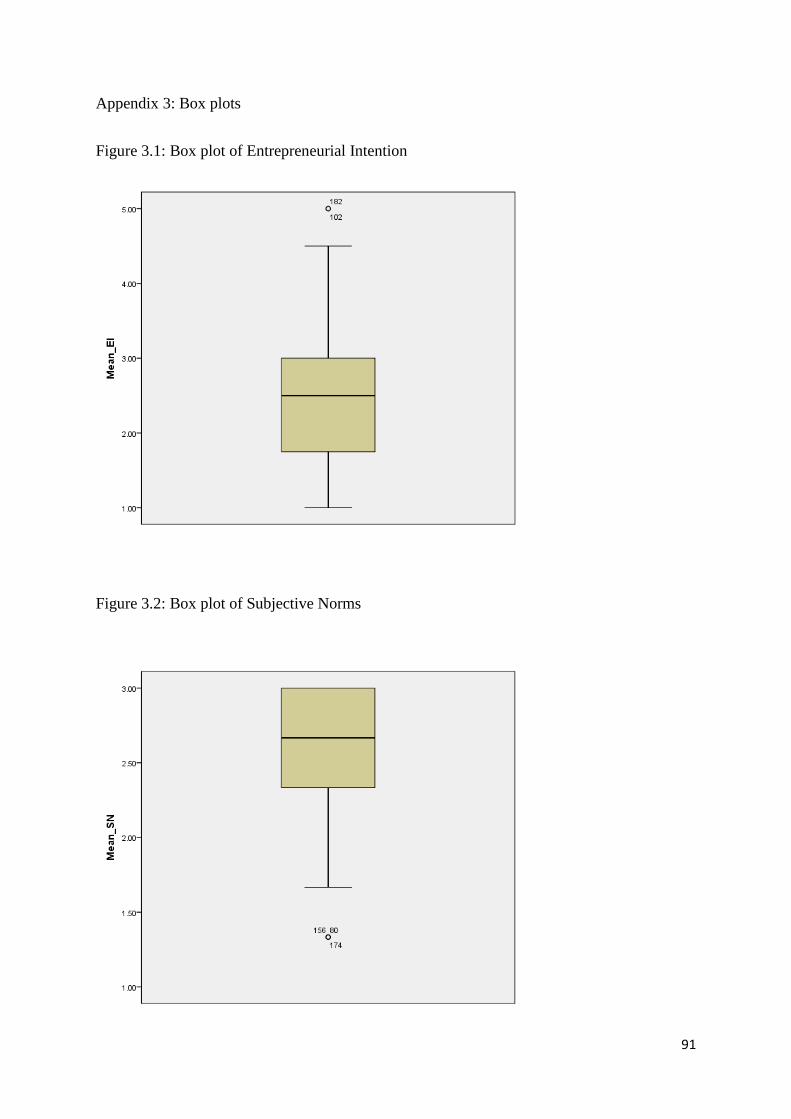
91
Appendix 3: Box plots
Figure 3.1: Box plot of Entrepreneurial Intention
Figure 3.2: Box plot of Subjective Norms

92
Figure 3.3: Box plot of Perceived Feasibility
Figure 3.4: Box plot of Perceived Desirability

93
Appendix 4: Factor Loadings and Inter-Item Correlation Tables for Propensity to Act Items
Table 4.1
Factor loadings for the Propensity to Act Items
Table 4.2
Corrected Inter-Items correlations between Propensity to Act items
PTA 1 PTA 2 PTA 3
PTA 1 1.00 .31 .07
PTA 2 .31 1.00 .22
PTA 3 .07 .22 1.00
Items Factor
Loadings
1. When I get what I want, it is usually because I
have worked for it.
.38
2. My life is mostly determined by my own actions. .81
3. I can pretty much control what will happen in
my life.
.26
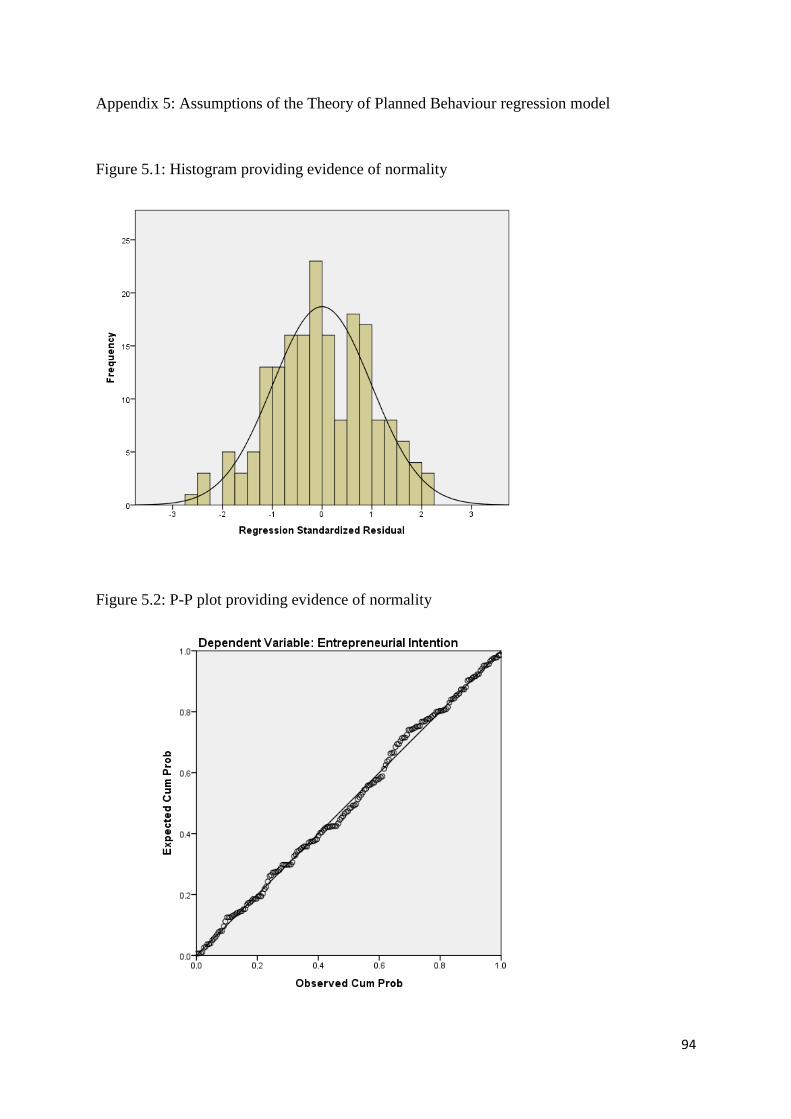
94
Appendix 5: Assumptions of the Theory of Planned Behaviour regression model
Figure 5.1: Histogram providing evidence of normality
Figure 5.2: P-P plot providing evidence of normality

95
Figure 5.3: Scatterplot of Standardized Predicted Values vs Standardized Residuals of
Entrepreneurial Intention providing evidence of homoscedasticity

96
Appendix 6: Assumptions of the Entrepreneurial Event Model regression analysis
Figure 6.1: Histogram providing evidence of normality
Figure 6.2: P-P plot providing evidence of normality

97
Figure 6.3: Scatterplot of Standardized Predicted Values vs Standardized Residuals of
Entrepreneurial Intention providing evidence of homoscedasticity