The Texas Rural Technology (R-TECH) Pilot Program … TEXAS RURAL TECHNOLOGY (R-TECH) PILOT PROGRAM...
35
Transcript of The Texas Rural Technology (R-TECH) Pilot Program … TEXAS RURAL TECHNOLOGY (R-TECH) PILOT PROGRAM...


THE TEXAS RURAL TECHNOLOGY (R-TECH) PILOT PROGRAM
INTERIM EVALUATION REPORT
December 2008
Prepared for Texas Education Agency
Prepared by Texas Center for Educational Research
Acknowledgments Texas Center for Educational Research
Contributing Authors
The Texas Center for Educational Research (TCER) conducts and communicates nonpartisan research on education issues to serve as an independent resource for those who make, influence, or implement education policy in Texas. A 15-member board of trustees governs the research center, including appointments from the Texas Association of School Boards, Texas Association of School Administrators, and State Board of Education. For additional information about TCER research, please contact: Catherine Maloney, Director Texas Center for Educational Research 12007 Research Blvd. P.O. Box 679002 Austin, Texas 78767-9002 Phone: 512-467-3632 or 800-580-8237 Fax: 512-467-3658 Reports are available at www.tcer.org
Catherine Maloney, Ph.D. Daniel Sheehan, Ed.D. Allyson Whipple, M.A.
Prepared for Texas Education Agency 1701 N. Congress Avenue Austin, Texas 78701-1494 Phone: 512-463-9734
Research Funded by Texas Education Agency
Copyright © Notice: The materials are copyrighted © and trademarked ™ as the property of the Texas Education Agency (TEA) and may not be reproduced without the express written permission of TEA, except under the following conditions: 1) Texas public school districts, charter schools, and Education Service Centers may reproduce and use copies of the
Materials and Related Materials for the districts’ and schools’ educational use without obtaining permission from TEA.
2) Residents of the state of Texas may reproduce and use copies of the Materials and Related Materials for individual personal use only without obtaining written permission of TEA.
3) Any portion reproduced must be reproduced in its entirety and remain unedited, unaltered and unchanged in any way.
4) No monetary charge can be made for the reproduced materials or any document containing them; however, a reasonable charge to cover only the cost of reproduction and distribution may be charged.
Private entities or persons located in Texas that are not Texas public school districts, Texas Education Service Centers, or Texas charter schools or any entity, whether public or private, educational or non-educational, located outside the state of Texas MUST obtain written approval from TEA and will be required to enter into a license agreement that may involve the payment of a licensing fee or a royalty. For information contact: Office of Copyrights, Trademarks, License Agreements, and Royalties, Texas Education Agency, 1701 N. Congress Ave., Austin, TX 78701-1494; phone 512-463-9270 or 512-936-6060; email: [email protected].
©Texas Center for Educational Research
Table of Contents
Executive Summary ....................................................................................................................................... i Interim Evaluation Findings ............................................................................................................. i The Continuing Evaluation ............................................................................................................. iii Overview of the Texas Rural Technology Pilot ............................................................................................ 1 Evaluation of the R-Tech Pilot ...................................................................................................................... 3 Methodology and Data Sources ....................................................................................................... 3 Study Limitations ............................................................................................................................. 3 Structure of the Report ..................................................................................................................... 4 Characteristics of R-Tech Districts and Campuses ....................................................................................... 4 Statewide Distribution of R-Tech Districts ...................................................................................... 5 2007 Accountability Ratings of R-Tech Districts and Campuses .................................................... 6 Student and Teacher Characteristics in R-Tech Districts .............................................................................. 8 Student Characteristics ..................................................................................................................... 8 Teacher Characteristics .................................................................................................................... 8 R-Tech Implementation Plans ....................................................................................................................... 9 Students Served by R-Tech .............................................................................................................. 9 Overview of R-Tech Program Implementation ............................................................................. 10 When and Where R-Tech Services are Provided to Students ........................................................ 11 R-Tech Hardware and Software Selections ................................................................................... 13 Professional Development Opportunities ...................................................................................... 13 The Academic Performance of R-Tech Campuses ..................................................................................... 14 TAKS Performance ........................................................................................................................ 14 Attendance Rates ........................................................................................................................... 18 Dropout Rates ................................................................................................................................ 18 Student Mobility ............................................................................................................................ 18 Other Performance Measures ...................................................................................................................... 19 Advanced Course Performance ...................................................................................................... 19 Graduation and Recommended High School Program Completion Rates .................................... 20 College Entrance Examinations ..................................................................................................... 20 College Readiness .......................................................................................................................... 21 Summary ..................................................................................................................................................... 22 Characteristics of R-Tech Districts and Campuses ........................................................................ 22 Districts’ Implementation of the R-Tech Program ........................................................................ 22 The Academic Performance of R-Tech Campuses ........................................................................ 23 The Continuing Evaluation ......................................................................................................................... 23 References ................................................................................................................................................... 25


EXECUTIVE SUMMARY Texas enrolls more students in rural public schools than any other state (Johnson & Strange, 2007). Eighteen percent of Texas’ more than 4.5 million public school students attend a rural public school, and more than half of the state’s public school districts and 27% of its public schools are located in rural areas (authors’ calculations using National Center for Education Statistics [NCES] and Texas Education Agency [TEA] data, 2007). Recognizing the challenges rural districts face in providing broad curricular offerings and supplemental educational services to students, in 2007, the 80th Texas Legislature authorized the creation of a pilot program designed to provide technology-based supplemental educational services to rural school districts that show an overall academic need as demonstrated by their 2007 state accountability ratings. The Rural Technology (R-Tech) Pilot Program provides nearly $8 million in funding for technology-based supplemental education programs, including online courses, to students in Grades 6 through 12 in high-need, rural districts. In establishing R-Tech, Legislators called for the pilot program to be evaluated to assess its effectiveness, requiring an interim report in December 2008 and a final evaluation report in December 2010. The following results are drawn from the evaluation’s first interim report (Texas Center for Educational Research [TCER], December 2008). The interim report describes the characteristics of R-Tech districts and campuses, the students they enroll, and the teachers they employ. It presents baseline data on students’ academic outcomes and describes how districts plan to implement the R-Tech program in their schools. Report sections provide baseline information and are descriptive in nature. They provide important information about the context for and implementation of the R-Tech pilot program, but they do not comprise an assessment of the pilot’s effectiveness. A comprehensive evaluation report, due in December 2010, will evaluate the pilot program’s effectiveness, including its effect on students’ academic achievement and college readiness outcomes, as well as its cost effectiveness. Throughout the report, state averages calculated at the district level omit R-Tech districts, and averages calculated at the campus level omit R-Tech campuses and campuses characterized as elementary programs in the Academic Excellence Indicator System (AEIS) data files.
INTERIM EVALUATION FINDINGS
Characteristics of R-Tech Districts and Campuses
• In spring of 2008, 64 rural Texas districts were awarded Cycle 1 grants to implement the R-Tech Pilot Program. Across R-Tech districts, 115 schools are participating in the R-Tech program, including 63 high schools, 48 middle schools, 3 K-12 campuses, and 1 elementary school that includes sixth grade students.
• All R-Tech districts enrolled fewer than 5,000 students in 2006-07 (the year used to determine grant eligibility), but there was considerable range in district size. The smallest R-Tech district enrolled 183 students, and the largest enrolled 4,954 students. On average, R-Tech districts enrolled 1,643 students in 2006-07.
• R-Tech districts are widely distributed across the state. The largest percentage of R-Tech districts (14%) are located within the area served by the Education Service Center (ESC) Region 10 (Richardson), only two ESC regions (ESC Region 9, Wichita Falls, and ESC Region 19, El Paso) have no R-Tech districts.
• R-Tech districts lag state averages in terms of the proportion of districts receiving accountability of ratings of Exemplary or Recognized, but exceed the state average in the proportion of districts rated Academically Acceptable.
i
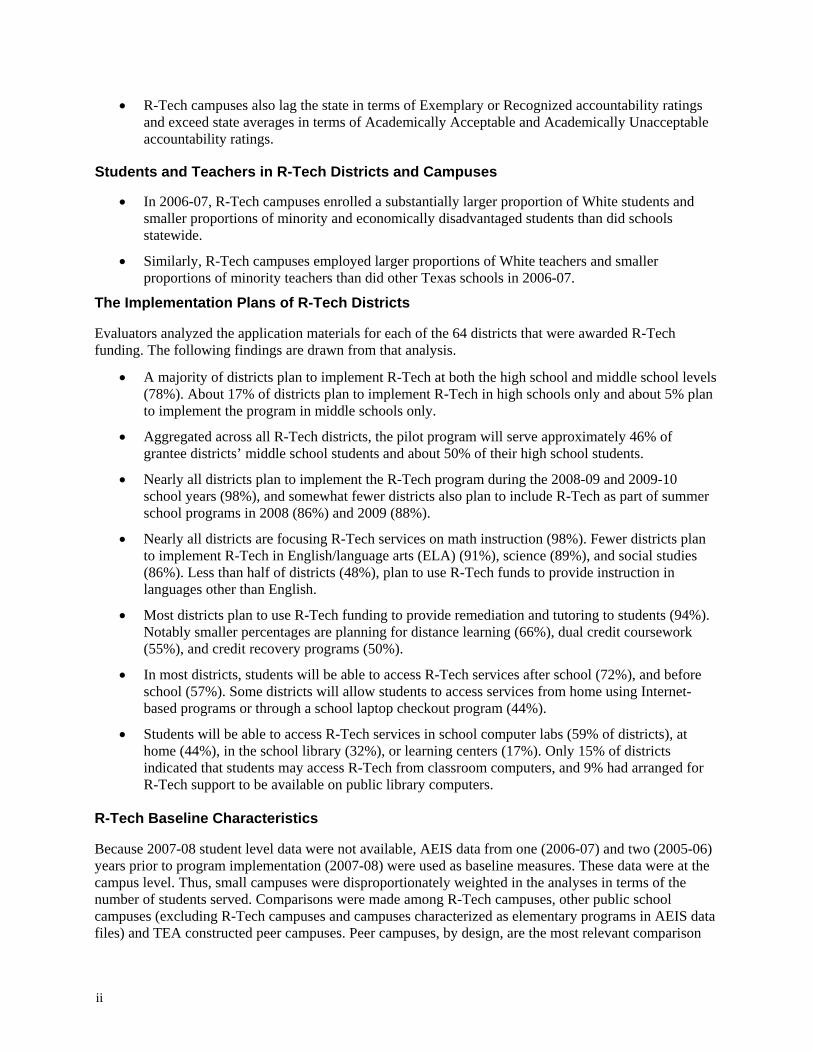
• R-Tech campuses also lag the state in terms of Exemplary or Recognized accountability ratings and exceed state averages in terms of Academically Acceptable and Academically Unacceptable accountability ratings.
Students and Teachers in R-Tech Districts and Campuses
• In 2006-07, R-Tech campuses enrolled a substantially larger proportion of White students and smaller proportions of minority and economically disadvantaged students than did schools statewide.
• Similarly, R-Tech campuses employed larger proportions of White teachers and smaller proportions of minority teachers than did other Texas schools in 2006-07.
The Implementation Plans of R-Tech Districts Evaluators analyzed the application materials for each of the 64 districts that were awarded R-Tech funding. The following findings are drawn from that analysis.
• A majority of districts plan to implement R-Tech at both the high school and middle school levels (78%). About 17% of districts plan to implement R-Tech in high schools only and about 5% plan to implement the program in middle schools only.
• Aggregated across all R-Tech districts, the pilot program will serve approximately 46% of grantee districts’ middle school students and about 50% of their high school students.
• Nearly all districts plan to implement the R-Tech program during the 2008-09 and 2009-10 school years (98%), and somewhat fewer districts also plan to include R-Tech as part of summer school programs in 2008 (86%) and 2009 (88%).
• Nearly all districts are focusing R-Tech services on math instruction (98%). Fewer districts plan to implement R-Tech in English/language arts (ELA) (91%), science (89%), and social studies (86%). Less than half of districts (48%), plan to use R-Tech funds to provide instruction in languages other than English.
• Most districts plan to use R-Tech funding to provide remediation and tutoring to students (94%). Notably smaller percentages are planning for distance learning (66%), dual credit coursework (55%), and credit recovery programs (50%).
• In most districts, students will be able to access R-Tech services after school (72%), and before school (57%). Some districts will allow students to access services from home using Internet-based programs or through a school laptop checkout program (44%).
• Students will be able to access R-Tech services in school computer labs (59% of districts), at home (44%), in the school library (32%), or learning centers (17%). Only 15% of districts indicated that students may access R-Tech from classroom computers, and 9% had arranged for R-Tech support to be available on public library computers.
R-Tech Baseline Characteristics Because 2007-08 student level data were not available, AEIS data from one (2006-07) and two (2005-06) years prior to program implementation (2007-08) were used as baseline measures. These data were at the campus level. Thus, small campuses were disproportionately weighted in the analyses in terms of the number of students served. Comparisons were made among R-Tech campuses, other public school campuses (excluding R-Tech campuses and campuses characterized as elementary programs in AEIS data files) and TEA constructed peer campuses. Peer campuses, by design, are the most relevant comparison
ii

group for R-Tech campuses because peer campuses serve similar student populations in terms of ethnic, economic, language, and mobility characteristics. Results of these comparisons are summarized below.
• In 2006-07, TAKS passing rates at R-Tech campuses were above state averages in mathematics, science, all tests taken, and reading/ ELA, equal to the state average in social studies, and slightly below in writing. Compared to peer campuses, R-Tech passing rates were slightly lower in all tested areas (two to three percentage points lower).
• In comparison with TAKS state grade-level averages, R-Tech high school grades (9th – 12th grade) performed from two to six percentage points higher. However, Grades 7 and 8 performed from one percentage point lower to two percentage points higher than state averages, and Grade 6 performed from one percentage point higher to four percentage points lower.
• In comparison with TAKS peer campus grade-level averages, R-Tech campuses performed below their peers in each tested area. The largest deficits were in mathematics and all tests taken and at Grades 6 through 8.
• The 2005-06 attendance rate at R-Tech campuses was slightly above the state average and slightly below the peer campus average.
• The 2005-06 R-Tech campus dropout rate at Grades 7 and 8 was lower than the state average but higher than the peer campus average. The R-Tech dropout rate at Grades 9 through 12 was also lower than the state average but higher than the peer campus average.
• From 2003 through 2006, the mobility rates at R-Tech campuses were about 13 to 15 percentage points lower than state averages, and about 3 to 4 percentage points higher than peer campus averages.
• Compared to peer campuses, R-Tech campuses had a slightly lower percentage of 2005-06 advanced course completions. However, compared to the state average, R-Tech campuses had a slightly higher percentage of advanced course completions.
• The 2005-06 R-Tech high school graduation rate was higher than the state graduation rate, but slightly lower than the peer campus rate. The 2005-06 R-Tech Recommended High School Program (RHSP) rate was slightly higher than the state rate, but lower than the peer campus rate.
• In 2005-06, the percentage of R-Tech seniors taking college entrance examinations was higher than the state average but lower than the peer campus average. SAT average scores in 2005-06 were highest for R-Tech campuses and lowest for the state average. ACT average scores were highest for peer campuses, followed by R-Tech campuses and the state average.
• The percentages of 2005-06 R-Tech graduates who were college-ready were slightly higher than state averages but lower than peer campus averages. This was true in mathematics, reading, and for both subjects combined.
In sum, R-Tech campuses lag the peer campuses in almost all performance comparisons. The R-Tech campuses have lower TAKS passing rates, attendance rates, advanced course completion rates, graduation rates, RHSP completion rates, and college readiness rates. In addition, R-Tech campuses have higher dropout rates and higher student mobility rates.
THE CONTINUING EVALUATION The evaluation of the R-Tech pilot program will extend through the 2008-09 and 2009-2010 school years. Future evaluation activities of the R-Tech pilot program will include surveys with administrators, teachers, and students; interviews with program staff; focus groups with teachers and students; site visits
iii

to a sample of R-Tech campuses; observations of R-Tech service delivery; and investigations of the impact of R-Tech services on student academic outcomes, the program’s cost effectiveness, and the sustainability of R-Tech services. The findings from these evaluations activities will be presented in the December 2010 evaluation report.
iv

THE TEXAS RURAL TECHNOLOGY (R-TECH) PILOT PROGRAM INTERIM EVALUATION REPORT
According to the Rural School and Community Trust (2007), the United States saw its overall public school enrollment grow by about 1% from 2002-03 to 2004-05, but enrollment in rural public schools grew by 15% for the same time period (Johnson & Strange, p. 1). While increases in rural public school enrollment may be attributed to a variety of factors, certain characteristics of rural schools may be attractive to parents and students. The National Center for Education Statistics (NCES), for example, reported that rural schools have higher levels of parental involvement and fewer student behavior problems than schools in other locales, and students attending rural schools have better academic outcomes than students in urban areas (2007, p. iv-v). Rural schools also confront some challenges, most notably in terms of staffing. Rural schools generally offer lower salaries than schools in other areas and employ fewer support staff, such as nurses and aides (Jimerson, 2004; NCES, 2007). The geographic isolation of rural communities makes it difficult to recruit and retain high quality teachers, and teacher shortages prompt many rural districts to rely on unqualified or out-of-field teachers in hard to staff courses. The lack of qualified teachers in rural areas limits the ability of many rural districts to provide a comprehensive curriculum, particularly at the high school level, and to provide supplemental educational support to students who need remediation, tutoring, and other services designed to increase academic achievement (Hobbs, 2004; Jimerson, 2003). Technology may provide a cost effective means to overcome many of the challenges faced by rural districts. Distance learning opportunities as well as online coursework and tutoring may enable rural districts to expand their curricular offerings and to provide supplemental support to struggling students. Further, technology-based teacher training opportunities may allow rural districts to improve the quality of teachers’ instruction (Cullen, Frey, Hinshaw, & Warren, 2004, 2006; Hobbs 2006; Wright & Lesisko, 2008). OVERVIEW OF THE TEXAS RURAL TECHNOLOGY PILOT Texas enrolls more students in rural public schools than any other state (Johnson & Strange, 2007). Eighteen percent of Texas’ more than 4.5 million public school students attend a rural public school, and more than half of the state’s public school districts and 27% of its public schools are located in rural areas (authors’ calculations using NCES and Texas Education Agency [TEA] data, 2007). Recognizing the challenges rural districts face in providing broad curricular offerings and supplemental educational services to students, in 2007, the 80th Texas Legislature authorized the creation of a pilot program designed to provide technology-based supplemental educational services to the state’s high-need, rural school districts. House Bill (HB) 2864 (80th Texas Legislature, Regular Session, 2007) authorized TEA to create the Rural Technology (R-Tech) Pilot Program, providing nearly $8 million in funding for technology-based supplemental education programs, including online courses, to students in Grades 6 through 12 in high-need, rural districts. R-Tech subsequently was incorporated in HB 2237 (80th Texas Legislature, Regular Session, 2007). In order to be eligible for R-Tech funding, districts must have enrolled fewer than 5,000 students, and must not have been located in a Standard Metropolitan Statistical Area (SMSA)1 as of January 1, 2007. R-Tech gives priority to districts with limited course offerings and to districts with high academic need as demonstrated by 2007 accountability ratings. Districts receive $200 per school year in state grant funding
1 SMSA is a term previously used by the U.S. government to describe a county or group of adjoining counties that contain at least one urbanized area with a population of 50,000 or more. After the 1980 U.S. census, SMSA was replaced with the term Metropolitan Statistical Area (MSA).
1

for each student receiving R-Tech services and are required to provide $100 per participating student per school year in matching funds. Districts may use High School Allotment (HSA) monies to provide matching funds at the high school level. R-Tech funding must be used to provide technology-based supplemental education services to students in Grades 6 through 12, and districts have discretion over which grade levels or combinations of grade levels will be served. R-Tech funds may be used to provide:
• Research based instructional support, • Teacher training, • Academic tutoring or counseling, • Distance learning opportunities in the core content areas or in foreign languages, and • Dual credit coursework in the core content areas or in foreign languages.
R-Tech requires that courses offered through distance learning or dual credit opportunities be linked to the Texas Essential Knowledge and Skills (TEKS). Because R-Tech funds supplemental instruction, its services must be offered outside of students’ regularly scheduled classes. Districts may offer services before or after school, during students’ free periods, on Saturdays, or at any other time when students are not receiving regular instruction. Access to R-Tech services must be provided for at least 10 hours each week, and districts are required to track how many hours students spend with R-Tech and report students’ average weekly usage to TEA. Further, each student who participates in the R-Tech program must be provided with a Personal Education Plan (PEP) that is used to measure individual achievement gains. Districts have considerable flexibility in how they implement the R-Tech program. In addition, to discretion over the grade levels served by R-Tech, districts have freedom to choose the types of services provided and their service providers. TEA published a list of agency-approved vendors for R-Tech and encouraged selections from the list, but districts may choose other vendors. Districts are limited, however, to the selection of two vendors—one at the high school level and another at the middle school level. Vendors provide a variety of educational services, including remediation and credit recovery programs, tutoring and counseling services, supplemental curricula, online or distance learning course offerings as well as professional development for teachers. Each R-Tech district is required to specify an R-Tech instructional facilitator. Facilitators must receive training in vendor products, monitor student PEPs, and track student use of R-Tech services. Districts that offer online or dual credit courses for high school students must provide an onsite facilitator to ensure that students understand and comply with program requirements. TEA posted a Request for Applications (RFA) early in 2008 and established a mid-March 2008 application due date. Selection of R-Tech districts was competitive and was guided by the following priorities:
• Representation of diverse geographical regions of the state, • Districts with the greatest need as indicated by their 2007 state accountability ratings, • Districts that demonstrated a readiness to implement R-Tech in terms of infrastructure, and • Districts in which large proportions of middle school and high school students would participate
in the program.
2

EVALUATION OF THE R-TECH PILOT In establishing R-Tech, Legislators called for the pilot program to be evaluated to assess its effectiveness, requiring an interim report in December of 2008 and a final evaluation report in December of 2010. This report comprises the interim R-Tech evaluation. Given the short implementation timeline at the time of its writing,2 the December 2008 report describes the characteristics of R-Tech districts and campuses, the students they enroll, and the teachers they employ. It presents baseline data3 on students’ academic outcomes and describes how districts plan to implement the R-Tech program in their schools. Report sections provide baseline information and are descriptive in nature. They provide important information about the context for and implementation of the R-Tech program, and while this report’s findings will inform the continuing study, they do not comprise an assessment of the pilot’s effectiveness. The comprehensive evaluation report, due in December 2010, will evaluate the pilot program’s effectiveness, including its effect on students’ academic achievement and college readiness outcomes as well as the cost effectiveness of the R-Tech program. Methodology and Data Sources The interim report relies on generally available campus- and district-level Academic Excellence Indicator System (AEIS) data for the 2006-07 school year. Analyses present summary information about school, student, and teacher characteristics as well as baseline academic outcomes for the 2006-07 school year. Results for R-Tech districts and campuses are compared to statewide averages. State averages calculated at the district level omit R-Tech districts, and averages calculated at the campus level omit R-Tech campuses. Because R-Tech is designed to serve students in Grades 6 through 12, campus-level averages also omit campuses characterized as elementary programs in the AEIS data files. Where appropriate, analyses make comparisons to TEA-identified peer comparison campuses, which are similar to R-Tech campuses in terms of students’ demographic and mobility characteristics.4
In addition, the report includes data collected through a document analysis of all grantee district applications (N=64). Application data provide information on district plans for implementation, including grades served, type of programs offered, vendor selections, and logistical information about how students may access R-Tech services. Study Limitations As noted in the previous section, findings included in this report are limited to analyses of 2006-07 AEIS data and data collected through a document analysis of grantee districts’ R-Tech applications. The data sources available for the interim evaluation create some limitations for the report.
2 R-Tech districts did not receive funding until March of 2008 and most districts began implementing the program in summer of 2008. 3Baseline indicators are measures of school characteristics and performance prior to program implementation. Such measures provide a “baseline” from which to assess program effects. 4 For each campus in the state, TEA has created a peer or comparison group of 40 public school campuses selected on the basis of six student demographic characteristics, including the percentages of African American, Hispanic, and White students, the percentage of economically disadvantaged students, the percentage of limited English proficient students, and the campus mobility rate (2007 Accountability Manual, TEA). For a specific performance indicator (e.g., TAKS score), TEA reports the median or middle value of the 40 comparison campuses on that indicator. For a specific profile indicator (e.g., number of students, mobility rate), TEA reports the mean or average value of the 40 comparison campuses on that indicator. Thus, peer groups allow for comparisons of campus performance and campus characteristics for schools that serve similar student populations.
3

AEIS data limitations. AEIS data are available for the 2006-07 school year, which is the year prior to R-Tech implementation. However, while AEIS Texas Assessment of Knowledge and Skills (TAKS) scores are for the 2006-07 school year, all other AEIS performance indicators are for the 2005-06 school year. While it is likely that 2005-06 and 2006-07 data trends persist in 2007-08, it is important to note the results presented in this report are for one and two years prior to R-Tech implementation. Student level data were not available for these analyses, and the available AEIS data represent campus averages. Using the campus as the unit of analysis disproportionately weights small campuses (R-Tech campus size ranges from 5 to 1,404 students with an average size of 411 students).5 Furthermore, indicator averages for small campuses are more susceptible to outlying values.6 Document analysis limitations. Variations in the information provided in districts’ R-Tech applications also create limitations for the evaluation. While all districts included some essential information in their applications (e.g., what grade levels would be served by R-Tech, where students would access R-Tech resources, etc.), there was considerable variation in the amount information districts provided in describing their planned programs. Some districts provided comprehensive descriptions of their programs, while others provided less information. Researchers have sought to present accurate information using R-Tech applications. To this end, the report notes where application summaries are based on data that are incomplete or rely on a reduced sample of respondents. Such missing information will be collected through surveys of R-Tech campuses conducted in the fall of 2008, spring of 2009, and spring of 2010. Structure of the Report The interim report contains the following sections:
• An overview of the R-Tech pilot that describes the program’s components and how districts were selected for participation in R-Tech;
• A description of the characteristics of R-Tech campuses and districts, including student and staff characteristics;
• A description of how districts plan to implement R-Tech; • A review of R-Tech performance indicators for the 2006-07 school year; • A summary of the report’s preliminary findings; and • A discussion of the evaluation’s continuing research activities.
CHARACTERISTICS OF R-TECH DISTRICTS AND CAMPUSES Sixty-seven Texas districts applied for Cycle 1 R-Tech funding and 64 received grant awards in spring of 2008. Within grantee districts, a total of 115 campuses participate in the R-Tech pilot. Of these, 63 are high schools, 48 are middle schools, 3 campuses serve K-12 students, and 1 campus is an elementary program that includes sixth grade students. While all R-Tech districts enrolled fewer than 5,000 students in 2006-07, there was a substantial range in district size, with the smallest district enrolling 183 students and the largest enrolling 4,954 students. On average, R-Tech districts enrolled 1,643 students and R-Tech campuses enrolled 411 students. Statewide, these averages are 3,861 and 615, respectively. 7 5 Using an extreme example, one student would contribute more to the school average at the campus serving 5 students than at the campus serving 1,404 students. 6 Consider a hypothetical student who scores 2400 on the SAT (perfect scores on the critical reading, mathematics, and writing sections). That student would have a larger influence on the average SAT composite score at the campus serving 5 students than at the campus serving 1,404 students. 7 State district average excludes R-Tech districts; state campus average excludes R-Tech campuses and campuses characterized as elementary programs in 2006-07 AEIS data files.
4

Statewide Distribution of R-Tech Districts Analysis of R-Tech districts by Education Service Center (ESC) region is a useful means by which to examine the distribution of the pilot program within the state. The Texas Education Code (TEC § 8.001) provides for the establishment of 20 regional ESCs throughout the state to assist districts with educational and operational matters. ESC’s regional boundaries are set by the Commissioner of Education and are designed such that each public school district has the opportunity to access to ESC services. Figure 1 maps the regions served by each of Texas’ 20 ESCs.
Figure 1. Texas’ Educational Service Center Regions Source: TEA, 2008
As presented in Table 1, R-Tech districts are widely distributed across the state, with the largest proportion (9 districts or 14%) located in the area served by the ESC Region 10 (Richardson). The only regions of the state that do not include R-Tech districts are those served by the ESC Region 9 (Wichita Falls) and ESC Region 19 (El Paso).
5

Table 1. R-Tech Districts by ESC Region
ESC Region Location Number of R-Tech
Districts Percentage of R-Tech
Districts Region 1 Edinburg 2 3.1% Region 2 Corpus Christi 3 4.7% Region 3 Victoria 1 1.6% Region 4 Houston 6 9.3% Region 5 Beaumont 5 7.8% Region 6 Huntsville 4 6.3% Region 7 Kilgore 6 9.3% Region 8 Mt. Pleasant 3 4.7% Region 9 Wichita Falls 0 0.0% Region 10 Richardson 9 14.1% Region 11 Ft. Worth 2 3.1% Region 12 Waco 3 4.7% Region 13 Austin 4 6.3% Region 14 Abilene 2 3.1% Region 15 San Angelo 2 3.1% Region 16 Amarillo 4 6.3% Region 17 Lubbock 1 1.6% Region 18 Midland 2 3.1% Region 19 El Paso 0 0.0% Region 20 San Antonio 5 7.8% Total 64 100.0% Source. 2006-07 AEIS data files.
2007 Accountability Ratings of R-Tech Districts and Campuses In addition to geographic diversity, R-Tech districts were selected because their 2007 accountability ratings indicated a need for educational services designed to improve student achievement. The following sections compare R-Tech district- and campus-level accountability ratings to statewide averages for the 2006-07 school year. District accountability ratings. Table 2 presents district level accountability ratings for R-Tech districts in 2007 as well as state averages. R-Tech districts lag state averages in terms of the highest ratings—no R-Tech district was rated Exemplary in 2007 compared with 2% of Texas districts and only 9% of R-Tech districts were Recognized compared with 18% of districts statewide. In contrast, 88% of R-Tech districts were rated Academically Acceptable compared to 69% of the state’s districts. R-Tech districts also lagged state averages in terms of the percentage of districts rated Academically Unacceptable. While about 6% of Texas districts received accountability ratings under the state’s alternative education accountability (AEA) procedures designed for districts that serve large proportions of students at risk of failure, no R-Tech district was characterized as an AEA district in 2007.
6
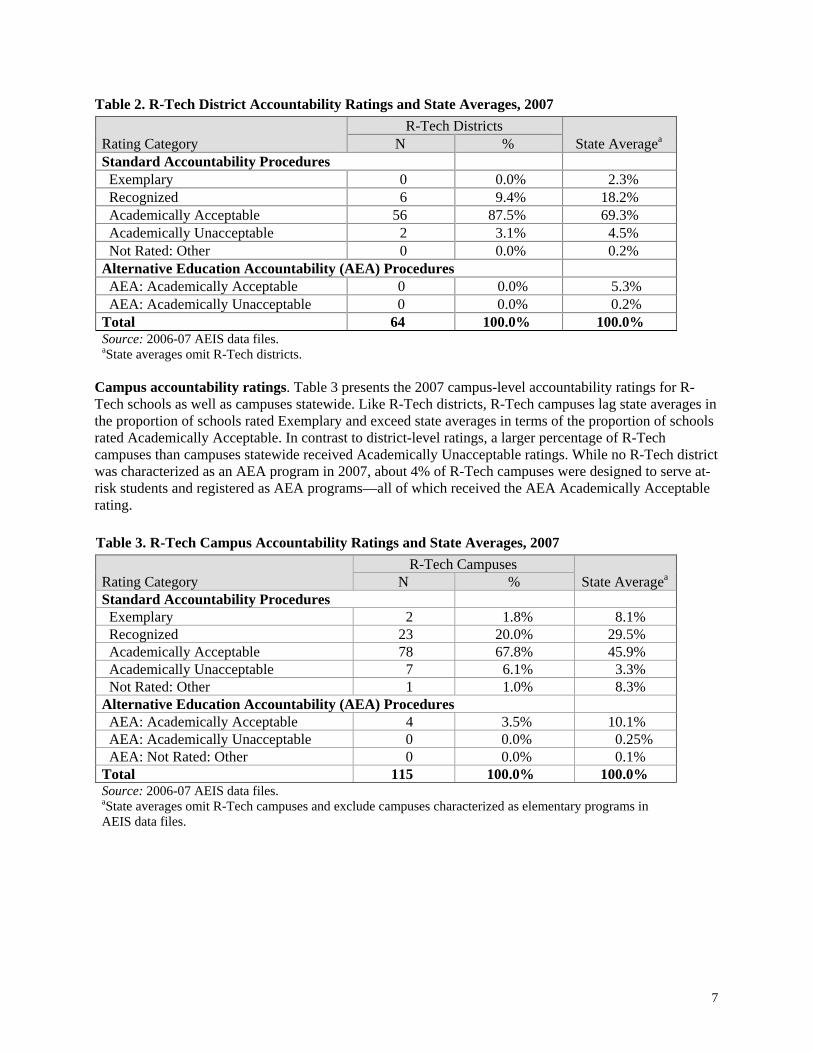
Table 2. R-Tech District Accountability Ratings and State Averages, 2007 R-Tech Districts
a State AverageRating Category N % Standard Accountability Procedures Exemplary 0 0.0% 2.3% Recognized 6 9.4% 18.2% Academically Acceptable 56 87.5% 69.3% Academically Unacceptable 2 3.1% 4.5% Not Rated: Other 0 0.0% 0.2% Alternative Education Accountability (AEA) Procedures AEA: Academically Acceptable 0 0.0% 5.3% AEA: Academically Unacceptable 0 0.0% 0.2%Total 64 100.0% 100.0%Source: 2006-07 AEIS data files. aState averages omit R-Tech districts.
Campus accountability ratings. Table 3 presents the 2007 campus-level accountability ratings for R-Tech schools as well as campuses statewide. Like R-Tech districts, R-Tech campuses lag state averages in the proportion of schools rated Exemplary and exceed state averages in terms of the proportion of schools rated Academically Acceptable. In contrast to district-level ratings, a larger percentage of R-Tech campuses than campuses statewide received Academically Unacceptable ratings. While no R-Tech district was characterized as an AEA program in 2007, about 4% of R-Tech campuses were designed to serve at-risk students and registered as AEA programs—all of which received the AEA Academically Acceptable rating. Table 3. R-Tech Campus Accountability Ratings and State Averages, 2007 Rating Category
R-Tech Campuses aState Average N %
Standard Accountability Procedures Exemplary 2 1.8% 8.1% Recognized 23 20.0% 29.5% Academically Acceptable 78 67.8% 45.9% Academically Unacceptable 7 6.1% 3.3% Not Rated: Other 1 1.0% 8.3%Alternative Education Accountability (AEA) Procedures AEA: Academically Acceptable 4 3.5% 10.1% AEA: Academically Unacceptable 0 0.0% 0.25% AEA: Not Rated: Other 0 0.0% 0.1%Total 115 100.0% 100.0%Source: 2006-07 AEIS data files. aState averages omit R-Tech campuses and exclude campuses characterized as elementary programs in AEIS data files.
7

STUDENT AND TEACHER CHARACTERISTICS IN R-TECH DISTRICTS
Student Characteristics
National statistics indicate that students attending rural schools are more likely to be White and less likely to be characterized as limited English proficient (LEP) than students in other locales. Nationally, rural schools enroll roughly similar proportions of special education students as other areas, and with the exception of suburban schools, rural schools enroll smaller proportions of economically disadvantaged students than other areas (NCES, 2007). As presented in Table 4, R-Tech campuses reflect national trends in terms of the types of students they enroll. Relative to state averages, R-Tech campuses enroll a notably larger percentage of White students, a smaller proportion of LEP students, a somewhat larger proportion of special education students, and a smaller percentage of economically disadvantaged students.
s
Table 4. R-Tech Student Information and Statewide Averages, a 2006-07Statewide
Student Group R-Tech Campuse Averagea
African American 9.2% 15.0%Hispanic 25.6% 42.9%White 64.2% 38.6%Other 1.0% 3.5%Economically disadvantaged 45.6% 48.9%Special education 13.8% 7.7%LEP 2.8% 11.9%Source: The AEIS 2007 campus data file aState averages omit R-Tech campuses and exclude campuses characterized aselementary programs in AEIS data files.
Teacher Characteristics National statistics indicate that rural districts tend to employ fewer teachers from ethnic minorities as well as more experienced teachers than districts in other locales (NCES, 2007). Table 5 presents the characteristics of teachers working on R-Tech campuses with state averages. Similar to rural schools nationally, teachers in R-Tech districts are less likely to be from an ethnic minority and tend to have more experience, on average, than teachers statewide. Relative to state averages, R-Tech districts employ a larger percentage of teachers with 11 or more years of experience, a smaller percentage of teachers with five or fewer years of experience, and about the same percentage of beginning teachers. A somewhat larger percentage of teachers in R-Tech districts have advanced degrees, and on average, R-Tech teachers work with smaller class sizes than do teachers statewide. In addition, R-Tech districts enjoy lower rates of teacher turnover than do schools statewide.
8

Table 5. Characteristics of Teachers Working on R-Tech Campuses, 2006-07
Teacher Characteristic R-Tech Campuses Averagea
13.4% 26.2%2.6% 9.7%
10.2% 14.7%86.6% 73.8%12.8 11.5
7.1 6.97.9% 9.3%
22.9% 27.0%17.3% 18.7%27.7% 23.9%24.1% 20.4%1.0% 1.4%
17.5% 15.9%$36,104 $36,830$43,864 $44,213
17.6% 21.5%11.8 13.0
Statewide
Minority teachersb
African American Hispanic White Teacher average years of experienceb
bTeacher tenure in yearsBeginning teachers 1-5 years experience 6-10 years experience 11-20 years experience More than 20 years experience Teachers with no degreec
Teachers with advanced degreesc
Average beginning teacher salaryb
Average teacher salaryb
Teacher annual turnover ratec
Students per teacher (average) b
Sources: 2007 TEA AEIS campus and district staff statistics file.aData are averages across districts and campuses. State averages calculated at the district level omit R-Tech districts, and averages calculated at the campus level omit R-Techcampuses and campuses characterized as elementary programs in AEIS data files.b2007 TEA AEIS campus staff statistics file. c2007 TEA AEIS district staff statistics file.
R-TECH IMPLEMENTATION PLANS Districts have considerable flexibility in how they implement the R-Tech program and are expected to tailor their supplemental educational programs to students’ specific academic needs and goals.8 In their grant applications, districts provided evidence of their technical readiness to implement R-Tech and described plans to support student access to at least 10 hours of technology-based supplemental instruction each week. Districts further described the types of supplemental instruction they planned to offer (e.g., dual credit, remediation and tutoring, distance learning), the content area focus of supplemental instruction, as well as the grade levels to be served by the grant. The following sections summarize information gathered through a document analysis of R-Tech district applications. Students Served by R-Tech Most of the 64 districts that received R-Tech grants planned to implement the program at both the middle school and high school levels (78%). However, 17% of districts planned to implement R-Tech solely for high school students, and about 5% planned R-Tech only for middle schools. In awarding R-Tech grants, TEA considered the proportion of district students who would be served by R-Tech. The grant application included a worksheet that districts used to calculate the proportion of students in Grades 6 through 8 and in Grades 9 through 12 to be served by R-Tech. Based on data
8 While districts enjoy flexibility in the implementation of R-Tech, they are required to implement the programs they describe in their grant applications.
9

gathered from application worksheets, districts plan to serve, on average, 46% of their middle school students and 50% of their high school students using R-Tech funds.
Overview of R-Tech Program Implementation
Researchers analyzed grantees’ applications for general information about how districts plan to implement R-Tech, including when districts will offer R-Tech during the school year, the subjects included in R-Tech, as well as the types of programming districts chose to offer.
R-Tech implementation by instructional period. R-Tech districts may choose to implement R-Tech during the school year, as a summer school program, or during both instructional periods. Grant funding became available to R-Tech districts in the spring of 2008 and districts may have first implemented the pilot as a summer program in 2008. Table 6 presents a summary of instructional periods in which districts plan to implement R-Tech and indicates that most districts (86%) planned to begin offering R-Tech services during 2008’s summer session. Nearly all districts plan to implement R-Tech during the course of the scheduled 2008-09 and 2009-10 school years (98% for each school year), and 88% plan to include R-Tech programming during summer 2009.
Table 6. R-Tech Implementation by Instructional Periods Number of Percentage of Districts
Implementation Period Districts (N=64) Summer 2008 55 86%Academic year 2008-2009 63 98%Summer 2009 56 88%Academic year 2009-2010 63 98%Source: Analysis of R-Tech district applications. Note. Percentages will not total to 100%. Districts may implement R-Tech during summer school and the regular school year.
Subject areas addressed by R-Tech. Districts may use R-Tech funding to provide supplemental educational services in the core subject areas—math, science, English/language arts (ELA), and social studies—as well as in languages other than English. As presented in Table 7, more than 85% of districts planned to implement R-Tech in each of the core subject areas, but less than half included a program in languages other than English. Most districts planned to implement R-Tech in at least two subject areas; however, three districts chose to focus exclusively on math. Of the core subjects, math was the area of greatest concern for R-Tech districts, with 98% of districts planning to use R-Tech funding to provide supplemental instruction in math. Somewhat fewer districts planned to offer support in ELA (91%), science (89%), and social studies (86%).
Table 7. Subject Areas Addressed by R-Tech Number of Percentage of Districts
Subject Areas Addressed by R-Tech Districts (N=64) Math 63 98%ELA 58 91%Science 57 89%Social studies 55 86% Languages other than English 31 48%Source: Analysis of R-Tech district applications. Note. Percentages will not total to 100%. Districts may implement R-Tech in more than one subject area.
10

Table 8. Types of Programs Implemented through R-Tech Percentage of Districts
R-Tech Program Type Number of Districts (N=64) Remediation and tutoring 60 94% Distance learning 42 66% Dual credit 35 55% Credit recovery 32 50% Source: Analysis of R-Tech district applications. Note. Percentages will not total to 100%. Districts may implement more than one type of program.
Types of programs implemented through R-Tech. R-Tech districts may choose to implement supplemental educational services in a variety of ways, including technology-based remediation and tutoring,9 credit recovery programs,10 dual credit coursework,11 and distance learning opportunities.12 Districts may choose to implement a different type of program at the middle school and high school levels. For example, a district may implement remediation and tutoring programs at the middle school and dual credit or credit recovery programs at the high school. Table 8 presents the percentage of districts implementing various types of supplemental instructional support. Results indicate that nearly all districts (94%) are using R-Tech funding to provide remediation and tutoring programs, and notably fewer districts are implementing distance learning (66%), dual credit (55%), and credit recovery programs (50%). Inconsistencies across district applications did not permit the disaggregation of program types across R-Tech middle schools and high schools.
When and Where R-Tech Services are Provided to Students When services are provided. Because R-Tech is designed to provide supplemental instruction, students must access R-Tech services outside of their regularly scheduled coursework. An analysis of districts’ R-Tech applications revealed that all district plan to allow students to access R-Tech services at multiple times (e.g., before and after school). Figure 2 illustrates that most districts planned to make R-Tech services available to students after (72%) or before (57%) regularly scheduled classes. About 44% of districts indicated that R-Tech services would be available to students at home, either through Internet-based coursework that students may access through home computers or through programs that permit students to access R-Tech software on a district laptop that they are able to take home. Smaller percentages indicated that students may access R-Tech during a study hall (24%) or free period (20%), on weekends (17%), or during a lunch period (13%). Less than 5% of districts planned to make R-Tech available to students during an advisory period, elective class, or during recess.
9 Remediation and tutoring programs provide additional support for students who are at-risk of failing or struggling with course content. 10 Credit recovery programs enable students to make up missing course credits and provide support for high school students seeking to graduate on time. 11 Dual credit courses provide students with an opportunity to earn high school credit for “successfully completing a college course that covers all the TEKS of any specified high school course” (TEA, 2007). 12 Distance learning refers to an instructional setting in which teachers and students are separated in space and/or time (U.S. Copyright Office, 1999).
11

Figure 2. When students may access R-Tech supplemental instruction. Source: Analysis of R-Tech district applications. Note. Percentages will not total to 100%. Districts may indicate more than one time for students to access R-Tech services.
Where services are provided. R-Tech districts also indicated a variety of locations at which students may access R-Tech’s supplemental instruction services. Of the 54 districts that indicated where they planned to offer R-Tech services, 81% indicated multiple locations (e.g., computer lab and at home). As shown in Figure 3, most districts planned to make R-Tech services available in the school’s computer lab (59%) and some districts (44%) indicated that students may access R-Tech on home computers through Internet-based programs or may take home laptops that contain R-Tech software. Less than a third of districts (32%) plan to provide access to R-Tech services in school libraries, and smaller percentages offer R-Tech in learning centers (17%) and regular classrooms (15%). Nine percent of districts have planned programs in which students may access R-Tech support through computers located in public libraries.
Figure 3. Locations identified for R-Tech supplemental instruction services Source: Analysis of R-Tech district applications. Note. Percentages will not total to 100%. Districts may indicate more than one place for students to access R-Tech services. Ten districts did not provide information about their planned locations for R-Tech services in their grant applications.
12

R-Tech Hardware and Software Selections
A majority of R-Tech districts (81%) indicated that they planned to purchase new computer hardware, including computers and smart boards (i.e., digital white boards), or to upgrade aging equipment in computer labs using R-Tech funds. Of the districts purchasing new hardware, 46% planned to purchase laptops that would enable students to access R-Tech services at home. R-Tech districts were permitted to select up to two software vendors—one vendor for the middle school and a second for the high school. Although applications were not always clear as to which vendor was chosen for which level of schooling, nearly all districts selected multidisciplinary software products that provided support for a range of subject areas (87%). Fourteen percent of districts selected ELA-specific software, and 10% chose programs focused on math instruction. Across R-Tech districts, 28 separate software vendors were selected to provide supplemental instruction. Table 9 presents software programs that were selected by at least three R-Tech districts. Seven districts did not indicate vendor selections in their application materials; therefore, the percentages presented in Table 9 are based on 57 of the 64 applications. As presented, the largest proportions of districts selected A+nywhere Learning System and PLATO Learning programs (about 14% or 8 schools chose each vendor). A+nywhere Learning System is a TAKS- and TEKS-aligned program that provides diagnostic assessments and self-paced tutorials in a broad range of subject areas. PLATO Learning provides self-paced remediation and credit-recovery programming for students in Grades 6 through 12 through online and distance learning formats. Beyond the selection of A+nywhere Learning System and PLATO, few districts had vendor selections in common, with four or fewer districts selecting each of the remaining programs.
Table 9. Selected Vendors for R-Tech implementation Number of Percentage of Districts
Vendor Districts (N=57)a
A+nyWhere Learning System 8 13.8%PLATO Learning 8 13.8%Achieve TeenBiz 3000 4 6.9%Compass Learning Odyssey 4 6.9% Epic Learning 4 6.9%NovaNET 4 6.9%Renaissance Learning 4 6.9%Agile Mind 3 5.2%Apangea 3 5.2%Apple 3 5.2%Ascend 3 5.2%New Century 3 5.2%Source: Analysis of R-Tech district applications. Note. Percentages will not total to 100%. Districts may select up to two vendors. aSeven districts did not indicate vendor selections in their R-Tech application materials.
Professional Development Opportunities Teachers in rural districts often experience reduced professional development opportunities because of their geographic isolation and the need to travel substantial distances in order to participate in out-of-district workshops or conferences. In order to offset these limitations, R-Tech funding may be used to increase the training available to teachers who work in rural districts. All R-Tech districts planned to
13

Table 10. R-Tech Professional Development Opportunities for Teachers
Professional Development Topic Number of Districts
Percentage of Districts (N=64)
Vertical alignment, collaboration, mentoring 18 28.1% Instructional technology 17 26.5% Best practices/pedagogy 15 23.4% Distance learning 12 18.7% Training in computer hardware 11 17.0% R-Tech pilot program 9 14.0% TEKS/TAKS preparation 9 14.0% Educating at-risk student groups 7 10.9% Dual credit opportunities 6 9.4% Multimedia training 5 7.8% Developing students’ Personal Education Plans (PEP) 5 7.8% Visiting other R-Tech sites 5 7.8% Multiple topics 60 93.8% Source: Analysis of R-Tech district applications. Note. Percentages will not total to 100%. Districts may indicate multiple training topics.
provide vendor-provided training designed to introduce teachers to software purchased with R-Tech funds, and many districts planned to offer additional professional development activities. Table 10, presents the training areas common across at least five district applications and includes training in vertical alignment (28%), instructional technology (27%), pedagogical best practices (23%), and distance learning (19%).
THE ACADEMIC PERFORMANCE OF R-TECH CAMPUSES
The following sections provide baseline data on R-Tech campuses’ academic performance. TAKS results are for the 2006-07 school year. Results for the other performance indicators are for the 2005-06 school year. Performance indicators include TAKS passing rates and commended performance rates, attendance, dropout, and mobility rates, advanced course completion rates, graduation rates, Recommended High School Program (RHSP) completions, college entrance examination results, and college readiness indicators. Reported values are averages of campus level measures for R-Tech campuses, the state (state average omitting R-Tech campuses and campuses characterized as elementary programs in AEIS data files), and TEA-identified peer campuses.
TAKS Performance
Campus-level comparisons. Table 11 and Figure 5 provide 2006-07 campus-level TAKS performance comparisons for students enrolled in R-Tech campuses. In the tested subject areas, overall TAKS performance in R-Tech schools is above state averages in mathematics, science, all tests taken, and reading/ELA, equal to the state average in social studies, and one percentage point lower in writing. Compared to peer campuses, R-Tech overall TAKS performance is slightly lower in all tested areas. R-Tech 2006-07 commended performance rates tend to be lower than state and peer campus averages. Compared to state averages, R-Tech commended performance rates are two or three percentage points lower in all tested areas. Compared to peer campus averages, R-Tech commended performance rates are the same in science but range from two percentage points lower in all tests taken to four percentage points lower in social studies and writing. When the percentages of students passing all TAKS tests are
14

15
compared across ethnic and economic groups, positive differences are found for R-Tech campuses. The percentages of African American, Hispanic, White, and economically disadvantaged students passing all TAKS tests at R-Tech campuses are from five to eight percentage points higher than state averages.
Table 11. Average 2006-07 TAKS Performance for R-Tech Campuses, Peer Comparison Campuses, and State Public School Campuses
Category
R-Tech Campus Average
Peer Campus Average
State Average
R-Tech - Peer
Differencea
R-Tech - State
Differencea
Students Passing TAKSAll Tests Taken 71% 73% 64% -2 +7
+1880
-1
-3 -2-3-3-2-3
7858
++
++++
Reading/ELA 88% 90% 87% -2 Mathematics 79% 81% 71% -2 Science 73% 76% 65% -3 Social Studies 87% 90% 87% -3 Writing 91% 93% 92% -2 Students Attaining Commended PerformanceAll Tests Taken 8% 10% 11% -2 Reading/ELA 27% 30% 29% -3 Mathematics 16% 19% 19% -3 Science 11% 11% 14% 0 Social Studies 30% 34% 32% -4 Writing 28% 32% 31% -4 Students Passing All Tests TakenAfrican American 61% NA 54% NAHispanic 67% NA 59% NA White 80% NA 75% NA Econ. Disadvantaged 65% NA 57% NA Source: Data are from 2006-07 AEIS campus TAKS files. Notes. Data are averages across campuses. State averages omit R-Tech campuses and exclude campuses characterized as elementary programs in AEIS data files. NA = Data are not available from the AEIS campus TAKS files. aThe R-Tech minus peer differences and the R-Tech minus state differences are in percentage points.

71%
88%
79%
73%
87%
91%
73%
90%
81%
76%
90%
93%
64%
87%
71%
65%
87%
92%
0% 10% 20% 30% 40% 50% 60% 70% 80% 90% 100%
All Tests Taken
Reading/ELA
Mathematics
Science
Social Studies
Writing
Percentage Passing
R-Tech Campuses Peer Comparison Campuses State Averages
Figure 5. Average campus-level 2006-07 TAKS passing rates of R-Tech campuses, peer comparison campuses, and state averages.
Grade-level comparisons. Comparisons by grade provide a more detailed examination of TAKS performance. In Table 12, the 2006-07 TAKS passing rates for R-Tech campuses are compared by content area, grade level, and comparison group. Grade-level comparisons for R-Tech campuses and state averages show that high school R-Tech campuses perform from two to six percentage points higher than state averages. However, middle school campuses perform from one percentage point lower to two percentage points higher than state averages. The exception is Grade 6 which performs four percentage points lower than the state average in mathematics and in all tests taken. Grade-level comparisons for R-Tech campuses and peer campuses show that R-Tech campuses are performing below their peers at all grade levels and in each tested area. The largest deficits are in mathematics and “all tests taken” and at Grades 6 through 8.
16

Table 12. Average 2006-07 TAKS Percentage Passing for R-Tech Campuses, Peer Comparison Campuses, and State Public School Campuses by Content Area and Grade Level
Grade
R-Tech Campus Average
Peer Campus Average
State Average
R-Tech - Peer
Differencea
R-Tech - State
Differencea
Reading/ELA6 91% 94% 90% -3 +1
-1+2+4+4+3
-40
-1+2+4+4
+2+4+6
+1+4+4
-1
-40
-1+2+4+4
7 84% 89% 85% -5 8 90% 92% 88% -2 9 89% 91% 85% -2 10 86% 89% 82% -3 11 91% 94% 88% -3 Mathematics6 73% 83% 77% -107 75% 81% 75% -6 8 70% 77% 71% -7 9 62% 67% 60% -5 10 66% 69% 62% -3 11 81% 84% 77% -3 Science8 72% 76% 70% -4 10 60% 62% 56% -2 11 80% 81% 74% -1 Social Studies8 87% 91% 86% -4 10 87% 91% 83% -4 11 94% 95% 90% -1 Writing7 92% 96% 93% -4 All Tests Taken6 71% 81% 75% -107 70% 75% 70% -5 8 59% 66% 60% -7 9 61% 66% 59% -5 10 52% 54% 48% -2 11 70% 73% 66% -3 Source: Data are from 2006-07 AEIS campus TAKS files. Notes. Data are averages across campuses. State averages omit R-Tech campuscharacterized as elementary programs in AEIS data files. aThe R-Tech minus peer differences and the R-Tech minus state differences are
es and exclude campuses
in percentage points.
17

Student attendance rates at R-Tech campuses are slightly above the state average and slightly below the peer campus average (see Table 13). R-Tech campuses exceed the state average by one percentage point and trail the peer campus average by eight tenths of a percentage point.
Table 13. 2005-06 Attendance Rates by Comparison Group
Group Attendance Rate R-Tech Campuses 94.8% Peer Comparison Campuses 95.6% State Average 93.8% Source: Data are from the 2006-07 AEIS campus non-TAKS performance indicators data file and are for school year 2005-06. Notes. Data are averages across campuses. State averages omit R-Tech campuses and exclude campuses characterized as elementary programs in AEIS data files.
Attendance Rates
Dropout Rates
The 2005-06 R-Tech campus dropout rates at Grades 7 and 8 and 9 through 12 are lower than state averages but higher than peer campus averages (See Table 14). The average R-Tech campus dropout rate for Grades 7 and 8 is lower than the state average by three tenths of a percentage point, but higher than the peer campus rate by two tenths of a percentage point. The Grades 9 through 12 dropout rate for R-Tech campuses is lower than the state average by one and six tenths percentage points but exceeds the peer campus average by seven tenths of a percentage point. Table 14. 2005-06 Dropout Rates by Comparison Group
Dropout Rate Dropout Rate Grades Grades Group 7 and 8 9 Through 12 R-Tech Campuses 0.2% 2.3% Peer Comparison Campuses 0.0% 1.6% State Average 0.5% 3.9% Source: Data are from the 2006-07 AEIS campus non-TAKS performance indicators data file and are for school year 2005-06. Notes. Data are averages across campuses. State averages omit R-Tech campuses and exclude campuses characterized as elementary programs in AEIS data files.
Student Mobility
A student is considered to be mobile if he or she has missed six or more weeks at a particular school. Campus student mobility is determined by dividing the number of mobile students during the school year by the number of students who were in membership at any time during the school year (2006-07 AEIS Glossary, TEA). Figure 6 shows the average campus mobility rates of R-Tech schools, peer campuses, and the state average (with R-Tech and elementary campuses removed) from 2003 through 2006. Students were less mobile at R-Tech campuses compared with state averages, but slightly more mobile than students at peer campuses. The mobility rates at R-Tech campuses were about 13 to 15 percentage points lower than the state average, but about 3 to 4 percentage points higher than the mobility rates at peer campuses.
18
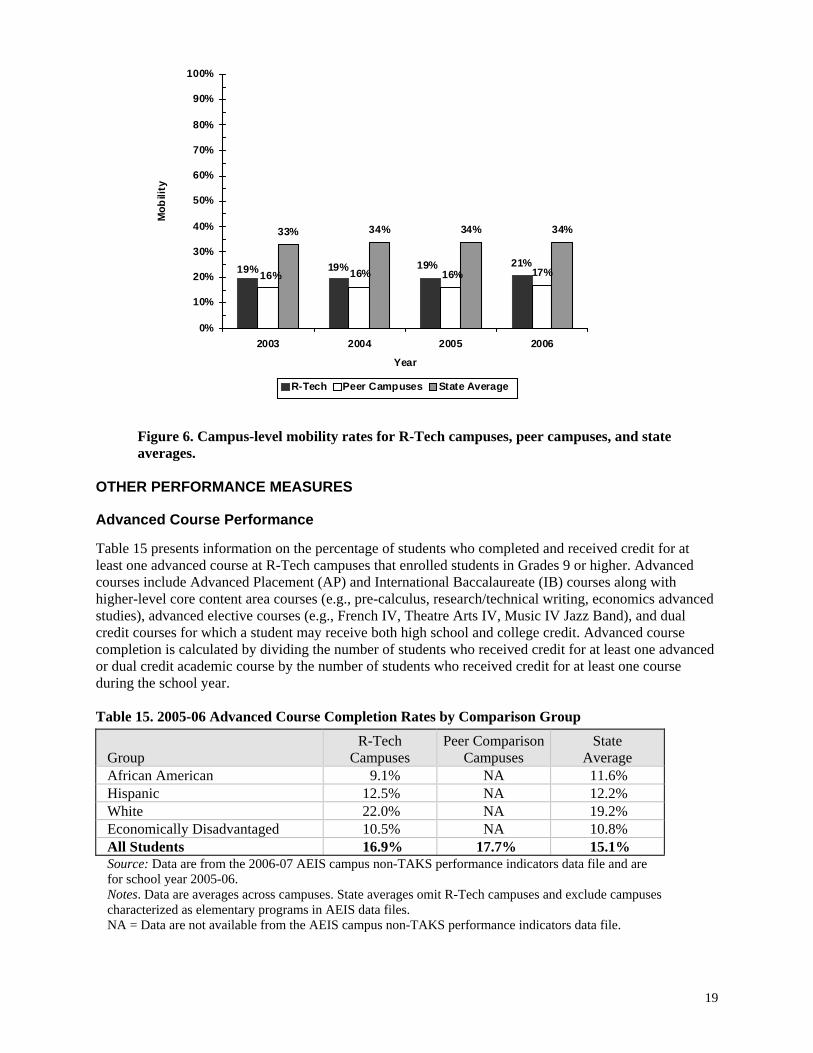
Figure 6. Campus-level mobility rates for R-Tech campuses, peer campuses, and state averages.
21%17%
33% 34% 34% 34%
19% 19% 19%16% 16% 16%
0%
10%
20%
30%
40%
50%
60%
70%
80%
90%
100%
2003 2004 2005 2006
Year
Mob
ility
R-Tech Peer Campuses State Average
OTHER PERFORMANCE MEASURES
Advanced Course Performance
Table 15 presents information on the percentage of students who completed and received credit for at least one advanced course at R-Tech campuses that enrolled students in Grades 9 or higher. Advanced courses include Advanced Placement (AP) and International Baccalaureate (IB) courses along with higher-level core content area courses (e.g., pre-calculus, research/technical writing, economics advanced studies), advanced elective courses (e.g., French IV, Theatre Arts IV, Music IV Jazz Band), and dual credit courses for which a student may receive both high school and college credit. Advanced course completion is calculated by dividing the number of students who received credit for at least one advanced or dual credit academic course by the number of students who received credit for at least one course during the school year.
Table 15. 2005-06 Advanced Course Completion Rates by Comparison Group
R-Tech Peer Comparison State Group Campuses Campuses AverageAfrican American 9.1% NA 11.6%
NA 12.2%NA 19.2%NA 10.8%7.7% 15.1%1
Hispanic 12.5%White 22.0%Economically Disadvantaged 10.5%All Students 16.9%Source: Data are from the 2006-07 AEIS campus non-TAKS performance indicators data file and are for school year 2005-06. Notes. Data are averages across campuses. State averages omit R-Tech campuses and exclude campuses characterized as elementary programs in AEIS data files. NA = Data are not available from the AEIS campus non-TAKS performance indicators data file.
19

Compared to peer campuses, R-Tech campuses have a slightly lower average of advanced course completions (about one percentage point lower). However, compared to the state average, R-Tech campuses have a slightly higher percentage of advanced course completions (two percentage points higher). R-Tech campuses also have similar or slightly higher percentages of advanced course completions for Hispanic, economically disadvantaged, and White groups. However, African American students at R-Tech campuses completed advanced courses at a slightly lower rate than the state average.
Graduation and Recommended High School Program Completion Rates
Outcome measures such as graduation rates and State Board of Education (SBOE) Recommended High School Program (RHSP)13 completion rates also reflect on student and campus performance. Findings on these measures by comparison group are presented in Table 16. The 2005-06 R-Tech high school graduation rate was higher than the state overall, but slightly lower than the peer campus rate. Specifically, the R-Tech graduation rate was 88%, while the state rate was 78%, and the peer campus rate was 89%. Another measure of academic readiness is the RHSP completion rate. In 2005-06, the RHSP required 24 credits and more rigorous elective courses (e.g., fine arts, languages other than English) than the 22-credit minimum graduation plan.14 Compared to the state average, a slightly higher percentage of R-Tech students completed the RHSP in 2005-06. Compared to peer campuses, a lower percentage of R-Tech students completed the RHSP in 2005-06. Table 16. 2005-06 Graduation Rates and Recommended High School Program Completion Rates by Comparison Group
Graduation RHSP Completion Rate Group Rate R-Tech Campuses 87.6% 67.8% Peer Comparison Campuses 89.4% 74.1% State Average 78.1% 66.7% Source: Data are from the 2006-07 AEIS campus non-TAKS performance indicators data file and are for school year 2005-06. Notes. Data are averages across campuses. State averages omit R-Tech campuses and exclude campuses characterized as elementary programs in AEIS data files. The graduation rate at a campus is calculated by dividing the number of students who received a high school diploma by the end of the cohort’s graduation year by the number of students in the original cohort. The RHSP rate is calculated by dividing the number of graduates with graduation codes for Recommended High School Program or Distinguished Achievement Program by the number of graduates.
College Entrance Examinations
College entrance examination scores are reported to TEA; the agency then reports the percentage of students taking examinations and average examination scores by campus. Data are reported when students are scheduled to be seniors, regardless of when examinations are taken. One factor that may influence college entrance examination results is the percentage of students taking the examinations. Lower percentages of students taking the examinations may be associated with higher average scores. As presented in Table 17, the percentage of R-Tech seniors taking college entrance examinations was 60% in 2005-06. This was higher than the state average (55%) but lower than the peer campus average (66%). SAT average scores were highest for R-Tech campuses (979 compared with 976 for peer campuses and 962 for the state). ACT average scores were highest for peer campuses (20.0), followed by R-Tech campuses (19.8) and the state (19.6). 13 See http://www.tea.state.tx.us/teks/handbook/gradreq.pdf for the Recommended High School Program graduation requirements. 14 Texas expanded the RHSP to include 26 credits in 2007-08.
20

Table 17. 2005-06 SAT and ACT College Entrance Examination Scores by Comparison Group
Percentage Taking SAT or SAT ACT Group ACTa Average Average R-Tech Campuses 59.8% 979 19.8 Peer Comparison Campuses 65.7% 976 20.0 State Average 54.8% 962 19.6 Source: Data are from the 2006-07 AEIS campus college admissions, college-ready graduates data file and are for school year 2005-06. Notes. Data are campus averages across students who took the SAT or ACT. State averages omit R-Tech campuses and exclude campuses characterized as elementary programs in AEIS data files aThe percentage is calculated by dividing the number of graduates who took either the SAT or ACT by the number of non-special education graduates.
College Readiness
The 2006-07 AEIS data included a new indicator of college readiness, the percentage of college-ready graduates. This indicator is a measure of progress toward preparation for postsecondary success. To be considered college-ready as defined by this indicator, a graduate must have met or exceeded specified criteria on the exit-level TAKS test, or the SAT, or the ACT. These criteria are listed in Table 18.
Table 18. College-Readiness Indicators and Criteria for the Class of 2006 Subject Exit-level TAKS SAT ACT
ELA >= 2200 scale score on ELA test AND a “3” or higher on the essay
OR >=500 on Critical Reading AND >=1070 Total
OR >= 19 on English AND >= 23 Composite
Mathematics >= 2200 scale score on mathematics test
OR >=500 on Math AND >=1070 Total
OR >= 19 on Math AND >= 23 Composite
Source: AEIS Glossary, p.10, November 2007.
As Table 19 indicates, the percentages of 2005-06 R-Tech graduates who were college-ready were slightly higher than state averages but lower than peer campus averages. For example, in mathematics, 46% of R-Tech graduates were college ready compared to 45% across the state and 50% at peer campuses. In reading, 44% of R-Tech graduates were college ready compared to 42% across the state and 46% at peer campuses.
Table 19. 2005-06 College Readiness Indicators by Comparison Group College Ready College Ready College Ready Group Mathematics Reading Both Subjects R-Tech Campuses 45.6% 43.8% 28.8% Peer Comparison Campuses 49.9% 45.8% 32.0% State Average 45.1% 41.8% 28.4% Source: Data are from the 2006-07 AEIS campus college admissions, college ready graduates data file and are for school year 2005-06. Notes. Data are averages across campuses. State averages omit R-Tech campuses and exclude campuses characterized as elementary programs in AEIS data files.
21
SUMMARY Characteristics of R-Tech Districts and Campuses
In spring of 2008, 64 rural Texas districts were awarded Cycle 1grants to implement the R-Tech Pilot Program. Across R-Tech districts, 115 schools participate in the R-Tech program, including 63 high schools, 48 middle schools, 3 K-12 campuses, and 1 elementary school that includes sixth grade students. R-Tech districts are widely distributed across the state. The largest percentage of R-Tech districts (14%) are located within the area served by the ESC Region 10 (Richardson), only two ESC regions (ESC Region 9, Wichita Falls, and ESC Region 19, El Paso) have no R-Tech districts.
R-Tech districts lag state averages in terms of the proportion of districts receiving accountability of ratings of Exemplary or Recognized, but exceed the state average in the proportion of districts rated Academically Acceptable. R-Tech campuses also lag the state in terms of Exemplary or Recognized accountability ratings and exceed state averages in terms of Academically Acceptable and Academically Unacceptable accountability ratings.
Similar to statistics for rural schools nationally, R-Tech campuses enrolled a substantially larger proportion of White students and smaller proportions of minority and economically disadvantaged students than did Texas schools statewide in 2006-07. R-Tech campuses also employed larger proportions of White teachers and smaller proportions of minority teachers than the state average.
Districts’ Implementation of the R-Tech Program
Analysis of grant applications for the R-Tech Program indicates that most districts plan to implement R-Tech at both the high school and middle school levels (78%). About 17% of districts plan to implement R-Tech in high schools only and about 5% plan to implement the program in middle schools only. R-Tech districts plan to serve about 46% of their middle school students and about 50% of their high school students. Nearly all districts plan to implement the R-Tech program during the 2008-09 and 2009-10 school years (98%); somewhat fewer districts plan to include R-Tech as part of summer school programs in 2008 (86%) and 2009 (88%). Nearly all districts are focusing R-Tech services on math instruction (98%). Somewhat fewer districts plan to implement R-Tech in ELA (91%), science (89%), and social studies (86%). Less than half of districts (48%), plan to use R-Tech funds to provide instruction in languages other than English. A majority of districts plan to use R-Tech funding to provide remediation and tutoring (94%); smaller percentages are planning for distance learning (66%), dual credit coursework (55%), and credit recovery programs (50%). The most popular vendors were A+nyWhere Learning System and PLATO Learning (about 14% of districts selected each vendor). A+nyWhere Learning System provides tutoring and remediation, and PLATO is a credit recovery and tutoring program. Many districts (81%) also plan to use R-Tech funds to purchase new computer hardware in order to either upgrade aging systems or to enhance the technological resources already in place. Nearly half of the districts purchasing new hardware indicated they would purchase laptops (46%). The R-Tech program is designed to provide supplementary instruction that is offered outside of students’ regularly scheduled classes. A majority of districts will fulfill this requirement by providing access to R-Tech services after school (72%), and before school (57%). Students may access R-Tech services in school computer labs (59% of districts), libraries (32%), or learning centers (17%). Only 15% of districts indicated that students may access R-Tech from classroom computers, and 9% had arranged for R-Tech support to be available on public library computers. Some districts will allow students to access services
22

from home using Internet-based programs that students may access using home computers or through software loaded on school laptops that students may take home (44%). The Academic Performance of R-Tech Campuses
Because 2007-08 student level data were not available, AEIS data from one and two years prior to program implementation were used as baseline measures of R-Tech performance. Comparisons were made among R-Tech campuses, other public school campuses excluding R-Tech campuses, and TEA-identified peer campuses, which serve student populations that are similar to those served by R-Tech campuses. Comparisons to peer campuses generally favored the peer campuses. R-Tech campuses had lower TAKS passing rates and commended performance rates than peer campuses. R-Tech campuses also had a slightly lower attendance rate, a higher dropout rate, slightly lower advanced course completion rates, lower graduation and RHSP rates, and slightly lower percentages of college ready graduates. Comparisons to state averages were more favorable. While R-Tech campus commended performance rates were lower than state averages, R-Tech campus TAKS passing rates were mostly higher than state averages. Comparisons on other performance indicators to state averages generally favored R-Tech campuses. The R-Tech campus attendance rate was slightly higher, dropout rates and the mobility rate were lower, the advanced course completion rates were slightly higher, graduation and RHSP rates were higher, SAT and ACT scores were higher, and the percentage of college ready graduates was slightly higher. This result is notable given the R-Tech pilot program’s requirement that grant awards be made to rural districts that demonstrated an academic need for supplemental instructional services. THE CONTINUING EVALUATION The evaluation of the R-Tech pilot program will extend through the 2008-09 and 2009-2010 school years, and a final evaluation report will be published in December of 2010. The evaluation will include surveys of administrators and teachers on R-Tech campuses as well as students who receive R-Tech services. Researchers will conduct site visits to a sample of R-Tech campuses, interview program staff, and conduct focus group discussions with teachers who participate in the program and students who receive R-Tech services. Evaluators will also observe R-Tech service delivery, including dual credit coursework, before and after school enrichment programs, tutoring, and professional development. The evaluation will also examine the effect of R-Tech services on student academic outcomes and the program’s cost effectiveness. The December 2010 report will present information about how districts and campuses implement the R-Tech program, the challenges to implementation, how challenges are overcome, the cost effectiveness of R-Tech, and the sustainability of R-Tech services. The report will present students’ views on R-Tech services, including their satisfaction with technology-based coursework and teaching methods, as well as the challenges and benefits of program participation. In addition, the report will present findings from analyses of R-Tech’s effects on student outcomes, including TAKS and AP exam scores; attendance and graduation rates; as well as participation in advanced, dual credit, and distance learning courses.
23


REFERENCES
Cullen, T., Frey, T., Hinshaw, R., & Warren, S. (2004). Technology grants and rural schools: The power to transform. Paper presented at the annual meeting of Association for Educational Communications and Technology, Chicago, IL. In M. Simonson and M. Crawford (Eds.), Proceedings of the Association for Educational Communications and Technology’s 2004 International Conference in Chicago, IL Vol. 1. Retrieved on May 14, 2008 from: http://www.eric.ed.gov/ERICDocs/data/ericdocs2sql/content_storage_01/0000019b/80/1b/a8/20.pdf
Cullen, T., Frey, T., Hinshaw, R., & Warren, S. (2006). NCLB technology and a rural school: A case study. Rural Educator, v28 n1 p.9-16 Fall. Retrieved on May 14, 2008 from: http://www.eric.ed.gov/ERICDocs/data/ericdocs2sql/content_storage_01/0000019b/80/3c/71/f4.pdf
Hobbs, V. (2004). The promise and the power of distance learning in rural education. Arlington, VA: Rural School and Community Trust.
Jimerson, L. (2003, March). The competitive disadvantage: Teacher compensation in rural America. Arlington, VA: Rural School and Community Trust.
Jimerson, L. (2004, May). Teachers and teaching conditions in rural Texas. Arlington, VA: Rural School and Community Trust.
Johnson, J. & Strange, M. (2007, October). Why rural matters 2007: The realities of rural education growth. Arlington, VA: Rural School and Community Trust.
Texas Education Agency. (2007). Glossary for the Academic Excellence Indicator System, 2006-07 report. Austin, TX: Texas Education Agency, Division of Performance Reporting. Retrieved September 24, 2008, from http://www.tea.state.tx.us/perfreport/aeis/2007/glossary.html.
Texas Education Agency. (2007). 2007 accountability manual. Austin, TX: Texas Education Agency, Division of Accountability and Data Quality. Retrieved October 10, 2007, from http://www.tea.state.tx.us/perfreport/account/2007/manual/index.html.
Texas Education Agency. (2007). Frequently asked questions about dual credit. Austin, TX: Texas Education Agency. Retrieved November 10, 2008, from http://www.tea.state.tx.us/gted/Dual_Credit.
U.S. Copyright Office (1999, May). Report on copyright and digital distance education. Washington, D.C.: Author.
National Center for Education Statistics (2007). Status of Education in Rural America. Washington, D.C.: U.S. Department of Education.
Wright, R. & Lesisko, L. (2008). Technology infusion in a rural school system: A case study from Pennsylvania. Paper presented at the Annual meeting of the American Educational Research Association March 24-28, 2008, New York. Retrieved on May 14, 2008, from: http://www.eric.ed.gov/ERICDocs/data/ericdocs2sql/content_storage_01/0000019b/80/3d/42/8e.pdf
25