THE SYSTEM LEVEL CAUSES AND CONSEQUENCES OF FIELD OF STUDY MISMATCH Guillermo Montt Directorate for...
19
THE SYSTEM LEVEL CAUSES AND CONSEQUENCES OF FIELD OF STUDY MISMATCH Guillermo Montt Directorate for Employment, Labour and Social Affairs [email protected] ELS Seminar June 2015
-
Upload
ralf-morrison -
Category
Documents
-
view
217 -
download
0
Transcript of THE SYSTEM LEVEL CAUSES AND CONSEQUENCES OF FIELD OF STUDY MISMATCH Guillermo Montt Directorate for...
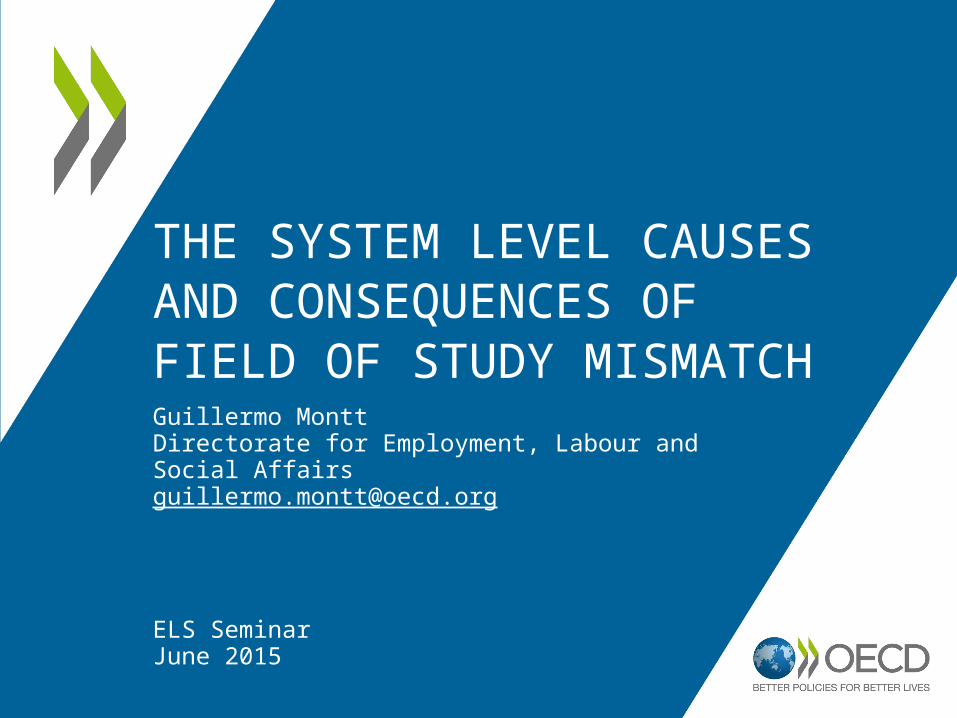
THE SYSTEM LEVEL CAUSES AND CONSEQUENCES OF FIELD OF STUDY MISMATCHGuillermo MonttDirectorate for Employment, Labour and Social [email protected]
ELS SeminarJune 2015

What is field-of-study mismatch?
“English Lit – How about you?”
E.g. • a pharmaceutical
technician (ISCO 321) is matched if studied science or health
• a ship and aircraft controller and technician (ISCO 325) if studied engineering only
• Theory: workers trained in a field but working in another, unrelated sector
• Operational definitionEight fields of study:
1) General programmes2) Teaching and education3) Humanities, languages, arts4) Social sciences, business, law5) Science, mathematics,
computing6) Engineering, construction,
manufacturing7) Agriculture and veterinary8) Health and welfare9) Services
Each ISCO_08 3-digit occupations matched to each field (one or more)
In PIAAC, if an individual works in an occupation that does not correspond to its field of study, the worker is considered mismatched by field of study

• Existing evidence:– For workers it brings lower wages, lower job
satisfaction, higher on-the-job search– More likely in certain fields than others (humanities,
languages and arts vs. health and welfare)
• Gaps in the literature:• Updated cross-national levels and effects of FoS
mismatch on individual outcomes• Relationship to other forms of mismatch• Relationship to labour market dynamics• System-level costs of FoS mismatch
Why should we care about studying field-of-study mismatch?
Should we care and/or do anything about field of study mismatch?

• PIAAC Survey of Adult Skills, 2012
• Data for 24 countries
• Cross-country and pooled-sample analysis– Pooled analysis rescales weights to consider
each country as a unit
• All analyses (OLS, logit, path analysis) consider replicate weights and plausible values (where applicable)
Data and methods

Kore
a
Engl
and/
N. Ir
elan
d (U
K)
Italy
Aust
ralia
Japa
n
Unite
d St
ates
Spai
n
Fran
ce
Russ
ian
Fede
ratio
n
Irela
nd
Pola
nd
Flan
ders
(Bel
gium
)
Coun
try A
vera
ge
Czec
h Re
publ
ic
Slov
ak R
epub
lic
Cana
da
Esto
nia
Denm
ark
Neth
erla
nds
Swed
en
Norw
ay
Aust
ria
Ger
man
y
Finl
and
0%
10%
20%
30%
40%
50%
60%
How much field-of-study mismatch is there?
Percentage of workers mismatched by field-of-study
Source: Survey of Adult Skills (PIAAC) (2012).

0%20%40%60%80%100%
How much field-of-study mismatch is there?
0% 20% 40% 60% 80% 100%
Note: Cross-country averages. Source: Survey of Adult Skills (PIAAC) (2012).
(2) Teacher training and education science
(3) Humanities, languages and arts
(4) Social sciences, business and law
(5) Science, mathematics and computing
(6) Engineering, manufacturing and construction
(7) Agriculture and veterinary
(8) Health and welfare
(9) Service
For a given group of graduates by field
For a given group of workers by occupation
>70% of graduates from humanities, languages and arts end up working in another sector
More than 40% of workers in the services sector come from other fields.

0%
20%
40%
60%
80%
100%
Field-of-study mismatch only Field-of-study and skills mismatchField-of-study and qualifications mismatch Field-of-study, qualifications and skills mismatch
How much field-of-study mismatch is qualifications mismatch?
Source: Survey of Adult Skills (PIAAC) (2012).
>50% field of study mismatch is independent of skills or qualifications mismatch
In some countries around half is associated with qualifications mismatch (usually over-qualification)
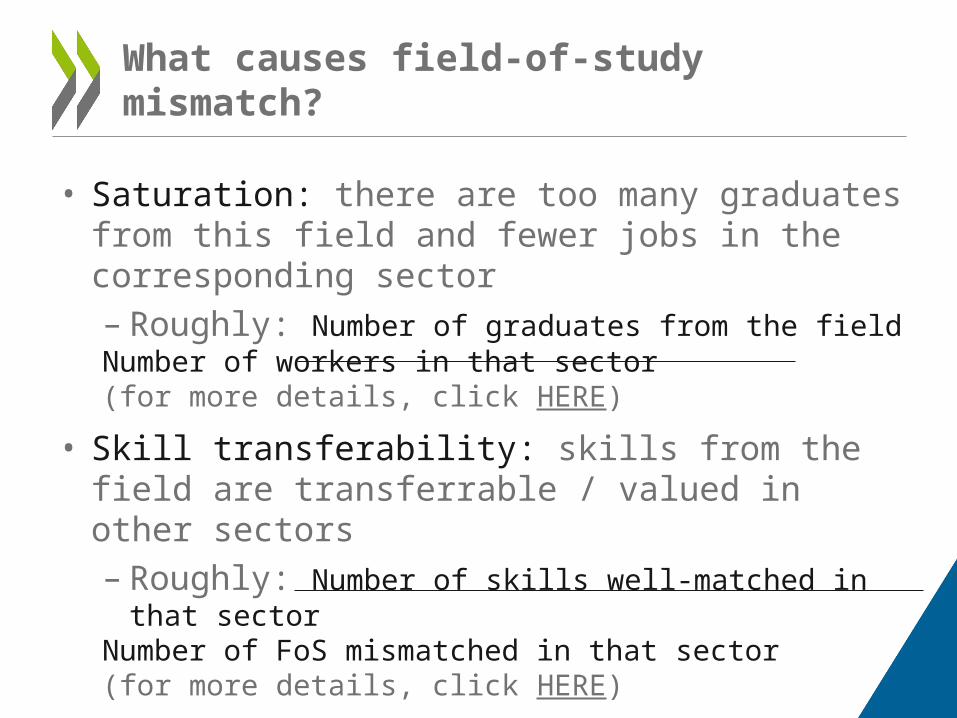
• Saturation: there are too many graduates from this field and fewer jobs in the corresponding sector– Roughly: Number of graduates from the field
Number of workers in that sector(for more details, click HERE)
• Skill transferability: skills from the field are transferrable / valued in other sectors– Roughly: Number of skills well-matched in that sector
Number of FoS mismatched in that sector(for more details, click HERE)
What causes field-of-study mismatch?

Does saturation and transferability predict field of study mismatch?
The short answer: YESGraduates from more saturated fields are more likely to be mismatched (and overqualified)
Graduates from fields with more transferability are more likely to be mismatched and well qualified
Results hold within countries as well
Note: Path analysis with country fixed effects. Source: Survey of Adult Skills (PIAAC) (2012).
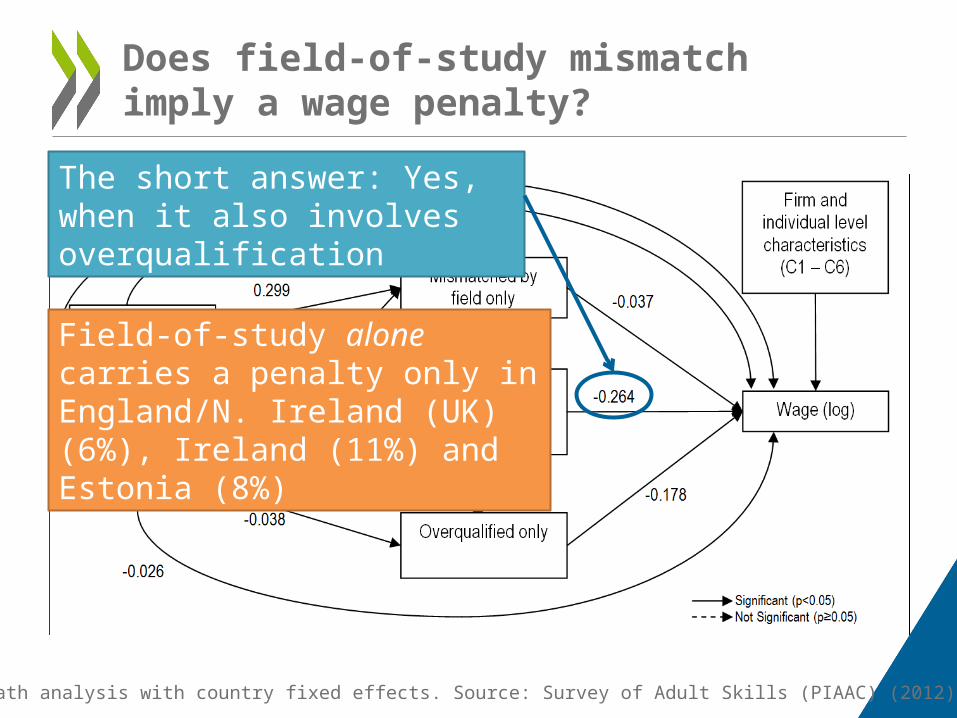
Does field-of-study mismatch imply a wage penalty?
The short answer: Yes, when it also involves overqualification
Note: Path analysis with country fixed effects. Source: Survey of Adult Skills (PIAAC) (2012).
Field-of-study alone carries a penalty only in England/N. Ireland (UK) (6%), Ireland (11%) and Estonia (8%)

Beta S.E.
Intercept 2.46*** (0.05)
Field of study mismatch only 0.05** (0.02)
x Skill transferability
x Major: (2) Teaching -0.09** (0.03)
x Major: (3) Humanities -0.06* (0.03)
x Major: (4) Social sciences -0.11*** (0.02)
x Major: (5) Sciences -0.07** (0.02)
x Major: (6) Engineering -0.04* (0.02)
x Major: (7) Agriculture 0.07 (0.04)
x Major: (8) Health -0.04 (0.02)Field of study mismatch and overqualification -0.04* (0.02)
x Skill transferability
x Major: (2) Teaching -0.24*** (0.03)
x Major: (3) Humanities -0.22*** (0.03)
x Major: (4) Social sciences -0.25*** (0.03)
x Major: (5) Sciences -0.23*** (0.03)
x Major: (6) Engineering -0.21*** (0.03)
x Major: (7) Agriculture -0.02 (0.04)
x Major: (8) Health -0.20*** (0.03)
The penalty varies by field
Linear regression with log(wages) as dependent variable. Services is the reference category for field of study. Models control for age, experience, tenure, contract type, public/private, firm size, numeracy, education level.
Source: Survey of Adult Skills (PIAAC) (2012)
The penalty is stronger when there is overqualification, particularly for Teaching, Humanities, Social Sciences, Sciences and Engineering

• Previously mismatched by field of study are more likely than previously well matched workers to be unemployed or inactive (18% vs. 14%)– Significant in 17/22 countries– ESP, KOR, NOR, USA: FoS mismatched workers have
over twice the odds of being unemployed or inactive– Once out of work, previously mismatched workers do
not spend more time out of work
• Job satisfaction is generally high (79%). FoS mismatched are less satisfied only if FoS mismatch implies overqualification– It remains significant in CAN, FIN, KOR, USA after
accounting for overqualification
Does field-of-study impact the risk of being out of work and job satisfaction?
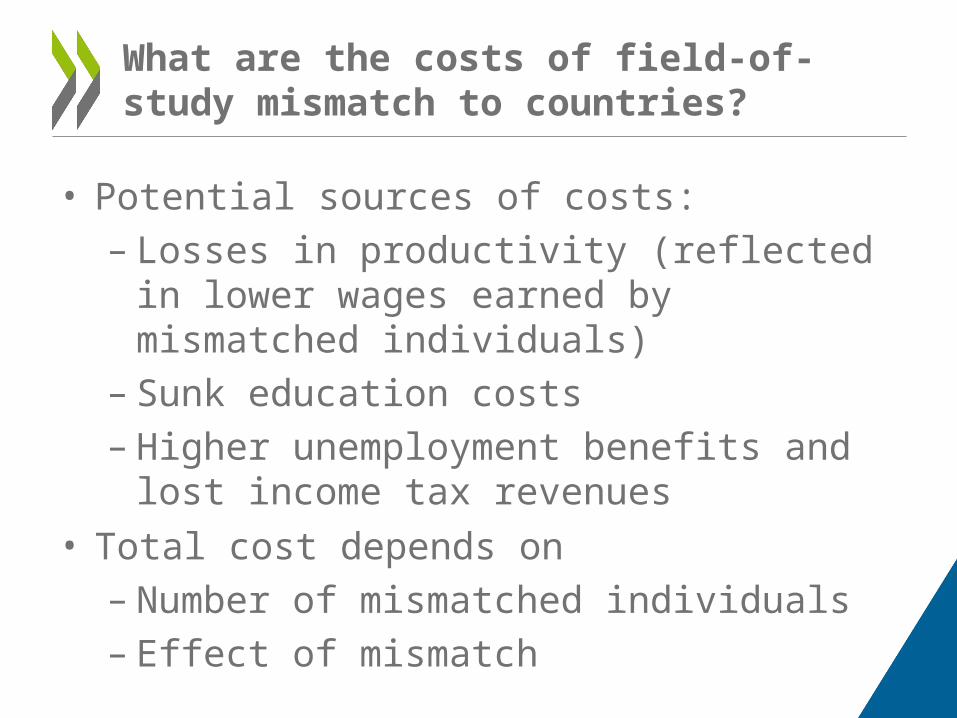
• Potential sources of costs:– Losses in productivity (reflected in lower
wages earned by mismatched individuals)– Sunk education costs – Higher unemployment benefits and lost
income tax revenues
• Total cost depends on– Number of mismatched individuals– Effect of mismatch
What are the costs of field-of-study mismatch to countries?

Engl
and/
N. Ir
elan
d (U
K)
Kore
a
Pola
nd
Irela
nd
Slov
ak R
epub
lic
Spai
n
Coun
try A
vera
ge
Czec
h Re
publ
ic
Neth
erla
nds
Japa
n
Italy
Flan
ders
(Bel
gium
)
Aust
ria
Denm
ark
Fran
ce
Swed
en
Norw
ay
Finl
and
-0.5%
0.0%
0.5%
1.0%
1.5%
2.0%
2.5%
3.0%Productivity Education Unemployment
The cost of field-of-study mismatch can amount to more than 1% of GDP
Percentage of GDP
Highest share of costs comes from productivity costs (wages), most of which result from the overqualification associated to FoS mismatch (assumes a 50-week work year)Sunk education costs assume that “lost” education amounts to ½ a year for ISCED 3 and 1 year for ISCED 5.

• FoS mismatch results from labour market dynamics (saturation / shortage) and programme characteristics (skill transferability)
• FoS mismatch is costly for individuals inasmuch it is a source of over-qualification
• Its costs (when it leads to overqualification) can aggregate to important national-level costs in terms of productivity and sunk education costs
The take-away point
“But Michael, the labour market is awaiting you!”
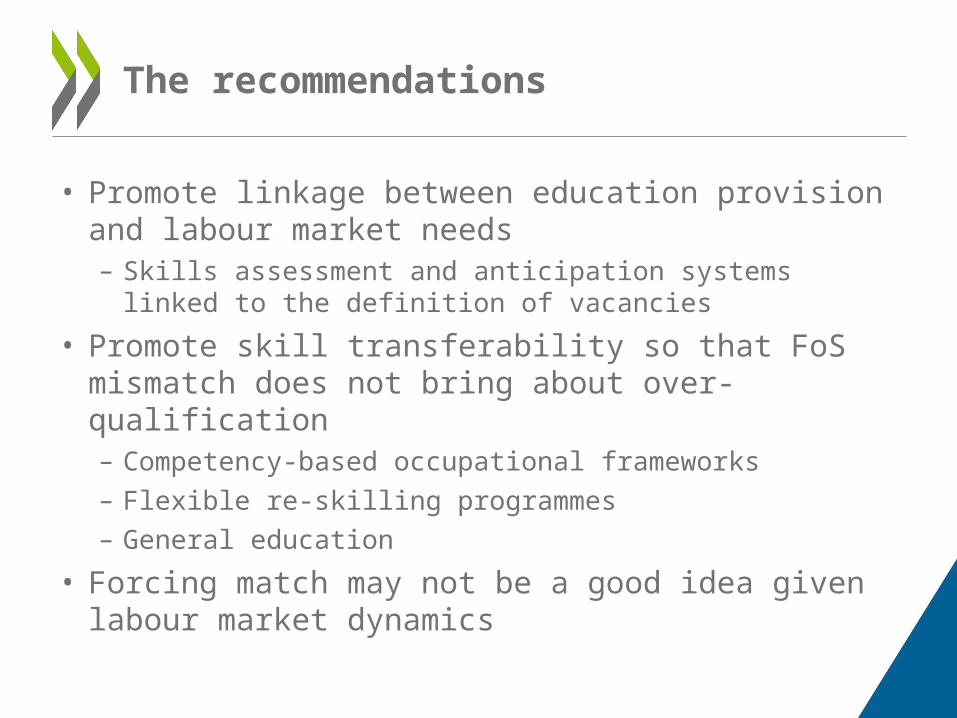
• Promote linkage between education provision and labour market needs– Skills assessment and anticipation systems linked to the
definition of vacancies
• Promote skill transferability so that FoS mismatch does not bring about over-qualification– Competency-based occupational frameworks
– Flexible re-skilling programmes
– General education
• Forcing match may not be a good idea given labour market dynamics
The recommendations

Contact: [email protected]
Read more about our work Follow us on Twitter: @OECD_Social
Website: www.oecd.org/els
Newsletter: www.oecd.org/els/newsletter
Thank you

• Logic: there are too many graduates from this field and fewer jobs in the corresponding sector– Saturation = Number of graduates from the field
Number of workers in that sector
– No one-to-one correspondence between field of study and sector
– Standardised with a mean 0, SD 1 for all country-field combinations
– Positive values indicate saturation greater than on average across fields
(back)
Saturation

• Logic: skills from the field are transferrable / valued in other sectors
Transferability= Number of skills well-matched in that sectorNumber of FoS mismatched in that sector
– No one-to-one correspondence between field of study and sector
– Interpreted as percentage of field mismatched workers in the sector that are not skills mismatched
(back)
Transferability