irp-cdn.multiscreensite.com¹... · irp-cdn.multiscreensite.com

2017/01/17 1
The System and Marginal Value of CSP in the SA IRP Time Horizon: The WWF SA Scenarios and NamPower
Macroeconomic Study
Dr Paul Gauché [email protected]
http://www.crses.sun.ac.za

Outline
2017/01/17 2
• Spatiotemporal approach
• Example: WWF 2030
• Example: NamPower

Resolving space
Image credit: Silinga, Rudman
2017/01/17 3

Solving in time
Load merit item & compute supply
fraction
Start year
Load 8760 hours solar, wind &
weather
Load 8760 demand hours
Configure all plants (capacity, availability merit, etc)
Demand met? Stop hour Start next hour
No
Yes
Year complete? Stop year
No Yes
Out of capacity?
No Yes Storage charging
logic (add to demand next
hour)
2017/01/17 4

Forecasting by probability Cost | account for wide range of futures probabilistically
0.0
0.5
1.0
0.50 0.52 0.54 0.56 0.58 Simple LCOE (R/kWh)
0.60 0.62 0.64
Prob
abili
ty
zero
avg Certain*
2017/01/17 5

CSP treatment
Storage Eg. 12 h
Turbine 100 MW
Collector Eg. SM=4
Hourly avg: DNI, Tamb & vwind
Grid
NodeGleocation Node
4
4
2
12
12
3 200
100
100 100
4
12
4
4
12 12
12 12
12 4
4
1
1
1
5
5
Nodal lumping provides further convenience without
losing precision
2017/01/17 6

The value of CSP in a high renewable 2030 South African energy system
SolarPACES 2015, Cape Town
Paul Gauché, Justine Rudman & Cebo Silinga. Stellenbosch University SolarPACES 2015 Cape Town 14 October, 2015
The value of CSP in a high renewable 2030 South African energy system
WWF RE VISION 2030
Stel
lio h
elio
stat
- im
age
copy
right
of s
bp g
mbh

The value of CSP in a high renewable 2030 South African energy system
Demand | scaling the entire yearly shape
30000
35000
40000
45000
65000 60000 55000 50000
Dem
and
(MW
)
Annual demand (TWh)
SolarPACES 2015, Cape Town 17 January 2017 - 8
Scenario Multiples
250 2010 n/a 358 WWF Low 1.430 407 WWF High 1.625 409 IRP Update 1.634 454 IRP 2010 1.816

The value of CSP in a high renewable 2030 South African energy system
WWF High | summer with poor sun event
0
10000
20000
30000
40000
50000
60000
24 25 26 27 Days of the year
28 29
Pow
er p
rodu
ctio
n an
d de
man
d (M
Wh)
OCGT Pumped storage
CCGT
CSP Coal
Hydro
Nuclear
City PV
Utility PV
Wind
Demand
SolarPACES 2015, Cape Town 17 January 2017 - 9

The value of CSP in a high renewable 2030 South African energy system
WWF High | summer with wind drop
0
10000
20000
30000
40000
50000
60000
32 33 34 35 36
Pow
er p
rodu
ctio
n an
d de
man
d (M
Wh)
Days of the year
OCGT Pumped storage
CCGT
CSP Coal
Hydro
Nuclear
City PV
Utility PV
Wind
Demand
SolarPACES 2015, Cape Town 17 January 2017 - 10

The value of CSP in a high renewable 2030 South African energy system
WWF High | transition to winter
0
10000
20000
30000
40000
50000
60000
92 93 94 95 96 97 Days of the year
98 99 100
Pow
er p
rodu
ctio
n an
d de
man
d (M
Wh)
OCGT
Pumped storage
CCGT
CSP
Coal
Hydro
Nuclear
City PV
Utility PV
Wind
Demand
SolarPACES 2015, Cape Town 17 January 2017 - 11

The value of CSP in a high renewable 2030 South African energy system
WWF High | deep winter
0
10000
20000
30000
40000
50000
60000
170 171 172 173 174 175 Days of the year
176 177 178
Pow
er p
rodu
ctio
n an
d de
man
d (M
Wh)
OCGT
Pumped storage
CCGT
CSP
Coal
Hydro
Nuclear
City PV
Utility PV
Wind
Demand
SolarPACES 2015, Cape Town 17 January 2017 - 12

The value of CSP in a high renewable 2030 South African energy system
Capacity | renewables, mid merit & peaking
Wind
Wind Wind Wind
PV
PV
PV PV
CSP
CSP
CSP CSP
CCGT CCGT
CCGT
CCGT
OCGT OCGT
OCGT OCGT
Pumped storage Pumped storage Pumped storage Pumped storage
SolarPACES 2015, Cape Town 17 January 2017 - 13
0%
10%
20%
30%
40%
50%
60%
70%
80%
90%
100%
IRP IRP Update WWF High WWF Low
Cap
acity
con
tribu
tion
(%)

The value of CSP in a high renewable 2030 South African energy system
Annual generation | renewables, mid merit & peaking
Wind Wind
Wind Wind
PV 30%
PV
PV PV CSP
CSP
CSP CSP
CCGT CCGT
CCGT CCGT
OCGT OCGT
OCGT OCGT Pumped storage Pumped storage
0%
10%
20%
40%
50%
60%
70%
80%
90%
100%
IRP IRP Update WWF High WWF Low
Annu
al p
rodu
ctio
n co
ntrib
utio
n (%
)
SolarPACES 2015, Cape Town 17 January 2017 - 14

The value of CSP in a high renewable 2030 South African energy system
Cost | each scenario probability costing
IRP Update WWF Low WWF High
0.5
IRP
SolarPACES 2015, Cape Town 17 January 2017 - 15
0
1
0.50 0.60 0.70 0.80 0.90 1.00 1.10 Cost of electricity (R/kWh)
1.20 1.30 1.40 1.50
Prob
abili
ty

The value of CSP in a high renewable 2030 South African energy system
Cost resilience | the final test
R 0.10
R 1.00
R 10.00
IRP 2010 system IRP update system
WWF High system WWF Low system
SolarPACES 2015, Cape Town 17 January 2017 - 16
IRP 2010 demand WWF High / IRP Update demand
WWF Low demand
Typi
cal c
ost o
f ele
ctric
ity (R
/kW
h)

WWF scenario findings
• CSP in balance offers two key system attributes
– Resilience to gas (and other fuel) price fluctuation
– Resilience to sudden demand changes (up and down)
• In WWF scenario, this caused 8 GW of CSP by 2030 to lead to the lowest cost system
2017/01/17 17

Towards Electricity Autonomy: Namibia’s Unique CSP Case Explored
Presenter: Paul Gauché
Contributors: Grant Muller (NP), Margaret Mutschler (NP), Elena Broughton (UE) & Karin Kritzinger (CRSES)

The solar resource 19
Towards Electricity Autonomy: Namibia’s Unique CSP Case Explored SolarPACES 2016 – Abu Dhabi

Demand 20
NamPow 2015/16
700 600 500 400 300 200 100
0 0 1000 2000 3000 4000 5000 6000 7000 8000 9000
Towards Electricity Autonomy: Namibia’s Unique CSP Case Explored SolarPACES 2016 – Abu Dhabi
Demand multiple demand growth [%/yr]
Year 1.5% 3.0% 4.0%
2020 107.7% 115.9% 121.7%
2025 116.1% 134.4% 148.0%
2030 125.0% 155.8% 180.1%
2035 134.7% 180.6% 219.1%

Generation options before 2020
Towards Electricity Autonomy: Namibia’s Unique CSP Case Explored SolarPACES 2016 – Abu Dhabi
21
Supply type / name Capacity [MW]
Notes
Ruacana hydropower 347 See river flow
Van Eck coal (4 x 27 MW) 108 Old, refurb for life extension, expensive due to coal transport
Backup generators 61 Expensive to run engines
Imports ~ 400 Various regional options
Wind IPPs ~ 50 At some level of approval
Solar PV IPPs ~160 At some level of approval
CSP ?
New coal ?
Backup / peaking ?

Hydro: P50 & P80 river flow 22
500 450 400 350 300 250 200 150 100 50 0
0 50 100 150 200 250 Year day from 1 June
300 350 400
Flow
rate
(m3/
s)
P80 (m3/s) P50 (m3/s) Min power level (all units) Max power level
Towards Electricity Autonomy: Namibia’s Unique CSP Case Explored SolarPACES 2016 – Abu Dhabi
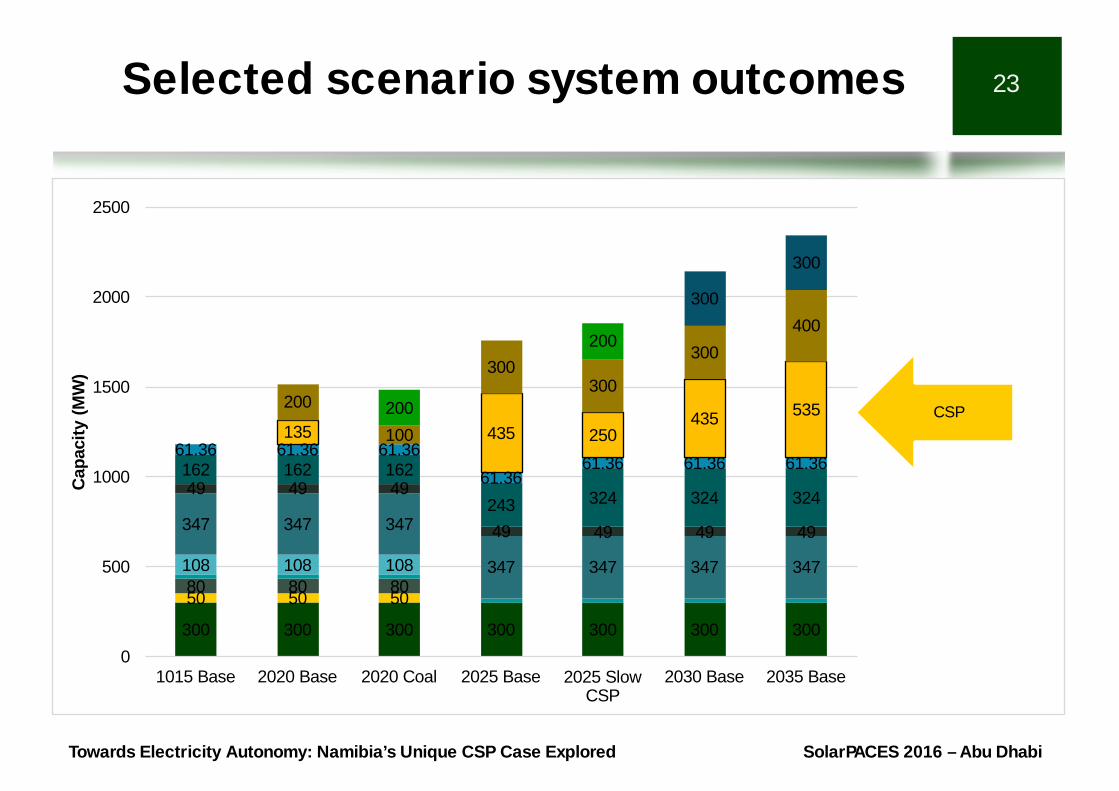
Selected scenario system outcomes 23
300 300 300 300 300 300 300
50 50 50 80 80 80 108 108 108
347 347 347
347 347 347 347
162 49
162 49
162 49
243 49
324
49
324
49
324
49
61.36 61.36 61.36 61.36
61.36 61.36 61.36
135 435 250 435 535 200
100
300 300
300 400
200
200
300
300
0
500
1000
1500
2000
2500
1015 Base 2020 Base 2020 Coal 2025 Base 2025 Slow CSP
2030 Base 2035 Base
Cap
acity
(MW
)
CSP
Towards Electricity Autonomy: Namibia’s Unique CSP Case Explored SolarPACES 2016 – Abu Dhabi

2020 – selected scenarios (lots of assumptions)
24
Base case
1.5% 4% Demand Demand CAGR CAGR
No CSP 200 MW Ruacana Ruacana Coal - CSP P80 P80 + 150 MW 200 MW
200MW CSP
Coal - Coal R- P80
Coal 1.5% CAGR
Coal 4% CAGR
Big PV and
backup
System cost high (N$/kWh) System cost low (N$/kWh)
Towards Electricity Autonomy: Namibia’s Unique CSP Case Explored SolarPACES 2016 – Abu Dhabi

2020 – selected scenarios (lots of assumptions)
25
0%
10%
20%
30%
40%
50%
60%
70%
80%
0
5 000
10 000
15 000
20 000
25 000
30 000
35 000
40 000
Rene
wal
be e
nerg
y ge
nera
tion
%
Uns
erve
d el
ectr
icity
(MW
h/ye
ar) Unserved electricity (MWh) Renewable %
Towards Electricity Autonomy: Namibia’s Unique CSP Case Explored SolarPACES 2016 – Abu Dhabi

GDP impact: PT vs. CR 26
Big picture: Either PT or CR will be good for Namibia (as first project)
Towards Electricity Autonomy: Namibia’s Unique CSP Case Explored SolarPACES 2016 – Abu Dhabi

Conclusion
• For different reasons in SA and Namibia, CSP offers value to the system
– Resilience at low system cost
– Macroeconomic advantage
• Thanks!
Paul Gauché – [email protected]
2017/01/17 27