
Drive - The Surprising Truth About What Motivates Us - By Daniel H. Pink

The Surprising Truth About
Your DR Maturity Level
Todd Scallan
VP, Product & Engineering
Daniel Kuperman
Sr. Manager Product Marketing

Agenda
Context: Why do we need DR maturity?
What is the DR maturity framework?
Example of DR maturity in action
How to calculate your company’s resiliency score
1
2
3
4
Wrap up and Q&A 5
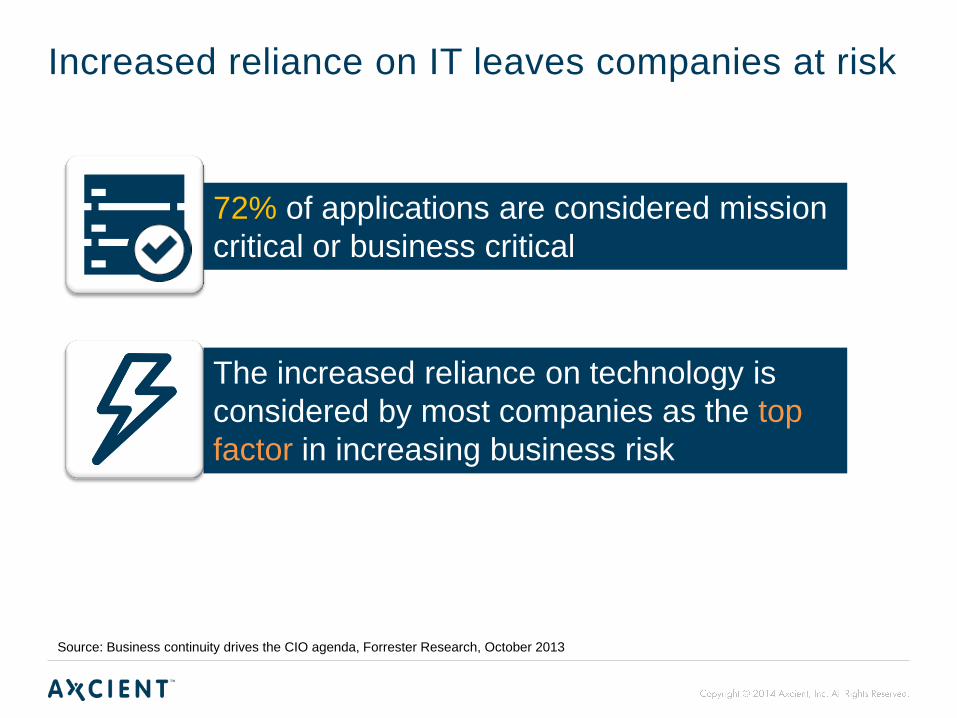
Increased reliance on IT leaves companies at risk
The increased reliance on technology is
considered by most companies as the top
factor in increasing business risk
Source: Business continuity drives the CIO agenda, Forrester Research, October 2013
72% of applications are considered mission
critical or business critical

A recent example is Superstorm Sandy
• New York Stock Exchange
closed for two days
• 25% of all mobile phone sites
across 10 states were down
• Cable operators reported 25%
broadband outages
• Walgreens — the drugstore
giant — was forced to close
1,400 stores
Image credit: RT.com

14%
24%
43.50%
50%
Weather
Power failure
Human error
SW / HWfailure +
network failure
Disaster Recovery Preparedness Benchmark Survey, 2014 Annual Report
But in fact, you shouldn’t worry about the next one Disasters are NOT the most common cause of application downtime

Maybe that is why companies fail to prepare
“Nearly 3 out of 4 companies worldwide are
failing in terms of disaster readiness”
Disaster Recovery Preparedness Benchmark Survey, 2014
1 in 5 companies lost one or more
critical applications over a period
of days
1 in 5
Losses from outages ranged from
a few thousand dollars to millions
of dollars
$$$ 36%
36% of organizations lost one or
more critical applications, VMs, or
critical data files for hours at a time

Especially when it comes to in-house initiatives
“What are the top challenges that you are facing with your in-house
disaster recovery infrastructure and processes?”
Source: Forrester Research
Lack of focus on DR relative to other IT projects
Not enough DR testing
Lack of funding to keep DR infrastructure up to date
Lack of DR skills in-house
Not confident in ability to respond to a real disaster
1
2
3
4
5

This is why we created the framework
Assess resiliency, not only for disaster scenarios, but also for the most
common causes of IT interruption
Involve other departments to discuss key
issues related to business continuity
Create a common language
among different stakeholders
Get agreement around the
company’s goals and required
IT improvements
Change the focus from backup and
recovery to company resiliency


Disaster Recovery Maturity Framework
Level 1 Level 2 Level 3 Level 4 Level 5
Re
co
ve
ry L
ike
lih
oo
d
Recovery Readiness
Ad Hoc
• Minimal or no backups
• No recovery plan
• Highest risk to
business
Reactive
• Elements of protection
• Disparate products
• Loose recovery plan
Prepared
• Clear recovery
procedures
• RPO & RTO understood
• Prone to surprises
Proactive
• Documented recovery
plan
• Proactive validation
• Good likelihood of
recovery
Resilient
• Recovery assured
• Integrated recovery plan
• Best likelihood of
recovery
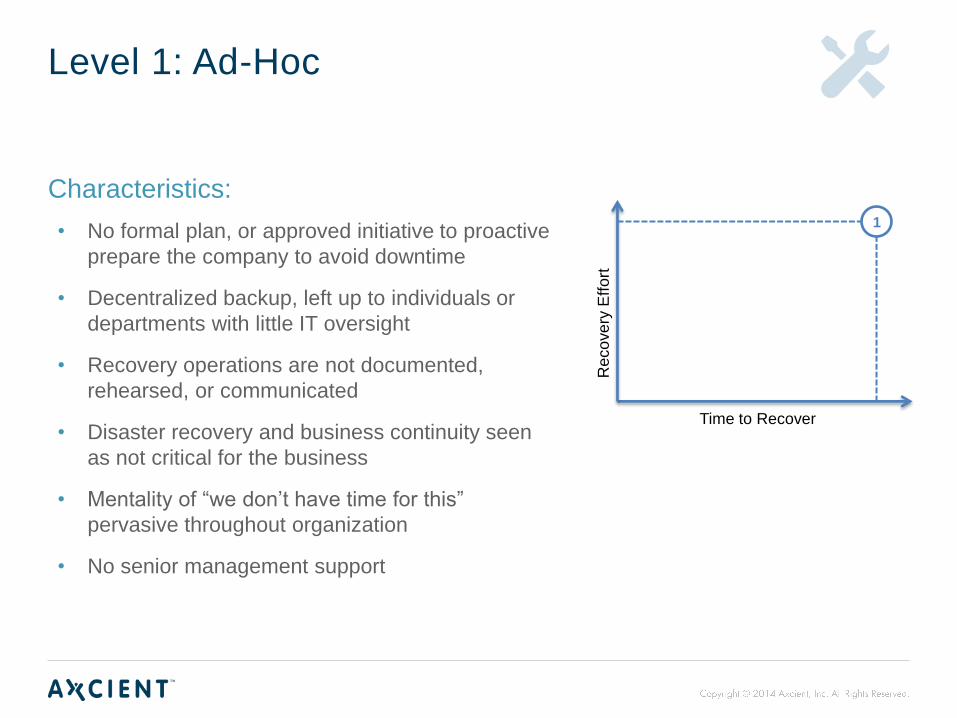
Level 1: Ad-Hoc
Characteristics:
• No formal plan, or approved initiative to proactive
prepare the company to avoid downtime
• Decentralized backup, left up to individuals or
departments with little IT oversight
• Recovery operations are not documented,
rehearsed, or communicated
• Disaster recovery and business continuity seen
as not critical for the business
• Mentality of “we don’t have time for this”
pervasive throughout organization
• No senior management support
Reco
ve
ry E
ffo
rt
Time to Recover
1

Level 2: Reactive
Characteristics:
• Some elements of protection exist (local backups
or remote copying of data)
• Multiple products, no overall strategy for DR
• Reactive recovery without documented steps
Reco
ve
ry E
ffo
rt
Time to Recover
2
1

Level 3: Prepared
Characteristics:
• Documented a plan with clear recovery
procedures
• Plan is aligned with business needs in terms of
recovery point and recovery time objectives (RPO
and RTO)
• Significant effort may still be required when
executing recovery operations
Reco
ve
ry E
ffo
rt
Time to Recover
2
1
3

Level 4: Proactive
Characteristics:
• A recovery plan exists
• Proactive validation of the plan is performed by
testing local recovery procedures and performing
periodic disaster drills
Reco
ve
ry E
ffo
rt
Time to Recover
2
1
3
4

Level 5: Resilient
Characteristics:
• The disaster recovery plan is fully integrated with
business continuity plans that are also in place
• Full organizational support towards DR activities
and initiatives
• Senior managers periodically attend plan
exercises as observers
• Onsite protection for data, applications, IT
infrastructure is available as well as off-site
capability to recover the entire IT infrastructure is
in place
• IT systems and business processes can be
returned to normal production well within RTO
Reco
ve
ry E
ffo
rt
Time to Recover
2
1
3
4
5

Additional Considerations for Maturity Levels
The following elements will help determine your DR maturity level
• Impact of application downtime
• RTO
• Protection architecture
• Protection scope
• Documentation
• Testing scope
• Testing frequency
• Organizational sponsorship

Case Study

Axcient: One Recovery-as-a-Service Platform
Vs.
vs.
Backup isn’t just about backup anymore, it’s about
improved resiliency – Forrester Research

One Snapshot, Multiple Recovery Options Local and cloud-based recovery

Example: Law Firm
IT ENVIRONMENT
10 Servers + VMs | Exchange Server Symantec Backup Exec to
Tape
Hurricane knocked down power for a week
CRITICAL EVENT
Florida-based law firm with 40 attorneys, 100+ employees
Level 1 Level 2 Level 3 Level 4 Level 5
Rec
ove
ry L
ike
lih
oo
d
Recovery Readiness
Ad Hoc Reactive Prepared
Proactive Resilient
“No one could work during that time. Every
hour down is thousands of dollars lost, so we
had to make a change.” – IT Manager

Example: Law Firm
IT ENVIRONMENT
10 Servers + VMs | Exchange Server Server replication
Power outage for ½ day
CRITICAL EVENT
Florida-based law firm with 40 attorneys, 100+ employees
Level 1 Level 2 Level 3 Level 4 Level 5
Rec
ove
ry L
ike
lih
oo
d
Recovery Readiness
Ad Hoc Reactive Prepared
Proactive Resilient

Example: Law Firm
IT ENVIRONMENT
10 Servers + VMs | Exchange Server Axcient
Recovery-as-a-Service
Upgrade of servers during production time
CRITICAL EVENT
Florida-based law firm with 40 attorneys, 100+ employees
Level 1 Level 2 Level 3 Level 4 Level 5
Rec
ove
ry L
ike
lih
oo
d
Recovery Readiness
Ad Hoc Reactive Prepared
Proactive Resilient
How to Calculate Your Readiness Score

1: Determine the Impact of Downtime
How will your company be affected by an interruption in operations?
Minor Impact Critical Impact
Small
Business Medium
Business Large
Business
$8,581
$686,250
$215,638
Average cost of downtime: $167K per hour
Sourc
e: A
berd
een G
roup

2: What is your RTO?
How quickly does your company need to get back fully operational to
minimize the impact?
Days Minutes / Seconds
Non-Profit
Publishing
Financial Services
Healthcare

3: Product architecture
What is the technology architecture of your current disaster recovery
solution?
TAPE
CD
DISK
SERVER
REPLICATION
CLOUD
Sp
eed
of
Reco
very
Comprehensiveness of Protection
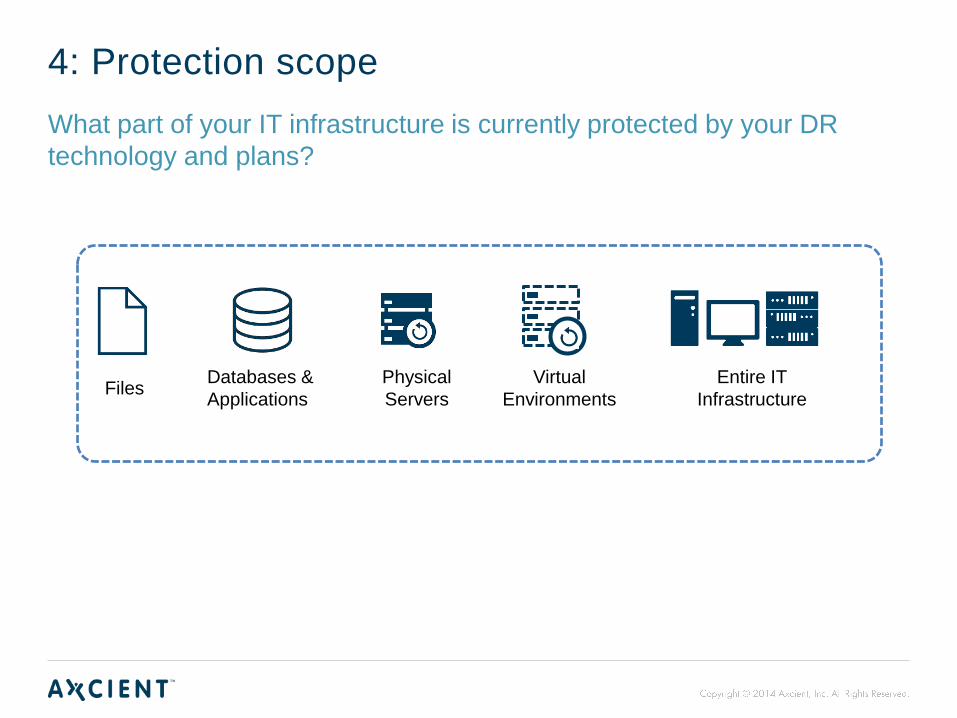
4: Protection scope
What part of your IT infrastructure is currently protected by your DR
technology and plans?
Files Databases &
Applications
Physical
Servers
Virtual
Environments
Entire IT
Infrastructure

5: Documentation
How well documented are your Disaster Recovery and Business
Continuity goals and procedures?
Sta
nd
ard
s a
nd
Be
st
Pra
cti
ce
s
Plan components
• Company DR policies
• DR plan documents
• Business impact analysis reports
• Risk assessment reports
• Exercise results
• IT DR procedures
• Supporting documents
TIP: Watch “Best Practices in Disaster Recovery Planning and Testing”
Axcient.com/resources

6: Testing scope and frequency
How often do you test your DR Plan and what is tested?
TIP: Watch “Best Practices in Disaster Recovery Planning and Testing”
Axcient.com/resources
Source: Disaster Recovery Preparedness Benchmark Survey, 2014

7: Organizational sponsorship
Is the Disaster Recovery and Business Continuity initiative supported by
the whole organization?
IT Individual
IT Leadership
Senior
Management
Company Wide

Readiness Score Calculator
What’s next
1. Calculate your score
• Send an email to [email protected] to
schedule a consultation and calculate your own
readiness score
2. Calculate your cost of IT interruption / downtime
• Go to axcient.com/downtime and use our online
calculator

Download the whitepaper
axcient.com/resources

For more information, visit axcient.com or call 800 715.2339
@Axcient linkedin.com/company/axcient axcient.com/facebook
Email [email protected] to calculate your company’s DR maturity score.