The Surfzone Heat Budget: The E ect of...
28
GEOPHYSICAL RESEARCH LETTERS, VOL. ???, XXXX, DOI:10.1029/, The Surfzone Heat Budget: The Effect of Wave 1 Heating 2 Gregory Sinnett and Falk Feddersen Scripps Institution of Oceanography, La Jolla CA 3 G. Sinnett, Scripps Institution of Oceanography, UCSD, 9500 Gilman Dr., La Jolla CA 92093- 0209 ([email protected]) F. Feddersen, Scripps Institution of Oceanography, UCSD, 9500 Gilman Dr., La Jolla CA 92093-0209 ([email protected]) DRAFT August 4, 2014, 8:54am DRAFT
Transcript of The Surfzone Heat Budget: The E ect of...
GEOPHYSICAL RESEARCH LETTERS, VOL. ???, XXXX, DOI:10.1029/,
The Surfzone Heat Budget: The Effect of Wave1
Heating2
Gregory Sinnett and Falk Feddersen
Scripps Institution of Oceanography, La Jolla CA3
G. Sinnett, Scripps Institution of Oceanography, UCSD, 9500 Gilman Dr., La Jolla CA 92093-
0209 ([email protected])
F. Feddersen, Scripps Institution of Oceanography, UCSD, 9500 Gilman Dr., La Jolla CA
92093-0209 ([email protected])
D R A F T August 4, 2014, 8:54am D R A F T

X - 2 SINNETT AND FEDDERSEN: SURFZONE HEAT BUDGET
Surfzone incident wave energy flux is dissipated by wave-breaking which4
through viscosity generates heat. This effect is not present in shelf heat bud-5
gets, and has not previously been considered. Pier-based observations of wa-6
ter temperature in 1–4 m depth, meteorology and waves are used to test a7
surfzone heat budget, which closes on diurnal and longer time-scales. Wave8
energy flux is the second most variable term with mean contribution 1/4 of9
the mean short-wave radiation. The heat-budget residual has semi-diurnal10
and higher frequency variability and net cooling. Cross-shore advective heat11
flux driven by internal wave events, rip currents and undertow contribute to12
this residual variability and net cooling. In locations with large waves, steeper13
beaches or less solar radiation, the ratio of wave energy flux to short-wave14
radiation may be > 1.15
D R A F T August 4, 2014, 8:54am D R A F T
SINNETT AND FEDDERSEN: SURFZONE HEAT BUDGET X - 3
1. Introduction
The nearshore (defined as ≤ 6 m water depth) region is ecologically and economically16
critical. Invertebrates, fish, and birds make their home in the nearshore. The region17
is a center of tourism and recreation, fueling economic activity. Nearshore waters are18
often impacted by poor water quality [Dorfman and Rosselot , 2009], creating health risks19
for bathers [e.g., Haile et al., 1999], thereby affecting coastal economies. The surfzone20
is the near-beach region where depth-limited wave-breaking occurs (with typical width21
Lsz = O(100) m, and depth typically twice the significant wave height). The region just22
seaward of the surfzone is denoted here as the inner-shelf. Thus, the nearshore includes23
both the surfzone and inner-shelf.24
Water temperature variations play a critical ecological role in the nearshore, and are25
linked to variation in mussel and barnacle growth rates [Phillips , 2005], egg-mass produc-26
tion rates of the coastal crab Cancer setosus [Fischer and Thatje, 2008], as well as barnacle27
recruitment rates [Broitman et al., 2005]. Temperature is also a tracer for nutrient deliv-28
ery to coastal waters [e.g., Omand et al., 2012]. Pathogen ecology in swimming waters29
is affected by temperature, including Staphylococcus [Goodwin et al., 2012], Enterroccus30
[Halliday , 2012], and Campylobacter [Hokajarvi et al., 2013].31
Previous nearshore temperature observations have typically been made using a vertical32
array to measure temporal variability and vertical structure [e.g., Winant , 1974; Pineda,33
1991]. Observations from the Scripps Institution of Oceanography (SIO) pier (La Jolla)34
in the Southern California Bight (http://cordc.ucsd.edu/projects/Piers/SIO/TChain/)35
reveal substantial temperature variability in 6 m water depth at high frequency (< 11 hr),36
D R A F T August 4, 2014, 8:54am D R A F T
X - 4 SINNETT AND FEDDERSEN: SURFZONE HEAT BUDGET
semi-diurnal (11-14.5 hr), diurnal (18-33 hr) and subtidal (> 33 hr) time-scales [as defined37
by Lerczak et al., 2003]. In water as shallow as 1.5 m, high-frequency nonlinear internal38
waves with 1◦C variation were observed on the summertime Dutch coast [van Haren et al.,39
2012]. However, the dominant processes governing surfzone temperature variability are40
not known, and a surfzone heat budget has never previously been studied.41
Heat budgets on the Northern California outer shelf (60-130 m water depth) show cross-42
shelf advection exports heat off shelf year-round [Lentz , 1987; Dever and Lentz , 1994].43
In shallower water (12-26 m) net cross-shore heat advection keeps shallow waters cooler44
than predicted by local surface heating [Fewings and Lentz , 2011]. This cross-shore heat45
advection is influenced at subtidal time scales by stratification, along-shelf winds [Austin,46
1999], and cross-shore wave-driven mass transport [Fewings and Lentz , 2011]. In addition,47
significant shelf temperature variations can be driven at diurnal time-scales by sea-breeze48
driven upwelling [e.g., Woodson et al., 2007] or solar heating [e.g., Davis et al., 2011],49
and also driven at semi-diurnal and shorter time-scales by internal waves [e.g., Omand50
et al., 2011; Walter et al., 2012].51
In contrast to the shelf, an additional process is unique to the surfzone heat budget.52
Incident wave energy flux Fwave, due to surfzone wave breaking, leads to turbulent dissi-53
pation [e.g., Feddersen, 2012a, b], which by viscosity converts mechanical energy to heat.54
In addition, incident waves can also drive surfzone currents, which are largely frictionally55
balanced [e.g., Feddersen et al., 1998], also generating heat. Incident Fwave is not fully56
converted into heat as there can be surfzone export of mechanical energy. However, as57
discussed in Section 5, this is much smaller than the incident Fwave.58
D R A F T August 4, 2014, 8:54am D R A F T

SINNETT AND FEDDERSEN: SURFZONE HEAT BUDGET X - 5
Observations from a cross-shore thermistor array mounted on the SIO pier (Section 2)59
are used to test a simplified surfzone heat budget (Section 3). The previously unconsidered60
wave energy flux term is significant and the binned-mean heat budget closes to first order61
(Section 4), although significant semi-diurnal and higher frequency variability in heat62
content is not resolved. The implications of wave energy flux heating of the surfzone,63
and cross-shore advective heat flux are discussed in Section 5. Results are summarized in64
Section 6.65
2. Experiment
A surfzone heat budget was tested with observations at the SIO pier for 47 days from66
June 6 – July 23, 2013. Six thermistors (Onset TidBit) were attached at z = −0.9 m67
below mean sea level to the north (shaded) portion of pier pilings at cross-shore (x)68
locations between x = 49 m and x = 216 m (where x = 0 m is at the mean low-tide69
shoreline) in mean water depths spanning h = 1.5 m to h = 4 m (Figure 1). The70
surfzone and inner shelf bathymetry profile (Figure 1) was measured on day 46 of the71
experiment by a jet ski bathymetry surveying system. Four specific thermistor locations72
are denoted, from onshore to offshore, as A, B, C, and D. An additional deeper thermistor73
was deployed at C, 1.6 m below the upper thermistor and was active for 20 days. Offshore74
surface water temperature was recorded at the Scripps Coastal Data Information Program75
(CDIP) mooring site 201 (location E) 1.2 km from shore in approximately 39 m water76
depth. Data was removed during extreme low tides (vertical extents > 0.69 m), when the77
thermistors might have been exposed to air (≈ 10% of all data).78
D R A F T August 4, 2014, 8:54am D R A F T

X - 6 SINNETT AND FEDDERSEN: SURFZONE HEAT BUDGET
Air temperature, humidity, winds, and tidal elevation were measured at the end of the79
SIO pier (near D). Incoming short-wave radiation also was measured on the SIO Pier80
with a LI-200SA Pyranometer sensor maintained by the SIO Climate Research Division.81
Hourly wave statistics, including significant wave height Hs, were provided by a virtual82
buoy (monitored and predicted points “MOP”) at the SIO pier, from the real-time CDIP83
spectral refraction wave model, initialized from offshore buoys [O’Reilly and Guza, 1991;84
O’Reilly and Guza, 1998]. This wave model has been used in studies of beach erosion85
[Yates et al., 2009] and shoreline ground motions [Young et al., 2013] in the Southern86
California Bight. During times when the pier-mounted SIO wave gauge was operational87
(May and late July to August 2013), the model demonstrates very high skill.88
3. Surfzone Heat Budget
The surfzone heat budget is written as a cross-shore and vertically integrated box model89
for heat content H, similar to a North Carolina inner-shelf heat budget in 13-26 m water90
depth [Austin, 1999]. With alongshore (y) uniform conditions, the surfzone heat content91
H (J m−1) in a region from the shoreline x = 0 to the fixed surfzone width x = Lsz is,92
H = ρcp
∫ Lsz
0
∫ 0
−h(x)
T (x, z) dz dx, (1)
where ρ is the density and cp is the specific heat capacity and h is the water depth. The93
upper-limit (z = 0 m) of the vertical integral is the mean sea surface. Heat content94
time-variation is driven by the total heat-fluxes Ftot into and out of the box, i.e.,95
dH
dt= Ftot. (2)
D R A F T August 4, 2014, 8:54am D R A F T

SINNETT AND FEDDERSEN: SURFZONE HEAT BUDGET X - 7
The total surfzone heat flux Ftot is,96
Ftot = (Qsw +Qlw +Qlat +Qsen)Lsz + Fwave + Fadv (3)
where the Q (W m−2) terms are surface vertical heat fluxes, consisting of the water-97
entering short-wave (Qsw) radiation, net long-wave (Qlw) radiation, and latent (Qlat) and98
sensible (Qsen) heat fluxes. As written in (3), theQ terms are assumed cross-shore uniform,99
but may differ between the surfzone, where waves are breaking, and farther offshore (but100
within the nearshore).101
The F terms in (3) are cross-shore heat fluxes (W m−1) evaluated at the surfzone bound-102
ary x = Lsz. The surfzone-specific cross-shore heat flux contribution from breaking surface103
gravity waves, Fwave (W m−1), as in (4) is considered here for the first time. For narrow-104
banded waves, the cross-shore wave energy flux at the surfzone boundary is105
Fwave =1
16ρgH2
s cg cos(θ), (4)
where g is gravity, cg is the group velocity at the peak frequency, and θ is the peak106
direction. Surfzone cross-shore advective heat flux Fadv, due to processes in the surfzone107
(such as undertow and rip currents) or shelf (internal waves), were not estimated here,108
and are discussed in Section 5. Furthermore, the export of mechanical energy from the109
surfzone to inner-shelf is shown to be small (Section 5).110
The resulting net surfzone heat flux, Fnet, considered in this heat budget is,111
Fnet = (Qsw +Qlw +Qlat +Qsen)Lsz + Fwave, (5)
which, as in (2), is balanced against dH/dt, i.e.,112
dH/dt = Fnet. (6)
D R A F T August 4, 2014, 8:54am D R A F T
X - 8 SINNETT AND FEDDERSEN: SURFZONE HEAT BUDGET
This heat budget (6) assumes that the gradient of cross-shore integrated alongshore (y)113
advective heat flux (i.e., terms related to V dT/dy, where V is the alongshore current)114
is negligible. On beaches with alongshore uniform bathymetry and incident wave field,115
time-averaged (hourly) alongshore mass, momentum, and turbulent TKE flux gradients116
are weak [e.g., Feddersen et al., 1998; Feddersen and Guza, 2003; Feddersen, 2012a].117
Thus, alongshore heat flux gradients are expected to be weak as well.118
The surfzone heat content H (1) was estimated with data from four surfzone thermis-119
tors and cross-shore integrating using the trapezoidal rule. Due to strong breaking-wave120
induced turbulence [e.g., Feddersen, 2012b], the surfzone is assumed to have vertically121
uniform temperature (i.e., well mixed), consistent with vertically-uniform surfzone dye122
[Hally-Rosendahl et al., 2014] and turbulent kinetic energy [Ruessink , 2010] observations.123
The outer limit of the surfzone was fixed at Lsz = 132 m (between B and C, vertical124
dashed line in Figure 1) which contained the surfzone at all times. However, at high125
tides and with small waves, wave-breaking occurred farther onshore of Lsz = 132 m. The126
constant vertical integral upper limit (z = 0 m) fixes the mass of the surfzone. Thus127
heat-content changes (and associated fluxes) due to tidal-induced surfzone mass changes128
are not included here. The change in surfzone heat content, dH/dt, was estimated with129
centered differences.130
Short-wave radiation above the water surface (Q+sw) was measured with a pier-end ra-131
diometer 10 m above the water surface. Water entering short-wave radiation Qsw is132
estimated as Qsw = Q+sw(1 − α), where α is a solar-zenith angle dependent open-ocean133
albedo (≈ 6%) parameterization [Payne, 1972]. As the surfzone is generally turbid with134
D R A F T August 4, 2014, 8:54am D R A F T
SINNETT AND FEDDERSEN: SURFZONE HEAT BUDGET X - 9
large optical attenuation, all water-entering Qsw is assumed absorbed in the water column.135
Since the albedo of wet sand is small [≈ 6%, Zhang et al., 2014], any Qsw reaching the bed136
will be absorbed by a thin sand layer, which will rapidly equilibrate with the turbulent137
water of the surfzone. Total (outgoing and incoming) long-wave radiation Qlw is estimated138
with a standard bulk parameterization method using cloud cover, vapor pressure, and air139
and water temperature [Josey et al., 1997]. Vapor pressure was calculated from sea sur-140
face temperature using the Antoine equation [Thomson, 1946]. Air-sea sensible (Qsen)141
and latent (Qlat) heat fluxes are estimated via the COARE 2.5 bulk parameterization142
[Fairall et al., 1996] using wind speed, air and water temperature and humidity. All heat143
budget terms were low-pass filtered with a 2 hr cutoff. Through controlled thermistor144
tests, the 2-hr low-pass filtered dH/dt instrument noise level is estimated using (1) to be145
≈ 300 W m−1.146
4. Results
Over the 47 day deployment, observed ocean temperature T spanned 14.5◦C to 23.4◦C147
(Figure 2a), with coherent variability at subtidal (> 33 hrs) time-scales. Diurnal vari-148
ability was stronger closer to shore (A & D) than 1.2 km offshore at E. Air temperature149
was typically colder than the ocean, fluctuating subtidally and diurnally. Significant150
cross-shore T variation was also observed. The temperature difference between surfzone151
location A and inner-shelf location D, ∆TAD (separated by ∆x = 157 m), varied signifi-152
cantly between −3◦C and 2◦C, generally at diurnal and shorter time-scales (not shown).153
The deployment spanned several spring-tide (amplitude 1.3 m) and neap-tide (amplitude154
0.3 m) cycles (Figure 2b, black), with the majority contribution from M2 and K1. The155
D R A F T August 4, 2014, 8:54am D R A F T

X - 10 SINNETT AND FEDDERSEN: SURFZONE HEAT BUDGET
mean significant wave height, Hs, was 0.7 m (Figure 2b, red) but fluctuated on subtidal156
time-scales with maximum and minimum of 1.6 m and 0.3 m, respectively.157
The water-entering short wave radiative heat flux (QswLsz) warms the surfzone, varies158
diurnally from zero at night-time to peak daytime values ≈ 5 × 10⁴ W m−1, and is the159
largest surfzone heat budget term (blue curve in Figure 2c and Table 1). The net long-160
wave radiation (QlwLsz) cools the surfzone and is largely steady at roughly half the time-161
averaged QswLsz (magenta curve in Figure 2c and Table 1). The latent heat flux (QlatLsz)162
and wave energy flux (Fwave) have similar magnitude and variability (black and red curves,163
respectively in Figure 2c and Table 1), but cool and warm the surfzone, respectively. The164
wave energy flux term Fwave, is on average 1/4 of the short-wave radiative heating QswLsz,165
and is the 2nd most variable term (Table 1), indicating it is an import factor in the166
surfzone heat budget. Estimated sensible heat flux (QsenLsz) is small compared to other167
heat budget terms.168
The net surfzone heat flux Fnet (5) and surfzone heat content time-derivative dH/dt are169
reasonably coherent at diurnal and longer time-scales (Figure 2d), but dH/dt has more170
variability than Fnet (Table 1) at semi-diurnal and shorter time-scales. This results in171
an unbinned heat balance (6) with low best-fit skill (squared correlation r2 = 0.16) and172
high heat-budget residual Fres = dH/dt − Fnet (Table 1). A binned-mean heat balance,173
representative of diurnal and longer time-scales, has a strong linear relationship between174
Fnet and dH/dt with high best-fit skill (r2 = 0.89), near-one slope (± standard deviation)175
of 1.20(±0.06), and an intercept of −6×10³ W m−1 (Figure 3). The slope and intercept of176
the binned-mean and unbinned heat balance are similar. The binned-mean heat balance177
D R A F T August 4, 2014, 8:54am D R A F T
SINNETT AND FEDDERSEN: SURFZONE HEAT BUDGET X - 11
high skill and the near-one slope indicates that, at diurnal and longer time-scales, the178
heat budget closes to first order.179
The wave energy flux Fwave, the 2nd most variable Fnet term, plays a significant role in180
the surfzone heat budget. If Fwave is excluded from Fnet (5), the binned-mean best-fit slope181
is farther from unity (1.33± 0.07) than if Fwave is included (1.20± 0.06). Thus, the wave182
energy flux helps balance the observed dH/dt variability, demonstrating its importance to183
the surfzone heat budget.184
Over the 47-day experiment, the surfzone had net warming (positive 〈dH/dt〉 in Table 1185
where 〈〉 represent a time-average), but warmed slower (by ≈ 5200 W m−1) than expected186
from 〈Fnet〉, consistent with the heat budget’s negative intercept (Figure 3). The surfzone187
net heat-flux Fnet variability is dominated (79% of variance) at diurnal (18-33 hr) and188
subtidal (> 33 hr) time-scales. The heat budget residual Fres variability far exceeds the189
300 W m−1 expected noise level (Table 1) and is dominated (80% of variance) at semi-190
diurnal (11-14.5 hr) and higher-frequency (< 11 hr) time-scales. Thus, processes (such191
as cross-shore heat advection) driving heat-content net cooling and variability on semi-192
diurnal and shorter time-scales are missing from the estimated Fnet. This is discussed193
further in Section 5.194
5. Discussion
At the La Jolla, CA experiment site, the ratio of time-averaged (over the deployment)195
wave energy flux 〈Fwave〉 to time-averaged short wave radiation 〈Qsw〉Lsz was ≈ 1/4, and196
the daily-averaged ratio 〈Fwave〉/(〈Qsw〉Lsz) varied between 0.05 and 1.1. This indicates197
that wave energy flux is important to the surfzone heat budget. The summer (June–July)198
D R A F T August 4, 2014, 8:54am D R A F T

X - 12 SINNETT AND FEDDERSEN: SURFZONE HEAT BUDGET
deployment with long days and high solar zenith angle resulted in large daily-averaged199
short wave radiation 〈Qsw〉 = 106 W m−2. At this site, summer waves are generally small200
compared to winter. During different seasons or at other locations (such as the Oregon201
coast where there are strong waves and cloudy skies) the wave energy flux Fwave may be202
even more important in the surfzone heat budget. Assuming a planar beach slope β and203
normally incident shallow-water waves (cg =√gh) that break in depth hb having constant204
γb = Hs/hb [e.g., Thornton and Guza, 1983], Lsz = hb/β and the ratio Fwave/(QswLsz),205
using (4), becomes206
Fwave
QswLsz
=ρβγ2b (ghb)
32
16Qsw
. (7)
The ratio (7) gives the importance of wave energy flux relative to short-wave radiative solar207
heating, and is proportional to beach slope β, γ2b , and h3/2b (a function of Hs). For constant208
daily-averaged Qsw, at steep beaches (where β is large and small surfzone width) or209
locations with large waves (where hb is deeper), the importance of Fwave relative to QswLsz210
in (3) increases. A Pacific Northwest winter case example with slope β = 0.02, γb = 0.5,211
and measured coastal Nov-Mar averaged short-wave radiation 〈Qsw〉 = 52 W m−2, and212
large waves typical of this location (Hs = 3 m and hb = 6 m) gives a average ratio (7) of213
2.7. Thus, wave heating can be more important than daily-averaged short-wave radiative214
heating.215
The incident Fwave may not be fully converted to heat in the surfzone, resulting in216
surfzone export of mechanical energy. One pathway is by shoreline wave reflection on non-217
dissipative steep beaches. However, on dissipative beaches (such as this one), reflected218
wave energy flux was < 0.03 of the incident Fnet [e.g., Elgar et al., 1994]. Rip currents219
D R A F T August 4, 2014, 8:54am D R A F T
SINNETT AND FEDDERSEN: SURFZONE HEAT BUDGET X - 13
or undertow could also export mechanical energy, which can be simply quantified as220
hbu∗(
1
2ρu∗2
)(8)
(units W m−1) where u∗ is an effective surfzone to inner-shelf exchange velocity that221
includes all potential exchange mechanisms. For a nearby beach with larger waves than222
typically observed here, u∗ ≈ 10−2m s−1 [Hally-Rosendahl et al., 2014]. With hb ≈ 2 m223
(Figure 1), the surfzone export of kinetic energy (8) is approximately 10−3W m−1, 6224
orders of magnitude less than the mean Fnet of 3300W m−1 (see Table 1). If instead u∗ =225
10−1m s−1 (a very large value), the surfzone export of kinetic energy becomes ≈ 1W m−1,226
still < 0.1% of the mean incident wave energy flux. Thus, the great majority of Fnet must227
be dissipated within the surfzone.228
The heat budget residual (Figures 2d, 3, and Table 1) has large semi-diurnal and higher-229
frequency variability and a negative mean (residual cooling), analogous to the summertime230
shallow (12-m depth) shelf mean heat export by cross-shore advective processes [Fewings231
and Lentz , 2011]. Rip currents (e.g., seaward directed flow out of the surfzone, Dalrymple232
et al. [2011]) can export heat from the surfzone [Hally-Rosendahl et al., 2014], as likely233
can the undertow. The rip current or undertow induced Fadv can have contributions at234
a range of time-scales from the mean, subtidal, tidal, and higher frequency. Internal235
waves can drive strong semi-diurnal and higher-frequency nearshore temperature variabil-236
ity [e.g., Winant , 1974; Pineda, 1991]. This suggests that cross-shore advective heat237
flux Fadv due to these processes is important to the surfzone heat budget. Although Fadv238
was not measured here, the contribution from internal waves and surfzone processes (rip239
D R A F T August 4, 2014, 8:54am D R A F T

X - 14 SINNETT AND FEDDERSEN: SURFZONE HEAT BUDGET
currents or undertow) to the surfzone heat content variability is examined qualitatively240
with two case examples.241
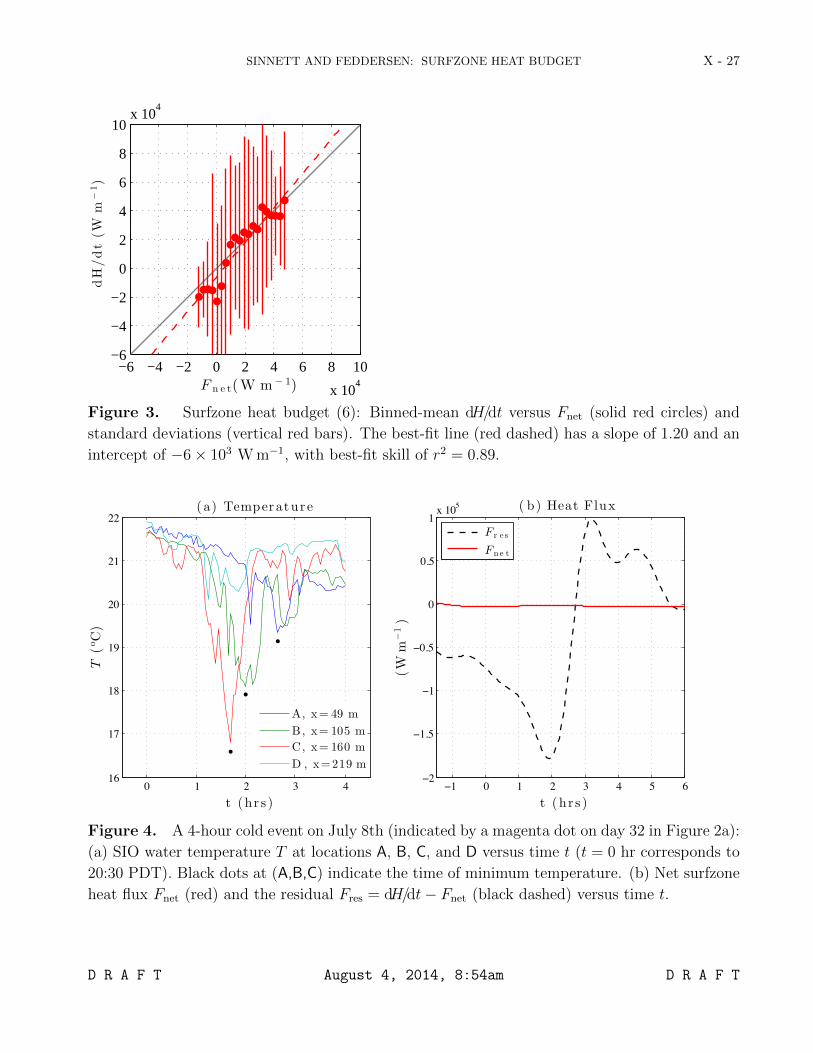
During the deployment, strong cold events were observed to propagate from the inner-242
shelf (5 m depth) into the surfzone. A four-hour highly nonlinear internal wave (or243
bore) event demonstrates the internal wave contribution to high-frequency surfzone heat244
content variations (Figure 4). Internal waves have been observed seaward of the surfzone245
in ≥ 6 m water depth [e.g., Winant , 1974; Pineda, 1991, 1994; Omand et al., 2011], and246
video observations of internal wave surface signatures just seaward of the surfzone suggest247
cross-shore propagation [Suanda et al., 2014]. However, this is the first in situ observation248
of cross-shore internal bore propagation from ≈ 4 m depth through the surfzone.249
During this event, Hs ≈ 0.82 m and the ebbing spring tide varied ≈ 1 m. At t = 1 hr, TC250
(x = 160 m) dropped 4◦C (from 21◦C) in 0.6 hr, subsequently rebounding to its initial level251
0.5 hr later (red curve in Figure 4a). The cold event arrived at B (55 m farther onshore)252
0.3 hr later, with an amplitude reduction to 3◦C (green curve in Figure 4a). The cold253
event minimum arrived at A 0.6 hr later with a reduced amplitude of ≈ 2◦C (blue curve in254
Figure 4a). Within the surfzone (B and A), the cold event duration is longer than at the255
deeper C, and temperature does not recover to its pre-event level, indicating net cooling256
from this event. At location D (59 m offshore of C), no significant cold event is observed257
(cyan curve in Figure 4), indicating that the cold internal wave event only surfaced farther258
onshore. The inferred cold event propagation speeds (C = ∆x/∆t) CBC = 0.05 m s−1259
and CAB = 0.03 m s−1 are approximately consistent with a reduced-gravity shallow water260
phase speed appropriate for a gravity current.261
D R A F T August 4, 2014, 8:54am D R A F T
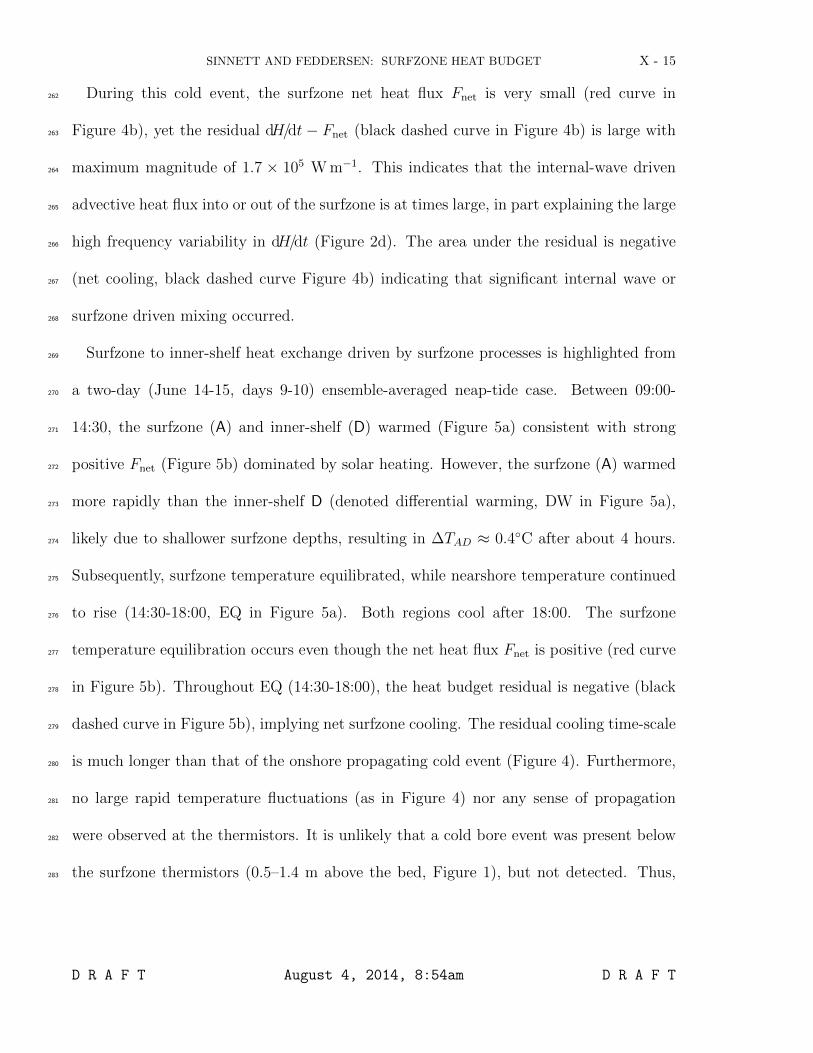
SINNETT AND FEDDERSEN: SURFZONE HEAT BUDGET X - 15
During this cold event, the surfzone net heat flux Fnet is very small (red curve in262
Figure 4b), yet the residual dH/dt − Fnet (black dashed curve in Figure 4b) is large with263
maximum magnitude of 1.7 × 10⁵ W m−1. This indicates that the internal-wave driven264
advective heat flux into or out of the surfzone is at times large, in part explaining the large265
high frequency variability in dH/dt (Figure 2d). The area under the residual is negative266
(net cooling, black dashed curve Figure 4b) indicating that significant internal wave or267
surfzone driven mixing occurred.268
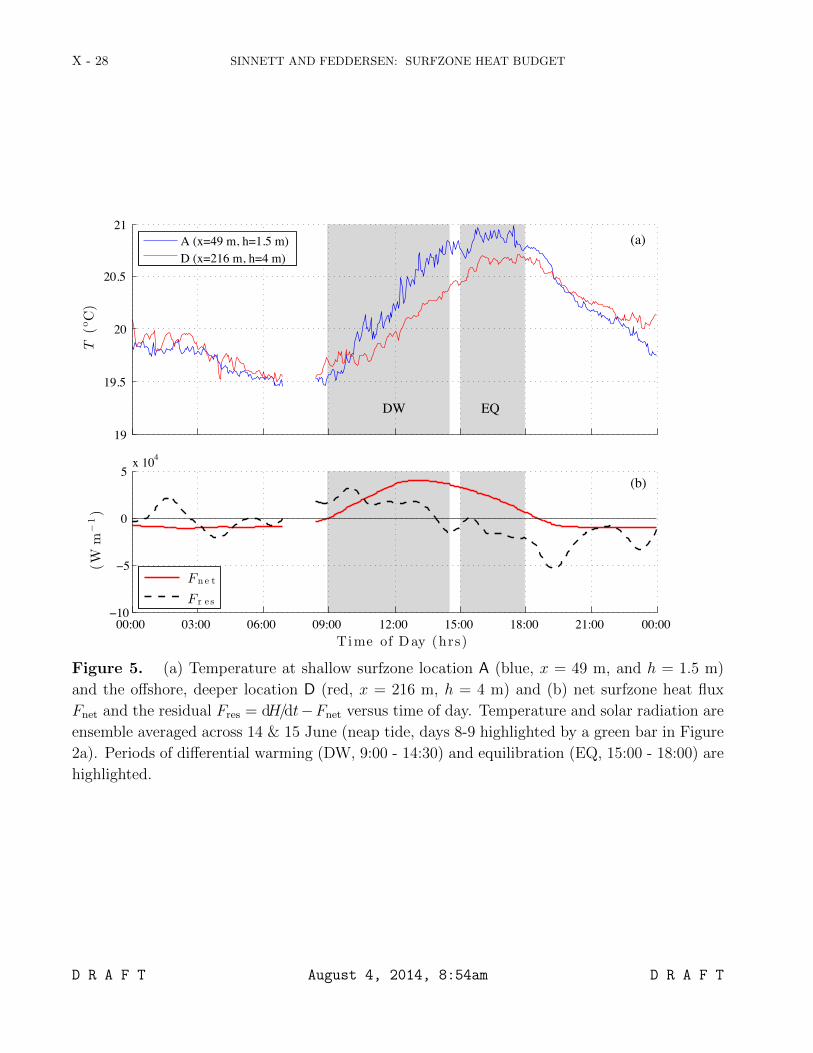
Surfzone to inner-shelf heat exchange driven by surfzone processes is highlighted from269
a two-day (June 14-15, days 9-10) ensemble-averaged neap-tide case. Between 09:00-270
14:30, the surfzone (A) and inner-shelf (D) warmed (Figure 5a) consistent with strong271
positive Fnet (Figure 5b) dominated by solar heating. However, the surfzone (A) warmed272
more rapidly than the inner-shelf D (denoted differential warming, DW in Figure 5a),273
likely due to shallower surfzone depths, resulting in ∆TAD ≈ 0.4◦C after about 4 hours.274
Subsequently, surfzone temperature equilibrated, while nearshore temperature continued275
to rise (14:30-18:00, EQ in Figure 5a). Both regions cool after 18:00. The surfzone276
temperature equilibration occurs even though the net heat flux Fnet is positive (red curve277
in Figure 5b). Throughout EQ (14:30-18:00), the heat budget residual is negative (black278
dashed curve in Figure 5b), implying net surfzone cooling. The residual cooling time-scale279
is much longer than that of the onshore propagating cold event (Figure 4). Furthermore,280
no large rapid temperature fluctuations (as in Figure 4) nor any sense of propagation281
were observed at the thermistors. It is unlikely that a cold bore event was present below282
the surfzone thermistors (0.5–1.4 m above the bed, Figure 1), but not detected. Thus,283
D R A F T August 4, 2014, 8:54am D R A F T

X - 16 SINNETT AND FEDDERSEN: SURFZONE HEAT BUDGET
the residual surfzone cooling during EQ is not due to internal waves. During EQ, the284
net residual cooling (≈ 2.5 × 10⁴ W m−1) is also similar to the 2 × 10⁴ W m−1 transient285
rip-current induced surfzone- to inner-shelf heat flux inferred by [Hally-Rosendahl et al.,286
2014]. Thus, this example of residual surfzone cooling is likely also due to surfzone to287
inner-shelf exchange induced by surfzone processes (undertow or rip currents). Larger288
waves drive larger rip currents [e.g., Dalrymple et al., 2011]. Thus, feedback between289
wave-energy flux and advective rip currents may also exist, such that as larger waves290
provide heat to the surfzone, some of that heat is advected offshore in more intense rip291
currents.292
In addition to the large semi-diurnal and high-frequency time-scale heat budget residual,293
the binned-mean dH/dt variability is 20% larger than the binned-mean Fnet variability294
(best-fit slope is 1.2). Many factors may contribute to this, including estimating heat295
content (1) with only four thermistors, neglecting bathymetric h(x) evolution, or assuming296
no stratification. In addition, the tidal sea-surface variation, inducing surfzone mass and297
thereby heat-content variations, is neglected. The vertical motion of the tides would lift298
and lower any surfzone stratification past the thermistors aliasing the dH/dt estimate. At299
the seaward of the surfzone location C (Figure 1), a second thermistor was deployed for300
the first 20 days 1.6 m below the upper thermistor. During this time, the root-mean301
square stratification was 0.06◦C m−1. Using the observed tidal amplitudes, this results in302
a tidally-induced apparent heat content variation of 2× 10³ W m−1, small relative to Fres303
(Table 1). However, within the surfzone, strong breaking-wave induced mixing is expected304
to result in weaker stratification as with other tracers [e.g., Hally-Rosendahl et al., 2014;305
D R A F T August 4, 2014, 8:54am D R A F T

SINNETT AND FEDDERSEN: SURFZONE HEAT BUDGET X - 17
Ruessink , 2010]. The near closure of the binned-mean heat budget justifies the neglect306
of the alongshore heat-flux gradients. Wind-generated spray in the open ocean has been307
shown to strongly affect latent (Qlat) and sensible (Qsen) heat fluxes [Andreas et al., 2008].308
The COARE 2.5 parameterization for Qlat and Qsen used here do not include depth-limited309
breaking spray effects. Surfzone depth-limited wave breaking generates spray at least an310
order of magnitude larger than just offshore [van Eijk et al., 2011]. Thus, surfzone latent311
and sensible heat fluxes may be under-represented, which could result in the best-fit slope312
above one and net cooling. The heat flux between sediment and the surfzone [e.g., as on313
tidal flats, Rinehimer and Thomson, 2014; Kim et al., 2010] is neglected in (3) as here314
the beach slope and tidal amplitudes are 25× larger and 3× smaller, respectively, than315
on these tidal flats.316
6. Summary
An experiment was conducted at the Scripps Institution of Oceanography (SIO) pier317
from June 6–July 23, 2013 to determine the importance of the onshore wave energy flux318
Fwave to the surfzone heat budget, which up to now had not been considered. Pier deployed319
thermistors measured surfzone and inner-shelf water temperature, with concurrent pier-320
based meteorological measurements and model wave energy flux estimates. The surfzone321
heat budget balances the time variation of vertical and cross-shore (over the surfzone322
width Lsz) integrated heat content dH/dt with surfzone water-entering short-wave and net323
long-wave radiation, latent and sensible heat fluxes (QswLsz, QlwLsz, QlatLsz and QsenLsz324
respectively) and the cross-shore wave energy flux Fwave. Short-wave radiation was the325
largest term in the surfzone heat budget. Time-averaged long-wave radiation, latent and326
D R A F T August 4, 2014, 8:54am D R A F T

X - 18 SINNETT AND FEDDERSEN: SURFZONE HEAT BUDGET
sensible heat flux cooled the surfzone. The wave energy flux Fwave heated the surfzone, was327
on average ≈ 1/4 of the daily averaged short-wave radiative heating, and was the second328
most variable term in the heat budget. The binned-mean heat budget, representative of329
diurnal and longer time-scales, had high skill (r2 = 0.89) and a slope near one, indicating330
the surfzone heat budget closed to first order.331
The heat balance had unexplained residual variability at semi-diurnal and high fre-332
quency time-scales, and residual net cooling (≈ 5200 W m−1). Cross-shore (surfzone to333
inner-shelf) advective heat fluxes due to nonlinear internal waves (causing 3◦C surfzone334
temperature variation in 0.6 hours) and surfzone processes such as rip currents and un-335
dertow, (at times exporting ≈ 2.5 × 10⁴ W m−1) contributed to the high-frequency and336
net heat budget residual.337
Excluding the wave energy flux Fwave from the binned-mean heat budget results in a338
best-fit slope farther from one, further demonstrating the importance of breaking-wave339
induced heating to the surfzone heat budget. A scaling for the ratio of Fwave to short-wave340
surfzone heat flux (QswLsz) shows that at locations where there are large waves, a large341
beach slope, or less solar insolation, the ratio may be > 1.342
Acknowledgments. Support was provided by the National Science Foundation (NSF)343
and the Scripps GK12 program. Field data was collected with help from Kent Smith,344
Rob Grenzeback, Brian Woodward, Dennis Darnell and Kai Hally-Rosendahl. Dan345
Cayan of the SIO Climate Research Division and Doug Alden and Spencer of the SIO346
Hydraulics Laboratory provided the short wave radiative data which is available at347
http://meteora.ucsd.edu/weather/observations/sio_other/sites/stn_21.html348
D R A F T August 4, 2014, 8:54am D R A F T
SINNETT AND FEDDERSEN: SURFZONE HEAT BUDGET X - 19
Pier end meteorological data was provided by the SIO Climate Research Division. The SIO349
Coastal Data Information Program (CDIP) provided wave measurements, and William350
O’Reilly and Corey Olfe provided wave model information for the SIO pier. Comments351
from two anonymous reviewers significantly improved this manuscript. Thank you.352
References
Andreas, E. L., P. O. G. Persson, and J. E. Hare (2008), A bulk turbulent air-sea flux353
algorithm for high-wind, spray conditions, J. Phys. Ocean., 38 (7), 1581–1596, doi:354
10.1175/2007JPO3813.1.355
Austin, J. A. (1999), The role of the alongshore wind stress in the heat budget356
of the North Carolina inner shelf, J. Geophys. Res., 104 (C8), 18,187–18,203, doi:357
10.1029/1998JC900122.358
Broitman, B., C. Blanchette, and S. Gaines (2005), Recruitment of intertidal inverte-359
brates and oceanographic variability at Santa Cruz Island, California, Limnology and360
Oceanography, 50 (5), 1473–1479.361
Dalrymple, R. A., J. H. MacMahan, A. J. H. M. Reniers, and V. Nelko (2011), Rip362
Currents, in Annual Review of Fluid Mechanics, Vol 43, Annual Review of Fluid Me-363
chanics, vol. 43, edited by Davis, SH and Moin, P, pp. 551–581, doi:10.1146/annurev-364
fluid-122109-160733.365
Davis, K. A., S. J. Lentz, J. Pineda, J. T. Farrar, V. R. Starczak, and J. H. Churchill366
(2011), Observations of the thermal environment on Red Sea platform reefs: A heat367
budget analysis, Coral Reefs, 30 (1, SI), 25–36, doi:10.1007/s00338-011-0740-8.368
D R A F T August 4, 2014, 8:54am D R A F T

X - 20 SINNETT AND FEDDERSEN: SURFZONE HEAT BUDGET
Dever, E. P., and S. J. Lentz (1994), Heat and salt balances over the Northern California369
shelf in winter and spring, Journal of Geophysical Research: Oceans, 99 (C8), 16,001–370
16,017, doi:10.1029/94JC01228.371
Dorfman, M., and K. S. Rosselot (2009), Testing the Wa-372
ters: A guide to water quality at vacation beaches, Tech. Rep.373
http://marineeconomics.noaa.gov/SCBeach/laobeach1.html, National Resrouces374
Defense Council.375
Elgar, S., T. Herbers, and R. T. Guza (1994), Reflection of ocean surface gravity waves376
from a natural beach, J. Phys. Ocean., 24, 1503–1511.377
Fairall, C., E. Bradley, D. Rogers, J. Edson, and G. Young (1996), Bulk parameteriza-378
tion of air-sea fluxes for tropical ocean-global atmosphere coupled-ocean atmosphere379
response experiment, Journal of Geophysical Research, 101 (C2), 3747–3764.380
Feddersen, F. (2012a), Observations of the surfzone turbulent dissipation rate,381
J. Phys. Ocean., 42, 386–399, doi:10.1175/JPO-D-11-082.1.382
Feddersen, F. (2012b), Scaling surfzone dissipation, Geophys. Res. Lett., 39 (L18613).383
Feddersen, F., and R. T. Guza (2003), Observations of nearshore circulation: Alongshore384
uniformity, J. Geophys. Res., 108, doi:10.1029/2001JC001293.385
Feddersen, F., R. T. Guza, S. Elgar, and T. H. C. Herbers (1998), Alongshore momentum386
balances in the nearshore, J. Geophys. Res., 103, 15,667–15,676.387
Fewings, M. R., and S. J. Lentz (2011), Summertime cooling of the shallow continental388
shelf, J. Geophys. Res., 116 (C7), doi:10.1029/2010JC006744.389
D R A F T August 4, 2014, 8:54am D R A F T

SINNETT AND FEDDERSEN: SURFZONE HEAT BUDGET X - 21
Fischer, S., and S. Thatje (2008), Temperature-induced oviposition in the brachyu-390
ran crab Cancer setosus along a latitudinal cline: Aquaria experiments and analy-391
sis of field-data, J. Experimental Marine Biology and Ecology, 357 (2), 157–164, doi:392
10.1016/j.jembe.2008.01.007.393
Goodwin, K. D., M. McNay, Y. Cao, D. Ebentier, M. Madison, and J. F. Griffith (2012),394
A multi-beach study of Staphylococcus aureus, MRSA, and enterococci in seawater and395
beach sand, Water Research, 46 (13), 4195–4207, doi:10.1016/j.watres.2012.04.001.396
Haile, R. W., J. S. Witte, M. Gold, R. Cressey, C. D. McGee, R. C. Millikan, A. Glasser,397
N. Harawa, C. Ervin, P. Harmon, J. Harper, J. Dermand, K. B. J. Alamillo, M. Nides,398
and G. Wang (1999), The health effects of swimming in ocean water contaminated by399
storm drain runoff, Epidemiology, 10, 355–363.400
Halliday, E. E. A. (2012), Sands and environmental conditions impact the abundance and401
persistence of the fecal indicator bacteria enterococcus at recreational beaches, Ph.D.402
thesis, Massachusetts Institute of Technology.403
Hally-Rosendahl, K., F. Feddersen, and R. T. Guza (2014), Cross-shore tracer exchange404
between the surfzone and the inner-shelf, J. Geophys. Res., doi: 10.1002/2013JC009722.405
Hokajarvi, A.-M., T. Pitkanen, H. M. P. Siljanen, U.-M. Nakari, E. Torvinen, A. Siito-406
nen, and I. T. Miettinen (2013), Occurrence of thermotolerant Campylobacter spp. and407
adenoviruses in Finnish bathing waters and purified sewage effluents, Journal of Water408
and Health, 11 (1), 120–134, doi:10.2166/wh.2012.192.409
Josey, S. A., D. Oakley, and R. W. Pascal (1997), On estimating the atmospheric long-410
wave flux at the ocean surface from ship meteorological reports, Journal of Geophysical411
D R A F T August 4, 2014, 8:54am D R A F T

X - 22 SINNETT AND FEDDERSEN: SURFZONE HEAT BUDGET
Research, 102 (C13), 27,961–27,972.412
Kim, T., Y. Cho, K. You, and K. Jung (2010), Effect of tidal flat on seawater temperature413
variation in the southwest coast of korea, Journal of Geophysical Research, 115 (C02007).414
Lentz, S. J. (1987), A heat budget for the Northern California shelf during CODE 2,415
J. Geophys. Res., 92 (C13), 14,491–14,509, doi:10.1029/JC092iC13p14491.416
Lerczak, J. A., C. D. Winant, and M. C. Hendershott (2003), Observations of the semid-417
iurnal internal tide on the southern california slope and shelf, Journal of Geophysical418
Research, 108 (C3).419
Omand, M. M., J. J. Leichter, P. J. S. Franks, A. J. Lucas, R. T. Guza, and F. Feddersen420
(2011), Physical and biological processes underlying the sudden appearance of a red-tide421
surface patch in the nearshore, Limnol. Oceanogr., 56, 787–801.422
Omand, M. M., F. Feddersen, P. J. S. Franks, and R. T. Guza (2012), Episodic vertical423
nutrient fluxes and nearshore phytoplankton blooms in southern california, Limnol.424
Oceanogr., 57, 1673–1688, doi:10.4319/lo.2012.57.6.1673.425
O’Reilly, W., and R. Guza (1991), Comparison of spectral refraction and refraction-426
diffraction wave models, Journal of Waterway Port Coastal and Ocean Engineering-427
ASCE, 117 (3), 199–215, doi:10.1061/(ASCE)0733-950X(1991)117:3(199).428
O’Reilly, W., and R. Guza (1998), Assimilating coastal wave observations in regional swell429
predictions. Part I: Inverse methods, J. Phys. Ocean., 28 (4), 679–691, doi:10.1175/1520-430
0485(1998)028¡0679:ACWOIR¿2.0.CO;2.431
Payne, R. E. (1972), Albedo of the sea surface, J. Atmos. Sci., 29, 959–970.432
D R A F T August 4, 2014, 8:54am D R A F T
SINNETT AND FEDDERSEN: SURFZONE HEAT BUDGET X - 23
Phillips, N. (2005), Growth of filter-feeding benthic invertebrates from a region433
with variable upwelling intensity, Marine Ecology Progress Series, 295, 79–89, doi:434
10.3354/meps295079.435
Pineda, J. (1991), Predictable upwelling and the shoreward transport of planktonic larvae436
by internal tidal bores, Science, 253 (5019), 548–551, doi:10.1126/science.253.5019.548.437
Pineda, J. (1994), Internal tidal bores in the nearshore - warm-water fronts, seaward438
gravity currents and the onshore transport of neustonic larvae, J. Marine Res., 52 (3),439
427–458, doi:10.1357/0022240943077046.440
Rinehimer, J., and J. T. Thomson (2014), Observations and modeling of heat fluxes on441
tidal flats, Journal of Geophysical Research: Oceans, 119, 1–14.442
Ruessink, B. G. (2010), Observations of turbulence within a natural surf zone,443
J. Phys. Ocean., 40 (12), 2696–2712, doi:10.1175/2010JPO4466.1.444
Suanda, S. H., J. A. Barth, R. A. Holman, and J. Stanley (2014), Shore-based video445
observations of nonlinear internal waves across the inner shelf, Journal of Atmospheric446
and Oceanic Technology, 31 (3), 714–728.447
Thomson, G. W. (1946), The antoine equation for vapor pressure data, Chemical Reviews,448
38 (1), 1–39.449
Thornton, E. B., and R. T. Guza (1983), Transformation of wave height distribution,450
J. Geophys. Res., 88 (C10), 5925–5938.451
van Eijk, A. M. J., J. T. Kusmierczyk-Michulec, M. J. Francius, G. Tedeschi, J. Piazzola,452
D. L. Merritt, and J. D. Fontana (2011), Sea-spray aerosol particles generated in the453
surf zone, Journal of Geophysical Research, 116 (D19210).454
D R A F T August 4, 2014, 8:54am D R A F T

X - 24 SINNETT AND FEDDERSEN: SURFZONE HEAT BUDGET
van Haren, H., L. Gostiaux, M. Laan, M. van Haren, E. van Haren, and L. J. A. Ger-455
ringa (2012), Internal wave turbulence near a texel beach, PLOS ONE, 7 (3), doi:456
10.1371/journal.pone.0032535.457
Walter, R. K., C. B. Woodson, R. S. Arthur, O. B. Fringer, and S. G. Monismith (2012),458
Nearshore internal bores and turbulent mixing in southern Monterey Bay, J. Geo-459
phys. Res., 117, doi:10.1029/2012JC008115.460
Winant, C. (1974), Internal surges in coastal waters, J. Geophys. Res., 79 (30), 4523–4526,461
doi:10.1029/JC079i030p04523.462
Woodson, C., D. Eerkes-Medrano, A. Flores-Morales, M. Foley, S. Henkel, M. Hessing-463
Lewis, D. Jacinto, L. Needles, M. Nishizaki, J. O’Leary, C. Ostrander, M. Pe-464
speni, K. Schwager, J. Tyburczy, K. Weersing, A. Kirincich, J. Barth, M. Mc-465
Manus, and L. Washburn (2007), Local diurnal upwelling driven by sea breezes466
in northern Monterey Bay, Continental Shelf Research, 27 (18), 2289 – 2302, doi:467
http://dx.doi.org/10.1016/j.csr.2007.05.014.468
Yates, M. L., R. T. Guza, and W. C. O’Reilly (2009), Equilibrium shoreline response:469
Observations and modeling, J. Geophys. Res., 114, doi:10.1029/2009JC005359.470
Young, A. P., R. T. Guza, M. E. Dickson, W. C. O’Reilly, and R. E. Flick (2013), Ground471
motions on rocky, cliffed, and sandy shorelines generated by ocean waves, J. Geo-472
phys. Res., 118 (12), 6590–6602, doi:10.1002/2013JC008883.473
Zhang, Y., X. Wang, R. Hu, Y. Pan, and H. Zhang (2014), Variation of albedo to soil mois-474
ture for sand dunes and biological soil crusts in arid desert ecosystems, Environmental475
Earth Sciences, 71 (3), 1281–1288.476
D R A F T August 4, 2014, 8:54am D R A F T
SINNETT AND FEDDERSEN: SURFZONE HEAT BUDGET X - 25
0 50 100 150 200
−4
−2
0
A B C D
L s z
S u r f zo n e In n er - s h e l f
z(m
)
C r o s s - s h o r e co o r d i n a t e x ( m )
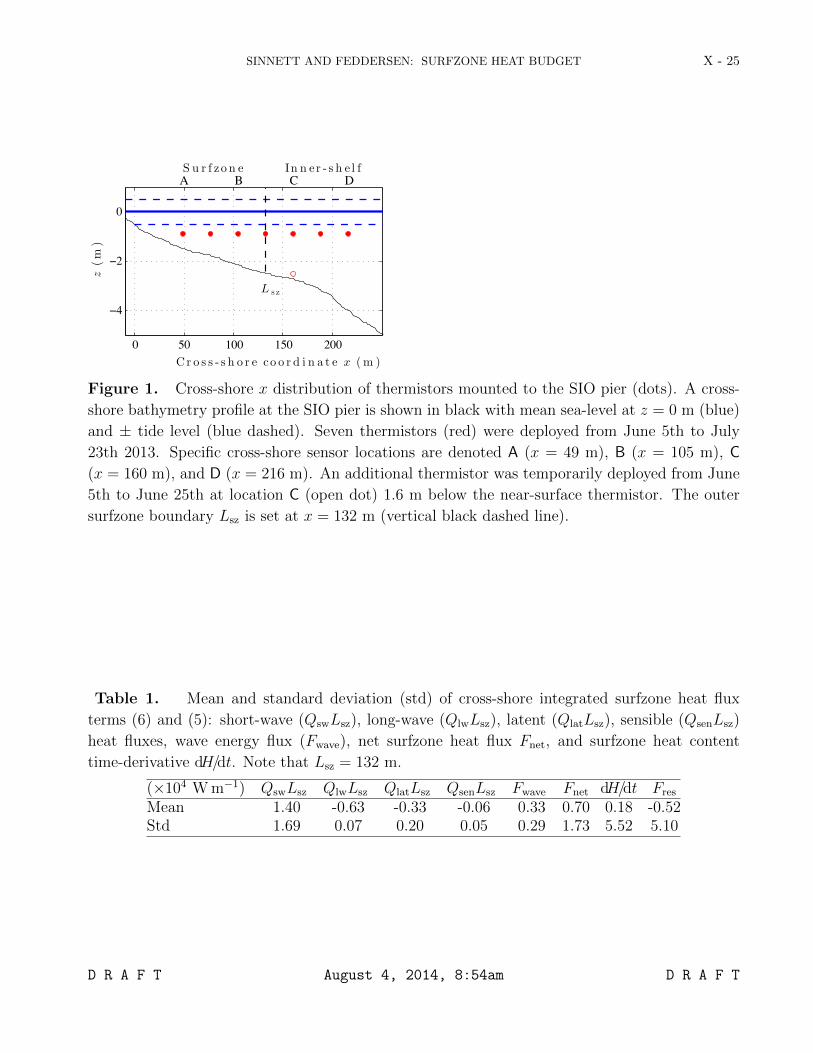
Figure 1. Cross-shore x distribution of thermistors mounted to the SIO pier (dots). A cross-
shore bathymetry profile at the SIO pier is shown in black with mean sea-level at z = 0 m (blue)
and ± tide level (blue dashed). Seven thermistors (red) were deployed from June 5th to July
23th 2013. Specific cross-shore sensor locations are denoted A (x = 49 m), B (x = 105 m), C
(x = 160 m), and D (x = 216 m). An additional thermistor was temporarily deployed from June
5th to June 25th at location C (open dot) 1.6 m below the near-surface thermistor. The outer
surfzone boundary Lsz is set at x = 132 m (vertical black dashed line).
Table 1. Mean and standard deviation (std) of cross-shore integrated surfzone heat flux
terms (6) and (5): short-wave (QswLsz), long-wave (QlwLsz), latent (QlatLsz), sensible (QsenLsz)
heat fluxes, wave energy flux (Fwave), net surfzone heat flux Fnet, and surfzone heat content
time-derivative dH/dt. Note that Lsz = 132 m.
(×104 W m−1) QswLsz QlwLsz QlatLsz QsenLsz Fwave Fnet dH/dt Fres
Mean 1.40 -0.63 -0.33 -0.06 0.33 0.70 0.18 -0.52Std 1.69 0.07 0.20 0.05 0.29 1.73 5.52 5.10
D R A F T August 4, 2014, 8:54am D R A F T

X - 26 SINNETT AND FEDDERSEN: SURFZONE HEAT BUDGET
14
16
18
20
22
24
T(oC)
(a)
A D E Air
−1
0
1
(m)
(b)
Tide Hs
−2
0
2
4
6x 10
4
Flu
x(W
m−1)
(c)
SW LW Lat Sen Wave
0 5 10 15 20 25 30 35 40 45−4
−2
0
2
4x 10
5
t ime (day s)
(Wm
−1)
(d)
dH/dt Fnet
Figure 2. Time series of: (a) water temperature at locations A (x = 49 m), D (x = 216 m) and
E (CDIP buoy, x = 1200 m), and air temperature at SIO Pier (see legend). Note temperature at
E is offset by 1.5 ◦C for visibility. (b) Pier tidal elevation (black) and significant wave height Hs
in 10 m depth (red). (c) Surfzone energy flux terms including water-entering short-wave (QswLsz)
net long-wave (QlwLsz) radiative fluxes, sensible (QsenLsz) and latent QlatLsz) air-sea fluxes, and
wave energy flux Fwave. (d) Cross-shore integrated surfzone heat budget terms dH/dt and Fnet.
The magenta dot at day 32 in plot (a) indicates the time of a strong internal wave event observed
at locations C, B and A highlighted in Figure 4. The green bar over days 8 and 9 in plot (a)
corresponds to the time highlighted in Figure 5.
D R A F T August 4, 2014, 8:54am D R A F T
SINNETT AND FEDDERSEN: SURFZONE HEAT BUDGET X - 27
−6 −4 −2 0 2 4 6 8 10
x 104
−6
−4
−2
0
2
4
6
8
10x 10
4
F n e t(W m − 1)
dH/dt(W
m−
1)
Figure 3. Surfzone heat budget (6): Binned-mean dH/dt versus Fnet (solid red circles) and
standard deviations (vertical red bars). The best-fit line (red dashed) has a slope of 1.20 and an
intercept of −6× 10³ W m−1, with best-fit skill of r2 = 0.89.
0 1 2 3 416
17
18
19
20
21
22
T(oC)
t ( hr s )
( a) Temperature
A, x= 49 m
B, x= 105 m
C, x= 160 m
D , x=219 m
−1 0 1 2 3 4 5 6−2
−1.5
−1
−0.5
0
0.5
1x 10⁵
(Wm
!1)
t ( hr s )
( b) Heat Flux
F r e s
Fn e t
Figure 4. A 4-hour cold event on July 8th (indicated by a magenta dot on day 32 in Figure 2a):
(a) SIO water temperature T at locations A, B, C, and D versus time t (t = 0 hr corresponds to
20:30 PDT). Black dots at (A,B,C) indicate the time of minimum temperature. (b) Net surfzone
heat flux Fnet (red) and the residual Fres = dH/dt− Fnet (black dashed) versus time t.
D R A F T August 4, 2014, 8:54am D R A F T
X - 28 SINNETT AND FEDDERSEN: SURFZONE HEAT BUDGET
T(oC)
(a)
DW EQ
19
19.5
20
20.5
21A (x=49 m, h=1.5 m)D (x=216 m, h=4 m)
(Wm
!1)
T ime of Day (hrs)
(b)
00:00 03:00 06:00 09:00 12:00 15:00 18:00 21:00 00:00−10
−5
0
5x 10⁴
Fn e t
F r e s
Figure 5. (a) Temperature at shallow surfzone location A (blue, x = 49 m, and h = 1.5 m)
and the offshore, deeper location D (red, x = 216 m, h = 4 m) and (b) net surfzone heat flux
Fnet and the residual Fres = dH/dt−Fnet versus time of day. Temperature and solar radiation are
ensemble averaged across 14 & 15 June (neap tide, days 8-9 highlighted by a green bar in Figure
2a). Periods of differential warming (DW, 9:00 - 14:30) and equilibration (EQ, 15:00 - 18:00) are
highlighted.
D R A F T August 4, 2014, 8:54am D R A F T