The SunShot Initiative 3/8/14
28
The SunShot Initiative 3/8/14
Transcript of The SunShot Initiative 3/8/14

1
The SunShot Initiative 3/8/14

2
US Market Growth
4.7 GW of PV in 2013
10X more installed than in 2009

3

4
High-Tech Manufacturing G
loba
l Hig
h Te
ch E
xpor
ts (
%)
Source: National Science Foundation, Science and Engineering Indicators 2010
0
5
10
15
20
25
30
1995 1999 2003 2007
U.S.
EU
China
Year
Japan

5
Erosion of Domestic PV cell and Module Manufacturing
0%
5%
10%
15%
20%
25%
30%
35%
40%
45%
1997 1998 1999 2000 2001 2002 2003 2004 2005 2006 2007 2008 2009 2010 2011 2012 Est.
0
5
10
15
20
25
30
U.S
. Mar
ket
Shar
e Pe
rcen
tage
PV
Mod
ule
Ship
men
ts (
GW
)
ROW Europe Japan U.S. Taiwan China U.S. Share
1997: 42%
2012: 2%

6
Manufacturing
“Abandoning today's ‘commodity’ manufacturing can lock you out of tomorrow's emerging industry.”
- Andy Grove, co-founder, former CEO, Intel

Global PV Shipments are Significant
Solar (PV) energy is capital intensive Investments comprised mostly (63%) of manufactured goods Manufacturer and direct-supplier revenues approached $100BN in 2011, despite solar PV accounting for <0.5% of world electricity generation
Sources: BNEF Q4 2012 PV Market Outlook, BNEF Q4 2012 Solar Spot Prices, GTM "Wafer-Cell-Module Database" (June 2012), VLSI Research, Photon (Inverter prices), NREL internal cost model (BoS hardware prices), UNEP (global solar investments)
• Solar investments grew 52% in 2011 ($147 Bn) • While manufacturers
experienced period of distress • Demand led by developed
economies • But, China demand surged in
Q4; targets also raised 67% • Threats to future investments
• EU sovereign debt crisis • EU and U.S. policy
In 2011, PV shipments exceeded iPhone sales despite accounting for <1% of global electricity supply.

8
So what is the SunShot Initiative?
8
SunShot Initiative SunShot Initiative
5 - 6¢/kwh without subsidy
A 75% cost reduction by the end of the decade
Pric
e

SunShot Utility Scale Progress Q42013
9
Sources: Margolis , R., et al. (2012). "SunShot Vision Study." DOE/GO-102012-3037. Golden, CO: National Renewable Energy Laboratory, pp. 265. Accessed 2013: http://www1.eere.energy.gov/solar/pdfs/47927_appendices.pdf; Goodrich, A; James, T; and Woodhouse, M. “Residential, Commercial, and Utility-Scale Photovoltaic System Prices in the United States: Current Drivers and Cost Reduction Opportunities.” NREL Technical Report No. TP-6A20-53347, Available Online at: www.nrel.gov/docs/fy12osti/53347.pdf . ; NREL internal (PV system cost) analysis (September 2013).
10
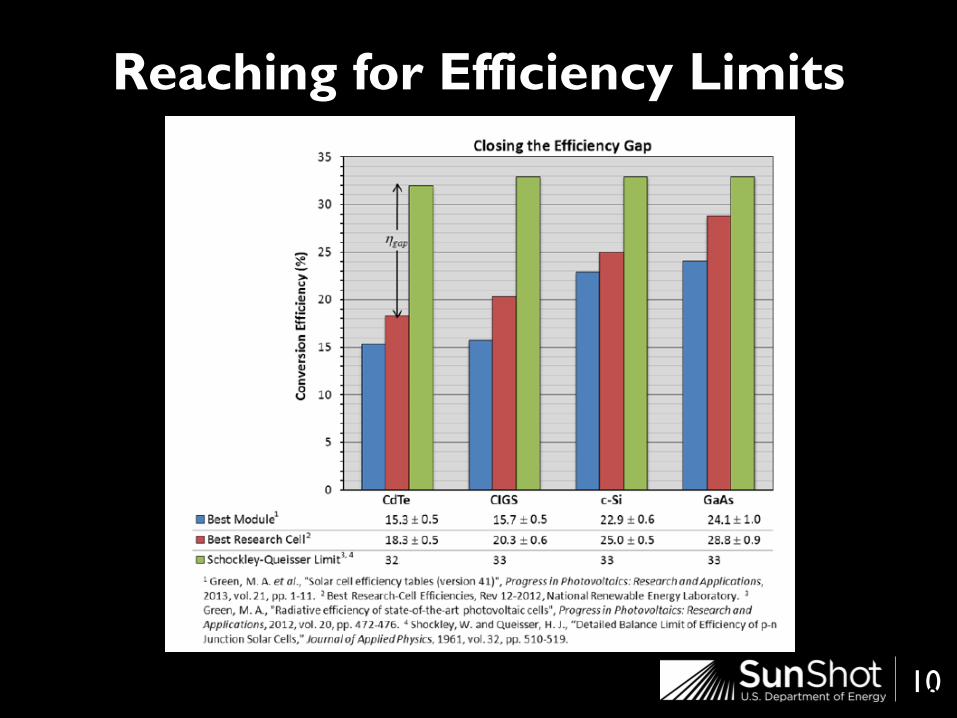
Reaching for Efficiency Limits
10

11
World Record Cell Efficiencies
~50% of the world record cell efficiencies from 1975-2012 were made by researchers supported by the DOE
11
energy.gov/sunshot
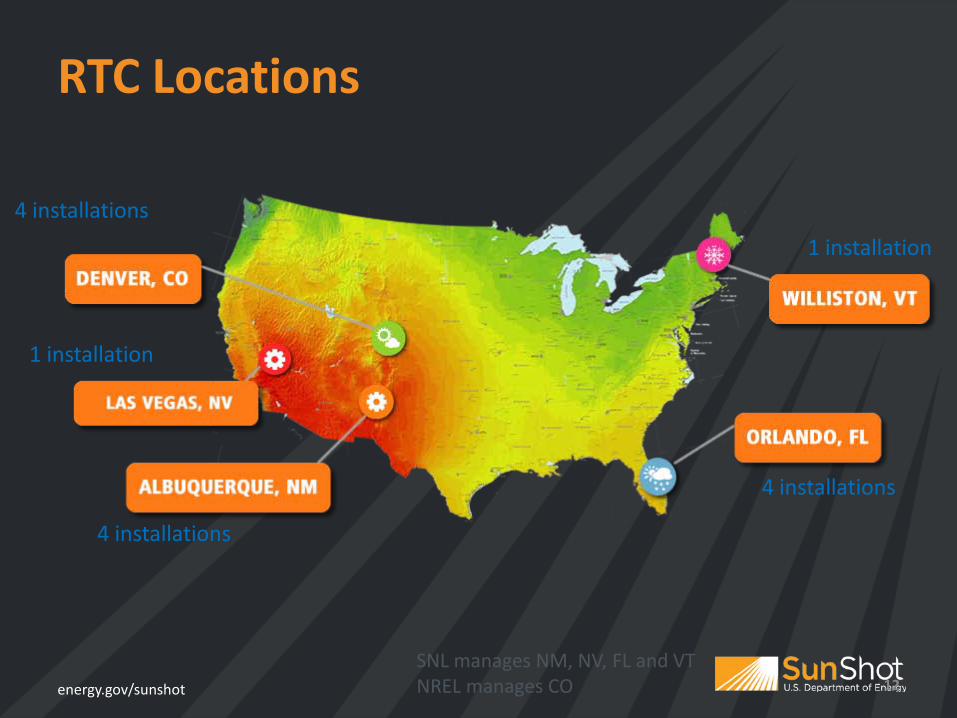
RTC Locations
12
4 installations
4 installations
4 installations
1 installation
1 installation
SNL manages NM, NV, FL and VT NREL manages CO
13
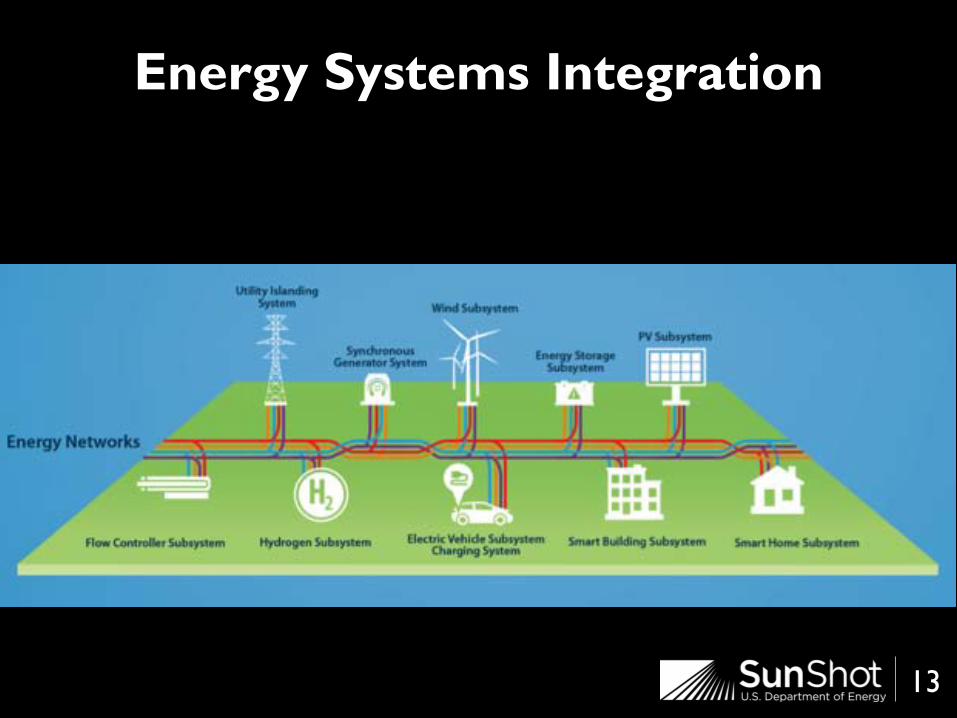
Energy Systems Integration

energy.gov/sunshot

energy.gov/sunshot energy.gov/sunshot energy.gov/sunshot
PV System Pathway to SunShot Residential
$6.60
$3.55
$1.50
$0
$1
$2
$3
$4
$5
$6
$7 In
stal
led
Syst
em P
rice
(201
0 $/
WD
C)
BOS-Soft Costs
BOS-Hardware
Inverter
Module

16
Soft Costs


More Paperwork = Higher Cost


20
And Permitting is Different Everywhere
20

21
Unlike physics, where we can fundamentally figure out the upper limit for the efficiency of solar cells,
there is no such limit to bureaucracy

Streamlined Permitting, Inspection
22
Web-Based permitting Track you permits in real time Eliminate trips to permitting office

Big Data Lowers Solar Soft Costs
Sun Number Scores - engaging consumers Roof top data processed to qualify buildings Lowering the cost of customer acquisition
23

Crowd-Funded Solar Non-homeowners can go solar for $25 Crowdfunding lowers the cost of capital
24

25

26 26
Well, let's say you can shave 10 seconds off of the boot time. Multiply that by five million users and that’s 50 million seconds, every single day. Over a year, that's probably dozens of lifetimes. So if you make it boot ten seconds
faster, you've saved a dozen lives. That's really worth it, don't you think?

27
22 Rooftop Solar Challenge Teams Cut red tape by 1 week
600 MW installed 40,000 installations
40,000 weeks of red tape = 768 Years of red tape About 10 lives saved

Thank You
Minh Le Director
SunShot Initiative