THE SUBPRIME CREDIT CRISIS AND CONTAGIONINFINANCIALMARKETS ... · THE SUBPRIME CREDIT CRISIS AND...
25
THE SUBPRIME CREDIT CRISIS AND CONTAGION IN FINANCIAL MARKETS Francis A. Longstaff ∗ Abstract. We conduct an empirical investigation into the pricing of subprime asset- backed CDOs and the resulting contagion effects on other markets. Using data for the ABX indexes of subprime CDO prices, we find strong evidence of contagion effects. In particular, we find that contagion effects spread first from lower-rated ABX indexes to higher-rated ABX indexes, and then from the subprime markets to the Treasury bond and stock markets. ABX index returns forecast stock and Treasury bond returns as much as three weeks ahead during the crisis. Furthermore, ABX index shocks are significantly related to contractions in the size of the short-term credit markets and increases in the trading activity of financial stocks over the next several weeks. These results provide support for the hypothesis that financial contagion was spread through liquidity and risk-premium channels. Current version: August 2008. ∗ UCLA Anderson School and NBER. I am very grateful for helpful discussions with Joshua Anderson, Vineer Bhansali, Bruce Carlin, Richard Clarida, Rajna Gibson, Rob- ert Gingrich, Hanno Lustig, Alfred Murata, Steve Schulist, and Jiang Wang, and for the comments of seminar participants at New York University, Pimco, and UCLA. All errors are my responsibility.
-
Upload
nguyentruc -
Category
Documents
-
view
215 -
download
0
Transcript of THE SUBPRIME CREDIT CRISIS AND CONTAGIONINFINANCIALMARKETS ... · THE SUBPRIME CREDIT CRISIS AND...

THE SUBPRIME CREDIT CRISIS AND
CONTAGION IN FINANCIAL MARKETS
Francis A. Longstaff∗
Abstract. We conduct an empirical investigation into the pricing of subprime asset-backed CDOs and the resulting contagion effects on other markets. Using data for theABX indexes of subprime CDO prices, we find strong evidence of contagion effects. Inparticular, we find that contagion effects spread first from lower-rated ABX indexesto higher-rated ABX indexes, and then from the subprime markets to the Treasurybond and stock markets. ABX index returns forecast stock and Treasury bond returnsas much as three weeks ahead during the crisis. Furthermore, ABX index shocks aresignificantly related to contractions in the size of the short-term credit markets andincreases in the trading activity of financial stocks over the next several weeks. Theseresults provide support for the hypothesis that financial contagion was spread throughliquidity and risk-premium channels.
Current version: August 2008.
∗ UCLA Anderson School and NBER. I am very grateful for helpful discussions withJoshua Anderson, Vineer Bhansali, Bruce Carlin, Richard Clarida, Rajna Gibson,Rob- ert Gingrich, Hanno Lustig, Alfred Murata, Steve Schulist, and Jiang Wang, andfor the comments of seminar participants at New York University, Pimco, and UCLA.All errors are my responsibility.

1. INTRODUCTION
During the past year, financial markets have suffered catastrophic losses from the on-going credit crisis. This crisis was initially triggered by the growing threat of extensivedefaults by subprime borrowers in the mortgage markets. This rapidly led to massivedeclines in the market values of large portfolios of highly-rated asset-backed securitiesheld by many financial institutions. The crisis has brought about an almost completehalt to the fledgling structured-credit market, a serious “credit crunch” for both indi-viduals and financial institutions, and a major decline in the liquidity of debt securitiesin virtually every market.
Even at the early stages, the markets feared that the subprime crisis might spillover into other sectors of the economy.1 As the crisis has unfolded, a number of thesefears have been realized as large negative shocks have occurred in the housing, auction-rate, municipal-bond, and corporate-debt markets. The recent failures, or near failures,of Bear Stearns, Countrywide, and IndyMac Bank have many financial institutionsscrambling for additional capital to bolster their balance sheets. Concerns about theviability of Fannie Mae and Freddie Mac have spread throughout the financial markets.These concerns, in turn, have resulted in credit default swaps on the U.S. Governmentbeing traded at spreads as high as 25 basis points. Recent intervention by the FederalReserve in these markets has been motivated largely by the objective of avoidingbroader credit contagion stemming from the crisis.
The issue of contagion in financial markets is of fundamental importance andthere is an extensive literature addressing its causes and effects. Important recentpapers focusing on contagion include Allen and Gale (2000), Kyle and Xiong (2001),Kodres and Pritsker (2002), Kiyotaki and Moore (2002), Kaminsky, Reinhart, andVegh (2003), Allen and Gale (2004), Brunnermeier and Pedersen (2005, 2007), andmany others. From a research perspective, the current crisis in the subprime asset-backed market provides a near-ideal “laboratory” for studying the role that contagionmay play in financial markets when an asset class becomes severely distressed.2
1For example, see Federal Reserve Governor Frederic S. Mishkin’s September 10, 2007speech “Outlooks and Risk for the U.S. Economy” and Federal Reserve ChairmanBen S. Bernanke’s October 15, 2007 speech “The Recent Financial Turmoil and itsEconomic Consequences.”2Important papers focusing on the valuation of distressed assets include Shleifer andVishny (1992), Asquith, Gertner, and Scharfstein (1994), Opler and Titman (1994),Clark and Ofek (1994), John and Ofek (1995), Andrade and Kaplan (1998), Pulvino(1998), Kahl (2002), Longstaff (2004), Vayanos (2004), Acharya and Pedersen (2005),Brunnermeier and Pedersen (2005), and Carlin, Lobo, and Viswanathan (2007).
1

The contagion literature identifies at least three possible mechanisms by whichshocks in one market may spill over into other markets. First, Kiyotaki and Moore(2002), Kaminsky, Reinhart, and Vegh (2003), and others describe mechanisms inwhich negative shocks in one market represent the arrival of economic news that di-rectly effects the collateral values or cash flows associated with securities in othermarkets. In this mechanism, contagion can be viewed as the transmission of infor-mation from more-liquid markets or markets with more-rapid price discovery to othermarkets. Second, Allen and Gale, (2000), Brunnermeier and Pedersen (2005), andothers show how investors who suffer losses in one market may find their ability toobtain funding impaired, potentially leading to a downward spiral in overall marketliquidity and other asset prices via a “flight to quality.” In this mechanism, contagionoccurs through a liquidity shock across all markets. Third, Vayanos (2004), Acharyaand Pedersen (2005), Longstaff (2008), and others imply that a severe negative shockin one market may be associated with an increase in the risk premium in other mar-kets. In this mechanism, contagion occurs as negative returns in the distressed marketaffect subsequent returns in other markets via the time-varying risk premium.
Our objective in this paper is to shed some light on these issues by studyingthe subprime asset-backed collateralized debt obligation (CDO) market during the2006-2007 period and exploring how negative shocks affected other markets as thesubprime crisis unfolded. The study is based on an extensive data set of prices forthe ABX indexes of subprime mortgage-related asset-backed CDOs. Using a vectorautoregression (VAR) framework, we examine the extent to which ABX returns arerelated to returns in other financial markets as well as to market leverage and tradingactivity measures.
Two major empirical results emerge from this analysis. First, we find that shockstended to flow from the lower-rated to higher-rated ABX indexes as the crisis devel-oped. Specifically, we find that the returns for the BBB and BBB− ABX indexes havereliable incremental forecast power for the AAA, AA, and A indexes several weeksahead. Returns for the higher-rated ABX indexes tend to be much more predictablethan is the case for the lower-rated ABX index returns.
Second, despite the lower liquidity of the ABS CDO market, we find that ABXindex returns developed significant predictive power for subsequent Treasury bond andstock market returns as the crisis unfolded. The ABX returns have significant forecastability for stock and bond market returns as far as three weeks ahead. Treasury bondprices increase in response to negative shocks to ABS CDO values, consistent with aflight-to-quality pattern. This effect, however, is much stronger for short-term Treasuryrates than for longer-term Treasury rates. Furthermore, negative shocks to the ABXindexes map into significant subsequent negative returns for both the S&P 500 Indexand the financial subcomponent of the Index. We also find that downward shocks inthe ABX indexes translate into significant declines in the size of the roughly $2 trillion
2
commercial paper market over the next several weeks along with large increases in thetrading activity of financial stocks.
These results provide some insights into the nature of mechanisms driving thespillovers across markets in the present credit crisis. For example, finding that shockstend to be transmitted with a lag from the less-liquid ABX index market to the highly-liquid Treasury-bond and stock markets argues against the price-discovery view of fi-nancial contagion. In contrast, the effects on the size of the credit market and the trad-ing activity in the stock market are consistent with the Allen and Gale (2000), Kodresand Pritsker (2002), and Brunnermeier and Pedersen (2005) liquidity-induced conta-gion mechanism. Furthermore, the predictability of returns based on ABX returns isalso consistent with the time-varying risk premium contagion mechanism implied byVayanos (2004), Acharya and Pedersen (2005), and others.
On the other hand, these results leave open the door for other possibly behavioralexplanations. It is puzzling that returns for the lower-credit-quality ABX indexes areable to forecast returns for the higher-credit-quality ABX indexes. It is even morepuzzling that ABX returns have so much forecast power for stock and bond marketreturns several weeks ahead. It may be that extremely bad news is incorporated morerapidly into the prices of the distressed assets than into the prices of nondistressedassets; that the stock and Treasury bond markets experienced something akin to a“deer-in-headlights” phenomenon. Thus, the nature of the price-discovery process infinancial markets could be state dependent.
The remainder of this paper is organized as follows. Section 2 briefly reviews theliterature on contagion in financial markets. Section 3 provides an introduction to theasset-backed CDO market. Section 4 describes the ABX indexes and the other dataused in the study. Section 5 presents the empirical results. Section 6 summarizes theresults and presents concluding remarks.
2. CONTAGION IN FINANCIAL MARKETS
The literature on contagion in financial markets is far too extensive for us to reviewfully here. Kindleberger (1978), Dornbusch, Park, and Claessens (2000), and Kamin-sky, Reinhart, and Vegh (2003), however, provide excellent surveys. Generally, thisliterature has focused on contagion effects across countries. Contagion, however, ispossible in virtually any set of financial markets. In this section, we will simply sum-marize some of the key implications of the contagion literature for the behavior ofsecurity prices during periods of extreme market distress.
Following Dornbusch, Park, and Claessens (2000), Kaminsky, Reinhart, and Vegh
3

(2003), Bae, Karolyi, and Stulz (2003), and many others, we adopt a working definitionof financial contagion as an episode in which there is a significant increase in cross-market linkages after a shock occurs in one market. The literature identifies at leastthree major channels by which contagion effects can be propagated through differentfinancial markets.
The first can be termed the correlated-information channel. In this mechanism,a shock to one financial market signals economic news that is directly or indirectlyrelevant for security prices in other markets. For example, Dornbusch, Park, andClaessens (2000) describe direct effects occuring through fundamentals such as tradelinks. Kiyotaki and Moore (2002) describe a balance-sheet channel in which losses inone market translate into declines in the equity of other firms holding the distressedassets. King and Wadhwani (1990) present a model in which contagion occurs asrational agents attempt to infer information from price changes in other markets. Acommon implication throughout the correlated information literature is that contagionoccurs rapidly via the price-discovery process. Thus, this channel should result inimmediate price effects in the markets affected by the distress event, particularly whenthese markets are more liquid that the market in which the original distress eventoccurs.
The second can be designated the liquidity channel. In this mechanism, a shock toone financial market results in decrease in the overall liquidity of all financial markets.In turn, this may affect investor behavior and asset prices. For example, Allen and Gale(2000) present a model in which banks have cross holdings of deposits across regions.In this model, financial shocks cause banks to liquidate these cross holdings, therebydenying liquidity to other regions. Kodres and Pritsker (2002) present a model in whichcontagion occurs as losses in one market force economic agents to either liquidateleveraged positions or to rebalance their portfolios in response. Brunnermeier andPedersen (2007) argue that agents who experience losses in one market may find theirability to obtain funding impaired, which then would result in declines in the liquidityof the other financial assets in the markets. A key implication of this liquidity-relatedchannel of contagion is that a distress event may be associated with subsequent declinesin the availability of credit and increases in trading activity in other markets.
The third can be termed the risk-premium channel. In this mechanism, financialshocks in one market may affect the willingness of market participants to bear risk inany market. Thus, prices in all markets may be affected as equilibrium risk premiachange in response. For example, Vayanos (2004) and Acharya and Pedersen (2005)present models in which shocks such as those that might result from a distress eventtranslate into major changes in the equilibrium risk premia of assets in the economy.An important implication of this time variation in risk premia is that return shocks tothe distressed security will be predictive for the subsequent returns of other assets.
Although similar in many ways, these three contagion channels each have different
4

implications for the behavior of security prices across markets when a distress eventoccurs. We will explore these empirical implications later in the paper.
3. THE SUBPRIME ASSET-BACKED CDO MARKET
In the current credit crisis, tranches or CDOs based on the cash flows of portfolios ofsubprime home-equity loans have been the major source of credit losses to many finan-cial institutions. Accordingly, we will focus primarily on these securities throughoutthis study. This section provides a brief introduction to the asset-backed securities(ABS) market.
Subprime CDOs were aggressively sold to investors during the past several yearsand were widely viewed as one of the most important financial innovations of the pastdecade. According to the Securities Industry and Financial Markets Association, thetotal U.S. issuance of asset-backed securities during the 2005-2007 period was $3.289trillion, and the total U.S. issuance of CDOs during the same period was $965 billion.
Asset-backed tranches or CDOs share many features in common with CDOs forcorporate bonds. As described in Longstaff and Rajan (2008), a CDO is created byan issuer first forming a portfolio of loans, either by lending money directly, or bybuying debt securities in the marketplace.3 In the ABS market, these loans couldconsist of first mortgages, second mortgages, loans on manufactured homes, creditcard receivables, auto loans, student loans, and even account receivables.4 Once theportfolio is formed, the CDO issuer sells tranches based on the cash flows scheduledto be generated by the underlying loans. Typically, the tranches vary in terms of theirsubordination. For example, the equity or residual tranche receives a high coupon onits principal amount, but is first in line to absorb any credit losses suffered by theunderlying portfolio. On the other hand, a supersenior tranche might only receive acoupon of Libor plus 20 basis points, but would not suffer any credit losses until afterthe total credit losses for the portfolio exceeded 15 percent.
In effect, a ABS CDO structure could be viewed as a synthetic lender where theassets consist of, say, subprime home equity loans and where the capital structureconsists of equity, subordinated debt, and senior debt (all often in the form of floating-rate notes). From a CDO issuer’s perspective, the advantages of issuing CDOs isthat it allows the issuer to make loans, repackage them, and then sell them to thirdparties, thereby allowing the issuer to earn fees from originating and then servicing the
3Alternatively, a synthetic CDO could be constructed through the use of credit defaultswaps.4For an excellent review of the ABS market, see Rajan, McDermott, and Roy (2007).
5
loans without having to commit their capital permanently. Of course, this mechanismcreates a number of moral hazard risks since the issuer is aware that he may not sufferany credit losses on the loans he makes since they will be sold as repackaged CDOs.
To provide an illustration of a typical subprime ABS CDO, Table 1 gives thedetails of a $900 million CDO sponsored by Countrywide Home Loans, Inc. andissued through Lehman Brothers in February 2006. The issuing entity is designedas CWABS Asset-Backed Certificates Trust 2006-1. Of the total notional amountunderlying the CDO, about $500 million is based on subprime fixed-rate mortgages,while $400 million is based on subprime floating-rate mortgages. On the fixed-rate side,the CDO consists of 12 separate tranches. The first six are equal in seniority but differin terms of their coupon rates and collateral. The other six tranches are subordinatedsequentially, with the MF-6 tranche absorbing the first $5.525 million in losses, theMF-5 tranche absorbing the next $6.188 million in losses, etc. A similar structureapplies on the floating-rate side of the portfolio with the MV-7 tranche absorbing thefirst $5.549 million of losses, the MV-6 tranche absorbing the next $5.907 million oflosses, etc. The average FICO score for the fixed-rate and floating-rate loans is 611 and618, respectively, placing these loans squarely in the subprime category. Interestingly,while some of the underlying mortgages bear low “teaser” rates, many carry very highmortgage rates; the mortgage rates for the loans in the underlying portfolio vary from4.95 to 12.00 percent. Given the different positions of the tranches in the capitalstructure “pecking order,” it is not surprising that the tranches can have differentcredit ratings. Table 1 shows that the initial credit ratings for the tranches offeredrange from Aaa/AAA to Baa1/A.
Since each of these CDO tranches can be viewed as either a fixed-rate bond or afloating-rate note, the prices of these securities are generally quoted per $100 notional.To illustrate, the MF-1 tranche in the CWABS 2006-1 example has a Bloomberg quotedprice of 65.00 on December 4, 2007. Thus, an investor who acquired this tranche atthe issue price of 99.99814 on February 8, 2006 would have mark-to-market loss ofnearly 35 percent. Given that this tranche initially had a credit rating of AA1/AA+,the subsequent large decline in the value of the tranche argues that the initial creditrating may have been overly optimistic.
From the perspective of the ABS CDO markets, there are several key events orthreads that underlie the current distressed state of the market. First, the unexpectedwave of subprime defaults and declines in housing values has created severe uncertaintyabout what the ultimate magnitude of credit losses will be. Second, given the inherentcomplexity of the underlying loan portfolios on which asset-backed CDOs are based(as evidenced from the Countrywide example in Table 1), many participants in thefinancial markets appear to have placed a high degree of reliance on the credit ratingsprovided by the ratings agencies in making investment and pricing decisions. Whenthe rating agencies began to backtrack from their previous optimistic ratings in mid-
6
2007 and the liquidity in secondary CDO markets dried up, many investors were leftcompletely in the dark as to what their asset-backed CDO positions were actuallyworth.
4. THE ABX INDEXES
To measure the returns on subprime CDOs, we use market quotations for the widely-known ABX indexes maintained by Markit Group Ltd. These indexes consist of dailyclosing values obtained from market dealers for subprime home-equity-related CDOs ofvarious credit ratings.5 In particular, the ABX indexes consist of five separate indexes,where each of these indexes is based on the market quotations of a specific basket ofdistinct subprime CDOs.
The AAA index is based on a portfolio of 20 subprime home-equity CDOs withinitial credit ratings of AAA. The AA index is based on a portfolio of 20 subprimehome-equity CDOs with initial credit ratings of AA. Similarly, the other three indexesare based on portfolios of subprime home-equity CDOs with credit ratings of A, BBB,and BBB−, respectively. Each index is a simple average of the prices for the 20 CDOsor tranches in the basket, where prices are quoted relative to a $100 notional position.
The 20 subprime deals that appear in each basket are chosen from among the qual-ifying deals of the largest subprime home equity asset-backed security shelf programsduring the six-month period preceeding the formation of the indexes. The algorithmfor choosing the 20 subprime CDOs to be included in each index limits the same loanoriginator to four deals and the same master servicer to six deals. The minimum dealsize is $500 million. Each CDO (tranche) must have a weighted average life betweenfour to six years as of the issuance date (except the AAA tranche which must begreater than five years). The tranches must be rated by Moody’s and Standard andPoors; the lesser of the ratings applies. At least 90 percent of a deal’s assets mustbe first lien mortgages, and the weighted average FICO credit score for loans under-lying the tranche must be less than 620. Deals must pay on the 25th of each monthand referenced tranches must bear interest at a floating-rate benchmark of one-monthLibor. The five ABX indexes are reconstituted every six months. The first series ofABX indexes were formed in January 2006 and are designated the ABX.HE 1 AAA,AA, A, BBB, and BBB− indexes. The second series of ABX indexes were formed inJuly 2006 and are designated the ABX.HE 2 AAA, AA, A, BBB, and BBB− indexes.
5Market makers for the ABX indexes during our sample period include Bank of Amer-ica, BNP Paribas, Deutsche Bank, Lehman Brothers, Morgan Stanley, Barclays Cap-ital, Citigroup, Goldman Sachs, RBS Greenwich Capital, UBS, Bear Stearns, CreditSuisse, JP Morgan, Merrill Lynch, and Wachovia.
7

Similarly for the ABX.HE 3 and ABX.HE 4 indexes which were formed in January2007 and July 2007, respectively.
Market quotations for the ABX indexes can be difficult to obtain. Fortunately, wewere given access to a proprietary data set by a major fixed income asset managementfirm that includes daily closing values for all of the ABX.HE 1, 2, 3, and 4 indexesfor the two-year period from the inception of the ABX index in January 19, 2006 toDecember 26, 2007. Table 2 presents summary statistics for the ABX indexes. Figure1 plots the time series of ABX.HE 1 AAA, AA, A, BBB, and BBB− indexes duringthe sample period.
Table 2 and Figure 1 illustrate the wide variation in the market valuations ofsubprime ABS tranches during the sample period. Table 3 provides a chronologyof the major crisis events during 2007. This chronology is taken from an extensivetimeline reported by Reuters.
As shown in Table 2, the market values of the tranches ranged from 99.18 to100.28 at the beginning of 2006. There is only minor variation in these prices untilthe beginning of 2007. By the end of February 2007, the BBB− index had declinedto about 80. This coincides with the February 2007 evidence of subprime losses andprofit warnings by subprime lenders. After February, the indexes recovered partially.By mid 2007, however, the indexes began to decline precipitously. Similar patternsare observed for the ABX.HE 2, 3, and 4 indexes.
5. THE EMPIRICAL ANALYSIS
Although the subprime mortgage crisis is far from over, it merits attention as analmost “perfect storm” example of a financial contagion event. As the crisis began tounfold at the beginning of 2007, market participants gradually realized that the actualcash flows from their holdings of ABS CDOs might ultimately be far less than theyhad anticipated given the high credit ratings these securities initially carried. As themark-to-market values of these securities plummeted, fears about the viability of thefinancial institutions holding these securities grew. Some of these fears are currentlybeginning to be realized with large institutions such as Bear Stearns, Countrywide,and IndyMac Bank either failing, or being forced to merge. At this date, even thesolvency of government sponsored agencies such as Fannie Mae and Freddie Mac isin doubt, and credit default swaps on the sovereign debt of the U.S. Government aretraded with the cost of credit protection being as high as 25 basis points.
In exploring the empirical implications of the contagion literature for the subprimecrisis, our approach will be to test whether there is an increase in cross-market linkages
8

between the ABS CDO market and other markets during the crisis period. Thisapproach is motivated by the standard definition in the literature of contagion as achange in the linkages between markets after a distress event. Specifically, we apply avector autoregression (VAR) framework that allows us to estimate the relation betweenreturns during the 2006 pre-crisis period separately from the relation between returnsduring the 2007 crisis period. The choice of 2007 as the crisis period is motivated bythe timeline provided in Table 3. An important advantage of this VAR framework isits ability to identify empirical relations while avoiding endogeneity problems amongvariables.
5.1 The VAR Variables
To capture valuation effects in the distressed ABS CDO market, we use the returns onthe ABX indexes (formed from the on-the-run series, e.g. rolling the series from ABX-HE 1 to ABX-HE 2 when the latter index is constructed, etc.). Specifically, we usethe weekly (Wednesday to Wednesday) returns for the corresponding on-the-run ABXindex. Altogether, we have five such on-the-run series of returns, each representinga different credit rating, which we designate ABXAAA, ABXAA, ABXA, ABXBBB ,and ABXBBB−.
As measures of the valuation effects in other markets, we focus primarily on theTreasury bond and stock markets. To capture changes in the Treasury bond market,we use weekly changes (over the same period as for the ABX returns) in the constantmaturity one-year and ten-year Treasury yields (obtained from the Federal ReserveBoard’s website). Yields are measured in percentage terms. Thus, a one-basis pointyield change from, say, 4.50 to 4.51 equals 0.01.
To capture changes in the stock market, we use two different measures. Specif-ically, we collect weekly return data for both the S&P 500 index and the S&P 500subindex of financial firms (dividends omitted from both return series). This subindexcurrently consists of 92 commercial and investment banks, insurance companies, homelenders, government sponsored entities such as Fannie Mae and Freddie Mac, andmonoline bond insurers such as AMBAC. The S&P 500 subindex of financial firmscan be viewed as a broader measure of “moderately distressed” assets since many ofthese firms have exposure to the subprime market through their portfolio holdings.The data for the S&P 500 indexes are obtained from the Bloomberg system.
In addition to valuation effects, we also consider variables that proxy for changesin the availability of funding or funding liquidity in the financial markets. In general,measuring changes in the aggregate size of the credit sector over a short period such asa week is challenging. In the current subprime crisis, however, considerable attentionhas focused on the commercial paper market. Over the past decade, this market hasgrown to a notional size on the order of $2 trillion and has become a major sourceof short-term funding for financial institutions, investors, and corporations. Given
9

that the median maturity of commercial paper is on the order of 30 days, percentagechanges in the size of this market may provide a useful proxy for discretionary changesin the amount of short-term credit provided in the financial markets. We obtain weekly(Wednesday) data on the size of the commercial paper market from the Federal ReserveBoard’s website.
Finally, to explore whether the subprime crisis is associated with portfolio re-balancing or flight-to-quality behavior in the market, we compute the ratio of theaggregate weekly trading volume for the firms in the S&P 500 subindex of financialfirms to the aggregate weekly trading volume for all firms in the S&P 500 index. Incomputing this ratio for week i, we use the volume data for the week immediatelybefore and including the Wednesday of week i. The rationale for considering this vari-able is that if agents only trade the market (as standard portfolio theory suggests),then no segment of the market should be traded more than any other. Thus, thisratio should remain constant even during a crisis. On the other hand, finding that thestocks in the S&P 500 subindex of financial firms are traded more intensively than theremaining S&P 500 firms during the crisis would provide evidence consistent with aflight to quality or a major rebalancing of portfolios in the financial markets.
5.2 Was There Contagion Across ABX Indexes?
We begin by first examining whether the various ABX indexes of ABS CDO prices be-haved similarly as the crisis unfolded. In doing this, however, it is important to be veryclear about what conclusions can and cannot be drawn from this analysis. In partic-ular, we chose this market and time period to study precisely because of the repeatednegative shocks it has experienced. Thus, finding evidence of serial correlation in ABXreturns may simply represent “look back” bias in the sample. Alternatively, evidence ofserial correlation may also simply be due to the effect of stale or infrequently-updatedprices in the illiquid ABS CDO market. An important advantage of the VAR approachwe adopt is that we can test whether there are spillover effects from one ABX index toa second ABX index after controlling for the lagged returns of the second ABX index.Thus, inferences about spillovers should be free from this type of “look back” bias.
To explore the relation between the various ABX index returns we estimate thefollowing VAR specification,
ABXi,t = γ0 +4∑
k=1
γ1kABXi,t−k + γ2kI2006ABXj,t−k + γ3kI2007ABXj,t−k + εi,t, (1)
where ABXi,t, ABXj,t, i �= j represent returns on ABX indexes, and I2006 and I2007
are dummy variables that take value one when t is in the respective year, and zerootherwise. In this specification, the γ2k capture the relation between ABXj returns and
10

subsequent ABXi returns during 2006, while the γ3k coefficients capture the relationduring 2007. If there was contagion across the ABX indexes once the subprime crisisbegan, then we would expect the relation to be much stronger during 2007 than during2006.
Table 4 reports the estimation results. Specifically, we report the t-statistics forthe γ2k and γ3K coefficients. In addition, we report the p-value for the F -test that theγ2k coefficients are jointly zero. Similarly, we report the p-value for the F -test thatthe γ3k coefficients are jointly zero. These tests allow us to determine whether there isa significant difference in the relation between ABX returns across the pre-crisis andcrisis periods.
Table 4 shows clearly that there is no significant lead-lag relation between the ABXindexes during 2006. After controlling for each ABX index’s lagged values, none of theother ABX indexes have any forecast ability during 2006. Similarly, the hypothesisthat the γ2k coefficients are jointly zero is never rejected in the VARs.
The results, however, are dramatically different during the 2007 crisis period.Many of the γ3k coefficients become highly significant once the crisis begins, providingclear evidence of a major increase in cross-market linkages. The joint tests indicatethat most of the ABX indexes are significantly predictable on the basis of lagged valuesof the other ABX indexes. The primary exception is the BBB− index which is notsignificantly predictable on the basis of AAA index returns.
This latter result, along with the observation that many of the t-statistics and p-values for the higher-credit ABX indexes reject the null hypothesis much more soundlythan for the lower-credit ABX indexes, suggests that the direction of financial conta-gion was from the lower-credit to higher-credit ABX indexes. This view is also stronglysupported by the adjusted R2’s for the VARs. In particular, the AAA, AA, and AABX indexes are much more predictable by the other lagged ABX indexes than is thecase for the BBB and BBB− ABX indexes.6
In summary, there is strong evidence that linkages across the different ABX in-dexes increased dramatically after the onset of the subprime crisis. Furthermore,shocks to the highest-rated ABX indexes were much more predictable than those forthe lowest-rated ABX indexes, consistent with the view that contagion spread slowlyfrom the sectors whose cash flows were impacted first by subprime borrowers’ defaults
6The nature of the time series properties of these ABX indexes is very relevant given therecently announced investigations by the Federal Bureau of Investigation, the Securitiesand Exchange Commission and the U.S. Attorney in New York. These agencies haveopened criminal inquiries into whether a dozen or more major financial firms includingUBS and Merrill Lynch deliberately failed to mark their CDOs to market as their pricescontinued to decline. See Scannell, Raghavan, and Efrati (2008).
11

to the other sectors. These slow-moving valuation effects are somewhat challengingto reconcile with the correlated-information view of contagion. In contrast, these ef-fects appear more similar to those that would be anticipated from the risk-premiumchannel.
5.3 Was There Contagion Across Markets?
Turning now to the question of whether the subprime crisis resulted in increased cross-market linkages between the ABS CDO market and other major markets, we estimatethe following VAR system,
Yt = γ0 +4∑
k=1
γ1kYt−k + γ2kI2006ABXt−k + γ3kI2007ABXt−k + εi,t. (2)
for six different specifications of the dependent variable Yt. Specifically, as the depen-dent variable Yt, we use the changes in the one-year and ten-year yield, the returns onthe S&P 500 index, the returns on the subindex of S&P 500 financial firms, percent-age changes in the amount of commercial paper outstanding, and the ratio of financialto market stock trading volume. As before, the γ2k coefficients capture the relationbetween the ABX index and subsequent values of Y during 2006, while the γ3k coef-ficients capture the corresponding relation during 2007. The four-week lag structureis suggested by the typical 30-day maturity of the commercial paper market and isalso consistent with the Akaike AIC criterion. Note that for every specification of thedependent variable Y , we estimate the system five different times, each time using adifferent ABX index. Table 5 reports the VAR estimation results.
For the pre-crisis 2006 period, Table 5 shows a pattern very similar to that in Table4. Specifically, there is no evidence of any significant linkage between the ABX marketsand any of the six dependent variables. This is evident both from the individual t-statistics for the γ2k coefficients and from the p-values for the F -test of joint significancefor the γ2k coefficients. These results for the 2006 period are intuitive since the ABSCDO market is much less liquid than the Treasury and stock markets. Thus, inordinary circumstances, we would anticipate that there would be very little informationin the ABX indexes that might be useful in forecasting Treasury and stock marketreturns.
Once the subprime crisis began in 2007, however, the relation between ABX re-turns and the other markets changed dramatically. Table 5 shows that in virtuallyevery VAR specification, the lagged values of the ABX indexes have significant forecastability for the other markets.
Focusing first on changes in the one-year Treasury yield, Table 5 shows that allfive of the ABX indexes have strong forecast ability as far as three weeks ahead; the
12
t-statistics for the third lagged value of the five ABX indexes range from 3.50 to 6.47.Each of the significant coefficients is positive, indicating that a negative shock to theABX index translates into a decline in the one-year Treasury yield, which, in turn,implies an increase in the value of the one-year Treasury bond. Thus, these results areconsistent with a flight-to-quality in the Treasury bond market in response to shocksin the subprime market.
Similarly, the lagged ABX returns are highly significant in predicting changes inthe ten-year Treasury yield. The second lagged ABX return is significant for the AAAindex, and the third lagged ABX return is significant for the other four indexes. Again,the sign of the significant coefficients are all positive which is consistent with a flight-to-quality. Interestingly, the magnitude of the coefficients for the ten-year Treasurybonds is roughly the same as that for the one-year Treasury bonds. Recall, however,that the duration and, therefore, the price effect on the value of a ten-year bond ismany times that for the one-year bonds. Thus, these results imply large increasesin the value of ten-year Treasury bonds stemming from declines in the value of ABSCDOs.
Turning to the stock market results, Table 5 shows that the lagged ABX returnshave significant forecasting ability for the S&P 500 financial subindex. In particular,the third lag of the ABX index return is significant at the five-percent level for theAA, A, BBB, and BBB− indexes. In contrast, the first lag for the AAA index issignificant. This latter result is consistent with the earlier finding that contagioneffects arrive in the higher-rated ABX indexes more slowly and, therefore, the forecastability of the AAA index is limited to the first lag. The sign of the coefficients for mostof the significant lagged ABX returns are positive as would be expected. In particular,negative returns for the ABX index forecast negative returns for financial firms.
The results for the S&P 500 index show that the ABX index returns are alsoable to predict broader stock market returns. The first lag of the AAA ABX index issignificant, while the third lags of the AA, A, and BBB indexes are significant. Thesecond lag of the BBB− index is also significant. Again, the signs for the significantcoefficients are all positive, implying that downward shocks in the value of the ABSCDOs translate into subsequent declines in the value of the S&P 500.
Recall that time variation in risk premium may be one source of predictabilityin asset returns. Consistent with this, Table 5 shows that both the Treasury bondand stock market regressions display a high level of predictability. The adjusted R2sfor the one-year Treasury yield regressions range from about 25 to 36 percent, whilethe adjusted R2s for the ten-year Treasury yield regressions range from about 8 to 15percent. These adjusted R2s are very significant and compare favorably to those forthe forward rate forecasting models presented in Cochrane and Piazzesi (2005).
The VAR results show that the stock market returns are likewise highly pre-
13

dictable on the basis of ex ante data. In fact, the S&P 500 financial subindex displaysa stunning amount of predictability, with adjusted R2s ranging from 28 to 38 percent.These values far exceed most of the stock market predictability results previously doc-umented in the literature.7 The adjusted R2s for the S&P 500 index returns are notas high, but are still very economically significant, with values ranging from about 11to 17 percent.
Taken together, this evidence of predictability provides strong support for thenotion that there were spillover or contagion effects to other markets as the creditcrisis unfolded; cross-market linkages become much more important and significantduring the subprime crisis. These results shed light on the earlier discussion aboutthe nature of the contagion mechanism in financial markets. Our evidence that laggedABX index returns contain significant information about future stock and bond mar-ket returns argues strongly that commonality in time varying risk premia may be animportant mechanism in explaining apparent contagion or spillovers in financial mar-kets. In contrast, if the time series properties of ABX index returns were due to illiquidpricing instead, lagged values of the ABX index would not contain information usefulin forecasting bond and stock returns.
Turning next to the credit-market implications, the VAR results show that theshocks to the lower-rated ABX indexes translate into shocks in the size of the commer-cial paper market. In particular, the coefficients for the third ABX lags are significantwhen the BBB, and BBB− indexes are included in the specification. The signs ofthese coefficients are positive, indicating that a decline in the value of the ABX indexis associated with a decline in the size of the commercial paper market. The signifi-cant coefficients are all positive in sign. These results are consistent with the modelpresented by Brunnermeier and Pedersen (2005) in which funding shocks in one mar-ket may translate into broad liquidity and valuation shocks in other markets, therebygenerating pervasive contagion effects in financial markets.
The VAR results indicate that ABX index returns have significant forecast abilityfor the trading volume ratio. In particular, the first and third lagged ABX returns arenegative and significant (at the ten-percent level) for each of the five ABX indexes.This implies that a downward shock in the value of the ABX indexes maps into asignificant increase in the trading volume of financial firms relative to nonfinancialfirms in the S&P 500 index. These results suggest that investors did not simply tradethe market as the subprime distress event unfolded, but concentrated their trading inthe financial sector. These results are again consistent with both the Brunnermeier andPedersen (2005) funding illiqudity contagion mechanism as well as with the portfoliorebalancing implications of Allen and Gale (2000), Pritsker and Kodres (2002), and
7As examples of the recent market predictability literature, see Lettau and Ludvigson(2001) and Cochrane (2006),
14

others. These results are also consistent with the view that that contagion duringthe subprime crisis was spread through a risk-premium channel which, in turn, wasassociated with major portfolio rebalancing by market participants.
6. CONCLUSION
The 2007 subprime crisis provides an ideal opportunity for studying the effects ofcontagion in financial markets. We use data for the ABX indexes of subprime ABSCDOs to examine whether contagion occured across markets at the crisis developed.Motivated by the frequently adopted definition of contagion in the literature as asignificant increase in cross-market linkages after a major distress event, we use aVAR framework to test for changes in the relation between the ABX market and otherfinancial markets after the onset of the crisis.
The results provide dramatic evidence of an increase in cross-market linkages.Prior to the subprime crisis, ABX returns contain no useful information for forecastingreturns in other major markets. After the crisis began, however, the ABX indexesbecame highly predictive for both Treasury bond and stock market returns. In manycases, the illiquid and lowest-rated ABX indexes are able to forecast Treasury bondand stock market returns up to three weeks ahead with surprisingly high adjusted R2s.These results provide strong support that financial contagion spread across marketsas the subprime crisis unfolded.
A key aspect of the study is that the results allow us to contrast among thedifferent models of contagion that appear in the extensive literature on the subject.For example, the length of the forecast horizon, in many cases as long as three weeks,argues against the view that contagion is spread via the correlated-information channel.The reason for this is simply that we would expect that price-discovery in the highly-liquid stock and Treasury bond markets would occur much more rapidly if the sourceof contagion was correlated information. In contrast, the significant declines in the sizeof the credit market, as well as the increase in portfolio rebalancing in the financialsector associated with negative shocks in the ABS CDO market, provide evidenceconsistent with the view that contagion is spread via a liquidity channel as argued byAllen and Gale (2000), Brunnermeier and Pedersen (2005), and others. Finally, theincreased degree of predictability in financial markets associated with the crisis is alsoconsistent with contagion being spread via a risk-premium channel, consistent withVayanos (2004), Acharya and Pedersen (2005), and others.
On the other hand, these results also leave us with a puzzle. The magnitude ofthe predictive power of the ABX index returns is so large as to raise questions as to
15

whether it can be fully explained by any of the contagion mechanisms put forward inthe literature. In particular, it could be argued that these results are also compatiblewith a behavioral “deer-in-headlights” reaction on the part of the market to extremelybad news.
16

REFERENCES
Acharya, Viral, and Lasse H. Pedersen, 2005, Asset Pricing with Liquidity Risk, Journalof Financial Economics 77, 375-410.
Allen, Franklin, and Douglas Gale, 2000, Financial Contagion, Journal of Political Economy108, 1-33.
Allen, Franklin, and Douglas Gale, 2004, Financial Intermediaries and Markets, Economet-rica 72, 1023-1061.
Andrade, Gregor, and Steven N. Kaplan, 1998, How Costly is Financial (not Economic) Dis-tress? Evidence from Highly Leveraged Transactions that Became Distressed, Journalof Finance 53, 1443-1493.
Asquith, Paul, Robert Gertner, and David Scharfstein, 1994, Anatomy of Financial Dis-tress: An Examination of Junk-Bond Issuers, Quarterly Journal of Economics 109,625-658.
Bae, Kee Hong, Andrew Karolyi, and Rene Stulz, 2003, A New Approach to MeasuringFinancial Market Contagion, Review of Financial Studies 16, 717-764.
Brunnermeier, Markus K. and Lasse H. Pedersen, 2005, Predatory Trading, Journal ofFinance 60, 1825-1863.
Brunnermeier, Markus K. and Lasse H. Pedersen, 2007, Market Liquidity and FundingLiquidity, Review of Financial Studies, forthcoming.
Carlin, Bruce I., Miguel S. Lobo, and S. Vishwanathan, 2007, Episodic Liquidity Crises:Cooperative and Predatory Trading, Journal of Finance 62, 2235-2274.
Clark, Kent and Eli Ofek, 1994, Mergers as a Means of Restructuring Distressed Firms: AnEmpirical Investigation, Journal of Financial and Quantitative Analysis 29, 541-565.
Cochrane, John H., 2006, The Dog that did not Bark: A Defense of Return Predictability,Review of Financial Studies, forthcoming
Cochrane, John H., and Monika Piazzesi, 2005, Bond Risk Premia, American EconomicReview 95, 138-160.
Dornbusch, Rudiger, Yung Chul Park, and Stijn Claessens, 2000, Contagion: Understand-ing How it Spreads, The World Bank Research Observer 15, 177-197.
John, Kose, and Eli Ofek, 1995, Asset Sales and Increase in Focus, Journal of FinancialEconomics 37, 105-126.
Kahl, Matthias, 2002, Economic Distress, Financial Distress, and Dynamic Liquidation,
17

Journal of Finance 57, 135-168.
Kaminsky, Graciela, Carmen Reinhardt, and Carlos Vegh, 2003, The Unholy Trinity ofFinancial Contagion, Journal of Economic Perspectives 17, 51-74.
Kindleberger, Charles, 1978, Manias, Panics, and Crashes, New York: Basic Books.
King, Mervyn, and Sushil Wadhwani, 1990, Transmission of Volatility between Stock Mar-kets, Review of Financial Markets 3, 5-33.
Kiyotaki, Nobuhiro, and John Moore, 2002, American Economic Review: Papers and Pro-ceedings 85, 62-66.
Kodres, Laura and Matthew Pritsker, 2002, A Rational Expectations Model of FinancialContagion, Journal of Finance 57, 769-800.
Kyle, Albert S. and Wei Xiong, 2001, Contagion as a Wealth Effect, Journal of Finance56, 1401-1440.
Lettau, Martin, and Sydney Ludvigson, 2001, Consumption, Wealth, and Expected Re-turns, Journal of Finance 55, 815-849.
Longstaff, Francis A., 2004, The Flight-to-Liquidity Premium in U.S. Treasury Bond Prices,Journal of Business 77, 511-526.
Longstaff, Francis A., 2008, Train Wrecks: Asset Pricing and the Valuation of SeverelyDistressed Assets, Working paper, UCLA.
Longstaff, Francis A. and Arvind Rajan, 2008, An Empirical Analysis of the Pricing ofCollateralized Debt Obligations, Journal of Finance 63, 529-563.
Opler, Tim C. and Sheridan Titman, 1994, Financial Distress and Corporate Performance,Journal of Finance 49, 1015-1040.
Pulvino, Todd C., 1998, Do Asset Fire Sales Exist? An Empirical Investigation of Com-mercial Aircraft Transactions, Journal of Finance 53, 939-978.
Rajan, Arvind, Glen McDermott, and Ratul Roy, 2007, The Structured Credit Handbook,John Wiley & Sons, Hoboken, NJ.
Scannell, Kara, Anita Raghavan, and Amir Efrati, 2008, The Subprime Cleanup Intensifies,Wall Street Journal, February 2, B1.
Shleifer, Andrei, and Robert W. Vishny, 1992, Liquidation Values and Debt Capacity: AMarket Equilibrium Approach, Journal of Finance 47, 1343-1366.
Vayanos, Dimitri, 2004, Flight to Quality, Flight to Liquidity, and the Pricing of Risk,Working paper, London School of Economics.
18

Table 1
Countrywide Subprime ABS CDO Structure CWABS 2006-1. This table reports some of the contractual terms listed in the prospectus forthis asset-backed CDO structure. The L in the initial pass-thru rate represents one-month Libor. The seniority ranking n/m means that the tranchesseniority is n-th out of m tranches.
Price Under- Initial Initial InitialNotional to Writer Pass-thru Moody’s S&P Seniority
Tranche Amount Public Fee Rate Maturity Rating Rating Ranking
AF-1 147,232,000 100.0000 0.0521 L+ 0.130% Nov 2025 Aaa AAA 1/7AF-2 22,857,000 99.9995 0.1042 5.281% May 2027 Aaa AAA 1/7AF-3 90,995,000 99.9998 0.1563 5.384% Jul 2033 Aaa AAA 1/7AF-4 21,633,000 99.9985 0.2500 5.714% Sep 2034 Aaa AAA 1/7AF-5 38,617,000 99.9987 0.3333 5.884% Jul 2036 Aaa AAA 1/7AF-6 44,200,000 99.9980 0.4167 5.526% May 2036 Aaa AAA 1/7MF-1 13,260,000 99.9981 0.4167 5.917% May 2036 Aa1 AA+ 2/7MF-2 12,155,000 99.9972 0.5000 6.016% May 2036 Aa2 AA+ 3/7MF-3 7,293,000 99.9965 0.5833 6.115% Apr 2036 Aa3 AA 4/7MF-4 6,409,000 99.4627 0.8333 6.200% Apr 2036 A1 AA- 5/7MF-5 6,188,000 98.9985 1.0000 6.200% Mar 2036 A2 A+ 6/7MF-6 5,525,000 98.5371 1.2500 6.200% Feb 2036 A3 A 7/7
AV-1 139,560,000 100.0000 0.0522 L+0.080% Jul 2028 Aaa AAA 1/8AV-2 115,712,000 100.0000 0.1033 L+0.190% May 2035 Aaa AAA 1/8AV-3 25,042,000 100.0000 0.1033 L+0.300% Jun 2036 Aaa AAA 1/8MV-1 14,320,000 100.0000 0.4167 L+0.390% May 2036 Aa1 AA+ 2/8MV-2 13,067,000 100.0000 0.5000 L+0.410% May 2036 Aa2 AA+ 3/8MV-3 7,518,000 100.0000 0.8333 L+0.440% May 2036 Aa3 AA 4/8MV-4 6,802,000 100.0000 0.9167 L+0.560% Apr 2036 A1 AA- 5/8MV-5 6,802,000 100.0000 0.9667 L+0.600% Apr 2036 A2 A+ 6/8MV-6 5,907,000 100.0000 1.0000 L+0.660% Mar 2036 A3 A 7/8MV-7 5,549,000 100.0000 1.0833 L+1.300% Mar 2036 Baa1 A 8/8

Table 2
Summary Statistics for ABX Home-Equity CDO Tranches. This table reports summary statistics for the indicate ABX indexes. Prices arequoted relative to a $100 notional position. The sample consists of daily closing prices for the January 25, 2006 to December 26, 2007 period.
StandardIndex Rating Mean Deviation Minimum Median Maximum N
ABX HE 1 AAA 99.35 1.88 90.09 100.26 100.38 486AA 98.06 4.75 77.58 100.31 100.73 486A 93.51 12.04 47.11 100.12 100.51 486BBB 87.53 20.66 25.00 99.83 101.20 486BBB− 84.54 23.29 21.83 99.24 102.19 486
ABX HE 2 AAA 97.36 4.52 79.97 99.57 100.12 362AA 92.60 12.56 51.47 99.50 100.12 362A 83.67 21.36 33.59 95.04 100.12 362BBB 72.98 27.82 18.61 83.00 100.58 362BBB− 68.70 28.83 16.63 73.32 100.94 362
ABX HE 3 AAA 93.74 8.31 68.92 99.08 100.09 236AA 82.99 20.07 37.47 97.42 100.09 236A 68.35 27.58 24.00 81.82 100.01 236BBB 54.35 25.77 17.56 61.43 98.35 236BBB− 50.01 23.61 16.84 54.30 97.47 236
ABX HE 4 AAA 86.75 10.15 66.41 91.44 99.33 109AA 68.67 20.32 34.67 78.06 97.00 109A 49.04 15.93 23.97 56.65 81.94 109BBB 33.83 10.24 19.88 39.56 56.61 109BBB− 31.27 9.20 18.90 36.73 50.33 109

Table 3
Timeline of the 2007 Subprime Crisis. Source: Reuters.
Late 2006 The U.S. housing market slows after 2 years of increases in official interest rates. Delinquencies rise, a wave of bankruptcies.Feb 7 Europe’s biggest bank HSBC holdings blamed soured U.S. subprime loans for its first-ever profit warning.Feb 13 Countrywide shares drop as Fremont General Corp., one of the largest providers of subprime loans, says it has stopped offering
some second mortgages.Apr 2 Subprime lender New Century Financial Corp. files for bankruptcy.Jun 20 Two Bear Stearns funds sell $4 billion of assets to cover redemptions and expected margin calls after making bad bets on securities
backed by subprime mortgages.Jul 10 Standard & Poor’s said it may cut ratings on some $12 billion of subprime debt.Jul 17 Bear Stearns says two hedge funds with subprime exposure have very little value; credit spreads soar.Jul 20 Home foreclosures rose 9 percent in July from June and soared 93 percent from a year ago.Aug 9 French bank BNP Paribas bars investors from redeeming cash in $2.2 billion worth of funds, telling the markets it is unable to
calculate the value of the asset-backed securities funds.Aug 10 Central banks pump billions of dollars into banking systems in a concerted effort to beat back a credit crisis.Aug 17 Fed surprises by cutting its discount rate by half a percentage point to 5.75 percent, cites tightening credit markets.Sep 13 UK mortgage lender Northern Rock sought emergency financial support from the Bank of England. The report sparked a run on
the bank’s deposits by worried savers.Oct 1 Swiss bank UBS said it would write down $3.4 billion in its fixed-income portfolio and elsewhere, first quarterly loss in 9 years.Oct 15 Bank of America, Citigroup, and JP Morgan Chase plan fund to pool assets from stressed SIVs to prevent a fire sale of these assets.Oct 30 Merrill Lynch ousts Chairman and Chief Executive Stan O’Neal after reporting biggest quarterly loss in company’s history.Nov 4 Citigroup announces a further $8-11 billion of subprime-related writedowns and losses. Charles Prince resigns as CEO.Dec 6 Treasury, lenders set plan to bring reset relief to many of the 2 million homeowners facing higher rates.Dec 12 Central banks coordinate the launch of a new temporary term auction facility to address pressures in short-term funding markets.

Table 4
VAR Estimation Results for ABX Index Returns. This table reports the t-statistics for the indicated coefficients from the estimation of theVAR specification shown below. In this specification, ABXi denotes the ABX index return that appears as the dependent variable while ABXj denotesthe ABX index return whose lagged values (along with lagged values of ABXi) appear as explanatory variables. Thus, each VAR specification involvestwo different ABX index return series. The dummy variables I2006 and I2007 take value one for the indicated year, and zero otherwise. p(γ2 = 0)denotes the p-value for the hypothesis that the four γ2k coefficients are jointly zero; p(γ3 = 0) denotes the p-value for the hypothesis that the four γ3kcoefficients are jointly zero. The superscript ∗∗ denotes significance at the five-percent level; the superscript ∗ denotes significance at the ten-percentlevel. The sample period is January 25, 2006 to December 31, 2007 (100 weekly observations).
ABXit = γ0 +4∑
k=1
γ1kABXi,t−k + γ2kI2006 ABXj,t−k + γ3kI2007 ABXj,t−k + εit
ABXi ABXj γ21 γ22 γ23 γ24 γ31 γ32 γ33 γ34 p(γ2 = 0) p(γ3 = 0) Adj. R2
AAA AA 0.40 0.40 0.42 0.43 7.23 −1.52 4.14 0.02 0.970 0.000 0.647A −0.09 −0.14 −0.11 −0.10 4.33 0.26 4.18 −1.63 0.999 0.000 0.593BBB 0.07 0.04 0.03 0.07 3.88 −0.03 2.80 1.13 0.999 0.000 0.548BBB− 0.04 −0.01 −0.01 0.03 2.26 0.26 2.52 0.82 0.999 0.001 0.466
AA AAA −0.09 −0.03 0.12 0.14 2.83 −0.60 −5.22 2.50 0.999 0.000 0.423A −0.05 −0.07 −0.09 −0.07 3.12 3.57 −1.07 −0.77 0.999 0.000 0.317BBB 0.12 0.11 0.09 0.08 1.85 2.11 1.65 2.17 0.999 0.000 0.281BBB− 0.06 0.03 0.03 0.02 0.83 3.46 1.41 0.50 0.999 0.001 0.236
A AAA −0.18 −0.12 0.16 0.22 1.39 −3.23 −4.64 4.62 0.999 0.000 0.543AA 0.18 0.14 0.31 0.34 3.32 −7.15 0.16 1.72 0.994 0.000 0.571BBB 0.06 −0.00 0.02 0.08 2.32 1.55 2.49 3.08 0.999 0.000 0.348BBB− 0.01 −0.04 −0.02 0.04 1.46 2.04 1.46 1.79 0.999 0.017 0.279
BBB AAA −0.31 0.10 0.13 0.18 −2.76 0.63 −2.85 −0.98 0.992 0.008 0.258AA 0.03 0.15 0.24 0.20 −0.41 −1.89 −0.13 −3.25 0.995 0.012 0.250A −0.34 −0.24 −0.01 −0.41 −0.27 0.71 −0.50 −4.94 0.983 0.000 0.333BBB− −0.26 −0.13 0.38 −0.15 0.69 0.53 3.46 −0.12 0.992 0.010 0.254
BBB− AAA −0.39 −0.01 0.15 0.30 −1.66 −0.12 −1.94 −0.49 0.995 0.176 0.081AA 0.11 0.16 0.25 0.25 −0.18 −1.93 −0.05 −2.46 0.998 0.065 0.108A −0.17 −0.35 −0.08 −0.45 −0.34 0.40 −0.61 −4.44 0.984 0.001 0.208BBB −0.04 −0.25 0.10 −0.06 0.93 1.42 2.16 −0.38 0.999 0.098 0.097
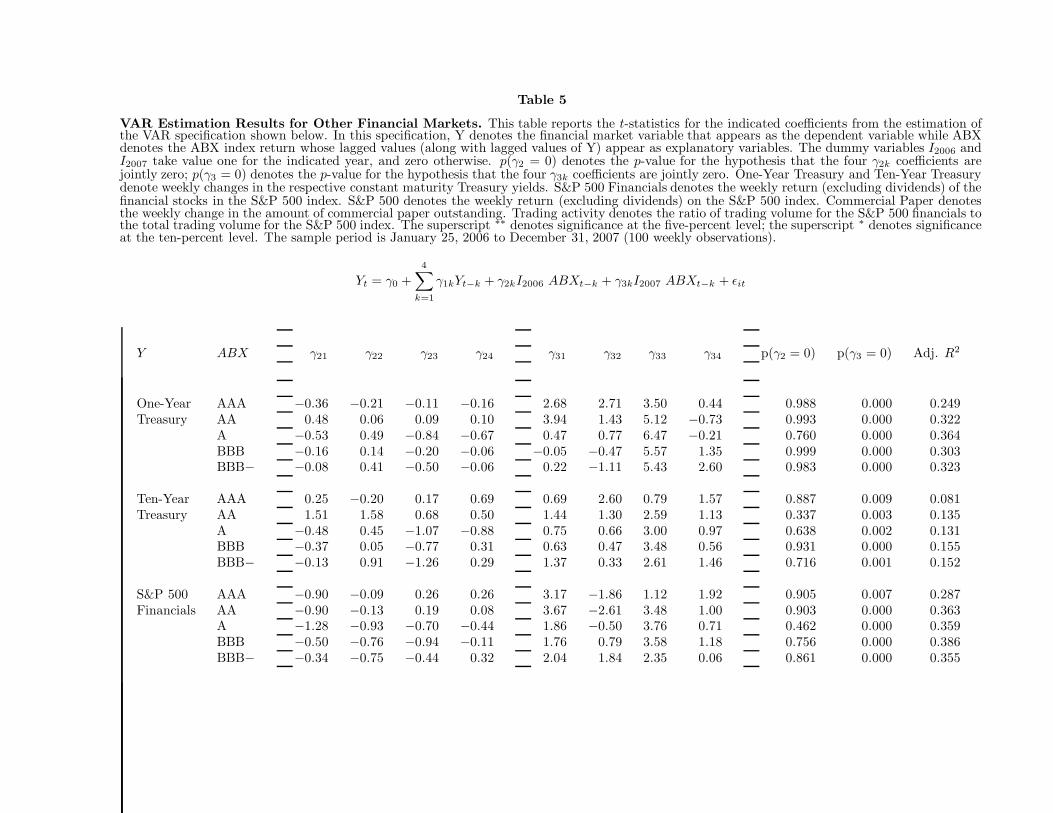
Table 5
VAR Estimation Results for Other Financial Markets. This table reports the t-statistics for the indicated coefficients from the estimation ofthe VAR specification shown below. In this specification, Y denotes the financial market variable that appears as the dependent variable while ABXdenotes the ABX index return whose lagged values (along with lagged values of Y) appear as explanatory variables. The dummy variables I2006 andI2007 take value one for the indicated year, and zero otherwise. p(γ2 = 0) denotes the p-value for the hypothesis that the four γ2k coefficients arejointly zero; p(γ3 = 0) denotes the p-value for the hypothesis that the four γ3k coefficients are jointly zero. One-Year Treasury and Ten-Year Treasurydenote weekly changes in the respective constant maturity Treasury yields. S&P 500 Financials denotes the weekly return (excluding dividends) of thefinancial stocks in the S&P 500 index. S&P 500 denotes the weekly return (excluding dividends) on the S&P 500 index. Commercial Paper denotesthe weekly change in the amount of commercial paper outstanding. Trading activity denotes the ratio of trading volume for the S&P 500 financials tothe total trading volume for the S&P 500 index. The superscript ∗∗ denotes significance at the five-percent level; the superscript ∗ denotes significanceat the ten-percent level. The sample period is January 25, 2006 to December 31, 2007 (100 weekly observations).
Yt = γ0 +4∑
k=1
γ1kYt−k + γ2kI2006 ABXt−k + γ3kI2007 ABXt−k + εit
Y ABX γ21 γ22 γ23 γ24 γ31 γ32 γ33 γ34 p(γ2 = 0) p(γ3 = 0) Adj. R2
One-Year AAA −0.36 −0.21 −0.11 −0.16 2.68 2.71 3.50 0.44 0.988 0.000 0.249Treasury AA 0.48 0.06 0.09 0.10 3.94 1.43 5.12 −0.73 0.993 0.000 0.322
A −0.53 0.49 −0.84 −0.67 0.47 0.77 6.47 −0.21 0.760 0.000 0.364BBB −0.16 0.14 −0.20 −0.06 −0.05 −0.47 5.57 1.35 0.999 0.000 0.303BBB− −0.08 0.41 −0.50 −0.06 0.22 −1.11 5.43 2.60 0.983 0.000 0.323
Ten-Year AAA 0.25 −0.20 0.17 0.69 0.69 2.60 0.79 1.57 0.887 0.009 0.081Treasury AA 1.51 1.58 0.68 0.50 1.44 1.30 2.59 1.13 0.337 0.003 0.135
A −0.48 0.45 −1.07 −0.88 0.75 0.66 3.00 0.97 0.638 0.002 0.131BBB −0.37 0.05 −0.77 0.31 0.63 0.47 3.48 0.56 0.931 0.000 0.155BBB− −0.13 0.91 −1.26 0.29 1.37 0.33 2.61 1.46 0.716 0.001 0.152
S&P 500 AAA −0.90 −0.09 0.26 0.26 3.17 −1.86 1.12 1.92 0.905 0.007 0.287Financials AA −0.90 −0.13 0.19 0.08 3.67 −2.61 3.48 1.00 0.903 0.000 0.363
A −1.28 −0.93 −0.70 −0.44 1.86 −0.50 3.76 0.71 0.462 0.000 0.359BBB −0.50 −0.76 −0.94 −0.11 1.76 0.79 3.58 1.18 0.756 0.000 0.386BBB− −0.34 −0.75 −0.44 0.32 2.04 1.84 2.35 0.06 0.861 0.000 0.355

Table 5 Continued
Y ABX γ21 γ22 γ23 γ24 γ31 γ32 γ33 γ34 p(γ2 = 0) p(γ3 = 0) Adj. R2
S&P 500 AAA −1.09 0.73 −0.09 0.41 2.16 0.60 0.33 1.78 0.646 0.073 0.116AA −1.53 −0.01 −0.38 −0.30 2.31 −0.28 2.25 1.29 0.626 0.016 0.151A −1.41 −0.15 −0.42 −0.11 0.72 0.61 2.70 1.19 0.665 0.007 0.168BBB −0.43 −0.25 −0.38 0.66 0.41 1.70 2.42 0.48 0.941 0.002 0.176BBB− −0.33 −0.35 0.04 0.73 0.96 2.53 1.28 0.15 0.942 0.004 0.165
Commercial AAA 0.02 −0.20 1.15 −0.15 −0.27 −0.02 0.64 2.13 0.820 0.185 0.190Paper AA −0.61 0.37 1.15 2.05 0.20 −0.58 1.20 1.31 0.197 0.358 0.215
A −1.33 0.55 0.07 0.99 −1.13 −0.18 1.93 1.15 0.600 0.117 0.210BBB −1.93 1.00 −0.17 0.38 −0.67 −0.90 2.47 0.67 0.285 0.096 0.176BBB− −1.94 1.26 −0.61 1.43 −0.94 −0.90 2.75 0.56 0.221 0.062 0.247
Trading AAA −0.32 1.23 −0.47 0.14 −4.99 −1.40 −1.79 −0.59 0.668 0.000 0.918Activity AA −0.91 −0.06 −0.88 −0.14 −5.88 −0.05 −3.35 −0.28 0.858 0.000 0.925
A −0.91 1.06 −1.24 0.96 −3.88 0.20 −3.89 −1.04 0.504 0.000 0.927BBB −0.69 −0.02 −0.80 0.01 −3.42 −0.43 −4.24 −1.55 0.872 0.000 0.930BBB− −0.72 0.35 −0.75 0.71 −3.31 −0.63 −3.94 −2.19 0.869 0.000 0.929