The Study of Thin Films by Electrochemical Impedance Spectroscopy
41
Chapter 1 The Study of Thin Films by Electrochemical Impedance Spectroscopy H. Cesiulis, N. Tsyntsaru, A. Ramanavicius and G. Ragoisha Abstract The capabilities and advantages of electrochemical impedance spec- troscopy (EIS) as a useful and non-destructive technique are discussed. EIS pro- vides the time dependent quantitative information about the electrode processes. The description of EIS is given in comprehensive way beginning from the theo- retical basics of EIS and data interpretation in the frames of various equivalent electric circuits. The practical applications of EIS are described for the following thin film types: (i) cathodic metals/alloys films deposition; (ii) anodization of metals and characterization of oxide films and its growth by EIS including information provided by Mott-Schottky plots; (iii) underpotential deposition of metals; (iv) characterization of organic films onto metals; (v) application in development of biosensors and biofuel cells. The original data of EIS on cathodic electrodeposition of Co and Co-W are provided and reduction mechanisms involving adsorbed intermediates are discussed. The advantages of EIS in the oxide films characteri- zation and their electrochemical properties are shown. EIS can be successfully applied for the characterization of biosensing surfaces and/or in evaluation of bioanalytical signals generated by biosensors. The glucose oxidase (GOx) based biosensor could be successfully analyzed by merged scanning electrochemical microscopy (SECM) and EIS techniques. Such combining study by SECM and EIS could be very attractive in order to evaluate the biofuel cell ef ficiency and in the H. Cesiulis (&) N. Tsyntsaru Department of Physical Chemistry, Faculty of Chemistry, Vilnius University, Vilnius, Lithuania e-mail: [email protected] N. Tsyntsaru Institute of Applied Physics, Academy of Sciences of Moldova, Chisinau, Moldova A. Ramanavicius Laboratory of Nanobiotechnology, Department of Materials Science and Electronics, Institute of Semiconductor Physics, State Scientific Research Institute Centre for Physical Sciences and Technology, Vilnius, Lithuania G. Ragoisha Research Institute for Physical Chemical Problems, Belarusian State University, Minsk, Belarus © Springer International Publishing Switzerland 2016 I. Tiginyanu et al. (eds.), Nanostructures and Thin Films for Multifunctional Applications, NanoScience and Technology, DOI 10.1007/978-3-319-30198-3_1 3
Transcript of The Study of Thin Films by Electrochemical Impedance Spectroscopy

Chapter 1The Study of Thin Filmsby Electrochemical ImpedanceSpectroscopy
H. Cesiulis, N. Tsyntsaru, A. Ramanavicius and G. Ragoisha
Abstract The capabilities and advantages of electrochemical impedance spec-troscopy (EIS) as a useful and non-destructive technique are discussed. EIS pro-vides the time dependent quantitative information about the electrode processes.The description of EIS is given in comprehensive way beginning from the theo-retical basics of EIS and data interpretation in the frames of various equivalentelectric circuits. The practical applications of EIS are described for the followingthin film types: (i) cathodic metals/alloys films deposition; (ii) anodization of metalsand characterization of oxide films and its growth by EIS including informationprovided by Mott-Schottky plots; (iii) underpotential deposition of metals;(iv) characterization of organic films onto metals; (v) application in development ofbiosensors and biofuel cells. The original data of EIS on cathodic electrodepositionof Co and Co-W are provided and reduction mechanisms involving adsorbedintermediates are discussed. The advantages of EIS in the oxide films characteri-zation and their electrochemical properties are shown. EIS can be successfullyapplied for the characterization of biosensing surfaces and/or in evaluation ofbioanalytical signals generated by biosensors. The glucose oxidase (GOx) basedbiosensor could be successfully analyzed by merged scanning electrochemicalmicroscopy (SECM) and EIS techniques. Such combining study by SECM and EIScould be very attractive in order to evaluate the biofuel cell efficiency and in the
H. Cesiulis (&) � N. TsyntsaruDepartment of Physical Chemistry, Faculty of Chemistry, Vilnius University,Vilnius, Lithuaniae-mail: [email protected]
N. TsyntsaruInstitute of Applied Physics, Academy of Sciences of Moldova, Chisinau, Moldova
A. RamanaviciusLaboratory of Nanobiotechnology, Department of Materials Science and Electronics,Institute of Semiconductor Physics, State Scientific Research Institute Centrefor Physical Sciences and Technology, Vilnius, Lithuania
G. RagoishaResearch Institute for Physical Chemical Problems, Belarusian State University,Minsk, Belarus
© Springer International Publishing Switzerland 2016I. Tiginyanu et al. (eds.), Nanostructures and Thin Films forMultifunctional Applications, NanoScience and Technology,DOI 10.1007/978-3-319-30198-3_1
3

modeling of biosensor action, because it is unavailable to obtain by other conve-nient electrochemical methods.
1.1 Introduction
Electrochemical impedance spectroscopy is a recent and powerful tool in corrosionand solid-state laboratories. Electrochemical Impedance Spectroscopy (EIS) also iscalled AC Impedance or just Impedance Spectroscopy. The usefulness of impe-dance spectroscopy lies in the ability to distinguish the dielectric and electricproperties of individual contributions of components under investigation.Impedance spectroscopy is a non-destructive technique and so can provide timedependent quantitative and time-dependant information about the electrode pro-cesses and complex interfaces, extract some characteristics of materials includinghigh resistance materials (e.g. paintings, oxide coatings). There are number ofbooks devoted to the theory, terminology and definitions, and experimental setup ofEIS in details, and some of them we recommend for young researchers [1–6]. Theaim of this review is to provide information for users about variety of thin filmsstudy by EIS in view of general principles of the method.
1.2 Basics of EIS
The electrochemical impedance method consists in measuring the response of anelectrode to a sinusoidal potential modulation at different frequencies. Often theseac modulations are superimposed either onto applied anodic or cathodic potential,or onto open circuit potential. The mathematical approach of electrochemicalimpedance data is based on the Ohm’s law, i.e. on the linear interdependencybetween potential perturbation and current response or vice versa. However, thepotential-current dependencies of electrochemical systems in general are non-linear.On the other hand, it is possible to extract a small fraction of this dependence,where the mentioned dependence can be approximated as linear, e.g. in the range of5–10 mV. Therefore, the measurements of impedance are performed under sinu-soidal potential modulation with amplitude 5–10 mV. The sinusoidal perturbationsof potential E(t) induces a sinusoidal current I(t) of the same frequency (ω)superimposed onto the steady state current with the phase shift ϕ with the respect tothe potential. As for physical electric circuits, the electrochemical impedance ofelectrode reaction (Z) is defined analogous to Ohm’s law as:
Z xð Þ ¼ E tð ÞI tð Þ ¼ E0j j sin xtð Þ
I0j j sin xt � /ð Þ ¼ Z0sin xtð Þ
sin xt � /ð Þ ð1:1Þ
4 H. Cesiulis et al.
here: E0 and I0 is amplitude of potential and current, respectively, ω = 2πf is theradial frequency in rad/s (f is a frequency expressed in Hz).
Here we follow methodology of the description of EIS basic conception pro-vided in [7]. In polar coordinates these functions are represented by vectors oflength E0j j and I0j j rotating counter clockwise at the radial frequency ω. Thesefunctions are most easily described by using complex numbers. With the mathe-matical identity,
exp jxð Þ ¼ cos xþ j sin x ð1:2Þ
it is obtained
E tð Þ ¼ E0j j exp jxtð Þ ð1:3Þ
I tð Þ ¼ I0j j exp jxt � juð Þ ð1:4Þ
here j is a complex unit j ¼ ffiffiffiffiffiffiffi�1p
.Thus, (1.1) can be rewritten to define the electrochemical impedance as a sum of
real (ZRe) and imaginary parts (ZIm) at certain ω:
ZðxÞ ¼ Z0j j exp j/ð Þ ¼ Z0j j cosuþ j sinuð Þ ¼ Z0j j cosuþ j Z0j j sinu ¼ ZRe þ jZImð1:5Þ
Note, that in the electrochemical literature real and imaginary parts of electro-chemical impedance often are marked as Z′ and Z″, respectively.
Using theory of complex functions the modulus of impedance, tanϕ, and ϕ areexpressed by a following equations:
Z xð Þj j ¼ffiffiffiffiffiffiffiffiffiffiffiffiffiffiffiffiffiffiffiZ2Re þ Z2
Im
qð1:6Þ
tan/ ¼ ZImZRe
ð1:7Þ
/ ¼ arctanZImZRe
ð1:8Þ
One popular format for evaluating electrochemical impedance data, consists onplotting the imaginary impedance component (Z″) against the real impedancecomponent (Z′) at each excitation frequency the Nyquist plot. This format is alsoknown as a Cole-Cole plot or a complex impedance plane plot. The Nyquist plothas several advantages. The primary one is that the plot format makes it easy to seethe effects of the ohmic (uncompensated) resistance (see the text below). If data aretaken at sufficiently high frequencies, it is easy to extrapolate the obtained curvetoward the left, down to the x axis to read the ohmic resistance. The shape of thecurve (often a semicircle) does not change when the ohmic resistance changes.
1 The Study of Thin Films by Electrochemical Impedance Spectroscopy 5

Another advantage of this plot format is that it emphasizes circuit components thatare in series. The Nyquist plot format also has some disadvantages. For example,frequency does not appear explicitly. Secondly, although the ohmic resistance andpolarization (charge transfer) resistance can be easily read directly from the Nyquistplot, the electrode capacitance can be calculated only after the frequency infor-mation is known.
Another format for evaluating electrochemical impedance data known as Bodeplots, and consists of the plotting Z xð Þj j and ϕ versus logω, i.e. lets to examinethese values as a function of frequency. The Bode plot has some distinct advantagesover the Nyquist plot. Since frequency appears as one of the axes, it is easy tounderstand from the plot how the impedance depends on the frequency. The plotuses the logarithm of frequency to allow a very wide frequency range to be plottedon one graph, but with each decade given equal weight. The Bode plot also showsthe magnitude (|Z|) on a log axis so that you can easily plot wide impedance rangeson the same set of axes. This can be an advantage when the impedance dependsstrongly on the frequency, as is the case with a capacitor (see text below). The Bodeplot is a useful alternative to the Nyquist plot. It lets you avoid the longer mea-surement times associated with low frequency determinations of polarizationresistance, because the log |Z| versus log ω plot sometimes allows a more effectiveextrapolation of data from higher frequencies. The Bode plot also has some dis-advantages. The greatest one is that the shape of the curves can change if the circuitvalues change, e.g. uncompensated resistance.
Therefore, usually EIS are analyzed both Nyquist and Bode plots. EIS data iscommonly analyzed by fitting it to an equivalent electrical circuit model consistingof passive elements that do not generate current or potential such as resistors (R),capacitors (C), and inductors (L). To be useful, the elements in the model shouldhave a physical meaning in the physical electrochemistry of the system. As anexample, most models contain a resistor that models the cell’s solution resistance.
The alternating current response of circuit elements are following. A sinusoidalvoltage applied to an ohmic resistance induces as alternating current that is in phasewith applied voltage, and the impedance of ohmic circuit element is therefore equalto its resistance R:
Zr ¼ E tð ÞI tð Þ ¼ E0j j sin xtð Þ
I0j j sin xtð Þ ¼ R ð1:9Þ
Notice that the impedance of a resistor is independent of frequency and has noimaginary component.
The impedance of a capacitor can be calculated based on the relation:
I tð Þ ¼ CdE tð Þdt
ð1:10Þ
that yields to the expression of capacitance impedance, it’s modulus and phase shift:
6 H. Cesiulis et al.

Zc ¼ � jxC
ð1:11Þ
Zcj j ¼ 1xC
/ ¼ � p2
ð1:12Þ
A capacitor’s impedance decreases as the frequency is raised. Capacitors alsohave only an imaginary impedance component. As follows from the detailedderivation of (1.11), the current through a capacitor is phase shifted by 90° withrespect to the voltage.
For the inductance, it can be written:
E tð Þ ¼ LdI tð Þdt
ð1:13Þ
that yields to the expression of inductance impedance, it’s modulus and phase shift:
Zl ¼ jxL ð1:14Þ
Zlj j ¼ xL / ¼ p2
ð1:15Þ
The impedance of an inductor increases as frequency increases. Inductors haveonly an imaginary impedance component. As a result, the current through aninductor is phase-shifted by −90° with respect to the voltage.
The interpretation of EIS data is built upon reaction model (or equivalent circuit)consisting on passive elements connected in some order. Regardless the variety ofelectrode processes (deposition and corrosion of metals, electroreduction of ions,oxide film formation, adsorption phenomena, and etc.) they contain the similarstages and comprises similar processes such as formation of double electric layer,the presence of ohmic resistance, charge transfer resistance of electrochemicalreaction, adsorbed layers formed by intermediates of complex electrochemicalreactions either by protective films, diffusion (transport phenomena) in solutionsand in the organic or polymeric films, and etc. Therefore, the same equivalentcircuits but with some different physical meaning of passive elements can simulatedifferent processes occurred on the electrode. With the equations of the model it isthen possible to calculate the electrochemical impedance as a function of frequencyand check conformity experimental data to theoretical model using commercialsoftware, for example ZVIEW® or Autolab® with frequency response analyzer(FRA).
Notably, the reactions occurring consequently are modeling by elements orcircuits connected in series, whereas simultaneously occurring processes aremodeling by elements or circuits connected in parallel. Mostly used equivalentcircuit describing electrode processes are provided in Fig. 1.1. The simplestequivalent circuit can model the electrical behavior of electrode-solution interface isshown in Fig. 1.1a. In this case R1 simulates ohmic resistance (solution, wires and
1 The Study of Thin Films by Electrochemical Impedance Spectroscopy 7

Fig. 1.1 Often used equivalent circuits to describe electrode processes, typical shapes of Nyquistand Bode plots of ones. For details, see the text
8 H. Cesiulis et al.

other uncompensated resistances), C1 simulates the capacity of double electric layerwhich is charged simultaneously with the occurring electrochemical reaction; thecharge transfer resistance (Rp) of one is simulated by R2. The Nyquist plot repre-sents a semi-circle of radius R2/2 whose center is located on the real axis at thedistance R1 + ½R2 from the origin.
The physical interpretation of the distributed elements in an equivalent circuitmodeling solid electrodes is somewhat more complicated than predicted by thismodel. They are, however, essential in understanding and interpreting mostimpedance spectra. There are two types of distributions which we need to concern.Both are related, but in different ways, to the finite spatial extension of any realsystem. The first one is associated directly with nonlocal processes, such as dif-fusion, which can occur even in a completely homogeneous material, one whosephysical properties, such as charge mobilities, are the same everywhere. The othertype, exemplified by the constant-phase element (CPE), arises because microscopicmaterial properties are themselves often distributed. For example, the solid elec-trode–solid electrolyte interface on the microscopic level is not the often presumedsmooth and uniform surface. It contains a large number of surface defects such askinks, jags, and ledges, local charge inhomogeneities, two- and three-phase regions,adsorbed species, and variations in composition and stoichiometry. Reactionresistance and capacitance contributions differ with electrode position and vary overa certain range around a mean, but only their average effects over the entire elec-trode surface can be observed. The macroscopic impedance, which depends, forexample, on the reaction rate distribution across such an interface is measured as anaverage over the entire electrode [3]. Consequently, in the Nyqist plot the semicirclebecomes flattened (Fig. 1.1b). To account for this effect, it has become currentpractice, especially in corrosion science and engineering, to replace the double layercapacitance (and other capacitances) in the equivalent circuits by a constant phaseelement (CPE). The impedance of constant CPE is given by:
Z xð Þ ¼ 1Q
jxð Þ�n ð1:16Þ
here 0 < n < 1, and Q is a constant.The case n = 1 recovers a perfect capacitor.If electrochemical impedance measurements are performed under reversible
potential it is possible to calculate apparent value of exchange current density, i0,and rate of constant of electrochemical reaction, k0 from the charge transfer resis-tance extracted from the EIS data. If one takes Butler-Volmer equation under thereversible condition, i.e. that in which the overpotential, η, tends to zero, then [8]
@i@g
¼ 1Rp
¼ i0FRT
ð1:17Þ
1 The Study of Thin Films by Electrochemical Impedance Spectroscopy 9

The relation of the exchange current density to the rate constant at equilibrium is
i0 ¼ zFvk0ci ð1:18Þ
here χ is the thickness of the reaction ion layerOn some electrochemical processes, there is more than one rate-determining
step. Each step represents a system impedance component and contributes to theoverall reaction rate constant. The electrochemical impedance experiment can oftendistinguish among these steps and provide information on their respective rates orrelaxation times. In such cases, the equivalent circuit contains more elements. Forexample, if electrochemical reaction involves intermediate stage with one adsorptionof reacting intermediate, the equivalent circuit for this case is shown in Fig. 1.1c. Thephysical meanings for R1, C1, and R2 are the same as in Fig. 1.1a, b. The elements C2
and R3 represent capacitance and resistor of adsorbed layer, respectively. However,this equivalent circuit describes also other processes, such as the presence ofnon-conductive films (lubricants, paints etc.), therefore passive elements have otherphysical meanings, and they are noted in the corresponding chapters below.
In fact, the analysis provided in [5] shows that in the simple case of one adsorbedintermediate various complex plane plots may be obtained, depending on the rel-ative values of the system parameters. These plots are described by variousequivalent circuits, which are only the electrical representations of the interfacialphenomena. In fact, there are no real capacitances, inductances or resistances in thecircuit (faradaic process). These parameters originate from the behavior of thekinetic equations and they are functions of the rate constants, transfer coefficients,potential, diffusion coefficients, concentrations, etc. Besides, all these parametersare highly nonlinear, that is they depend on the electrode potential. It seems that theelectrical representation of the faradaic impedance, however useful it may sound, isnot necessary in the description of the system. The system may be described in asimpler way directly by the equations describing impedances or admittances.
When transport phenomena play a role, the faradaic impedance can be separatedinto two terms, the kinetic impedance (Zt) and the diffusion impedance (Zd), andZF ¼ Zt þ Zd .
Zt represents impedance in the absence of concentration overpotential. In somesimple cases it can be represented by charge transfer resistance (see Fig. 1.1a), inmore complicated cases it may include several circuit elements, e.g. impedance ofconsequently occurring charge transfer reactions (Fig. 1.1c). Zd describes thecontribution of concentration overpotential to the faradaic impedance, and thereforedepends on transport phenomena in the solution. In the absence of convection, it isreferred as Warburg impedance ZW. The Warburg impedance is equal to:
ZW ¼ rffiffiffiffix
p � jrffiffiffiffix
p ð1:19Þ
r ¼ RT
Cstn2F2Affiffiffiffiffiffi2D
p
10 H. Cesiulis et al.

As follows from (1.19):
tan/ ¼ ZImZRe
¼ �1 ð1:20Þ
Therefore, the phase shift is equal to ϕ =−45°, and in the Nyquist plot theWarburgimpedance is represented by a straight line at 45° angle. If charge transfer is repre-sented only by one resistance (Rp = R2), the total impedance of the electrode corre-sponds to that of theRandles equivalent circuit, as it is shown in Fig. 1.1e. In thisfigureNyquist diagram consists of two distinct domains: at high frequency, a semicircleshows that the transfer resistance determines the impedance, while at low frequenciesdiffusion dominates and Warburg impedance is observed. However, in some cases,the kinetics of electrode processes is more complicated [9], because of the adsorptionof intermediates and components of solutions (e.g. ligands) coupled with chargetransfer and diffusion processes. Therefore, it is impossible to distinguish frequenciesranges at those the kinetics or mass transfer controls electrode processes based on theexperimental EIS data (some of these were published for ex. in [10, 11]).
Analysis of the ac impedance spectra in the presence of specific adsorptionrevealed that the complex plane show formation of deformed semicircles, thatmight be described by introducing into equivalent circuit CPE. Authors [12] pro-posed an electrical equivalent model, in which instead of the CPE there is adouble-layer capacitance in parallel with a series connection of the adsorptionresistance and capacitance, Rad and Cad (R3 and C2 in Fig. 1.1f), and thesemi-infinite Warburg impedance (W) connected with the diffusion of adsorbingspecies. This equivalent circuit allows describing various shapes of Nyquist plots,such as 2 semicircles, depressed one semicircle, and other.
Other more specific equivalent circuits are provided in the correspondingchapters of this paper below.
The impedance technique is often applied to various electrochemical systemsthat were never studied before. The Nyquist and Bode plots obtained often displayshapes that had never been encountered previously. Before starting the analysis andmodeling of the experimental results, it should be confirmed that the impedancedata are valid. There is a general mathematical procedure, which allows for theverification of the impedance data. It was introduced by Kramers in 1929 andKronig, 1926 further developed by Bode in 1945 and later applied to EIS [13]. Theimpedance derived is valid provided that the following four criteria are met:(i) linearity (a system is linear when its response to a sum of individual input signalsis equal to the sum of the individual responses); (ii) causality (the response of thesystem must be entirely determined by the applied perturbation, that is the outputdepends only on the present and past input values); (iii) stability (a stable systemremains stable unless excited by an external source and it should return to itsoriginal state once the perturbation is removed and the system cannot supply powerto the output irrespective of the input); and (iv) finiteness (the real and imaginarycomponents of the impedance must be finite-valued over the entire frequency range
1 The Study of Thin Films by Electrochemical Impedance Spectroscopy 11

0 < ω < ∞, i.e. the impedance must tend to a constant real value for ω → 0 andω → ∞. Unfortunately, the Kramers-Kronig transform requires integration over arange of frequency from zero to infinity. Since no one can measure spectral dataover that range, evaluating the K-K relations via integration always involvesassumptions about the behavior of a spectrum outside the frequency over which itwas measured. The transformation procedure is described in details in for ex. [3–5,13]. In practice, the Kramer-Kronig transformation is possible to perform usingbuilt in the EIS recording devices corresponding software, e.g. Gamry EchemAnalyst or Autolab® with FRA. When you select Kramers- Kronig on an impe-dance menu a model of the type is fit to the selected region of the spectrum. If the fitis poor, you can assume that the data is not transformable and is therefore of poorquality. There is little point fitting non-Kramers-Kroning compliant data to anequivalent circuit model.
1.3 EIS Responses During Cathodic Metals and AlloysFilms Deposition
Electrochemical impedance spectroscopy (EIS) responses during electrodepositionhave gained the interest last decades due to possibility to determine severalparameters of the systems e.g. double-layer capacitance, to characterize the elec-trode processes and to determine the kinetics of the electrochemical systems. Theuse of this technique in metals/alloys electrodeposition in the presence of com-plexes or additives has also high impact since adsorption phenomena stronglyinfluence the electrochemical impedance [14–18]. One of its advantages is thepossibility of investigation the relaxation of the electrode surface from adsorbedspecies and growth of layers. The impedance spectra of the deposition processes ofmetals/alloys usually show one or several relaxations (capacitive or inductive)[19, 20]. Thus, using electrochemical impedance spectroscopy, the electrodeposi-tion of Co and Co-W were studied by authors in order to compare the differences ofthe deposition and codeposition of Co with tungsten and the effect of the pH onthese processes.
The cobalt and cobalt alloys are investigated for their magnetic and corrosionresistant properties by many groups of researchers, including [21]. The interest intungsten and its alloys has been driven by its outstanding properties and multiplepossible applications overviewed by E. Lassner and W.D. Schubert [22] andrecently by N. Tsyntsaru and others [9]. The first commercial Co-W alloy elec-trodeposition process was reported by Schwartz [23], indicating the role of citratespecies as an important factor to achieve the desirable morphology and structure ofdeposits. Complexing is used as a method to approach the electrode potentials ofdifferent metals by reducing the concentration of “free” Me2+” ions and increasingthe solubility of Me(II) salts in baths containing OH−, WO4
2− and PO43− [24, 25].
Several common electrolytes are known and used for the electrodeposition of
12 H. Cesiulis et al.
tungsten alloys with iron-group metals but the number of complexing agents used islimited (citrates, pyrophosphates [26, 27], tartarates [28, 29], gluconates [30, 31]).The presence in such electrolytes the species with high molecular weight [32, 33] isthe particular feature of the given systems which influence the mechanism ofelectrodeposition.
However, some difficulties to describe the mechanism and kinetics of tungstencodeposition with iron group metals (Fe, Co, Ni) are related with rare data about themechanism and kinetics of pure iron group metal complexes electroreduction andidentification of the electrochemically active complex of metal that participates inthe electrochemical charge transfer reaction in complex solutions. Even in the“simple” case of cobalt electrodeposition, the process actually is complex andmultistaged, caused by transfer of two electrons for cobalt reduction to metal stateand by the parallel process of hydrogen evolution. This secondary process increasesthe pH of the near-electrode layer and induced the formation of CoOH+ on elec-trode surface [34], effect on the kinetics and mechanism of cobalt electrodeposition[35–38].
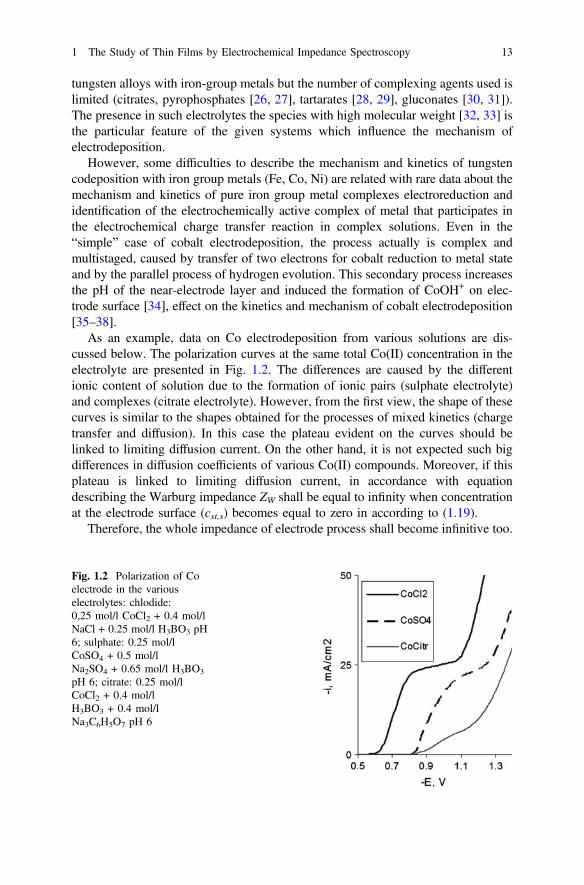
As an example, data on Co electrodeposition from various solutions are dis-cussed below. The polarization curves at the same total Co(II) concentration in theelectrolyte are presented in Fig. 1.2. The differences are caused by the differentionic content of solution due to the formation of ionic pairs (sulphate electrolyte)and complexes (citrate electrolyte). However, from the first view, the shape of thesecurves is similar to the shapes obtained for the processes of mixed kinetics (chargetransfer and diffusion). In this case the plateau evident on the curves should belinked to limiting diffusion current. On the other hand, it is not expected such bigdifferences in diffusion coefficients of various Co(II) compounds. Moreover, if thisplateau is linked to limiting diffusion current, in accordance with equationdescribing the Warburg impedance ZW shall be equal to infinity when concentrationat the electrode surface (cst,s) becomes equal to zero in according to (1.19).
Therefore, the whole impedance of electrode process shall become infinitive too.
Fig. 1.2 Polarization of Coelectrode in the variouselectrolytes: chlodide:0,25 mol/l CoCl2 + 0.4 mol/lNaCl + 0.25 mol/l H3BO3 pH6; sulphate: 0.25 mol/lCoSO4 + 0.5 mol/lNa2SO4 + 0.65 mol/l H3BO3
pH 6; citrate: 0.25 mol/lCoCl2 + 0.4 mol/lH3BO3 + 0.4 mol/lNa3C6H5O7 pH 6
1 The Study of Thin Films by Electrochemical Impedance Spectroscopy 13

The EIS data obtained in the sulphate electrolyte on Co at the “plateau”potentials presented in Fig. 1.3 show relatively small values of real and imaginaryparts and spectra fit well to the equivalent circuit containing elements simulatingstage of intermediate adsorbed compound (Fig. 1.1c), probably of CoOH+, similarlyto the case of Ni and Fe electrodeposition [39, 40]. Also, the analogous EIS datawere obtained in [41] for the cases of Ni electrodeposition from chloride, sulphateand citrate solutions. In addition, this point of view is confirmed by EIS dataobtained also in citrate solutions for Co-Cu alloys electrodeposition [42], where wasshown that the reduction of Cu(II)-citrate and Co(II)-citrate is divided into twosteps. The Cu(II)-citrate and Co(II)-citrate are first reduced to an intermediate stateand then to Cu0 and Co0. Adsorption exists at the surface of the electrode at thepotential of about −1.0 V.
The polarization curve for Co-W electrodeposition and corrected for ohmic dropare shown in Fig. 1.4. It is similar as for the processes with the ionic mass transferdetermining step.
Fig. 1.3 EIS (Nyquist and Bode plots) obtained in the sulphate solution (content as in Fig. 1.2) onCo and fitting results to the equivalent circuit (Fig. 1.1c) at the potentials: a E = −1.00 V,b E = −1.20 V
0,8 0,9 1,0
0,1
1
10
2
-E, V
Fig. 1.4 Polarization curvesof Co-W electrodepositionobtained under naturalconvection and subtracted ofohmic drop
14 H. Cesiulis et al.

The results obtained by us [10] suggest that the process under study is morecomplex than the classical process of mixed kinetics (slow charge transfer plus slowconvective diffusion). The first complexity lies in the fact that, due to the complexformation at pH > 4, the concentration of the electroactive particles significantlydiffers from the analytical value; hence, the respective diffusion currents and thediffusion coefficients that are determined on their basis decrease. The secondcomplexity is due to the possibility of the formation of intermediates (in the bulksolution or on the electrode surface) and their reduction is a multistage process thatincludes intermediate adsorption and interaction in the adsorption stage. One of themethods for determining the role of the ionic mass transfer (the diffusion in thesolution) in this process can be electrochemical impedance spectroscopy, whichwas applied by us.
The data presented in Fig. 1.5 show that the shape of the impedance spectra doesnot imply a slow diffusion stage. The presence of two peaks in the Bode diagramexcludes a single slow stage of charge transfer. Also note that, if in the case of thedeposition of Co-W at pH = 6.7 at low cathode potentials the electrochemicalimpedance spectrum is described without separate adsorption component(Fig. 1.5a), then an increase in the potential leads to an increase in the hydrogenevolution and hence in the alkalization of the near electrode layer, which results inthe appearance of an adsorption component at potentials above –0.7 V (Fig. 1.5b).
Fig. 1.5 Comparison of theexperimental electrochemicalimpedance spectra for Co andCo-W obtained from citrateelectrolytes and the results offitting in Nyquist and Bodecoordinates to the equivalentcircuit shown in Fig. 1.1c
1 The Study of Thin Films by Electrochemical Impedance Spectroscopy 15
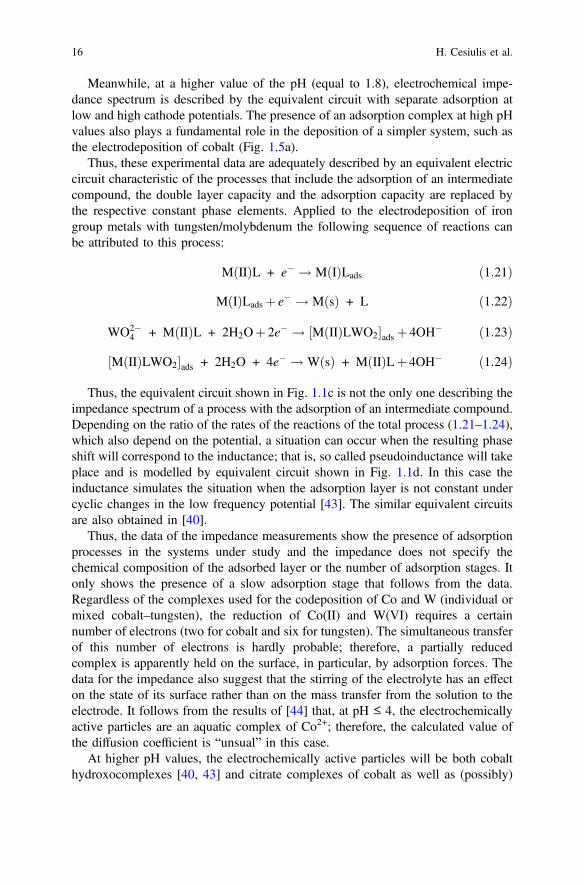
Meanwhile, at a higher value of the pH (equal to 1.8), electrochemical impe-dance spectrum is described by the equivalent circuit with separate adsorption atlow and high cathode potentials. The presence of an adsorption complex at high pHvalues also plays a fundamental role in the deposition of a simpler system, such asthe electrodeposition of cobalt (Fig. 1.5a).
Thus, these experimental data are adequately described by an equivalent electriccircuit characteristic of the processes that include the adsorption of an intermediatecompound, the double layer capacity and the adsorption capacity are replaced bythe respective constant phase elements. Applied to the electrodeposition of irongroup metals with tungsten/molybdenum the following sequence of reactions canbe attributed to this process:
M IIð ÞL + e� ! M Ið ÞLads ð1:21Þ
M Ið ÞLads þ e� ! M sð Þ + L ð1:22Þ
WO2�4 + M IIð ÞL + 2H2Oþ 2e� ! M IIð ÞLWO2½ �ads þ 4OH� ð1:23Þ
M IIð ÞLWO2½ �ads + 2H2O + 4e� ! W sð Þ + M IIð ÞLþ 4OH� ð1:24Þ
Thus, the equivalent circuit shown in Fig. 1.1c is not the only one describing theimpedance spectrum of a process with the adsorption of an intermediate compound.Depending on the ratio of the rates of the reactions of the total process (1.21–1.24),which also depend on the potential, a situation can occur when the resulting phaseshift will correspond to the inductance; that is, so called pseudoinductance will takeplace and is modelled by equivalent circuit shown in Fig. 1.1d. In this case theinductance simulates the situation when the adsorption layer is not constant undercyclic changes in the low frequency potential [43]. The similar equivalent circuitsare also obtained in [40].
Thus, the data of the impedance measurements show the presence of adsorptionprocesses in the systems under study and the impedance does not specify thechemical composition of the adsorbed layer or the number of adsorption stages. Itonly shows the presence of a slow adsorption stage that follows from the data.Regardless of the complexes used for the codeposition of Co and W (individual ormixed cobalt–tungsten), the reduction of Co(II) and W(VI) requires a certainnumber of electrons (two for cobalt and six for tungsten). The simultaneous transferof this number of electrons is hardly probable; therefore, a partially reducedcomplex is apparently held on the surface, in particular, by adsorption forces. Thedata for the impedance also suggest that the stirring of the electrolyte has an effecton the state of its surface rather than on the mass transfer from the solution to theelectrode. It follows from the results of [44] that, at pH ≤ 4, the electrochemicallyactive particles are an aquatic complex of Co2+; therefore, the calculated value ofthe diffusion coefficient is “unsual” in this case.
At higher pH values, the electrochemically active particles will be both cobalthydroxocomplexes [40, 43] and citrate complexes of cobalt as well as (possibly)
16 H. Cesiulis et al.
mixed cobalt–tungsten citrate complexes. As the pH increases, their concentrationchanges and the adsorbed citrate complexes undergo a structuring. It is also known(see, e.g., [45]) that the concentration of the cobalt aquatic complexes in thesolution and the current density of the electrodeposition decrease at pH > 5. Thehydrogen evolution on the electrode favors a local increase in the pH. With therotation of the electrode, the local increase in the pH sharply slows down, whichleads to a decrease in the concentration of the adsorbed complexes and an increasein the electrodeposition current’s density. In a galvanostatic mode, at a constantcurrent density, this results in an increase in the current efficiency; a lowering of theelectrodeposition potential; and a decrease in the concentration of tungsten in thecoating [46], which, in turn, is one of the causes of changes in its structure [47] andhence properties [48].
1.4 Anodization of Metals: Characterization of OxideFilms and Their Growth by EIS
Anodization, because of its nature-friendly properties and low cost, has become apoint of interest in the last century. Anodizing is an electrochemical process whichis performed to form a protective oxide layer on the surface of a metal. Othermethods such as evaporation or plasma enhanced chemical vapor deposition(PECVD) are known to be used also for oxidation. But among these, advantages ofanodizing make it more attractive. Low cost, more precise thickness control andeasier handling of process can be given as examples to these advantages [49].Anodization can be used in different fields or for different applications. Protectionof a surface against corrosion, decorative metal finish, architectural and nan-otechnology applications, electrolytic capacitors, humidity sensors, self-lubricatingsystems and aerospace structures can be given as examples [50–53].
Anodic film formation of various thickness and structure is mostly applied ontitanium (Ti) and aluminium (Al). However, zinc, magnesium, niobium, tantalumand iron can also be anodized [52]. For valve metals such as Al, Ti, Ta, or Zr,anodization has been extensively explored and, by a controlled variation of theelectrochemical parameters used, the thickness, morphology e.g., compact or por-ous layers or crystal structure of the anodic films can be tailored to achieve thedesired functionality [54]. Either a thick non-porous oxide or a film consisting ofpores in nano-scale can be achieved by anodizing [49].
The porous structure of the anodic layers provides the oxides with absorbentcharacteristics which increase their applications. Nevertheless, in those applicationswhere the oxides are atmospherically exposed, sealing of the anodic layers isrequired because porosity decreases the corrosion resistance [55]. The sealingprocess achieves an important reduction in the porosity of the anodic layer.Atmospheric exposure of the oxide produces significant changes in the anodic layer(due to the autosealing process) increasing the material corrosion resistance
1 The Study of Thin Films by Electrochemical Impedance Spectroscopy 17

[56, 57]. The corrosion resistance depends on layer thickness and especially on thesealing quality, so good quality control on both parameters has maximum signifi-cance. There are many different experimental evaluation techniques which offerinteresting information, but all of them have their limitations [57]. The applicationof electrochemical impedance spectroscopy to the oxide films characterization hasmany advantages. The results show that EIS is a powerful tool able to provide tinypieces of information on the films electrochemical properties, and not least in whichway atmospheric exposure can modify the anodized samples properties [57–61].Hoar and Wood [62] were first proposing an impedance bridge to describe oxidefilms; they suggested ECs to model unsealed and partially sealed anodized films[55]. Lorenz and other authors proposed the ‘‘passive pit model’’ (where it isassumed that pits have penetrated only the outer porous layer without damaging thebarrier layer) and the active pit model (where it is assumed that pits have penetratedboth the porous and barrier layer) [60, 61, 63, 64]. As pointed out by Mansfeld andKendig [60], the passive pit model can also be used to interpret the sealingmechanism.
Electrochemical impedance spectroscopy has been used to characterize oxidefilms on titanium surface [65–71]. Thus, in [71] the surface treatment consisted ofan etching followed by an anodising procedure of titanium and sample sealing.Anodic oxide films were grown electrochemically on titanium surface usingmodulated potential, in hydrofluoric acid solution aiming for the production of aporous film. It is assumed that the oxide film is a two-layer film, consisting of oneinner barrier layer and an outer porous layer The effect of surface etching beforeanodising, oxide film sealing is analyzed using the equivalent electrical circuitproposed by Pan and et al. [65] and Aziz-Kerzzo et al. [67] to simulate EIS data foran anodic oxide titanium film. This equivalent circuit is similar to shown inFig. 1.1c, only in this R1 = Rs, which is electrolyte resistance, C1 = Cpr, which CPEof porous layer, R2 = Rpr, which is porous layer resistance, C2 = Cb, which CPE ofbarrier layer and R3 = Rb, which barrier layer resistance.
By evaluating Rpr value at different anodizing potentials it gives data on theoxide film formed and namely if the Rpr value is smaller than the pores producedshould be larger. At the same time, Ti etching procedure before anodizing did notshow any influence on Rpr values, but sealing of the oxide film increased Rpr values[71]. This fact can be expected because Rpr is associated to the outer porous layerresistance and sealing closes partially the film pores promoting a better behaviour ofthe anodised samples in terms of corrosion resistance. Etching of Ti surface andoxide film sealing instead increase Rb values of samples. These facts could be anindication that the inner layer is also porous. Chemical etching causes a rougher Tisurface that might improve the barrier characteristic of the inner layer. Sealing inboiling deionized water converts amorphous Ti oxide into a more stable crystallineform. Thus, if the inner layer has pores the sealing process can improve the Rb
value, hence increases the inner layer corrosion resistance.Over the years, fluoride containing electrolytes have been utilized to develop
TiO2 nanotubes of varied dimensions [72–74] in order to increase surface area forvarious applications. Based on EIS measurements in NaCl solution the presence of
18 H. Cesiulis et al.

inner barrier and outer porous TiO2 nanotube layer was detected [75]. TiO2 nan-otubes showed two time constants at different frequency ranges and this can be dueto the change in surface morphology and thickness changes with increasinganodization time. The decrease in phase angles at the high-frequency region may berelated to the porous nature of the outer layer. Nyquist plots for as-formed andannealed TiO2 nanotubes display a semicircle, which indicates near capacitiveresponse and the presence of two time constants, can also be identified. Surfaceanodized for longer duration showed a larger capacitive loop which can be relatedto increase in thickness of the oxide layer. At high frequency, semicircles show thatthe transfer resistance dominates the impedance and at lower frequencies, Warburgimpedance is observed which is due to diffusion of titanium ions to the porouslayer. It has been reported that upon immersion in bio-fluids, Warburg impedancetends to decrease at earlier stages and finally it reaches a constant value. Thisbehavior is due to the increase in the buildup of titanium ions in the electrolyte suchthat the diffusion of titanium ions back into the porous layer takes place.
More complex case is present by Suay et al. [55] which by means of electro-chemical impedance spectra investigated composite process of aluminum porousanodizing, in the view of the sealing quality and the anodic films changes, and theageing process produced by atmospheric exposure, which is important from thepoint of view of corrosion reliability of those oxides. To oversee the alumina porousfilm properties, it is a need to understand its nature. The hexagonal cells and barrierlayer are made from anhydride alumina with different sulphate ions Al2(SO4)3 fromthe anodizing bath. On the other hand, the porous layer is full of hydrate alumina(mono- or trihydrate or a mixture) plus absorbed water [55, 57]. Finally, there is onelast layer (the intermediate layer), which is formed by diffusion from the exterior,especially in the sealing process, and slowly in atmospheric exposure [76]. Can beexpected that significant changes in the porous layer will appear due to the atmo-spheric exposure (water absorption and the transformation of anhydride alumina tohydrate alumina inside the cells), and in the intermediate layer.
In order to fit the EIS experimental results of the anodic aluminum layer mul-tipart equivalent circuit was proposed (Fig. 1.6). The parameter Rsol represents
Fig. 1.6 The proposed EC to model the impedance spectra of the sealed anodized aluminiumlayer
1 The Study of Thin Films by Electrochemical Impedance Spectroscopy 19
electrolyte used, R1 simulates the presence of electrolyte in the pores and faults ofthe intermediate layer. One of the parallel branches which are present in the circuitis formed by the resistance Rpw and the associate capacitance Cpw—they representthe walls of the hexagonal cells with uniform or nearly uniform dielectric proper-ties. Taking into account that Rpw is usually so high that it prevents the passage ofcurrent, so in equivalent circuit only a capacitance Cpw in this branch is present. Theother branch is formed by the resistance R1 of the electrolyte in the pores anddefects of the intermediate layer, in series with the pores as a whole (the pore andthe barrier layers). The electrochemical properties of the pore filling are representedby Rp and Cp, while the properties of the barrier layer are represented by Rb and Cb.
Resistance R1 is directly related to the intermediate layer changes as result toatmospheric exposure. R1 vary markedly with the extent of sealing and the growingof the intermediate layer thickness (both processes are closely related and dependon ageing time) [55]. R1 doubles in size for all types of atmospheres when thesamples have been exposed up to 39 months. This change can be due to a bettersealing of pores because hydroxides precipitation increases with exposure timeand/or to an intermediate layer thickness increment. As exposure time increasesprecipitate particles start covering the alumina layer surface making cavities dis-appear and finally forming after years of exposure a homogeneous anodic layersurface, so anodized and sealed aluminum anticorrosion performance is increaseddue to sealing and natural ageing process.
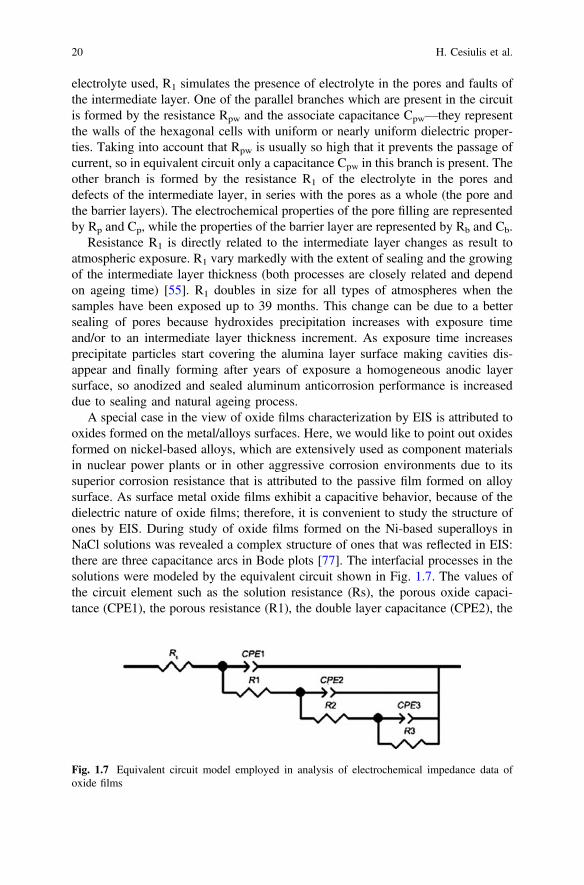
A special case in the view of oxide films characterization by EIS is attributed tooxides formed on the metal/alloys surfaces. Here, we would like to point out oxidesformed on nickel-based alloys, which are extensively used as component materialsin nuclear power plants or in other aggressive corrosion environments due to itssuperior corrosion resistance that is attributed to the passive film formed on alloysurface. As surface metal oxide films exhibit a capacitive behavior, because of thedielectric nature of oxide films; therefore, it is convenient to study the structure ofones by EIS. During study of oxide films formed on the Ni-based superalloys inNaCl solutions was revealed a complex structure of ones that was reflected in EIS:there are three capacitance arcs in Bode plots [77]. The interfacial processes in thesolutions were modeled by the equivalent circuit shown in Fig. 1.7. The values ofthe circuit element such as the solution resistance (Rs), the porous oxide capaci-tance (CPE1), the porous resistance (R1), the double layer capacitance (CPE2), the
Fig. 1.7 Equivalent circuit model employed in analysis of electrochemical impedance data ofoxide films
20 H. Cesiulis et al.
compact resistance (R2), the compact oxide capacitance (CPE3) and polarization(the chloride ions transport) resistance (R3) were used to characterize the perfor-mance of the oxide film in the corrosive environment. Based on the changes invalues of elements the following dynamics of processes was proposed. Diffusion ofions into micro-pores in the oxide film experienced difficulties because of the largeresistance to charge transfer. Accordingly, the fitted resistance was very large.Under this condition, the changes of CPE3 with exposure time could be used todetermine water/ions uptake of the oxide film. With increasing the immersion time,the oxide film capacitance (CPE3) increased, indicating that chloride ions hadpenetrated into the oxide film. After then, some interconnected micro-pores werefilled with the electrolyte solution, which enables further measurements of the poresresistance reasonable.
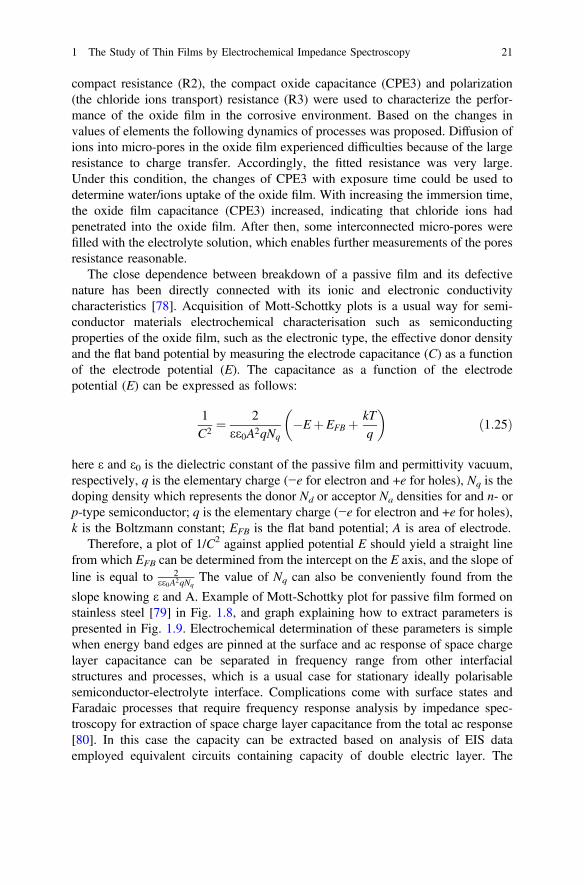
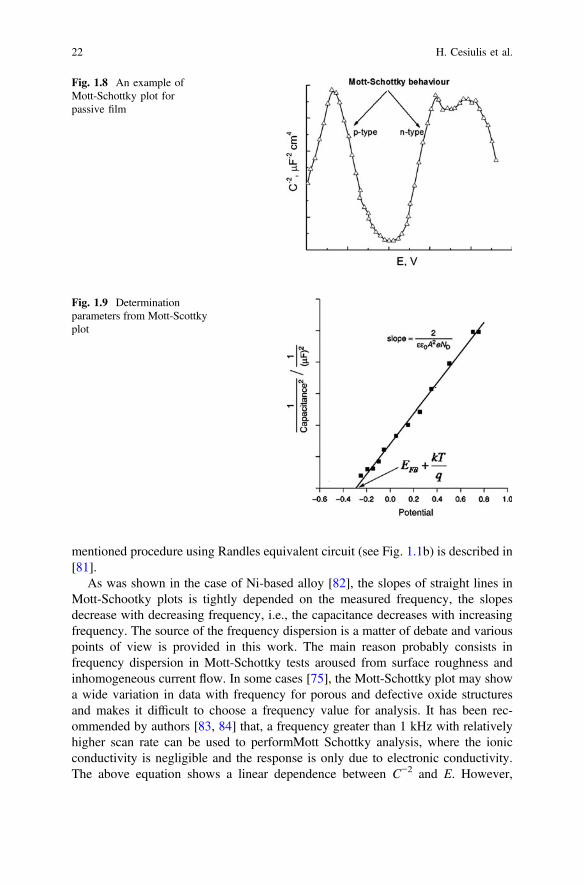
The close dependence between breakdown of a passive film and its defectivenature has been directly connected with its ionic and electronic conductivitycharacteristics [78]. Acquisition of Mott-Schottky plots is a usual way for semi-conductor materials electrochemical characterisation such as semiconductingproperties of the oxide film, such as the electronic type, the effective donor densityand the flat band potential by measuring the electrode capacitance (C) as a functionof the electrode potential (E). The capacitance as a function of the electrodepotential (E) can be expressed as follows:
1C2 ¼
2ee0A2qNq
�EþEFB þ kTq
� �ð1:25Þ
here ε and ε0 is the dielectric constant of the passive film and permittivity vacuum,respectively, q is the elementary charge (−e for electron and +e for holes), Nq is thedoping density which represents the donor Nd or acceptor Na densities for and n- orp-type semiconductor; q is the elementary charge (−e for electron and +e for holes),k is the Boltzmann constant; EFB is the flat band potential; A is area of electrode.
Therefore, a plot of 1/C2 against applied potential E should yield a straight linefrom which EFB can be determined from the intercept on the E axis, and the slope ofline is equal to 2
ee0A2qNqThe value of Nq can also be conveniently found from the
slope knowing ε and A. Example of Mott-Schottky plot for passive film formed onstainless steel [79] in Fig. 1.8, and graph explaining how to extract parameters ispresented in Fig. 1.9. Electrochemical determination of these parameters is simplewhen energy band edges are pinned at the surface and ac response of space chargelayer capacitance can be separated in frequency range from other interfacialstructures and processes, which is a usual case for stationary ideally polarisablesemiconductor-electrolyte interface. Complications come with surface states andFaradaic processes that require frequency response analysis by impedance spec-troscopy for extraction of space charge layer capacitance from the total ac response[80]. In this case the capacity can be extracted based on analysis of EIS dataemployed equivalent circuits containing capacity of double electric layer. The
1 The Study of Thin Films by Electrochemical Impedance Spectroscopy 21
mentioned procedure using Randles equivalent circuit (see Fig. 1.1b) is described in[81].
As was shown in the case of Ni-based alloy [82], the slopes of straight lines inMott-Schootky plots is tightly depended on the measured frequency, the slopesdecrease with decreasing frequency, i.e., the capacitance decreases with increasingfrequency. The source of the frequency dispersion is a matter of debate and variouspoints of view is provided in this work. The main reason probably consists infrequency dispersion in Mott-Schottky tests aroused from surface roughness andinhomogeneous current flow. In some cases [75], the Mott-Schottky plot may showa wide variation in data with frequency for porous and defective oxide structuresand makes it difficult to choose a frequency value for analysis. It has been rec-ommended by authors [83, 84] that, a frequency greater than 1 kHz with relativelyhigher scan rate can be used to performMott Schottky analysis, where the ionicconductivity is negligible and the response is only due to electronic conductivity.The above equation shows a linear dependence between C−2 and E. However,
Fig. 1.8 An example ofMott-Schottky plot forpassive film
Fig. 1.9 Determinationparameters from Mott-Scottkyplot
22 H. Cesiulis et al.

non-linearity was observed experimentally, which according to Tomkiewicz [85] isdue to oxidation of the electrode itself by holes in the depletion region,non-homogeneous doping and deep doping levels. Despite the existence ofnon-linear behavior, it has been shown that ND and EFB values can be determinedfromthe slope and the intercept of the linear portion.
1.5 The Study of Underpotential Deposition of Metalsby EIS
Underpotential deposition (UPD) is the phenomenon of electrochemical depositionof typically a monolayer of a metal on a foreign metal substrate at potentials higherthan the reversible Nernst potential E(Men+/Me), i.e. the deposition at “less nega-tive” potential than that predicted from Nernst equation. In the wider sense, theUPD is not limited to the deposition of metals on metals; e.g. electrochemicaladsorption of hydrogen atoms on platinum above E(H+/H2) is also an example ofUPD. The essence of the UPD phenomenon is in the surface limited character of thedeposition. The UPD is controlled by the first atomic layer of the deposited materialspecific interaction with atoms of a substrate, which determines the intrinsic limit ofthe deposited material amount, typically a monolayer. Due to the surface limitedcharacter, the UPD is an efficient instrument for creating atomic layer buildingblocks for nanostructured materials assembly [86–91]. The UPD is also animportant stage in the mechanisms of electrodeposition of semiconductor materials,mainly metal chalcogenides [92]. The difference between the reversible UPDpotential, EUPD (or quasi-reversible potential in the case of irreversible UPD) and E(Men+/Me) is called the UPD shift, ΔEUPD. The UPD shift correlates with differ-ences of work functions of the substrate and the deposited metal in many UPDprocesses [93], though the correlation with work functions is not universal [94], e.g.in UPD of metals on tellurium ΔEUPD shows correlation with free energies offormation of the corresponding tellurides rather than work function differences [95].The dependences of the UPD shift on different physical quantities disclose possibledifferences in the nature of the interactions that control the underpotential deposi-tion in different systems.
The surface limited character of the UPD determines the choice of electro-chemical methods for investigation and monitoring of the underpotential deposi-tion. The stationary electric current in the UPD is equal to zero, but thepotentiodynamic profiles of the current and few other electrochemical variablesobtained by potential sweep methods are typically very expressive (Fig. 1.10). Thedecay of the current at a steady potential under the potentiostatic control may affectessentially the frequency response acquired in impedance spectroscopy, due to thefollowing reasons. First, the metal cation concentration profile which controls theimpedance of diffusion decays along with the current. Second, many UPD pro-cesses are irreversible, i.e. the cathodic deposition and anodic oxidation of the
1 The Study of Thin Films by Electrochemical Impedance Spectroscopy 23

adlayer may proceed in different regions of potential, as shown in Fig. 1.10 forPb UPD on tellurium. In the irreversible UPD, neither the forward, nor backreaction can respond to a small perturbation of the potential, when impedancespectrum is acquired at the steady state after the UPD current decay. So, therequirement of stationarity in the classical version of impedance spectroscopyappears to be in conflict with the essential properties of the object. The way out ofthis trouble is the same as in the case of voltammetric response acquisition in theUPD. Instead of measuring stationary frequency response which may lack essentialcontribution of the UPD, one can acquire the frequency response in the potentialsweep, keeping in mind that the potential sweep itself causes a low-frequency limitin the frequency response acquisition [96]. Thus, the optimal solution in the UPDinvestigation by alternating current frequency response analysis lies in the use ofpotentiodynamic electrochemical impedance spectroscopy [96–98]. The latter isapplicable both to reversible and irreversible UPD processes.
Interestingly, different equivalent electric circuits were derived from analysis ofimpedance spectra of reversible and irreversible UPD (Fig. 1.11) [96]. Theequivalent circuit that represents typical reversible UPD processes (Fig. 1.12a)contains the charge transfer resistance Rct, adsorption capacitance Ca and Warburgimpedance ZW in the Faradaic branch of the circuit, the latter is connected inparallel with double layer capacitance Cdl and the two parallel branches are
Fig. 1.10 Potentiodynamic profiles of a electric current i and double layer capacitance Cdl;b Warburg coefficient AW and charge transfer resistance Rct in Pb UPD on tellurium in 6 mM Pb(NO3)2 + 0.1 M HNO3 at potential sweep rate 2.35 mV/s. The insets show equivalent electriccircuits from which the frequency response parameters of the UPD were derived, with thecorresponding elements of the circuit highlighted
Fig. 1.11 Basic equivalent electric circuits of a reversible, b irreversible UPD, and c the reversibleUPD with anion coadsorption
24 H. Cesiulis et al.

altogether connected in series with the active resistance of solution Rs. Theequivalent circuit of irreversible UPD contains the same elements except Ca
(Fig. 1.11b). The adsorption capacitance, which is characteristic only of thereversible UPD, results from oscillation of metal adatom coverage at the periodicperturbation of the potential. The adatom coverage does not oscillate in the absenceof the back reaction; therefore, the irreversible UPD processes of the kind shown inFig. 1.10 do not show this parameter.
The most informative parameter of the UPD derived from EIS is the double layercapacitance. This parameter discloses alterations of the interface status during thecathodic deposition and anodic oxidation of the adlayer (Fig. 1.10a). The twoparameters of the Faradaic branch of the equivalent circuit, charge transfer resis-tance Rp and Warburg coefficient σ, characterize, correspondingly, kinetic anddiffusional contributions to the Faradaic impedance. The inverses of these twoparameters show peaks at the potentials of adlayer deposition and oxidation(Fig. 1.10b).
In the case of a reversible UPD, the steady state coverage of the adatomsoscillates with the potential perturbation [99], so both versions of impedancespectroscopy can give informative frequency response which corresponds to eithercircuit a, or circuit c shown in Fig. 1.11. The circuit c characterises the UPD withcoadsorption of anions, such as Bi [98, 99] or Cu [97] UPD on Au. The circuitc was first derived in the analysis of impedance spectra of hydrogen UPD onplatinum [100]. The pseudocapacitances that result from UPD and also from anioncoadsorption, when the latter affects the UPD, can be much higher than the doublelayer capacitance; however, their contribution to the total capacitive response of theelectrode is graded by the charge transfer resistance that stands in series with thecorresponding capacitance in the equivalent circuit. The adsorption capacitancescan be also a valuable source of information about the UPD. Figure 1.12 shows thevariation of the adsorption capacitance of lead UPD on gold in the cyclic scan andalso the cyclic voltammograms of Pb UPD on bare gold and gold electrode coveredwith atomic layer of selenium [101]. The sharp peak in Ca(E) plot in Fig. 1.12bdiscloses the phase transition in Pb monolayer in the final stage of UPD. This
Fig. 1.12 a Cyclic voltammograms of bare Au electrode (dotted) and Au electrode coated withselenium atomic layer (solid) in 1 mM Pb(ClO4)2 + 0.1 M HClO4 and b the variation of leadadsorption pseudocapacitance in the cyclic scan that corresponds to the dotted line in a
1 The Study of Thin Films by Electrochemical Impedance Spectroscopy 25

element disappeared from the equivalent circuit of Pb UPD, after the gold electrodewas covered electrochemically with atomic layer of selenium, which was due to thetransition from reversible to irreversible UPD (see Fig. 1.12a).
Thus, impedance spectroscopy can be a very informative source of informationabout underpotential deposition when it is applied adequately with the account ofthe surface limited character of the UPD processes.
1.6 Characterization of Organic Films onto Metals by EIS
The base purpose of protective organic films is to prevent the corrosion of metalstructures. New films are developed that could be more successfully resist theversatile aggressive environments to which metals are exposed during processing.In order to assist the development and characterization of new films formulations,the early evaluation of their performance is of greatest importance. This evaluationis possible by using electrochemical impedance spectroscopy (EIS).
The first works on the EIS characterization of organic films were published byEpelboin et al. [102] and Mansfield et al. [103], and it also suggested a generalmodel of an equivalent electrical circuit from which a large number of other modelscan be derived. This circuit is composed of the electrolyte resistance, followed by acapacitance (coating capacitance C) in parallel with a resistance (the coating or poreresistance) and finally an element Z which represents the electrochemical impe-dance Z of the process at the metal interface. One of the simplest circuit describingZ is composed of a capacitance, which represents the double electric layer capac-itance in parallel with a resistance representing charge transfer resistance, whichdescribes the electrochemical reaction under activation control (Fig. 1.1c). Thismodel “as is” (Fig. 1.1c) and with some modifications still is very popular anduseful to investigate various systems containing organic films on the metallic sur-face, such as conducting polypyrrole film on Pt [104], fluor-polymer and oligomercoated steel [105–107], industrial lubricants on stainless steel [108], organic filmsand corrosion inhibitors [109–114].
One of the examples of such films can be used of organic films for steel pro-tection. Interesting cases in this view presents the use of different “films-paints”[114–116]. Thus, research by EIS of the corrosion resistance of a water-based paintsystem applied on carbon steel is well documented [115, 116]. Epoxy-polyamine,epoxy-amine and epoxy-acrylic resins as primer films, and acrylic-polyurethane andacrylic paints as top films, were investigated both in single layer and double-layerapplications. The best protection was provided by the epoxy-amine resin, whereasacrylic-polyurethane exhibited the poorest characteristics and signs of corrosioncould be observed since the initial moments of immersion onwards. Even moreefficient protection against corrosion can be provided by the acrylic polymer con-taining zinc phosphate pigments when it was applied as a multilayer system. In thisway, the high density of pores produced in the polymer matrix during the curingprocess could be avoided to become direct ionic pathways for the transport of
26 H. Cesiulis et al.

aggressive species from the environment towards the surface of the underlyingmetal substrate [116].
Another case is use of oil lubricant films for steel protection. Fully formulatedlubricant or organic films can be viewed as a non-aqueous colloidal polymericsystem with low, primarily ionic electrical conductivity. Typical lubricating oil iscomposed of a combination of mineral or synthetic base oils and specializedadditives designed to improve long-term stability and enhanced performance inaggressive environments. The dipolar nature of components of the lubricant permitsinvestigation of their properties using electrochemical impedance spectroscopy. EISpresents an opportunity to resolve a complicated non-aqueous colloidal system bothspatially and chemically, and to analyze specific parts of that system based onrelaxation frequencies using small potential (5–10 mV) for the excitation of elec-trochemical activity of the system metal/coated film/solution. The final purpose ofthe EIS characterization of the protected organic coatings is to obtain informationabout the system properties such as presence of defects in films, reactivity of theinterface, adhesion, barrier properties [113, 117].
Thus, one of the “oil films” which will be described here is barrier properties ofthe films of mineral oil SAE 10 with antioxidant as well as contained Fe particleswere investigated [113]. The 3 cases of steel corrosion were investigated: (a) thesteel corrosion without lubricant; (b) and (c)—oil film with and without suspendedFe particles, respectively. The oil film was formed on the active area of steel rod bydropping of fixed amount (5 µl) of oil. Such amount of oil allows forming of oil filmwith thickness 200–250 μm. As corrosive media for such kind of measurementsusually NaCl solution is used.
The value of open circuit potential (OCP) is a parameter determined by the ratesof cathodic reaction and anodic reaction of a corroding device. In the studying case,the cathodic reaction is hydrogen evolution reaction, and the anodic reaction is theactive electrolytic dissolution of metal [118]. At the open circuit potential, the ratesof these reactions are equal. The rates of both reactions depend on the corrosionmedia, chemical composition of electrode material. Furthermore, the hydrogenevolution reaction depends on the state of the surface. If oil film does not participatein any chemical interaction with steel, the OCP values should be close to each otherboth in the presence and absence of oil film. The data presented in Fig. 1.13 confirmthis statement as settled values of OCP are in the range of *50–70 mV. The morepositive values of OCP obtained for steel covered by film containing iron particlesmight be caused by contacting Fe particles whose surfaces are partially oxidizeddue to high specific area and activity. The OCP of oxidized entirely or in partsurface is more positive than that for metallic surfaces. EIS is particularly wellsuited to evaluating corrosion behavior and insulator film characterization ofmaterials whose surfaces have been coated with isolator films, because the EISmethod in contrary to voltammetry is non-destructive method.
In Fig. 1.13 also Nyquist plots are presented for variously modified electrodes byoil films. To interpret data and physical meanings of the studied electrochemicalsystem the equivalent circuit shown in Fig. 1.1c was used. This model is used inconsideration that isolator film builds always on the metal surface in a corrosive
1 The Study of Thin Films by Electrochemical Impedance Spectroscopy 27
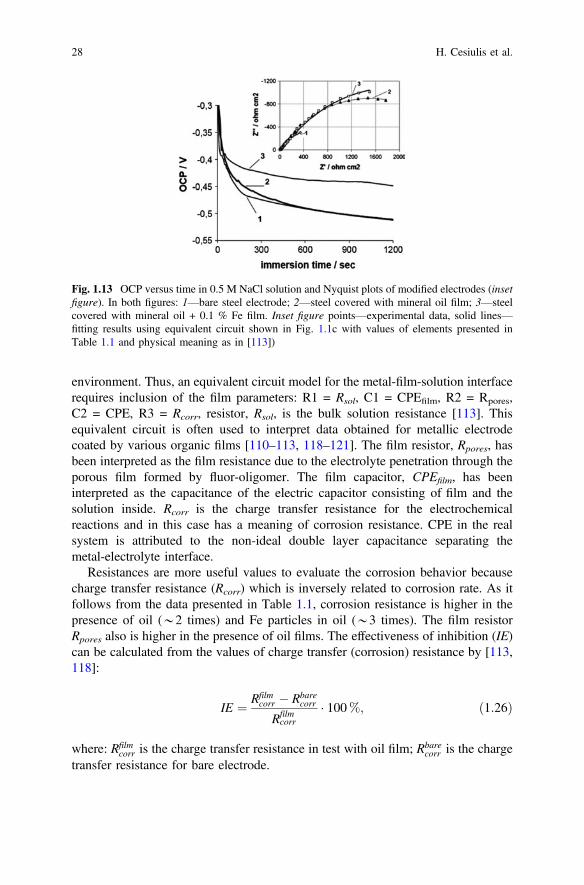
environment. Thus, an equivalent circuit model for the metal-film-solution interfacerequires inclusion of the film parameters: R1 = Rsol, C1 = CPEfilm, R2 = Rpores,C2 = CPE, R3 = Rcorr, resistor, Rsol, is the bulk solution resistance [113]. Thisequivalent circuit is often used to interpret data obtained for metallic electrodecoated by various organic films [110–113, 118–121]. The film resistor, Rpores, hasbeen interpreted as the film resistance due to the electrolyte penetration through theporous film formed by fluor-oligomer. The film capacitor, CPEfilm, has beeninterpreted as the capacitance of the electric capacitor consisting of film and thesolution inside. Rcorr is the charge transfer resistance for the electrochemicalreactions and in this case has a meaning of corrosion resistance. CPE in the realsystem is attributed to the non-ideal double layer capacitance separating themetal-electrolyte interface.
Resistances are more useful values to evaluate the corrosion behavior becausecharge transfer resistance (Rcorr) which is inversely related to corrosion rate. As itfollows from the data presented in Table 1.1, corrosion resistance is higher in thepresence of oil (*2 times) and Fe particles in oil (*3 times). The film resistorRpores also is higher in the presence of oil films. The effectiveness of inhibition (IE)can be calculated from the values of charge transfer (corrosion) resistance by [113,118]:
IE ¼ Rfilmcorr � Rbare
corr
Rfilmcorr
� 100%; ð1:26Þ
where: Rfilmcorr is the charge transfer resistance in test with oil film; Rbare
corr is the chargetransfer resistance for bare electrode.
Fig. 1.13 OCP versus time in 0.5 M NaCl solution and Nyquist plots of modified electrodes (insetfigure). In both figures: 1—bare steel electrode; 2—steel covered with mineral oil film; 3—steelcovered with mineral oil + 0.1 % Fe film. Inset figure points—experimental data, solid lines—fitting results using equivalent circuit shown in Fig. 1.1c with values of elements presented inTable 1.1 and physical meaning as in [113])
28 H. Cesiulis et al.

The IE in the 0.5 M NaCl of mineral oil film on steel is 53 %, and of mineral oilfilm containing Fe particles is 62 %. These results means that oil films are moderatecorrosion inhibitors.
1.7 Electrochemical Impedance Spectroscopy(EIS) in Development of Biosensors and Biofuel Cells
EIS is has been successfully applied for the characterization of biosensing surfaces[122] and/or in evaluation of bioanalytical signals generated by biosensors [104].
Electrochemical biosensors could be divided into two principally differentclasses: (i) catalytic (which are mostly based on enzymatic catalysis) biosensors[123] and (ii) affinity sensors [124]. The application of EIS in both types ofbiosensors is significantly different, because in the most of enzymatic sensorsvariations that can be detected by EIS are mostly accumulated in bulk solution inthe form of changing concentrations of reactants and/or reaction products, at thesame time the changes on the enzyme-modified electrode are mostly not welldetectable by EIS, therefore here other some electrochemical methods such asconstant potential amperometry [125] or cyclic voltammetry are applied [126]. Inthis respect EIS is mostly applied during the formation of enzymatic and othermaterials based sub-layers, which are essential for function of the sensor, e.g. in ourrecent researches we have shown that EIS could be successfully applied for theevaluation of separateed multilayers in glucose sensors based on multi-layeredstructure [127, 128]. The EIS is mostly used in order to determine the doubleelectric layer capacity and resistance of various modifiers, which carry the chargefrom electrolyte to electrode and also for the estimation of ion diffusion in solutiontowards the studied electrode [129]. Because of these abilities the EIS providesdetailed information on some electrochemical characteristics of the electrochemicalsystem. During our preliminary evaluation of 1,10-phenanthroline-5,6-dione andglucose oxidase modified electrode basic RΩ(RACA) circuit was applied [128],
Table 1.1 Values of elements used to fit experimental data with equivalent circuit shown inFig. 1.1c
Element Bare steel Steel covered with mineraloil film
Steel covered with mineraloil + 0.1 % Fe film
Rsol, Ω cm2 3.84 4.97 4.28
Rpores, Ω cm2 63.99 278.6 490.4
Rcorr, Ω cm2 1263 2683 3394
CPEfilm, μFcm−2
19.40 21.35 34.92
n = 0.61 n = 0.700 n = 0.63
CPE, μFcm−2
53.20 15.20 21.24
n = 0.815 n = 0.724 n = 0.725
1 The Study of Thin Films by Electrochemical Impedance Spectroscopy 29

however the circuit well fitted with experimental results only in very narrow fre-quency range from 1390 Hz to 14.37 mHz. Therefore, the aim of advanced researchwas advanced EIS-based evaluation of 1,10-phenanthroline-5,6-dione and glucoseoxidase deposited on graphite electrodes, in order to adjust most suitable equivalentcircuit, which is describing this electrochemical system [127]. It was determinedthat equivalent circuit RΩ(RF2C2)(C[RFW]) most optimally describes this electro-chemical system.
There are also some other studies on the application of EIS for the characteri-zation of enzyme-modified surfaces [130]. Some other researches illustrated thatEIS could be applied in glucose concentration measurements based onbio-electrochemical systems on GOx-modified electrodes [131].
Very different situation is observed in affinity sensors, because during theapplication of these sensors there are almost no observable changes in bulk solu-tion, which could be easily detected by EIS. But differently from enzymaticbiosensors in affinity sensors changes on electrode surface are very different sinceaffinity sensors are not able to generate constant flow of electrons or significantlychange the concentration of redox compound, therefore analytical signal in affinitysensors can be only indirectly detected by constant potential amperometry, e.g. suchdetection is possible when secondary antibodies labelled by horseradish peroxidaseare applied [132]. However, surface changes in affinity sensors are significanttherefore they could be determined and relatively well evaluated by variouspotentiodymic methods, such as cyclic voltammetry [133, 134], differential pulsevoltammetry [134], square wave voltammetry [135], pulsed amperometric detection[136] and EIS techniques [134]. We have demonstrated that among here mentionedtechniques EIS is providing the most useful set of data, which is required for theevaluation of analytical signal [134]. The EIS is based on electrochemical responseof a system towards perturbations applied at different frequencies [104]. Usingother electrochemical methods, such as amperometry or potentiometry there isalways a problem of the measured system being non-linear because of changingelectrochemical conditions, due to relatively high variation of electric current orvoltage, and in this way influencing measured results. In potentiostatic EIS, whichis based on constant electrode polarization voltage, a small sinusoidal perturbationof potential is usually applied. The amplitude of such perturbation usually is in therange of 5–20 mV. Such perturbation does not disturb the system’s linearity and inthis way it enables to acquire results, which are also linear in time and suitable forfurther analysis [129, 130]. Hence the EIS is one of the most informative out ofmany recently available electrochemical methods in development of affinity sensorsand biosensors [135].
Especially well the EIS is applied in the sensors based on electrodes modified bysemiconducting polymer based layers [137]. Especially well EIS is suitable foraffinity sensors based on molecularly imprinted conducting polymers (MIPs) suchas polypyrrole, which could be imprinted by low molecular mass molecules such astheophylline [138], caffeine [139, 140] or by large molecules such as proteins [141]and even DNA [142]. In a number of our research we have demonstrated that theEIS is the most efficient electrochemical signal detection technique in sensors where
30 H. Cesiulis et al.

here mentioned MIPs [138, 139, 142] or some other affinity towards analyteexhibiting structures are applied for creation of affinity sensors [143]. If correctequivalent circuit is applied the EIS has advantages over other electrochemicalmethods, (e.g. pulsed amperometric detection [136]).
It should be noted that conventional EIS based techniques represents onlyaveraged response of the entire electrochemical system. Therefore, if advancedevaluation of affinity sensor signals is required during various stages of creation ofaffinity sensors [122, 139, 143, 144]. In such investigations combination of EISwith quartz crystal microbalances [139, 144], surface plasmon resonance [145],scanning electrochemical microscopy [122] and other techniques are applied.
In order to get more advanced mapping of electrochemical system the EIS couldbe merged with scanning electrochemical microscopy (SECM) this marged tech-nique is named scanning electrochemical impedance spectroscopy (SEIM).In SEIM based technique localized impedance measurements could be performed inthe range of frequencies when the surface of interest is scanned by ultramicro-electrode (UME) [122]. Dependingly on requerments the result of SEIM could bevisualized by mapping one of calculated parameters, e.g. charge transfer resistanceor double layer capacitance as a function of 3D coordinates [146, 147]. It wasdemonstrated that the combination of SECM and EIS is providing informationabout local corrosion phenomena, which could help to identify the location ofdefects induced by corrosion [147]. In addition, comparison of conventional EISwith localized EIS was done during the investigation of degradation of polyestercoil-coated galvanized steel [148] and in the evaluation of the degradation of somecoatings, which were based on deposited organic compounds or polymeric layers[149, 150].
During the development of enzymatic biosensors, it was demonstrated that theglucose oxidase (GOx) based biosensor surfaces could be sucessfully analyzed bymerged scanning electrochemical microscopy (SECM) and EIS techniques [122].This advancement of SECM by EIS could provide additional electrochemicalinformation on electrochemical properties and concentrations gradients of electro-chemically active and even not active materials in selected 3D volume of solution[122]. Such EIS data based information could be very atractive in the evaluation ofbiofuel cell efficiency [151] and in the modelling of biosensor action [152] becauseit is hardly available by other electrochemical methods.
The evaluation of enzymatic reaction intensity could be estimated by conven-tional SECM techniques [153, 154]. However, in conventional SECM the mostcommonly used electrochemical method is based on faradaic response when fixedpotential is applied to the UME in order to register the concentration of electro-chemically active enzymatic reaction products [155, 156]. Moreover, it should benoted, that the potential applied to the electrode drives the electrochemical systemfar from the equilibrium, and then the response to this perturbation is observed asdisturbing signal. In order to avoid this problem, the applicability of techniquebased on SECM in which the UME is modulated by selected frequency alternatingcurrent (AC-SECM) can be applied. The AC-SECM based technique also allows tostudy local corrosion processes in the entire solution volume without any redox
1 The Study of Thin Films by Electrochemical Impedance Spectroscopy 31

mediator [157]. Using AC-SECM method the approach curves were recorded atseveral different frequencies and they demonstrated negative feedback behaviorwhile the UME was approaching an insulating surface [158]. This phenomenon issimilar to that observed in faradaic SECM based methods, however, differentapproach curves were observed when different frequencies were applied [159]. Inorder to advance this technique, the entire electrochemical impedance spectra canbe registered at every measurement point and then the electrochemical system canbe evaluated using the most suitable and informative equivalent circuits. Thistechnique is called scanning electrochemical impedance microscopy (SEIM). In thecase of SEIM conventional approach curves, which represent ohmic resistanceand/or other equivalent circuit parameters vs distance are plotted. The concept ofSEIM was described recently in the evaluation of localized corrosion processes bySchuhmann’s group [147, 160]. When SEIM was applied for localized evaluationof corrosion processes the sample was minimally influenced by UME, which wasapplied as a scanning probe, and it was demonstrated that domains, which havedifferent electrochemical properties, could be easily distinguished by SEIM even ifthey have similar topography and/or morphology [147]. In another research,impedance dependence on UME distance from insulating sample was revealed atfeedback mode SEIM [161]. The spherical diffusion, which has most significantinfluence far from insulating surface, was evaluated by Cole-Cole impedanceevaluation method, and the radial diffusion, which has most significant influencewhen the UME is approaching insulating surface, was evaluated by Cole-Davidsonimpedance evaluation method. It was determined that the low-frequency part of theEIS in a thin-layer between UME and surface of interest is controlled by both abovementioned types of diffusion. Moreover, it was also demonstrated that the SEIM infeedback mode is suitable for constant-height based imaging. When SEIM wasacting in feedback mode the local information on both topography and surfacereactivity was obtained from the simultaneous analysis of the current andelectrolyte-resistance variations [162]. Fundamental aspects of SEIM were inves-tigated comparing UME responses while it was approaching to different surfacese.g.: (i) insulator surface, (ii) conducting surface not-connected to electric circuit,and (iii) conducting surface, which was connected to electric circuit and was held atconstant potential [163]. By this research it has been shown that the admittance ofthe UME located at relatively small distance from the surface of interest mostlydepends on the distance between UME and the surface and on interfacial propertiesof the surface. Therefore, the SEIM based imaging is informative even without anyredox mediators. When AC-SECM and SECM methods are compared, it should benoted that the AC-SECM is performed at single frequency, while the SEIM isperformed in broad range of frequencies what enables to select the most suitableequivalent circuit and to calculate number of EIS parameters. Therefore, parame-ters, which are derived from SEIM evaluations, better describe an electrochemicalsystem than the parameters that are derived from AC-SECM data. We believe thatthe SEIM could be suitable for the investigation of biosensor and biofuel cellsurfaces in order to evaluate localized activity of immobilized enzymes and/or toperform advanced evaluation of the diffusion of enzymatic reaction products.
32 H. Cesiulis et al.

Some researches were based on the EIS application for the evaluation ofenzymatic reaction when the enzymes were immobilized on surfaces of electrodes[127, 128]. In addition, it was determined that conventional SECM is very suitablefor the investigation of enzyme-modified insulating surfaces while applying con-stant potential to UME [153–156]. Therefore, by the assumption of previousachievements we have expected that it is possible to merge the EIS technique withSECM in order to get efficient SEIM system, which will be suitable for the eval-uation of enzyme-modified surfaces [122]. The main aim of here mentionedresearch was to merge EIS with SECM into efficient SEIM system and, usingdeveloped SEIM for the investigation of solution conductivity at different positions,to demonstrate the suitability of SEIM for the evaluation of reaction product dif-fusion from enzyme-modified surface in real time [22]. The working electrode inthis research applied SEIM equipment was an UME. This electrode was scanning inall three directions and therefore it was applied for the investigation of selected 3Dspace of solution. The obtained data were analyzed using randles equivalent circuit.Actually the SEIM is used more rarely, than the AC-SECM, because scanning atone desired frequency takes less time. But the advantage of SEIM is that the EISmeasurements are performed in wide range of frequencies at each point of the UMEposition. Such measurements allow to evaluate the response of the electrochemicalsystem, to develop 3D model of the system, also to determine the most suitableequivalent circuit and their parameters, which in the most optimal way to describethe system [125]. What is the most important, such measurements allow to find thevalues of equivalent circuit parameters in selected volume of the electrochemicalcell. Reaction products, which affect solution’s conductivity, diffuse from the activesites of GOx-modified surface into the solution; therefore, the SEIM with movingUME is one of the best choice to study the diffusion of formed reaction products inselected volume of electrochemical cell. Due to the fact that the EIS measurementstake a long time, the conductivity changes in time were also evaluated and this issuewas taken into account.
Another alternative technique, which is used for the determination of localizedEIS data, is an impedance imaging combined with atomic force scanning electro-chemical microscopy (AFM-SECM) [164]. In this technique the AFM-basedtopography and alternating current SECM (AC–SECM) based signals are recordedsimultaneously with ring-shaped microelectrode, which is integrated on the AFMprobe. In one AC–SECM-based research structured glass/gold substrate was eval-uated by such advanced AFM probe and significant increase of current was reg-istered when the probe was placed over spots consisting of gold [164].
However, according to our best knowledge, up to now complex research in thearea of application of EIS for the investigation of biosensors and biofuel cells is stillmissing. Therefore, despite of high number of researches based on various EISapplications in biosensorics and biofuel cell development, further developments inthese areas are required especially in those directions where the combination withother surface characterization techniques is leading towards advanced phenomenaof complex interactions between biomolecules and modified electrode.
1 The Study of Thin Films by Electrochemical Impedance Spectroscopy 33

1.8 Conclusions
1. Electrochemical impedance spectroscopy (EIS) is a recent and powerful tool incorrosion and solid state laboratories. The basics of EIS and data presentationformats (Nyquist, Cole-Cole, Bode) are described and discussed.
2. The described interpretation of EIS data is built upon equivalent circuit.Regardless the variety of electrode processes its contain the similar stages andcomprises similar processes such as formation of double electric layer, thepresence of ohmic resistance, charge transfer resistance of electrochemicalreaction, and etc. Therefore, the same equivalent circuits but with some specialphysical meaning of passive elements of equivalent circuit can simulate thevarious processes occurred on the electrode, such as cathodic metals/alloys filmsdeposition; anodization of metals, under potential deposition of metals; char-acterization of organic films onto metals, application in development ofbiosensors and biofuel cells. With the equations of the model it is then possibleto calculate the electrochemical impedance as a function of frequency and checkconformity experimental data to theoretical model using commercial software.
3. Combining study by scanning electrochemical microscopy and EIS could bevery attractive in order to evaluate the biofuel cell efficiency and in the modelingof biosensor action as it is unavailable to obtain by other convenient electro-chemical methods.
Acknowledgments The authors acknowledge funding from FP7 Oil&Sugar project (295202),from the Research Council of Lithuania (MIP-031/2014) and Moldavian national projects(15.817.02.05A), (14.819.02.16F). Also, A.Ramanavicius is grateful to LaMeTech program pro-ject No.VP1-3.1-SMM-08-K-01-004/KS-120000-1756 for financial support.
References
1. M. Sluyters-Rehbah, Impedances of electrochemical systems: terminology, nomenclature andrepresentation. Part 1. Cells with metal electrodes and liquid solutions. Pure Appl. Chem. 66(9), 1831–1891 (1994)
2. A.J. Bard, L.R. Faulkner, Electrochemical methods. Fundamentals and Applications (Wiley,New York, 2001), 829 pp
3. E. Barsoukov, J.R. Macdonald (ed.), Impedance Spectroscopy Theory, Experiment, andApplications (Wiley, New York, 2005), 595 pp
4. M.E. Orazem, B. Tribollet, Electrochemical Impedance Spectroscopy (Wiley, New York,2008), 523 pp
5. A. Lasia, in Electrochemical Impedance Spectroscopy and its Applications, ed. by B.E.Conway, J.O’M. Bockris, R.E. White, Modern Aspects of Electrochemistry, vol. 32 (KluwerAcademic Publishers, New York), pp. 143–248
6. A. Lasia, Electrochemical Impedance Spectroscopy and its Applications (Springer, NewYork, 2014), 367 pp
7. D. Landoldt, Corrosion and Surface Chemistry of Metals (EPFL Press, Lausanne, 2007), 622pp
34 H. Cesiulis et al.

8. J.O’M Bockris, A.K.N. Reddy, M. Gamboa-Aldeco, Modern Electrochemistry, vol. 24.Fundamentals of Electrodics (Kluwer Academic Publishers, New York, 2002)
9. N. Tsyntsaru, H. Cesiulis, M. Donten, J. Sorte, E. Pellicer, E.J. Podlaha-Murphy, Moderntrends in tungsten alloys electrodeposition with iron group metals. Surf. Eng. Appl.Electrochem. 48(6), 491–520 (2012)
10. S.S. Belevskii, H. Cesiulis, N. Tsyntsaru, A.I. Dikusar, The role of mass transfer in theformation of the composition and structure of CoW coatings electrodeposited from citratesolutions. Surf. Eng. Appl. Electrochem. 46(6), 570–578 (2010)
11. Y. Liu, W. Wangz, Investigation on the Cu(II) and Co(II) electrochemical reduction processin citrate solution by CV and EIS. J. Electrochem. Soc. 159(6), D375–D381 (2012)
12. T. Pajkossy, Th Wandlowski, D.M. Kolb, Impedance aspects of the anion adsorption on goldsingle crystal electrodes. J. Electroanal. Chem. 414, 209–220 (1996)
13. J.R. Macdonald, Impedance Spectroscopy Emphasizing Solid Materials and Systems (Wiley,New York, 1987)
14. C. Cachet, B. Saidani, R. Wiart, A model for zinc deposition in alkaline electrolytes:inhibition layer and activation mechanism. Electrochim. Acta 34, 1249 (1989)
15. C. Cachet, B. Saidani, R. Wiart, The kinetics of zinc deposition at low overpotentials inalkaline electrolytes. Electrochim. Acta 33, 405 (1988)
16. C. Cachet, B. Saidani, R. Wiart, The behavior of zinc electrode in alkaline electrolytes I.A kinetic analysis of cathodic deposition. J. Electrochem. Soc. 138, 678 (1991)
17. C. Cachet, Z. Chami, R. Wiart, The behavior of zinc electrode in alkaline electrolytes II.A kinetic analysis of anodic dissolution. J. Electrochem. Soc. 139(3), 644–654 (1991)
18. T. Chengyu, C. Hang, H. Wei, L. Yu, Z. Ziqiao, Influence of Nano-Al2O3 particles on nickelelectrocrystallization at initial stage. Rare Metal Mat. Eng. 39, 10–16 (2010)
19. C. Cachet, C. Gabrielli, F. Huet, M. Keddam, R. Wiart, Electrochim. Acta 28, 899 (1983)20. I. Danaee, Theoretical and experimental studies of layer by layer nucleation and growth of
palladium on stainless steel Chemija. 24(2), 128–136 (2013)21. E.M. Garcia, T. Matencio, R.Z. Domingues, L.M. Garcia, J.A. Figueiredo dos Santos, N.
Ribeiro, H.A. Tarôco, V. F.C. Lins, Study of cobalt electrodeposition onto stainless steelusing electrochemical impedance spectroscopy (IES) J. Phys. Sci. Appl. 2(10), 409–413(2012)
22. E. Lassner, W.D. Schubert, Tungsten—Properties, Chemistry, Technology of the Element,Alloys, and Chemical Compounds (Springer, New York, 1999), 422 pp
23. M. Schwartz, N.V. Myung, K. Nobe, Electrodeposition of iron group-rare earth alloys fromaqueous media. J. Electrochem. Soc. 151, C468–C477 (2004)
24. H. Cesiulis, A. Baltutiene, M. Donten, M.L. Donten, Z. Stojek, Increase in rate ofelectrodeposition and in Ni(II) concentration in the bath as a way to control grain size ofamorphous/nanocrystalline Ni-W alloys. J. Solid State Electrochem. 6, 237–244 (2002)
25. H. Cesiulis, E.J. Podlaha-Murphy, Electrolyte considerations of electrodeposited Ni-W alloysfor microdevice fabrication. Mater. Sci. (Medziagotyra) 9, 324–327 (2003)
26. H. Cesiulis, M. Donten, M.L. Donten, Z. Stojek, Electrodeposition of Ni-W Ni-Mo andNi-Mo-W alloys from pyrophosphate baths. Mater. Sci. (Medziagotyra) 7, 237–241 (2001)
27. P. Andricacos, S.H. Boettcher, S.G. Malhotra, M. Paunovic, C. Ransom, Structurecomprising a barrier layer of a tungsten alloy comprising cobalt and/or nickel. U.S. PatentApplication Publication 6 pp. US 2004108136 A1 20040610 (2004)
28. M. Svensson, U. Wahlstrom, G. Holmbom, Compositionally modulated cobalt–tungstenalloys deposited from a single ammoniacal electrolyte. Surf. Coat. Technol. 105, 218–223(1998)
29. G.Y. Wei, J.W. Lou, H.L. Ge, Y.D. Yu, L. Jiang, L.X. Sun, Co–W films prepared fromelectroplating baths with different complexing agents. Surf. Eng. 28, 412–417 (2012)
30. D.P. Weston, S.J. Harris, P.H. Shipway, N.J. Weston, G.N. Yap, Establishing relationshipsbetween bath chemistry, electrodeposition and microstructure of Co-W alloy coatingsproduced from a gluconate bath. Electrochim. Acta 55, 5695–5708 (2010)
1 The Study of Thin Films by Electrochemical Impedance Spectroscopy 35
31. D.P. Weston, S.J. Haris, H. Capel, N. Ahmed, P.H. Shipway, J.M. Yellup, NanostructuredCo-W coatings produced by electrodeposition to replace hard Cr on aerospace components.Trans. Inst. Metal Finish. 88, 47–56 (2010)
32. A.I. Shul’man, S.S. Belevskii, S.P. Yushchenko, A.I. Dikusar, Role of complexation informing composition of Co-W coatings electrodeposited from gluconate electrolyte. Surf.Eng. Appl. Electrochem. 50(1), 9–17 (2014)
33. S.S. Belevskii, S.P. Yushchenko, A.I. Dikusar, Anomalous electrodeposition of Co-Wcoatings from a citrate electrolyte due to the formation of multinuclear heterometalliccomplexes in the solution. Surf. Eng. Appl. Electrochem. 48, 97–98 (2012)
34. J.S. Santos, F. Trivinho-Strixino, E.C. Pereira, Investigation of Co(OH)2 formation duringcobalt electrodeposition using a chemometric procedure. Surf. Coat. Technol. 205,2585–2589 (2010)
35. P. Vermeiren, R. Leysen, H. Vandenborre, Study of hydrogen evolving reaction in alkalinemedium at nickel and cobalt based electrocatalysts. Electrochim. Acta 30, 1253 (1985)
36. D.R. Gabe, The role of hydrogen in metal electrodeposition processes. J. Appl. Electrochem.27, 908 (1997)
37. J.T. Matsushima, F. Trivinho-Strixino, E.C. Pereira, Investigation of cobalt deposition usingthe electrochemical quartz crystal microbalance Electrochim. Acta 51 (2006)
38. J.S. Santos, R. Matos, F. Trivinho-Strixino, E.C. Pereira, Effect of temperature on Coelectrodeposition in the presence of boric acid Electrochim. Acta 53, 644 (2007)
39. W.C. Grande, J.B. Talbot, Electrodeposition of thin films of nickel-iron. 1. Experimental.J. Electrochem. Soc. 140(3), 669–674 (1993)
40. W.C. Grande, J.B. Talbot, Electrodeposition of thin films of nickel-iron. 2. Modelling.J. Electrochem. Soc. 140(3), 675–681 (1993)
41. A. Budreika, The study of the electrodeposition of Ni, Co and their alloys with tungsten andmolybdenum. Doctoral dissertation, 2010, Vilnius
42. Yan Liu, Wei Wang, Investigation on the Cu(II) and Co(II) electrochemical reductionprocess in citrate solution by CV and EIS. J. Electrochem. Soc. 159(6), D375–D381 (2012)
43. H. Cesiulis, G. Baltrunas, The study of surface passivity and blocking by the electrochemicaltechnique. Physicochem. Mech. Mater. 5, 11–17 (2006)
44. M.I. Jeffrey, W.L. Choo, P.L. Breuer, The effect of additives and impurities on the cobaltelectrowinning process. Miner. Eng. 13(12), 1231–1241 (2000)
45. S.S. Belevskii, S.P. Yushchenko, A.I. Dikusar, Electrodeposition of nanocrystalline Co–Wcoatings from citrate electrolytes under controlled hydrodynamic conditions: Part 1. Coelectrodeposition. Surf. Eng. Appl. Electrochem. 45(6), 446–454 (2009)
46. S.S. Belevskii, N.I. Tsyntsaru, A.I. Dikusar, Electrodeposition of nanocrystalline Co–Wcoatings from citrate electrolytes under controlled hydrodynamic conditions: part 2. Theelectrodeposition rate and composition of the coatings. Surf. Eng. Appl. Electrochem. 46(2),91–99 (2010)
47. N. Tsyntsaru, H. Cesiulis, E. Pellicer, J.-P. Celis, J. Sort, Structural, magnetic, andmechanical properties of electrodepositedcobalt–tungsten alloys: intrinsic and extrinsicinterdependencies. Electrochim. Acta 104, 94–103 (2013)
48. S.A. Silkin, S.S. Belevskii, A.S. Gradinar, V.I. Petrenko, I.V. Yakovets, N.I. Tsyntsaru, A.I.Dikusar, Electrodeposition of nanocrystalline Co–W coatings from citrate electrolytes undercontrolled hydrodynamic conditions: part 3. The micro_ and macrodistribution of thedeposition rates, the structure and the mechanical properties. Surf. Eng. Appl. Electrochem.46(3), 206–214 (2010)
49. L.M. Hagelsieb, Anodic aluminum oxide processing, characterization and application toDNA hybridization electrical detection. PhD. thesis, Universite Catholique de Louvain,Louvain-La-Neuve, Belgique (2007)
50. C.X. Jiang, J.P. Tu, S.Y. Guo, M.F. Fu, X.B. Zhao, Friction properties of oil-infiltratedporous AAO film on an aluminium substrate. Acta Metallurgica Sinica (English Letters) 18,249–253 (2005)
36 H. Cesiulis et al.
51. W. Lee, The anodization of aluminium for nanotechnology applications. JOM 62, 57–63(2010)
52. J. Choi, Fabrication of monodomain porous alumina using nanoimprint lithography and itsapplications. PhD. thesis, Martin-Luther-Universitat Halle, Wittenberg, Germany (2004)
53. I.U. Khan, P. John, S.T. Sheikh, N. Gulzar, A.U. Rehman, Anodizing of aluminum withimproved corrosion properties. J. Chem. Soc. Pak. 32, 46–51 (2010)
54. T.D. Burleigh, P. Schmuki, S. Virtanen, Properties of the nanoporous anodic oxideelectrochemically grown on steel in hot 50 % NaOH. J. Electrochem. Soc. 156(1), C45–C53(2009)
55. J.J. Suay, E. Gimenez, T. Rodrıguez, K. Habbib, J.J. Saura, Characterization of anodized andsealed aluminium by EIS. Corros. Sci. 45, 611–624 (2003)
56. M.R. Kalantary, D.R. Gabe, D.H. Ross, A model for the mechanism of nickel fluoride coldsealing of anodized aluminium. J. Appl. Electrochem. 22(3), 268–276 (1992)
57. J.A. Gonzalez, S. Feliu, J.A. Bautista, E. Otero, Changes in cold sealed aluminum oxide filmsduring ageing. J. Appl. Electrochem. 29, 843–852 (1999)
58. V López, E. Otero, A. Bautista, E. Escudero, J.A. González, Changes in the morphology ofporous anodic films formed on aluminium in natural and artificial ageing. Rev Metal MadridVol Extr, 104–109 (2003)
59. F. Mansfeld, M.W. Kendig, Spectroscopy as quality control and corrosion test for anodizedaluminum alloys. Corrosion 41, 490 (1985)
60. F. Mansfeld, M.W. Kendig, W.J. Lorenz, Corrosion inhibition in neutral, aerated media.J. Electrochem. Soc. 132, 290 (1985)
61. J. Hizing, K. Juettner, W.J. Lorenz, W. Paatsch, AC-impedance measurements on porousaluminium oxide films. Corros. Sci. 24, 945 (1984)
62. T.P. Hoar, G.C. Wood, The sealing of porous anodic oxide films on aluminium. Electrochim.Acta 7, 333 (1962)
63. K. Juettner, W.J. Lorenz, W. Paatsch, The role of surface inhomogeneities in corrosionprocesses-electrochemical impedance spectroscopy (EIS) on different aluminium oxide films.Corros. Sci. 29, 279–288 (1989)
64. F. Mansfeld, Electrochemical impedance spectroscopy (EIS) as a new tool for investigatingmethods of corrosion protection. Electrochim. Acta 35, 1533 (1990)
65. J. Pan, D. Thierry, C. Leygraf, Electrochemical impedance spectroscopy study of the passiveoxide film on titanium for implant application. Electrochim. Acta 41(7–8), 1143 (1996)
66. J.R. Birch, T.D. Burleigh, Oxides formed on titanum by polishing, etching, anodzng, orthermal oxidizng. Corrosion 56(12), 1233 (2000)
67. M. Aziz-Kerrzo, K.G. Conroy, A.M. Fenelon, S.T. Farrell, C.B. Breslin, Electrochemicalstudies on the stability and corrosion resistance of titanium-based implant materials.Biomaterials 22, 1531 (2001)
68. S. Piazza, G. Lo, Biundo, M.C. Romano, C. Sunseri, F. Di Quarto, In situ characterization ofpassive films on al-ti alloy by photocurrent and impedance spectroscopyfn1. Corros. Sci. 40(7), 1087 (1998)
69. J.R. Macdonald, Impedance Spectroscopy (Wiley, New York, 1987)70. M.J. Esplandiu, E.M. Patrito, V.A. Macagno, Characterization of hafnium anodic oxide
films: an AC impedance investigation. Electrochim. Acta 40(7), 809 (1995)71. M.E.P. Souza, M. Ballester, C.M.A. Freire, EIS characterisation of Ti anodic oxide porous
films formed using modulated potential. Surf. Coat. Technol. 201, 7775–7780 (2007)72. J.M. Macak, L.V. Taveira, H. Tsuchiya, K. Sirotna, J. Macak, P. Schmuki, Influence of
different fluoride containing electrolytes on the formation of self-organized titania nanotubesby Ti anodization. J. Electroceram. 16, 29–34 (2006)
73. N.K. Shrestha, J.M. Macak, F. Schmidt-Stein, R. Hahn, C.T. Mierke, B. Fabry, P. Schmuki,Magnetically guided titania nanotubes for site-selective photocatalysis and drug release.Angew. Chem. 120, 1–5 (2008)
1 The Study of Thin Films by Electrochemical Impedance Spectroscopy 37

74. H. Cesiulis, T. Maliar, N. Tsyntsaru, F. Wenger, P. Ponthiaux, E. Podlaha, Anodic titaniumoxide films: photoelectrochemical and tribocorrosion behavior. J. Nanoelectron.Optoelectron. 9, 1–6 (2014)
75. Balakrishnan Munirathinam, Lakshman Neelakantan, Titania nanotubes from weak organicacid electrolyte: Fabrication, characterization and oxide film properties. Mater. Sci. Eng.C 49, 567–578 (2015)
76. A.W. Brace, The Technology of Anodizing Aluminium (Tecnicopy Ltd., Stonenhouse,Gloucesterhire, Great Britian, 1979), pp. 1–19
77. H. Bai, F. Wang, Protective properties of high temperature oxide films on Ni-basedsuperalloys in 3.5 % NaCl solution. J. Mater. Sci. Technol. 23(4) (2007)
78. P. Schmuki, H. Bohni, Semiconductive properties of passive films and susceptibility tolocalized corrosion. Werkstoffe und Korrosion Mater. Corros. 42(5), 203–207 (1991)
79. N.E. Hakiki, S. Boudin, B. Rondot, M. Da Cunha, Belo. The electronic structure of passivefilms formed on stainless steels. Corros. Sci. 37(11), 1809–1822 (1995)
80. A.S. Bondarenko, G.A. Ragoisha. Variable Mott-Schottky plots acquisition bypotentiodynamic electrochemical impedance spectroscopy. J. Solid State Electrochem. 9(12), 845–849 (2005)
81. K. Gelderman, L. Lee, S.W. Donne, Flat-band potential of a semiconductor: using theMott-Schottky equation. J. Chem. Educ. 84(7), 685–688 (2007)
82. D. Li, D. Chen, J. Wang, H. Chen, Chemical composition and Mott-Schottky analysis ofpassive film formed on G3 alloy in bicarbonate/karbonate buffer solution. Acta Metall. Sin.(Engl. Lett.). 23(6), 461–472 (2010)
83. E. Sikora, J. Sikora, D.D. Macdonald, A new method for estimating the diffusivities ofvacancies in passive films. Electrochim. Acta 41(6), 783–789 (1996)
84. Z. Jiang, X. Dai, H. Middleton, Investigation on passivity of titanium under steady-stateconditions in acidic solutions. Mater. Chem. Phys. 126(3), 859–865 (2011)
85. M. Tomkiewicz, Impedance spectroscopy of rectifying semiconductor-electrolyte interfaces.Electrochim. Acta 35(10), 1631–1635 (1990)
86. B.W. Gregory, D.W. Suggs, J.L. Stickney, Conditions for the deposition of CdTe byelectrochemical atomic layer epitaxy. J. Electrochem. Soc. 138, 1279–1284 (1991)
87. F. Forni, M. Innocenti, G. Pezzatini, M.L. Foresti, Electrochemical aspects of CdTe growthon the face (111) of silver by ECALE. Electrochim. Acta 45, 3225–3231 (2000)
88. A.S. Bondarenko, G.A. Ragoisha, N.P. Osipovich, E.A. Streltsov, Multiparametricelectrochemical characterisation of Te-Cu-Pb atomic three-layer structure deposition onpolycrystalline gold. Electrochem. Commun. 8, 921–926 (2006)
89. G.A. Ragoisha, A.S. Bondarenko, N.P. Osipovich, S.M. Rabchynski, E.A. Streltsov,Multiparametric characterisation of metal-chalcogen atomic multilayer assembly bypotentiodynamic electrochemical impedance spectroscopy. Electrochim. Acta 53, 3879–3888(2008)
90. I. Sisman, U. Demir, Electrochemical growth and characterization of size-quantized CdTethin films grown by underpotential deposition. J. Electroanal. Chem. 651, 222–227 (2011)
91. J. Stickney, in Encyclopedia of Applied Electrochemistry, ed. by G. Kreysa, R.F. Savinell, K.Ota (Springer, New York, 2014), pp. 1447–1453
92. M. Bouroushian, Electrochemistry of Metal Chalcogenides (Springer, Heidelberg, 2010)93. D.M. Kolb, M. Przasnysky, H. Gerischer, Underpotential deposition of metals and work
function differences. J. Electroanal. Chem. 54, 25–38 (1974)94. E. Budevski, G. Staikov, W.J. Lorenz, Electrochemical Phase Formation and Growth (VCH,
Weinheim, 1996)95. P.V. Chulkin, Y.M. Aniskevich, E.A. Streltsov, G.A. Ragoisha, Underpotential shift in
electrodeposition of metal adlayer on tellurium and the free energy of metal tellurideformation. J Solid State Electrochem. 19, 2511–2516 (2015). doi:10.1007/s10008-015-2831-x
96. G.A. Ragoisha, Potentiodynamic electrochemical impedance spectroscopy for underpotentialdeposition processes. Electroanalysis 27, 855–863 (2015)
38 H. Cesiulis et al.

97. G.A. Ragoisha, A.S. Bondarenko, Potentiodynamic electrochemical impedance spectroscopy.Copper underpotential deposition on gold. Electrochem. Commun. 5, 392–395 (2003)
98. G.A. Ragoisha, A.S. Bondarenko, Potentiodynamic electrochemical impedancespectroscopy. Electrochim. Acta 50, 1553–1563 (2005)
99. J.E. Garland, K.A. Assiongbon, C.M. Pettit, S.B. Emery, D. Roy, Kinetic analysis ofelectrosorption using fast fourier transform electrochemical impedance spectroscopy:underpotential deposition of Bi3+ in the presence of coadsorbing ClO4- on Gold.Electrochim. Acta 47, 4113–4124 (2002)
100. S. Morin, H. Dumont, B.E. Conway, Evaluation of the effect of 2-Dimensional geometry ofPt single-crystal faces on the kinetics of UPD of H using impedance spectroscopy.J. Electroanal. Chem. 412, 39–52 (1992)
101. G.A. Ragoisha, A.S. Bondarenko, N.P. Osipovich, E.A. Streltsov, Potentiodynamicelectrochemical impedance spectroscopy of lead upd on polycrystalline gold and onselenium atomic underlayer. Electrochem. Commun. 7, 631–636 (2005)
102. L. Beaunier, I. Epelboin, J.C. Lestrade, H. Takenouti, Electrochemical and scanningmicroscope study of pained Fe. Surf. Technol. 4, 237 (1976)
103. F. Mansfield, M. Kendig, S. Tsai, Evaluation of corrosion behavior of coated metals with ACimpedance measurements. Corrosion 38(7), 478–485 (1982)
104. A. Ramanavicius, A. Finkelsteinas, H. Cesiulis, A. Ramanaviciene, Electrochemicalimpedance spectroscopy of polypyrolle based immunosensor. Bioelectrochemistry 79(1),11–16 (2010)
105. P.L. Bonora, F. Deflorian, L. Fedrizzi. Electrochemical impedance spectroscopy as a tool forinvestigating underpaint corrosion. Electrochimica Acta 41(7–8), 1073–1082 (1996)
106. J. Padgurskas, R. Rukuiza, H. Cesiulis, A. Amulevicius, A. Daugvila, R. Davidonis, C.Sipavicius, The properties and physicochemical interactions in the systemiron-fluoroligomer. Physicochem. Mech. Mater. 45(5), 81–90 (2009)
107. J. Padgurskas, R. Rukuiza, A. Amulevicius, C. Sipavicius, K. Mazeika, R. Davidonis,A. Daugvila, H. Cesiulis, Influence of fluor-oligomers on the structural and tribologicalproperties of steel surface at the rolling friction. Ind. Lubr. Tribol 60(5), 222–227 (2008)
108. V.F. Lvovich, M.F. Smiechowski, Non-linear impedance analysis of industrial lubricants.Electrochim. Acta 53(25), 7375–7385 (2008)
109. D. Hallam, D. Thurrowgood, V. Otieno-Alego, D. Creagh, An EIS Method for assessing thinoil films used in museums, in Proceedings of Metal 2004 National Museum of AustraliaCanberra ACT, 4–8 October 2004 ABN 70 592 297 967, pp. 388–399
110. L. Jianguo, G. Gaoping, Y. Chuanwei, EIS study of corrosion behaviour of organiccoating/Dacromet composite systems. Electrochimica Acta 50(16–17), 3320–3332 (2005)
111. Y.J. Tan, S. Balley, B. Kinsella, An investigation of the formation and destruction ofcorrosion inhibitor films using electrochemical impedance spectroscopy (EIS). Corros. Sci.38(9), 1545–1561 (1996)
112. S. González, M.A. Gil, J.O. Hernández, V. Fox, R.M. Souto, Resistance to corrosion ofgalvanized steel covered with an epoxy-polyamide primer coating. Prog. Org. Coat. 41,167–170 (2001)
113. H. Cesiulis, N. Tsyntsaru, Non-destructive method for assessing thin oil films, inProceedings of the International Conference BALTTRIB’2009 (2009), pp. 59–64
114. J.J. Santana, J.E. González, J. Morales, S. González, R.M. Souto, Evaluation of ecologicalorganic paint coatings via electrochemical impedance spectroscopy. Int. J. Electrochem. Sci.7, 6489–6500 (2012)
115. N. Hammouda, H. Chadli, G. Guillemot, K. Belmokre, The corrosion protection behaviour ofzinc rich epoxy paint in 3 % NaCl solution advances in chemical. Eng. Sci. 1, 51–60 (2011)
116. B.M. Fernández-Pérez, J.A. González-Guzmán, S. González, R.M. Souto, Electrochemicalimpedance spectroscopy investigation of the corrosion resistance of a waterborne acryliccoating containing active electrochemical pigments for the protection of carbon steel. Int.J. Electrochem. Sci. 9, 2067–2079 (2014)
1 The Study of Thin Films by Electrochemical Impedance Spectroscopy 39
117. P.L. Bonora, F. Deflorian, L. Fedrizzi. Electrochemical impedance spectroscopy as a tool forinvestigating underpaint corrosion. Electrochimica Acta 41(7–8), 1073–1082 (1996)
118. H. Cesiulis, G. Baltrūnas, J. Padgurskas, The effect of FOLEOX thin films on the corrosionbehaviour of Armco iron. Mater. Sci. (Medziagotyra) 8(4), 392–395 (2002)
119. G.W. Walter, A review of impedance plot methods used for corrosion performance analysisof painted metals. Corros. Sci. 26(9), 681–703 (1986)
120. Y.J. Tom, S. Bailey, An investigation on the formation and destruction of corrosion inhibitorfilms using electrochemical noise analysis (ENA). Corros. Sci. 38(9), 1545–1561 (1996)
121. A. Banu, O, Radovici, M. Marcu, T. Spataru, S. Jurcoane, Electrochemical synthesis andcharacterization of a polipyrrole/lipase composite film. Roum. Biotechnol. Lett. 13(1),3551–3556 (2008)
122. I. Morkvenaite-Vilkonciene, P. Genys, A. Ramanaviciene, A. Ramanavicius, Scanningelectrochemical impedance microscopy for investigation of glucose oxidase catalyzedreaction colloids and surfaces. B-Biointerfaces 126, 598–602 (2015)
123. I. Lapenaite, A. Ramanaviciene, A. Ramanavicius, Current trends in enzymatic determinationof glycerol. Crit. Rev. Anal. Chem. 36, 13–25 (2006)
124. A. Ramanavicius, A. Ramanaviciene, A. Malinauskas, Electrochemical sensors based onconducting polymer—polypyrrole (Review). Electrochim. Acta 51, 6025–6037 (2006)
125. Y. Oztekin, A. Ramanaviciene, Z. Yazicigil, A.O. Solak, A. Ramanavicius, Direct electrontransfer from glucose oxidase immobilized on polyphenanthroline modified-glassy carbonelectrode. Biosens. Bioelectron. 26, 2541–2546 (2011)
126. N. German, A. Ramanaviciene, A. Ramanavicius, Electrochemical deposition of goldnanoparticles on graphite rod for glucose biosensing. Sens. Actuators B: Chem. 203, 25–34(2014)
127. A. Ramanavicius, P. Genys, A. Ramanaviciene, Electrochemical impedance spectroscopybased evaluation of 1,10-Phenanthroline-5,6-dione and glucose oxidase modified graphiteelectrode. Electrochim. Acta 146, 659–665 (2014)
128. A. Ramanavicius, P. Genys, Y. Oztekin, A. Ramanaviciene, Evaluation of the redoxmediating properties of 1,10-Phenanthroline-5,6-dione for glucose oxidase modified graphiteelectrodes. J. Electrochem. Soc. 161, B31–B33 (2014)
129. D.D. Macdonald, Reflections on the history of electrochemical impedance spectroscopy.Electrochim. Acta 51, 1376–1388 (2006)
130. R.K. Shervedani, A.H. Mehrjardi, N. Zamiri, A novel method for glucose determinationbased on electrochemical impedance spectroscopy using glucose oxidase self-assembledbiosensor. Bioelectrochemistry 69, 201–208 (2006)
131. T. Hoshino, S. Sekiguchi, H. Muguruma, Amperometric biosensor based on multilayercontaining carbon nanotube, plasma-polymerized film, electron transfer mediatorphenothiazine, and glucose dehydrogenase. Bioelectrochemistry 84, 1–5 (2012)
132. B. Kurtinaitiene, D. Ambrozaite, V. Laurinavicius, A. Ramanaviciene, A. Ramanavicius,Amperometric immunosensor for diagnosis of BLV infection. Biosens. Bioelectron. 23,1547–1554 (2008)
133. Y. Oztekin, A. Ramanaviciene, N. Ryskevic, Z. Yazicigil, Z. Ustundag, A.O. Solak, A.Ramanavicius, 1,10-Phenanthroline modified glassy carbon electrode for voltammetricdetermination of cadmium(II) ions. Sens. Actuators B: Chem. 157, 146–153 (2011)
134. Y. Oztekin, Z. Yazicigil, A. Ramanaviciene, A. Ramanavicius, Polyphenol-modified glassycarbon electrodes for copper detection. Sens. Actuators B: Chem. 152, 37–48 (2011)
135. Y. Oztekin, Z. Yazicigil, A. Ramanaviciene, A. Ramanavicius, Square wave voltammetrybased determination of copper (II) ions by polyluteolin- and polykaempferol-modifiedelectrodes. Talanta 85, 1020–1027 (2011)
136. A. Ramanaviciene, A. Ramanavicius, Pulsed amperometric detection of DNA with anssDNA/polypyrrole modified electrode. Anal. Bioanal. Chem. 379, 287–293 (2004)
137. A. Ramanavicius, Y. Oztekin, A. Ramanaviciene Electrochemical Formation ofPolypyrrole-based layer for immunosensor design. Sens. Actuators B: Chem. 197,237–243 (2014)
40 H. Cesiulis et al.

138. V. Ratautaite, S.D. Janssens, K. Haenen, M. Nesládek, A. Ramanaviciene, I. Baleviciute, A.Ramanavicius, Molecularly imprinted polypyrrole based impedimentric sensor fortheophylline determination. Electrochim. Acta 130, 361–367 (2014)
139. V. Ratautaite, D. Plausinaitis, I. Baleviciute, L. Mikoliunaite, A. Ramanaviciene,A. Ramanavicius, Characterization of caffeine-imprinted polypyrrole by a quartz crystalmicrobalance and electrochemical impedance spectroscopy. Sens. Actuators B: Chem. 212,63–71 (2015)
140. A. Ramanaviciene, A. Finkelsteinas, A. Ramanavicius, Basic electrochemistry meetsnanotechnology: Electrochemical preparation of artificial receptors based on a nanostructuredconducting polymer, polypyrrole. J. Chem. Educ. 83, 1212–1214 (2006)
141. A. Ramanaviciene, A. Ramanavicius, Molecularly imprinted polypyrrole-based syntheticreceptor for direct detection of bovine leukemia virus glycoproteins. Biosens. Bioelectron.20, 1076–1082 (2004)
142. V. Ratautaite, S.N. Topkaya, L. Mikoliunaite, M. Ozsoz, Y. Oztekin, A. Ramanaviciene,A. Ramanavicius, Molecularly imprinted polypyrrole for DNA determination.Electroanalysis 25, 1169–1177 (2013)
143. A. Ramanaviciene, A. Ramanavicius, Application of polypyrrole for the creation ofimmunosensors. Crit. Rev. Anal. Chem. 32, 245–252 (2002)
144. D. Plausinaitis, V. Ratautaite, L. Mikoliunaite, L. Sinkevicius, A. Ramanaviciene,A. Ramanavicius, Quartz crystal microbalance based evaluation of electrochemicalformation of aggregated polypyrrole particle based layer. Langmuir 31(10), 3186–3193 (2015)
145. A. Ramanaviciene, N. German, A. Kausaite-Minkstimiene, J. Voronovic, J. Kirlyte,A. Ramanavicius, Comparative study of surface plasmon resonance, electrochemical andelectroassisted chemiluminescence methods based immunosensor for the determination ofantibodies against human growth hormone. Biosens. Bioelectron. 36, 48–55 (2012)
146. A.S. Bandarenka, K. Eckhard, A. Maljusch, W. Schuhmann, Localized electrochemicalimpedance spectroscopy: Visualization of spatial distributions of the key parametersdescribing solid/liquid interfaces. Anal. Chem. 85, 2443–2448 (2013)
147. V. Kuznetsov, A. Maljusch, R.M. Souto, A.S. Bandarenka, W. Schuhmann, Characterizationof localised corrosion processes using scanning electrochemical impedance microscopy.Electrochem. Commun. 44, 38–41 (2014)
148. L. Philippe, G. Walter, S. Lyon, Investigating localized degradation of organic coatingscomparison of electrochemical impedance spectroscopy with local electrochemicalimpedance spectroscopy. J. Electrochem. Soc. 150, B111–B119 (2003)
149. K. Darowicki, M. Szociński, A. Zieliński, Assessment of organic coating degradation vialocal impedance imaging. Electrochim. Acta 55, 3741–3748 (2010)
150. M. Szociński, K. Darowicki, K. Schaefer, Identification and localization of organic coatingdegradation onset by impedance imaging. Polym. Degrad. Stab. 95, 960–964 (2010)
151. A. Ramanavicius, A. Kausaite-Minkstimiene, I. Morkvenaite-Vilkonciene, P. Genys,R. Mikhailova, T. Semashko, J. Voronovic, A. Ramanaviciene, Biofuel cell based onglucose oxidase from Penicillium funiculosum 46.1 and horseradish peroxidase. Chem. Eng.J. 264, 165–173 (2015)
152. A. Ramanavicius, Y. Oztekin, A. Ramanaviciene, Electrochemical formation ofpolypyrrole-based layer for immunosensor design. Sens. Actuators B: Chem. 197, 237–243(2014)
153. M.V. Mirkin, W. Nogala, J. Velmurugan, Y. Wang, Scanning electrochemical microscopy inthe 21st century. Update 1: five years after. Phys. Chem. Chem. Phys. 13, 21196–21212(2011)
154. M. Ciobanu, D.E. Taylor, J.P. Wilburn, D.E. Cliffel, Glucose and lactate biosensors forscanning electrochemical microscopy imaging of single live cells. Anal. Chem. 80,2717–2727 (2008)
155. D.T. Pierce, P.R. Unwin, A.J. Bard, Scanning electrochemical microscopy. 17. Studies ofenzyme-mediator kinetics for membrane- and surface-immobilized glucose oxidase. Anal.Chem. 64, 1795–1804 (1992)
1 The Study of Thin Films by Electrochemical Impedance Spectroscopy 41
156. B.R. Horrocks, D. Schmidtke, A. Heller, A.J. Bard, Scanning electrochemical microscopy.24. Enzyme ultramicroelectrodes for the measurement of hydrogen peroxide at surfaces.Anal. Chem. 65, 3605–3614 (1993)
157. K. Eckhard, T. Erichsen, M. Stratmann, W. Schuhmann, Frequency-dependentalternating-current scanning electrochemical microscopy (4D AC-SECM) for localvisualisation of corrosion sites. Chem. Eur. J. 14, 3968–3976 (2008)
158. K. Eckhard, C. Kranz, H. Shin, B. Mizaikoff, W. Schuhmann, Frequency dependence of theelectrochemical activity contrast in AC-scanning electrochemical microscopy and atomicforce microscopy-AC-scanning electrochemical microscopy imaging. Anal. Chem. 79,5435–5438 (2007)
159. P.M. Diakowski, Z.F. Ding, Novel strategy for constant-distance imaging using alternatingcurrent scanning electrochemical microscopy. Electrochem. Commun. 9, 2617–2621 (2007)
160. B. Ballesteros, A. Katemann, E.J. Schulte, M. Calvo, W. Koudelka-Hep, Schuhmann,Localised electrochemical impedance spectroscopy with high lateral resolution by means ofalternating current scanning electrochemical microscopy. Electrochem. Commun. 4, 134–138(2002)
161. C. Gabrielli, M. Keddam, N. Portail, P. Rousseau, H. Takenouti, V. Vivier, Electrochemicalimpedance spectroscopy investigations of a microelectrode behavior in a thin-layer cell:experimental and theoretical studies. J. Phys. Chem. B 110, 20478–20485 (2006)
162. C. Gabrielli, F. Huet, M. Keddam, P. Rousseau, V. Vivier, Scanning electrochemicalmicroscopy imaging by means of high-frequency impedance measurements in feedbackmode. J. Phys. Chem. B 108, 11620–11626 (2004)
163. A.S. Baranski, P.M. Diakowski, Application of AC impedance techniques to scanningelectrochemical microscopy. J. Solid State Electrochem. 8, 683–692 (2004)
164. K. Eckhard, H. Shin, B. Mizaikoff, W. Schuhmann, C. Kranz, Alternating current(AC) impedance imaging with combined atomic force scanning electrochemicalmicroscopy (AFM-SECM). Electrochem. Commun. 9, 1311–1315 (2007)
42 H. Cesiulis et al.

http://www.springer.com/978-3-319-30197-6