THE STUDY OF CONTAMINATED TOXIC HEAVY METALS OF TRAFFIC STREET DUST AND SOILS IN ERBIL CITY
23
1 ICEEE 2014 CONFERENCE 1 ST INTERNATIONAL CONFERENCE on ECOLOGY, ENVIRONMENT, AND ENERGY 1 JUNE , 2014 ISHIK UNIVERSITY ERBIL IRAQ BOOK OF PROCEEDINGS
-
Upload
university-of-salahaddin-hawler -
Category
Documents
-
view
37 -
download
0
Transcript of THE STUDY OF CONTAMINATED TOXIC HEAVY METALS OF TRAFFIC STREET DUST AND SOILS IN ERBIL CITY

1
ICEEE 2014 CONFERENCE
1ST
INTERNATIONAL CONFERENCE
on
ECOLOGY, ENVIRONMENT, AND ENERGY
1 JUNE , 2014
ISHIK UNIVERSITY
ERBIL
IRAQ
BOOK OF PROCEEDINGS

2
BOOK OF PROCEEDINGS ICEEE
2014
DESIGNED BY HASAN RUSTEMOGLU

3
Published by Ishik University
Erbil, Iraq
First Published in 2014
All rights reserved. No part of this publication may be reproduced,
stored in a retrieval system or transmitted in any form or by any
means, electronic, mechanical, photocopying, recording or otherwise
without the prior written permission of the copyright holder.
Reproduction of material in this information product for resale or
other commercial purposes is prohibited without written permission
of the copyright holder. Applications for such permission should be
addressed to Ishik University, 100 meter Street, Erbil, Iraq.
Editors: Assoc. Prof. Dr. Sukru Dursun, Dr. Doğan Özdemir, Duran
Kala
(ى ثيَذراوة 2108(ى سالي )824طشتي كتيَبخانت طشتيت كان رمارةى سثاردن )به رايه تي لت بتريَوة
Disclaimer:
Any views or opinions expressed in any of the papers in this
collection are those of their respective authors. They do not represent
the view or opinions of Ishik University, the editors nor of the
publisher and conference sponsors.

4
Honorary Committee
Prof. Dr. Ahmet Öztaş
President of Ishik University
Conference Chair
Dr. Mehmet Özdemir,
Vice President of Administrative Affairs, and Dean of faculty of
Education
Ishik University
Conference Co-Chair
Çağrı Tuğrul Mart
Ishik University
Organizing Secretary
Mustafa Albay
Ishik University, Iraq
Organizing Committee
Dr. Mehmet Özdemir,
Dean of Faculty of Education, Ishik University, Iraq
Çağrı Tuğrul Mart

11
TABLE OF CONTENTS
1. ENVIRONMENTAL POLLUTION FROM FOSSIL FUELS AND PREVENTION
MEASURES
PROF. DR. ZAFER AYVAZ……………………………………………………………………………14
2. POTENTIALS OF RAINWATER HARVESTING AND ITS IMPACTS ON HEALTH AND
SANITATION IN SAIDPUR MODEL VILLAGE ISLAMABAD, PAKISTAN
HUMAIRA JOUHAR, IFTIKHAR FAREED, SAIMA JADOON, SARFARAZ MUNIR …….…… 22.
3. EVALUATION OF ZIRCONIUM CORES ADAPTATION FABRICATED BY CAD/CAM
SYSTEMS
RITA RAMIZ ROBEIL ……………………………………………………………………….…………47
4. SOIL MOISTURE ESTIMATION FROM LAND SURFACE MODEL AND SATELLITE
REMOTE SENSING BASED ON CATCHMENT WATER BALANCE: A COMPARATIVE
ASSESSMENT STUDY
DELEEN AL-SHRAFANY, MIGUEL ANGEL RICO-RAMIREZ, DAWEI HAN ……...……. ……60
5. ELABORATION OF ELECTRICITY ENERGY FOR PRODUCTION-CONSUMPTION
RELATION OF NORTHERN-IRAQ FOR THE FUTURE EXPECTATIONS
AHMET DEMIR ……………………………………………………………………………………... 105
6. THE EFFECTS OF FREQUENCY AND TEMPERATURE ON THE DIELECTRIC CONSTANT OF
X%AL2O3 POWDER EXTRACTED FROM IRAQI KAOLIN
AYOUB S. KARIM ……………………………………………………………………………………………………………………………115
7. ENVIRONMENTAL AND ECOLOGICAL ISSUES IN ELT & COURSE BOOKS
TAHSIN YAGCI, YUNUS YILDIZ, MARWAN AL-KHALIDY, ISMAEL AHMED RASOLL ….137
8. MEASURES OF TREE SPECIES DIVERSITY IN THE URBAN FOREST
FARHAD ALI ……………………………………………………………………………………….. 149
9. THE IRAQI FARMERS UNDER THE NEW IRAQI PATENT LAW
MARWAN KHALIDY ………………………………………………………………………………. 223
10. ZERO FOOTPRINTS RE-SKINNING USING PV PANELS AND MAXIMISE THE
EFFICIENCY OF PV PANELS VIA PROTOTYPE DUAL AXIS SOLAR TRACKER IN
ECOLOGICALLY RESPONSIVE ARCHITECTURE
HARDI K. ABDULLAH ………………………………………………………………..…………… 231

12
11. TUMORS OF PLANTS. EPIDEMIOLOGY AND ECOLOGY IN TERRITORY OF LANDSCAPE
RESERVE “TEPLY STAN”.
AMIR NURULLAYEVICH HUSEYINOV, DURAN KALA …………………….………… … ...…252
12. WATER SOLUBILIZATION OF HEAVY METALS IN CONTAMINATED SOILS USING
SELECTED AMENDMENTS
IFTIKHAR FAREED, MUHAMMAD IRSHAD, ZOHAIB AYUB, SYED TAWAB SHAH .……….261
13. THE AWARENESS OF HEALTH AND SAFETY ISSUES AT EDUCATIONAL
INSTITUTIONS
TAHSIN YAGCI, YUNUS YILDIZ, MARWAN AL-KHALIDY, ISMAEL AHMED RASOLL ..… 279
14. HARDNESS OF WATER ,FACTORS CAUSING IT, METHODS OF ITS REMOVING
DOGAN OZDEMIR, MEHMET OZDEMIR ……………………………………………………….…282
15. PARADOX BETWEEN ECOLOGY AND ECONOMY
SNOOR FAQÊ MUHAMMAD MUHAMMAD, SHERZAD AHMED SHAHAB ……………..….. 303
16. RAISING ENVIRONMENTAL AWARENESS AMONG SECONDARY SCHOOL
STUDENTS
MEHMET ÖZDEMIR …………………………………………………………………………….……335
17. ESTIMATING AND SIMULATION DRINKING WATER USING WEAP MODEL (CASE
STUDY: EKBATAN DAM IN HAMEDAN)
SINA ABASMIRZAIE, NIAN SOHRABNEJAD ……………………………………………….….…343
18. ANALYZING FACTORS RESPONSIBLE FOR PREVALENCE OF TYPHOID AND
TRACHOMA IN UNION COUNCIL ATTAR SHISHA OF DISTRICT MANSEHRA
SAEEDA SARWAR ……………………………………………………………………………...……359
19. THE STUDY OF CONTAMINATED TOXIC HEAVY METALS OF TRAFFIC STREET
DUST AND SOILS IN ERBIL CITY
SHAWKET, F. SIRWAN, ISMAIL, W. ALI , AYOOB, M. MZGIN , ALI, O. KARWAN …….… 402
20. THE ECOLOGY OF THE EMBRYO AFFECTS HIS FUTURE DENTAL HEALTH CARE
BUSHRA RAHID ……………………………………………………………………………......….. 418
21. EVALUATION OF INTERNAL ADAPTABILITY OF DIFFERENT CORE MATERIALS
(AN IN VITRO STUDY)
RITA R. ROBEIL ……………………………………………………………………………....………434

13
22. THE ASPECT OF ISLAMIC CULTURE ON ENVIRONMENT AND ECOLOGY
TAHSIN YAGCI …………………………………………………………………………………… 448
23. TEACHING ENVIRONMENTAL AWARENESS IN EDUCATIONAL INSTITUTIONS
YUNUS YILDIZ ………………………………………………………………………………………453

402
THE STUDY OF CONTAMINATED TOXIC HEAVY METALS
OF TRAFFIC STREET DUST AND SOILS IN ERBIL CITY
Shawket, F. Sirwan1a
*; Ismail, W. Ali1b
; Ayoob, M. Mzgin1c
; Ali,
O. Karwan1d
1Salahaddin University, Education College, Chemistry Department,
Erbil, Kurdistan Region, Iraq
c
[email protected]. ; d [email protected].
Abstract: During the last few years, the numbers of vehicles in a
developing Erbil City in Kurdistan region - Iraq have increased rapidly
which leads to increasingly high contamination of some heavy metals in
the street dust around traffics. This research represents the level of
heavy metals (Pb , Cd , Ag , Cr , Cu, Zn and Fe ) in the traffic street
dust . The results indicate a highly contaminated toxic with heavy
metals when compared with the background values. The higher
concentrations of Pb, Cu, Cr and Fe were observed as being related to
high vehicular and heavy traffic, nevertheless other elements such as
Cd, Zn and Ag do not show anthropogenic activity influence and their
content can be attributed to the composition of soil. The PI value of the
metal included, Fe, Pb, Cu , Cr, Zn, and Cd ranged from 28.54 - 36,
4.73 - 25.13, 3.23 - 9.75 and 3.35 - 5.65, 3.78-15.06, 7.89-9.87
respectively. The results indicate that all traffics are heavily
contaminated with obvious heavy metals like Fe, Pb, Cu and Cr (PI >
3). The PI value of Ag varied from 1.06 to 1.74 with a average value of
1.462 and about 100% of soil samples were classified as being
moderately contamination with Ag metal.
Key Words: Heavy metals, pollution index, traffic street dust, soil,
Erbil City
1- Introduction

403
Heavy metals in urban soils have been widely studied due to their
toxicity and persistence have been considered to be powerful tracers
for monitoring the impact of human activities(Kelly, Thornton, &
Simpson, 1996; Manta, Angelone, Bellanca, Neri, & Sprovieri, 2002).
The activities lead to emission of heavy metals into the air and their
subsequent deposition into urban soils, such as vehicular emissions
and fuel combustion (Li, Poon, & Liu, 2001). In urban areas, heavy
metals can be readily transferred into the human body as a
consequence of inhalation, and ingestion (Ferreira-Baptista & De
Miguel, 2005). Then the metal can typically accumulate in human
body due to their non-biodegradable nature. It has been found that
heavy metals in urban soils may have toxic effects on human health
especially on the children (Lim, Lee, Chon, & Sager, 2008). For
example, Lead from leaded gasoline used to be a major source of
atmospheric (Manahan, 2004). Lead is considered one of the
environmentally hazardous elements along with cadmium, copper,
zinc and chromium it poses a particularly high risk can be harmful
with low-level Pb exposure can be harmful to enzyme systems
involved in blood production and high-level Pb exposure can even
affect intelligence of human (Babula et al., 2008). Lead may be
absorbed into the inhalation. Short-term exposure to high levels of
lead can cause vomiting, diarrhea, convulsions, Coma or even death
when exposure to even very small amounts of lead, especially to
infants and young children. Therefore it is very important to monitor
the trace levels of Pb in environments (Miguel et al., 1997). In this
aspect, reliable and sensitive analytical methods have an important
role to evaluate the environmental impact of metal pollutants; the
most common analytical methods for the lead trace determination are
the flame atomic absorption spectrometry, the electrothermal atomic
absorption spectrometry and the inductively coupled plasma emission
spectrometry (ICP). Flame atomic absorption spectrometry is by far
the most widely employed technique for analyte determination (Stein
Vincent & McClellan Bobby, 1980).
1- Introduction

404
in present work investigate concentration of background values (BV)
for some heavy metal Pb, Cr, Fe, Zn, Cd, Cu and Ag in soil of Erbil
City included a comparison with its average concentrations in the
traffic street dust contaminated sample to evaluate, pollution indexes
(PI) for each heavy metal.
2- Material and Method
2-1 Reagents
Stock standard solution of Cadmium, 1000 mg liter-1
Cd,
prepared by dissolving 1.000 g of cadmium metal in 20ml of 5M
hydrochloric acid and 2 drops of nitric acid (S.G.1.42). Dilute to
1 liter in a volumetric flask with deionized water then stored in a
polythene bottle.
Stock standard solution of Chromium, 1000 mg liter-1
Cr,
prepared by dissolving 7.690 g of [Cr(NO3)3.9H2O] in 250 ml of
deionized water. Dilute to 1 liter in a volumetric flask with
deionized water then stored in a polythene bottle.
Stock standard solution of Cobalt,1000 mg liter-1
Co, Dissolve
4.9379 g of [Co(NO3)3.6H2O] in 200 ml of deionized water.
Dilute to 1 liter in a volumetric flask with deionized water then
stored in a polythene bottle.
Stock standard solution of Copper, 1000 mg liter-1
Cu, dissolve
1.000 g of cupper metal in 50 ml of 5 M nitric acid. Dilute to 1
liter in a volumetric flask with deionized water then stored in a
polythene bottle.
Stock standard solution of Iron, 1000 mg liter-1
Fe, dissolves
1.000 g of Iron powder granules in 20 ml of 5 M hydrochloric
acid and 5 ml of nitric acid (S.G .1.42). Dilute to 1 liter in a
volumetric flask with deionized water then stored in a polythene
bottle.
Stock standard solution of Lead, 1000 mg liter-1
Pb, dissolve
1.5980 g of lead nitrate [Pb(NO3)2] in 100 ml deionized water.
Dilute to 1 liter in a volumetric flask with deionized water then
stored in a polythene bottle.
405
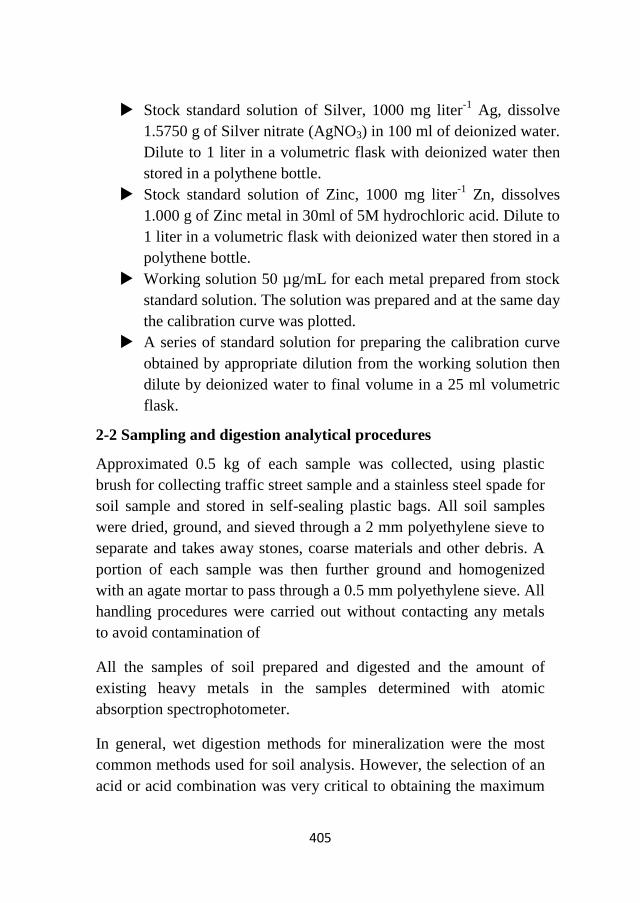
Stock standard solution of Silver, 1000 mg liter-1
Ag, dissolve
1.5750 g of Silver nitrate (AgNO3) in 100 ml of deionized water.
Dilute to 1 liter in a volumetric flask with deionized water then
stored in a polythene bottle.
Stock standard solution of Zinc, 1000 mg liter-1
Zn, dissolves
1.000 g of Zinc metal in 30ml of 5M hydrochloric acid. Dilute to
1 liter in a volumetric flask with deionized water then stored in a
polythene bottle.
Working solution 50 µg/mL for each metal prepared from stock
standard solution. The solution was prepared and at the same day
the calibration curve was plotted.
A series of standard solution for preparing the calibration curve
obtained by appropriate dilution from the working solution then
dilute by deionized water to final volume in a 25 ml volumetric
flask.
2-2 Sampling and digestion analytical procedures
Approximated 0.5 kg of each sample was collected, using plastic
brush for collecting traffic street sample and a stainless steel spade for
soil sample and stored in self-sealing plastic bags. All soil samples
were dried, ground, and sieved through a 2 mm polyethylene sieve to
separate and takes away stones, coarse materials and other debris. A
portion of each sample was then further ground and homogenized
with an agate mortar to pass through a 0.5 mm polyethylene sieve. All
handling procedures were carried out without contacting any metals
to avoid contamination of
All the samples of soil prepared and digested and the amount of
existing heavy metals in the samples determined with atomic
absorption spectrophotometer.
In general, wet digestion methods for mineralization were the most
common methods used for soil analysis. However, the selection of an
acid or acid combination was very critical to obtaining the maximum

406
extraction of metal. HNO3 digests many common metals either alone
or in combination of some other acids.
Accurately weighed 4.0 grams for each of street dust samples or soil
dried at 110 °C, weigh out into separate, acid washed, labeled, clean,
and dry 250 ml beakers. For digestion procedure to each sample add
15 ml water, and then 10 ml concentrated HNO3. Heat the samples
together on one hotplate until vapor is condensing on the bottom of
the watch glass and dripping back down into the beaker. Remove the
samples from the hotplate and let them cool. Add a further 10 ml of
concentrated HNO3 to each, replace the watch glasses, and reflux for
10 minutes . Rinse the material back into the beaker. After cooling the
samples again , add 10 ml of concentrated HCl and then add 15ml of
water. Replace the watch glass cover and reflux for 15 minutes.
Finally, filter each solution through acid washed qualitative filter
paper into a 50 ml volumetric flask. rinse volume you might have left
to try to wash the yellow color out of the filter paper and into the
volumetric flask. After the solution has cooled to room temperature,
dilute to the mark by deionized water.
2-3 Apparatus
The absorbance of the solution was measured by SP9 PYE-UNICOM
Flame atomic absorption spectrometer against blank test as reference.
The previously plotted calibration curve was used to read the content
of metals in the mineralized solutions and to calculate the content of
metals per kg of dry mass of soil. The determination for every sample
collection site was done three times.
2-4 Sampling Area
Street dust samples collected in fourteen traffics and were selected for
the study, are located in different parts in Erbil city. Six of them
(traffic No. 7- 12) are located in the city centre, Fig. 1, while the

407
others selected traffic situated outside and around the city center. The
selection of the traffics allowed an examination of the effect of the
intensity of the traffic on the content of the heavy metals in Erbil City
to study degree of contamination to assist in developing strategies to
protect urban environments and human health against long-term
accumulation of heavy metals.
No Traffic name
1 Adala
2 Makhmor
3 Baz
4 Sami abdulrahman
5 Korani ankawa
6 Ankawa
7 Shekhicholi
8 Garage nishtman
9 Zaitwna
10 Barzani namr
11 Xairwlla abdulkarim
12 Shahidan
13 Langa
14 Akar
408
Fig. (1): Distribution of the sampling area indicated by a number on
Erbil City map. The attached list shows the numbers for each
traffic name. This is to show traffic numbers from 7-12 being
located in the city center.
2-5 Background value
Soil samples far from roads around Erbil City were collected by
means of a soil rod at 30cm depths and digested in the same
procedure that was traffic dust street prepared.
3- Results and Discussion
The concentration of various metals released in the soil, far from roads
and from anthropogenic activities, is directly related to its granularity
and mineral composition. In this study, the soil background values (BV)
for Pb, Cr, Fe, Zn, Cd, Cu and Ag in Erbil City used were 17.0, 8.52,
176.4, 0.78, 0.39, 21.40, 21.40 and 1.93 mg/kg respectively in dry soil
were represent in Table 1.
Analysis of the results shows that the content of all each heavy metals
for street dust sample in Erbil City represented in Fig.(1- 7) a ,
together to a comparison with each heavy metals content in the soil
background values plotted inFig. (1- 7) b.
The concentration ranges of Pb, Cr, Fe, Zn, Cd, Cu and Ag were
80.35 - 427.15, 28.51- 48.17, 5034.2- 6349.8, 2.95- 11.75, 3.08 -
3.85, 69.05 - 208.75 and 2.05 - 3.43 mg/kg, with Average values of
181.54, 37.56, 5779.24, 5.481, 3.36, 128.21, and 2.81 mg/kg,
respectively.
Average concentrations of the heavy metals in the street dust sample
decreased in the order of Fe > Pb > Cu > Cr > Zn > Cd > Ag.

409
Concentrations of Ag were approximately comparable to the
background values, while for Fe, Pb, Cu, Cr, Zn, and Cd
concentrations were, respectively 32.7-, 10.68-, 5.99-, 4.41-,
7.03- and 8.53- fold higher than their corresponding background
values.
The concentrations of Fe, Cu, Pb, and Cr varied greatly, while Zn, Ag
and Cd concentrations were homogeneous across the city. Based on
the coefficients of variation (CV) which are presented in Table(1), the
analyzed heavy metals can be classified into two groups: Zn, Ag and
Cd with CV values lower than 0.3; and Fe, Cu, Pb, and Cr, with CV
values higher than 0.5.
It has been reported that CV values of heavy metals dominated by
natural sources are quietly low, while CV values of heavy metals
related to anthropogenic activity sources are very high(Yongming,
Peixuan, Junji, & Posmentier, 2006).
Accordingly, Fe, Pb, Cu and Cr concentrations in for street dust
sample in Erbil City tend to be affected by anthropogenic activities,
while Zn, Ag and Cd may more often be associated with natural
sources. A group of heavy metals contained Fe, Pb, Cu and Cr well-
known pollutants in urban soils and may originate from a common
anthropogenic activity source. The other group contained Zn, Ag and
Cd which may originate from the soil, as well as parent rocks
composition.
Table (1): The concentration (mg/kg) of heavy metals in Erbil City
Heavy metal Concentration (mg/kg) SD CV BV
Min. Max.
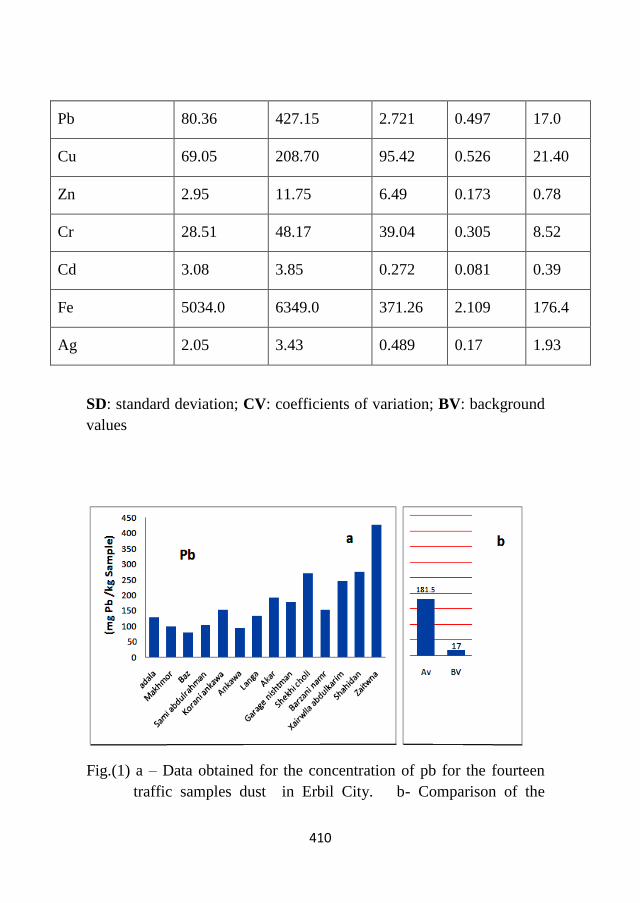
410
Pb 80.36 427.15 2.721 0.497 17.0
Cu 69.05 208.70 95.42 0.526 21.40
Zn 2.95 11.75 6.49 0.173 0.78
Cr 28.51 48.17 39.04 0.305 8.52
Cd 3.08 3.85 0.272 0.081 0.39
Fe 5034.0 6349.0 371.26 2.109 176.4
Ag 2.05 3.43 0.489 0.17 1.93
SD: standard deviation; CV: coefficients of variation; BV: background
values
Fig.(1) a – Data obtained for the concentration of pb for the fourteen
traffic samples dust in Erbil City. b- Comparison of the

411
average (AV) concentration with data obtained for the
background value (BV).
Fig.(2) a – Data obtained for the concentration of Cd related to the
fourteen traffic samples dust in Erbil City. b- Comparison
of the average (AV) concentration with data obtained for the
background value (BV).

412
Fig.(3)a – Data obtained for the concentration of Cr for the fourteen
traffic samples dust in Erbil City. b- Comparison of the
average (AV) concentration with data obtained for the
background value (BV).
Fig.(4)a – Data obtained for the concentration of Cu for the fourteen
traffic samples dust in Erbil City. b- Comparison of the
average (AV) concentration with data obtained for the
background value (BV).

413
Fig.(5) a – Data obtained for the concentration of Zn for the fourteen
traffic samples dust in Erbil City. b- Comparison of the
average (AV) concentration with data obtained for the
background value (BV).
Fig.(6)a – Data obtained for the concentration of Fe for the fourteen
traffic samples dust in Erbil City. b- Comparison of the
average (AV) concentration with data obtained for the
background value (BV)

414
Fig.(7) a – Data obtained for the concentration of Ag for the fourteen
traffic samples dust in Erbil City. b- Comparison of the
average (AV) concentration with data obtained for the
background value (BV).
3-1. Evaluation of pollution index (PI)
To evaluate contamination level of the heavy metals, The pollution
index (PI) for each metal were calculated. The PI of each metal was
defined as the ratio of its concentration to the background value of the
corresponding metal using the following equation (Wei and Yang,
2010). The PI of each metal was classified as either low (PI 1),
moderate (1<PI 3) or high contamination (PI>3).
The PI value of the metal included, Fe, Pb, Cu, Cr, Zn, and Cd ranged
from 28.54 - 36, 4.73 - 25.13, 3.23 - 9.75 and 3.35 - 5.65, 3.78 -
15.06, 7.89 - 9.87 respectively. The results in Table(2) indicate that
all traffics in Erbil city heavily contaminated with obvious heavy
metals like Fe, Pb, Cu and Cr (PI > 3). The PI value of Ag varied
from 1.06 to 1.74 with a average value of 1.462 and about 100% of
soil samples were classified as being moderately contamination with
Ag metal.

415
Table (2): Values for pollution index (PI) of heavy metals
contaminated dust collected from fourteen traffics in Erbil
city.
Heavy metal s PI
Min. Max. Mean
Fe 28.54 36 32.77
Pb 4.73 25.13 10.6
Cu 3.23 9.75 6.08
Cr 3.35 5.65 4.41
Zn 3.78 15.06 7.03
Cd 7.89 9.87 8.52
Ag 1.06 1.74 1.46
4- Conclusion
Everyone is exposed to trace amounts of heavy metals through
inhalation dust with highly contaminated heavy metals when
compared with the background values .The level of heavy metals in
the dust depends on the intensity of traffic in the area that indicates
high concentrations of Pb, Cu and Fe in street dust were associated
with vehicular exhausts arising from the use of leaded gasoline and
from erosive of the vehicular braking systems respectively.
Acknowledgements
The authors wish to acknowledge the department of chemistry –
Salahaddin University-Erbil, without their support, leading to make

416
facilitations to use the instruments, the work would not have been
accomplished
References
Babula, P., Adam, V., Opatrilova, R., Zehnalek, J., Havel, L., &
Kizek, R. (2008). Uncommon heavy metals, metalloids and
their plant toxicity: a review. Environmental Chemistry
Letters, 6(4), 189-213.
Ferreira-Baptista, L., & De Miguel, E. (2005). Geochemistry and risk
assessment of street dust in Luanda, Angola: a tropical urban
environment. Atmospheric Environment, 39(25), 4501-4512.
Kelly, J., Thornton, I., & Simpson, P. (1996). Urban geochemistry: a
study of the influence of anthropogenic activity on the heavy
metal content of soils in traditionally industrial and non-
industrial areas of Britain. Applied Geochemistry, 11(1), 363-
370.
Li, X., Poon, C.-s., & Liu, P. S. (2001). Heavy metal contamination of
urban soils and street dusts in Hong Kong. Applied
Geochemistry, 16(11), 1361-1368.
Lim, H.-S., Lee, J.-S., Chon, H.-T., & Sager, M. (2008). Heavy metal
contamination and health risk assessment in the vicinity of the
abandoned Songcheon Au–Ag mine in Korea. Journal of
Geochemical Exploration, 96(2), 223-230.
Manahan, S. E. (2004). Environmental chemistry: CRC press.
Manta, D. S., Angelone, M., Bellanca, A., Neri, R., & Sprovieri, M.
(2002). Heavy metals in urban soils: a case study from the city
of Palermo (Sicily), Italy. Science of the Total Environment,
300(1), 229-243.

417
Miguel, E. d., Llamas, J. F., Chacón, E., Berg, T., Larssen, S., Røyset,
O., & Vadset, M. (1997). Origin and patterns of distribution of
trace elements in street dust: unleaded petrol and urban lead.
Atmospheric Environment, 31(17), 2733-2740.
Stein Vincent, B., & McClellan Bobby, E. (1980). Enhancement of
Atomc-Absorption Sensitivity for Cadmium, Manganese
Nickel and Silver and Determination of Sub-Microgram
Quantities of Cadmium and Nickel in Environmental-Samples
Enviro. Sci. & Tech, 14, 872-877.
Yongming, H., Peixuan, D., Junji, C., & Posmentier, E. S. (2006).
Multivariate analysis of heavy metal contamination in urban
dusts of Xi'an, Central China. Science of the Total
Environment, 355(1), 176-186.