
THE STUDY AND DEVELOPMENT OF CALCIUM PHOSPHATE BONE CEMENT ...
153
THE STUDY AND DEVELOPMENT OF CALCIUM PHOSPHATE BONE CEMENT AND HYDROXYAPATITE NANOFIBERS ____________________________________________________ A Dissertation Presented to Faculty of the Graduate School University of Missouri ________________________________________ In Partial Fulfillment Of the Requirements for the Degree Doctor of Philosophy _______________________________________ by WEN WANG RITTS Dr. Hao Li, Dissertation Advisor Mechanical and Aerospace Engineering Department University of Missouri MAY 2012
Transcript of THE STUDY AND DEVELOPMENT OF CALCIUM PHOSPHATE BONE CEMENT ...

THE STUDY AND DEVELOPMENT OF CALCIUM PHOSPHATE
BONE CEMENT AND HYDROXYAPATITE NANOFIBERS
____________________________________________________
A Dissertation Presented to Faculty of the Graduate School University of Missouri
________________________________________
In Partial Fulfillment Of the Requirements for the Degree
Doctor of Philosophy
_______________________________________
by WEN WANG RITTS
Dr. Hao Li, Dissertation Advisor Mechanical and Aerospace Engineering Department
University of Missouri MAY 2012

© Copyright by Wen Wang Ritts 2012
All Rights Reserved

The undersigned, appointed by the Dean of the Graduate School, have examined the Dissertation entitled:
THE STUDY AND DEVELOPMENT OF CALCIUM PHOSPHATE
BONE CEMENT AND HYDROXYAPATITE NANOFIBERS
Presented by Wen Wang Ritts
A candidate for the degree of DOCTOR OF PHILOSOPHY
And hereby certify that in their opinion it is worthy of acceptance.
________________________ Prof. Hao Li
________________________ Dr. Kenneth Lambert
________________________ Prof. James Lee
________________________ Prof. Qingsong Yu
________________________ Prof. Stephen Lombardo
________________________ Prof. Robert A. Winholtz

DEDICATION
I dedicate this dissertation to my wonderful family, particularly to my
understanding and patient husband, Andy, who has always given me unconditional love
and support. I must also thank my loving mother and my terrific in-laws who have given
me their fullest support.

ii
ACKNOWLEDGEMENTS
I would never have been able to finish my dissertation without the guidance of my
committee members, help from other faculty and staff, and support from my family and
husband.
In the first place I would like to record my gratitude to Dr. Hao Li for his
supervision, advice, and guidance from the very early stage of this research as well as
giving me extraordinary experiences throughout the work. Above all and the most
needed, he provided me unflinching encouragement and support in various ways. His
truly scientific intuition has made him as a constant oasis of idea and passion in science,
which exceptionally inspired and enriched my growth as a student, a researcher and an
inspiring scientist. I am indebted to him more than he knows.
I gratefully acknowledge Dr. Kenneth Lambert for his advice and crucial
contribution, which made him a backbone of this research and so to this dissertation. His
involvement with his originality has triggered and nourished my intellectual maturity in
orthopedics field that I will benefit from, for a long time to come.
I would also like to thank all the professors that have helped to shape my
understanding of the world, especially: D r. Qingsong Yu with his advice and
instrumentation, as well as other material characterizations; Dr. James Lee’s support on
cell culture work conducted in his lab; Dr. Stephen Lombardo with his expertise on
material sciences and ceramic processing; Dr. Andy Winholtz with his help on material
characterization and analysis; Dr. Fu-hung Hsieh for allowing me to use his TA-HD
universal testing machine for mechanical property analysis; Dr. Shubhra Gangopadhyay
for allowing me to use her FTIR and XRD devices, Dr. Meng Chen for his great

iii
suggestions on pl asma related work; I would also like to thank my PhD committee
members for taking time to evaluate my doctoral degree. In addition, I would like to
thank the wonderful staff in Mechanical and Aerospace Engineering Department,
Melanie Carraher, Pat Frees, Marilyn Nevels, and Cynthia Irsik for their outstanding
assistance and help with everything I have asked over the years.
Many thanks to my colleagues in our research group: Dr. Andrew Ritts, Dr.
Liang Chen, Joe McCrate, John Jones, Da Yan, Qing Hong, Richard Lebens, Huibin
Chang, Adam Blumhagen, Chad Wickman for their insightful discussions and help on
many projects.
I would also like to thank the students and staff in other departments who helped
me on my projects: Harold Huff with mechanical testing, Joseph Mathai for assisting
with XRD and FTIR, Lou Ross for help with SEM analysis, Randy Tindall and Cheryl
Jensen for help with TEM operations.
Finally, I would like to thank my husband Andy for his unconditional love and
support and great patience at all times. My parents and in-laws have given me their
unequivocal support throughout, as always, for which my mere expression of thanks
likewise does not suffice. I am also grateful about my soon-to-be-born baby for his
peaceful dwelling during the final phase of finishing this dissertation.
Wen Wang Ritts
University of Missouri
April 2012

TABLE OF CONTENTS
ACKNOWLEDGEMENTS ................................................................................................ ii
LIST OF FIGURES ........................................................................................................... iv
LIST OF TABLES ............................................................................................................ vii
ABSTRACT ..................................................................................................................... viii
Chapter 1 Introduction .........................................................................................................1
1. Research Objective ........................................................................................................1
2. Structure and Function of Human Bone ........................................................................3
3. Biomaterials for Orthopedics .........................................................................................7
3.1. Metals Used in Orthopedics ....................................................................................7
3.1.1. Stainless Steel ..............................................................................................8
3.1.2. Titanium and its Alloy .................................................................................8
3.1.3. Cobalt-Chrome Alloy...................................................................................9
3.2. Polymer Used in Orthopedics ...............................................................................10
3.3. Ceramics Used in Orthopedics .............................................................................12
3.3.1. Bioglass® ...................................................................................................12
3.3.2. A-W Glass Ceramic ...................................................................................13
3.3.3. Calcium Phosphate.....................................................................................14
4. The State-of-the-Art Development of Calcium Phosphate Cements ...........................16
5. Reference .....................................................................................................................19

Chapter 2 Influence of Cement Liquid Concentration on Setting Time, Injectability and
Mechanical Properties of Apatite Cement .........................................................................28
1. Introduction ..................................................................................................................28
2. Materials and Methods .................................................................................................30
2.1. Materials ...............................................................................................................30
2.2. Sample Preparation for Mechanical Testing .........................................................31
2.3. Setting Time ..........................................................................................................33
2.4. Injectability ...........................................................................................................33
2.5. Scanning Electron Microscopy .............................................................................34
2.6. X-ray Diffraction and Conversion Rate ...............................................................34
2.7. Compressive Strength and Flexural Strength Measurement ...............................35
3. Result and Discussion ..................................................................................................36
3.1. Setting Time ..........................................................................................................36
3.2. Injectability ...........................................................................................................42
3.3. Conversion Rate ...................................................................................................43
3.4. Mechanical Strength and Microstructures ...........................................................45
4. Conclusion ...................................................................................................................50
5. Reference .....................................................................................................................50
Chapter 3 Setting Time, Injectability and Mechanical Properties of Polymer-Apatite
Cement as Bone Substitute ...............................................................................................54
1. Introduction ..................................................................................................................54
2. Materials and Methods .................................................................................................57
2.1. Materials ...............................................................................................................57

2.2. Sample Preparation for Mechanical Testing .........................................................58
2.3. Setting Time ..........................................................................................................60
2.4. Injectability ...........................................................................................................60
2.5. Scanning Electron Microscopy .............................................................................60
2.6. X-ray Diffraction and Conversion Rate ...............................................................61
2.7. Compressive Strength and Flexural Strength Measurement ...............................61
3. Result and Discussion ..................................................................................................62
3.1. Setting Time ..........................................................................................................62
3.2. Injectability ...........................................................................................................65
3.3. Conversion Rate ...................................................................................................66
3.4. Mechanical Strength and Microstructures ...........................................................69
4. Conclusion ...................................................................................................................72
5. Reference .....................................................................................................................73
Chapter 4 Synthesis of High Aspect Ratio Hydroxyapatite Nanofiber and Design of
Experiments Study ............................................................................................................78
1. Introduction ..................................................................................................................78
2. Materials and Methods .................................................................................................80
2.1. Synthesis of HA Nanofibers .................................................................................80
2.2. EDTA Titration for Ca2+ Ion Concentration .......................................................81
2.3. Synthesis of HA Nanofibers with High Precursor Content ..................................81
2.4. Scanning Electron Microscopy .............................................................................82
2.5. pH value track .......................................................................................................82
2.6. X-Ray Diffraction and Crystal Size ......................................................................83

2.7. Biological Evaluation of HA Nanofiber ...............................................................83
2.8. Design of Experiment Study on Quality of High Reactant Concentration HA
Nanofiber Synthesis ..............................................................................................84
3. Result and Discussion ..................................................................................................87
3.1. Synthesis of HA Nanofiber and Its Characterization ...........................................87
3.2. Synthesis and Characterization of HA Nanofiber with High Precursor Content .92
3.3. DOE Trials and Results ........................................................................................98
4. Conclusion .................................................................................................................102
5. Reference ...................................................................................................................103
Chapter 5 Apatite Cement-Surface Modified Hydroxyapatite Nanocomposite and
Characterization ...............................................................................................................107
1. Introduction ................................................................................................................107
2. Materials and Methods ...............................................................................................110
2.1. Materials .............................................................................................................110
2.2. Fabrication of Hydroxyapatite Nanofiber ...........................................................110
2.3. Surface Modified Hydroxyapatite Nanofiber .....................................................111
2.4. Surface Functional Groups’ Titration ......................................................113
2.5. Fourier Transform Infrared Spectroscopy (FT-IR) ............................................113
2.6. Sample Preparation for Mechanical Testing .......................................................113
2.7. Compressive Strength and Flexural Strength Measurement ..............................115
2.8. Scanning Electron Microscopy ...........................................................................116
3. Result and Discussion ................................................................................................116
3.1. Hydroxyapatite-CPC nanocomposite and characterization ................................116

3.2. Surface Modified Hydroxyapatite-CPC nanocomposite and characterization ...118
4. Conclusion .................................................................................................................128
5. Reference ...................................................................................................................129
Chapter 6 Summary and Future Work .............................................................................132
VITA ................................................................................................................................136

iv
LIST OF FIGURES
Figure Page
1.1 A schematic representation of the hierarchical structure of cortical bone .......................... 3
1.2 Schematic of cortical and trabecular bone .......................................................................... 5
1.3 Scanning election micrograph of fracture surface of CPC showing nanosized HA crystals
.......................................................................................................................................... 15
2.1 PTFE mold for flexural strength testing (a) and compressive strength testing (b) ........... 32
2.2 Microstructure of DCPA (a) and TTCP (b) particles under SEM ................................... 36
2.3 Setting time of cement with different percentage of Na2HPO4 and NaH2PO4 in a plot.
The simulated power law functions are shown with equations and probability .............. 39
2.4 XRD pattern of Group 1 sample before setting and 1 h, 6 h, 24 h and 72 h after setting 44
2.5 SEM images show microstructures of Group 1 (a), (b), Group 2 (c), (d) and Group 3 (e),
(f). ..................................................................................................................................... 46
2.6 Microstructure of CPC in Group 1. Scale bar is 2 μm ...................................................... 47
2.7 Compressive and flexural strength of Group 1, Group 2 and Group 3. Error bars are
standard deviation (n=5) ................................................................................................... 49
3.1 Chemical structure of PEI (a) and PAH (b) ...................................................................... 58
3.2 Microstructure of DCPA (a) and TTCP (b) particles under SEM .................................... 62
3.3 XRD pattern of Group 1 sample before setting and 1 h, 6 h, 24 h and 72 h after setting 67
3.4 Extent of setting reaction of CPC-PEI and CPC with non-polymeric liquid .................... 68
3.5 Microstructure of Group 1 (a), Group 2 (b), Group 3 (c), Group 4 (d), Group 5 (e) and
Group 6 (f) under SEM. Scale bar is 20μm ..................................................................... 70

v
3.6 Compressive strength and flexural strength of apatite cement with polymeric liquid. Error
bars are standard deviation (n=5) ...................................................................................... 71
4.1 Solubility diagram of calcium phosphate compounds ...................................................... 86
4.2 XRD patterns of as-obtained products through various reaction times. “#” represents
DCPA peaks (PDF#01-071-1760) and “+” represents HA peaks (PDF#01-071-5049). .. 88
4.3 pH value in the solution and Ca/P ratio in as-obtained products through various reaction
times of HA nanofiber synthesis ...................................................................................... 89
4.4 Microstructures of HA nanofiber synthesized at 1 h (a), 3 h (b), 5 h(c), 24 h (d) and 72 h
(e) as-obtained products. Scale bars are 100 μm............................................................... 91
4.5 XRD patterns of as-obtained products through various reaction times of high reactant
concentration HA nanofiber synthesis. “#” represents DCPA peaks (PDF#01-071-1760)
and “+” represents HA peaks (PDF#01-071-5049) ......................................................... 92
4.6 pH values in the solution and Ca/P ratio in as-obtained products through various reaction
times of high reactant concentration HA nanofiber synthesis .......................................... 93
4.7 Microstructures of 1 h (a), 3 h (b), 5 h(c), 24 h (d), 48 h (e) and 72 h (f) as-obtained
products of high reactant concentration HA nanofiber synthesis .................................... 95
4.8 Biocompatibility evaluation of Ti-6Al-4V (Ti), HA nanoparticles (HA NP), and HA
nanofibers (HA NF) on the bottom of wells using MC3T3-E1 cell lines by MTT assay.
Values are mean ± STD, n=5, *p<0.05 compared to Ti and **p<0.05 compared to HA
NP. The absorbance values are proportional to the number of viable cells ...................... 96
4.9 The leverage plot of Na/Ca, urea and gelatin with respect of fiber length (a), (c), (e) and
percentage of impurity (b), (d), (f) ................................................................................... 99
4.10 The leverage plot of Na/Ca, urea, gelatin and urea*gelatin with respect of fiber length (a),
(c), (e), (g) and percentage of impurity (b), (d), (f), (h) ................................................. 101

vi
5.1 The chemical structure of 12-aminododecanoic acid (a), dodecanoic acid (b) and
dodecanedioic acid (c) .................................................................................................... 111
5.2 SEM images of DCPA (a) and TTCP (b) particles ......................................................... 116
5.3 The untreated HA nanofiber before (a) and after dispersion in ethanol (b). Scale bar is
100 μm ........................................................................................................................... 117
5.4 The schematic of surface modification with 12-aminododecanoic acid, dodecanoic acid
and dodecanedioic acid ................................................................................................... 118
5.5 Surface modified HA nanofiber, Amine-HA (a), Methyl-HA (b) and Carboxyl-HA (c).
Scale bard is 100 μm ....................................................................................................... 119
5.6 The possible changes of surface functional groups after the surface modification ........ 119
5.7 Number of surface functional group per gram of HA nanofiber after the surface
modification with 12-aminododecanoic acid, dodecanoic acid and dodecanedioic acid 120
5.8 FTIR of untreated HA nanofiber (a) and Amine-HA nanofiber (b), Methyl-HA nanofiber
(c) and Carboxyl-HA nanofiber (d) ............................................................................... 123
5.9 HA aggregate inside CPC with 2 wt% (a), 5 wt% (b) and 10 wt% (c) HA nanofiber. Scale
bar is 100 μm ................................................................................................................. 124
5.10 Compressive strength and 3-point flexural strength of CPC reinforced with 0 wt%, 2 wt%,
5 wt% and 10 wt% untreated HA nanofiber ................................................................... 125
5.11 Microstructure of CPC with pull-out HA nanofibers of 0 wt% (a), 2 wt% (b), 5 wt% (c)
and 10 wt% (d). Scale bar is 10 μm ............................................................................... 126
5.12 Compressive strength and 3-point flexural strength of CPC reinforced with 0 wt%, 2 wt%,
5 wt% and 10 wt% untreated HA nanofiber, and 2 wt% and 5 wt% surface modified HA
nanofiber. Error bars are standard deviation (n=5). ........................................................ 127

vii
LIST OF TABLES
Table Page
1.1 Mechanical properties of cortical and trabecular bone ....................................................... 5
1.2 Mechanical properties of metals used for implants ............................................................ 8
2.1 The composition of different cement liquid and their P-L ratio in the system ................. 32
2.2 Setting time of CPC with different cement liquid............................................................. 38
2.3 Injectability of CPC with different cement liquid ............................................................. 42
2.4 Extent of CPC setting reaction as a function of time ........................................................ 44
3.1 The composition of different cement liquid and their P-L ratio in the system ................. 59
3.2 Setting time of CPC with different cement liquid............................................................. 64
3.3 Injectability of CPC with different cement liquid ............................................................. 65
3.4 Extent of CPC setting reaction as a function of time ........................................................ 66
4.1 The level of design for each reactant of high reactant concentration HA nanofiber
synthesis ............................................................................................................................ 84
4.2 The detailed design according to DOE ............................................................................. 85
4.3 The fiber length and impurity percentage of HA products from different DOE trials ...... 98
5.1 The name of modified HA nanofiber corresponds to the chemical ................................ 112
5.2 The powder to liquid ratio in the HA-CPC nanocomposites and control samples (both
before and after surface modification of HA nanofibers) ............................................... 114
5.3 Diameter of HA nanofibers/bundles with respect to total surface area per gram of HA
nanofibers ....................................................................................................................... 121
5.4 Number of surface functional groups (amino and carboxyl) per nm2 of HA bundle surface,
assuming the bundle size is 2000 nm in diameter, 50000 nm in length ......................... 122

viii
THE STUDY AND DEVELOPMENT OF CALCIUM PHOSPHATE
BONE CEMENT AND HYDROXYAPATITE NANOFIBERS
Wen Wang Ritts
Dr. Hao Li, Dissertation Advisor
ABSTRACT
Among various synthetic bone graft substitutes, calcium phosphate cements (CPCs),
typically made by mixing a powder and a liquid, are one of the primary choices for
orthopedic surgeries. They can be manufactured in large quantity and are chemically
similar to human hard tissues. However, depending on the specific formulas, CPCs may
render poor properties, such as setting time, injectability and mechanical properties,
which significantly limit their clinical applications. In order to have better understanding
of the influence of the raw materials of the cements, including both powder and liquid,
on the properties of the of calcium phosphate cements and to eventually develop a way
to better control and improve cement properties, we have 1) developed a liquid recipe
primarily containing sodium hydrogen phosphate (Na2HPO4) and sodium dihydrogen
phosphate (NaH2PO4), which can regulate the setting time, injectability and mechanical
strength of tetracalcium phosphate (TTCP) - dicalcium phosphate (DCPA) cements, 2)
applied various polymer additives, including chitosan lactate (chitosan), poly
(ethyleneimine) (PEI) and poly (allylamine hydrochloride) (PAH) to tailor the setting
time, injectability and mechanical properties of polymer-apatite cement as a bone
substitute, and 3) synthesized high aspect-ratio hydroxyapatite (HA) nanofibers, applied
such HA nanofibers as additives to the cements, and also investigated the properties of

ix
the cement composites containing nanofibers. The chemical composition, microstructure,
and mechanical properties of the raw materials and resulting calcium phosphate cements
and composites have been characterized by X-ray Diffraction (XRD), scanning electron
microscope (SEM), electron energy dispersive spectrometer (EDS), and Instron universal
mechanical testing machine. O ur results suggested that: 1) higher concentration of
Na2HPO4 and NaH2PO4 in the cement liquid led to shorter setting time, lower
injectability and lower mechanical strength of TTCP-DCPA cement; 2) chitosan can
improve injectability of apatite cement significantly, and PEI, and PAH can greatly
improve mechanical properties, and higher concentration of PEI and PAH cement liquid
rendered shorter setting time, but the setting time of all three types of polymeric CPC was
shown to exceed the optimal limits; 3) very unique evolution of reaction product was
demonstrated during synthesis of HA nanofibers with high precursor content, and
dissolution-evolution-precipitation mechanism for HA nanofibers crystal growth was
discussed. 4) HA nanofibers were successfully included in the CPC to make a working
paste with acceptable injectibility and setting time by significantly increasing the amount
of liquid (lowering the powder to liquid ratio), but the reinforcing effects of HA
nanofibers have not been observed. The results of our experimental work and analysis
indicated that there are multiple ways to tailor the cement properties and further
investigation is needed to make calcium cements with different properties that may meet
each of the variety of orthopedic applications.

1
Chapter 1 Introduction
1. Research Objective
Calcium phosphate cements (CPCs) contain similar minerals as human bone and are
used in orthopedic surgery as bone fillers. The objective of this dissertation is to develop
an apatite CPC matrix with appropriate setting time, injectability, and mechanical
strength. Different cement liquids, both non-polymeric and polymeric, were applied to
the matrix. Ultra-long hydroxyapatite (HA) nanofibers were synthesized and reactions
conducted in a biomimetic process under two different reactant concentrations, with low
precursor content and high precursor content. In addition, another apatite CPC matrix
was developed that was reinforced by super-strong and ultra-long HA nanofibers. The
concept behind this matrix was based on fundamental understanding of nanocomposites
which occur in nature, such as bone and tooth, utilizing innovative design using advanced

2
technologies. The rationales for using ultra-long nanofibers are: 1) developing ceramic
nanofibers having mechanical strength with values in nanoscale, i.e. several Giga Pascal
for HA nanofibers with diameter of 100 nm ; and 2) the load transfer is roughly
proportional to the nanofiber length up to a maximum value. The main body of research
was carried out in the following sequence:
1) First a l iterature search was conducted on synthesizing apatite cement, i.e.
tetracalcium phosphate (TTCP, Ca4(PO4)2O) and dicalcium phosphate
anhydrous (DCPA, CaHPO4) based matrix. Next, well-accepted chemicals for
cement liquid were found and systematic studies were developed on the
influence of cement liquid concentration on the setting time, injectability and
mechanical strength as well as microstructures of apatite cement.
2) Based on the previously developed apatite cement matrix, other polymer
cement liquids were explored. Next, the influence of various polymers and
their concentrations on the setting time, injectability and mechanical strength
as well as microstructures of apatite cement were investigated.
3) Based on researching the literature, synthesis of ultra-long HA nanofibers in
biomimetic formation was carried out. The mechanism of fiber growth was
studied by pH changes, as well as calcium-to-phosphorous ratio changes
during the reaction. To enhance the yield per batch from an economic
perspective, a high reactant concentration reaction was investigated and the
mechanism of fiber growth was studied as before. A Design of Experiment
study was conducted to optimize precursor concentration of high reactant
concentration on the results of fiber length and percentage of impurity.

3
4) Based on the rationales mentioned earlier, apatite CPC matrix were developed
which were reinforced with ultra-long HA nanofibers and mechanical
properties through microstructures of the nanocomposite were studied.
Various surface modification approaches were designed to modify the surface
functional groups of ultra-long HA nanofibers. These were then incorporated
into the apatite CPC matrix to study the influence of surface modification on
the mechanical strength. Associated studies are included to characterize
changes to surface functional groups.
This chapter provides ba ckground information about biomaterials for orthopedic
applications and bone cements.
2. Structure and Function of Human Bone
Figure 1.1 A schematic representation of the hierarchical structure of cortical bone.

4
The bone of all vertebrae is natural composite material, in which one of the
components is inorganic compound, named hydroxyapatite. It takes up to 65% of total
bone mass, and the remaining is formed by organic tissue and water. Most of the organic
matter in bone (or even in skin, tendon and dentin) is called Type 1 collagen.
Figure 1.1 shows the hierarchical structure of the human cortical bone. At molecular
level, bone can be considered to a hierarchical composite consisting of a fibrous protein,
collagen, stiffened by an extremely dense filling and surrounding of calcium phosphate
crystals [1-4]. The type 1 collagen comprises two identical and a third distinct
polypeptides with the same length. These chains wrap round each other to form rigid left-
handed triple helical structures stabilized by hydrogen bonds. The helices then become
the new blocks for the tropocollagen molecules, which line up and bond with molecules
in neighboring lines, to form microfibrils. Microfibrils aggregate to form fibrils through
cross-linking (stable trivalent bonds) in an organized order. They subsequently aggregate
into collagen fibers, which are impregnated and surrounded by bone mineral, such as
calcium phosphate. These bone minerals have very high specific surface area, with the
size of only 10 atomic layers thick in one dimension. Most of calcium phosphate in the
bone mineral is hydroxyapatite, precisely, carbonated hydroxyapatite (dahllite), which
has 4~6% of carbonate replacing the phosphate groups. Depending upon how it is
involved with the bone mineral, there are three stages of bone: woven bone, parallel-
fibered bone and lamellar bone.
5
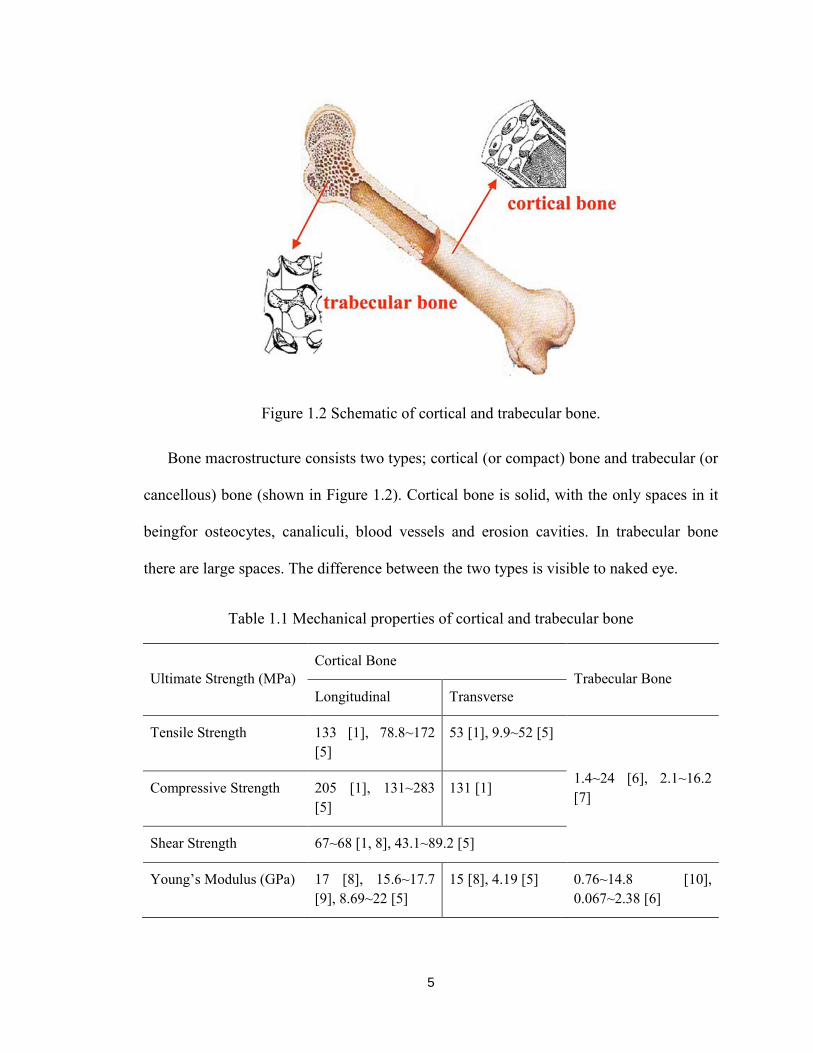
Figure 1.2 Schematic of cortical and trabecular bone.
Bone macrostructure consists two types; cortical (or compact) bone and trabecular (or
cancellous) bone (shown in Figure 1.2). Cortical bone is solid, with the only spaces in it
beingfor osteocytes, canaliculi, blood vessels and erosion cavities. In trabecular bone
there are large spaces. The difference between the two types is visible to naked eye.
Table 1.1 Mechanical properties of cortical and trabecular bone
Ultimate Strength (MPa) Cortical Bone
Trabecular Bone Longitudinal Transverse
Tensile Strength 133 [1], 78.8~172 [5]
53 [1], 9.9~52 [5]
1.4~24 [6], 2.1~16.2 [7] Compressive Strength 205 [1], 131~283
[5] 131 [1]
Shear Strength 67~68 [1, 8], 43.1~89.2 [5]
Young’s Modulus (GPa) 17 [8], 15.6~17.7 [9], 8.69~22 [5]
15 [8], 4.19 [5] 0.76~14.8 [10], 0.067~2.38 [6]

6
Human bones serve the body in various ways. First, they provide the framework
which supports the body and maintains its shape. Without the ribs, costal cartilages and
intercostal muscles the internal organ and heart would collapse. Second, bone protects
many vital organs substantially, such as skull protecting brain and eyes, vertebrae
protecting spinal cord. Bone matrix can store calcium and is involved in calcium
metabolism, and bone marrow can store iron and ferritin and is involved with iron
metabolism. Bone is also permeated by and lined by various kinds of specialized cells,
such as bone-lining cells, osteoblasts, osteocytes and osteoclasts [1]. Bone-lining cells
cover all surfaces of bones, including the blood channels, forming a thin continuous sheet
that controls the movement of ions between the body and the bone. Osteoblasts derive
from bone-lining cells and are responsible for the formation of bone. Osteocytes derive
from osteoblasts and are imprisoned in the hard bone tissue and connect with neighboring
osteocytes. Osteoclasts are bone-destroying cells and are large multinucleated cells
derived from precursor cells circulating in the blood.
Because of the distinct difference in structure, the mechanical property is quite
different between these two types. Table 1.1 shows a summary of mechanical properties
of cortical and trabecular bone from literatures. Depending upon the testing method
(buckling, ultrasound, three or four point bending, and uniaxial tension), the anatomic
location of the bone (tibia, femur, iliac crest, and vertebrae), and species (bovine or
cadaver), the mechanical properties of the cortical and trabecular bones can vary in a
wide range. For instance, compressive modulus of trabecular bone varies 100-fold from
one location to another within a single proximal tibia [11]. Substantial mechanical
properties loss occurs with aging as well. According to some studies [12-14], ultimate

7
stress reduces by 7% and 11% per decade, from age 20~100, for human proximal femur
and vertebrae, respectively. Due to the complication of bone mechanical properties, we
won’t go in depth in this section, but list some values obtained from the literature as a
reference to the subsequent chapters.
3. Biomaterials for Orthopedics
With the longevity of life increasing, more and more population is experiencing aging
related and osteoporosis issues. According to Bergen’s report in 2007 [15], nearly 6
million Americans suffer from bone fracture each year. Currently a large variety of
orthopedic biomaterials is used in different medical procedures. It ranges from natural
tissue (bone allografts, autogenous bone, and demineralized bone matrix) to synthetic
materials (metal, ceramic, polymers and composites). The application of each material
varies, including joint replacement, reconstruction or replacement of skeletal or ligament
defects, augmentation of fracture repair, filling of defects and spinal fusion. While the
source of natural tissues is always limited, researchers have been making efforts at
fabricating synthetic biomaterials that are non-toxic and have good biocompatibility. A
summary of different biomaterials available is conducted in this study.
3.1. Metals Used in Orthopedics
Metals were among the first materials that were applied in orthopedic field. Presently
most orthopedic implants are made of stainless steel, titanium or its alloys, and cobalt-
chrome alloy. Occasionally tantalum and Nitinol metals were also applied.

8
Table 1.2 Mechanical properties of metals used for implants [17].
Ultimate Tensile Strength (MPa)
Yield Strength (MPa)
Elongation (%)
Density (g/cc)
AISI 316L Stainless Steel 490~1350 190~690 12~40 7.95
Unalloyed Titanium-Grade 1
240~300 170~200 24 4.51
Ti-6Al-4V 825~860 760~795 8~10 4.43
Nitinol 551~1450 200~350 10 6.45
Cast Cobalt-Chromium 655~1310 450~930 8 8.29
Wrought Cobalt-Chromium 860~900 310~830 30
3.1.1. Stainless Steel
Stainless steel is essentially an iron-chromium-carbon alloy. Typically nickel is added
to increase the size of austenite structure and stabilize it. With low carbon content the
steel is virtually pure austenite at room temperature. Compared to other steel phases
austenite steel has excellent ductility and corrosion resistance and is not ferromagnetic.
Most implants made from steel are manufactured of AISI 316 o r its low carbon form
AISI 316L according to ASTM F138 and F139. These stainless steels contain a very
small percentage of carbon and molybdenum, which improves its corrosion resistance in
body fluids. However, in a study of retrieved 316L stainless steel implants [16], it was
reported that all implants exhibited corrosion to some extent and the severity of corrosion
is non-related to amount of time in situ. The mechanical properties of AISI 316L are
listed in Table 1.2.
3.1.2. Titanium and its Alloy

9
Titanium is less dense material than stainless steel and provides excellent corrosion
resistance, high strength-to-weight ratio and ductility, which suits well for biomedical
implants. Titanium is the relatively abundant element, which makes it readily available.
However, it is extremely difficult to form and machine titanium bulk into desired shapes.
Titanium alloys were developed rapidly in the past four decades, including Ti-6Al-4V
(alloy of titanium, aluminum and vanadium, most commonly used titanium alloy), Ti-
4Al-4Mo-2Sn-o.5Si (alloy of titanium, aluminum, molybdenum, tin and silicon,
developed later) and Ti-Ni (alloy of titanium and nickel, also called Nitinol or shape-
memory alloy). These materials are categorized as bioinert materials, which means they
remain the original state when implanted. However, human bodies are able to recognize
them as foreign, and try to isolate them and encase them in fibrous tissues. Typically
titanium alloys are tolerated well by human bodies, and they do not induce adverse or
allergic reactions observed occasionally in stainless steel implants. Often the surface of
titanium or its alloy is chemically modified or coated with hydroxyapatite (HA, which is
the inorganic composition of human hard tissues) through plasma spraying. Niticol has
many orthopedic applications due to its ability of returning to its original shape upon
heating after deformation. The mechanical properties of some titanium alloys are listed in
Table 1.2.
3.1.3. Cobalt-Chrome Alloy
Cobalt is a brittle, hard metal, white in appearance resembling nickel. Cobalt alloys
have better corrosion resistance and abrasive wear resistance than steels. It was reported
in 1924 that a cobalt-chrome alloy called Stellite had best biocompatibility of all metals

10
in dogs [18]. Vitallium, a derivative of Stellite, continues in use today for orthopedic and
dental implants. Two types of most common cobalt-chrome allongs are the castable alloy
and wrought alloy, and their mechanical properties are listed in Table 1.2.
Overall, metal implants have premium mechanical properties and are relatively
biocompatible. However, elastic modulus mismatch and stress shielding for nearby
tissues [19-21], and foreign reactions of the body inhibited bone ingrowth and limited
their applications. Therefore, other biomaterials with mechanical properties similar to
human bones were needed and developed.
3.2. Polymer Used in Orthopedics
Over the past several decades polymers have been developed into various biomedical
applications. Polymethyl-methacrylate (PMMA) is the first acrylic bone cement that was
used as anchorage of prostheses to the surrounding bone in cemented arthroplasties.
Charnley [22] introduced the self-polymerizing PMMA bone cement into contemporary
orthopedics. This cement consists of a powder phase (pre-polymerized PMMA, an
initiator to catalyze the polymerization and a radiopacifier), and a liquid phase of MMA
monomer, an accelerator and a stabilizer. When two phases are mixed, the paste starts
polymerizing, hardens and eventually sets. Upon polymerization PMMA provides
excellent primary fixation of broken bones, however, there are a few drawbacks that
concern the orthopedic surgeons. Along with exothermic polymerization process it may
cause nerve necrosis of surrounding tissues. In addition, the residual monomers could get
into blood stream producing embolism. Moreover, the shrinkage during setting results in
gaps and loss of contact between the bone and PMMA. Also PMMA is not biodegradable

11
and does not promote biological interactions with body tissues. Other non-degradable
polymers, such as polyethylene (PE) and medical grade silicone were also used in
different applications. The common issue is a layer of fibrous tissue will grow and
eventually encapsulate the implants.
To address these issues, biodegradable polymers, such as polyglycolic acid (PGA),
polylactic acid (PLA), polydioxanon (PDS), poly(ε-caprolactone) (PCL), and
polyhydroxybutyrate (PHB) were extensively studied and developed later.
Biodegradability is mainly originated by hydrolysis of the polymer chain backbone and to
a less extent by enzymatic activity [23, 24]. Compared with metal ones, these polymeric
implants could reduce the stress shielding effect, prevent the subsequent surgeries that
could be necessary to remove the metal implant, and enhance the tissue-implant
interaction. Among all available biodegradable polymers, PLA, PGA and PDS have been
widely used for bone fixation devices, and their mechanical properties can be improved
by developing self-reinforced composite. Generally these polymers can be melt spun (or
through other methods) to produce strong, stiff and crystalline fibers. Self-reinforced
polymer is constituted by reinforcing the polymer matrix with fibers of same material.
Self-reinforced PLA, PGA and PDS pins can be used to fix distal chevron osteotomy [25];
PLA staples are used in foot surgery [26, 27]. The application of bioabsorbable implants
on spinal surgery has recently been studied [28] in comparison of previous applications.
Bioabsorbable ramp teyp interbody spacers for posterior lumbar interbody fusion process,
and use of PLA screws for anterior cervical decompression and fusion procedures have
been successfully conducted [29, 30]. However, one study showed that degradation of
PLLA led to rapid decrease of the mechanical properties and resulted in 90~95%

12
decrease within 3 months [31]. This implies the degradation process and speed needs to
be carefully studied and controlled.
3.3. Ceramics Used in Orthopedics
Bioceramics is referred as ceramic materials for skeletal repair and reconstruction
[32]. In general, ceramic materials are brittle, hard and have high wear resistance.
According to the type of ceramic used and their interaction with the body tissue,
bioceramics can be classified as bioinert or bioactive. Bioinert ceramic, such as carbon–
carbon fiber ceramic composite, are lightweight, strong and low modulus materials and
would seem to offer great potential for load-bearing orthopaedic devices [33, 34].
However, delamination can occur under cyclic loading and releases carbon fibers into the
contacting tissues, which could cause chronic inflammatory response. Thus, bioinert
ceramics are not widely used and not likely to be a promising direction for development
in this century. Bioactive ceramics can be resorbable or non-resorbable. Typically
bioceramics includes polycrystalline materials, glasses, glass ceramics and ceramic-filled
bioactive composites. They can be fabricated in porous of dense form in bulk, granules,
or in the form of cement or coatings. Bioactive ceramic can form direct bonding with
hard or soft tissue of a living organism, or even actively participate in the metabolic
processes of an organism with the predictable results [35]. In this section, we will be
focusing on the distinct and promising bioactive ceramics.
3.3.1. Bioglass®
Bioglass® was developed around 1970’s in the need of development of materials that
would help with repair of tissues by forming direct bond with them, instead of fibrous

13
tissues occurred with metallic and polymeric implants. Hench et al. [36-38] reported
Na2O-CaO-P2O5-SiO2 system with B2O3 and CaF2 additions formed strong and
adherent bond with bone. In vitro tests showed that the surface of Bioglass® reacted in a
complicated process and formed a biologically active hydroxyl-carbonate apatite layer.
This layer is chemically and structurally similar to the inorganic phase of the bone and
hence provides a direct bond by bridging tissues with implant [39, 40]. Many other types
of glasses have since been reported in literature [41-43], which are often based on t he
same system as Hench’s original recipe.
3.3.2. A-W Glass Ceramic
In 1982 K okubo et al. [44] reported the fabrication and behavior of a new glass-
ceramic material called apatite-wollastonite (A-W) glass-ceramic. Since then A-W glass
ceramic has been widely studied as bone substitute. It is synthesized through heat
treatment. A dense and homogeneous composite is obtained with composition of
crystalline apatite (Ca10(PO4)6OF2) and β-wollastonite (CaO·SiO2) in a MgO-CaO-SiO2
glassy matrix. Flexural strength, fracture toughness and Young’s modulus of A-W glass-
ceramic were the highest among all the bioactive glasses and glass-ceramics in 1993 [45].
The mechanical strength showed a s low decrease even under load-bearing condition in
the organism [46], which enables it to be used in applications such as vertebral prostheses
and iliac crest replacement [47]. In addition to the research on A-W glass-ceramic,
Kobuko is also known to develop a rapid method of ranking bioactivity of biomaterials
using simulated body fluid. This solution was developed in similar composition to human
blood plasma. Upon immersion in this simulated body fluid a carbonated HA layer is

14
formed on the surface of bioactive material and the rate is correlated to the activity of
sample in vivo [48].
3.3.3. Calcium Phosphate
As discussed earlier, the inorganic mineral component of human hard tissue is
calcium phosphate (CaP). CaP ceramics and cements can be categorized as bioactive
materials due to their chemical similarities to the CaP in human body. There are a group
of CaPs and the properties are directly correlated to the proportion of calcium to
phosphorus ion (Ca/P) in the structure. Depending on t he synthesis process, each
compound can show different physical and chemical properties [49].
One of the earliest and most widely used CaP is synthetic HA. HA has a chemical
formula of Ca10(PO4)6(OH)2, and has a higher stability in aqueous media than other
CaPs within range of 4.5~8. This could be why it is the most common form of CaP in
human body. This enables synthetic HA to exhibit good bioactive properties, but it also
limits its solubility rate after implantation, which result in HA implant remain integrated
in regenerated bone tissue.
Tricalcium phosphate (TCP, Ca3(PO4)2) is another commonly used CaP. Unlike HA,
TCP dissolves in physiological media in a much faster rate, which after implanted can
lead to complete reabsorption and replacement by bone tissue [50, 51]. TCP has four
crystal forms, in which the most common one are the α and β forms. The stoichiometry of
HA is highly strict and slight imbalances in the ratio of Ca/P could lead to appearance of
TCP (Ca/P<1.67) or CaO (Ca/P>1.67) depending on the condition.

15
Typically after implantation it may be preferential for CaP to assist bone repair and
then slowly be dissolved and replaced by new tissue. This requires the match in
resorption rate of implant with new bone tissue regeneration. When CaP dissolves faster
than the generation of new tissue, it could leave voids and defects on site where new bone
tissue hasn’t gained enough strength. As mentioned before TCP has a much higher
solubility than HA around pH of body fluid. To achieve a moderate rate of dissolution of
implant, mixtures of TCP and HA are often manufactured, known as biphasic calcium
phosphate (BCP).
Figure 1.3 Scanning election micrograph of fracture surface of CPC showing nanosized
HA crystals [59].
Besides sintered CaPs, low temperature CaP formulations have been extensively
developed by a number of groups [52-55] and are known as CaP cement (CPC).
Generally CPC consists of a powder (or powder mixture) and an aqueous liquid, which
result in a paste upon mixing and set into a hardened body at room temperature.
Depending upon the formulation, the final product could be either apatite or brushite [56].
Compared with sintered CaP, CPC has some outstanding features that are irreplaceable.
Similar to traditional PMMA, CPC fit into bone defect intimately as paste and hardens on

16
site, however, its setting reaction is not exothermic hence doesn’t cause necrosis of
neigboring tissues. Sintered CaP requires machining to fit precisely in the defect and has
limited resorbability, and its implants may induce little new bone regeneration [57]. On
the contrast, final product of CPC is more bioresorbable, due to the formation of CPC
occurs in an aqueous environment at room or body temperature, and hence is more
similar to biological apatite [58-60]. As shown in Figure 1.3, nano-HA crystals
precipitated from CPC exhibits sizes similar to HA found in natural hard tissue such as
bone and tooth. However, CPC usually exhibits low mechanical strength in comparison
to sintered CaP even with similar porosity [61, 62].
CPC possesses some unique properties and is very promising as new-developed
orthopedic bioceramic. The first animal study of CPC was performed in 1991 [63], by
subcutaneously implanting CPC disks in cats. Some CPC has excellent rheology
properties and can be injected into the bone defect. Studies have shown injectable CPC
are highly biocompatible and osteoconductive, and can stimulate tissue regeneration [64,
65]. CPC has been used for treatment of distal radius fracture [66-68]. Other successful
attempts has been made using CPC with various formulations for calcaneal fractures [69],
hip fractures [70, 71], augmentation of osteoporotic vertebral bodies [72], tibial plateau
fractures [73-75], restoration of pedicle screw fixation [76], and fixation of titanium
implants [77].
4. The State-of-the-Art Development of Calcium Phosphate Cements
Calcium phosphate cements (CPCs) are obtained by mixing a solid and a liquid
component. The solid component is made of a combination of calcium phosphate (CP)
with or without other calcium compounds, and the liquid one is an aqueous solution.

17
Upon mixing, the calcium phosphate(s) dissolves and precipitates into a less soluble paste
containing crystals of one or more CP. The cements set by the entanglement of the CP
crystals and micropores are formed by the intercrystalline space [78, 79]. The first CPCs
were reported by Brown and Chow [80] in 1987. Since then, a lot of studies have been
devoted to CPCs and many different formulations have been proposed to make CPCs [81,
82]. Most CPCs can be classified into two categories according to the end products of the
precipitation: (i) apatite CPCs, with the end products of precipitated hydroxyapatite (PHA)
and (ii) brushite CPCs, with dicalcium phosphate dihydrate (DCPD) formed during the
setting reaction.
The mechanical properties of the CPC are mainly determined by the ratio between the
amounts of solid (S) and liquid (L) phases used to make the cements [79, 83]. Higher S/L
ratio results in improved mechanical properties due to decreased porosity. Smaller
amount of mixing liquid also shortens the setting time, which is usually required to be
5~15 minutes [84]. Driessens [85] measured the compressive strength of several
commercial apatite cements, which varies from 4~83 MPa. The compressive strengths
were correlated to the setting time and porosity. High compressive strength, comparable
to that of human bones, can be achieved for both apatite and brushite CPCs. For latter, a
compressive strength up t o 60 MPa was reported [79]. However, the tensile and shear
strength of the cements are very low compared to the natural bone. Apatite and brushite
CPCs can reach tensile strengths of 16 MPa [86] and 10 MPa [87], respectively.
The calcium phosphate cements have excellent biocompatibility under normal
conditions [79]. Apatite CPCs have higher biodegradability than sintered HA ceramics,
due to lower crystallinity. Porosity has been identified as an important factor to influence

18
the resorbability of the apatite CPCs. Del Real et al. [88] evaluated the in-vivo resorption
rate of apatite cements with different pore sizes. Biocement DTM (Merck Biomaterial,
Darmstadt, Germany) was used in the study. When setting in normal condition, the pores
in the cement is smaller than 1μm. Macropores larger than 100μm can be created using
gas bubble method during the setting process. At 10 weeks after implantation, 81% of
the phosphate cement with macropores was resorbed accompanied by the formation of
new bone. In contrast, no sign of cement resorption was observed in the cement with pore
size smaller than 1μm. Compared to other commercial apatite cements, α-BSMTM (ETEX
Corporation, Cambridge, MA) has better degradability with a high porosity. It
demonstrated nearly complete resorption within 1 to 2 months following implantation [89,
90]. Brushite CPCs degrade faster than apatite CPCs because of higher solubility [79, 91,
92]. This rapid degradation rate may cause the formation of immature bones. Beta-
tricalcium calcium phosphate (β-TCP) granules are often added to the cement paste to
overcome this problem [91, 93]. The granules act as bone anchor and encourage the
formation of mature bones.
CPCs provide the following advantages: 1) non-exothermic setting at room or body
temperature, 2) negligible shrinkage, 3) the ability to be modeled and shaped to fill bony
cavities with complex geometries, 4) compressive strength comparable to trabecular
bones, 5) osteoconductivity, and 6) varied extent of degradability. A wide range of
clinical studies have been conducted about the use of the CPCs to fill voids in
metaphyseal bone and improve the holding strength around metal devices in osteoporotic
bone [94]. Clinical results have shown that the CPCs have contributed to faster and more
aggressive rehabilitation when used in the repair of fractures of the distal radius, tibial

19
plateau, calcaneus, and hip. Research efforts have been continuously directed to improve
the injectability of the CPCs so that the cements can be accurately delivered through
applicators or needles to the narrow defects and sites of limited accessibility, such as the
application for vertebroplasty and kyphoplasty [94-97]. Other important applications of
CPCs include the use as drug delivery vehicles [79, 83, 98, 99] and scaffolds for bone
tissue engineering [100].
5. Reference
1. Currey, J.D., Bones: Structure and Mechanics. 2002: Princeton University Press.
2. Katz, J.L., Hard tissue as a composite material--I. Bounds on the elastic behavior.
Journal of Biomechanics, 1971. 4(5): p. 455-473.
3. Katz, E., et al., The structure of mineralized collagen fibrils. Connective Tissue
Research, 1989. 21(1-4): p. 149-158.
4. Lawrence Katz, J., et al., The effects of remodeling on the elastic properties of
bone. Calcified tissue international, 1984. 36: p. 31-36.
5. Reilly, D.T. and A.H. Burstein, Review article. The mechanical properties of
cortical bone. The Journal of bone and joint surgery. American volume, 1974.
56(5): p. 1001.
6. Keaveny, T.M., et al., Biomechanics of trabecular bone. Annual Review of
Biomedical Engineering, 2001. 3(1): p. 307-333.
7. Ciarelli, M., et al., Evaluation of orthogonal mechanical properties and density of
human trabecular bone from the major metaphyseal regions with materials
testing and computed tomography. Journal of Orthopaedic Research, 1991. 9(5): p.
674-682.
8. CARTER, D.R. and D.A.N.M. SPENGLER, Mechanical properties and
composition of cortical bone. Clinical Orthopaedics and Related Research, 1978.
135: p. 192.

20
9. Burstein, A.H., D.T. Reilly, and M. Martens, Aging of bone tissue: Mechanical
properties. The Journal of bone and joint surgery. American volume, 1976. 58(1):
p. 82.
10. Keaveny, T.M. and W.C. Hayes, A 20-year perspective on the mechanical
properties of trabecular bone. Journal of Biomechanical engineering, 1993. 115:
p. 534.
11. Goldstein, S.A., et al., The mechanical properties of human tibial trabecular bone
as a function of metaphyseal location. Journal of Biomechanics, 1983. 16(12): p.
965-969.
12. RICHARD W, M. and M. JOSEPH A, Age-Related Changes in the Compressive
Strength of Cancellous Bone. The Relative Importance of Changes in Density and
Trabecular Architecture*. The Journal of Bone and Joint Surgery (American),
1997. 79(3): p. 421-7.
13. Mosekilde, L., Normal vertebral body size and compressive strength: relations to
age and to vertebral and iliac trabecular bone compressive strength. Bone, 1986.
7(3): p. 207-212.
14. Mosekilde, L. and C. Danielsen, Biomechanical competence of vertebral
trabecular bone in relation to ash density and age in normal individuals. Bone,
1987. 8(2): p. 79-85.
15. Bergen, G., et al., Injury in the United States: 2007 chartbook. Hyattsville, MD:
National Center for Health Statistics, 2008.
16. Leventhal, G.S., Titanium, a metal for surgery. J Bone Joint Surg Am, 1951. 33: p.
473-474.
17. Katz, J.L., et al. Orthopedic biomaterials. 2004: Marcel Dekker, Inc.
18. Zierold, A.A., Reaction of bone to various metals. Archives of Surgery, 1924.
9(2): p. 365.
19. Farris, R.A., Implant insertion device. 1998, Google Patents.
20. McKay, W.F., Reinforced porous spinal implants. 1997, Google Patents.
21. Hench, L., The challenge of orthopaedic materials. Current orthopaedics, 2000.
14(1): p. 7-15.

21
22. Charnley, J., Anchorage of the femoral head prosthesis to the shaft of the femur.
Journal of Bone and Joint Surgery-British Volume, 1960. 42(1): p. 28.
23. Vert, M., et al., Bioresorbability and biocompatibility of aliphatic polyesters.
Journal of Materials Science: Materials in Medicine, 1992. 3(6): p. 432-446.
24. Li, S. and S. McCarthy, Further investigations on the hydrolytic degradation of
poly (-lactide). Biomaterials, 1999. 20(1): p. 35-44.
25. Barca, F. and R. Busa, Resorbable poly-L-lactic acid mini-staples for the fixation
of Akin osteotomies. The Journal of foot and ankle surgery, 1997. 36(2): p. 106-
111.
26. Burns, A.E., Absorbable fixation techniques in forefoot surgery. Techniques in
Orthopaedics, 1998. 13(2): p. 201.
27. Burns, A.E. and J. Varin, Poly-L-lactic acid rod fixation results in foot surgery.
The Journal of foot and ankle surgery, 1998. 37(1): p. 37-41.
28. Vaccaro, A.R., et al., The use of bioabsorbable implants in the spine* 1. The
Spine Journal, 2003. 3(3): p. 227-237.
29. Subach, B., et al. Postrior lumbar interbody fusion (PLIF) using an impacted,
bioabsorbable device. 1999.
30. van Dijk, M., et al., The effect of cage stiffness on the rate of lumbar interbody
fusion: an in vivo model using poly (l-lactic acid) and titanium cages. Spine, 2002.
27(7): p. 682.
31. Leenslag, J.W., et al., Resorbable materials of poly(l-lactide): VII. In vivo and in
vitro degradation. Biomaterials, 1987. 8(4): p. 311-314.
32. Best, S., et al., Bioceramics: past, present and for the future. Journal of the
European Ceramic Society, 2008. 28(7): p. 1319-1327.
33. Mooney, D. and R. Langer, The Biomedical Engineering Handbook. 1995, CRC
press. p. 532-609.
34. Thompson, I. and L.L. Hench, Medical applications of composites. Encyclopedia
of Composites. Elsevier Press, Amsterdam, 2000. 727.
35. Dubok, V.A., Bioceramics--Yesterday, Today, Tomorrow. powder metallurgy and
metal ceramics, 2000. 39(7): p. 381-394.

22
36. Hench, L.L., et al., Bonding mechanisms at the interface of ceramic prosthetic
materials. Journal of biomedical materials research, 1971. 5(6): p. 117-141.
37. Greenlee Jr, T., et al., Glass ceramic bone implants. A light microscopic study.
Journal of biomedical materials research, 1972. 6(3): p. 235-244.
38. Hench, L.L. and H. Paschall, Direct chemical bond of bioactive glass ceramic
materials to bone and muscle. Journal of biomedical materials research, 1973.
7(3): p. 25-42.
39. Pantano Jr, C., A. Clark Jr, and L. Hench, Multilayer corrosion films on bioglass
surfaces. Journal of the American Ceramic Society, 1974. 57(9): p. 412-413.
40. Ogino, M. and L.L. Hench, Formation of calcium phosphate films on silicate
glasses. Journal of Non-Crystalline Solids, 1980. 38: p. 673-678.
41. da Rocha Barros, V.M., et al., In vivo bone tissue response to a canasite glass-
ceramic. Biomaterials, 2002. 23(14): p. 2895-2900.
42. Heikkilä, J.T., et al., Bioactive glass versus hydroxylapatite in reconstruction of
osteochondral defects in the rabbit. Acta Orthopaedica, 1993. 64(6): p. 678-682.
43. Alani, A., et al., Ion release characteristics, precipitate formation and sealing
ability of a phosphate glass-polycaprolactone-based composite for use as a root
canal obturation material. Dental Materials, 2009. 25(3): p. 400-410.
44. Kokubo, T., et al., Apatite- and wollastonite-containing glass-ceramics for
prosthetic application. Bull. Inst. Chem. Res., Kyoto Univ., 1982. 60(Copyright
(C) 2011 American Chemical Society (ACS). All Rights Reserved.): p. 260-8.
45. Kokubo, T., A/W glass-ceramic: processing and properties. An Introduction to
bioceramics, 1993: p. 75–88.
46. Kokubo, T., Bioactive glass ceramics: properties and applications. Biomaterials,
1991. 12(2): p. 155-163.
47. Kokubo, T., et al., Ca, P rich layer formed on high strength bioactive glass
ceramic A W. Journal of biomedical materials research, 1990. 24(3): p. 331-343.
48. Kokubo, T., et al., Ca, P-rich layer formed on high-strength bioactive glass-
ceramic A-W. Journal of biomedical materials research, 1990. 24(3): p. 331-343.
49. El-Ghannam, A., Bone reconstruction: from bioceramics to tissue engineering.
Expert review of medical devices, 2005. 2(1): p. 87-101.

23
50. Takahashi, Y., M. Yamamoto, and Y. Tabata, Osteogenic differentiation of
mesenchymal stem cells in biodegradable sponges composed of gelatin and
[beta]-tricalcium phosphate. Biomaterials, 2005. 26(17): p. 3587-3596.
51. Ginebra, M., T. Traykova, and J. Planell, Calcium phosphate cements as bone
drug delivery systems: a review. Journal of controlled release, 2006. 113(2): p.
102-110.
52. Driessens, F.C.M., et al., Amorphous calcium phosphate cements and their
transformation into calcium deficient hydroxyapatite. Bioceram., Proc. Int. Symp.
Ceram. Med., 1996. 9(Copyright (C) 2011 American Chemical Society (ACS).
All Rights Reserved.): p. 231-234.
53. Brown, W.E.C., L.C., A new calcium phosphate setting cement. Journal of Dental
Research, 1983. 62: p. 672.
54. Monma, H., Chemistry of calcium phosphate cements. Seitai Zairyo, 1997.
15(Copyright (C) 2011 American Chemical Society (ACS). All Rights Reserved.):
p. 24-30.
55. Driessens, F., et al., Effective formulations for the preparation of calcium
phosphate bone cements. Journal of Materials Science: Materials in Medicine,
1994. 5(3): p. 164-170.
56. Bohner, M., Calcium orthophosphates in medicine: from ceramics to calcium
phosphate cements: Calcium-orthophosphate in der medizin: von der keramik zu
calciumphosphat-zementen: Des orthophosphates de calcium en médecine: des
céramiques aux ciments phosphocalciques: Los ortofosfatos de calcio en
medicina: de la cerámica a los cementos de fosfato de calcio. Injury, 2000. 31: p.
D37-D47.
57. Garrett, S., Periodontal regeneration around natural teeth. Annals of
periodontology, 1996. 1(1): p. 621-666.
58. Costantino, P.D., et al., Experimental hydroxyapatite cement cranioplasty. Plastic
and reconstructive surgery, 1992. 90(2): p. 174&hyhen; 185.
59. Xu, H.H.K., et al., Development of a nonrigid, durable calcium phosphate cement
for use in periodontal bone repair. The Journal of the American Dental
Association, 2006. 137(8): p. 1131.

24
60. Frankenburg, E., et al., Biomechanical and histological evaluation of a calcium
phosphate cement. Journal of bone and joint surgery. American volume, 1998.
80(8): p. 1112-1124.
61. Le Huec, J., et al., Influence of porosity on the mechanical resistance of
hydroxyapatite ceramics under compressive stress. Biomaterials, 1995. 16(2): p.
113-118.
62. Barralet, J., et al., Effect of porosity reduction by compaction on compressive
strength and microstructure of calcium phosphate cement. Journal of biomedical
materials research, 2002. 63(1): p. 1-9.
63. Costantino, P., et al., Hydroxyapatite cement. I. Basic chemistry and histologic
properties. Archives of otolaryngology--head & neck surgery, 1991. 117(4): p.
379.
64. Schmitz, J.P., J.O. Hollinger, and S.B. Milam, Reconstruction of bone using
calcium phosphate bone cements: a critical review. Journal of oral and
maxillofacial surgery, 1999. 57(9): p. 1122-1126.
65. Claes, L., I. Hoellen, and A. Ignatius, Resorbable bone cements]. Der Orthopäde,
1997. 26(5): p. 459.
66. Constantz, B.R., et al., Skeletal repair by in situ formation of the mineral phase of
bone. Science, 1995. 267(5205): p. 1796.
67. Liverneaux, P., Osteoporotic distal radius curettage–filling with an injectable
calcium phosphate cement. A cadaveric study. European Journal of Orthopaedic
Surgery & Traumatology, 2005. 15(1): p. 1-6.
68. Liverneaux, P., et al., Cement pinning of osteoporotic distal radius fractures with
an injectable calcium phosphate bone substitute: report of 6 cases. European
Journal of Orthopaedic Surgery & Traumatology, 2006. 16(1): p. 10-16.
69. Thordarson, D.B., et al., Superior compressive strength of a calcaneal fracture
construct augmented with remodelable cancellous bone cement. Journal of bone
and joint surgery. American volume, 1999. 81(2): p. 239-246.
70. Stankewich, C.J., et al., Augmentation of femoral neck fracture fixation with an
injectable calcium-phosphate bone mineral cement. Journal of Orthopaedic
Research, 1996. 14(5): p. 786-793.
25
71. Goodman, S.B., et al., Norian SRS Cement Augmentation in Hip Fracture
Treatment: Laboratory and Initial Clinical Results. Clinical Orthopaedics and
Related Research, 1998. 348: p. 42-50.
72. Bai, B., et al., The use of an injectable, biodegradable calcium phosphate bone
substitute for the prophylactic augmentation of osteoporotic vertebrae and the
management of vertebral compression fractures. Spine, 1999. 24(15): p. 1521.
73. Horstmann, W., C. Verheyen, and R. Leemans, An injectable calcium phosphate
cement as a bone-graft substitute in the treatment of displaced lateral tibial
plateau fractures. Injury, 2003. 34(2): p. 141-144.
74. Simpson, D. and J. Keating, Outcome of tibial plateau fractures managed with
calcium phosphate cement. Injury, 2004. 35(9): p. 913-918.
75. Welch, R.D., H. Zhang, and D.G. Bronson, Experimental tibial plateau fractures
augmented with calcium phosphate cement or autologous bone graft. The Journal
of bone and joint surgery. American volume, 2003. 85(2): p. 222.
76. Moore, D.C., et al., Restoration of pedicle screw fixation with an in situ setting
calcium phosphate cement. Spine, 1997. 22(15): p. 1696.
77. Ooms, E., et al., Trabecular bone response to injectable calcium phosphate (Ca P)
cement. Journal of biomedical materials research, 2002. 61(1): p. 9-18.
78. Nakahara, H., et al., Periosteal bone formation elicited by partially purified bone
morphogenetic protein.[see comment]. Clinical Orthopaedics & Related Research,
1989(239): p. 299-305.
79. Bohner, M., Calcium orthophosphates in medicine: from ceramics to calcium
phosphate cements. Injury, 2000. 31 Suppl 4: p. 37-47.
80. Brown, W.E. and L.C. Chow, in Cements Research Progress 1986, P.W. Brown,
Editor. 1987, American Ceramics Society: Ohio. p. 352.
81. Chow, L.C. and S. Takagi, in Cements Research Progress 1994, L.J. Struble,
Editor. 1996, American Ceramics Society: Ohio. p. 189.
82. Chow, L.C., M. Markovic, and S. Takagi, in Cements Research Progress, L.J.
Struble, Editor. 1998, American Ceramics Society: Ohio. p. 215.

26
83. Bohner, M., U. Gbureck, and J.E. Barralet, Technological issues for the
development of more efficient calcium phosphate bone cements: a critical
assessment. Biomaterials, 2005. 26(33): p. 6423-9.
84. Kenny, S.M. and M. Buggy, Bone cements and fillers: A review. Journal of
Materials Science-Materials in Medicine, 2003. 14(11): p. 923-938.
85. Driessens, F., Concepts and Clinical Applications of Ionic Cements. 1999:
Arcachon, France.
86. Ishikawa, K., et al., Behavior of a calcium phosphate cement in simulated blood
plasma in vitro. Dental Materials, 1994. 10(1): p. 26-32.
87. Andrianjatovo, H., F. Jose, and J. LeMaitre, Effect of beta-TCP granularity on
setting time and strength of calcium phosphate hydraulic cements. Journal of
Materials Science-Materials in Medicine, 1996. 7(1): p. 34-39.
88. del Real, R.P., et al., In vivo bone response to porous calcium phosphate cement.
Journal of Biomedical Materials Research Part A, 2003. 65A(1): p. 30-36.
89. Knaack, D., et al., Resorbable calcium phosphate bone substitute. Journal of
Biomedical Materials Research, 1998. 43(4): p. 399-409.
90. Wenisch, S., et al., In vivo mechanisms of hydroxyapatite ceramic degradation by
osteoclasts: Fine structural microscopy. Journal of Biomedical Materials
Research Part A, 2003. 67A(3): p. 713-718.
91. Oberle, A., et al., Untersuchungen uber den klinischen Einsatz von Brushite- und
Hydroxylapatit-Zement beim Schaf. Schweizer Archiv fur Tierheilkunde, 2005.
147(11): p. 482-90.
92. Apelt, D., et al., In vivo behavior of three different injectable hydraulic calcium
phosphate cements. Biomaterials, 2004. 25(7-8): p. 1439-51.
93. Theiss, F., et al., Biocompatibility and resorption of a brushite calcium phosphate
cement. Biomaterials, 2005. 26(21): p. 4383-94.
94. Sune, L. and T.W. Bauer, Clinical Orthopaedics & Related Research, 2002. 395:
p. 23.
95. Constantz, B.R., et al., Skeletal Repair by in-Situ Formation of the Mineral Phase
of Bone. Science, 1995. 267(5205): p. 1796-1799.
96. Manoj, K. and H.K. Varma, Bulletin of Materials Science, 2003. 26: p. 415.

27
97. Gladius, L., Journal of Biomedical Materials Research, 2006. 76B: p. 456.
98. Lee, D.D., et al., alpha-BSM: a biomimetic bone substitute and drug delivery
vehicle. Clinical Orthopaedics & Related Research, 1999(367 Suppl): p. S396-405.
99. Paul, W. and C.P. Sharma, Ceramic drug delivery: a perspective. Journal of
Biomaterials Applications, 2003. 17(4): p. 253-64.
100. Xu, H.H.K., et al., Fast setting calcium phosphate scaffolds with tailored
macropore formation rates for bone regeneration. Journal of Biomedical
Materials Research Part A, 2004. 68(4): p. 725-734.

28
Chapter 2 Influence of Cement Liquid Concentration on Setting Time,
Injectability and Mechanical Strength of Calcium Phosphate Cement
1. Introduction
With about one million bone grafts performed each year in the United States to treat
osseous defects [1], the study of effective synthetic bone graft substitutes is a possible
solution to the concerns of regenerative medicine. Autologous bone graft and allografts
both have their restrictions, such as donor availability and risk of body rejection and
transferring disease. Calcium phosphate compounds are the primary choice as the
alternative to bone harvesting. They can be synthesized in large quantity and are
chemically similar to the mineral phase of human bone. In the last twenty years, a large
number of publications on calcium phosphate materials, especially on calcium phosphate
cements (CPCs) [2-4], have appeared in the literature, reflecting an increase of the
interests in the research aimed to develop better materials for a broader clinical use.

29
The first self-setting CPC was reported in 1986 [2, 5]. CPCs typically consist of a
powder mixture and an aqueous liquid, which are mixed to form a CPC paste [2, 6-11].
The paste is placed into a bone void as a substitute for the damaged part of the bone [3, 4,
12-15]. One type of CPC consists of tetracalcium phosphate (TTCP, Ca4(PO4)2O) and
dicalcium phosphate anhydrous (DCPA, CaHPO4). Pure TTCP has a calcium to
phosphate ratio of 2.0, a nd is the only calcium phosphate that has a calcium to
phosphorous (Ca/P) ratio higher than that of hydroxyapatite (HA, Ca10(PO4)6(OH)2),
which is 1.67. D CPA has Ca/P ratio of 1. T herefore the mixture of TTCP and DCPA
leads to the same Ca/P ratio as HA.
The CPC paste intimately fits into the bone defects even for irregularly shaped
cavities. For minimally invasive surgeries, it is required to have injectable CPCs with
minimal filtration [16]. Typically instead of placing CPC paste in the defect by pressing
with surgeon’s hands, a specially made syringe with a cannula is used to minimize the
opening of the wound and accurately extrude the cement. The CPC paste reacts and sets
into hydroxyapatite in aqueous environment at body temperature, therefore it is more
compatible to biological apatites in human hard tissues than sintered hydroxyapatite [17,
18]. Consequently, CPC is bioactive, noncytotoxic, osteoconductive and bioresorbable
and it may be eventually replaced by new bone cells [3, 4, 12-14].
However, the low strength of CPC, especially tension and shear strength, has limited
its use to only non-load-bearing applications [13], and clinical usage has also been
significantly hindered by its brittleness [3]. One clinical study on the repair of periodontal
bone defects demonstrated that the brittle nature of CPC caused early exfoliation of the
scaling and root planing implant [19]. Another major shortcoming is that it ta kes a

30
relatively long time for the CPC paste to set. A long setting time can result in the
deformation of CPC when the paste comes in contact with physiological fluids, or if
bleeding occurs due to the difficulty in some cases to achieve complete hemostasis [8, 20,
21]. Although most CPCs have been claimed to be injectable, most surgeons complain
that CPC are poorly injectable for their purpose [22].
Sodium hydrogen phosphate and sodium dihydrogen phosphate supposedly could
accelerate the setting reaction and shorten the setting time [23, 24]. Sodium citrate will
help prevent the clumping the CPC particles [25] and thus minimize the filtration of
powder from liquid in the CPC paste, hence will improve injectability of CPC paste. The
objective of this study is to systematically investigate the influence of different cement
liquids on t he comprehensive properties of CPC and hope to provide valuable
information for future development of calcium phosphate cement with appropriate setting
time, injectability and mechanical properties. This study also evaluates the effects of
different liquids on microstructures of CPC. A phase transition from TTCP-DCPA to HA
was investigated at different time of reaction by X-ray diffraction.
2. Materials and Methods
2.1. Materials
Tetracalcium phosphate (TTCP) was synthesized by heating a mixture of dicalcium
phosphate anhydrous (DCPA, J. T. Baker, 1430) and calcium carbonate (CC, Aldrich,
310034) at 1500 ºC for 8 hours. DCPA and CC were mixed with molar ratio of 1:0.9,
instead of the ideal ratio of 1:1 in order to avoid the presence of CaO in the product,
which can be formed if calcium is in excess due to the inhomogeneities in the sintering
process. Presence of CaO has been shown to cause an increase of pH in cement slurry

31
and retard the setting reaction [26, 27]. 1 mol DCPA and 0.9 mol CC were added into a
1000mL Pyrex beaker with 500mL deionized (DI) water. The mixture slurry was then
placed on electric magnetic stirrer and stirred for 2 hours. After the mixing was finished
water was eliminated from the mixture by vacuum filter. The powder was dried in oven at
100 ºC overnight before it was transferred to Small Benchtop Muffle Furnace (Sentro
Tech Corporation, Model #ST-1600C-445). The powder mixture was heated at 1500 ºC
for 6 hours and then quenched at room temperature immediately. The sintered cake was
broken and grinded with mortar and pestle until it passed 355µm sieves. It was then
loaded into the planetary milling machine (Retsch, PM100) and milled for 2 hours.
Results from previous studies showed that medium-particle-size of TTCP and fine-
particle-size of DCPA yield the strongest samples [28-30]. DCPA was a commercially
obtained reagent-grade chemical. It was ground in distilled water for 48 hour s in
planetary mill at 200 rpm to a median particle size of 1µm. The ground DCPA was then
collected by vacuum filter and dried in oven at 100 ºC overnight to remove any moisture.
The dried DCPA was mixed with TTCP at molar ratio of 1:1 in the media of pure ethanol
or acetone. The slurry was mixed with magnetic stirrer for 2 hours to make sure it was
thoroughly dispersed.
2.2. Sample Preparation for Mechanical Testing
Solid phase of the specimens consisted of 27wt% DCPA and 73wt% TTCP (molar
ratio 1:1). Liquid phase was aqueous solution including NaH2PO4, Na2HPO4, sodium
citrate (Na3C6H5O7) with different applied levels as seen in Table 2.1.

32
Table 2.1. The composition of different cement liquid and their powder to liquid ratio in
the system
Figure 2.1 PTFE mold for flexural strength testing (a) and compressive strength testing (b)
In order to form a workable paste, solid phase was mixed with liquid phase in specific
powder to liquid ratio (refer to Table 2.1) with glass mortar and pestle for 30 seconds to
Group Liquid Composition Powder to Liquid ratio (g/mL)
1 2 wt% Na2HPO4+2 wt% NaH2PO4+0.5M/L
Na3C6H5O7 3.3
2 4 wt% Na2HPO4+4 wt% NaH2PO4+0.5M/L
Na3C6H5O7 3.3
3 6 wt% Na2HPO4+6 wt% NaH2PO4+0.5M/L
Na3C6H5O7 3.3

33
ensure the full contact between two phases. Previous results showed adding too much
liquid while increasing the injectability, would decrease the mechanical strength
significantly [30]. In order to reduce the probability of having poor mechanical strength,
the least amount of liquid that could form a workable paste was applied to each group
here. The putty was put into molds shown in Figure 2.1, in the shapes of cylinders with 6
mm in diameter and 12 mm in height for compressive samples, and of bars of 25×3×4
mm for 3-point bending samples. The specimens were kept in molds and placed at 100%
humidity environment in the incubator at 37 ºC until the mechanical testing. One hour
before testing samples were demolded and their surface was slightly sanded.
2.3. Setting Time
Setting time of CPC was measured according to ASTM C266-07 [31] (n=3). Gillmore
apparatus was used to determine the rate and speed of the setting reaction. It includes
two needles with different weight cells. Gillmore initial needle weighs 113.4 g with
needle size of 2.12 mm, while Gillmore final needle weighs 453.5 g with needle size of
1.06 mm. A specimen is molded from the paste and is tested for time of setting by means
of the Gillmore initial and final needles. The initial setting time is the time required for
the test specimen to bear the initial Gillmore needle without noticeable indentation, while
the time required for the test specimen to bear the final Gillmore needle without
noticeable indentation is the final setting time. Aliquots of liquid were gradually added in
3 g of CPC powder until a bright and fluid homogeneous paste was obtained, as described
in ASTM C427 standard, with different powder to liquid ratios according to table 1 (n=3).
Glass mortar and pestle are used to apply 30 seconds of mixing motion, and the paste was
then transferred into a clean plastic dish for setting time measurement.

34
2.4. Injectability
Aliquots of liquid were added in 5 g of CPC powder until a bright and fluid
homogeneous paste was obtained, as described in ASTM C427 standard, with powder to
liquid ratios 3.3. Glass mortar and pestle were used to apply 30 seconds of mixing motion,
and the paste was transferred into a 3 mL disposable syringe (Luer-Loc TipTM, BD
Medical, Franklin Lakes, NJ). The paste was extruded through the tip by hand. Since
different powder to liquid ratio was applied, the original volume of the paste is different.
Injectability was determined by the fraction of paste that could be extruded by measuring
the weight of the metallic cartridge before and after extrusion.
2.5. Scanning Electron Microscopy
Microstructures of the samples were observed by Scanning Electron Microscope
(Quanta 600 F EG ESEM, FEI, Hillsboro, Oregon, USA). Several bulk samples were
collected following the bending strength test and coated with platinum and partially
covered by silver paint before it was observed to remove charging during imaging.
Microphotographs were obtained under high vacuum under 10 KV accelerating voltage.
2.6. X-ray Diffraction and Conversion Rate
Samples incubated at 100% humidity and 37 ºC for 1h, 6h, 24h, 72h w ere crushed
immediately after by mortar and pestle into small pieces and washed with ethanol 3 times
to prevent further setting reaction from proceeding. It was then dried in room temperature
for 12 hour s before powder x-ray diffraction (XRD) to determine the extent of the
starting materials and the identities of the products as a function of time. X-ray
diffraction patterns were recorded on a Rigaku powder diffractometer with graphite-
monochromatized copper Kα1 radiation (X = 0.154 nm) generated at 40 kV and 44 mA.

35
All data was collected in a continuous scan mode (1° 2θ/min) on a strip-chart recorder.
The peak intensities at 29.58º (2θ) for TTCP and 25.76º (2θ) for HA were recorded and
used to estimate the amounts of conversion rate of the components of the cements into
HA on the cements incubated were estimated. The conversion rate was calculated by the
following equation, modified from the report of Fukase et al. [30]
𝑅 (𝐶𝑜𝑛𝑣𝑒𝑟𝑠𝑖𝑜𝑛 𝑅𝑎𝑡𝑒) (%) = 1 2⁄ [�𝑃𝐻𝐴(𝑡) 𝑃𝐻𝐴(∞)⁄ � + (1 − 𝑃𝑇𝑇𝐶𝑃(𝑡) 𝑃𝑇𝑇𝐶𝑃(0))]⁄
where 𝑃𝑇𝑇𝐶𝑃(0) is the peak intensity of TTCP at 29.58º in the original powder
components, and 𝑃𝐻𝐴(∞) is the peak intensity of HA at 29.58º in the cements at setting
time of 72 hour s’ incubation. 𝑃𝑇𝑇𝐶𝑃(𝑡) and 𝑃𝐻𝐴(𝑡) are the intensities of peaks of TTCP
and HA in the cement harvested at time t after incubation.
2.7. Compressive Strength and Bending Strength Measurement
The compressive strength (CS) and bending strength (BS) were measured on an
Instron universal testing machine (Model 3367, Instron, MA). The universal testing
machine recorded the applied load (Newton, N) as a function of time (second, s). CS was
calculated as maximum uniaxial stress according to the equation below (sample size n=5):
𝜎𝑐 = 𝐹 𝐴⁄
where F is the load (N) at the fracture point, A is the cross section size (mm2), σc is the
CS (MPa). The experiment carries out with uniaxial compressive stress reached when the
material fails completely. The load cell applied was 250Kg and the crosshead speed was
1 mm per minute.
BS was calculated according to 3-point bending setup (n=5):
𝜎𝑓 =3𝐹𝐿
2𝑏𝑑2

36
where F is the load (N) at the fracture point, L is the length of the supporting span (mm)
which is 40 mm, b i s width of the sample (mm), and d i s the thickness of the sample
(mm), σf is the BS (MPa). The load cell applied was 50 kg and the crosshead speed was
0.5 mm per minute.
3. Result and Discussion
3.1. Setting Time
Figure 2.2. Microstructure of DCPA (a) and TTCP (b) particles under SEM.
Figure 2.2 (a) and (b) show the microstructure of DCPA and TTCP particles,
respectively. ImageJ was used to measure the particle size. DCPA particles were around
1 µm in mean diameter, and TTCP particles were around 17 μm.
The setting process of CPC is complex, involving the dissolution of the starting
materials DCPA and TTCP, the precipitation of HA from the solution, and the
neutralization of acidic and basic by-products [32, 33]. Typically DCPA is one of the
least soluble calcium phosphate (CaP) compounds at acidic to neutral pH, while TTCP is
the most soluble CaP compound around this pH [34]. In order to compensate this
difference, we manipulated the dissolving rate of DCPA and TTCP by grinding them into

37
different sized powders. A particle size ~1µm DCPA is desirable and can dissolve in a
rate that is closer to dissolving rate of TTCP with particle size ~17 µm , which will result
in the efficient precipitation of HA. In addition, with the addition of phosphate ions as a
result of applying sodium phosphate solution, it also compensates the deficiency of low
dissolving rate of DCPA, and could speed up the precipitation of HA. Two reactions
occurred in this CPC system as below, of which the first is the main reaction and the
second took place incorporating slight amount of Na+ into HA crystal.
2𝐶𝑎4(𝑃𝑂4)2𝑂 (𝑇𝑇𝐶𝑃) + 2𝐶𝑎𝐻𝑃𝑂4(𝐷𝐶𝑃𝐴) = 𝐶𝑎10(𝑃𝑂4)6(𝑂𝐻)2(𝐻𝐴)
4𝐶𝑎4(𝑃𝑂4)2𝑂 + 2𝐶𝑎𝐻𝑃𝑂4 + 𝐻𝑃𝑂42− + 𝐻2𝑃𝑂4− + 2𝑁𝑎+
𝑐𝑒𝑚𝑒𝑛𝑡 𝑙𝑖𝑞𝑢𝑖𝑑����������� 2𝐶𝑎9𝑁𝑎(𝑃𝑂4)6(𝑂𝐻)2 + 𝐻+
It is difficult to characterize the relationship between the hydration reaction and
microstructure development, even many methods, such as the amount assay of hydration
product formation [33], AC impedance spectroscopy [35], etc., were developed to
explore the setting process. Most of the methods have their limitations, which involves
either indirect detection or intermittent examinations. Gillmore Needle Apparatus can
define setting time as when the surface of the material is strong enough to withstand a
certain pressure. Although this does not directly characterize setting behavior [36], it is
linked to the extent of setting reaction assuming same paced progress throughout the
whole system (from surface to inside). In this dissertation Gillmore Needle was used to
show the progress of setting process.

38
Table 2.2. Setting time of CPC with different cement liquid.
Group Liquid Composition Initial Setting Time(min)
Final Setting Time(min)
1 2 wt% Na2HPO4+2 wt% NaH2PO4 +0.5M/L
Na3C6H5O7 31.0±2.2 72.0±3.7
2 4 wt% Na2HPO4+4 wt% NaH2PO4 +0.5M/L
Na3C6H5O7 6.3±0.6 14.0±1.0
3 6 wt% Na2HPO4+6 wt% NaH2PO4 +0.5M/L
Na3C6H5O7 2.3±0.6 5.3±0.6
The setting time via Gillmore Needles Apparatus of each group of CPC was reported
in Table 2.2. According to Driessens et al. [37] the clinical meaning of Gillmore needles
is that the cement should be implanted before initial setting time and that the wound can
be closed after final setting time: The paste should not be deformed between initial
setting time and final setting time because in that stage of the setting process any
deformation could induce cracks. Ginbra et al. claimed that the desired time for initial
setting time is about 4~8 min and the desired time for final setting time is about 10~15
min [38], however, dependent upon the type of surgery, initial and final setting time can
be as long as 30 min and 60 min, respectively.

39
Figure 2.3. Setting time of cement with different percentage of Na2HPO4 and NaH2PO4
in a plot. The simulated power law functions are shown with equations and probability.
In Group 1, CPC reacted with the aqueous solution with 2 w t% Na2HPO4, 2 w t%
NaH2PO4 and 0.5M/L Na3C6H5O7. With the concentration of Na2HPO4 and NaH2PO4
increasing in Group 2 a nd 3 to 4% and 6% of each, respectively, the setting reaction
accelerates significantly; hence the setting time decreases dramatically. The solubility
product constant of TTCP is defined as below [39]:
𝐾𝑠𝑝 = [𝐶𝑎2+]4[𝑃𝑂43−]2[𝑂𝐻−]2
And it corresponds to the equilibrium constant of the following reaction:
𝐶𝑎4(𝑃𝑂4)2𝑂 + 𝐻2𝑂 = 4𝐶𝑎2+ + 2𝑃𝑂43− + 2𝑂𝐻−
Similarly, the solubility product constant of DCPA is expressed:

40
𝐾𝑠𝑝 = [𝐶𝑎2+][𝐻𝑃𝑂42−]
The setting time of calcium phosphate cement is related to the kinetics of HA
formation and the diffusion of the ions required for HA formation. Without extra ions in
the cement liquid, the setting reaction can slow and result in a prolonged setting time.
This is mainly due to rate limiting nature of the slow dissolution of the reactants, which
prevents the supersaturation of phosphate ion in the system [40]. Adding Na2HPO4 and
NaH2PO4 to the cement can increase the diffusion of phosphate ions as well as the
kinetic rate of the formation of HA thus decreasing the setting time as observed. The
concentration of phosphate ion in the cement liquid is essential for determining the rate of
the reaction. TTCP and DCPA both will provide ions through dissolution into the liquid
added to them. The concentration of the ions in solution is dictated by the solubility
product constants of TTCP and DCPA. The concentration of phosphate ions added in the
accelerator should be on the order of magnitude (or higher) than the concentration
provided by TTCP and DCPA dissolution in order to have a significant effect on t he
reaction kinetics. According to Ksp of TTCP and DCPA collected by Larry Chow [34],
PO43- provided by TTCP is 1.5e-5 mol/L In this study, 2% NaH2PO4 and 2% Na2HPO4
has 1.7e-3 mol/L H2PO4 and 1.4e-3 mol/L HPO4, respectively. As the concentration of
phosphate ion is largely increased by phosphate ion concentration in the cement liquid,
the rate of HA precipitation is accelerated drastically. Since the dissolution of reactants
can’t be observed directly, the reaction rate is essentially related to HA precipitation in
the following discussion.
Figure 2.3 shows initial setting time and final setting time with their corresponding
simulated power law function (allometric).

41
𝑌𝐼 = 155.26𝑋−2.32, 𝑅 = 0.99996
𝑌𝐹 = 372.40𝑋−2.37, 𝑅 = 0.99922
where YI is the initial setting time, YF is the final setting time, and X is the weight
concentration of NaH2PO4 or Na2HPO4 (equal value). R value close to 1 s hows the
simulated equation is very reliable. Setting time of TTCP-DCPA reaction can be assumed
to be the inverse relationship with the reaction rate as below:
𝑅𝑒𝑎𝑐𝑡𝑖𝑜𝑛 𝑅𝑎𝑡𝑒 ∝1
𝑆𝑒𝑡𝑡𝑖𝑛𝑔 𝑇𝑖𝑚𝑒
According to the simulated allometric power law functions, reaction rate can be directly
related to the weight concentration of NaH2PO4 or Na2HPO4:
𝑅𝑒𝑎𝑐𝑡𝑖𝑜𝑛 𝑅𝑎𝑡𝑒 𝑏𝑒𝑓𝑜𝑟𝑒 𝐼𝑛𝑖𝑡𝑖𝑎𝑙 𝑆𝑒𝑡𝑡𝑖𝑛𝑔 ∝ 𝑋2.32
𝑅𝑒𝑎𝑐𝑡𝑖𝑜𝑛 𝑅𝑎𝑡𝑒 𝑏𝑒𝑓𝑜𝑟𝑒 𝐹𝑖𝑛𝑎𝑙 𝑆𝑒𝑡𝑡𝑖𝑛𝑔 ∝ 𝑋2.37
With these simulated power law functions, it can be hypothesized that with powder to
liquid ratio 3.3, setting time can be controlled by the concentration of Na2HPO4 and
NaH2PO4. For instance, initial setting time and final setting time of CPC with 3 w t%
Na2HPO4, 3 wt% NaH2PO4 and 0.5M/L Na3C6H5O7 are 10.8 m in and 26.5 min,
respectively; initial setting time and final setting time of CPC with 5 wt% Na2HPO4, 5 wt%
NaH2PO4 and 0.5M/L Na3C6H5O7 are 3.6 and 8.2 min, respectively. Nonetheless, these
functions are purely statistical rather than empirical, thus only can be used to interpret the
concentration points within the range of the experiment, under the exact experiment
condition. Depending on the type of surgery, various setting time could be applicable in
orthopedic trials. Spine surgeries usually take longer operation time which typically
involve with complications, and could use Group 1 s ince longer setting gives surgeon
enough time to deal with treatment of the wound, etc. Anterior cruciate ligament (ACL)

42
reconstruction can be augmented easily with the fast setting Group 2 or 3, depending on
the types of accessories utilized in the surgery.
3.2. Injectability
Injectability is one crucial criterion of bone cement for minimally invasive orthopedic
treatment of bone diseases. In this section injectability of CPC in different groups was
measured with the same powder to liquid ratio as the setting time test. Usually
injectability is affected by several parameters: powder to liquid ratio, the type of additive,
shape and size of CPC powder, etc. Different groups of cement liquid affect injectability
in various mechanisms. Tom Trocsynski claimed water solution containing α–
hydroxyacid ions may reduce the agglomerate of calcium phosphate powder thus reduce
and porosity and increase the mechanical strength [25]. Sodium citrate solution contains
citrate anions, which absorbs preferentially on the surface of the CPC particles providing
Coulomb repulsion, which counterbalances the Van der Waals attraction between them,
and hence reduces the filtration of CPC from cement liquid and sliding friction from
particle-to-particle during injection [25].
Table 2.3. Injectability of CPC with different cement liquid.
Group Liquid Composition Injectability (%)
1 2 wt% Na2HPO4 + 2 wt% NaH2PO4 +0.5M/L Na3C6H5O7 100
2 4 wt% Na2HPO4 + 4 wt% NaH2PO4 +0.5M/L Na3C6H5O7 100
3 6 wt% Na2HPO4 + 6 wt% NaH2PO4 +0.5M/L Na3C6H5O7 65.2±29.4
Table 2.3 shows the injectability of Group 1, Group 2 and Group 3, respectively. Both
Group 1 a nd Group 2 ha s 100% injectability, meaning the cement paste is completely

43
injectable with no separation of liquid and solid, while Group 3 is only 65.2% injectable.
Marc Bohner et al. suggested that injectability study should not be presented without
setting time test [16], because the setting reaction solidifies the CPC paste and could
adversely affect the injectability at different setting extent. Table 2.2 has shown the
setting time of these three groups is very different, ranging from 5 min to over 60 min.
Since the injectability study was carried out about 1.5 min after the contact of CPC
powder and cement liquid in all three groups, Group 3 ha s already started the setting
reaction and some CPC paste has reached initial setting time before it was injected.
Therefore the injectability of Group 3 i s much lower than Group 2. The high standard
deviation of Group 3 injectability is attributed to partial hardening of CPC paste.
3.3. Conversion Rate of CPC
The XRD patterns of specimens in Group 2 obt ained at the various time intervals
show in Figure 2.4 that the only reaction product present was HA. The extent of reaction,
expressed in terms of R, as a function of time is given in the Table 2.4. As the reaction
time increased, R value increased as expected. During the first six hour after mixing, R
varied approximately linearly with time. Although the maximum extent of CPC reaction
was obtained in the 72-hour samples, the differences between the 24- and 72-hour
samples were relatively small. This was why mechanical strength testing at 24h could
represent the strength of the material. There were no discernible changes in the XRD
patterns for any of the samples beyond 72h. However, trace amounts of residual TTCP
were present in most 72-hour specimens, probably because of a slight excess of it in the
starting cement powder.

44
Table 2.4 Extent of CPC setting reaction as a function of time.
Time (h) Extent of Reaction (R)%
0 0
1 14.42
6 44.34
24 90.42
72 100
20 25 30 35 40
#
+ TTCP# DCPA* HA
2theta
++ #++ #
***
Inte
nsity
before mixing with liquid
1h
6h
24h
72h
Figure 2.4. XRD pattern of Group 1 sample before setting and 1h, 6h, 24h and 72h after
setting.
During the first six hours, the setting reaction proceeded at a near-linear rate,
indicating that it may be due to the consistent supply of Ca2+ and PO43-, which holds the

45
concentration of Ca2+ and PO43- relatively constant. The rate of reaction may be limited
by factors, such as the surface area of DCPA, which would dissolve in a slower rate than
TTCP under acid and neutral pH conditions, and the diffusion distances over which the
calcium and phosphate ions must migrate in order to form HA. Mechanical Strength and
Microstructures
From materials science point of view, once set, CPC is a brittle, micro-porous
material. To increase its mechanical strength one has to either increase the fracture
toughness or to decrease the flaw size [25].
Figure 2.5 shows the microstructure images of CPC from all three groups under SEM.
Figure 2.5 (a) is an overview of fracture surface of Group 1, and shows some pores with
10-40µm diameter (the white arrows). There are some smaller pores with size from
submicron to 10μm. Typically once CPC powder is mixed with the cement liquid, the
large TTCP particles and small DCPA particles dissolve into the water. TTCP is more
soluble than DCPA around pH 7.6 [34], which is the pH of the cement liquid. Due to the
different particle size TTCP has a relatively small specific surface area that is in contact
with water molecules, and DCPA has a l arger specific surface area. The difference in
dissolving rate compensates the solubility of TTCP and DCPA, which result in similar
rates of dissolution for these two reactants. Once the reaction of HA precipitation occurs,

46
Figure 2.5. SEM images show microstructures of Group 1 (a), (b), Group 2 (c), (d) and
Group 3 (e), (f).

47
Figure 2.6. Microstructure of CPC in Group 1. Scale bar is 2μm.
it continues until the water (reaction media) evaporates, because HA has considerably
lower solubility than TTCP and DCPA and it precipitates into crystal. Figure 2.5 (b)
shows large TTCP block that is embedded in the newly precipitated HA crystals in
sample of Group 1 (the black arrows). This indicates the reaction didn’t finish completely
at the time mechanical testing was done. Fracture surfaces of Group 2 and Group 3
shown in Figure 2.5 (c) and (e) respectively, are rather similar to that of Group 1 i n
Figure 2.5 (a), with micron-sized pores. Similar to Group 1, s amples in Group 2 a nd
Group 3 bot h have some big TTCP crystal left embedded in the structure, shown in
Figure 2.5 (d) and (f). Some big TTCP particles could function as bridge during the
failing of the sample if the precipitate HA crystals grow tightly against them and hence
reinforce the CPC.
Figure 2.6 (a) shows a high magnification of newly formed HA crystals grown in
sample of Group 1. N ew HA crystals have grown into a void that was left from the
reacting of a bigger TTCP or DCPA particle. Based on the phase diagram in Ca(OH)2-
H3PO4-H2O ternary system [2], the liquid phase in the cement is also supersaturated with

48
respect to octacalcium phosphate (OCP, Ca8H2(PO4)6·5H2O), and OCP can be expected
to form because it is a more rapid-forming phase than HA [41]. Although OCP was not
detected by XRD in any of the samples in this study, the appearance of plate-like product
(Figure 2.6 (b)) suggests that transient formation of this phase may have occurred [42].
Similar structures of newly formed HA and plate-like OCP also exhibit in
microphotograph of Group 2 and 3, which are not shown in this section.
Figure 2.7 shows the mechanical strength of Group 1, Group 2 and Group 3 at 1 day,
3 days and 7 days after setting. As it can be seen, Group 1 shows a highest CS among all
three groups, along with the longest setting time shown in Figure 2.3. Group 3 has the
shortest setting time, which indicates the HA crystals precipitate in the fastest rate, and
leads to restricted dissolution and diffusion of reactant particles in short period of time.
This could hinder the diffusion of Ca2+ and PO43- to form new crystals. New HA crystals
form most entanglement during setting, which greatly contributes to the mechanical
strength. This also explains the decrease of mechanical strength from Group 1 to Group 3,
because the faster CPC sets, the less crystal entanglement could form, hence the
mechanical strength would decrease. In addition, a common trend can be seen that both
bending strength and compressive strength increase from 1 day to 3 da ys after setting,
and then decrease at 7 days. Similar phenomenon has been observed in other cement
systems[43], of which strength gradually increase from setting to a plateau and slowly
decrease. This mechanical strength change can be related to kinetics of recrystallization
in progress, and early resorption that starts after crystallization. However, with the high
standard deviation shown in Figure 2.7, there is no s tatistic difference in compressive
strength of all groups. Statistic difference could be observed in bending strength from

49
Group 1 at 1, 3 and 7 days, Group 2 at 3 and 7 days, Group 3 at 3 and 7 days. Future
investigation of mechanical strength will be continued in later publications.
0
2
4
6
8
10
12
14
16
18
Bend
ing
Stre
ngth
(MPa
) Group 1 Group 2 Group 3
1 day 3 days 7 days0
10
20
30
40
50
Com
pres
sive
Stre
ngth
(MPa
)
Time
Figure 2.7. Compressive and bending strength of Group 1, Group 2 and Group 3, 1 day, 3
days and 7 days after setting. Error bars are standard deviation (n=5).

50
4. Conclusion
Our study investigated the influence of different concentrations of Na2HPO4-
NaH2PO4- Na3C6H5O7 as cement liquid on comprehensive properties of CPC, and
provided valuable information on future development to proper setting time, injectability
and mechanical strength of CPC. With increasing concentration of Na2HPO4-NaH2PO4
in the liquid, initial setting time and final setting time decreased significantly, both
following the power law functions, in which the setting time of cement liquid with the
percentage in between can be predicted accordingly. Kinetics of TTCP-DCPA setting
reaction was discussed. The injectability of cement systems with such cement liquids was
investigated and it was determined that too short of setting time could adversely affect the
injectability. During cement setting reactions TTCP and DCPA converted to HA mostly
within 24h a nd meantime gained full strength. Accelerated setting speed also led to
decrease of mechanical strength overall. Mechanical strength was studied through
different time after setting, and at 3 days samples show the highest compressive and
bending strength.
5. Reference
1. Buddecke, D.E., Jr., L.N. Lile, and E.A. Barp, Bone grafting. Principles and applications in the lower extremity. Clin Podiatr Med Surg, 2001. 18(1): p. 109-45, vi.
2. Brown, W. and L. Chow, A new calcium phosphate water setting cement. Cements Research Progress, 1986: p. 352-379.
3. Friedman, C.D., et al., BoneSource™ hydroxyapatite cement: a novel biomaterial for craniofacial skeletal tissue engineering and reconstruction. Journal of biomedical materials research, 1998. 43(4): p. 428-432.
4. Chow, L.C. Calcium phosphate cements: chemistry, properties, and applications. 1999. Materials Research Society, 506 Keystone Drive, Warrendale, PA 15086, USA.

51
5. LeGeros, R., A. Chohayeb, and A. Shulman, Apatitic calcium phosphates: possible dental restorative materials. J Dent Res, 1982. 61: p. 343.
6. Constantz, B.R., et al., Histological, chemical, and crystallographic analysis of four calcium phosphate cements in different rabbit osseous sites. Journal of biomedical materials research, 1998. 43(4): p. 451-461.
7. Knaack, D., et al., Resorbable calcium phosphate bone substitute. Journal of biomedical materials research, 1998. 43(4): p. 399-409.
8. Miyamoto, Y., et al., Histological and compositional evaluations of three types of calcium phosphate cements when implanted in subcutaneous tissue immediately after mixing. Journal of biomedical materials research, 1999. 48(1): p. 36-42.
9. Barralet, J., et al., Effect of porosity reduction by compaction on compressive strength and microstructure of calcium phosphate cement. Journal of biomedical materials research, 2002. 63(1): p. 1-9.
10. Ginebra, M., et al., Setting reaction and hardening of an apatitic calcium phosphate cement. Journal of Dental Research, 1997. 76(4): p. 905.
11. Yokoyama, A., et al., Development of calcium phosphate cement using chitosan and citric acid for bone substitute materials. Biomaterials, 2002. 23(4): p. 1091-1101.
12. Friedman, C., et al., Hydroxyapatite cement. II. Obliteration and reconstruction of the cat frontal sinus. Archives of otolaryngology--head & neck surgery, 1991. 117(4): p. 385.
13. Costantino, P.D., et al., Experimental hydroxyapatite cement cranioplasty. Plastic and reconstructive surgery, 1992. 90(2): p. 174&hyhen; 185.
14. Shindo, M., et al., Facial skeletal augmentation using hydroxyapatite cement. Archives of otolaryngology--head & neck surgery, 1993. 119(2): p. 185.
15. Apelt, D., et al., In vivo behavior of three different injectable hydraulic calcium phosphate cements. Biomaterials, 2004. 25(7-8): p. 1439-1451.
16. Bohner, M. and G. Baroud, Injectability of calcium phosphate pastes. Biomaterials, 2005. 26(13): p. 1553-1563.
17. Takagi, S., et al., Morphological and phase characterizations of retrieved calcium phosphate cement implants. Journal of biomedical materials research, 2001. 58(1): p. 36-41.
18. Xu, H.H.K., et al., Development of a nonrigid, durable calcium phosphate cement for use in periodontal bone repair. The Journal of the American Dental Association, 2006. 137(8): p. 1131.

52
19. Brown, G.D., et al., Hydroxyapatite cement implant for regeneration of periodontal osseous defects in humans. Journal of periodontology, 1998. 69(2): p. 146.
20. Ueyama, Y., et al., Initial tissue response to anti washout apatite cement in the rat palatal region: Comparison with conventional apatite cement. Journal of biomedical materials research, 2001. 55(4): p. 652-660.
21. Xu, H.H.K., et al., Fast setting calcium phosphate scaffolds with tailored macropore formation rates for bone regeneration. Journal of Biomedical Materials Research Part A, 2004. 68(4): p. 725-734.
22. Ishikawa, K., Effects of spherical tetracalcium phosphate on injectability and basic properties of apatitic cement. Key Engineering Materials, 2002. 240: p. 369-372.
23. Bohner, M., Reactivity of calcium phosphate cements. J. Mater. Chem., 2007. 17(38): p. 3980-3986.
24. Burguera, E.F., F. Guitian, and L.C. Chow, Effect of the calcium to phosphate ratio of tetracalcium phosphate on the properties of calcium phosphate bone cement. Journal of Biomedical Materials Research Part A, 2008. 85(3): p. 674 -683.
25. Troczynski, T., Bioceramics: A concrete solution. Nature Materials, 2004. 3(1): p. 13-14.
26. Burguera, E., F. Guitian, and L. Chow, A water setting tetracalcium phosphate–dicalcium phosphate dihydrate cement. Journal of Biomedical Materials Research Part A, 2004. 71(2): p. 275-282.
27. Matsuya, S., S. Takagi, and L. Chow, Effect of mixing ratio and pH on the reaction between Ca 4 (PO 4) 2 O and CaHPO 4. Journal of Materials Science: Materials in Medicine, 2000. 11(5): p. 305-311.
28. Sun, L., et al., Influence of particle size on DCPD hydrolysis and setting properties of TTCP/DCPD cement. Key Engineering Materials, 2005. 284: p. 23-26.
29. Chow, L.C., et al., Hydrolysis of tetracalcium phosphate under a near-constant-composition condition--effects of pH and particle size. Biomaterials, 2005. 26(4): p. 393-401.
30. Fukase, Y., et al., Setting reactions and compressive strengths of calcium phosphate cements. J Dent Res, 1990. 69(12): p. 1852-6.

53
31. C266, Standard Test Method for Time of Setting of Hydraulic-Cement Paste by Gillmore Needles, in Cement Standards and Concrete Standards2008, ASTM International.
32. Chow, L.C., Development of self-setting calcium phosphate cements. Nippon Seramikkusu Kyokai Gakujutsu RonbunshiJournal of the Ceramic Society of Japan, 1991. 99(1154).
33. Liu, C., et al., Mechanism of the hardening process for a hydroxyapatite cement. Journal of biomedical materials research, 1997. 35(1): p. 75-80.
34. Chow, L., Next generation calcium phosphate-based biomaterials. Dental materials journal, 2009. 28(1): p. 1.
35. Liu, C., Y. Huang, and H. Zheng, Study of the hydration process of calcium phosphate cement by AC impedance spectroscopy. Journal of the American Ceramic Society, 1999. 82(4): p. 1052-1057.
36. Carlson, J., et al., An ultrasonic pulse-echo technique for monitoring the setting of CaSO4-based bone cement. Biomaterials, 2003. 24(1): p. 71-77.
37. Driessens, F.C.M., et al., Osteotransductive bone cements. Proceedings of the Institution of Mechanical Engineers, Part H: Journal of Engineering in Medicine, 1998. 212(6): p. 427-435.
38. Ginebra, M., et al., Compliance of an apatitic calcium phosphate cement with the short-term clinical requirements in bone surgery, orthopaedics and dentistry. Clinical materials, 1994. 17(2): p. 99-104.
39. Matsuya, S., S. Takagi, and L.C. Chow, Hydrolysis of tetracalcium phosphate in H3PO4 and KH2PO4. Journal of Materials Science, 1996. 31(12): p. 3263-3269.
40. Komath, M., H. Varma, and R. Sivakumar, On the development of an apatitic calcium phosphate bone cement. Bulletin of Materials Science, 2000. 23(2): p. 135-140.
41. Brown, W.E., Solubilities of phosphates and other sparingly soluble compounds. Environmental phosphorus handbook, 1973: p. 203.
42. Brown, W., N. Eidelman, and B. Tomazic, Octacalcium phosphate as a precursor in biomineral formation. Advances in dental research, 1987. 1(2): p. 306.

54
Chapter 3 Setting Time, Injectability and Mechanical Properties of
Polymer-Apatite Cement as Bone Substitute
1. Introduction
Medical surgeries related with bone injury are prevalent in the United States, with
around 900,000 hospitalizations for fractures [1] and over 800,000 grafting procedures
annually [2]. Hydroxyapatite (HA) or calcium phosphate provides good biocompatibility
and osteoconductivity being similar to the major inorganic component of natural bone.
Calcium phosphate ceramics are widely used as bone substitutes in dentistry, orthopedics
and reconstructive surgery. Unfortunately, they are only available as pre-fabricated
blocks or granules. These pre-fabricated calcium phosphate ceramic typically go through
sintering process, which makes its microstructure less bioresorbable [3, 4]. In addition, it
is very difficult to process calcium phosphate blocks into ideal shape for the specific site
of patients, which may cause that less bone tissue could attach onto the implant [5-8]. CP

55
granules could possibly migrate into other parts of the body and cause a clog or
inflammation [9-12].
A self-hardening CP cement (CPC), reported at the first time in 1986 [13-15], has
been shown in clinical studies to be effective for repairing bone defects [16]. This cement
consists of tetracalcium phosphate (Ca4(PO4)2O, TTCP), dicalcium phosphate anhydrous
(CaHPO4, DCPA) and a cement liquid. Once upon the mixing it forms a paste that can be
placed into a bone void as a substitute for the damaged part of the bone [9, 17-21] and
hardens into the exclusive product HA. For minimally invasive surgeries, it is required to
have injectable CPCs with minimal filtration. Typically a specially made syringe with a
cannula is used to deliver CPC paste to the site while minimizing the opening of the
wound. CPC paste reacts and sets into HA in aqueous environment at body temperature,
therefore it is more compatible to biological apatites in human hard tissues than sintered
HA [4, 22]. There are also other orthopedic applications that do not need high
injectibility if the CPC paste could be directly molded and delivered to the right place.
The low strength of CPC has limited its use to only non-load-bearing applications [18]
and clinical usage has been significantly hindered by its brittleness [20]. One clinical
study on t he repair of periodontal bone defects demonstrated that the brittle nature of
CPC caused early exfoliation of all or pieces of the implant [23]. Another major
shortcoming is that it takes a relatively long time for the CPC paste to set. A long setting
time can result in the deformation of CPC when the paste comes in contact with
physiological fluids, or if bleeding occurs due to the difficulty in some cases to achieve
complete hemostasis [24-26]. Although most CPCs have been claimed to be injectable,
most surgeons complain that CPCs are poorly injectable [27].

56
From a composites material science perspective, polymers are known to provide the
continuous structure and design flexibility to achieve tailored mechanical properties. It is
well known that the organic polymers are used to compensate weak-points of inorganic
cements and the cements are called polymeric cement composites. It is generally
accepted that the mechanical bonding force of the polymer cements comes from the
following subjects [28-30]: formation of a cement hydrate, formation of a matrix phase
between cement hydrates and organic polymers, and chemical bond between hydrates and
organic polymers. Moreover, some polymers have high viscosity which could be applied
to improve the injectability of CPC [31].
A number of researchers have investigated the influence of adding polymer on
properties of CPC. Sun et al. [32] reported nearly two times increase of bending strength
of CPC by adding 20% chitosan biopolymer. Cherng et al. [33] showed that adding
hydroxypropyl methylcellulose (HPMC), carboxyl methylcellulose (CMC), chitosan
acetate and chitosan lactate improved the handling properties but HPMC and CMC
increased the setting time while chitosan lactate and chitosan acetate weakened the
mechanical strength. Bohner et al. [31] reported by increasing the viscosity of the mixing
liquid, the injectability of CPC could improve significantly without reducing the viscosity
of CPC paste. Tajima et al. [34] showed sodium alginate could improve the washout
property of CPC but slowed down the transformation to HA. Michiewicz et al. reported
that by adding various polymers poly (ethyleneimine) (PEI), and poly (allylamine
hydrochloride) (PAH) in the compressive strength exhibited up to six times greater that
the pure α-BSMTM material [35].

57
The objective of this study is to explore the feasibility of strengthening our apatite
cement by incorporating different polymers into it and to study their influence on setting
time, injectability as well as mechanical strength of TTCP-DCPA apatite. Chitosan and
its derivatives are natural biopolymers, which are biocompatible, biodegradable,
osteoconductive, and have been used in the surgical reduction of periodontal pockets[36-
38]. Two water-soluble polyelectrolytes, PEI (Mw~750,000, Sigma, St, Louis, MO), and
PAH (Mw~15,000, Sigma, St. Louis, MO), were chosen as the other candidates because
of their known tendency to adsorb to CPC and to influence their crystallization behavior
[39-42]. Chitosan lactate (chitosan), poly (ethyleneimine) (PEI), and poly (allylamine
hydrochloride) (PAH) were hence chosen for this purpose and two levels of concentration
with each chemical in aqueous solutions were investigated. The microstructure of each
group of CPCs was observed and the conversion rate of one group to HA over 1h, 6h,
24h and 72h was reported. Their influence on setting time, injectability and mechanical
properties was investigated accordingly.
2. Materials and Methods
2.1 Materials
Tetracalcium phosphate (Ca4(PO4)2O, TTCP) was synthesized by heating a mixture
of dicalcium phosphate anhydrous (CaHPO4, DCPA, J. T. Baker, 1430) and calcium
carbonate (CaCO3, CC, Aldrich, 310034) at 1500 ºC for 8 hours. DCPA and CC were
mixed with molar ratio of 1:0.9, instead of the ideal ratio of 1:1 in order to avoid the
presence of CaO in the product, which can be formed if calcium is in excess due to the
inhomogeneities in the sintering process. Presence of CaO could cause an increase of pH
in cement slurry and retard the setting reaction [43, 44]. The sintered cake was broken

58
and grinded with mortar and pestle until it passed 355µm sieves. It was then loaded into
the planetary milling machine (Retsch, PM100) and milled for 2 hours.
Results from previous studies showed that medium-particle-size of TTCP and fine-
particle-size of DCPA yield the strongest samples [45-47]. DCPA was a commercially
obtained reagent-grade chemical. It was ground in distilled water for 48 hour s in
planetary mill at 200 rpm to a median particle size of 1µm. The ground DCPA was then
collected by vacuum filter and dried in oven at 100 ºC overnight to remove any moisture.
The dried DCPA was mixed with TTCP at molar ratio of 1:1 in the media of pure ethanol
or acetone. The slurry was mixed with magnetic stirrer for 2 hours to make sure it was
thoroughly mixed.
2.2 Sample Preparation for Mechanical Testing
Figure 3.1 Chemical structure of PEI (a) and PAH (b).
Solid phase of the specimens consisted of 27wt% DCPA and 73wt% TTCP (molar
ratio 1:1). Liquid phase was an aqueous solution containing 2.5 wt% chitosan, 5 w t%
chitosan, 5 wt% PEI, 10 wt% PEI, 5 wt% PAH or 10 wt% PAH. Chemical structure of
PEI and PAH are shown in Figure 3.1. Table 3.1 shows different types of cement liquid
and their powder to liquid ratios in details.
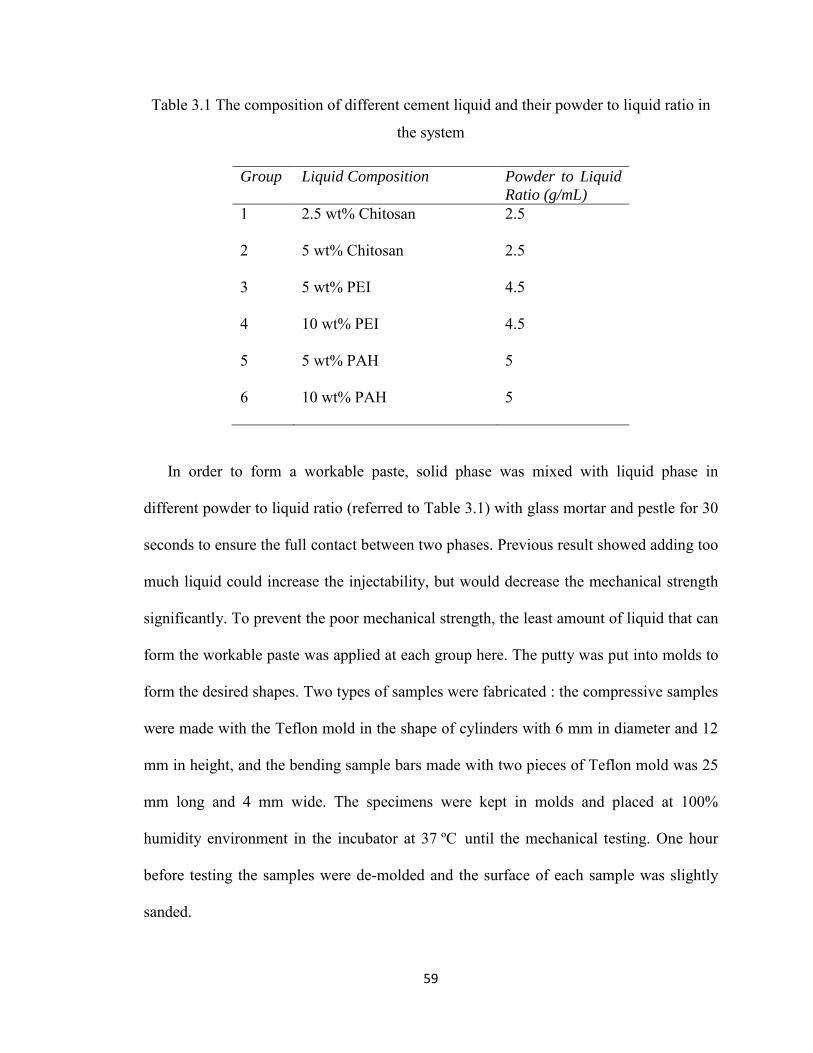
59
Table 3.1 The composition of different cement liquid and their powder to liquid ratio in
the system
Group Liquid Composition Powder to Liquid Ratio (g/mL)
1 2.5 wt% Chitosan 2.5
2 5 wt% Chitosan 2.5
3 5 wt% PEI 4.5
4 10 wt% PEI 4.5
5 5 wt% PAH 5
6 10 wt% PAH 5
In order to form a workable paste, solid phase was mixed with liquid phase in
different powder to liquid ratio (referred to Table 3.1) with glass mortar and pestle for 30
seconds to ensure the full contact between two phases. Previous result showed adding too
much liquid could increase the injectability, but would decrease the mechanical strength
significantly. To prevent the poor mechanical strength, the least amount of liquid that can
form the workable paste was applied at each group here. The putty was put into molds to
form the desired shapes. Two types of samples were fabricated : the compressive samples
were made with the Teflon mold in the shape of cylinders with 6 mm in diameter and 12
mm in height, and the bending sample bars made with two pieces of Teflon mold was 25
mm long and 4 mm wide. The specimens were kept in molds and placed at 100%
humidity environment in the incubator at 37 ºC until the mechanical testing. One hour
before testing the samples were de-molded and the surface of each sample was slightly
sanded.

60
2.3 Setting Time
Setting time of CPC was measured according to ASTM C266-07 [48] (n=5) where a
Gillmore apparatus was used to determine the rate and speed of the setting reaction.
Aliquots of liquid were gradually added in 3 g of CPC powder until a bright and fluid
homogeneous paste was obtained, as described in ASTM C305 [49], with different
powder to liquid ratios according to Table 3.1 (n=3). Glass mortar and pestle are used to
apply 30 seconds of mixing motion, and the paste was then transferred into a clean petri
dish for setting time measurement.
2.4 Injectability
Mix 5g of CPC, as described in ASTM C305, with different powder to liquid ratios
according to Table 3.1 (n=5), and the paste was transferred into a 3 mL disposable
syringe (Luer-Loc TipTM, BD Medical, Franklin Lakes, NJ). The paste was extruded
through the tip by hand. When different powder to liquid ratios were applied, the original
volume of the CPC paste varied. Injectability was determined by the volume fraction of
paste that could be extruded by measuring the volume of CPC paste before and after
extrusion.
2.5 Scanning Electron Microscopy
Microstructures of the samples were observed by Scanning Electron Microscope
(Quanta 600 F EG ESEM, FEI, Hillsboro, Oregon, USA). Several bulk samples were
collected following the bending strength test and were immediately coated with platinum
and partially covered by silver paint before it was observed to reduce charging.

61
2.6 X-ray Diffraction and Conversion Rate
Samples of CPC - 10% PEI were incubated at 100% humidity and 37 ºC for 1h, 6h,
24h, and 72h before they were crushed by mortar and pestle into small pieces. Crushed
pieces were washed with ethanol 3 t imes to prevent further setting reaction from
proceeding. It was then dried in room temperature for 12 hours before powder x-ray
diffraction (XRD) to determine the extent of the starting materials and the identities of
the products as a function of time. X-ray diffraction patterns were recorded on a Rigaku
powder diffractometer with graphite-monochromatized copper Kα1 radiation (X = 0.154
nm) generated at 40 kV and 44 mA. All data was collected in a continuous scan mode (1°
2θ/min, time constant 2 s) on a strip-chart recorder. The intensities of two peaks, 29.58º
(2θ) for TTCP and 25.76º (2θ) for HA, were recorded and the conversion rate of the
cement to HA was estimated. The transformation rate was calculated by the following
equation, modified from the report of Fukase et al. [47]
𝑅 (𝐶𝑜𝑛𝑣𝑒𝑟𝑠𝑖𝑜𝑛 𝑅𝑎𝑡𝑒) (%) = 1 2⁄ [�𝑃𝐻𝐴(𝑡) 𝑃𝐻𝐴(∞)⁄ � + (1 − 𝑃𝑇𝑇𝐶𝑃(𝑡) 𝑃𝑇𝑇𝐶𝑃(0))]⁄
where 𝑃𝑇𝑇𝐶𝑃(0) and i s the intensity of the peaks of TTCP in the original powder
components, and𝑃𝐻𝐴(∞) is the intensity of the peaks of HA in the cements at setting time
of 72 hours’ incubation. 𝑃𝑇𝑇𝐶𝑃(𝑡) and 𝑃𝐻𝐴(𝑡) are the intensities of peaks of TTCP and HA
in the cement harvested at time t after incubation.
2.7 Compressive Strength and Bending Strength Measurement
The compressive strength (CS) and bending strength (BS) were measured on an
Instron Universal Testing Machine (Model 3367, Instron, MA). The Universal Testing
Machine recorded the applied load (Newton) as a function of time (second). CS was
calculated according to the equation below (n=5):

62
𝜎𝑐 = 𝐹 𝐴⁄
where F is the load (N) at the fracture point, A is the cross section size (mm2), σc is the
CS (MPa). The experiment carries out with uniaxial compressive stress reached when the
material fails completely. The load cell applied was 250 kg and the crosshead speed was
1mm per minute.
BS was calculated according to 3 point bending (n=5) with the following formula:
𝜎𝑓 =3𝐹𝐿
2𝑏𝑑2
where F is the load (N) at the fracture point, L is the length of the supporting span (mm)
which is 20 mm, b i s width of the sample (mm), and d i s the thickness of the sample
(mm), σf is the BS (MPa). The load cell applied was 50 kg and the crosshead speed was
0.5 mm per minute.
3. Result and Discussion
3.1 Setting time
Figure 3.2 Microstructure of DCPA (a) and TTCP (b) particles under SEM.

63
Figure 3.2 (a) and (b) show the microstructure of DCPA and TTCP particles,
respectively. DCPA particles are around 1 µm in mean diameter, and TTCP particles are
around 17μm.
The setting process of CPC is complex, involving the dissolution of the starting
materials DCPA and TTCP, the precipitation of HA from the solution, and the
neutralization of acidic and basic by-products [50, 51]. Typically around pH 7, DCPA has
a fairly low solubility, and TTCP has a relatively higher rate of dissolution. Thus a
particle size ~1µm DCPA is desirable and can dissolve in a rate that is closer to that of
TTCP, which will result in the precipitation of HA.
2𝐶𝑎4(𝑃𝑂4)2𝑂 + 2𝐶𝑎𝐻𝑃𝑂4 = 𝐶𝑎10(𝑃𝑂4)6(𝑂𝐻)2
It is difficult to correlate the relationship between the hydration reaction and
microstructure development, even though many methods, such as the amount assay of
hydration product formation [51], and AC impedance spectroscopy [52], etc., were
developed to explore the setting process. Most of the methods have their limitations,
which involves either indirect detection or intermittent examinations. Gillmore Needle
Apparatus can define setting time as when the surface of the material is strong enough to
withstand a certain pressure. Although this is not directly characterizing the setting
process [53], it can reflect the extent of setting reaction through surface hardness. In this
dissertation Gillmore Needles was used to show the progress of setting reaction.

64
Table 3.2 Setting time of CPC with different cement liquid.
Group Composition Initial Setting Time(min)
Final Setting Time (min)
1 CPC-2.5 wt% Chitosan 49.0±14.4 228.7±13.9
2 CPC-5 wt% Chitosan 59.7±4.5 218.7±6.0
3 CPC-5 wt% PEI 34.3±9.5 109±7.2
4 CPC-10 wt% PEI 21.0±3.0 111.0±6.0
5 CPC-5 wt% PAH 47.3±6.5 107.7±6.0
6 CPC-10 wt% PAH 23.7±3.1 66.3±8.7
The setting time of each group of CPC was reported in Table 3.2. Group 1 a nd 2,
using chitosan as the sole ingredient of aqueous cement liquid, significantly prolong the
setting time of CPC paste. The change of concentration of chitosan in those two samples
didn’t change the overall setting time. This implies that the existence of chitosan
molecules slows down the setting reaction, possibly by covering DCPA and TTCP
particles and decreasing the solubility of the two reactants. Group 3 a nd 4 s hows the
setting time of CPC incorporated with 5 wt% and 10wt% PEI solution. With the amount
of PEI increasing, the initial setting time the final setting time didn’t show significant
difference. Group 5 and 6 show the initial setting time and final setting time of CPC with
PAH aqueous solution concentration of 5 wt% and 10 wt%. Compared with CPC with
PEI, the higher concentration of PAH can shorten the setting time significantly. It can be
predicted with percentage of PAH above 10%, a shorted setting time of CPC paste could
possibly be achieved. Other methods are also available to potentially shorten the setting
time, such as adding Na2HPO4 or NaH2PO4 in the CPC powder to accelerate the reaction.

65
3.2 Injectability
Table 3.3 Injectability of CPC with different cement liquid.
Group Composition Powder to Liquid Ratio (g/mL)
Injectability (%)
1 CPC-2.5 wt% Chitosan 2.5 100
2 CPC-5 wt% Chitosan 2.5 100
3 CPC-5 wt% PEI 4.5 6.3±3.15
4 CPC-10 wt% PEI 4.5 2.1±1.8
5 CPC-5 wt% PAH 5 0
6 CPC-10 wt% PAH 5 0
The injectability of CPC paste from Group 1 to Group 6 is shown in Table 3.3. Upon
mixing with chitosan solution, CPC paste appeared to be flowable and is 100% injectable.
This could be due to the high viscosity of cement liquid itself, which greatly contributes
to the injectability of CPC paste [31]. However, even with typical appearance of fluid
homogeneous paste, CPCs from Group 3 to Group 6 are barely injectable, and appear to
behave like a non-Newtonian liquid, for the level of shear force applied. This could be
attributed to the high powder to liquid ratio, which is generally known to decrease
injectability of CPC. Also PEI and PAH do not de-aggregate CPC powders during the
mixing process. The powder agglomerate usually leads to filtration of CPC powder from
mixing liquid, which causes an increase of friction between particles. Filtration of CPC
paste often occurs when the powder reaches the decreased diameter of the cannula where
the particles stay packed in the syringe while the liquid flows through the particles and
the syringe. The packed particles form a d ense layer, and the thickness of the layer

66
increases with time. Interestingly, the filtration didn’t appear to be the main issue for
CPC-PEI and CPC-PAH groups. The liquid seems to have strong bonding with particles,
however, the shear-thickening behavior made the vicosity of the paste increase
dramatically while force is applied to inject the paste through the syringe canola. CPC-
PEI paste has a lower powder to liquid ratio compared with CPC-PAH paste, hence only
2-6 vol% of CPC could be injected, although obvious filtration occurred (the paste that
was injected was much thinner). Although these CPCs are not applicable for minimally
invasive surgeries (in which injectable CPC is preferred), they could be used in an open-
wound surgery where CPC paste can be packed in through large openings.
3.3 Conversion Rate
Table 3.4 Extent of CPC setting reaction as a function of time.
Time (h) Extent of Reaction (R)%
0 0
1 21.70
6 59.40
24 90.22
72 100
The XRD patterns of CPC-10wt% PEI specimens obtained at the various time
intervals are shown in Figure 3.3. It can be seen that the only reaction product present
was hexagonal HA (PDF#01-071-5049). The extent of reaction, expressed in terms of R,
as a function of time is given in the Table 3.4. As the reaction time increased, R value
increased as expected. During the first six hour after mixing CPC powder with 10wt%

67
PEI solution, R varied approximately linearly with time. Although the maximum extent
of CPC reaction was obtained in the 72-hour samples, the difference between the 24- and
72-hour samples was small. This may be related to that fact that mechanical strength
tested at 24h was often used to represent the strength of the material. There were no
discernible changes in the XRD patterns for any of the samples beyond 72h. However,
trace amounts of residual TTCP were present in most 72-hour specimens, possibly
because some large TTCP particles didn’t dissolve and react completely with DCPA.
Figure 3.3 XRD pattern of Group 1 sample before setting and 1h, 6h, 24h and 72h after
setting.
During the first six hours, the setting reaction proceeded at a near-linear rate,
indicating that it may be due to the consistent supply of Ca2+ and PO43-, which holds the

68
concentration of Ca2+ and PO43- relatively constant. The rate of reaction may be limited
by factors, such as the surface area of DCPA, which would dissolve in a slower rate than
TTCP under acid and neutral pH conditions, and the diffusion distances over which the
calcium and phosphate ions must migrate in order to form HA.
Figure 3.4 Extent of setting reaction of CPC-PEI and CPC with non-polymeric liquid
The extent of setting reaction of CPC-PEI and CPC with non-polymeric liquid is
shown in Figure 3.4. Compared to the conversion rate of CPC mixed with non-polymer
cement liquid in our previous study [54], the extent of setting reaction here proceeded
faster in 1h (21.70% as compared to 14.42%), and 6h (59.40% as compared to 44.34%),
although the setting time of CPC with non-polymer liquid has much shorter setting time.
This phenomenon indicates that setting time alone may not be sufficient information to
interpret setting process of polymeric CPC. Setting time only reflects the extent of setting
through surface hardness, however, certain CPC paste exhibit irregular surface hardness,
such as CPC-PEI and CPC-PAH, when shear thickening paste forms. Another reason for

69
polymeric CPC to have higher R could be that the chemical reaction of TTCP and DCPA
benefit from the long setting time, which would enhance the chance for longer period of
chemical diffusion in the paste that is necessary of forming new HA crystals. Since the
conversion rate of CPC is known to be directly related to the mechanical strength [47],
the higher extent of reaction in the early stage would more likely decrease the chance of
cracking in the body after surgeries.
3.4 Mechanical Strength
Microstructure and mechanical strength of CPCs from Group 1 to Group 6 are shown
in Figure 3.5 and Figure 3.6, respectively. It can be seen that CPC-chitosan has much
lower mechanical strength than CPC-PEI and CPC-PAH. This could be due to chitosan
de-aggregated CPC powder and distributed evenly in between TTCP and DCPA particles,
which lower the solubility of TTCP and DCPA in aqueous solution and therefore
hindered the setting reaction from proceeding to further extent, hence less crystal
entanglement of new HA precipitate occurred. Crystal entanglement has been known to
be responsible for mechanical behavior of CPC and majority source of enhance
mechanical strength after setting reaction [55]. Some researchers [32, 33] reported
improvement of mechanical properties of CPC incorporated with chitosan, however, due
to chemistry differences in the specific cement formula, such phenomenon was not
observed in our study.

70
Figure 3.5 Microstructure of Group 1 (a), Group 2 (b), Group 3 (c), Group 4 (d), Group 5
(e) and Group 6 (f) under SEM. Scale bar is 20μm.

71
Figure 3.6 Compressive strength and bending strength of apatite cement with polymeric
liquid. Error bars are standard deviation (n=5).
The great improvement of CS was seen in CPC-PEI and CPC-PAH, in which PEI has
very high molecular weight (750,000 g/mol), and PAH has a lower molecular weight
(15,000). CPC-5 wt% PEI exhibits the peak value of CS 54.0 M Pa with very small
standard deviation (n=5) and decent BS 13.8 MPa. Other Group 4 to Group 6 samples

72
also have CS of 27~34 MPa and BS of 13~15 MPa. Three factors can attribute to the high
CS and BS. CPC-PEI and CPC-PAH have a much higher powder to liquid ratio than
CPC-chitosan, which results in a less polymer matrix with more contacts between TTCP
and DCPA particles. This could lead to a higher percentage of HA precipitate and
entanglement. Secondly, PEI and PAH appear to surround TTCP, DCPA and new HA
crystals in a closer manner than chitosan (shown with arrows in microstructures in Figure
3.3), which would provide better binding and adhesion between the polymer component
and the inorganic matrix. In addition, as polyelectrolytes PEI and PAH are rich in
charged functional groups, which could cause the bond w ith surface anions of apatite
crystals.
4. Conclusion
TTCP-DCPA type CPC incorporated with chitosan, PEI and PAH were fabricated
and the polymers’ influence on setting time, injectability, mechanical strength and
conversion rate of the cement system was investigated. CPC-chitosan has good
injectability (100%), but exhibits long setting time (>200 minutes for final setting time)
and low mechanical strength (~8 MPa). CPC-PEI and CPC-PAH showed poor
injectability but had excellent mechanical properties. The highest mechanical strength
was demonstrated for CPC-5% PEI samples, which is over 50 MPa for CS and 15 MPa
for BS. Conversion rate study indicated CPC-PEI had higher extent of reaction during the
early stage (<6h) compared with non-polymeric CPC shown in previous study, and the
mechanism was discussed as well. CPC- PEI and CPC-PAH have very good mechanical
properties, and can be potentially applied to load-bearing case in orthopedics.

73
5. Reference
1. Temenoff, J.S. and A.G. Mikos, Injectable biodegradable materials for orthopedic tissue engineering. Biomaterials, 2000. 21(23): p. 2405-2412.
2. Laurencin, C., et al., Tissue engineering: orthopedic applications. Annual Review of Biomedical Engineering, 1999. 1(1): p. 19-46.
3. Bohner, M., Calcium orthophosphates in medicine: from ceramics to calcium phosphate cements: Calcium-orthophosphate in der medizin: von der keramik zu calciumphosphat-zementen: Des orthophosphates de calcium en médecine: des céramiques aux ciments phosphocalciques: Los ortofosfatos de calcio en medicina: de la cerámica a los cementos de fosfato de calcio. Injury, 2000. 31: p. D37-D47.
4. Xu, H.H.K., et al., Development of a nonrigid, durable calcium phosphate cement for use in periodontal bone repair. The Journal of the American Dental Association, 2006. 137(8): p. 1131.
5. Tañag, M.A., K. Yano, and K. Hosokawa, Orbital floor reconstruction using calcium phosphate cement paste: An animal study. Plastic and reconstructive surgery, 2004. 114(7): p. 1826.
6. Jansen, J., et al., Injectable calcium phosphate cement for bone repair and implant fixation. Orthopedic Clinics of North America, 2005. 36(1): p. 89-95.
7. Stanton, D.C., J.C. Chou, and L.R. Carrasco, Injectable calcium-phosphate bone cement (Norian) for reconstruction of a large mandibular defect: a case report1. Journal of oral and maxillofacial surgery, 2004. 62(2): p. 235-240.
8. Ooms, E., et al., Enhancement of initial stability of press-fit femoral stems using injectable calcium phosphate cement: an in vitro study in dog bones. Biomaterials, 2004. 25(17): p. 3887-3894.
9. Apelt, D., et al., In vivo behavior of three different injectable hydraulic calcium phosphate cements. Biomaterials, 2004. 25(7-8): p. 1439-1451.
10. Blattert, T., G. Delling, and A. Weckbach, Evaluation of an injectable calcium phosphate cement as an autograft substitute for transpedicular lumbar interbody fusion: a controlled, prospective study in the sheep model. European Spine Journal, 2003. 12(2): p. 216-223.
11. Horstmann, W., C. Verheyen, and R. Leemans, An injectable calcium phosphate cement as a bone-graft substitute in the treatment of displaced lateral tibial plateau fractures. Injury, 2003. 34(2): p. 141-144.

74
12. Comuzzi, L., E. Ooms, and J.A. Jansen, Injectable calcium phosphate cement as a filler for bone defects around oral implants: an experimental study in goats. Clinical Oral Implants Research, 2002. 13(3): p. 304-311.
13. Brown, W. and L. Chow, A new calcium phosphate setting cement. J Dent Res, 1983. 62: p. 672.
14. Chow, L., et al., Diametral tensile strength and compressive strength of a calcium phosphate cement: effect of applied pressure. Journal of biomedical materials research, 2000. 53(5): p. 511-517.
15. Takagi, S. and L. Chow, Formation of macropores in calcium phosphate cement implants. Journal of Materials Science: Materials in Medicine, 2001. 12(2): p. 135-139.
16. Friedman, C.D., et al., Reconstruction of the frontal sinus and frontofacial skeleton with hydroxyapatite cement. Archives of Facial Plastic Surgery, 2000. 2(2): p. 124.
17. Friedman, C., et al., Hydroxyapatite cement. II. Obliteration and reconstruction of the cat frontal sinus. Archives of otolaryngology--head & neck surgery, 1991. 117(4): p. 385.
18. Costantino, P.D., et al., Experimental hydroxyapatite cement cranioplasty. Plastic and reconstructive surgery, 1992. 90(2): p. 174&hyhen; 185.
19. Shindo, M., et al., Facial skeletal augmentation using hydroxyapatite cement. Archives of otolaryngology--head & neck surgery, 1993. 119(2): p. 185.
20. Friedman, C.D., et al., BoneSource™ hydroxyapatite cement: a novel biomaterial for craniofacial skeletal tissue engineering and reconstruction. Journal of biomedical materials research, 1998. 43(4): p. 428-432.
21. Chow, L.C. Calcium phosphate cements: chemistry, properties, and applications. 1999. Materials Research Society, 506 Keystone Drive, Warrendale, PA 15086, USA.
22. Takagi, S., et al., Morphological and phase characterizations of retrieved calcium phosphate cement implants. Journal of biomedical materials research, 2001. 58(1): p. 36-41.
23. Brown, G.D., et al., Hydroxyapatite cement implant for regeneration of periodontal osseous defects in humans. Journal of periodontology, 1998. 69(2): p. 146.
24. Miyamoto, Y., et al., Histological and compositional evaluations of three types of calcium phosphate cements when implanted in subcutaneous tissue immediately after mixing. Journal of biomedical materials research, 1999. 48(1): p. 36-42.

75
25. Ueyama, Y., et al., Initial tissue response to anti washout apatite cement in the rat palatal region: Comparison with conventional apatite cement. Journal of biomedical materials research, 2001. 55(4): p. 652-660.
26. Xu, H.H.K., et al., Fast setting calcium phosphate scaffolds with tailored macropore formation rates for bone regeneration. Journal of Biomedical Materials Research Part A, 2004. 68(4): p. 725-734.
27. Ishikawa, K., Effects of spherical tetracalcium phosphate on injectability and basic properties of apatitic cement. Key Engineering Materials, 2002. 240: p. 369-372.
28. Ohama, Y., History and present status of inorganic-organic polymer composite materials in the civil and building industry. Muki materiaru, 1998(277): p. 459-471.
29. Ohama, Y., Polymer-modified mortars and concretes. Concrete Admixtures Handbook: Properties, Science, and Technology, 1995: p. 558.
30. Ohama, Y., Polymer-based admixtures. Cement and Concrete Composites, 1998. 20(2-3): p. 189-212.
31. Bohner, M. and G. Baroud, Injectability of calcium phosphate pastes. Biomaterials, 2005. 26(13): p. 1553-1563.
32. Sun, L., et al., Fast setting calcium phosphate cement-chitosan composite: mechanical properties and dissolution rates. Journal of biomaterials applications, 2007. 21(3): p. 299.
33. Cherng, A., S. Takagi, and L. Chow, Effects of hydroxypropyl methylcellulose and other gelling agents on the handling properties of calcium phosphate cement. Journal of biomedical materials research, 1997. 35(3): p. 273-277.
34. TAJIMA, S., et al., Effects of added sodium alginate on mechanical strength of apatite cement. Dental materials journal, 2004. 23(3): p. 329-334.
35. Mickiewicz, R.A., A.M. Mayes, and D. Knaack, Polymer–calcium phosphate cement composites for bone substitutes. Journal of biomedical materials research, 2002. 61(4): p. 581-592.
36. Machida, Y., et al., Use of chitosan and hydroxypropylchitosan in drug formulations to effect sustained release. Drug design and delivery, 1986. 1(2): p. 119.
37. Muzzarelli, R., Amphoteric derivatives of chitosan and their biological significance. Chitin and chitosan. New York: Elsevier Applied Science, 1989: p. 87–99.

76
38. Muzzarelli, R., et al., Osteoconduction exerted by methylpyrrolidinone chitosan used in dental surgery. Biomaterials, 1993. 14(1): p. 39-43.
39. Horvath, L., Effect of cationic surfactant on the transformation of octacalcium phosphate. Journal of crystal growth, 2000. 219(1-2): p. 91-97.
40. Zieba, A., et al., Influence of organic phosphonates on hydroxyapatite crystal growth kinetics. Langmuir, 1996. 12(11): p. 2853-2858.
41. Burke, E., et al., Influence of polyaspartic acid and phosphophoryn on octacalcium phosphate growth kinetics. Colloids and Surfaces B: Biointerfaces, 2000. 17(1): p. 49-57.
42. Gorski, J.P., Acidic phosphoproteins from bone matrix: A structural rationalization of their role in biomineralization. Calcified tissue international, 1992. 50(5): p. 391-396.
43. Burguera, E., F. Guitian, and L. Chow, A water setting tetracalcium phosphate–dicalcium phosphate dihydrate cement. Journal of Biomedical Materials Research Part A, 2004. 71(2): p. 275-282.
44. Matsuya, S., S. Takagi, and L. Chow, Effect of mixing ratio and pH on the reaction between Ca 4 (PO 4) 2 O and CaHPO 4. Journal of Materials Science: Materials in Medicine, 2000. 11(5): p. 305-311.
45. Sun, L., et al., Influence of particle size on DCPD hydrolysis and setting properties of TTCP/DCPD cement. Key Engineering Materials, 2005. 284: p. 23-26.
46. Chow, L.C., et al., Hydrolysis of tetracalcium phosphate under a near-constant-composition condition--effects of pH and particle size. Biomaterials, 2005. 26(4): p. 393-401.
47. Fukase, Y., et al., Setting reactions and compressive strengths of calcium phosphate cements. J Dent Res, 1990. 69(12): p. 1852-6.
48. Standard Test Method for Time of Setting of Hydraulic-Cement Paste by Gillmore Needles, in Cement Standards and Concrete Standards2008, ASTM International.
49. Mechanical Mixing of Hydraulic Cement Pastes and Mortars of Plastic Consistency, in Highway and Transportation Officials Standards2011, ASTM International. p. 3.
50. Chow, L.C., Development of self-setting calcium phosphate cements. Nippon Seramikkusu Kyokai Gakujutsu RonbunshiJournal of the Ceramic Society of Japan, 1991. 99(1154).

77
51. Liu, C., et al., Mechanism of the hardening process for a hydroxyapatite cement. Journal of biomedical materials research, 1997. 35(1): p. 75-80.
52. Liu, C., Y. Huang, and H. Zheng, Study of the hydration process of calcium phosphate cement by AC impedance spectroscopy. Journal of the American Ceramic Society, 1999. 82(4): p. 1052-1057.
53. Carlson, J., et al., An ultrasonic pulse-echo technique for monitoring the setting of CaSO4-based bone cement. Biomaterials, 2003. 24(1): p. 71-77.
54. Ritts, W. and H. Li, Unpublished data.

78
Chapter 4 Synthesis of High Aspect Ratio Hydroxyapatite Nanofibers
and the Structural Evolution
1. Introduction
Hydroxyapatite is the primary component of human hard tissues, such as bones and
teeth [1]. In the past couple of decades, it has drawn more interests from scientific
researchers to study the synthesis of this material and further investigate the addition of
HA to medical devices. Typically synthetic HA has very excellent biocompatibility and
bioactivity with not only hard tissues, but also skin and muscle tissues. It has been used
as additive to various matrices, such as biopolymer materials polylactic acid (PLA) and
dental composites, to reduce inflammation caused by polymer degradation [2]. Also,
synthetic HA can be tailored to have a specific geometry, like nanoparticles [3-6],
nanorods [7, 8] and nanofibers [9, 10]. These structures will also have specific
mechanical properties, and can typically help reinforce the matrices they are added into.

79
Multiple methods have been applied for preparation of HA materials, as reviewed in
several works [11]. Two major ways for synthesis of HA are solid state reactions and wet
methods. Solid state reactions usually give a stoichiometric and well-crystallized product,
but they require relatively high temperatures and long heat treatment time. Moreover,
sinterability of such HA powders is usually low since typically the surface energy is
previously lowered by high temperature reaction. In the case of HA fabrication, the wet
method includes three categories, hydrothermal technique, precipitation, and hydrolysis
of other calcium phosphates [11, 12]. Depending upon t he technique, materials with
various morphology, stoichiometry, and level of crystallinity can be obtained. In the
precipitation method, the temperature of the reaction rarely exceeds 100 ºC in order to
prepare nanosized HA. The shape of the crystals consists of particles, rods, fibers and
plates. Their crystallinity and calcium to phosphate (Ca/P) ratio depend strongly upon the
preparation conditions and are in many cases lower than those of well-crystallized
stoichiometric hydroxyapatite. The hydrothermal technique usually yields HA with a
higher degree of crystallinity and with a Ca/P close to the stoichiometric value. Their
crystal size is in the range of nanometers to millimeters. Hydrolysis of tricalcium
phosphate, monetite, brushite, or octacalcium phosphate requires low temperatures and
results in micro-sized HA needles or blades, which are often highly nonstoichiometric
(Ca/P~1.5 to 1.71). There are many other alternative techniques of fabricating HA
powders, such as sol-gel [13, 14], flux method [15], electrocrystallization [16, 17], spray-
pyrolysis [18, 19], freeze-drying [20, 21], microwave irradiation [22, 23], mechano-
chemical method [24, 25], or emulsion processing [26, 27].

80
HA materials, especially fibers, have unique properties that could benefit biomedical
devices in terms of mechanical properties, as well as biocompatibility. With fiber-like
shape they could be used as secondary phase in a matrix, which could significantly
reinforce and toughen the main phase materials. Single crystal HA nanofibers have
extremely high tensile strength and modulus, which provides excellent properties as
reinforcing material. Chen et.al [28] reported that the addition of HA nanofibers in dental
composite could improve mechanical strength by 20~30%. The objective of this study is
to synthesize HA nanofibers with precipitation method, as well as to investigate a
reaction through same technique with much higher precursor content. A distinct
intermediate phase of dicalcium phosphate anhydrous (DCPA) was discovered through
the process, and the unique morphology evolution of products during the reaction was
carefully studied throughout the entire reaction time. The length of HA nanofiber is
100~150μm and the width is 50~100 nm, which leads to the aspect ratio up to 1000.
Biocompatibility of such HA nanofibers was studied as compared to titanium and HA
nanoparticles. Finally, design of experiments was applied to this study to investigate the
influence of each reactant for HA nanofiber synthesis with high precursor content.
2. Materials and Methods
2.1. Synthesis of HA Nanofibers
0.2 mol calcium nitrate tetrahydrate (Ca(NO3)2·4 h2O, C4955-1KG, Sigma, St.
Louis), 0.2 mol sodium dihydrogen phosphate dihydrate (NaH2PO4·2 h2O, 71505-1KG,
Sigma, St. Louis), 0.3 mol urea (CH4N2O, U5128-1KG, S igma, St. Louis), and 10 g
bovine gelatin (type B 225 bloom, Sigma, St. Louis ) were weighed out. Two 1000 mL
beakers were filled with in 1000 mL of distilled (DI) water. Ca(NO3)2·4 h2O and gelatin

81
were carefully added in one beaker and NaH2PO4·2 h2O and urea were added in the
other beaker. Two beakers were place on magnetic stirrers for 30 minutes to make sure
the chemicals were fully dissolved excluding the gelatin. The solution were mixed with 8
more liters DI water in a 10-liter reactor with heating mantle (Chemglass, Vineland, NJ)
and the temperature was kept at 95 ºC for 72 hours. The precipitates were then washed
with DI water and collected via vacuum filter. Extra moisture was removed by drying in
the over at 100 ºC overnight.
2.2. EDTA Titration for Ca2+ Ion Concentration
Calcium ion concentration was tracked by ethylenediaminetetraacetic acid (EDTA)
titration. Both Ca2+ solutions and EDTA are colorless so an indicator was needed to
signal the reaction completion. The indicator of choice was eriochrome black T which
forms a wine-red complex with Mg2+. A very small amount Mg2+ will be bound to the
indicator through most of the titration. When all of the Ca2+ has reacted with EDTA, the
Mg2+ in the indicator will react with the EDTA. The indicator then returns to its acidic
form which is a sky-blue and signals the end of the process. To maximize the EDTA-Ca
(or Group II A ion) complex formation and minimize formation of other metal complexes,
the pH for the reaction system is set at 10. T ypically, to prepare 0.01 mol/L EDTA
solution in 0.16 m ol/L sodium glycine buffer, approximately 0.88 g of dry disodium
EDTA salt and 4 g Sodium Glycine were added to about 200 mL of DI water in a 400 mL
beaker and swirl periodically. Dilute the prepared solution to 250 mL, and pH should be
around 10.

82
2.3. Synthesis of HA Nanofiber with High Precursor Content
From previous study the yield of each batch of regular HA nanofiber synthesis is
about 20 g rams per 72 hours. To enhance the efficiency of the yield per batch, higher
concentrations of recipe for HA nanofiber synthesis was investigated. 2 mol Ca(NO3)2·4
h2O, 2 mol NaH2PO4·2 h2O, 3 mol urea, and 50 g gelatin were weighed out. In 2 of the
1000mL beakers, fill in 1000mL DI water. Ca(NO3)2·4 h2O and gelatin were carefully
added in one beaker and mix the other two chemicals in the other beaker. Two beakers
were place on magnetic stirrers for 30 min to make sure the chemicals are fully dissolved
except gelatin. Mix both solutions with 8 more liters DI water in a 10-liter reactor and
keep the temperature at 95 ºC for 72 hours.
2.4. Scanning Electron Microscopy
Samples were obtained at various reaction time points to track the morphology of the
HA nanofiber growth. The time the reactor started being heated was recorded as Time
Zero. At 1 hour, 2 hours, 3 hours, 4 hours, 5 hours, 6 hours and 24 hours, and 72 hours,
different samples were collected in 20 ml vials with pyrex pipettes from the middle of
reactor. The fiber were separated from liquid through vacuum filter and dried in the oven
at 100 ºC overnight.
Microstructures of the HA nanofibers were observed by Scanning Electron
Microscope (Quanta 600 FEG ESEM, FEI, Hillsboro, Oregon, USA). A small amount of
fiber was taken from each condition and was mounted on the aluminum stubs with carbon
adhesive disks on top. Samples with electron charging problems were coated with
platinum and partially covered by silver paint before it was observed. Samples were also

83
observed Energy Dispersive X-ray Spectroscopy (EDS) to characterize the Ca/P molar
ratio in the HA nanofiber.
2.5. pH value track
pH value of the reaction solution was tracked by measuring liquid samples obtained
through various reaction time. pH of each sample is measure by pH meter (6219 Micro
Computer based pH/mV/Temp Meter, Jenco Instruments, San Diego, CA).
2.6. X-Ray Diffraction and Crystal Size
Samples obtained at various reaction times were measured by powder X-ray
diffraction (XRD) to determine the phrase of the products as a function of time. X-ray
diffraction patterns were recorded on a Rigaku powder diffractometer with graphite-
monochromatized copper Kα1 radiation (X = 0.154 nm) generated at 40 kV and 44 mA.
All data were collected in a continuous scan mode (1° 2θ/min) on a strip-chart recorder.
According to Scherrer Equation [29], crystal size could be calculate as follows:
...………………….(1)
Where D is the crystal size, K is Scherrer contant (0.89 * 57.3), λ is the wavelength of
the radiation from Cu Kα1 which is 0.154056 nm, b is the peak width at half height and θ
represents to the peak position, which correspond to the two main HA peaks 31.66º and
32.76º. The result from the average of these two peaks would be the true size of HA
crystal.
2.7. Biological Evaluation of HA Nanofiber [30]
Cell studies were performed with MC3T3-E1 cell line (American Type Culture
Collection, VA). Cells were maintained in modified alpha minimum essential medium (α-
MEM) without ascorbic acid (GIBCO), supplemented with 10% fetal bovine serum (FBS)

84
and incubated in a humidified atmosphere at 37 ºC and at 5% CO2. All cell studies were
performed using cell passages below 10. After an incubation of 4 hours at 37 º C, the
liquid was aspirated and the insoluble formation produced was dissolved in
DMSO/Ethanol (DMSO:Ethanol=1:1) solution. The optical densities were measured at
540 nm (Fusion TM alpha microplate analyzer, A Packard BioScience Company). The
MTT assay, using 3-(4,5- dimethylthiazol-2-yl)-2,5-diphenyltetrazolium bromide (MTT),
is applied to evaluate cell vitality and proliferation. Mitochondrial dehydrogenases of
living cells reduce the tetrazolium ring, yielding a blue formazan product, which can be
measured spectrophotometrically; the amount of formazan produced is proportional to the
number of viable cells present [31]. Ti-6Al-4V plates and HA nanoparticles were used as
controls.
2.8. Design of Experiment Study on Quality of High Reactant Concentration HA
Nanofiber Synthesis
Table 4.1 The level of design for each reactant of high reactant concentration HA
nanofiber synthesis
Na/Ca Urea Gelatin
L1 0.1 mol/L 0.15 mol/L 2.5 g/L
L2 0.2 mol/L 0.3 mol/L 5 g/L
L3 -- 0.45 mol/L --
To find out the influence of each of the chemicals on t he morphology and crystal
growth of high reactant concentration HA nanofiber, a series of groups were designed
according to Design of Experiment (DOE) with different strength of each factor. In order

85
to maintain the final product to be hydroxyapatite, Ca-P ratio was keep the same as the
original ratio, in which Ca(NO3)2·4 h2O and NaH2PO4·2 h2O have concentration ratio of
1:1. In fact Ca(NO3)2·4 h2O and NaH2PO4·2 h2O were treated as one group in DOE
represented by Na/Ca. Urea and gelatin are the other two groups. It is hypothesized that
the preferential level of gelatin is 2.5~5 g/L, urea is 0.15~0.45 g/L and Na/Ca is 0.1~0.2
mol/L. Table 4.1 shows the designed level with concentration Ca(NO3)2·4 h2O,
NaH2PO4·2 h2O, urea and gelatin. All the experiments were carried out at 95 ºC in 6L
volume for 72 hours.
Table 4.2 The detailed design according to DOE.
Group Level of Factor
Na/Ca Urea Gelatin
1 L1 L1 L1
2 L1 L3 L2
3 L2 L2 L1
4 L2 L3 L2
5 L2 L3 L1
6 L1 L2 L2
7 L2 L1 L1
8 L2 L2 L2
9 L1 L1 L2
10 L2 L1 L2
11 L1 L3 L1
12 L1 L2 L1

86
Commercial software JMP@ 7 was used to perform the DOE result analysis. The
least square fit model was applied with two responses, fiber length and the percentage of
impurity. Both responses were measured through Image J software on four SEM images
per condition with 100 HA nanofibers with magnification of 500 t imes. Percentage of
impurity is defined as the size of the area with impurity divided by the entire image area.
Figure 4.1 Solubility diagram of calcium phosphate compounds[32]

87
3. Result and Discussion
3.1. Synthesis of HA Nanofiber and Characterization
Chow revealed the solubility diagram of the common calcium phosphate compounds
[32], shown in Figure 4.1, in which he revealed that with change of pH and
concentrations of acids and bases (such as hydrochloride acid and sodium hydroxide) in
solution each compound has different solubility.
XRD pattern for 2 h, 3 h, 9 h, 24 h and 72 h as-obtained products shown in Figure 4.2
confirmed the existence of DCPA in the first few hours. At 2 h, 3 h and 9 h XRD results,
26.44º and 30.16º can be assigned to triclinic single crystal DCPA (PDF#01-071-1760),
and correspond to (002) and (120) plane. For the 24 h and 72 h as-obtained samples, all
the diffraction peaks can be assigned to hexagonal HA (PDF#1-071-5049). Unlike the
usual three-dimensional HA crystals, the XRD patterns appear to be much simpler in this
HA nanofiber. The intensity of (hk0) planes, such as (120), (300) and (130), increased
significantly, while (211) plane didn’t change intensity over time. All the other (00l)
peaks were missing, which imply the HA fiber growth is preferential along [001]
direction. Based on Scherrer’s Equation, the crystal size of as-obtained products at 3 h, 9
h, 24 h and 72 h according to peak (211) is 16.33 nm, 16.33 nm, 17.01 nm and 17.37 nm,
respectively. The same products according to (300) have crystal size of 18.68nm, 21.23
nm, 21.24 nm and 21.72 nm, respectively. This also indicates the crystal along (211)
didn’t grow as much as the crystal along (300) direction. These results are approximate
and assume the crystal is cubic because the constant for hexagonal crystallites is not
available in literature.

88
Figure 4.2 XRD patterns of as-obtained products through various reaction times. “#”
represents DCPA peaks (PDF#01-071-1760) and “+” represents HA peaks (PDF#01-071-
5049).
Zhan et al. reported the single crystal to single crystal transformation of octacalcium
phosphate (OCP) to HA [33-36] with similar experimental approach; however, our
current study has very distinct result from their reported data. Octacalcium phosphate
(OCP) was not found from XRD result within any time period, although there is a
possibility for OCP to exist as intermediate phase, it most likely isn’t stable and cannot be
detected with XRD. Instead, DCPA was detected clearly with their unique 2θ at 26.44º
and 30.16º at 2 h, 3 h and 9 h reaction products.

89
Figure 4.3 pH value in the solution and Ca/P ratio in as-obtained products through
various reaction times of HA nanofiber synthesis
pH value of reaction solutions was recorded after they were collected at different
reaction times and cooled to room temperature. Figure 4.3 shows the pH value change in
the reactant solution as a function of time in a logarithmic coordinates. From time zero
which is defined as the point before the solution was heated, the pH was 4.6. Between 1 h
to 5 h reaction time the pH of the solution fluctuated but slowly increased to 4.7. In the
solubility diagram it s hows CaHPO4 (DCPA) and hydroxyapatite (HA) are the least
soluble phase around pH 4~5. This implies that in the beginning of the reaction there
could have been some DCPA precipitated due to the low pH.
In addition, Ca/P ratio change measured by EDS is shown in Figure 4.3 as well. Note
in DCPA the Ca/P ratio is 1, and in HA it is 1.67. In 1 h, 2 h, 3 h, 4 h and 5 h reaction

90
products, the precipitates have an average Ca/P ratio of 1.46 ± 0.06, 1.31 ± 0.15, 1.35 ±
0.23, 1.38 ± 0.20 and 1.41 ± 0.29, respectively. In some areas of the product during the
first 5 h, Ca/P ratio could be as low as 1.1 which is very close to that of DCPA, which
matches the XRD result from Figure 4.2. This indicates in the initial 5 hours the reaction
product could be mixture between DCPA and HA, which leads to Ca/P ratio overall to be
around 1.3~1.4, considering other calcium phosphate compounds are at least one order of
magnitude more soluble (shown in Figure 4.1). In 24 h, 48 h and 72 h reaction products,
it is clearly shown the Ca/P ratio has increased to 1.6~1.7, with pH value at each reaction
time 6.0, 7.8, 8.5, r espectively. According to the solubility phase diagram, around pH
5~10, HA is the least soluble calcium phosphate. This indicates that along with the
hydrolysis of urea, pH in the solution slowly increased; all the DCPA re-dissolved into
the reaction solution, and only HA nanofibers were precipitated as the final product.
According to the amount of Ca(NO3)2·4H2O reactant that was added in the solution,
Ca2+ ion concentration would be 800 ppm. However, from the EDTA titration result, after
the reaction started Ca2+ ion concentration has always been around 1~3 ppm. This does
not correlate to the slow growing of HA nanofiber which should lead to the slow decrease
of Ca2+ concentration. C. Shu et al. [37] studied the influence of gelatin solution on the
HA crystallites formation and discussed about the interaction between Ca2+ ion and R-
(COO)- ions of gelatin molecules. After gelatin breaks down into multiple amino acids,
each of the amino acid contains different carboxyl groups. These carboxyl groups could
form covalent bonds with Ca2+ ion and hence greatly limit the amount of free Ca2+ ions
which desirably react with PO43- to form crystalline DCPA or HA. This mechanism is
crucial for the formation of nano-scale HA fibers. In addition, various amino acids from

91
gelatin breakdown that are rich in carboxyl and amino surface functional groups also act
as the surfactant capping agent that controls HA to grow only in one dimension [10].
Figure 4.4 Microstructures of HA nanofiber synthesized at 1 h (a), 3 h (b), 5 h(c), 24 h (d)
and 72 h (e) as-obtained products. Scale bars in all micrographs are 100μm.
Microstructure of HA nanofiber was examined by extracting samples at various
reaction times and observed under SEM. 1 h, 3 h, 5 h, 24 h, and 72 h (shown in Figure
4.4). Short rods and small particles appear in solution as early as 1 hour. After 24 hours
the rods begin to grown into longer fibers and particles observed from 1 h to 5 h appear to
vanish. The particles could be made up of DCPA, which was then re-dissolved into
reaction solution at higher pH between 9 h and 24 h. The dissolution of DCPA became
reservoir of Ca2+ and PO43- for further precipitation of HA nanofiber.

92
3.2. Synthesis and Characterization of HA Nanofiber with High Precursor Content
Figure 4.5 XRD patterns of as-obtained products through various reaction times of high
reactant concentration HA nanofiber synthesis. “#” represents DCPA peaks (PDF#01-
071-1760) and “+” represents HA peaks (PDF#01-071-5049).
XRD patterns of 2 h, 3 h, 9 h, 24 h, 48 h and 72 h as-obtained products from high
reactant concentration HA nanofiber synthesis are shown in Figure 4.5. At reaction time
of 2 h, the texture of the product looked like powder instead of cotton. Unlike the weak
DCPA peaks of XRD in regular HA nanofiber synthesis at 2 h reaction time, XRD shows
all the peaks of 2 h reaction time of high reactant concentration HA nanofiber product
correspond to triclinic DCPA (PDF#01-071-1760) precisely, and no HA peak was
observed. As the reaction continued, the peaks of DCPA became sharper at 3 h,

93
indicating the crystal growth of DCPA, and then decreased at 9 h, implying the re-
dissolution of DCPA at higher pH. However, no HA peaks was foun in the 9 h as-
obtained product. After 24 h reaction, the collected product started to have cotton-like
texture. XRD pattern showed major HA peaks at (211) and (300), although DCPA peak
at (002) and (120) indicate residual DPCA still existed at this point. DCPA (002) peak
shift to HA (002) peak at 48 h, while (120) disappeared at 48 h. At 72 h, all peaks
correspond to hexagonal HA (PDF#01-071-5049) and the reaction was deemed complete.
Figure 4.6 pH values in the solution and Ca/P ratio in as-obtained products through
various reaction times of high reactant concentration HA nanofiber synthesis
The pH values in the reactant solution and Ca/P ratio of as-obtained products at
different reaction times in synthesis of HA nanofiber with high precursor content are
shown in Figure 4.6. The pH value and Ca/P ratio started around 2.5 a nd 1.12

94
respectively. The low solubility of DCPA at low pH shown in Figure 4.1 and strong
DCPA peaks in 2 h XRD pattern in Figure 4.5 indicate that the majority of the reaction
product before 2 h is DCPA precipitate. As the reaction continued to 5 h, the increase of
pH was almost linear and increased to 6.8 at the end of 5 h. Ca/P ratio followed the same
trend and increased up to 1.43. T his could imply DCPA particles was re-dissolving
gradually along with increasing of the pH, and HA started to precipitate. Since HA has a
Ca/P ratio of 1.67, the higher percentage of HA lead to a higher Ca/P ratio in the overall
reaction product. After 24 h both pH value in the solution and Ca/P ratio of as-obtained
products slowly increased, and reached to 8.5 and 1.70, respectively.
Microstructure under SEM shows unique morphology evolution from micron-sized
DCPA plates to nano-sized HA fiber (shown in Figure 4.7), possibly involving
dissolution-precipitation process. At 1 h reaction time large DCPA plate precipitated and
smaller plates split from the large ones. Nearly all the plate appeared to stand alone after
3 h, with large plates dissolving and their size decreasing to smaller plates, and fiber-like
structure began to appear. At 5 h reaction more HA fibers started to precipitate and less
DCPA plates were left, which indicates the further dissolving of DCPA was in progress.
However, based on XRD pattern no HA was detected before 9 h, which could be due to
DCPA and HA have overlapping peaks. Starting from 24 h, large quantities of HA
nanofibers was seen and only a few DCPA plates were left and observed. At this moment
the pH value of the solution has increased to 7, and DCPA is much more soluble than HA
around this pH (shown in Figure 4.1). Even less DCPA appeared at 48 h and 72 h, due to
the continuously increased pH of the reaction solution. In the final products at 72 h,

95
Figure 4.7 Microstructures of 1 h (a), 3 h (b), 5 h (c), 24 h (d), 48 h (e) and 72 h (f) as-
obtained products of high reactant concentration HA nanofibers synthesis.

96
small amount of DCPA particles was found at the bottom of the reactor from the
incomplete transformation to HA, which indicates reaction time longer than 72 h could be
desirable. The DCPA particles were easily separated from the HA nanofibers which were
suspended throughout the solution in contrast to the large particles that settled to the
bottom of the reactor. HA nanofibers synthesis with high precursor content increased the
yield per batch significantly, which demonstrated it is capable of making HA nanofibers
with excellent quality while being cost-effective.
Figure 4.8 Biocompatibility evaluation of Ti-6Al-4V (Ti), HA nanoparticles (HA NP),
and HA nanofibers (HA NF) on the bottom of wells using MC3T3-E1 cell lines by MTT
assay. Values are mean ± STD, n=5, *p<0.05 compared to Ti and **p<0.05 compared to
HA NP. The absorbance values are proportional to the number of viable cells.
Compared to the regular HA nanofibers synthesis, this reaction has much more
DCPA appear as transient phase. This could be due to the lower pH at the beginning of
the reaction. A unique crystal growth mechanism is presented as dissolution-evolution-
precipitation process. A more detailed study is needed for the quality control of synthesis

97
of HA nanofiber with high precursor content to determine the influence of each precursor
on the reaction.
Cytotoxicity test was carried out with two controls, titanium (Ti) and HA
nanoparticles. Each data point in Figure 4.8 is based on 15 testing results (5 cell wells X
3 tests). It appears that there is no significant difference between HA nanofibers and Ti
alloy in terms of cytotoxicity, while titanium alloy could be considered as a positive
control in this case. It was concluded that HA nanofibers are significantly better than HA
nanoparticles in spite of the fact that they have the exactly same chemical composition.
HA nanoparticles either impede cell proliferation or decrease the cell viability. Sun et al.
[38, 39] had investigated the effect of HA particles with different size on osteoblasts,
myoblasts, and fibroblasts and found that the smaller HA particles have greater impeding
effect on cell proliferation compared to large HA particles. This type of toxicity depends
on direct contact between cells and particles and may be associated with membrane
damage. With similar concentration/volume fraction of HA nanofibers and HA
nanoparticles, it is conceivable that there are high possibility for the HA nanoparticles to
interact more with cells and it might also be easier for HA nanoparticles to get into the
cell considering the larger size of HA nanofibers. Previous in vivo tests shows that HA
[40-43] and tricalcium phosphate (TCP) [44, 45] improve osteoconductivity and bone
bonding properties, so it is unlikely HA nanoparticles and nanofibers will have
significant detrimental effects on animal or human bodies. It can be concluded that HA
nanofibers have good biocompatibility and can be used as reinforcement of other
biomaterials without degrading the overall biological properties.

98
3.3. DOE Trials and Results
Table 4.3 T he fiber length and impurity percentage of HA products from different
DOE trials.
Trial Level of Factor Fiber length
Impurity (%) Na/Ca Urea Gelatin Length (μm) STD (μm)
1 L1 L1 L1 83.85 31.73 0.76
2 L1 L3 L2 114.19 44.93 11.71
3 L2 L2 L1 0.00 0.00 100.00
4 L2 L3 L2 27.75 22.80 2.02
5 L2 L3 L1 74.69 20.52 72.34
6 L1 L2 L2 27.75 22.80 2.02
7 L2 L1 L1 82.55 19.94 8.03
8 L2 L2 L2 56.73 22.08 1.06
9 L1 L1 L2 90.45 23.86 4.68
10 L2 L1 L2 0.00 0.00 100.00
11 L1 L3 L1 76.15 14.44 0.00
12 L1 L2 L1 66.23 25.04 1.89
The measured results according to SEM images are shown with respect of fiber
length and percentage of impurity in Table 4.3. Via utilizing a least square fit model, two
types of analysis were studied, one is assuming Na/Ca, urea and gelatin all act as
independent factor, the other is assuming the interaction of urea and gelation on top of the
other three factors.
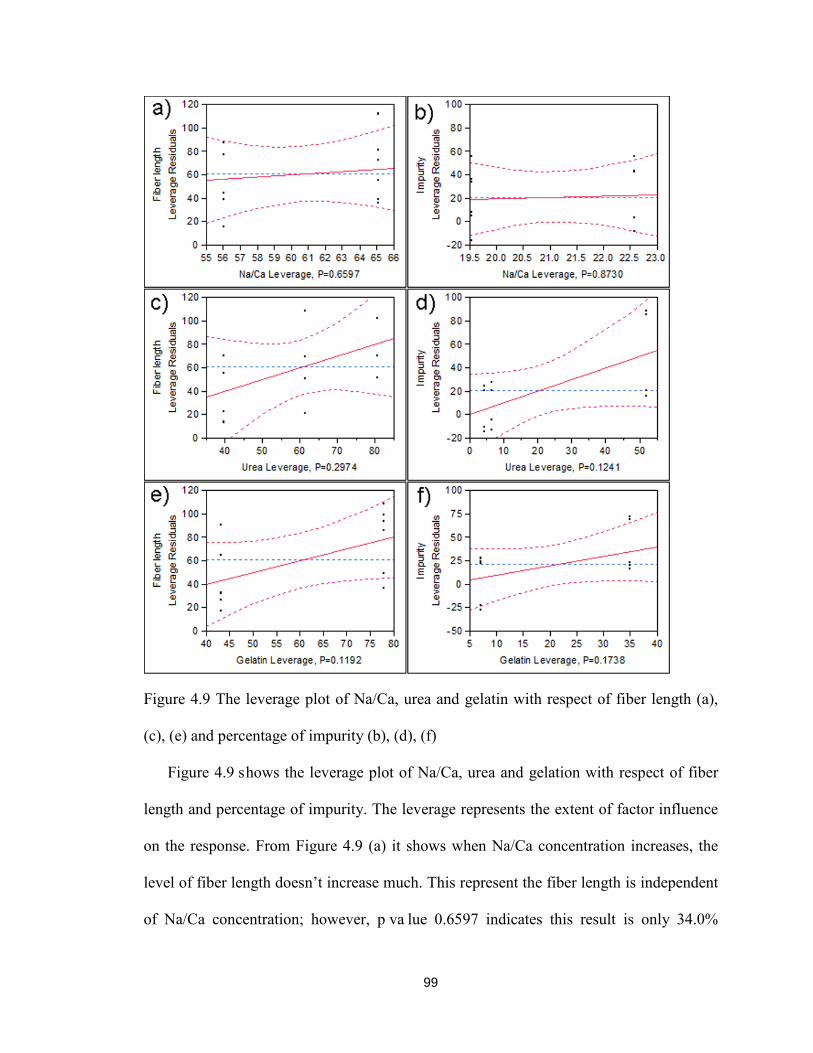
99
Figure 4.9 The leverage plot of Na/Ca, urea and gelatin with respect of fiber length (a),
(c), (e) and percentage of impurity (b), (d), (f)
Figure 4.9 shows the leverage plot of Na/Ca, urea and gelation with respect of fiber
length and percentage of impurity. The leverage represents the extent of factor influence
on the response. From Figure 4.9 (a) it shows when Na/Ca concentration increases, the
level of fiber length doesn’t increase much. This represent the fiber length is independent
of Na/Ca concentration; however, p va lue 0.6597 indicates this result is only 34.0%

100
reliable. Figure 4.9 (b) and (c) indicate the levels of urea and gelatin have more influence
on fiber length, and fiber length is proportionate to the concentration of urea (60.3%
reliable) and gelatin (88.1% reliable). The fiber length increases with the level of urea
and gelatin increasing. Moreover, the slope of Figure 4.9 (b) is larger than (c) indicates
urea contributes more to fiber length.
Similarly, Na/Ca does not affect the percentage of impurity (only 16.7% reliable);
level of urea contributes to the percentage of impurity the most (87.6% reliable);
concentration of gelatin also affects percentage of impurity to some extent (82.7%
reliable).
The influences of each factor including the interaction of urea and gelatin
(represented by urea*gelatin) on fiber length and percentage of impurity are shown in
Figure 4.10. Once again, the leverage plot of Na/Ca (Figure 4.10 (a) and (b)) does not
show a r elative relationship between Na/Ca and the responses, which indicates the
concentration of Ca(NO3)2·4 h2O and NaH2PO4·2 h2O does not have effect on the fiber
length (43.0% reliable) and impurity content (82.9% reliable). The concentrations of urea
(Figure 4.10 (c), 77.7% reliable) and gelatin (Figure 4.10 (e), 88.6% reliable) both have
proportionate effect on the fiber length, and definitely have proportionate effect on
impurity level of final product (Figure 4.10(d), >99.99% reliable and (f), >99.99%
reliable). Most interestingly, urea*gelatin has the most influence on both fiber length
(Figure 4.10 (g), 75.0% reliable) and level of impurity (Figure 4.10 (h), >99.9% reliable)
of final products.

101
Figure 4.10 The leverage plot of Na/Ca, urea, gelatin and urea*gelatin with respect of
fiber length (a), (c), (e), (g) and percentage of impurity (b), (d), (f), (h)
102
The two types of results give a relatively clear picture for the quality control of high
reactant concentration HA synthesis products. The concentration of Ca(NO3)2·4H2O and
NaH2PO4·2H2O does not affect the quality as much as that of urea and gelatin do,
possibly because the formation of DCPA limited the concentration of the Ca2+ and PO43-
during the HA nanofiber growth. It is feasible to enhance the efficiency of the HA
nanofibers yield with good quality by increasing the main chemical concentration.
However, the level of urea and gelatin needs to be carefully controlled, in order to grow
ultra-long HA nanofibers while limiting impurities, due to the strong interaction observed.
When the level of urea*gelatin increases, the fiber length of HA product and the amount
of impurity increases simultaneously, thus the optimal level to achieve long fiber and less
impurity can be achieved in an environment with moderate concentration of urea and
gelatin. However, the ratio of the two factors will need to be further investigated.
4. Conclusion
High aspect ratio HA nanofibers was synthesized successfully. From solubility point
of view it is confirmed that DCPA appeared as distinct transient phase in the early stage
of the reaction and was re-dissolved as the pH of the reaction solution increased. The
dissolution of DCPA can be seen as a form of reservoir for Ca2+ and PO43- for further HA
precipitation. As pH increased in the solution, HA nanofibers nucleated and grew in one
dimension preferentially for the final product, which could be contributed from both
gelatin and urea, acting as surfactant for the capping effect. Synthesis of HA nanofibers
with high precursor content was achieved successfully and a unique morphology
evolution was observed as dissolution-evolution-precipitation, and the final product of
high precursor content HA nanofibers synthesis was confirmed to be only HA.

103
Cytotoxicity study shows that HA nanofibers have better cell viability than both Ti alloy
and HA n anoparticles. Quality control of HA nanofibers synthesis with high precursor
content was investigated and influence of each reactant was determined; urea and gelatin
have great influence on the fiber length and the amount of impurity.
5. Reference
1. Hench, L.L., Bioceramics: From Concept to Clinic. Journal of the American Ceramic Society, 1991. 74(7): p. 1487-1510.
2. Hu, Y., et al., Development of a porous poly(L-lactic acid)/hydroxyapatite/collagen scaffold as a BMP delivery system and its use in healing canine segmental bone defect. Journal of Biomedical Materials Research Part A, 2003. 67A(2): p. 591-598.
3. Jarudilokkul, S., W. Tanthapanichakoon, and V. Boonamnuayvittaya, Synthesis of hydroxyapatite nanoparticles using an emulsion liquid membrane system. Colloids and Surfaces A: Physicochemical and Engineering Aspects, 2007. 296(1-3): p. 149-153.
4. Fujii, S., M. Okada, and T. Furuzono, Hydroxyapatite nanoparticles as stimulus-responsive particulate emulsifiers and building block for porous materials. Journal of Colloid & Interface Science, 2007. 315(1): p. 287-96.
5. Mobasherpour, I., et al., Synthesis of nanocrystalline hydroxyapatite by using precipitation method. Journal of Alloys and Compounds, 2007. 430(1-2): p. 330-333.
6. Uota, M., et al., Synthesis of High Surface Area Hydroxyapatite Nanoparticles by Mixed Surfactant-Mediated Approach. Langmuir, 2005. 21(10): p. 4724-4728.
7. Gonzalez-McQuire, R., et al., Synthesis and characterization of amino acid-functionalized hydroxyapatite nanorods. Journal of Materials Chemistry, 2004. 14(14): p. 2277-2281.
8. Liu, Y., D. Hou, and G. Wang, A simple wet chemical synthesis and characterization of hydroxyapatite nanorods. Materials Chemistry and Physics, 2004. 86(1): p. 69-73.
9. Yanjie, Z. and L. Jinjun, The transformation of single-crystal calcium phosphate ribbon-like fibres to hydroxyapatite spheres assembled from nanorods. Nanotechnology, 2008. 19(15): p. 155608.

104
10. Zhan J, T.Y.H.C.J.C.C. and C.Y. Mou, Biomimetic formation of hydroxyapatite nanorods by a single-crystal-to-single-crystal transformation. Adv. Funct. Mater., 2005. 15(12): p. 2005.
11. Aoki, H., Science and medical applications of hydroxyapatite1991: Ishiyaku Euroamerica.
12. LeGeros, R.Z., Calcium phosphates in oral biology and medicine1991: Karger.
13. Liu, D.M., T. Troczynski, and W.J. Tseng, Water-based sol-gel synthesis of hydroxyapatite: process development. Biomaterials, 2001. 22(13): p. 1721-30.
14. Bezzi, G., et al., A novel sol–gel technique for hydroxyapatite preparation. Materials Chemistry and Physics, 2003. 78(3): p. 816-824.
15. Teshima, K., et al., Well-Formed One-Dimensional Hydroxyapatite Crystals Grown by an Environmentally Friendly Flux Method. Crystal Growth & Design, 2009. 9(6): p. 2937-2940.
16. Eliaz, N. and T.M. Sridhar, Electrocrystallization of Hydroxyapatite and Its Dependence on Solution Conditions. Crystal Growth & Design, 2008. 8(11): p. 3965-3977.
17. Yen, S.K. and C.M. Lin, Cathodic reactions of electrolytic hydroxyapatite coating on pure titanium. Materials Chemistry and Physics, 2003. 77(1): p. 70-76.
18. Aizawa, M., et al., Characterization of hydroxyapatite powders prepared by ultrasonic spray-pyrolysis technique. Journal of Materials Science, 1999. 34(12): p. 2865-2873.
19. Cho, J.S. and Y.C. Kang, Nano-sized hydroxyapatite powders prepared by flame spray pyrolysis. Journal of Alloys and Compounds, 2008. 464(1–2): p. 282-287.
20. Deville, S., E. Saiz, and A.P. Tomsia, Freeze casting of hydroxyapatite scaffolds for bone tissue engineering. Biomaterials, 2006. 27(32): p. 5480-5489.
21. Lu, H., Z. Qu, and Y. Zhou, Preparation and mechanical properties of dense polycrystalline hydroxyapatite through freeze-drying. Journal of Materials Science: Materials in Medicine, 1998. 9(10): p. 583-587.
22. Liu, J., et al., Rapid formation of hydroxyapatite nanostructures by microwave irradiation. Chemical Physics Letters, 2004. 396(4–6): p. 429-432.
23. Parhi, P., A. Ramanan, and A.R. Ray, A convenient route for the synthesis of hydroxyapatite through a novel microwave-mediated metathesis reaction. Materials Letters, 2004. 58(27–28): p. 3610-3612.

105
24. Riman, R.E., et al., Solution synthesis of hydroxyapatite designer particulates. Solid State Ionics, 2002. 151(1–4): p. 393-402.
25. Toriyama, M., et al., Synthesis of hydroxyapatite-based powders by mechano-chemical method and their sintering. Journal of the European Ceramic Society, 1996. 16(4): p. 429-436.
26. Lim, G.K., et al., Processing of hydroxyapatite via microemulsion and emulsion routes. Biomaterials, 1997. 18(21): p. 1433-1439.
27. Bose, S. and S.K. Saha, Synthesis and Characterization of Hydroxyapatite Nanopowders by Emulsion Technique. Chemistry of Materials, 2003. 15(23): p. 4464-4469.
28. Chen, L., et al., BisGMA/TEGDMA dental composite containing high aspect-ratio hydroxyapatite nanofibers. Dental Materials, 2011. 27(11): p. 1187-1195.
29. Langford, J. and A. Wilson, Scherrer after sixty years: a survey and some new results in the determination of crystallite size. Journal of Applied Crystallography, 1978. 11(2): p. 102-113.
30. Chen, L., Unpublished data. 2008.
31. Calandrelli, L., et al., Biocompatibility studies on biodegradable polyester based composites of human osteoblasts: A preliminary screening. Journal of biomedical materials research, 2002. 59(4): p. 611-617.
32. Chow, L., Next generation calcium phosphate-based biomaterials. Dental materials journal, 2009. 28(1): p. 1.
33. Son, D.H., et al., Cation exchange reactions in ionic nanocrystals. Science, 2004. 306(5698): p. 1009.
34. Kaupp, G., Solid-state reactions, dynamics in molecular crystals. Current Opinion in Solid State and Materials Science, 2002. 6(2): p. 131-138.
35. Takahashi, S., et al., Single-crystal-to-single-crystal transformation of diolefin derivatives in nanocrystals. Journal of the American Chemical Society, 2002. 124(37): p. 10944-10945.
36. Atwood, J.L., et al., Guest transport in a nonporous organic solid via dynamic van der Waals cooperativity. Science, 2002. 298(5595): p. 1000.
37. Shu, C., et al., Synthesis and sintering of nanocrystalline hydroxyapatite powders by gelatin-based precipitation method. Ceramics International, 2007. 33(2): p. 193-196.

106
38. Sun, J.S., et al., Influence of hydroxyapatite particle size on bone cell activities: an in vitro study. Journal of biomedical materials research, 1998. 39(3): p. 390-397.
39. Sun, J.S., et al., Effect of hydroxyapatite particle size on myoblasts and fibroblasts. Biomaterials, 1997. 18(9): p. 683-690.
40. Durucan, C. and P.W. Brown, Biodegradable Hydroxyapatite–Polymer Composites. Advanced Engineering Materials, 2001. 3(4): p. 227-231.
41. Shikinami, Y. and M. Okuno, Bioresorbable devices made of forged composites of hydroxyapatite (HA) particles and poly--lactide (PLLA): Part I. Basic characteristics. Biomaterials, 1999. 20(9): p. 859-877.
42. Furukawa, T., et al., Biodegradation behavior of ultra-high-strength hydroxyapatite/poly (-lactide) composite rods for internal fixation of bone fractures. Biomaterials, 2000. 21(9): p. 889-898.
43. Hasegawa, S., et al., A 5-7 year in vivo study of high-strength hydroxyapatite/poly (l-lactide) composite rods for the internal fixation of bone fractures. Biomaterials, 2006. 27(8): p. 1327-1332.
44. Ignatius, A.A., et al., Composites made of rapidly resorbable ceramics and poly (lactide) show adequate mechanical properties for use as bone substitute materials. Journal of biomedical materials research, 2001. 57(1): p. 126-131.
45. Kikuchi, M., et al., In vitro change in mechanical strength of β-tricalcium phosphate/copolymerized poly-L-lactide composites and their application for guided bone regeneration. Journal of biomedical materials research, 2002. 62(2): p. 265-272.

107
Chapter 5 Apatite Cements containing Surface Modified
Hydroxyapatite Nanofibers
1. Introduction
Because of its chemical and crystallographic similarity to the carbonated apatitic
calcium phosphate mineral found in vertebrate skeletal systems, the calcium phosphate
cement (CPC) has been one of the most often used restorative materials for the repair of
human hard tissues [1-3]. In general CPC includes two main components, a powder and a
liquid. Upon mixing, the powder and the liquid would react and form one of the two
types of cement product: apatite and brushite. One promising recipe of CPC powder is
composed of tetracalcium phosphate (TTCP, Ca4(PO4)2O) and dicalcium phosphate
anhydrous (DCPA, CaHPO4). Such CPC powder reacts with aqueous cement liquid and
form a cement product hydroxyapatite (HA), containing nearly 40% porosity with size
from submicron to tens of microns [4-7]. The CPC has excellent osteoconductivity and

108
biocompatibility, and can be resorbed slowly in human body and replaced by new bone
cells [8-12]. However, the CPC is limited in its application [9, 12-14], since its
mechanical properties are not sufficient for more demanding load-bearing cases. Before
HA can be applied to load bearing cases, the improvement of mechanical properties has
to be achieved. Addition of strong fibers in to the CPC matrix could be a viable approach
for improving the mechanical properties.
From composite materials science perspective, there are three types of reinforcement:
1) particle-reinforced, includes commonly used concrete, which is reinforced by sand and
gravel (about 60-75 wt%); 2) fiber reinforced, such as steel rebar in concrete; and 3)
natural reinforced, includes wood or animal bones. Among these three types, fiber-
reinforced materials usually aim to improve the mechanical strength and stiffness, which
also includes three subcategories [15], 1) aligned continuous fiber or short fiber, which
improves strength along one direction, 2) random-oriented short fiber, which improves
strength along all directions, and 3) woven fibers, which provide multidirectional
strength. The well-known reinforcing mechanisms for fiber-reinforced composite
material include fiber pull-out and fiber bridging. To ceramic composite materials this
mechanism can increase the toughness, which is typically the weakest property for
ceramic.
CPC is known to have weak bending strength and low toughness. A few research
groups have investigated to reinforce CPC with different materials. Dos Santos et al. [16]
reported that incorporating up to 1.6% polyamide fibers had little effect of compressive
strength. Xu et al. showed a polyglactin-knitted mesh on t he tensile surface of CPC
increased the work of fracture value by nearly 100 times [17]. Sun et al. [18] reported

109
nearly two times increase of bending strength of CPC by adding 20% chitosan
biopolymer. Xu et al. [19, 20] claimed the use of resorbable polyglactin fiber to initially
improve the bending strength and following the degradation, led to formation of
macroporosity. Wang et al. [21] reported a 120% increase in the compressive strength
adding bio-mineralized carbon nanotubes in CPC. Muller et al. [22] added 30% HA
whiskers and increased bending strength of CPC by 60%.
Unique high aspect ratio HA nanofibers were fabricated using a biomimetic approach
and has been successfully incorporate in polymer matrix dental composites to improve
the mechanical properties [23]. It is hoped that such ultra-long HA nanofibers will also
improve the mechanical properties of apatite CPC. The objective of this study is to
reinforce apatite CPC with the high aspect ratio HA nanofibers and to study the effect of
the surface modification of reinforcing phase, HA nanofibers on t he composite. HA
nanofibers have a diameter ranging from 50 nm to 100 nm and have an aspect ratio of
500~1000. The fibers were dispersed and mixed into CPC matrix as reinforcing phase
before the surface modification, which served as the control of the experiment. These
same HA nanofibers were then surface-modified to carry longer polymer chains with
various surface functional groups before they are mixed into CPC matrix as
reinforcement. It was hypothesized that the surface functional group modification would
be effective and the specific functional group changes were proposed in details. Surface
modified HA nanofibers were then characterized with FTIR and surface functional
groups’ titration. Mechanical properties of these nanocomposites were reported and
evaluated.

110
2. Materials and Methods
2.1 Materials
Tetracalcium phosphate (Ca4(PO4)2O, TTCP) was synthesized by heating a mixture
of dicalcium phosphate anhydrous (CaHPO4, DCPA, J. T. Baker, 1430) and calcium
carbonate (CaCO3, CC, Aldrich, 310034). DCPA and CC were mixed with molar ratio of
1:0.9, to avoid the excess product of CaO, which would retard the setting reaction of the
final cement. The powder mixture of DCPA and CC was transferred to Small Benchtop
Muffle Furnace (Sentro Tech Corporation, Model #ST-1600C-445). The powder mixture
was heated at 1500 ºC for 6 hours and then quenched at room temperature immediately.
The sintered cake was broken and grinded with mortar and pestle until it passed 355 µm
sieves. It was then loaded into the planetary milling machine (Retsch, PM100, Newtown,
PA, USA) and milled for 2 hours.
Results from previous studies showed that medium-particle-size of TTCP and fine-
particle-size of DCPA yield the samples with high mechanical properties. DCPA was a
commercially obtained reagent-grade chemical (J. T. Baker, 1430). It was ground in
distilled water for 48 hours in planetary mill at 200 rpm to a median particle size of 1µm.
The ground DCPA was then collected by a vacuum filter and dried in an oven at 100 ºC
for 8 hours to remove any moisture. The dried DCPA was mixed with TTCP at molar
ratio of 1:1 in the media of pure ethanol or acetone with magnetic stirrer for 2 hours.
2.2 Fabrication of HA Nanofibers
0.2 mol calcium nitrate tetrahydrate (Ca(NO3)2·4H2O, C4955-1KG, Sigma, St.
Louis) and 10 g bovine gelatin (type B 225 bl oom, Sigma, St. Louis ) were carefully
added in one 1000 ml beaker with 1000 m l liter deionized water and mixed. 0.2 mol

111
sodium dihydrogen phosphate dihydrate (NaH2PO4·2H2O, 71505-1KG, Sigma, St.
Louis) and 0.3 mol urea ((NH2)2CO, U5128-1KG, Sigma, St. Louis) were mixed in the
another 1000ml beaker with 1000 ml deionized water. Two beakers were then stirred on
magnetic stirrers for 30 minutes to make sure the chemicals were completely dissolved.
It is important to note a small amount of gelatin could remain undissolved. Mix one
solution with 8 more liters DI water in a 10-liter reactor, and them mix in the other
solution, and keep the temperature at 95 ºC for 72 hour s. The final reaction products
were then washed with DI water and collected via vacuum filter. Water that was bound to
the surface of the products was reduced by drying at 100 ºC for 8 hours.
2.3 Surface Modified HA Nanofibers
Figure 5.1 The chemical structure of 12-aminododecanoic acid (a), dodecanoic acid (b)
and dodecanedioic acid (c)
Hydroxyapatite nanofibers prepared using the previously described method were
treated with different organic compounds to modify the surface chemistry of the material.

112
For the wet chemical method, three chemicals, 12-aminododecanoic acid, dodecanoic
acid and dodecanedioic acid, with molecular structures containing carboxylic acid
groups, as shown in Figure 5.1, and with high affinity with calcium in hydroxyapatite
were chosen for this study. After the treatment, depending on the type of fatty acid used
in specific modification, the treated HA nanofibers was named to Amine-HA, Methyl-
HA and Carboxyl-HA, shown in Table 5.1. The nanofibers were placed in an aqueous
solution containing the one of the three compounds and ammonium hydroxide was
utilized to increase the pH so that the carboxylic acid groups on t he compound would
become deprotonated. A fter thorough mixing, the solution was mixed by a magnetic
stirrer for 5 hours at 95 ºC. T his process forced the carboxylic acid containing
compounds to become adsorbed to the surface of the HA nanofibers. It is a n early
irreversible process since the calcium salts of the compounds have low solubility. After
the modification, the treated nanofibers were collected with vacuum filter, thoroughly
dried, and then rinsed with water and recollected. This procedure of vacuuming, drying
and rinsing was repeated three times. Finally, the treated fibers were rinsed once more
with water and centrifuged. T he samples were dried in air overnight to remove any
residual water.
Table 5.1 The name of modified HA nanofibers corresponds to the fatty acids
Type of Modification Fiber Name
12-aminododecanoic acid Amine-HA
dodecanoic acid Methyl-HA
dodecanedioic acid Carboxyl-HA

113
2.4 Surface Functional Groups’ Titration
Surface amino groups and surface carboxyl groups were measured through titration.
The treated HA nanofibers were immersed into an aqueous solution of Ponceau 2R (3-
hydroxy-4- (2,4-methylphenylazo)-2,7-naphthalenedisulfonic acid, sodium salt) for NH2
titration (10-5 mol/L-1) and an ethanol solution of thionin acetate (C12H9N3S·C2H4O2,
Sigma, St. Louis, MO) for COOH titration (10-5 mol/L-1). The reaction solution was
stirred at room temperature for 5 hours. Then, HA nanofibers were removed and washed
with deionized water, and the solution was titrated by measuring its UV absorption at
certain wavelength (λ=503 nm for NH2 titration, λ=605 nm for COOH titration) and
comparing it to that of a blank solution. The difference between the two absorptions was
proportional to the number of groups attached onto the nanofibers. Spectroscopic
titrations were run on a UV-visible spectrometer VarianDMS100 using a quartz cell (1
cm length). All the results are given in sites per gram of HA nanofibers.
2.5 Fourier Transform Infrared Spectroscopy (FT-IR)
1% untreated and surface modified HA nanofibers were added into dried potassium
bromide powder (KBr, 206391000, Acros Organics, NJ) and grinded with mortar and
pestle. The mixture was put into a hand press to make KBr pellet. Fourier Transform
Infrared Spectroscopy (Nicolet 4700, T hermo Scientific, Newington, NH) was used to
characterize the surface functional groups of untreated and surface modified HA
nanofibers. Each spectrum between 400 cm-1 to 4000 c m-1 was obtained at 4 cm-1
resolution averaging 128 scans in transmission mode.
2.6 Sample Preparation for Mechanical Testing
Solid phase of the specimens consisted of 27 wt% DCPA and 73 wt% TTCP (at

114
molar ratio of 1:1). Liquid phase was aqueous solution including 4% NaH2PO4, 4%
Na2HPO4, and 0.5 m ol/L sodium citrate (Na3C6H5O7). 2 wt%, 5 w t% and 10 wt%
untreated HA nanofibers were dispersed in ethanol with a ratio of 1 g HA nanofibers per
100 mL ethanol, before they were mixed in CPC matrix. Ultrasonic horn (450 Sonifier®,
Branson, Danbury, CT) was applied with 70% power and 50% duty cycle for 20 minutes.
2 wt% and 5 wt% surface modified HA nanofibers were dispersed in similar manner. The
type of modified HA nanofibers were named after its final surface functional group as
described in Table 5.1. The dispersed HA nanofibers was then mixed with CPC powder.
Table 5.2 The powder to liquid ratio in the HA-CPC nanocomposites and control samples
(both before and after surface modification of HA nanofibers)
HA Nanofibers wt% Powder to
Liquid ratio (g/mL)
Pure CPC Control: Powder to Liquid Ratio
0 3.33
2 2.86 2.86
5 2.50 2.50
10 2.00 2.00
In order to form a workable paste, solid phase was mixed with liquid phase in
different powder to liquid ratio (P-L ratio, referred to Table 5.2) with glass mortar and
pestle for 30 s econds to ensure the full contact between two phases. Previous result
showed adding too much liquid could increase the injectability, but would decrease the
mechanical strength significantly. In order to achieve relatively high mechanical strength,
the least amount of liquid that can form the workable paste was applied at each group in

115
our study. However, with the increase of HA percentage in CPC matrix, a decrease of P-
L ratio was applied to make the CPC paste at similar consistency (refer to Table 5.1). The
putty was put into molds to form the desired shapes. Two types of samples were
fabricated in the lab. 6 mm in diameter and 12 mm in height cylinder samples for
compressive strength measurement were made with the PTFE mold, while 25 mm long
and 4 mm wide sample bars for bending strength measurement were made with two
pieces of PTFE mold. Samples were kept in molds and placed at 100% humidity
environment in the incubator at 37 ºC until the mechanical testing. The samples were
demolded 1 hour before testing and their surface was slightly sanded.
To compare the reinforcing effect of HA nanofibers in CPC matrix, a set of control
samples with pure CPC was fabricated with the same powder to liquid ratio as HA-CPC
nanocomposites.
2.7 Compressive Strength and Bending Strength Measurement
The compressive strength (CS) and 3-point bending strength (BS) were measured on
a SMS TAHD Plus Texture Analyzer. The SMS TA.HDPlus Texture Analyzer recorded
the applied load (Newton) as a function of time (second). CS was calculated according to
Hooke’s Law (sample size n=5):
𝜎𝑐 = 𝐹 𝐴⁄
Where F is the load (N) at the fracture point, A is the cross section size (mm2), σc is
the CS (MPa). The experiment carries out with uniaxial compressive stress reached when
the material fails completely. The load cell applied was 250 kg and the crosshead speed
was 1 mm per minute.
BS was calculated according to 3 point bending setup (samples size n=5):

116
𝜎𝑓 =3𝐹𝐿
2𝑏𝑑2
where F is the load (N) at the fracture point, L is the length of the supporting span (mm)
which is 40 mm, b i s width of the sample (mm), and d i s the thickness of the sample
(mm), σf is the BS (MPa). The load cell applied was 50 kg and the crosshead speed was
0.5 mm per minute.
2.8 Scanning Electron Microscopy
Microstructures of different cement samples were observed by scanning electron
microscope (SEM, Quanta 600 FEG ESEM, FEI, Hillsboro, Oregon, USA). Several bulk
samples were collected following the bending strength test and coated with platinum
prior to SEM.
3. Result and Discussion
3.1 HA-CPC nanocomposite and characterization
Figure 5.2 SEM images of DCPA (a) and TTCP (b) particles
The setting process of CPC is complex, involving the dissolution of the starting
materials DCPA and TTCP, the precipitation of HA from the solution, and the
neutralization of acidic and basic by-products [24, 25]. Figure 5.2 shows SEM of DCPA

117
(a) and TTCP (b) particles, and it can be estimated that the mean particles size of DCPA
and TTCP is 1µm and 17µm, respectively. Typically DCPA has a fairly low solubility,
and TTCP has a relatively higher solubility. Thus a particle size ~1µm DCPA is desirable
and can achieve the rate of dissolution which is closer to that of TTCP, which will result
in adequate speed of HA precipitation. Applying sodium phosphate solution supplies
phosphate ions to compensate the deficiency of low dissolving rate of DCPA, and speeds
up the precipitation of HA.
Figure 5.3 The untreated HA nanofibers before (a) and after dispersion in ethanol (b).
Scale bar is 100μm.
HA nanofibers were synthesized and observed under SEM shown in Figure 5.3 (a).
The reactant solution includes gelatin made by denatured collagen. The gelation could
contain more than 20 types of amino acids. Each of the amino acid has amino group and
carboxyl group. Some amino acids also have hydroxyl groups. It was reported that the
existence of gelatin is the key factor that forces HA to grow in one dimension and form a
nanofiber structure, and gelatin binds on the surface of HA nanofibers [26]. This implies
that the surface of HA nanofibers has both amines (-NH2), carboxyls (-COOH) and

118
hydroxyls (-OH). Because the surface functional groups have both positive and negative
charges, HA nanofibers tend to form bundle structures when synthesized.
It is very important to break down the bundles and disperse HA nanofibers
homogeneously throughout CPC matrix. Here we use ultrasonic horn to disperse HA
nanofibers in ethanol first, and then mix in CPC powder. However, although the
dispersion of HA in ethanol was good (shown in Figure 5.3 (b)), after adding CPC
powder, the dispersion of HA appeared to decrease. Since HA and CPC are both calcium
phosphate compound, it is more likely for the nanofibers to aggregate of among the CPC
particles when they are being mixed.
3.2 Surface Modified HA-CPC nanocomposite and characterization
.
Figure 5.4 The schematic of surface modification with 12-aminododecanoic acid,
dodecanoic acid and dodecanedioic acid

119
As discussed above, breakdown of gelatin in the reactant solution could induce
various amino acids to attach to HA nanofibers surface. This indicates the surface of HA
nanofibers has both amines (-NH2) and carboxyls (-COOH) besides the hydroxyls (-OH).
Surface modification in this study is based on t his hypothesis. Figure 5.4 shows the
schematic of surface modification with these chemicals.
Figure 5.5 Surface modified HA nanofibers, Amine-HA (a), Methyl-HA (b) and
Carboxyl-HA (c). Scale bard is 100μm.
Figure 5.6 The possible changes of surface functional groups after the surface
modification.

120
During the surface modification, OH, COOH, and NH2 on HA nanofibers surface
would react with COOH and or NH2 group on t he three modification chemicals, 12-
aminododecanoic acid, dodecanoic acid and dodecanedioic acid. Figure 5.5 shows the
microstructure of HA nanofibers after the modification. No obvious morphology change
were observed.
02468
101214
Num
ber o
f Ca
rbox
yl G
roup
spe
r gra
m o
f HA
(e17
)
0
2
4
6
8
10
Num
ber o
fAm
ino
Gro
ups
per g
ram
of H
A (e
16)
Type of ModificationCarb
oxyl H
A
Methyl H
A
Amine HA
Untrea
ted HA
Figure 5.7 Number of surface functional group per gram of HA nanofibers after the surface
modification with 12-aminododecanoic acid, dodecanoic acid and dodecanedioic acid
The reactions during the modification and the possible change of the surface
functional groups on H A nanofibers could be complex, but can be simplified to the
schematic shown in Figure 5.6. Essentially, 12-aminododecanoic acid (NH2-COOH)

121
should increase the number of surface amine group and keep the number of surface
carboxyl group. Dodecanoic acid (CH3-COOH) should decrease the number of surface
amine group but keep carboxyl group. Dodecanedioic acid (COOH-COOH) would
decrease amine group and increase carboxyl group. Result from surface functional
groups’ titration shown in Figure 5.7 confirmed this hypothesis. The number of carboxyls
on one gram of Carboxyl-HA appears to be nearly two times as much as that of untreated
HA nanofibers. Meanwhile, the number of amino groups on each gram of Amino-HA
appears to be two times as much as untreated HA. It is important to note that the reaction
extent may not be 100%, due to the structure of the HA bundles, which hinders the
modification chemicals from reacting with nanofibers surface inside of the bundle.
Table 5.3 Diameter of HA nanofibers/bundles with respect to total surface area per gram
of HA nanofibers
Diameter of HA (nm)
Total Surface Area per gram of HA
(nm2) 100 1.27E19
500 2.54E18
2000 6.45E17
To quantify the effect of bundling structure on t he surface modification, 3 s izes of
HA fibers/bundles were considered: 100 nm, 500 nm and 2000 nm in diameter. Only the
outside HA surface in the bundles would be modified with the new functional groups.
Fiber length was assumed to be 50 µ m. The cross section of HA nanofibers would be
hexagonal. Table 5.3 shows the amount of surface area each gram of HA nanofiber would
have. Assuming the average bundle size of HA nanofibers is 2000 nm, Table 5.4 shows

122
the amount of amino and carboxyl groups that were measured through surface functional
group titration.
Table 5.4 Number of surface functional groups (amino and carboxyl) per nm2 of HA
bundle surface, assuming the bundle size is 2000 nm in diameter, 50000 nm in length
Type of Modification Amino Groups Carboxyl Groups
Untreated HA 0.08 ± 0.04 1.21 ± 0.06
Amine HA 0.13 ± 0.02 1.10 ± 0.59
Methyl HA 0.07 ± 0.06 1.08 ± 0.10
Carboxyl HA 0.06 ± 0.04 1.90 ± 0.15
The infrared spectra of untreated HA nanofibers and three types of surface modified
HA nanofibers provide a number of spectral details indicating the specific functional
groups (shown in Figure 5.8). Hydroxyl stretch was observed at 3569 cm-1 at all samples
from HA lattice. Broad band 970~1190 cm-1 is present in all spectra and can be assigned
to phosphate band, in which 962 cm-1 is PO43- v1 mode,1033 cm-1 is PO4
3- v3 mode, and
1145 cm-1 is HPO42- band. Phosphate v4 mode is present at 510~670 cm-1. At 472 cm-1
shows the phosphate v2 mode. The broad absorption band around 3000~3600 cm-1
represents the water bending mode. Meanwhile, bands at 1639 cm-1 and 1546 cm-1 are
attributed to amino and carbonyl groups in the gelatin and 1458 cm-1 and 1394 cm-
1 correspond to the vibration of COO-. The strong absorption peaks at 2852 cm-1 and 2921
cm-1 are shown on both Amine-HA and Methyl-HA spectra, which represents the
stretching mode of C-H group of corresponding types of acid molecules attached to HA
surface after the modification. However, no s uch peaks exhibit from the spectrum of

123
Carboxyl-HA, whose spectrum showed a much lower transmission percentage. This
could be due to slight differences in the sample preparation. The band at 3200 cm-1 on
Amine-HA indicates the stretching mode of NH2 group.
Figure 5.8 FTIR of Methyl-HA nanofibers (a), untreated HA nanofibers (b), Amine-HA
nanofibers (c), and Carboxyl-HA nanofibers (d).
3.3 Mechanical Properties of HA-CPC nanocomposites
The hypothesis was HA nanofibers can disperse and spread into the CPC matrix and
function as reinforcement during sample failing through fiber-pull out mechanism. Fiber
pull-out effect can be seen under SEM at fracture surface (shown in Figure 5.9).
Compressive strength and 3-point bending strength of CPC reinforced with 0 w t%, 2
wt%, 5 w t% and 10 w t% are shown in Figure 5.10. However, compressive strength
decreases rapidly while the percentage of HA increases. This could be due to the

124
inhomogeneous dispersion of HA nanofibers in CPC matrix. CPC is a brittle, micro-
porous material. To increase its mechanical strength one has to either increase the
fracture toughness or to decrease the flaw size [27]. The inhomogeneity of HA nanofibers
functioned as defects of the structure (shown in Figure 5.4, arrows point out the location),
which leads to the failure of the material. This also explains why CPC with 10 wt% HA
Figure 5.9 HA nanofibers aggregate inside CPC with 0wt% (a), 2 wt% (b), 5 wt% (c) and 10 wt%
(d). Scale bar is 100 μm.
nanofibers have the lowest compressive strength, due to the increased quantity of defects.
While a m ajority of HA nanofibers acted like defects, a small percentage of HA

125
nanofibers were able to disperse across the entire matrix and hence fiber pull-out occurs,
which is shown in Figure 5.11. This toughens CPC and counteracts the effect of defects,
Figure 5.10 Compressive strength and 3-point flexural strength of CPC reinforced with 0 wt%, 2
wt%, 5 wt% and 10 wt% untreated HA nanofibers.
which leads to leveled valued of bending strength. Table 5.2 shows the powder to liquid
ratio decreases while the percentage of HA increases in CPC-HA composite. It was
necessary to decrease powder to liquid ratio to achieve a consistent workable cement
paste when increasing the HA percentage, due to the large surface area of HA nanofibers
which requires more water to wet the surface without decreasing the viscosity of the
paste. With lower powder to liquid ratio more water will be involved in the structure
during setting, however, it also increased the voids which were left behind after water

126
evaporates. This would contribute to the poor mechanical strength observed with a higher
percentage of HA nanofibers in the CPC matrix.
Figure 5.11 CPC with pull-out HA nanofibers of 0 wt% (a), 2 wt% (b), 5 wt% (c) and 10
wt% (d). Scale bar is 10μm.
The compressive strength and bending strength of CPC reinforced with 0%, 2 wt%
and 5wt% untreated HA and surfaced modified HA are shown in Figure 5.12. Similar as
CPC reinforced with untreated HA nanofibers, the compressive strength of CPC
reinforced with surface modified HA decreases with the percentage of HA increasing,
mainly due to the unchanged powder to liquid ratio. CPC reinforced with 5% Carboxyl-
HA showed approximately 4 MPa higher than all the other groups, which indicates the
extra carboxyls on H A nanofibers surface could possibly help with dispersion and
decrease the size of HA nanofibers aggregate. However, due to the standard deviation no

127
statistic difference can be determined from pure CPC to CPC reinforced by 2% HA, and
from CPC reinforced by 2% HA to CPC reinforced by 5% HA.
Figure 5.12 Compressive strength and 3-point bending strength of CPC reinforced with
0%, 2 wt%, 5 wt% and 10 wt% untreated HA nanofibers, and 2 wt% and 5 wt% surface
modified HA nanofibers. Error bars are standard deviation (n=5).
With regarding to bending strength of all groups, pure CPC, CPC with 2% HA and
CPC with 5% HA exhibit similar values. This could be due to the fiber pull-out effect

128
observed in the composite, which compensates the defect from the HA nanofibers
aggregates. The bending strength could also be less sensitive to the flaws in the samples.
Carboxyl-HA also showed a higher average strength than other groups by nearly 0.5
MPa. However, no statistic difference could be observed over all the groups.
During the process of making pure CPC control samples, it was observed that the
CPC control could form workable putty only in a very narrow range of powder to liquid
ratio. Insufficient amount of the liquid will make the cement a dry and inhomogeneous
mass, with which shaping is difficult. Excessive amount of cement liquid on the other
hand, will give a loose paste. As a result of using powder to liquid ratio lower that 3.33
shown in Table 5.2, the cement paste is very thin and flowable, but upon forming samples
in the mold, the extra amount of liquid would eventually evaporate and leave the samples
with numerous cracks, which make the samples very weak and untestable.
4. Conclusion
Ultra high aspect ratio HA nanofibers were added in CPC matrix as reinforcing phase
before and after surface modification. However, due to the poor dispersion of HA
nanofibers in CPC matrix shown under microphotographs, the final mechanical strength
of the nanocomposites decreases as the percentage of HA nanofibers addition increases.
HA nanofibers were effectively modified with three fatty acids with long chains, and
surface functional groups’ titration and FTIR were utilized to evaluate and characterize
modified HA nanofibers. The result showed the surface modification of HA nanofibers
was effective and proved the proposed functional group change on t he surface of
nanofibers; however, the mechanical strength of nanocomposites reinforced with
modified HA nanofibers was not improved overall due to the unchanged powder to liquid

129
ratio. At this moment it is unclear whether HA nanofibers could reinforce CPC as we
hypothesized.
5. Reference
1. Osborn, J. and H. Newesely, The material science of calcium phosphate ceramics. Biomaterials, 1980. 1(2): p. 108-111.
2. Hench, L.L., Bioceramics. Journal of the American Ceramic Society, 1998. 81(7): p. 1705-1728.
3. Suchanek, W. and M. Yoshimura, Processing and properties of hydroxyapatite-based biomaterials for use as hard tissue replacement implants. Journal of Materials Research, 1998. 13(01): p. 94-117.
4. Brown, W. and L. Chow, A new calcium phosphate water setting cement. Cements Research Progress, 1986: p. 352-379.
5. Chow, L.C., et al., Formation of hydroxyapatite in cement systems. Hydroxyapatite and related materials, 1994: p. 127.
6. Fukase, Y., et al., Setting reactions and compressive strengths of calcium phosphate cements. J Dent Res, 1990. 69(12): p. 1852-6.
7. Takagi, S. and L. Chow, Formation of macropores in calcium phosphate cement implants. Journal of Materials Science: Materials in Medicine, 2001. 12(2): p. 135-139.
8. Costantino, P., et al., Hydroxyapatite cement. I. Basic chemistry and histologic properties. Archives of otolaryngology--head & neck surgery, 1991. 117(4): p. 379.
9. Friedman, C., et al., Hydroxyapatite cement. II. Obliteration and reconstruction of the cat frontal sinus. Archives of otolaryngology--head & neck surgery, 1991. 117(4): p. 385.
10. Costantino, P.D. and C.D. Friedman, Synthetic bone graft substitutes. Otolaryngologic Clinics of North America, 1994. 27(5): p. 1037.
11. Ishikawa, K., et al., Properties and mechanisms of fast-setting calcium phosphate cements. Journal of Materials Science: Materials in Medicine, 1995. 6(9): p. 528-533.
12. Friedman, C.D., et al., BoneSource™ hydroxyapatite cement: a novel biomaterial for craniofacial skeletal tissue engineering and reconstruction. Journal of biomedical materials research, 1998. 43(4): p. 428-432.
130
13. Shindo, M., et al., Facial skeletal augmentation using hydroxyapatite cement. Archives of otolaryngology--head & neck surgery, 1993. 119(2): p. 185.
14. Costantino, P.D., et al., Experimental hydroxyapatite cement cranioplasty. Plastic and reconstructive surgery, 1992. 90(2): p. 174&hyhen; 185.
15. Shackelford, J.F., Introduction to materials science for engineers2009: Pearson Prentice Hall.
16. Dos Santos, L.A., et al., Fiber reinforced calcium phosphate cement. Artificial Organs, 2000. 24(3): p. 212-216.
17. Xu, H.H.K., F.C. Eichmiller, and A.A. Giuseppetti, Reinforcement of a self setting calcium phosphate cement with different fibers. Journal of biomedical materials research, 2000. 52(1): p. 107-114.
18. Sun, L., et al., Fast setting calcium phosphate cement-chitosan composite: mechanical properties and dissolution rates. Journal of biomaterials applications, 2007. 21(3): p. 299.
19. Xu, H.H.K. and C.G. Simon Jr, Self hardening calcium phosphate cement–mesh composite: Reinforcement, macropores, and cell response. Journal of Biomedical Materials Research Part A, 2004. 69(2): p. 267-278.
20. Xu, H.H.K. and J.B. Quinn, Calcium phosphate cement containing resorbable fibers for short-term reinforcement and macroporosity. Biomaterials, 2002. 23(1): p. 193-202.
21. Wang, X., et al., Reinforcement of Calcium Phosphate Cement by Bio Mineralized Carbon Nanotube. Journal of the American Ceramic Society, 2007. 90(3): p. 962-964.
22. Müller, F.A., et al., Whisker Reinforced Calcium Phosphate Cements. Journal of the American Ceramic Society, 2007. 90(11): p. 3694-3697.
23. Chen, L., et al., BisGMA/TEGDMA dental composite containing high aspect-ratio hydroxyapatite nanofibers. Dental Materials, 2011. 27(11): p. 1187-1195.
24. Chow, L.C., Development of self-setting calcium phosphate cements. Nippon Seramikkusu Kyokai Gakujutsu RonbunshiJournal of the Ceramic Society of Japan, 1991. 99(1154).
25. Liu, C., et al., Mechanism of the hardening process for a hydroxyapatite cement. Journal of biomedical materials research, 1997. 35(1): p. 75-80.
26. Zhan J, T.Y.H.C.J.C.C. and C.Y. Mou, Biomimetic formation of hydroxyapatite nanorods by a single-crystal-to-single-crystal transformation. Adv. Funct. Mater., 2005. 15(12): p. 2005.
131
27. Troczynski, T., Bioceramics: A concrete solution. Nature Materials, 2004. 3(1): p. 13-14.

132
Chapter 6 Summary and Future Work
Calcium phosphate cements (CPCs) are very promising orthopedic biomaterial. In the
last few decades researchers have been dedicated to investigating various aspects of
CPCs, including biological, mechanical and chemical properties. With chemically similar
composition to human hard tissue, there are other issues for CPC that need to be
addressed. Fundamental studies for various CPC formulations are still to be continued.
Mechanical behavior and properties need to be continuously studied and improved, with
the addition of various polymers and reinforcement phases, as medical implants can
undertake a wide range of pressure from the body. Biocompatibility is also necessary to
investigate while other additives or second phase are applied. This dissertation provides a
comprehensive study on the properties of polymeric and non-polymeric CPC, as well as
CPC-hydroxyapatite (HA) nanocomposites. The secondary phase, HA nanofiber, was
thoroughly studied.

133
Chapter 2 s tudied the influence of cement liquid concentration on setting time,
injectability and mechanical properties of tetracalcium phosphate (Ca4(PO4)2O, TTCP) –
dicalcium phosphate anhydrous (CaHPO4, DCPA) based cement. Setting time and
injectability are very important criteria for commercial bone cements, as specific medical
procedure requires bone cement with special properties. The concentration of sodium
hydrogen phosphate (Na2HPO4) and sodium dihydrogen phosphate (NaH2PO4) in the
cement liquid was designed at different levels. The result shows that setting time was
shortened significantly by increasing the concentration of Na2HPO4 and NaH2PO4 in
cement liquid. The relationship between initial setting time / f inal setting time and
concentration of the two chemicals follows the power law functions. The injectability and
mechanical strength, however, was adversely affected by increasing the two chemicals.
Conversion rate was investigated through x-ray diffraction (XRD).
Chapter 3 studied the setting time, injectability and mechanical properties of CPC
with different polymer cement liquids. Chitosan lactate (chitosan), poly (ethyleneimine)
(PEI), and poly (allylamine hydrochloride) (PAH) were chosen in this study as the
polymer base. CPC-Chitosan exhibited 100% injectability, however, the final setting time
of such system is longer than 200 minutes, and the mechanical strength is below 10MPa.
CPC-PEI and CPC-PAH show no injectability, but they have excellent mechanical
properties: 30-50 MPa of compressive strength (CS) and 10-15 MPa of bending strength
(BS), with the final setting time of about 60 minutes. The conversion rate of CPC-PEI
under XRD showed faster reaction during the early stage (less than 6 hours).
Chapter 4 i nvestigated the fiber growth mechanism of HA nanofiber under regular
reactant concentration and high reactant concentration reactions. It was concluded that

134
dicalcium phosphate anhydrous (DCPA) is the main intermediate phase during the
synthesis of HA nanofibers. In addition, the mechanism of synthesis of HA at high
precursor content was proved successful with unique phase evolution, where DCPA
appear with large crystals that dissolved in the mid-reaction, and HA precipitated as
nanofibers eventually. Finally, quality control of HA nanofiber synthesis with high
precursor content was investigated. Urea and gelatin were found to have greater influence
on the fiber length and the amount of impurity than other reactants.
In Chapter 5, HA nanofibers, without and with the surface modification, were
dispersed in CPC matrix. Three types of surface modification chemicals were used,
including 12-aminododecanoic acid, dodecanoic acid and dodecanedioic acid. The results
exhibited that mechanical strength was decreased by increasing the percentage of HA, for
both untreated and surface modified nanofiber, due to the high surface area of HA
nanofiber, which absorbs more liquid before the surface of the system can be completely
wet. Microstructures of CPC showed non-uniform dispersion of untreated HA in CPC
and large portions of HA nanofiber aggregation.
The results of our experimental work and analysis indicated that there are multiple
ways to tailor the cement properties and that further investigation is needed to make
calcium cements with different properties that may meet each of the variety of orthopedic
applications. In order to further improve the properties of our CPCs and to develop
different types of CPC system, the following work is recommended:
i. The effect of cement liquid consisting of Na2HPO4, NaH2PO4 should be studied in
more detailed manner, including different ratios of the two chemicals.

135
ii. The effect of dwelling temperature on the injectability of the different cement
system will be studied systematically, with a temperature profile mimicking that in
operation room for orthopedic cases.
iii. PEI and PAH can be mixed with other hardening accelerators in the cement liquid
to further shorten the setting time and improve the injectability to fit different
orthopedic applications.
iv. Other types of surface modification on HA nanofibers could be applied, in order to
wet HA nanofibers surface with less cement liquid.
v. Other types of fibers could be added into the CPC system to form a composite, in
which a good interface between the fibers and TTCP-DCPA particles could be
formed and fiber pull-out and fiber bridging could reinforce the matrix so the
mechanical properties would be improved.
vi. In vitro and In vivo study of specific CPC systems should be investigated to show
cytotoxicity and biocompatibility.
136
VITA
Wen Wang Ritts was born in Shijiazhuang, Hebei, China on September 3, 1981,
the daughter of Yafen Wang and Shenggui Wang. After completing high school in First
High School, Shijiazhuang, Hebei, China in 1999, she attended Xian Jiao Tong
University in Xian, Shaanxi, China from 1999 to 2003. She graduated with Bachelor of
Science and Engineering in 2003. From 2003 to 2006, she attended graduate school for
Master of Engineering at Xian Jiao Tong University in Xian, Shaanxi, China. During her
Master Degree’s study, she was chosen as an exchange student and went to Osaka
University in Japan for a year of study. In 2006, she finished the exchange program and
graduated with Master of Engineering from Xian Jiao Tong University in Xian, Shaanxi,
China. In 2007, M rs. Ritts joined Dr. Hao Li’s group in Mechanical and Aerospace
Engineering Department at University of Missouri, Columbia, Missouri as a Ph. D
student. In 2011, M rs. Ritts joined Electron Microscopy Core Facilities as Senior
Research Specialist at University of Missouri, Columbia, Missouri. Mrs. Ritts is now
member of Microanalysis Society and Microscopy Society of America.


