Jbig D eaL Jbig D eaL Jbig D eaL Jbig D eaL D ownload from ...
Upload
howard-kelley-davisCategory
view
214download
1
The Student Handbook toTHE APPRAISAL OF REAL ESTATE
1
Chapter 16
Land and Site Valuation

Student Handbook to THE APPRAISAL OF REAL ESTATEChapter 16 2
Relation to Appraisal Principles
Value concepts and principles Property rights and public controls Physical characteristics and site improvements Highest and best use
Student Handbook to THE APPRAISAL OF REAL ESTATEChapter 16 3
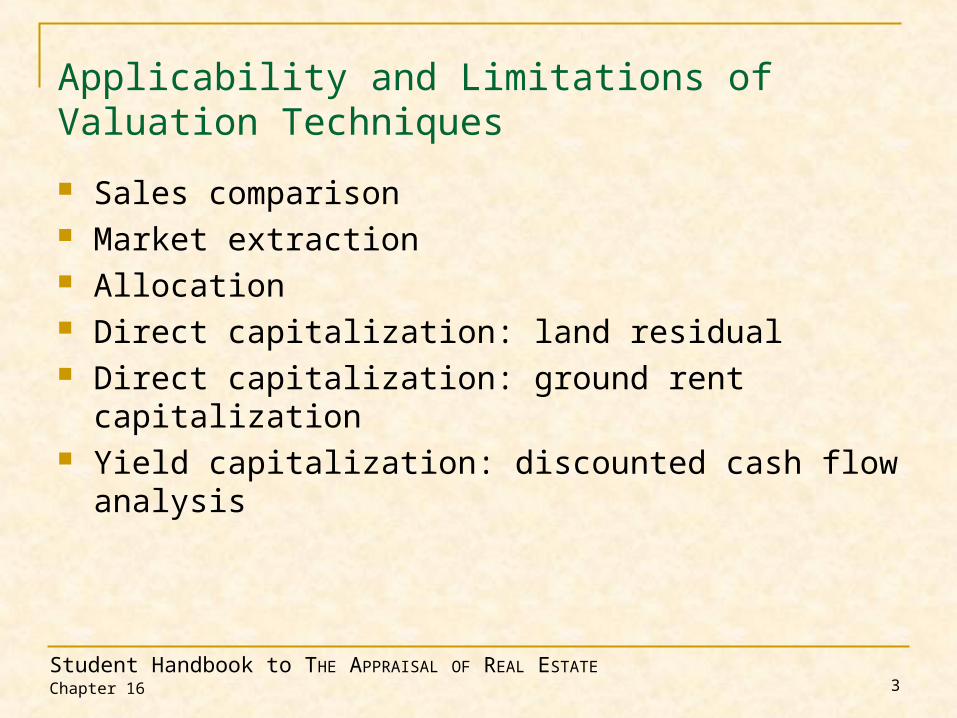
Applicability and Limitations of Valuation Techniques
Sales comparison Market extraction Allocation Direct capitalization: land residual Direct capitalization: ground rent capitalization Yield capitalization: discounted cash flow analysis

Student Handbook to THE APPRAISAL OF REAL ESTATEChapter 16 4
Sales Comparison
Preferred method Sequence of adjustments Gross and net adjustments Bracketing the subject property Adjustments for items of dissimilarity
Comparable inferior, add (CIA) Comparable superior, subtract (CSS)

Student Handbook to THE APPRAISAL OF REAL ESTATEChapter 16 5
Sales Comparison Grid
Subject Property Comparable 1 ADJ.$ Comparable 2 ADJ.$
Address 8225 Washington Blvd
Sales price $0 $79,000 $55,000
Price/sq. ft. $0 $2.13 $3.61
Rights transferred Fee Simple Fee simple 0.00% Fee simple 0.00%
Subtotal $79,000 $55,000
Financing Assume cash Contract sale -5.00% Cash to seller 0.00%
Subtotal $75,050 $55,000
Conditions of sale Arm's-length Arm's-length 0.00% Arm's-length 0.00%
Subtotal $75,050 $55,000
Market conditions 3% Now 5 months ago 1.25% 4 months ago 1.00%
Subtotal $75,988 $55,550
Topography Rolling Level 5.00% Level 5.00%
Location Cul de sac Corner lot 10.00% Cul de sac 0.00%
Wooded 10% 50% -8.00% 50% -8.00%
Flood area 0.00% 0.00% 0.00% 0.00% 0.00%
Size (sq. ft.) 22,000 37,026 15,246
Size (acres) 50% 0.5051 0.85 -17.25% 0.35 7.76%
Zoning Residential Residential 0.00% Residential 0.00%
Utilities Public water/sewer Public wtr/swr 0.00% Public wtr/swr 0.00%
Type (platted) Platted Platted 0.00% Platted 0.00%
Improved property $300,000 $450,000 $200,000
Price range 0.05% $400,000 $550,000 -7.50% $250,000 6.25%
Other factors None None 0.00% None 0.00%
Net adjustment N/A -17.75% 11.01%
Indicated value N/A $62,500 $61,661
1430 E. 82nd Street 1710 E. 80th Street

Student Handbook to THE APPRAISAL OF REAL ESTATEChapter 16 6
Paired Data Sales Analysis Example
Market Street 50’ R/WLot #1 Lot #2 Lot #4 Lot #6Sold $25,000 Sold $23,000 Sold $24,000 Sold $26,0006 mos. ago 12 mos. ago 6 mos. ago 6 days ago
Lot #9 Lot #12Sold $26,000 Sold $27,000now 6 days ago
Main Street 50’ R/WLot #13 Lot #14 Lot #15Sold $27,000 Sold $24,000 subjectNow 12 mos. agoLot #19 Lot #20 Lot #23Sold $28,000 Sold $25,000 Sold $27,000Now 12 mos. ago now
Lake Street
Lot #3 Lot #5
Lot #7 Lot #8 Lot #10 Lot #11
Lot #16 Lot #17 Lot #18
Lot #21 Lot #22 Lot #24

Student Handbook to THE APPRAISAL OF REAL ESTATEChapter 16 7
Paired Data Sales Analysis Example – Answers
The subject property is a lot in the middle of the block on Main Street (#15) and the comparable sales are equal to the subject in all other elements of comparison. What is the value? The answer is listed in the table below. The fact that the answers are all the same is not an accident or because of how the data was created; it is the process. Measuring the difference in sale price to explain the difference in the properties should narrow the range of indicated values.
Lot # 1 Lot # 2 Lot # 4 Lot # 6 Lot # 9 Lot # 12 Lot # 13 Lot # 14 Lot # 19 Lot # 20 Lot # 23
$25,000 $23,000 $24,000 $26,000 $26,000 $27,000 $27,000 $24,000 $28,000 $25,000 $27,000
Sale Date 6 mos. 12 mos. 6 mos. Now Now Now Now 12 mos. Now 12 mos. Now
+1,000 +2,000 +1,000 0 0 0 0 +2,000 0 +2,000 0
Street Location Market Market Market Market Main Main Main Main Lake Lake Lake
+1,000 +1,000 +1,000 +1,000 0 0 0 0 -1,000 -1,000 -1,000
Corner Yes No No Yes No Yes Yes No Yes No No
-1,000 -1,000 -1,000 -1,000 -1,000
Adj.Price $26,000 $26,000 $26,000 $26,000 $26,000 $26,000 $26,000 $26,000 $26,000 $26,000 $26,000

Student Handbook to THE APPRAISAL OF REAL ESTATEChapter 16 8
Alternative Techniques
Market extraction Commonly used to estimate land values when
comparable sales are not available Land value is the net result of subtracting the
value of the improvements by the cost approach from the sale price of an improved property.

Student Handbook to THE APPRAISAL OF REAL ESTATEChapter 16 9
Land Value via Market Extraction
$301,000
Residence cost new 2,800 @ $75 = $210,000
Basement cost new 500 @ $25 = $12,500
Porches, etc. cost new 500 @ $25 = $12,500
Garage cost 750 @ $25 = $18,750
Total cost new of $253,750
Total depreciation (all causes) 12% -$30,450
$223,300 -$223,300
-$12,500
$65,200
Depreciated value of site improvements
Estimated land value
Gross sale price
Depreciated value of building improvements

Student Handbook to THE APPRAISAL OF REAL ESTATEChapter 16 10
Page 235
= $140,000
= -$110,000
= -$5,000
= $25,000
Overall value
Less value of the building(s)
Less value of site improvements
Extracted site value

Student Handbook to THE APPRAISAL OF REAL ESTATEChapter 16 11
Alternative Techniques, continued
Allocation Uses land-to-building or land-to-property-value
ratios in improved areas to support a land value in the subject area when no land sales are available
Subject and comparable properties must be improved to their highest and best use or this technique is less applicable.
The ratio from one area and price range is not necessarily transferable to another area or price range.

Student Handbook to THE APPRAISAL OF REAL ESTATEChapter 16 12
Land Value via the Allocation Method
Sale 1 Sale 2 Sale 3 Sale 4
Sale price $250,000 $300,000 $220,000 $200,000
Estimated land value -$50,000 -$56,000 -$45,000 -$40,000Estimated building value$200,000 $244,000 $175,000 $160,000
Land/property ratio 20.00% 18.67% 20.45% 20.00%

Student Handbook to THE APPRAISAL OF REAL ESTATEChapter 16 13
Alternative Techniques, continued
Direct capitalization: ground rent capitalization Establishes a ratio of income to value in the
comparable properties and then uses that ratio for the subject property
Can be an excellent method if the market thinks this way
Requires very similar expenses and upside potential to be accurate
Can be incorrect if the risk is not the same in comparable properties and the subject property

Student Handbook to THE APPRAISAL OF REAL ESTATEChapter 16 14
Extraction and Application of Overall Capitalization
Example of extraction and application of overall capitalization of a single year’s income
Sale Income Sale Price Cap. Rate$1 $42,000 / $350,000 = 12.00%$2 $36,000 / $300,000 = 12.00%$3 $37,000 / $295,000 = 12.54%$4 $19,000 / $175,000 = 10.86%$5 $8,600 / $75,000 = 11.47%
Subject $12,000 / 12% = 100,000$
I
R V

Student Handbook to THE APPRAISAL OF REAL ESTATEChapter 16 15
Alternative Techniques, continued
Direct capitalization: land residual technique Uses the income capitalization approach to
isolate income to the land by segregating income from the building from overall income
Requires capitalization rates for both land and building, which are difficult to get with similar risk and income patterns
This is a theoretical technique because buyers and sellers do not buy land and buildings, rather they buy rights in realty (e.g., the leased fee and leasehold interests).

Student Handbook to THE APPRAISAL OF REAL ESTATEChapter 16 16
Alternative Techniques, continued
Yield capitalization: discounted cash flow analysis Not used in some markets at all but quite
applicable in others Assumes land value is based on development
potential, not on alternative properties Does not consider other listings but only that it
is feasible to develop the project

Student Handbook to THE APPRAISAL OF REAL ESTATEChapter 16 17
Land Value by Discounted Cash Flow Analysis
Quarter 1 2 3 4 5 6 7 8
Lots per quarter $8 $8 $8 $8 $8 $8 $8 $8
Sale price per lot $47,500 $47,500 $47,500 $47,500 $47,500 $47,500 $47,500 $47,500
Estimated PGI $356,250 $356,250 $356,250 $356,250 $356,250 $356,250 $356,250 $356,250
Development costs $200,000 $200,000 $200,000 $200,000 $0 $0 $0 $0
Real estate taxes $400 $0 $400 $0 2,000 $0 2,000 $0
Sales commission 7% 24,938 24,938 24,938 24,938 24,938 24,938 24,938 24,938
Advertising, etc. 4% 14,250 14,250 14,250 14,250 14,250 14,250 14,250 14,250
Entrepreneurial incentive 20% 71,250 71,250 71,250 71,250 71,250 71,250 71,250 71,250
Total expenses $310,838 $310,438 $310,838 $310,438 $112,438 $110,438 $112,438 $110,438
Net cash flow $45,412 $45,812 $45,412 $45,812 $243,812 $245,812 $243,812 $245,812
Discounted @ 12% 0.9709 0.9426 0.9151 0.8885 0.8626 0.8375 0.8131 0.7894
Present value $44,091 $43,182 $41,556 $40,704 $210,312 $205,868 $198,242 $194,044
$977,999
Less estimated expenses
Present value of land

Student Handbook to THE APPRAISAL OF REAL ESTATEChapter 16 18
Problems
Suggested solutions begin on page 426.

Student Handbook to THE APPRAISAL OF REAL ESTATEChapter 16 19
Problem 12—Suggested Solution
Subject Property Comparable 1 Adj. $ Comparable 2 Adj. $ Comparable 3 Adj. $
Address 1234 W. 87th St
Sale price $45,000 $60,000 $52,000
Rights transferred Fee simple Fee simple 0% Fee simple 0% Fee simple 0%
Subtotal 45,000$ 60,000$ 52,000$
Financing Assume cash Cash to seller 0% Cash to seller 0% Listing only 0%
Subtotal 45,000$ 60,000$ 52,000$
Conditions of sale Arm's-length Arm's-length 0% Arm's-length 0% Arm's-length 0%
Subtotal 45,000$ 60,000$ 52,000$
Market conditions Current 6 months ago +1.50% 9 months ago +2.25% Current listing 0.00%
Subtotal 45,675$ 61,350$ 52,000$
Topography Rolling Rolling 0% Level +5% Level +5%
Location River township River township 0% River township 0% River township 0%
Wooded 75% 25% +5% 75% 0% 25% 5%
Flood area 10.00% Equal 0% Equal 0% Equal 0%
Size (acres) $1.2500 $1.0000 +5% $1.7500 -10% $1.0000 +5%
Zoning Residential R1 Residential R1 0% Residential R1 0% Residential R1 0%
Utilities All public All public 0% All public 0% All public 0%
Type (platted) Platted Platted 0% Platted 0% Platted 0%
Improved property $200,000 $150,000 $300,000 $300,000
Price range $300,000 $250,000 $400,000 $400,000
Other factors None None 0% None 0% None
Net adjustment N/A +15% -15% +5%
Indicated value N/A 52,526 52,148 54,600
9001 Kissel Road 1112 W. 91st Street 815 W. 86th Street
+5% -10% -10%

Student Handbook to THE APPRAISAL OF REAL ESTATEChapter 16 20
Problem 13—Suggested Solution
Subject
Address 123 Nicole Street
Data source N/A
Sale price $0 $560,960 $350,000
Price/sq. ft. $0 $2.61 $3.48
Rights transferred Fee simple Fee simple Fee simple
Financing Assume cash Cash sale Cash sale
Conditions of sale Arm's length Arm's length Arm's length
Date of sale Current 12 months ago Inferior 18 months ago Inferior
Topography Level Level Level
Location West side East side Inferior West side
Access 1 point 2 points Superior 2 points Superior
Visibility Avg./industrial Equal Superior Superior
Flood area 0.00% 0.00% 0.00%
Road frontage 166 341 Superior 305 Superior
Average depth 981 630 330
Size (sq. ft.) 162,818 215,000 100,500
Size (acres) 3.7378 4.936 Inferior 2.301 Superior
Zoning Industrial I3S Industrial I3S Industrial I4S Superior
Utilities All public All public All public
Other factors None None None
Indicated value per sq. ft. A little more than $2.61 Much less than $3.48
Co-op # 29761 Co-op # 29761
505 Jeanine Drive 123 Eunice Lane
Comparable Land Analysis (Qualitative Analysis)
Comparable 1 Comparable 2