Macroinvertebrate Bioassessment Tools Aquatic Life/Nutrient Workgroup August 11, 2008.
i
The structuring of aquatic macroinvertebrate
communities within cave streams
A thesis
Submitted in partial fulfilment for the degree of
Master of Science in Ecology
at the
University of Canterbury,
Christchurch, New Zealand
by
Troy N. Watson
University of Canterbury
2010

ii
Dedicated to my parents,
who introduced me to the world and wilderness
iii
Abstract
The unusual environmental conditions within caves provided unique opportunities for
developing an understanding of ecosystem processes. However, relatively few studies have
been conducted on the ecology of New Zealand cave systems. The primary aim of this
research was to investigate changes in aquatic invertebrate communities along a longitudinal
gradient from the surface into caves and investigate the fundamental drivers of cave
communities. This study was carried out in three streams (two in pasture catchments and one
in a forested catchment) flowing into caves in the Waitomo region, North Island, New
Zealand. In order to address these aims I carried out a longitudinal survey of 12 sites in each
stream, an experimental manipulation of food, and an isotopic study of a single stream. The
longitudinal survey of the three cave streams revealed light intensity as well as algal and
CPOM biomass all decreased significantly from outside the caves into caves. In contrast,
water temperature, dissolved oxygen, stream width, depth, and velocity did not vary
significantly with distance into caves. Benthic aquatic macroinvertebrate communities within
the caves were a depauperate subset of surface communities, appearing to be structured by
gradients in resources and colonisation through drift. However, some invertebrate taxa
(primarily predators) were rarely found within caves, further suggesting that resource
gradients were structuring cave communities. Surprisingly, the densities of some collector-
browsers (primarily mayflies) increased within cave streams relative to surface densities. This
may be due to a decrease in competition and predation, flexible feeding strategies, and high
drift propensity. However, the benthic densities of most taxa within the caves appeared to be
related to drift densities. Although surface forest and pastoral stream communities differed in
community composition and density 32 meters within the caves invertebrate community
diversity and density became similar, although specific taxa within communities varied. This
convergence was attributed to similar environmental gradients within the caves. The resource
addition experiment (adding leaf packs) indicated that cave streams were resource limited;
the addition of leaves produced communities of similar richness and density across the
environmental gradient. The isotopic survey suggested cave stream invertebrate communities
were reliant upon similar basal resources to surface streams. However, within the cave
epilithon appeared to be increasingly important while filamentous algae were absent. Cave

iv
aquatic invertebrates were also found to support terrestrial predators (spiders, harvestmen,
and glow-worms), presumably increasing the abundance and diversity of terrestrial cave
communities. In conclusion, aquatic cave communities were reliant upon surface derived
resources and consequently strongly linked to surface land-use and managerial practices.

1
Contents
Abstract
Acknowledgements
iii - iv
2
Chapter 1:
General introduction: the structuring of aquatic invertebrate
communities within cave streams
5
Chapter 2:
Cave communities across a longitudinal gradient: source-
sink populations structured by resource limitations
22
Chapter 3:
Factors limiting macroinvertebrate communities within
cave streams: manipulations of algae and CPOM
53
Chapter 4:
Comparing energy pathways between cave and surface
environments using stable isotopes
74
Chapter 5: Synthesis: the structuring of aquatic macroinvertebrate
communities within cave streams
97

2
Acknowledgements
First and foremost I owe the completion of this thesis to two people, my supervisor Jon
Harding and unofficial supervisor Duncan Gray. Jon’s ability to keep my thesis on target,
generally put up with a wayward masters student, and insights to the world of science were
incredibly helpful. While comments he had made and I had argued forcibly against were
found to be correct after three, or so, days of extra contemplation. Thank you very much.
Throughout my thesis Duncan provided much needed advice (on ecology and life in general),
statistical help, understood my incoherent sentences and half formed ideas, and adopted me
into the Gray Clan when I needed a place to stay. Once again thank you very much. On this
note I also wish to thank his partner Bridget for letting me stay, even though she already had
to look after their 3 year old daughter Lucia and the 9 month twin girls Honor and Lauren (as
well as Duncan). I think I understand the world slightly better after doing jigsaws and making
toy cave ecosystems on the floor, using the pretence of helping while actually avoiding
university.
Secondly, this research would not have been possible without the permission and goodwill of
the land owners. On this note I would like to thank the Murchie, Geange, and Osbourne
families who put up with someone with a weird assortment of gear walking randomly around
their properties looking for holes in which to disappear. A special thanks to the Osbourne’s
who turned the bulls (who would chase me daily, scattering temperature loggers, invertebrate
samples, lights, and the accursed tanglefoot across the landscape) into hamburgers.
Early one morning in my second year of university Dad woke me up to say there was a
scientist going into the cave at work and I should tag along. In a car park standing in a wet
wetsuit I met Mike Scarsbrook from NIWA and mumbled that I wanted to do a MSc in a few
years time. We went back to my place for a cup of tea and a chat, consequently found the
milk was off and there was no tea because Mum was in Australia, and decided to go caving

3
instead. On this note I thank Mike for setting up my scholarship with NIWA, and my co-
supervisor at NIWA Graham Fenwick.
I would also like to thank: The Legendary Black Water Rafting company for the use of their
gear and all the cool people that work there, Travis Horton at Canterbury University for the
use of his stable isotope lab, Dave Kelly at Canterbury University for the use of his
anemometers, Kevin Simon for his help with the isotope survey, John Ash for his advice and
instruments, Dave Smith at Te Kuiti DoC for his help with permits, Travis Cross from the
Glow-worm Cave for the loan of scientific instruments, his time, and the enjoyable days
spent exploring a new cave system on Mt Owen, which we aptly named Master Wrecker.
Jonathan Cocks, Kieran Chandler, and Silas Dow for taking time out of their lives to help
with the occasional bout of field work, Zane Burdett for helping Dad manoeuvre the 700 kg
algal experiment into the stream (to colonise and not wash away), Steve Mahoney for all the
welding jobs (they were necessary, sort of), Rachel Nielsen for all her help, Ewan Isherwood
for all the hours bug picking and general humour, and all my friends and flatmates who have
kept me from drifting further down the road to madness (or pushed me further along).
I would like to thank everyone in FERG for their help and friendship. Frank, Jono, Jarred,
Hannah, Simon, Helen, Katie, Steve, Danladi, and Phil were always keen for a beer, chat, or
some sort of trouble. Rebecca and Elisabeth returned the office discussions to topic, while
Angus, Pete, Tanya, and Kristy provided advice on ecology, stable isotopes, and statistics.
Linda was always willing to find small items of field gear and provided me with the 80 L of
100% ethanol which led to me failing a breath test (because of interference from the
fumigated car) and being threatened with jail on the long commute to Waitomo, only to be let
off when I assured them I was at Canterbury University and a student of Jon Harding (I wish
to state that I did pass the breath test once I stepped away from the fumigated car). Mike
Winterbourn’s willingness to help, broad range of knowledge, and the ability to turn water
into wine (in a sentence sense), were nothing short of amazing.
Lastly to my parents who introduced me to caving, helped with field work, labelled countless
things (at least three times), and provided help and advice throughout the years, thank you.

4
Entrance to Murchies cave
Chapter 1. General introduction: the structuring of aquatic macroinvertebrate communities within cave streams
5
Chapter 1
General introduction: the structuring of aquatic macroinvertebrate communities
within cave streams
Introduction
The fundamental difference between cave and surface ecosystems is the presence of light
(Barr 1967, Azad and Borchardt 1969, Death 1989, Simon and Benfield 2001, Simon et al.
2003, Wood et al. 2008). Light drives autochthonous food-webs through photosynthetic
fixation of carbon (Azad and Borchardt 1969), accounting for the majority of aquatic primary
production on earth. The exceptions being a few chemotrophic systems recorded in deep-sea
vents and caves (Sarbu et al. 1996). Therefore, surface stream communities abundant in light
should differ markedly from cave stream communities in their sources of energy (Barr 1967,
Howarth 1983, Culver et al. 1995, Gunn et al. 2000, Simon and Benfield 2001, Simon et al.
2003, Moseley 2007, Tobler 2008, Wood et al. 2008, Roldán and Hernández-Mariné 2009).
Cave communities are primarily dependent upon surface derived allochthonous and detrital
resources, received via water and air flow, animals, and root exudates (Polis et al. 1997).
Reliance upon surface originating detritus intimately links cave streams and their associated
invertebrate communities to surface streams (Death 1988, 1989, Simon et al. 2003, Wood et
al. 2008). The aim of my study was to quantify changes in aquatic invertebrate communities
that occur as surface streams flow into caves and investigate the fundamental drivers of cave
ecosystems. In this chapter I will briefly discuss the properties of caves, then highlight
aspects surface stream ecological theory which might be relevant to caves, and finish with
some cave specific examples.
Caves formation and structure
Caves are commonly found in karst, more commonly known as limestone or marble, regions
which constitute about 25 percent of the world’s land mass (LaMoreaux et al. 1997). For a
cave to develop in karst Le Grande (1973) notes that five conditions must occur; 1) the

Chapter 1. General introduction: the structuring of aquatic macroinvertebrate communities within cave streams
6
presence of soluble rocks, 2) the presence of carbonic acid, 3) ample precipitation, 4)
openings in the rocks, and 5) a favourable topographical and geological structure.
Karst terrains are composed of limestone (calcium carbonate), or its metamorphosed form
marble, which is readily dissolved by weak carbonic acids formed in rain and soils (Le Grand
1973, Williams 1992). Carbon dioxide laden water sinks through surface cracks dissolving
and eroding as it percolates to the water table - leading to a paucity of surface streams (Le
Grand 1973, Williams 1992). Thus, surface cracks become enlarged and a complex system of
vertical and horizontal cracks forms. Larger cracks capture a greater portion of the sinking
water and are enlarged even further until the water table drops, or the source of the water is
diverted and a dry passage is created (Howarth 1983).
Distinctive features of karst terrains, besides the scarcity of surface streams, include; thin
soils, and rugged topography. The high permeability of karst landscapes intricately links
surface and cave environments (Howarth 1983, Williams 1992, Bolstad and Swank 1997,
Gunn et al. 2000). Linkages occur through multiple fissures, allowing surface sediments and
nutrients to seep into caves, especially during precipitation events (Howarth 1983, Bolstad
and Swank 1997, Gunn et al. 2000). Thus, surface land-use is liable to significantly influence
cave communities (Gunn et al. 2000, Wood et al. 2002).
Subterranean environments present a number of unique conditions for organisms. They are
characterised by a labyrinth of dark passages, relatively constant temperatures (near the
average annual surface temperature), a moist substrate, a water saturated atmosphere, and
decreasing contact with the surface environment (Howarth 1983). Typically the number and
density of species diminishes rapidly just inside of the cave entrance, as many species are
intolerant of the cave conditions (Death 1988, 1989). A thorough review of basic cave
structure and physical and environmental conditions is provided by Howarth (1983), and for
Karst landscapes within New Zealand Williams (1992).
General stream ecological theory
Cave communities offer an opportunity for investigating community dynamics (e.g. specific
stress gradients), this is because of their relatively depauperate communities, well defined
boundaries, and relatively constant environmental conditions (Gibert and Deharveng 2002).

Chapter 1. General introduction: the structuring of aquatic macroinvertebrate communities within cave streams
7
Predation
Benign Harsh
Gradient of environmental stress
Abiotic
factors
Competition
Stream invertebrate community structure
Stress gradients
Resource gradients are one of the primary environmental factors which alter community
composition and functioning (Peckarsky 1983). In the context of this study the lack of light
driven food resources is the most likely potential stressor moving the cave system towards the
harsh end of a harsh-benign environmental gradient (Figure 1.1). Under this model, harsh
environments, such as caves, are increasingly structured by abiotic factors. For example, light
gradients, while more benign surface systems are more likely to be structured by biotic
factors, such as competition and predation.
Figure 1.1. Conceptual model of the regulation of stream community structure along an
environmental gradient, from Peckarsky (1983).
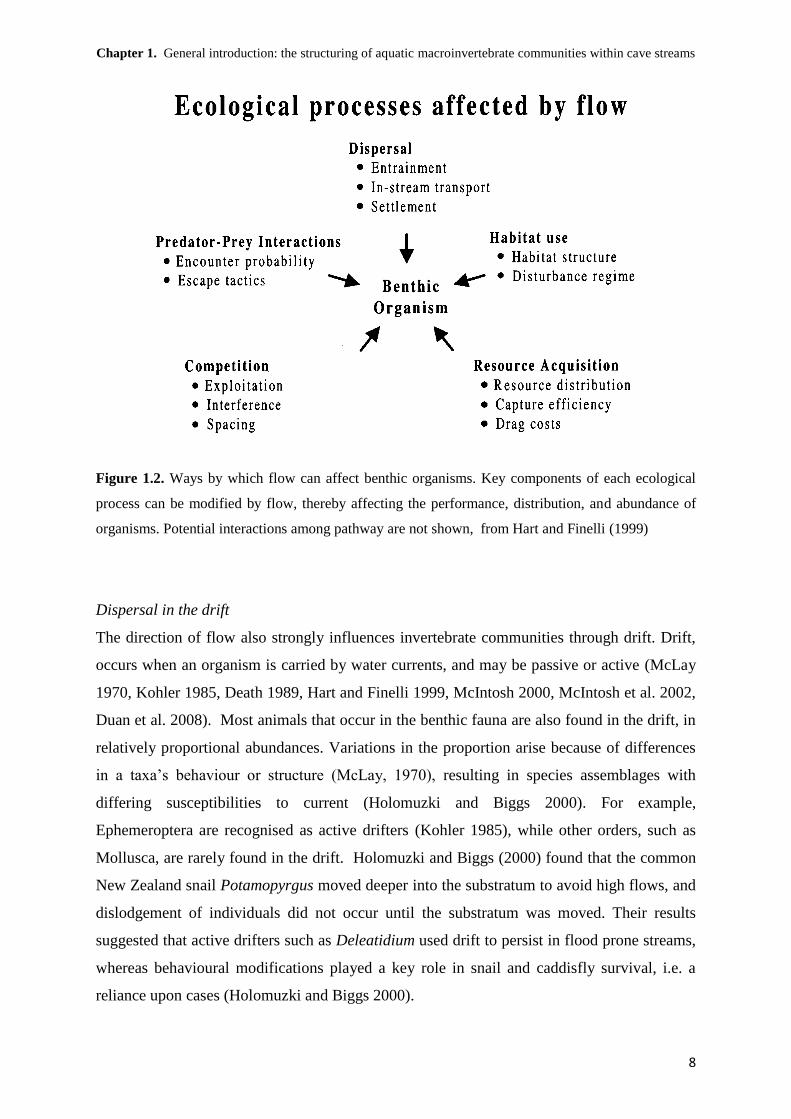
Effects of flow
Lotic ecosystems are fundamentally regulated by flow levels, velocities, and direction, i.e.
downstream communities are linked to upstream processes (Allan and Castillo 2007). Hart
and Finelli (1999) remarked that flow effected stream biota in so many different and powerful
ways that it should be viewed as the primary environmental factor within lotic ecosystems.
Flow influences, but is not limited to, disturbance, the creation of habitats, dispersal (passive
or active), predator-prey interactions, competition (inter and intra specific), and resource
acquisition (Figure 1.2) (Hart and Finelli 1999).
Chapter 1. General introduction: the structuring of aquatic macroinvertebrate communities within cave streams
8
Figure 1.2. Ways by which flow can affect benthic organisms. Key components of each ecological
process can be modified by flow, thereby affecting the performance, distribution, and abundance of
organisms. Potential interactions among pathway are not shown, from Hart and Finelli (1999)
Dispersal in the drift
The direction of flow also strongly influences invertebrate communities through drift. Drift,
occurs when an organism is carried by water currents, and may be passive or active (McLay
1970, Kohler 1985, Death 1989, Hart and Finelli 1999, McIntosh 2000, McIntosh et al. 2002,
Duan et al. 2008). Most animals that occur in the benthic fauna are also found in the drift, in
relatively proportional abundances. Variations in the proportion arise because of differences
in a taxa’s behaviour or structure (McLay, 1970), resulting in species assemblages with
differing susceptibilities to current (Holomuzki and Biggs 2000). For example,
Ephemeroptera are recognised as active drifters (Kohler 1985), while other orders, such as
Mollusca, are rarely found in the drift. Holomuzki and Biggs (2000) found that the common
New Zealand snail Potamopyrgus moved deeper into the substratum to avoid high flows, and
dislodgement of individuals did not occur until the substratum was moved. Their results
suggested that active drifters such as Deleatidium used drift to persist in flood prone streams,
whereas behavioural modifications played a key role in snail and caddisfly survival, i.e. a
reliance upon cases (Holomuzki and Biggs 2000).

Chapter 1. General introduction: the structuring of aquatic macroinvertebrate communities within cave streams
9
Source sink dynamics
Variations in habitat suitability creates patchy distributions of populations within, or between,
ecosystems (Turner 1989), leading to the formation of metapopulations (Pulliam 1988,
Leibold et al. 2004, Holyoak et al. 2005). Source-sink dynamics occur between
metapopulations when surplus individuals from highly productive source habitats move to
less productive sink habitats. In source-sink conditions within-habitat reproduction fails to
keep pace with within-habitat mortality, so migrants from source populations prevent sink
populations from extirpation (Pulliam 1988, Pulliam and Danielson 1991). Source-sink
dynamics can be driven by differences in food and/or habitat availability (Foppen et al.
2000), as well as predation levels (Woodford and McIntosh 2010). Source-sink relationships
seem likely between surface and cave environments as caves are likely to have low internal
recruitment.
Land use change
Caves are intimately connected to surface systems. Therefore, changes in land-use and
management practices within surface catchments can result in significant changes to cave
ecosystems (Watson et al. 1997, Poulson and Lavoie 2000, Hancock et al. 2005, Wood et al.
2008). Alterations to catchments include quarrying, agriculture, waste disposal, and
groundwater abstraction (Gunn et al. 2000), and have all been shown to effect surface stream
health, through impacts on physio-chemical and biotic conditions within aquatic ecosystems
(Harding et al. 1999, Young and Huryn 1999, Quinn and Stroud 2002, Collier and Quinn
2003, Death et al. 2003, Larned et al. 2004, Townsend et al. 2008, Wilcock et al. 2009).
Forest versus pasture
One of the commonest land-use changes has occurred in many New Zealand river
catchments, the shift from forest cover to open grasslands (Quinn 2000, Ewers et al. 2006). In
this thesis I have focussed on comparing cave streams within both forested and agriculture
land-uses. Forested streams are typically characterised by heavy shading, and allochthonous
inputs, whereas pastoral streams are typically unshaded, highly autotrophic systems (Hicks
1997, Quinn and Cooper 1997, Quinn 2000, Simon et al. 2003). These contrasting systems
are based upon different food sources; forested streams rely primarily on detritus from the
riparian zone, such as coarse particulate organic matter (CPOM), and minimal autochthonous
production. Whereas pastoral streams rely primarily upon autocthonous production (e.g.
algal), because of the high availability of light and nutrients and often poor levels of riparian
Chapter 1. General introduction: the structuring of aquatic macroinvertebrate communities within cave streams
10
vegetation (Quinn 2000, Simon et al. 2003). Autochthonous energy is energy produced
within streams, e.g. photosynthesis in algae, macrophytes, and biofilms. Allochthonous
energy is energy produced outside of streams, e.g. coarse particulate organic matter (CPOM)
and fine particulate organic matter (FPOM), and subsequently imported to the stream
environment. CPOM is an important direct food source and habitat (Winterbourn 2000), as
well as an important indirect food resource for invertebrates, acting as substrate for biofilms
(Simon and Benfield 2001, Simon et al. 2003). FPOM is also an important food source for
stream invertebrates (Winterbourn 2000), and can be transported long distances, as seston,
within the water column (Ock 2010). These sources of energy are vital to stream ecosystems
and play a significant role in the structuring of invertebrate communities (Townsend et al.
2004).
In summation, an organism’s occurrence in any habitat depends on its ability to disperse to
that location and, upon arrival, tolerate local environmental conditions, use resources, and
interact competitively with its neighbours. Taxa may persist in a sub-optimal habitat despite
extinctions through dispersal from source populations (Pulliam 1988, Leibold et al. 2004,
Holyoak et al. 2005). Within streams invertebrate dispersal is generally through drift (McLay
1970, Death 1988, 1989, McIntosh 2000, McIntosh et al. 2002), although it can be facilitated
by adult dispersal (Bunn and Hughes 1997, Winterbourn and Crowe 2001).
Cave stream community regulation
When streams enter caves their character and community are the product of their catchments;
reflecting the disturbance, resource supply, and competitive interactions dictated by upstream
conditions. However, upon entering caves some of these conditions change fundamentally
and rapidly, although the degree of change will depend upon their associated upstream
characteristics. The invertebrate communities of each cave will reflect the upstream
conditions of that stream, changing environmental gradients within the cave, and the supply
of colonists (Death 1989).
Cave environment
The cave environment is primarily characterised by a lack of light and increasing
environmental stability. There is a constant lack of riparian inputs, stable temperatures, high
humidity, and darkness; however flooding is still a common disturbance within caves. At the
location of the cave and surface ecotone edge effects may occur (Hansen et al. 1988, Nakano

Chapter 1. General introduction: the structuring of aquatic macroinvertebrate communities within cave streams
11
and Murakami 2001, Simon and Benfield 2001, Hancock 2002, Prous et al. 2004, Hancock et
al. 2005). The cave ecotone can be classified into three distinct zones (Figure 1.3). The
surface-cave, or para-hypogean, located immediately above the cave entrance, and greatly
affected by the surface system. The cave-surface edge, twilight zone or para-epigean, which
extends from the entrance until light is lost. Finally, the dark, hypogean zone, beyond the
penetration of light, which is increasingly isolated from the surface and increasingly stable
(Aley and Aley. 1997, Prous et al. 2004). Ecotones often have different communities and
higher diversity to their adjacent ecosystems, because organisms from both environments
may inhabit or forage in them (Hansen et al. 1988, Andren 1992, Nakano and Murakami
2001, Prous et al. 2004).
Resource limitation in caves
Previous studies on invertebrates communities in caves have found them to be resource
limited with strong links to surface environments (Le Grand 1973, Death 1988, 1989, Gunn
et al. 2000, Simon and Benfield 2001, Simon et al. 2003, Wood et al. 2008). Death (1989)
found benthic invertebrate densities much lower within a South Island alpine cave, and
attributed this to the lack of food, although relative abundances were similar. Death (1989)
also noted that there was potential for sustainable benthic invertebrate populations to exist
within cave systems, but it would seem more likely that populations of the majority of taxa
were strongly influenced by upstream flow and drift. However, the net spinning caddis fly
Aoteasphysche was present in higher numbers than predicted, which was attributed to their
ability to feed upon FPOM in the water column (Death 1989).
Simon et al. (2003) used stable isotope analysis and tracer additions to confirm cave stream
reliance upon imported surface material, and noted that caves may represent the heterotrophic
extreme in the continuum of stream types. However, they were unable to discern the relative
importance of the different fractions of allochthonous material; dissolved organic matter,
particulate organic matter, and associated microbes (Simon et al. 2003).

Chapter 1. General introduction: the structuring of aquatic macroinvertebrate communities within cave streams
12
Figure 1.3. The epigean–ecotone–hypogean system. The ecotone is located in a zone characterised by
gradients in environmental stability and resource availability. Hypogean and epigean communities are
located in opposite extremes – the former in a stable environment with low resource availability and
the latter in a zone of low environmental stability with high resource availability. From Prous et al.
(2004).
A study by Vinogradova et al. (1998) assessed how the loss of light affected epilithic
cyanobacteria diversity, in the dry, 90 m deep, el-Wad cave, in Mount Carmel, Israel.
Altogether 42 species from 20 genera of blue-green algae were found. Between the entrance
and the end of the cave the number of coccoid forms decreased and filamentous (especially
oscillatorial) taxa increased. Vinogradova et al. (1998) concluded that the diversity of species
and community composition of cyanophytes was reduced from the entrance to the end of the
cave concomitantly with darkness stress.
Cave fauna
Invertebrates show variable affinities to cave environments, which has led to a classification
system to describe cave invertebrates. Cave aquatic organisms have been classified into four
categories (Gibert et al. 1994).
1) Stygobites, cave obligate species.
Chapter 1. General introduction: the structuring of aquatic macroinvertebrate communities within cave streams
13
2) Stygophiles, facultative species that live and reproduce not only in caves but also in
cool, dark, moist micro-habitats outside of caves.
3) Stygoxenes, species that utilise caves, but cannot complete their life cycle entirely in
caves.
4) Cave accidentals.
The prefix stygo is used in reference to aquatic cave organisms, as opposed to troglo which is
used to describe terrestrial cave organisms.
In Peak and Speedwell Caverns, England, Gunn et al. (2000) found relatively few stygobiotic
taxa, and the majority of taxa were described as stygophiles or stygoxenes. Invertebrate
communities in allogenic cave streams, (surface streams entering caves), had a higher
diversity than autogenic streams, (streams beginning underground). The majority of taxa
within caves were also found in surface streams, although dispersal mechanisms were not
always obvious. The shining pea clam Pisidium nitidum, was found to inhabit a stream
derived from autogenic percolation and the direction of flow was towards the cave entrance,
and its mode of colonisation was uncertain (Gunn et al. 2000). Gunn et al. (2000) also noted
that epigean populations within the cave were often impoverished, compared to surface
communities, suggesting that invertebrates had difficulty in travelling through and/or
surviving in karst ecosystems.
Considerable literature exits on obligate cave dwelling species within deep caves. The species
that have received the most attention are iconic or cash-species such as the Ozark cave fish,
Amblyopsis rosae, (Stewart 1984, Aley and Aley. 1997, Graening and Brown 2003, Graening
2005), and glow-worms, Arachnocampa spp., within Australia and New Zealand (Pugsley
1984, Broadley and Stringer 2001, Baker et al. 2008, Driessen 2010). Arachnocampa
luminosa (New Zealand’s only currently identified species) are troglophiles, as they also
inhabit damp epigean environments. A. luminosa live in mucus hammocks suspended from
the roof and use bioluminescence to attract prey which they ensnare on sticky mucus threads
(Pugsley 1984). A. luminosa are known predators of adult stream invertebrates, e.g. mayflies
and chironomids, and therefore the continued persistence of these organisms within any cave
is partially dependent on the supply of invertebrate prey (Pugsley 1984). A. luminosa are
generally found in colonies, as their combined light attracts more prey, however territorial
competition occurs, and dominant organisms throw weaker individuals from the roof, or

Chapter 1. General introduction: the structuring of aquatic macroinvertebrate communities within cave streams
14
consume them (pers. comm. Professor D. Merrit). Opiliones (Harvestmen) also occupy cave
roofs, preying on both adult aquatic insects and glow-worms (Broadley and Stringer 2001).
Thus, the terrestrial cave community is structured by the supply of prey resources from
streams and competitive interactions within and between populations. At the time of this
research there have been no published studies on fish within cave environments, in New
Zealand.
The primary aim of this research was to assess differences between the structuring of cave
and surface stream macroinvertebrate communities and to determine the main drivers in
differences between these communities. To address these questions I undertook a survey of
abiotic and biotic factors within caves streams, which is discussed in chapter two. This led to
an experimental manipulation of resources (algal, habitat, and CPOM) with respect to
invertebrate communities, discussed in chapter three. The fourth chapter covers an isotopic
survey assessing energy flow within a cave system, and finally findings were summarised and
implications for management of cave systems were discussed in chapter five. The thesis has
been structured as a series of standalone scientific manuscripts (with references provided at
the end of each chapter), as such there is some repetition between chapters.

Chapter 1. General introduction: the structuring of aquatic macroinvertebrate communities within cave streams
15
References:
Aley, T., and C. Aley. 1997. Groundwater recharge area delineation, hydrobiological
assessment, and vulnerability mapping of four Ozark cavefish (Amblyopsis rosae)
populations in Missouri. A report to the Missouri department of conservation.
Allan, J. D., and M. M. Castillo. 2007. Stream ecology: structure and function of running
waters: Springer, Netherlands: 2nd ed., XIV, 436 p.
Andren, H. 1992. Corvid density and nest predation in relation to forest fragmentation: a
landscape perspective. Ecology 73:794-804.
Azad, H. S., and J. A. Borchardt. 1969. A method for predicting the effects of light intensity
on algal growth and phosphorus assimilation. Journal of the Water Pollution Control
Federation 41:392-404
Baker, C. H., G. C. Graham, K. D. Scott, S. L. Cameron, D. K. Yeates, and D. J. Merritt.
2008. Distribution and phylogenetic relationships of Australian glow-worms
Arachnocampa (Diptera, Keroplatidae). Molecular Phylogenetics and Evolution
48:506-514.
Barr, T. C. 1967. Observations on ecology of caves. American Naturalist 101:475-491.
Bolstad, P. V., and W. T. Swank. 1997. Cumulative impacts of landuse on water quality in a
southern Appalachian watershed. Journal of the American Water Resources
Association 33:519-534.
Broadley, R. A., and I. A. N. Stringer. 2001. Prey attraction by larvae of the New Zealand
glowworm, Arachnocampa luminosa (Diptera: Mycetophilidae). Invertebrate Biology
120:170-177.
Bunn, S. E., and J. M. Hughes. 1997. Dispersal and recruitment in streams: evidence from
genetic studies. Journal of the North American Benthological Society 16:338-346.
Collier, K. J., and J. M. Quinn. 2003. Land-use influences macroinvertebrate community
response following a pulse disturbance. Freshwater Biology 48:1462-1481.
Culver, D. C., T. C. Kane, and D. W. Fong. 1995. Adaptation and natural selection in caves:
the evolution of Gammarus minus. Harvard University Press, Cambridge,
Massachusetts London, England.
Death, R. G. 1988. Drift distance, periodicity and frequency of benthic invertebrates in a cave
stream. Verhandlungen der Internationalen Vereinigung für Theoretische und
Angewandte Limnologie 23:1446-1450.

Chapter 1. General introduction: the structuring of aquatic macroinvertebrate communities within cave streams
16
Death, R. G. 1989. The effect of a cave on benthic invertebrate communities in a South Island
stream. New Zealand Natural Sciences 16:67-78.
Death, R. G., B. Baillie, and P. Fransen. 2003. Effect of Pinus radiata logging on stream
invertebrate communities in Hawke's Bay, New Zealand. New Zealand Journal of
Marine and Freshwater Research 37:507-520.
Driessen, M. M. 2010. Enhancing conservation of the Tasmanian glow-worm,
Arachnocampa tasmaniensis Ferguson (Diptera: Keroplatidae) by monitoring
seasonal changes in light displays and life stages. Journal of Insect Conservation
14:65-75.
Duan, B., B. F. Li, R. S. Liu, and X. L. Tong. 2008. Diel rhythm of benthic
macroinvertebrate's drift in streams in Hengshishui River watershed of Guangdong,
China. Chinese Journal of Applied Ecology 19:1084-1090.
Ewers, R. M., A. D. Kliskey, S. Walker, D. Rutledge, J. S. Harding, and R. K. Didham. 2006.
Past and future trajectories of forest loss in New Zealand. Biological Conservation
133:312-325.
Foppen, R. P. B., J. P. Chardon, and W. Liefveld. 2000. Understanding the role of sink
patches in source-sink metapopulations: Reed Warbler in an agricultural landscape.
Conservation Biology 14:1881-1892.
Gibert, J., D. L. Danielopol, and J. A. Stanford. 1994. Groundwater Ecology, Academic
Press, United States of America.
Gibert, J., and L. Deharveng. 2002. Subterranean ecosystems: a truncated functional
biodiversity. BioScience 52:473-481.
Graening, G. O. 2005. Trophic structure of Ozark cave streams containing endangered
species. Oceanological and Hydrobiological Studies 34:3-17.
Graening, G. O., and A. V. Brown. 2003. Ecosystem dynamics and pollution effects in an
Ozark cave stream. Journal of the American Water Resources Association 39:1497-
1507.
Gunn, J., P. Hardwick, and P. J. Wood. 2000. The invertebrate community of the Peak-
Speedwell cave system, Derbyshire, England - pressures and considerations for
conservation management. Aquatic Conservation: Marine and Freshwater Ecosystems
10:353-369.
Hancock, P. J. 2002. Human impacts on the stream-groundwater exchange zone.
Environmental Management 29:763-781.

Chapter 1. General introduction: the structuring of aquatic macroinvertebrate communities within cave streams
17
Hancock, P. J., A. J. Boulton, and W. F. Humphreys. 2005. Aquifers and hyporheic zones:
towards an ecological understanding of groundwater. Hydrogeology Journal 13:98-
111.
Hansen, A. J., F. Castri, and R. J. Naiman. 1988. Ecotones: what and why? Biology
International Special Issue 17:9-46.
Harding, J. S., R. G. Young, J. W. Hayes, K. A. Shearer, and J. D. Stark. 1999. Changes in
agricultural intensity and river health along a river continuum. Freshwater Biology
42:345-357.
Hart, D. D., and C. M. Finelli. 1999. Physical-biological coupling in streams: the pervasive
effects of flow on benthic organisms. Annual Review of Ecology and Systematics
30:363-395.
Hicks, B. J. 1997. Food webs in forest and pasture streams in the Waikato region, New
Zealand: a study based on analyses of stable isotopes of carbon and nitrogen, and fish
gut contents. New Zealand Journal of Marine and Freshwater Research 31:651-664.
Holomuzki, J. R., and B. J. F. Biggs. 2000. Taxon-specific responses to high-flow
disturbance in streams: implications for population persistence. Journal of the North
American Benthological Society 19:670-679.
Holyoak, M., M. A. Leibold, and R. D. Holt. 2005. Metacommunities: spatial dynamics and
ecological communities. University of Chicago Press, Chicago, Illinois, USA.
Howarth, F. G. 1983. Ecology of cave arthropods. Annual Review of Entomology 28:365-
389.
Kohler, S. 1985. Identification of stream drift mechanisms: an experimental and
observational approach. Ecology 66:1749-1761.
LaMoreaux, P. E., W. J. Powell, and H. E. LeGrand. 1997. Environmental and legal aspects
of karst areas. Environmental Geology 29:23-36.
Larned, S. T., M. R. Scarsbrook, T. H. Snelder, N. J. Norton, and B. J. F. Biggs. 2004. Water
quality in low-elevation streams and rivers of New Zealand: recent state and trends in
contrasting land-cover classes. New Zealand Journal of Marine and Freshwater
Research 38:347-366.
Le Grand, H. E. 1973. Hydrological and ecological problems of karst regions. Science
179:859-864.
Leibold, M. A., M. Holyoak, N. Mouquet, P. Amarasekare, J. M. Chase, M. F. Hoopes, R. D.
Holt, J. B. Shurin, R. Law, D. Tilman, M. Loreau, and A. Gonzalez. 2004. The
Chapter 1. General introduction: the structuring of aquatic macroinvertebrate communities within cave streams
18
metacommunity concept: a framework for multi-scale community ecology. Ecology
Letters 7:601-613.
McIntosh, A., R. 2000. Aquatic predator-prey interactions. Collier.K.J. and Winterbourn,
M.J. eds. New Zealand stream invertebrates: ecology and implications for
management. New Zealand Liminological Society, Christchurch:140-141.
McIntosh, A. R., B. L. Peckarsky, and B. W. Taylor. 2002. The influence of predatory fish on
mayfly drift: extrapolating from experiments to nature. Freshwater Biology 47:1497-
1513.
McLay, C. 1970. A theory concerning distance travelled by animals entering drift of a stream.
Journal of the Fisheries Research Board of Canada 27:359-370.
Moseley, M. 2007. Acadian biospeleology: composition and ecology of cave fauna of Nova
Scotia and southern New Brunswick, Canada. International Journal of Speleology
36:1-21.
Nakano, S., and M. Murakami. 2001. Reciprocal subsidies: dynamic interdependence
between terrestrial and aquatic food webs. Proceedings of the National Academy of
Sciences of the United States of America 98:166-170.
Ock, G. T., Y. 2010. Estimation of transport distance of fine particulate organic matter in
relation to channel morphology in tailwaters of the Lake Biwa and reservoir dams.
Landscape and Ecological Engineering 6:1-9.
Peckarsky, B. 1983. Biotic interactions or abiotic limitations? A model of lotic community
structure. Fontaine, T. and Bartell, S. eds: Dynamics of lotic ecosystems: Ann Arbor
Science Publishers, Michigan, USA, pp 303-323
Polis, G. A., W. B. Anderson, and R. D. Holt. 1997. Toward an integration of landscape and
food web ecology: the dynamics of spatially subsidized food webs. Annual Review of
Ecology and Systematics 28:289-316.
Poulson, T. L., and K. H. Lavoie. 2000. The trophic basis of subsurface ecosystems.
Ecosystems of the world 30: subterranean ecosystems; Wilkens H, Culver D.C,
Humphreys W.F, eds. Elsevier. Amsterdam, 2000pp. 231–249. .
Prous, X., R. Lopes Ferreira, and R. Parentoni Martins. 2004. Ecotone delimitation: epigean-
hypogean transition in cave ecosystems. Austral Ecology 29:374-382.
Pugsley, C. 1984. Ecology of the New Zealand glowworm, Arachnocampa luminosa
(Diptera: Keroplatidae), in the Glowworm Cave, Waitomo. Journal of the Royal
Society of New Zealand 14:387- 407.

Chapter 1. General introduction: the structuring of aquatic macroinvertebrate communities within cave streams
19
Pulliam, H. R. 1988. Sources, sinks and population regulation. American Naturalist 132:652-
661.
Pulliam, H. R., and B. J. Danielson. 1991. Sources, sinks, and habitat selection: a landscape
perspective on population dynamics. American Naturalist 137:60-66.
Quinn, J. M. 2000. Effects of pastoral development. In: Collier.K.J. and Winterbourn,M.J.
eds. New Zealand stream invertebrates: ecology and implications for management.
New Zealand Liminological Society, Christchurch:208-229.
Quinn, J. M., and A. B. Cooper. 1997. Land-water interactions at Whatawhata, New Zealand:
introduction and synthesis. New Zealand Journal of Marine and Freshwater Research
31:569-577.
Quinn, J. M., and M. J. Stroud. 2002. Water quality and sediment and nutrient export from
New Zealand hill-land catchments of contrasting land use. New Zealand Journal of
Marine and Freshwater Research 36:409-429.
Roldán, M., and M. Hernández-Mariné. 2009. Exploring the secrets of the three-dimensional
architecture of phototrophic biofilms in caves. International Journal of Speleology
38:41-53.
Sarbu, S. M., T. C. Kane, and B. K. Kinkle. 1996. A chemoautotrophically based cave
ecosystem. Science 272:1953-1954.
Simon, K. S., and E. F. Benfield. 2001. Leaf and wood breakdown in cave streams. Journal of
the North American Benthological Society 20:550-563.
Simon, K. S., E. F. Benfield, and S. A. Macko. 2003. Food web structure and the role of
epilithic biofilms in cave streams. Ecology 84:2395-2406.
Stewart, J. 1984. Endangered and threatened wildlife and plants; proposed threatened status
for the Ozark Cavefish (Amblyopsis rosae). Federal Register 49:3889-3891
Tobler, M. 2008. Divergence in trophic ecology characterizes colonization of extreme
habitats. Biological Journal of the Linnean Society 95:517-528.
Townsend, C. R., B. J. Downes, K. Peacock, and C. J. Arbuckle. 2004. Scale and the
detection of land-use effects on morphology, vegetation and macroinvertebrate
communities of grassland streams. Freshwater Biology 49:448-462.
Townsend, C. R., S. S. Uhlmann, and C. D. Matthaei. 2008. Individual and combined
responses of stream ecosystems to multiple stressors. Journal of Applied Ecology
45:1810-1819.
Turner, M. G. 1989. Landscape ecology: the effect of pattern on process. Annual review of
ecology and systematics. Vol. 20:171-197.

Chapter 1. General introduction: the structuring of aquatic macroinvertebrate communities within cave streams
20
Vinogradova, O. N., O. V. Kovalenko, S. P. Wasser, E. Nevo, and M. Weinstein-Evron.
1998. Species diversity gradient to darkness stress in blue-green algae/cyanobacteria:
a microscale test in a prehistoric cave, Mount Carmel, Israel. Israel Journal of Plant
Sciences 46:229-238.
Watson, J., E. Hamilton-Smith, D. Gillieson, and K. Kiernan. 1997. Guidelines for cave and
karst protection, International union for conservation of nature and natural resources.
Cambridge. 53 pp.
Wilcock, R. J., K. Betteridge, D. Shearman, C. R. Fowles, M. R. Scarsbrook, B. S. Thorrold,
and D. Costall. 2009. Riparian protection and on-farm best management practices for
restoration of a lowland stream in an intensive dairy farming catchment: a case study.
New Zealand Journal of Marine and Freshwater Research 43:803-818.
Williams, P. W. 1992. Karst in New Zealand. in: Landforms of New Zealand; Soons, M.J.
and Selby, J.M. eds; Longman Paul, New Zealand.
Winterbourn, M. J. 2000. Feeding ecology. Collier.K.J.; Winterbourn,M.J. eds. New Zealand
stream invertebrates: ecology and implications for management. New Zealand
Liminological Society, Christchurch:100-124.
Winterbourn, M. J., and A. L. M. Crowe. 2001. Flight activity of insects along a mountain
stream: is directional flight adaptive? Freshwater Biology 46:1479-1489.
Wood, P. J., J. Gunn, and J. Perkins. 2002. The impact of pollution on aquatic invertebrates
within a subterranean ecosystem - out of sight out of mind. Archiv für Hydrobiologie
155:223-237.
Wood, P. J., J. Gunn, and S. D. Rundle. 2008. Response of benthic cave invertebrates to
organic pollution events. Aquatic Conservation: Marine and Freshwater Ecosystems
18:909-922.
Woodford, D. J., and A. R. McIntosh. 2010. Evidence of source-sink metapopulations in a
vulnerable native galaxiid fish driven by introduced trout. Ecological Applications
20:967-977.
Young, R. G., and A. D. Huryn. 1999. Effects of land use on stream metabolism and organic
matter turnover. Ecological Applications 9:1359-1376.

21
Aoteapsyche 700 meters within Murchies cave

Chapter Two. Cave communities across a longitudinal gradient: source-sink populations structured by resource limitations
22
Chapter Two
Cave communities across a longitudinal gradient: source-sink populations
structured by resource limitations
Abstract
Caves are unique ecosystems with challenging environmental conditions, resulting in
relatively depauperate communities. One of the most important approaches to understanding
their invertebrate communities is by investigating their structuring forces. To assess the
structure of cave communities, across an environmental gradient, I investigated three streams
(two in pasture catchments and one in a forested catchment) flowing into caves in the
Waitomo region, North Island, New Zealand. In each stream 12 sites were sampled
longitudinally: four sites were upstream of the cave entrance and the remaining eight sites
were arranged from the entrance to 256 m inside the cave. A range of physical, chemical, and
biological parameters were assessed along this environmental gradient. As expected, light
intensity and algal production were tightly linked, high at surface sites and exponentially
decreasing within the caves. Cave communities had significantly fewer benthic invertebrate
taxa (P = 0.046) and lower densities (P = 0.0020) than surface communities. Cave benthic
invertebrate communities were a sub-set of surface communities, primarily structured by a
decrease in resources, and surface recruitment. Further than 32 m inside the caves similar
invertebrate densities were found, suggesting that resources were constant and a continuous
supply of invertebrates, via drift, meant resources were exploited. The propensity of
invertebrates to drift increased within the caves, presumably because caves were resource
limited, while drift density remained constant. Several taxa were found at densities varying
from those expected, suggesting that the physical and behavioural adaptations of taxa play a
role in survival. Finally, caves constituted a sink, arising from the surface stream invertebrate
source populations, further confirming the importance of upstream surface land-use and
stream health.
Chapter Two. Cave communities across a longitudinal gradient: source-sink populations structured by resource limitations
23
Introduction
Globally, 97% of all unfrozen freshwater is subterranean, surface lakes and rivers encompass
less than two percent (Gibert et al. 1994). Despite the importance and volume of subterranean
waters, surprisingly little ecological research has been conducted on these systems, and even
fewer studies have intensively investigated aquatic communities and food-webs within caves
(Simon et al. 2003). Cave streams experience a different set of environmental conditions,
relative to those occurring on the surface. They include an absence of light, limited
temperature variation, and scarcity of food, resulting in caves providing extreme, harsh,
habitats for aquatic life (Ginet and Decou 1977). Abiotic and biotic gradients drive changes
in resource availability and quality (Howarth 1983, Culver and Sket 2000, Gunn et al. 2000,
Simon et al. 2003, Tobler 2008), as well as competitive interactions within and between
species (Tobler 2008). As a result, caves tend to sustain depauperate, weakly productive
communities (McMullin et al. 2000, Tsurumi 2003, Tobler 2008).
The unusual environmental conditions within caves provide unique opportunities for
developing an understanding of ecosystem processes, and functioning (Gibert and Deharveng
2002). Specifically, caves provide excellent models of how/if changes in biodiversity and
resources, such as energy and habitat, affect invertebrate communities (Ginet and Decou
1977, Death 1988, 1989, Sarbu et al. 1996, Looser et al. 1999, Gunn et al. 2000, Simon et al.
2003, Graening 2005, Herrando-Perez et al. 2008)
The most obvious difference between surface (epigean) and cave habitats (hypogean) is the
lack of solar energy in caves. In surface environments this elemental building block of life
fuels the evolution of complex diverse communities (Azad and Borchardt 1969). However,
because cave communities are reliant upon limited amounts of detrital energy they tend to
have relatively simple, depauperate communities (Gunn et al. 2000). Thus, hypogean and
epigean communities can be viewed as representing opposite extremes of a continuum, with
epigean communities being structured by high resource availability, and hypogean
communities being structured by low resource availability (Death 1989, Simon et al. 2003,
Prous et al. 2004).
A major factor limiting aquatic communities in caves is therefore the supply of carbon, with
the majority of cave systems entirely dependent on allochthonous, detrital resources (Barr
1967, Simon and Buikema 1997, Looser et al. 1999, Gunn et al. 2000, Wood et al. 2002,
Chapter Two. Cave communities across a longitudinal gradient: source-sink populations structured by resource limitations
24
Simon et al. 2003, Wood et al. 2008). There are few examples of autochthonous energy
sources in caves, such as those provided by chemotrophs (Sarbu et al. 1996, Engel 2007,
Porter et al. 2009). Sarbu et al. (1996) studied a cave system in Romania that had a water
temperature of 21oC and was rich in hydrogen sulphide. Chemoautotrophic energy provided
the trophic basis for the community, which had many similarities to deep-sea volcanic
communities (Sarbu et al. 1996). However, apart from rare examples such as this, caves are
thought to be primarily dependent upon surface-derived materials.
The point at which ecosystems or habitats meet is known as an ecotone (Prous et al. 2004)
(Figure 1.3). This transition zone between adjacent ecological systems has a set of unique
features defined by spatial scale, and the strength of the interactions between the systems
(Hansen et al. 1988). Within an ecotone diversity can be higher, similar, or lower than in
adjacent ecosystems (Prous et al. 2004). Cave ecotones can be divided into distinct zones.
First, the entrance, or para-hypogean zone is located immediately outside the cave mouth, and
is greatly affected by the surface system. The twilight, or para-epigean, zone extends from the
entrance to a point where light is lost. Finally, the dark, or deep cave zone is almost entirely
isolated from the surface (Aley and Aley. 1997). The response of stream communities to
these transition zones has not been documented in New Zealand.
Terrestrial land-use activities such as agriculture, quarrying, and waste disposal have
significant impacts on physico-chemical and biotic interactions within surface aquatic
ecosystems (Quinn and Cooper 1997, Harding et al. 1999, Quinn 2000, Quinn and Stroud
2002, Collier and Quinn 2003, Townsend et al. 2004, Townsend et al. 2008), and they in turn
influence the aquatic systems of caves (Gunn et al. 2000, Mazina et al. 2009, Shi et al. 2009).
Hence, changes in land-use and management practices in epigean catchments can result in
significant changes to hypogean ecosystems (Watson et al. 1997, Poulson and Lavoie 2000,
Hancock et al. 2005).
Forested streams are typically characterised by heavy shading and heterotrophic inputs,
whereas pastoral streams are typically unshaded, highly autotrophic systems (Figure 2.1)
(Hicks 1997, Quinn and Cooper 1997, Simon et al. 2003). These contrasting systems are
based upon different food (carbon) resources, with forested streams relying mostly on
detritus, such as coarse particulate organic matter (CPOM), because of minimal
autochthonous production. In contrast, pastoral streams rely upon allochthonous production
Chapter Two. Cave communities across a longitudinal gradient: source-sink populations structured by resource limitations
25
(e.g. algal) because of a lack of riparian vegetation and increased nutrient and light levels
(Scarsbrook and Townsend 1993, Quinn 2000, Scarsbrook et al. 2001, Niyogi et al. 2007a).
Simon and Benfield (2001) noted that nutrient limitation was unlikely to occur within cave
streams because nutrient concentrations were typically high in karst groundwater, a result of
agricultural inputs. Additionally, cave systems are vulnerable to land-use change as
sediments and nutrients readily percolate through fissures in overlying bedrock, particularly
during precipitation events (Bolstad and Swank 1997).
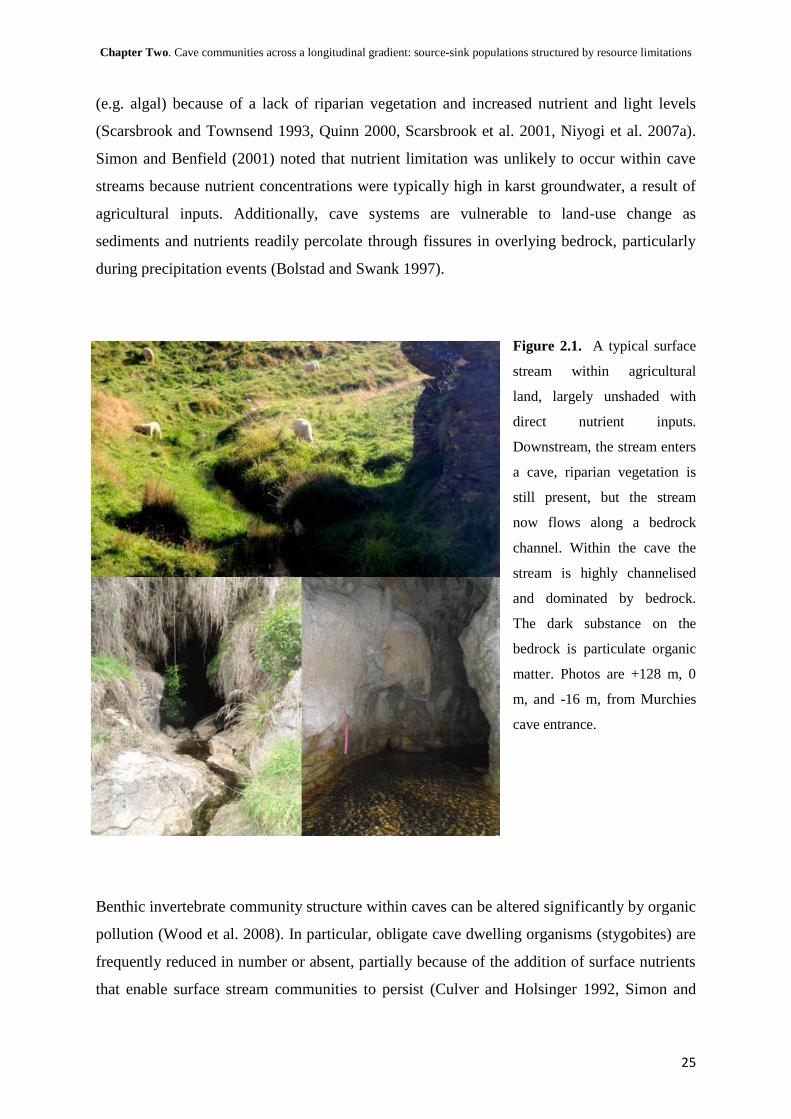
Figure 2.1. A typical surface
stream within agricultural
land, largely unshaded with
direct nutrient inputs.
Downstream, the stream enters
a cave, riparian vegetation is
still present, but the stream
now flows along a bedrock
channel. Within the cave the
stream is highly channelised
and dominated by bedrock.
The dark substance on the
bedrock is particulate organic
matter. Photos are +128 m, 0
m, and -16 m, from Murchies
cave entrance.
Benthic invertebrate community structure within caves can be altered significantly by organic
pollution (Wood et al. 2008). In particular, obligate cave dwelling organisms (stygobites) are
frequently reduced in number or absent, partially because of the addition of surface nutrients
that enable surface stream communities to persist (Culver and Holsinger 1992, Simon and

Chapter Two. Cave communities across a longitudinal gradient: source-sink populations structured by resource limitations
26
Buikema 1997, Graening and Brown 2003). Epigean invertebrates are generally not adapted
to survive and reproduce within cave environments so the occurrence of epigean animals
within cave environments may be indicative of source-sink dynamics. A source-sink
interaction occurs when individuals from a highly productive source habitat move into less
productive sink habitats where mortality is greater than reproduction (Pulliam 1988, Pulliam
and Danielson 1991, Leibold et al. 2004, Holyoak et al. 2005, Woodford and McIntosh
2010).
Benthic cave invertebrate communities may initially be structured by drift from up-stream
(Death 1989), but may also respond independently to resource gradients within caves (Simon
and Buikema 1997). Drift is a low-energy means of migration, which enables stream
invertebrates to leave risky habitats or escape predation (McLay 1970, McIntosh 2000,
Winkelmann et al. 2008). The proportional occurrence of species drifting is expected to be
more or less similar to that on the benthos, deviations being a consequence of behavioural or
structural attributes of the species (McLay 1970). Drift can be passive or active, with active
drifters such as mayflies, drifting further than passive drifters, such as cased caddisflies
(McLay 1970, Duan et al. 2008, Winkelmann et al. 2008).
In this chapter I report the results of an investigation into longitudinal gradients in
invertebrate communities and abiotic variables across cave ecotones. I proposed that surface
streams entering caves would undergo marked changes in physical structure and water
quality. Firstly, light levels would be reduced at cave entrances, and at some distance into a
cave light would no longer be present, resulting in marked changes to primary production
(e.g. algal and macrophyte growth). It is also logical to expect that diel variations in light,
and therefore water temperature, would affect water temperatures inside the caves.
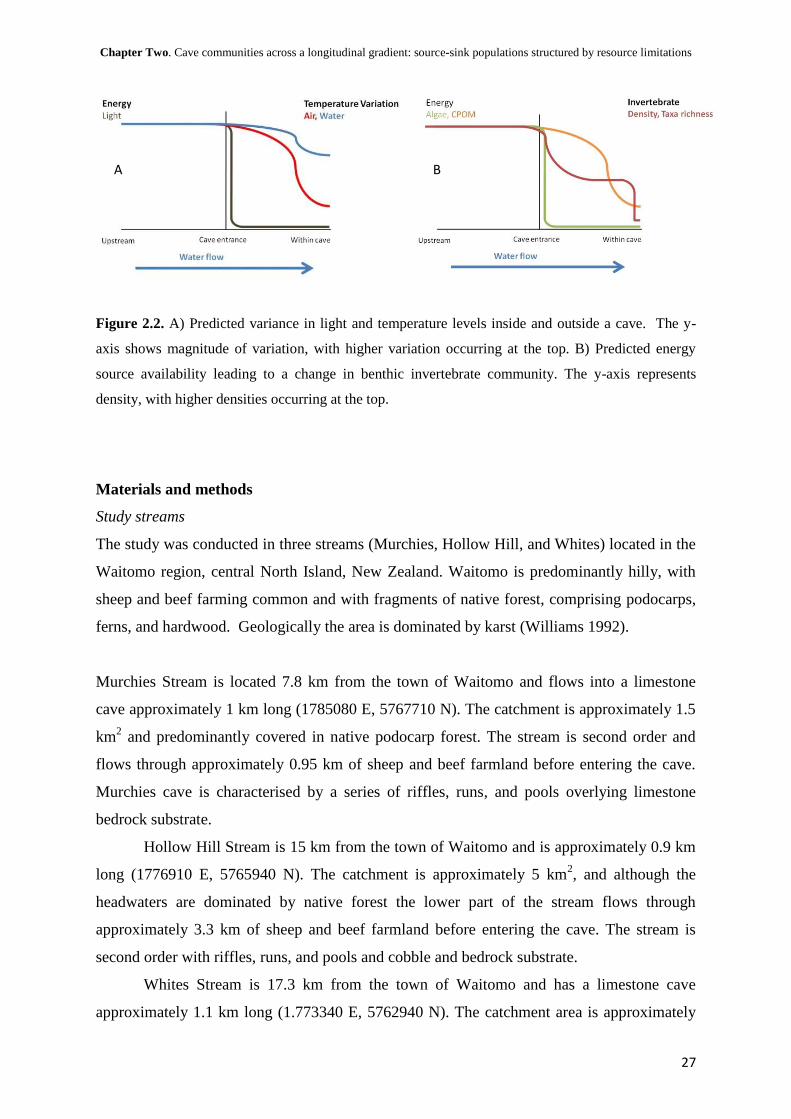
Therefore, I predicted that temperature variations would be greater outside the cave (Figure
2.2a). I predicted that algae would be the main food source for benthic invertebrates outside
caves, while inside caves, imported carbon in the form of FPOM (fine particulate organic
matter) and CPOM, should become increasingly important. Finally, I predicted that changes
in food sources would lead to major changes in benthic communities, particularly taxonomic
richness, density, and feeding strategies (Figure 2.2b). However, these changes may not be
linear as ecotone effects would be expected to occur around cave entrances and deeper
transition zones.
Chapter Two. Cave communities across a longitudinal gradient: source-sink populations structured by resource limitations
27
Figure 2.2. A) Predicted variance in light and temperature levels inside and outside a cave. The y-
axis shows magnitude of variation, with higher variation occurring at the top. B) Predicted energy
source availability leading to a change in benthic invertebrate community. The y-axis represents
density, with higher densities occurring at the top.
Materials and methods
Study streams
The study was conducted in three streams (Murchies, Hollow Hill, and Whites) located in the
Waitomo region, central North Island, New Zealand. Waitomo is predominantly hilly, with
sheep and beef farming common and with fragments of native forest, comprising podocarps,
ferns, and hardwood. Geologically the area is dominated by karst (Williams 1992).
Murchies Stream is located 7.8 km from the town of Waitomo and flows into a limestone
cave approximately 1 km long (1785080 E, 5767710 N). The catchment is approximately 1.5
km2 and predominantly covered in native podocarp forest. The stream is second order and
flows through approximately 0.95 km of sheep and beef farmland before entering the cave.
Murchies cave is characterised by a series of riffles, runs, and pools overlying limestone
bedrock substrate.
Hollow Hill Stream is 15 km from the town of Waitomo and is approximately 0.9 km
long (1776910 E, 5765940 N). The catchment is approximately 5 km2, and although the
headwaters are dominated by native forest the lower part of the stream flows through
approximately 3.3 km of sheep and beef farmland before entering the cave. The stream is
second order with riffles, runs, and pools and cobble and bedrock substrate.
Whites Stream is 17.3 km from the town of Waitomo and has a limestone cave
approximately 1.1 km long (1.773340 E, 5762940 N). The catchment area is approximately
A B

Chapter Two. Cave communities across a longitudinal gradient: source-sink populations structured by resource limitations
28
1.5 km2, predominantly covered by native podocarps. The stream has two tributaries, one of
which is sourced from a farm pond and wetland and one, the larger, from native forest. The
stream is composed of riffles, runs, and pools with a limestone bed and silt filled pools.
Study reaches
On each stream 12 sites distributed on a log2 scale were sampled. Of these, four sites (+128m,
+32m, +8m, +4m) were upstream of the cave entrance, one was located at the cave entrance
(0 m), and a further seven were located inside the cave (-2 m, -4 m, -8 m, -16 m, -32 m, -128
m, -256 m). At Hollow Hill a rock fall occurred at -16 m so a site was established at -64 m.
A range of physical, chemical, and biological parameters were measured at each site. Air and
water temperature loggers (DS1921 iButton Temperature Dataloggers, Maxim Innovation, or
hobo data loggers, Onset computer corporation, H08) were placed at seven sites (+128 m, +8
m, 0 m, -8 m, -32 m, -128 m, and -256 m) within each cave. Air and water temperature were
measured every 15 minutes from 1 March to 18 March 2009. At each site wetted width was
measured and water velocity was calculated at five evenly spaced distances across the stream,
using a pygmy current meter. Stream depth measurements were taken at each water velocity
location. Spot measures were taken of conductivity, temperature, and pH (Elemetron CX-
401- waterproof).
Chlorophyll-a biomass was estimated from ceramic tiles (~24.95 cm2) which were allowed to
colonise for an average of four weeks. Six tiles were placed at each of nine sites in each
stream (+32 m, +8 m, +4 m, 0 m, -2 m, -4 m, -8 m, -16 m, and -32 m). After four weeks, each
tile was removed, scrubbed with a wire brush in water, and the slurry filtered through
Whatman glass microfiber filters (diameter 47 mm, nominal pore size 1 µm), wrapped in
aluminium foil and frozen. Chlorophyll-a was measured using a flurometer (Trilogy 7200-00,
Turner designs, Sunnyvale, CA). To extract chlorophyll-a, 50 ml pottles (covered with black
duct tape, to reduce light) were used. Pottles were rinsed twice with 50% ethanol before the
addition of algal samples and were left in a darkened room to extract in 20 ml of buffered
ethanol for 12 to 16 hours. Buffered ethanol was made using 90% ethanol and 10%
supersaturated magnesium carbonate (MgCO3) solution, which was made by adding 10 g of
MgCO3 to 1000 ml of nanopure water, and letting it settle for 24 hours. Three ml of extracted
sample was used to rinse test tubes (12 mm by 70 mm glass test tubes), before 3 ml of sample
was added to each tube with a micro-pipette. Samples were then measured flurometrically, in

Chapter Two. Cave communities across a longitudinal gradient: source-sink populations structured by resource limitations
29
relative fluorescence units (RFU). Immediately after this 30 µL of 0.1 N HCl was added to
each test tube and the sample was left to degrade for 2-5 minutes. They were then remeasured
to enable chlorophyll-a and pheophytin-a to be separated. If an RFU value > 1 million was
obtained samples were diluted. For diluted samples 0.3 ml of extracted sample was added to
the test tube, followed by 2.7 ml of buffered ethanol. The samples were then processed as
above. To prepare 0.1 N HCl acid 8.5 ml of concentrated hydrochloric acid was added to 800
ml of deionized water in a one litre volumetric flask, and then topped up with deionized
water.
The amount of chlorophyll-a in samples was calculated using the following equations:
(a) Chlorophyll a per unit area:
Chl a (mg / units of area, e.g., m2) = R * (fluoresence before - fluoresence after) * (extract
volume of the sample / area of sample m2) * (total volume / subsample volume)*(1 / dilution
factor)
(b) Chlorophyll a per unit volume:
Chl a (mg / L) = R * (fluoresence before - fluoresence after) * (extract volume of the sample /
total volume) * (total volume / subsample volume) * (1 / dilution factor)
The dilution factor was determined as: dilution factor = volume of sample added to cuvette /
(volume of sample added + volume of buffered ethanol added), i.e., the total volume is in the
denominator, or the part to the whole). All volumes are in litres. References for chlorophyll a
extractions methods and equations include Nusch (1980) and Sartory and Grobbelaar (1984).
Samples of fine particulate organic matter (FPOM) in suspension were obtained from each
site by taking a 4.5 L water sample, which was filtered through a Whatman glass microfiber
filter (diameter 47 mm, nominal pore size 1 µm), wrapped in aluminium foil and frozen. In
the laboratory, samples were dried at 45ºC for at least 56 hours. Samples were weighed and
ashed at 550ºC for 3 hours. Ashed samples were re-weighed and the ash-free dry weight
(AFDW) of FPOM calculated. Coarse particulate organic matter (CPOM) was collected from
benthic invertebrate Surber samples, which were kept in 90% ethanol prior to processing. In
Chapter Two. Cave communities across a longitudinal gradient: source-sink populations structured by resource limitations
30
the laboratory, organic matter was removed and dried at 45ºC for at least 101 hours. The
samples were weighed, ashed at 550ºC for 3 h, re-weighed and the AFDW of CPOM
calculated.
Benthic invertebrates were collected from each site in March 2009. Three Surber samples
(0.0625 m2, mesh 500 µm) and one composite kick-net (mesh 500 µm) were taken from each
site. All samples were preserved in 90% ethanol in the field, and sorted in the laboratory
under a Wild M3 dissecting microscope, at 6.4 to 40x magnification. Identifications were
made using the keys and guides of Winterbourn (1973), Chapman and Lewis (1976), and
Winterbourn et al. (2000). Identifications were carried out to the lowest taxonomic level
possible, except for Chironomidae, which were not separated below tribe.
Benthic invertebrate drift was measured once over 24 h using three drift nets (net opening
105 x 55 mm, mesh 500 µm). Drift was measured at all 12 sites, but because upstream nets
might disrupt catches at downstream sites only one site per stream was sampled over any 24 h
period. Nets were placed at randomly selected sites and were moved to other randomly
selected sites until all 12 sites had been sampled. Water velocity was measured for 90
seconds at the mouth of each drift net, using a pygmy current meter. Drift sampling was
carried out during March 2009 when streams were close to base flow, and before benthic
sampling began. Samples were transferred to pottles in the field and preserved in 90%
ethanol. Drift propensity was calculated by dividing invertebrate drift density by invertebrate
benthic density (McIntosh et al. 2002).
Adult flying insects were sampled using six sticky traps placed above the drift nets at each
site. Sticky traps were positioned as close to the stream surface as possible, and were
constructed from A4 sized sheets (623.7 cm2) of clear plastic, and coated with Tanglefoot
(Tanglefoot CO. USA). Sheets were placed back to back so that three sheets faced upstream
and three faced downstream, and left for approximately 24 h, removed, wrapped in
“Gladwrap”, and frozen.
Chapter Two. Cave communities across a longitudinal gradient: source-sink populations structured by resource limitations
31
Statistical methods
Data were transformed when necessary, either by a ln, log, or ln (x+1), to correct for
normality (Quinn and Keough 2002). Non-metric Multi-Dimensional Scaling (NMDS)
models were run in Primer 6.1.12 (Clarke and Warwick 2001) as were associated analyses of
similarity (ANOSIMS). NMDS and ANOSIM were used to compare community composition
of the streams. Data from the three caves were analysed separately because their separation
in ordination space, suggested different processes and communities occurred in them. Had
the combined data set been analysed the results would have described differences between
caves rather than patterns common to all caves.
Detrended Correspondence Analysis (DCA) models were run in CANOCO 4.5 (ter Braak and
Šmilauer 2002) and de-trended by segments. Data were then log(x +1) transformed and rare
species were down weighted. Canoniacl Correspondence Analysis (CCA) models were run in
CANOCO 4.5. Data were then log(x +1) transformed and rare species were down weighted.
Significant variables were selected manually using 999 Monte Carlo permutations. The
significance level was set at P < 0.10 to reduce the likelihood of rejecting biologically
relevant variables (Legendre and Legendre 1998). An RDA was run for Whites cave, rather
than a CCA, because of its low gradient score. RDA models focus on inter-species
correlations with species scores divided by the standard deviation. Data were then log(x +1)
transformed and rare species were down weighted. Data was centred by species. Significant
drivers were selected manually using 999 Monte Carlo permutations. The significance level
was set at P < 0.10 to reduce the likelihood of rejecting biologically relevant variables
(Legendre and Legendre 1998). Permutations were set to unlimited.
Standard errors of the mean were calculated by dividing standard deviations by the number of
samples. Regressions were linear and calculated in Sigma plot (2001, Systat Software Inc).
Results
Abiotic conditions
Light intensity, chlorophyll-a concentration, and CPOM biomass were significantly
correlated with distance from cave entrances (R2
= 0.91, F = 99.23, df = 11, P < 0.001), (R2
=
0.84, F = 37.45, df = 8, P < 0.001), and (R2
= 0.47, F = 8.99, df = 11, P = 0.013), respectively
(Figure 2.3). The large variation in light intensity outside caves was influenced by

Chapter Two. Cave communities across a longitudinal gradient: source-sink populations structured by resource limitations
32
differences in riparian vegetation density. The length of the twilight zone (distance light
penetrated inside the cave) varied between caves, ranging from 8 m to 32 m. The para-
epigean zone (immediately above the cave entrance) was less well defined, but was
approximately 0 - 8 m. In contrast to light, water temperature, dissolved oxygen, and stream
width, depth, and velocity did not vary significantly (P > 0.05) between the outside and
inside of caves. Unfortunately, FPOM values for all sites did not differ from blank control
filters, suggesting that 4.5 L water samples were not large enough to detect FPOM biomass.
Distance from entrance (m)
Chlo
rophyll-a
(ln
(mg/m
2))
3
4
5
6
7
8
9
CP
OM
(ln
(g/m
2)
-2
-1
0
1
2
3
4
Lig
ht
inte
nsity
(ln(lux+
1))
-2
0
2
4
6
8
10
12
Figure 2.3. Light intensity, chlorophyll-a, and CPOM at 12 sites on a longitudinal gradient from
upstream to inside caves. Mean ±1standard error (n = 3). In this figure and the following (unless
otherwise stated) the dotted line represents the cave entrance, the sun represents outside the cave, and
the black square represents inside the cave.
Benthic invertebrate communities
Comparisons of benthic invertebrate taxonomic richness across all three streams showed that
richness decreased in caves (R2
= 0.34, F = 5.19, df = 11, P = 0.046) (Figure 2.4).
Invertebrate density showed a similar pattern, and was significantly higher outside the caves
(R2
= 0.63, F = 17.08, df = 11, P = 0.0020) (Figure 2.4). No aquatic invertebrate species were
found to be unique to caves, and as such were a subset of surface communities, upstream of
the caves.
Distance from entrance (m)
1000 100 10 0 -10 -100 -1000 1000 100 10 0 -10 -100 -1000 1000 100 10 0 -10 -100 -1000

Chapter Two. Cave communities across a longitudinal gradient: source-sink populations structured by resource limitations
33
Distance from entrance (m)
-3-2-10123
T
axo
no
mic
ric
hn
ess (
ln(x
))
0
1
2
3
-3-2-10123
Be
nth
ic d
en
sity (
ln(m
-2))
4
5
6
7
8
9
Figure 2.4. Benthic taxonomic richness and density at 12 sites along a longitudinal gradient from
128 m above the cave entrances to 256 m inside the caves. Mean ± standard error (n = 3)
The propensity of invertebrates to drift differed inside and outside the caves (Figure 2.5) and,
there was a significant increase in drift propensity (drift density / benthic density, m3s
-1/m
2)
with distance into the cave (R2
= 0.62, F = 16.57, df = 11, P= 0.0022). Invertebrate drift
density did not differ inside and outside the caves (P > 0.05) (Figure 2.5).
Distance from entrance (m)
-3 -2 -1 0 1 2 3
Drift (
Ind. m
-3 s
-1)
0.0
0.5
1.0
1.5
2.0
-3-2-10123
Drift p
ropensity
(ln
(drift d
ensity / b
enth
ic d
ensity))
-11
-10
-9
-8
-7
-6
-5
Figure 2.5. Invertebrate drift propensity and density (all species combined) in the three caves. Mean
±1 standard error (n = 3). Where error bars are not shown they were smaller than the symbol.
1000 100 10 0 -10 -100 -1000 1000 100 10 0 -10 -100 -1000
1000 100 10 0 -10 -100 -1000 1000 100 10 0 -10 -100 -1000

Chapter Two. Cave communities across a longitudinal gradient: source-sink populations structured by resource limitations
34
Individual taxa densities and drift rates varied between surface and cave sites, as well as
between caves (Table 2.1 and 2.2.). Mayflies and Austrosimulium were more abundant within
than outside Murchies and Whites cave, whereas Aoteapsyche was more abundant inside
Hollow Hill cave than outside it although numbers were small. All other taxa decreased
within the three caves, relative to surface sites. Hudsonema, Hydrobiosis spp., Oxyethira,
Chironomidae, and Elmidae were absent, or present in very low abundance within the caves,
relative to surface sites. Drift densities of mayflies, Megaleptoperla, Hudsonema, and
Elmidae increased within caves, but drift densities of all other taxa decreased within the
caves, relative to surface sites (Table 2.2).
Table 2.1. Average densities (m-2
) of the most abundant aquatic taxa at surface (sites +128 m and +32
m averaged) and within the three caves (sites -32 m, -128 m, -256 m averaged). Values in brackets are
standard errors. Mur = Murchies, Hh = Hollow Hill, Wi = Whites.
Mur surface Mur cave Hh surface Hh cave Wi surface Wi cave
Deleatidium spp. 13(8) 46(12) 45(14 18(12) 0 (0) 12(8)
Neozephlebia 8(3) 14(7) 0 0 0(0) 2(2)
Zephlebia 3(3) 12(8) 0 0 5(5) 18(8)
Megaleptoperla 88(56) 4(4) 0 0 8(3) 0
Aoteapsyche 301(296) 112(50) 1(0) 9(4) 3(3) 0
Hudsonema 77(77) 7(5) 0 0 19(3) 0
Hydrobiosis spp. 34(19) 0 3(2) 1(1) 16(5) 2(2)
Oxyethira 112(107) 0 0 0 0 0
Austrosimulium 13(3) 28(9) 0 4(2) 32(11) 66(34)
Chironominae 1171(771) 0 15(15) 0 3(3) 5(5)
Orthocladiinae 2827(256) 5(3) 6(5) 1(1) 184(29) 64(46)
Potamopyrgus 5944(5741) 432(272) 1(1) 4(3) 123(27) 84(81)
Elmidae 37(27) 2(2) 63(38) 8(4) 0 0
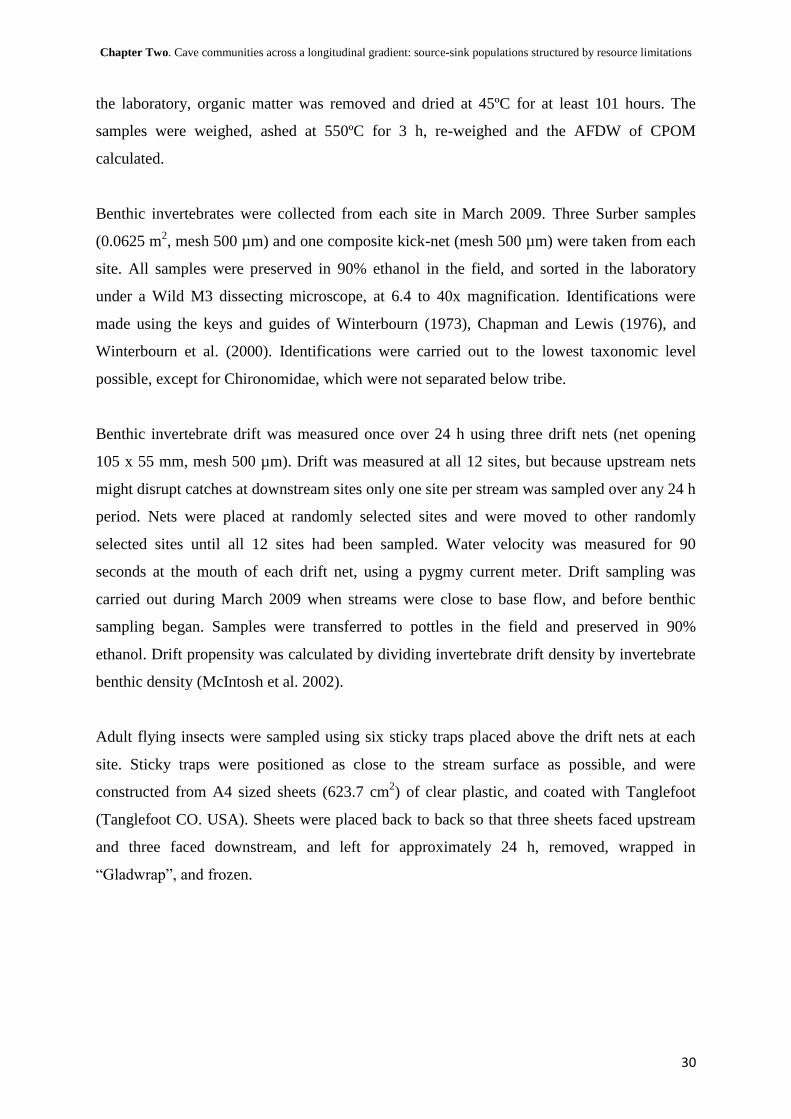
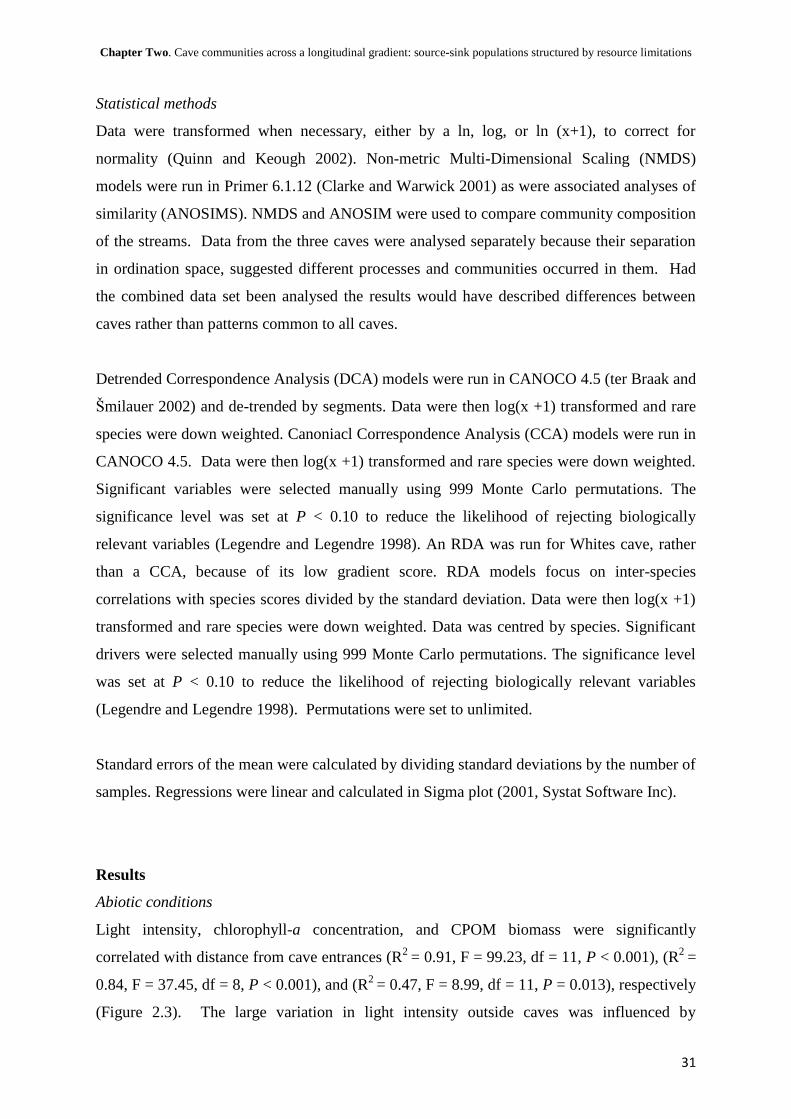
Viable cave populations
As previously mentioned aquatic communities within the caves were a subset of their
upstream surface communities. If cave benthic communities were structured exclusively by
drift the proportion of invertebrates drifting above the cave may relate to the proportion of
invertebrates in the benthos within the cave. Taxa with low surface drift rates but high cave
benthic densities may have sustainable cave populations, while taxa with high surface drift
rates but low cave benthic densities may not be persisting within the cave, and taxa that had

Chapter Two. Cave communities across a longitudinal gradient: source-sink populations structured by resource limitations
35
surface drift rates appearing to be in ratio with cave benthic densities may have been solely
structured by drift.
Table 2.2. Drift density of aquatic taxa (Ind. m-3
s-1
) at the surface (sites +128 m and +32 m averaged)
and within the caves (sites -32 m, -128 m, -256 m averaged). Values in brackets are standard errors.
Taxa shown were the most abundant. Mur = Murchies, Hh = Hollow Hill, Wi = Whites.
Mur surface Mur cave Hh surface Hh cave Wi surface Wi cave
Deleatidium spp. 0.0049
(0.0049) 0.1356
(0.0646) 0.010
(0.0077) 0.0185
(0.0078) 0 0.0068
(0.0045)
Neozephlebia 0.0008
(0.0008) 0.0116
(0.0071) 0 0 0 0.0026
(0.0015)
Zephlebia 0.0048
(0.0032) 0.0953
(0.0481) 0 0.0012
(0.0036) 0.0013
(0.0013) 0.0105
(0.0073)
Megaleptoperla 0.0016
(0.0016) 0.0031
(0.0016) 0 0.0004
(0.0009) 0 0
Aoteapsyche 0.0711
(0.0711) 0.0102
(0.0055) 0.0020
(0.0003) 0.0027
(0.0018) 0.0013
(0.0013) 0
Hudsonema 0.0057
(0.0057) 0.0062
(0.0006) 0.0024
(0.0024) 0.0027
(0.0018) 0.0026
(0.0026) 0.0009
(0.0005)
Hydrobiosis spp. 0.0178
(0.0064) 0.0098
(0.0049) 0.0114
(0.0098) 0.0187
(0.0058) 0.0082
(0.0031) 0.0048
(0.0027)
Oxyethira 0 0 0 0.0017
(0.0015) 0 0
Austrosimulium 0.0437
(0.0115) 0.0080
(0.0019) 0.0020
(0.0003) 0.0066
(0.0031) 0.0346
(0.0038) 0.0733
(0.0207)
Chironominae 0.0210
(0.0031) 0 0.0012
(0.0012) 0.0012
(0.0004) 0 0
Orthocladiinae 0.1098
(0.0270) 0.0024
(0.0015) 0.0193
(0.0184) 0.0137
(0.0014) 0.0173
(0.0083) 0.0236
(0.0202)
Potamopyrgus 0.4428
(0.4103) 0.0909
(0.0133) 0.0020
(0.0003) 0.0042
(0.0020) 0.0334
(0.0334) 0.0034
(0.0034)
Elmidae 0.0008
(0.0008) 0.0014
(0.0014) 0.0921
(0.0257) 0.0860
(0.0327) 0 0
Within Murchies cave, surface drift density (sites +128 m and +32 m, averaged) was
significantly correlated to cave benthic density (sites -128 m and -256 m, averaged) (R2
=
0.48, F = 11.12, df = 13, P < 0.001) (Figure 2.6). Several taxa (Deleatidium and
Neozephlebia) had low surface drift rates but high cave benthic densities while other taxa
(Orthocladiinae and Oligochaeta) had high surface drift rates but low cave benthic densities.
The remaining taxa had surface drift rates that appeared to be in ratio with cave benthic
densities.

Chapter Two. Cave communities across a longitudinal gradient: source-sink populations structured by resource limitations
36
Cave benthic density ln (m-2
)
-8 -7 -6 -5 -4 -3 -2 -1 0
Surf
ace d
rift ln (
m-3
s-1
)
0
1
2
3
4
5
6
7
Austrosimulium
Deleatidium
Potamopyrgus
Neozephlebia
Oligochaeta
Orthocladiinae Aoteapsyche
Elmidae Megaleptoperla
Zephlebia
Platyhelminthes
Hudsonema
Figure 2.6. Murchies surface invertebrate drift density (+128 m and +32 m averaged) in relation to
cave invertebrate benthic density (-128 m and -256 m averaged).
Within Hollow Hill cave, surface drift density (sites +128 m and +32 m, averaged) was not
significantly correlated to cave benthic density (sites -128 m and -256 m, averaged) (R2
=
0.60, F = 4.51, df= 4, P = 0.12), presumably because of Aoteapsyche (Figure 2.7). The net-
spinning caddis Aoteapsyche had low surface drift rates but high cave benthic densities, while
the other taxa had surface drift rates that appeared to be in ratio with cave benthic densities.
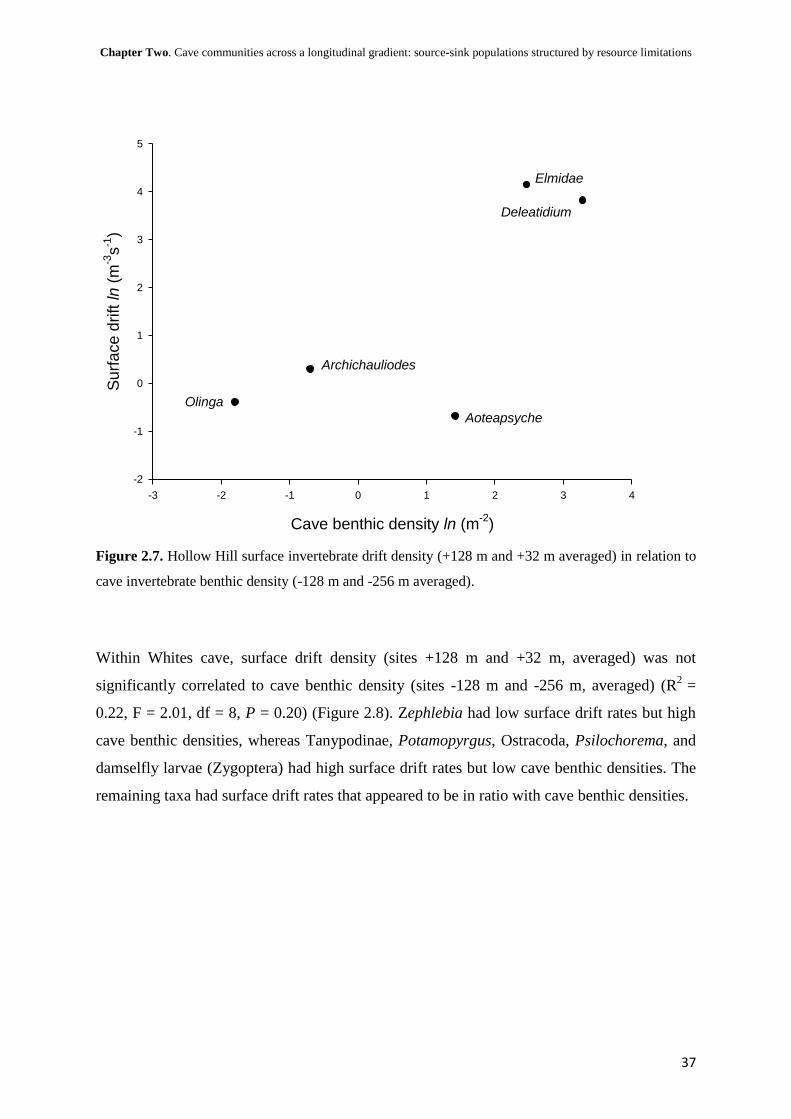
Chapter Two. Cave communities across a longitudinal gradient: source-sink populations structured by resource limitations
37
Cave benthic density ln (m-2
)
-3 -2 -1 0 1 2 3 4
Surf
ace d
rift ln (
m-3
s-1
)
-2
-1
0
1
2
3
4
5
Deleatidium
Aoteapsyche
Olinga
Archichauliodes
Elmidae
Figure 2.7. Hollow Hill surface invertebrate drift density (+128 m and +32 m averaged) in relation to
cave invertebrate benthic density (-128 m and -256 m averaged).
Within Whites cave, surface drift density (sites +128 m and +32 m, averaged) was not
significantly correlated to cave benthic density (sites -128 m and -256 m, averaged) (R2
=
0.22, F = 2.01, df = 8, P = 0.20) (Figure 2.8). Zephlebia had low surface drift rates but high
cave benthic densities, whereas Tanypodinae, Potamopyrgus, Ostracoda, Psilochorema, and
damselfly larvae (Zygoptera) had high surface drift rates but low cave benthic densities. The
remaining taxa had surface drift rates that appeared to be in ratio with cave benthic densities.
Chapter Two. Cave communities across a longitudinal gradient: source-sink populations structured by resource limitations
38
Benthic density ln (m-2
)
-2 -1 0 1 2 3
Surf
ace d
rift ln (
m-3
s-1
)
-7.0
-6.5
-6.0
-5.5
-5.0
-4.5
-4.0
-3.5
-3.0
Zephlebia
Hydrobiosis
Psilochorema
ZygopteraAustrosimulium
OrthocladinaeTanypodinae
Potamopyrgus
Ostracoda
Oligochaeta
Figure 2.8. Whites surface invertebrate drift density (+128 m and +32 m averaged) in relation to
cave invertebrate benthic density (-128 m and -256 m averaged).
Adult flight patterns
Numbers of adult insects captured on upstream and downstream sides of sticky traps were not
significantly different (P > 0.05) so data were combined for analysis. Adult Ephemeroptera,
Plecoptera, and Trichoptera (EPT) density on traps decreased rapidly within the caves (Figure
2.9). However, this was driven primarily by the agricultural streams, as EPT taxa were caught
at only two forested sites over the sampling period. Significantly more EPT taxa were found
outside caves than inside (R2 = 0.53, F = 11.41, df = 11, P = 0.007).
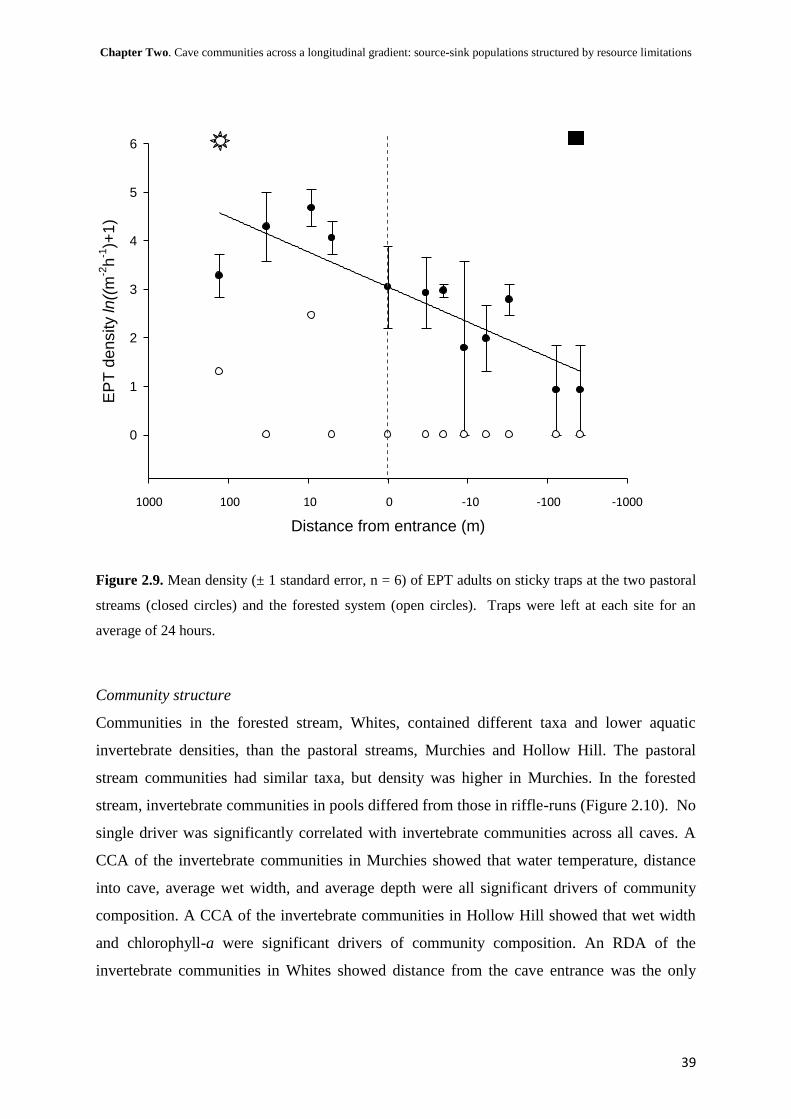
Chapter Two. Cave communities across a longitudinal gradient: source-sink populations structured by resource limitations
39
Distance from entrance (m)
-3-2-10123
EP
T d
en
sity ln
((m
-2h
-1)+
1)
0
1
2
3
4
5
6
Figure 2.9. Mean density (± 1 standard error, n = 6) of EPT adults on sticky traps at the two pastoral
streams (closed circles) and the forested system (open circles). Traps were left at each site for an
average of 24 hours.
Community structure
Communities in the forested stream, Whites, contained different taxa and lower aquatic
invertebrate densities, than the pastoral streams, Murchies and Hollow Hill. The pastoral
stream communities had similar taxa, but density was higher in Murchies. In the forested
stream, invertebrate communities in pools differed from those in riffle-runs (Figure 2.10). No
single driver was significantly correlated with invertebrate communities across all caves. A
CCA of the invertebrate communities in Murchies showed that water temperature, distance
into cave, average wet width, and average depth were all significant drivers of community
composition. A CCA of the invertebrate communities in Hollow Hill showed that wet width
and chlorophyll-a were significant drivers of community composition. An RDA of the
invertebrate communities in Whites showed distance from the cave entrance was the only
1000 100 10 0 -10 -100 -1000

Chapter Two. Cave communities across a longitudinal gradient: source-sink populations structured by resource limitations
40
significant driver of community composition. All cave sites were generally closer together in
ordination space than their associated surface communities.
Axis 1
-2.0 -1.5 -1.0 -0.5 0.0 0.5 1.0 1.5
Axis
2
-0.8
-0.6
-0.4
-0.2
0.0
0.2
0.4
0.6
0.8
1.0
1.2
4
0
-2 -8 128
-128
8
32 -16
-256
128
-128
8
32 -256
4
0
-2
128
-128
8 -16 -4
-64
-4
-4
32
-32
-32
-256
-2
-8
-8 0
-4
Figure 2.10. NMDS of aquatic invertebrate communities for all three stream systems. Numbers
represent the distance from entrance, with negative numbers occurring inside caves. Inverted triangles
represent communities in Whites, solid circles represent sites in Murchies, and open circles represent
sites in Hollow Hill cave. Sites 8 to -8 in Whites were pool sites. The rest of the sites were in
riffle/runs.
Discussion
Differences in cave and surface communities
Chlorophyll-a and CPOM biomass decreased rapidly at the cave entrances and were
significantly lower within the caves, relative to surface environments, presumably because of
the exclusion of light and riparian vegetation. However, despite the predicted importance of
these factors they did not appear to be the main drivers of community structure. FPOM was
observed on the streambed at all sites and likely played a significant role in structuring
invertebrate communities. FPOM can be transported in the water column for long distances
Chapter Two. Cave communities across a longitudinal gradient: source-sink populations structured by resource limitations
41
(Ock 2010), and the lack of other kinds of food means that it potentially supplies a valuable
resource, to cave stream communities. Aoteapsyche and Deleatidium were observed over one
kilometre inside caves, and the presence of the filter-feeding Aoteapsyche suggests that
FPOM is still a readily available resource. A study by Ock (2010) in dam tailwaters showed
FPOM transport distances of up to 19.2 km in deeper channels (and a minimum transport
distance of 2.2 km in shallower channels), so it is likely that invertebrate communities will
have continual access to FPOM resources in cave systems. FPOM biomass may also remain
high throughout caves as percolating water and entrances offer recharge points (Bolstad and
Swank 1997).
As well as having an abundance of carbon resources, surface streams in this study had
a diverse range of micro-habitats, allowing greater taxa diversity and density (Gray et al.
2006). Surface sites ranged from shallow algal riffles, to deep macrophyte filled runs, to
debris-shrouded pools, whereas caves generally consisted of bedrock riffles, bedrock runs,
and bedrock pools. The loss of micro- and macro-habitats combined with a reduction in
energy supplies (food and solar), are likely to have had cumulative negative effects upon cave
stream communities.
Invertebrate benthic richness and density were significantly lower within caves than in the
surface streams. Furthermore, cave invertebrate communities were found to be a subset of
surface communities, sourced through downstream drift, as also found by Death (1989).
Taxonomic diversity was closely associated with invertebrate density, which was not
surprising as lower density communities are likely to contain fewer taxa and rare species, as
seen in other studies (e.g. Collier and Quinn, 2003). The decline in taxonomic richness and
density within caves was presumably related to a loss of suitable resources (Death 1989).
However, within caves benthic invertebrate density and richness did not vary between -32
and -256 metres (across all sampled caves). This finding suggests that conditions were
relatively constant within caves enabling similar invertebrate richness and densities, even
where land-use differed upstream. The significant increase in drift propensity, inside caves,
suggested an increase in relative densities of organisms entering the drift, potentially because
of a lack of suitable resources, i.e. caves are resource limited, rather than structured by
increased predation levels (Peckarsky 1983). It is also possible that the lack of light was
responsible for increased drift propensity within caves, as it is known that most invertebrates
have a diel drift pattern, with a peak at night (Elliott 1968, McIntosh 2000, Duan et al. 2008).

Chapter Two. Cave communities across a longitudinal gradient: source-sink populations structured by resource limitations
42
The constant invertebrate drift density observed between the inside and outside of caves was
presumably because of invertebrates attempting to leave an unsuitable environment.
Significantly fewer adult EPT taxa were recorded within caves, possibly because of the lower
number of juveniles within them, or because few adults fly into caves. The low numbers
could also be partially explained by lower temperatures that may limit flight (Smith 2002),
and some adults may be attracted and ensnared by the glow-worm Arachnocampa luminosa.
The larvae of individual aquatic taxa differed in their “responses” to cave environments, and
surprisingly, mayflies and Austrosimulium were found in greater numbers in the benthos
within caves than outside them. The larger numbers in caves could be related to an increase
in relative resource availability, because of the decrease in total invertebrate density, or a
decrease in predatory invertebrates, primarily Hydrobiosis species, and possibly Hudsonema
species, as they are known omnivores (Winterbourn 2000). Oxyethira was presumably not
found on the benthos within caves because filamentous algae, on which it feeds (Quinn and
Hickey 1990), were only present outside the caves. Predatory invertebrates (primarily
Hydrobiosis spp.) were presumably not found within the caves because of the decrease in
total prey density, or because harsh abiotic conditions (a preponderance of bedrock lacking
refuges for predators) make predation difficult (Peckarsky 1983). Elmidae also appeared to
find the cave environment unsuitable, and had low benthic density but increased drift density.
Chironomids too were rarely present within the caves. Most of those outside the cave were
tube-dwelling species and unlikely to drift, and it appears that few adults were attracted into
the caves to lay eggs. Death (1989) obtained similar results, except that mayflies were less
abundant in the cave he studied.
Source-sink dynamics
Source-sink dynamics in caves would seem to be driven by drift, either active or passive. I
found that high surface drift densities did not necessarily equate to high cave benthic
densities, suggesting that the presence of a cave altered populations. However, because drift
was only sampled once, conclusions drawn from the results are necessarily tentative. My data
showed that in the Murchies system Oligochaeta and Orthocladiinae were present at lower
densities than drift predicted, whereas in Whites, Tanypodinae, Potamopyrgus, Ostracoda,
Psilochorema, and Zygoptera were present at lower densities than drift predicted. It is
therefore possible to surmise that these particular species were unable to maintain populations
Chapter Two. Cave communities across a longitudinal gradient: source-sink populations structured by resource limitations
43
in the cave and were likely experiencing a mortality level greater than the drift rate, or an
emigration rate higher than an immigration rate. Conversely, Deleatidium and Neozephlebia
were present in greater density than drift predicted in Murchies, while in Hollow Hill and
Whites Aoteapsyche and Zephlebia, respectively, were both present at higher densities than
drift predicted. It is therefore possible that these particular species were able to maintain
populations greater than drift predicted, either through organisms reproducing within the cave
and completing their life cycles, or because the mortality rate was lower than the rate of
replacement, via drift. As to which of these hypotheses was correct cannot be confirmed by
my data, but I would speculate that for Zephlebia hypothesis two is likely to be correct. While
it may be possible that the net spinning caddis Aoteapsyche is able to attract mates in
darkness, with the aid of pheromones, it seems unlikely, and further research is needed.
Forested and pastoral aquatic communities
An NMDS performed on benthic data from the three caves combined showed they all had
significantly different communities, although the two pastoral streams had similar species.
This result was not surprising as large and small differences between each catchment result in
differences in community structure. The fact that species composition was similar between
the two pastoral streams and very different from the forested stream is neither surprising nor
novel (Quinn and Cooper 1997, Young and Huryn 1999, Collier and Quinn 2003, Death et al.
2003). Community densities were highest in surface pastoral sites, followed by surface
forested sites, and lastly within caves. Beyond the twilight zone, community density was
lowest, with no apparent difference between caves in catchments supporting different land
uses. Adult EPT flight was greater in the pastoral systems, possibly because of higher larval
densities, solar radiation, and temperature.
An important factor structuring cave invertebrate communities is the ability of species to
colonise them. If reproduction is not occurring within caves, organisms must be entering
them from an outside source population, driving a source-sink relationship. There is no
published evidence of surface aquatic macroinvertebrates completing their life cycle within
caves, and I found none in the caves I studied. It is also unlikely that individuals from deeper
cave sites fly out of the caves to reproduce, especially in the forested system where no
individuals were recorded flying within the cave.

Chapter Two. Cave communities across a longitudinal gradient: source-sink populations structured by resource limitations
44
Within my study, differences occurred between invertebrate communities within forested,
pastoral, and cave streams thought to be related to carbon resources. However, it is possible
that observed differences were not only because of food availability, but other environmental
drivers. An alternative hypothesis is that differences between forested, pastoral, and cave
stream communities were driven by recruitment rate not simply a lack of available food.
High light and temperatures in surface streams can be expected to lead to increased larval
metabolism (Biswas 1991, Hervant et al. 1997, Hervant and Renault 2002, Issartel et al.
2005), and adult flight activity (Smith 2002), enabling growth and reproduction to occur at a
faster rate, relative to cave invertebrates. This in turn could lead to denser populations in
warm, light-abundant systems, such as pastoral streams. Adult flight would therefore be
expected to be greater in open and warmer sites (e.g. Winterbourn and Crowe, 2001; Collier
and Quinn. 2003), and benthic populations would be dominated by tolerant organisms with
high reproduction rates, such as Deleatidium (Winterbourn and Crowe 2001). Therefore
caves, devoid of light, would be expected to support lower invertebrate growth and maturity
(Kinsey et al. 2007), as well as limited adult flight and reproduction, leading to depauperate
communities sustained only by an upstream source.
In conclusion, the two surface pastoral streams had similar species richness and greater
invertebrate densities than the forested stream up-stream of the cave entrance. However, 32
meters inside the caves species density and richness were similar, suggesting environmental
conditions were similar. No single physico-chemical driver of community assemblage was
significant across all three caves. More importantly, the measured food resources (algae and
CPOM) did not appear to structure aquatic communities. Coarse particulate organic matter
(CPOM) was not a significant driver of community assemblage in any of the streams,
whereas filamentous algae were only important in one pastoral stream, despite both surface
streams containing them. Finally, cave streams had lower invertebrate richness and density.
Cave aquatic communities appeared to be structured by a lack of resources, leading to
increased drift propensity. Furthermore, cave communities appeared to be a sink derived from
the upstream surface source community. However, some taxa were found in greater numbers
than drift predicted, suggesting that an organism’s physical and behavioural adaptations, as
well as resource/environmental gradients, were important for within-cave survival.
Additional, more intensive, long-term studies are clearly needed to further assess the major
drivers of cave community structure.

Chapter Two. Cave communities across a longitudinal gradient: source-sink populations structured by resource limitations
45
References:
Aley, T., and C. Aley. 1997. Groundwater recharge area delineation, hydrobiological
assessment, and vulnerability mapping of four Ozark cavefish (Amblyopsis rosae)
populations in Missouri. A report to the Missouri department of conservation.
Azad, H. S., and J. A. Borchardt. 1969. A method for predicting the effects of light intensity
on algal growth and phosphorus assimilation. Journal of the Water Pollution Control
Federation 41:392-404
Barr, T. C. 1967. Observations on ecology of caves. American Naturalist 101:475-491.
Biswas, J. 1991. Annual modulation of diel motor activity rhythm of the dusk active loach
Nemacheils evezardi (Day). a correlation between day length and circadian
parameters. Proceedings of the Indiana Natural Academy of Science B57:339-346.
Bolstad, P. V., and W. T. Swank. 1997. Cumulative impacts of landuse on water quality in a
southern Appalachian watershed. Journal of the American Water Resources
Association 33:519-534.
Chapman, M. A., and M. H. Lewis. 1976. An introduction to the freshwater Crustacea of
New Zealand. Auckland, Collins.
Clarke, K. R., and R. M. Warwick. 2001. Changes in marine communities: an approach to
statistical analysis and interpretation, 2nd edn. PRIMER-E, Plymouth.
Collier, K. J., and J. M. Quinn. 2003. Land-use influences macroinvertebrate community
response following a pulse disturbance. Freshwater Biology 48:1462-1481.
Culver, D. C., and J. R. Holsinger. 1992. How many species of troglobites are there? National
Speleological Society Bulletin 54:79-80.
Culver, D. C., and B. Sket. 2000. Hotspots of subterranean biodiversity in caves and wells.
Journal of Cave and Karst Studies 62:11-17.
Death, R. G. 1988. Drift distance, periodicity and frequency of benthic invertebrates in a cave
stream. Verhandlungen der Internationalen Vereinigung für Theoretische und
Angewandte Limnologie 23:1446-1450.
Death, R. G. 1989. The effect of a cave on benthic invertebrate communities in a South Island
stream. New Zealand Natural Sciences 16:67-78.
Death, R. G., B. Baillie, and P. Fransen. 2003. Effect of Pinus radiata logging on stream
invertebrate communities in Hawke's Bay, New Zealand. New Zealand Journal of
Marine and Freshwater Research 37:507-520.

Chapter Two. Cave communities across a longitudinal gradient: source-sink populations structured by resource limitations
46
Duan, B., B. F. Li, R. S. Liu, and X. L. Tong. 2008. Diel rhythm of benthic
macroinvertebrate's drift in streams in Hengshishui River watershed of Guangdong,
China. Chinese Journal of Applied Ecology 19:1084-1090.
Elliott, J. M. 1968. The daily activity patterns of mayfly nymphs (Ephemeroptera). Journal of
Zoology 155:201-221.
Engel, A. S. 2007. Observations on the biodiversity of sulfidic karst habitats. Journal of Cave
and Karst Studies 69:187-206.
Gibert, J., D. L. Danielopol, and J. A. Stanford. 1994. Groundwater Ecology, Academic
Press, United States of America.
Gibert, J., and L. Deharveng. 2002. Subterranean ecosystems: a truncated functional
biodiversity. BioScience 52:473-481.
Ginet, R., and V. Decou. 1977. Initiation a la biologie et a l'lcologie souterraines. Paris:
Delarge.
Graening, G. O. 2005. Trophic structure of Ozark cave streams containing endangered
species. Oceanological and Hydrobiological Studies 34:3-17.
Graening, G. O., and A. V. Brown. 2003. Ecosystem dynamics and pollution effects in an
Ozark cave stream. Journal of the American Water Resources Association 39:1497-
1507.
Gray, D., M. R. Scarsbrook, and J. S. Harding. 2006. Spatial biodiversity patterns in a large
New Zealand braided river. New Zealand Journal of Marine and Freshwater Research
40:631-642.
Gunn, J., P. Hardwick, and P. J. Wood. 2000. The invertebrate community of the Peak-
Speedwell cave system, Derbyshire, England - pressures and considerations for
conservation management. Aquatic Conservation: Marine and Freshwater Ecosystems
10:353-369.
Hancock, P. J., A. J. Boulton, and W. F. Humphreys. 2005. Aquifers and hyporheic zones:
towards an ecological understanding of groundwater. Hydrogeology Journal 13:98-
111.
Hansen, A. J., F. Castri, and R. J. Naiman. 1988. Ecotones: what and why? Biology
International Special Issue 17:9-46.
Harding, J. S., R. G. Young, J. W. Hayes, K. A. Shearer, and J. D. Stark. 1999. Changes in
agricultural intensity and river health along a river continuum. Freshwater Biology
42:345-357.

Chapter Two. Cave communities across a longitudinal gradient: source-sink populations structured by resource limitations
47
Herrando-Perez, S., M. Baratti, and G. Messana. 2008. Subterranean ecological research and
multivariate statistics: a review (1945-2006). Journal of Cave and Karst Studies
70:120-128.
Hervant, F., J. Mathieu, and G. Messana. 1997. Locomotory, ventilatory and metabolic
responses of the subterranean Stenasellus virei (Crustacea, Isopoda) to severe hypoxia
and subsequent recovery. Comptes Rendus de l'Academie des Sciences - Serie III
320:139-148.
Hervant, F., and D. Renault. 2002. Long-term fasting and realimentation in hypogean and
epigean isopods: a proposed adaptive strategy for groundwater organisms. Journal of
Experimental Biology 205:2079-2087.
Hicks, B. J. 1997. Food webs in forest and pasture streams in the Waikato region, New
Zealand: a study based on analyses of stable isotopes of carbon and nitrogen, and fish
gut contents. New Zealand Journal of Marine and Freshwater Research 31:651-664.
Holyoak, M., M. A. Leibold, and R. D. Holt. 2005. Metacommunities: spatial dynamics and
ecological communities. University of Chicago Press, Chicago, Illinois, USA.
Howarth, F. G. 1983. Ecology of cave arthropods. Annual Review of Entomology 28:365-
389.
Issartel, J., D. Renault, Y. Voituron, A. Bouchereau, P. Vernon, and F. Hervant. 2005.
Metabolic responses to cold in subterranean crustaceans. Journal of Experimental
Biology 208:2923-2929.
Kinsey, J., T. J. Cooney, and K. S. Simon. 2007. A comparison of the leaf shredding ability
and influence on microbial films of surface and cave forms of Gammarus minus Say.
Hydrobiologia 589:199-205.
Legendre, P., and L. Legendre. 1998. Numerical ecology. Elsevier, Second edition.
Amsterdam.
Leibold, M. A., M. Holyoak, N. Mouquet, P. Amarasekare, J. M. Chase, M. F. Hoopes, R. D.
Holt, J. B. Shurin, R. Law, D. Tilman, M. Loreau, and A. Gonzalez. 2004. The
metacommunity concept: a framework for multi-scale community ecology. Ecology
Letters 7:601-613.
Looser, M. O., A. Parriaux, and M. Bensimon. 1999. Landfill underground pollution
detection and characterization using inorganic traces. Water Research 33:3609-3616.
Mazina, S. E., A. V. Gopin, and A. L. Nikolaev. 2009. Assessing the contamination of water
flow in Soldatskaya Cave (Crimea). Water Resources 36:699-705.

Chapter Two. Cave communities across a longitudinal gradient: source-sink populations structured by resource limitations
48
McIntosh, A., R. 2000. Aquatic predator-prey interactions. Collier.K.J. and Winterbourn,
M.J. eds. New Zealand stream invertebrates: ecology and implications for
management. New Zealand Liminological Society, Christchurch:140-141.
McIntosh, A. R., B. L. Peckarsky, and B. W. Taylor. 2002. The influence of predatory fish on
mayfly drift: extrapolating from experiments to nature. Freshwater Biology 47:1497-
1513.
McLay, C. 1970. A theory concerning distance travelled by animals entering drift of a stream.
Journal of the Fisheries Research Board of Canada 27:359-370.
McMullin, E. R., D. C. Bergquist, and C. R. Fisher. 2000. Metazoans in extreme
environments: adaptations of hydrothermal vent and hydrocarbon seep fauna.
Gravitational and space biology bulletin: publication of the American Society for
Gravitational and Space Biology 13:13-23.
Niyogi, D. K., M. Koren, C. J. Arbuckle, and C. R. Townsend. 2007. Longitudinal changes in
biota along four New Zealand streams: declines and improvements in stream health
related to land use. New Zealand Journal of Marine and Freshwater Research 41:63-
75.
Nusch, E. A. 1980. Comparison of different methods for chlorophyll and phaeopigments
determination. Archiv für Hydrobiologie 14 14–36.
Ock, G. T., Y. 2010. Estimation of transport distance of fine particulate organic matter in
relation to channel morphology in tailwaters of the Lake Biwa and reservoir dams.
Landscape and Ecological Engineering 6:1-9.
Peckarsky, B. 1983. Biotic interactions or abiotic limitations? A model of lotic community
structure. Fontaine, T. and Bartell, S. eds: Dynamics of lotic ecosystems: Ann Arbor
Science Publishers, Michigan, USA, pp 303-323
Porter, M. L., A. S. Engel, T. C. Kane, and B. K. Kinkle. 2009. Productivity-diversity
relationships from chemolithoautotrophically based sulfidic Karst systems.
International Journal of Speleology 38:27-40.
Poulson, T. L., and K. H. Lavoie. 2000. The trophic basis of subsurface ecosystems.
Ecosystems of the world 30: subterranean ecosystems; Wilkens H, Culver D.C,
Humphreys W.F, eds. Elsevier. Amsterdam, 2000pp. 231–249. .
Prous, X., R. Lopes Ferreira, and R. Parentoni Martins. 2004. Ecotone delimitation: epigean-
hypogean transition in cave ecosystems. Austral Ecology 29:374-382.
Pulliam, H. R. 1988. Sources, sinks and population regulation. American Naturalist 132:652-
661.
Chapter Two. Cave communities across a longitudinal gradient: source-sink populations structured by resource limitations
49
Pulliam, H. R., and B. J. Danielson. 1991. Sources, sinks, and habitat selection: a landscape
perspective on population dynamics. American Naturalist 137:60-66.
Quinn, G. P., and M. J. Keough. 2002. Experimental design and data analysis for biologists.
Cambridge University Press, Cambridge
Quinn, J. M. 2000. Effects of pastoral development. In: Collier.K.J. and Winterbourn,M.J.
eds. New Zealand stream invertebrates: ecology and implications for management.
New Zealand Liminological Society, Christchurch:208-229.
Quinn, J. M., and A. B. Cooper. 1997. Land-water interactions at Whatawhata, New Zealand:
introduction and synthesis. New Zealand Journal of Marine and Freshwater Research
31:569-577.
Quinn, J. M., and C. W. Hickey. 1990. Characterisation and classification of benthic
invertebrate communities in 88 New Zealand rivers in relation to environmental
factors. New Zealand Journal of Marine & Freshwater Research 24:387-409.
Quinn, J. M., and M. J. Stroud. 2002. Water quality and sediment and nutrient export from
New Zealand hill-land catchments of contrasting land use. New Zealand Journal of
Marine and Freshwater Research 36:409-429.
Sarbu, S. M., T. C. Kane, and B. K. Kinkle. 1996. A chemoautotrophically based cave
ecosystem. Science 272:1953-1954.
Sartory, D. P., and J. U. Grobbelaar. 1984. Extraction of chlorophyll a from freshwater
phytoplankton for spectrophotometric analysis. Hydrobiologia 114:177-187.
Scarsbrook, M. R., J. M. Quinn, J. Halliday, and R. Morse. 2001. Factors controlling litter
input dynamics in streams draining pasture, pine, and native forest catchments. New
Zealand Journal of Marine and Freshwater Research 35:751 - 762.
Scarsbrook, M. R., and C. R. Townsend. 1993. Stream community structure in relation to
spatial and temporal variation: a habitats templet study of two contrasting New
Zealand streams. Freshwater Biology 29:395-410.
Shi, Z. T., X. Y. Liu, Y. Liu, Y. Huang, and H. Y. Peng. 2009. Catastrophic groundwater
pollution in a karst environment: a study of phosphorus sludge waste liquid pollution
at the Penshuidong Cave in Yunnan, China. Environmental Earth Sciences 59:757-
763.
Simon, K. S., E. F. Benfield, and S. A. Macko. 2003. Food web structure and the role of
epilithic biofilms in cave streams. Ecology 84:2395-2406.

Chapter Two. Cave communities across a longitudinal gradient: source-sink populations structured by resource limitations
50
Simon, K. S., and J. A. L. Buikema. 1997. Effects of organic pollution on an Appalachian
cave: changes in macroinvertebrate populations and food supplies. American Midland
Naturalist 138:387-401.
Smith, B. J., Collier, K. J., Halliday, N. J. 2002. Composition and flight periodicity of adult
caddisflies in New Zealand hill-country catchments of contrasting land use. New
Zealand Journal of Marine and Freshwater Research 36:863-878.
ter Braak, C. J. F., and Šmilauer, P. 2002. CANOCO Reference manual and CanoDraw for
Windows user's guide: software for canonical community ordination (version 4.5).
Ithaca, NY: Microcomputer Power.
Tobler, M. 2008. Divergence in trophic ecology characterizes colonization of extreme
habitats. Biological Journal of the Linnean Society 95:517-528.
Townsend, C. R., B. J. Downes, K. Peacock, and C. J. Arbuckle. 2004. Scale and the
detection of land-use effects on morphology, vegetation and macroinvertebrate
communities of grassland streams. Freshwater Biology 49:448-462.
Townsend, C. R., S. S. Uhlmann, and C. D. Matthaei. 2008. Individual and combined
responses of stream ecosystems to multiple stressors. Journal of Applied Ecology
45:1810-1819.
Tsurumi, M. 2003. Diversity at hydrothermal vents. Global Ecology and Biogeography
12:181-190.
Watson, J., E. Hamilton-Smith, D. Gillieson, and K. Kiernan. 1997. Guidelines for cave and
karst protection, International union for conservation of nature and natural resources.
Cambridge. 53 pp..
Williams, P. W. 1992. Karst in New Zealand. in: Landforms of New Zealand; Soons, M.J.
and Selby, J.M. eds; Longman Paul, New Zealand.
Winkelmann, C., T. Petzoldt, J. H. E. Koop, C. D. Matthaei, and J. Benndorf. 2008.
Benthivorous fish reduce stream invertebrate drift in a large-scale field experiment.
Aquatic Ecology 42:483-493.
Winterbourn, M. J. 1973. A guide to the freshwater Mollusca of New Zealand. Tuatara
20:141-159.
Winterbourn, M. J. 2000. Feeding ecology. Collier.K.J.; Winterbourn,M.J. eds. New Zealand
stream invertebrates: ecology and implications for management. New Zealand
Liminological Society, Christchurch:100-124.
Winterbourn, M. J., and A. L. M. Crowe. 2001. Flight activity of insects along a mountain
stream: is directional flight adaptive? Freshwater Biology 46:1479-1489.

Chapter Two. Cave communities across a longitudinal gradient: source-sink populations structured by resource limitations
51
Winterbourn, M. J., K. L. D. Gregson, and C. H. Dolphin. 2000. Guide to the aquatic insects
of New Zealand. Bulletin of the Entomological Society of New Zealand:13:102pp.
Wood, P. J., J. Gunn, and J. Perkins. 2002. The impact of pollution on aquatic invertebrates
within a subterranean ecosystem - out of sight out of mind. Archiv für Hydrobiologie
155:223-237.
Wood, P. J., J. Gunn, and S. D. Rundle. 2008. Response of benthic cave invertebrates to
organic pollution events. Aquatic Conservation: Marine and Freshwater Ecosystems
18:909-922.
Woodford, D. J., and A. R. McIntosh. 2010. Evidence of source-sink metapopulations in a
vulnerable native galaxiid fish driven by introduced trout. Ecological Applications
20:967-977.
Young, R. G., and A. D. Huryn. 1999. Effects of land use on stream metabolism and organic
matter turnover. Ecological Applications 9:1359-1376.

52
Ameletopsis (a predatory mayfly) 200 m within a cave

Chapter 3. Factors limiting macroinvertebrate communities within cave streams: manipulations of algae and
CPOM
53
Chapter 3
Factors limiting macroinvertebrate communities within cave streams:
manipulations of algae and CPOM
Abstract
Pastoral and forested surface streams contain markedly different invertebrate communities,
primarily because of their differing dominant basal resources: algal versus CPOM. These
characteristics should also remain apparent within recipient cave streams. I manipulated
CPOM and algal abundance within streams to investigate their relative importance to forested
and pastoral aquatic invertebrate communities. Pre-conditioned replicate algal tiles were
placed outside and inside two caves. Tiles either excluded (control) or were exposed to
invertebrate grazing, and left for five days. In a second manipulation, CPOM (leaf packs) and
an inedible artificial habitat (plastic leaves) were added across the cave ecotone, and left for
41 days. Unfortunately, a bacterial bloom in the forested stream smothered benthic
communities making it impossible to compare results. However, algal biomass declined
within the cave on the pastoral stream, although there was no significant difference between
biomass on exclusion and open tiles. Thus, algae may have died in the cave within 5 days due
to a lack of light, and grazing had little effect; or algae were consumed rapidly by
invertebrates on open tiles, while decreasing gradually on grazer-exclusion tiles to a level
similar to that of open tiles, over the duration of the study. Invertebrate abundance on leaf
packs or artificial packs, showed no significant difference inside and outside the cave,
suggesting that caves were resource limited. Furthermore, leaf and artificial packs appeared
to be colonised by individuals in the drift, rather than from the benthos. Leaf packs had
significantly more taxa and denser communities than artificial packs, suggesting that actual
leaves were the preferred resource. Shredders were the only functional group that increased in
abundance in leaf packs, relative to control or survey data. Finally, aquatic invertebrate
communities inside the cave were a subset of surface communities and appeared to be
resource limited.

Chapter 3. Factors limiting macroinvertebrate communities within cave streams: manipulations of algae and
CPOM
54
Introduction
Energy driving stream ecosystems comes either from in-stream photosynthesis (i.e.
autochthonous sources), or allochthonous materials (Hicks 1997, Huxel and McCann 1998).
Autochthonous production (i.e. algal growth), occurs wherever light is present, although
environmental factors, such as floods or droughts, can lead to reductions in primary
production (Whiles and Wallace 1995, Townsend et al. 1997, Collier and Quinn 2003).
Whereas variations in light energy affect photosynthesis directly, they also affect growth
indirectly, as solar radiation controls temperature, which in turn influences primary
production (Azad and Borchardt 1969). A third factor having a positive effect on
photosynthetic production is nutrient addition, particularly concentrations and availability of
nitrate and phosphate (McDowell et al. 2009). Differences in algal density, between forested
and pastoral streams, are therefore primarily due to variations in light, temperature, and
nutrient levels (Winterbourn and Fegley 1989, Niyogi et al. 2007b). It has been suggested
that primary production is positively correlated with food chain length, or ecosystem
complexity, such that streams with higher levels of primary production (e.g. pastoral streams)
will have longer food chains and increasingly complex ecosystems, compared to streams with
lower levels of primary production, such as forested streams or streams in caves (Huxel and
McCann 1998, Simon et al. 2003).
Terrestrially derived, allochthonous, organic matter has been shown to be important in many
stream ecosystems and its presence and abundance are primarily dependent upon the form
and structure of riparian vegetation (Fisher and Likens 1973, Cummins 1974). Detritus,
leaves and wood from the riparian zone, and dead or decaying material produced within the
stream are transformed by abiotic and biotic processes while undergoing displacement
downstream, and provide important basal resources for stream communities (Suberkropp and
Klug 1980, Wallace et al. 1982, Boulton and Boon 1991, Suberkropp and Chauvet 1995,
Young et al. 2008). Leaf breakdown typically occurs in three phases (against a background of
physical abrasion); 1) a rapid loss of mass due to leaching of soluble compounds, 2)
colonisation by microorganisms, 3) losses from invertebrate shredding (Burton and Likens
1973, Quinn and Cooper 1997, Rutherford et al. 1997). As a result, streams have strong
linkages to both lateral and upstream terrestrial components of the landscape. These linkages
are particularly important to cave stream ecosystems because of their reliance upon detrital
Chapter 3. Factors limiting macroinvertebrate communities within cave streams: manipulations of algae and
CPOM
55
material, and an absence of autochthony (Culver 1982, Simon and Benfield 2001, Simon et
al. 2003).
Land use change
A reliance upon surface-derived material suggests that structuring of macroinvertebrate
communities within caves should be strongly linked to land-use practices upstream
(Sponseller et al. 2001). A loss of terrestrial vegetation can lead to alterations in flow regimes
(Poff et al. 1997), evapotranspiration, sedimentation, channel morphology, solar radiation
(Burton and Likens 1973, Quinn and Cooper 1997, Rutherford et al. 1997), temperature
(Vannote and Sweeney 1980, Ward and Stanford 1982, Quinn and Hickey 1990, Quinn et al.
1994, Rutherford et al. 1997), and organic matter inputs, which can bring about changes to
surface (Lenat and Crawford 1994, Waters 1995, Quinn and Cooper 1997, Sponseller et al.
2001) and cave communities (Simon et al. 2003, Wood et al. 2008).
In New Zealand, land-use change affects water quality, physical habitat and the nature of the
biota within streams (Quinn and Cooper 1997, Harding et al. 1999). The conversion of
shaded forest streams to open waterways alters stream energy sources, may permit grazing to
channel edges by stock, and often results in bank erosion, higher water temperatures, and
higher nutrient inputs (Williamson et al. 1992, Quinn 2000). Loss of riparian vegetation
reduces the amount of wood and leaf litter entering streams (Scarsbrook et al. 2001) and
destabilises banks, previously bound by tree roots (Hanchet 1990). Deforestation has also led
to increased peak flows and water volumes during flood events (Rowe et al., 1997).
Collectively, these impacts constitute a press disturbance and can continue to affect stream
community structure and function in the long term (Harding et al. 1998).
Resource additions
Many organisms live in or on their food and in such cases it may be difficult to assess the
relative importance of material as habitat or food (Dobson 1991). In an attempt to distinguish
between habitat and food limitation, several studies have compared colonisation of real and
artificial leaves by invertebrates (Dobson and Hildrew 1992, Richardson 1992b, 1992a,
Wallace et al. 1999). In most instances, invertebrate diversity and density has been found to
be higher on natural leaves than artificial ones (Dobson and Hildrew 1992, Richardson
1992b, 1992a, Wallace et al. 1999). For example, Richardson (1992b) found that food, not

Chapter 3. Factors limiting macroinvertebrate communities within cave streams: manipulations of algae and
CPOM
56
habitat, was the primary determinant of leaf pack use for most invertebrates (regardless of
their feeding strategy) in a North American stream, and that shredders increased in numbers
on leaf packs, relative to controls. Nevertheless, it is likely that organisms also use leaves to
shelter from currents, for settlement, refuge from predators, and to shelter between foraging
forays (Richardson 1992b). Wallace et al. (1997) excluded leaf litter inputs to a forested
stream reach and demonstrated the powerful influence of allochthonous inputs in structuring
stream food-webs. Cave streams provide a natural situation that is the reverse of the Wallace
et al. experiment as allochthonous inputs enter them in the drift, while autochthonous
production ceases (Simon and Benfield 2001).
The aim of this study was to test the importance of algal and CPOM resources to aquatic
macroinvertebrate communities within cave streams, relative to forest and pastoral systems. I
predicted that algae would be lost at a faster rate within a cave on a pastoral stream because
of the lack of algal resources within caves. I also predicted that macroinvertebrates would be
found in greater densities on leaf packs relative to artificial packs, because of their higher
nutritional value. Conversely, I predicted that algae would be lost in a forested stream, at a
similar rate inside and outside the cave, because of similarly low light levels both above and
within the cave. As a result, macroinvertebrates would be found at greater densities on leaf
packs relative to artificial packs, because of their higher nutritional value, and a shift in
density would occur between the inside and outside of the cave, because of the greater
abundance of CPOM outside the cave.
Methods
Study streams
The study was conducted in two streams (Murchies and Whites) located in the Waitomo
region, central North Island, New Zealand. Waitomo is predominantly hilly, with sheep and
beef farming common and with fragments of native forest, comprising podocarps, ferns, and
hardwood. Geologically the area is dominated by karst (Williams 1992).
Murchies Stream is located 7.8 km from the town of Waitomo and flows into a limestone
cave approximately 1 km long (1785080 E, 5767710 N). The catchment is approximately 1.5
km2 and predominantly covered in native podocarp forest. The stream is second order and
flows through approximately 0.95 km of sheep and beef farmland before entering the cave.

Chapter 3. Factors limiting macroinvertebrate communities within cave streams: manipulations of algae and
CPOM
57
Murchies cave is characterised by a series of riffles, runs and pools overlying limestone
bedrock substrate.
Whites Stream is 17.3 km from the town of Waitomo and has a limestone cave
approximately 1.1 km long (1.773340 E, 5762940 N). The catchment area is approximately
1.5 km2, predominantly covered by native podocarps. The stream has two tributaries, one of
which is sourced from a farm pond and wetland and one, the larger, from native forest. The
stream is composed of riffles, runs, and pools with a limestone bed and silt filled pools.
Algal manipulation
Algae were allowed to colonise 144 ceramic tiles (24.95 cm2) in an open section of stream,
between 14 December 2009 and 14 January 2010. Tiles were placed at +128 m, +64 m, +32
m, -32 m, -64 m, and -128 m, in the forested and pastoral streams (where positive values are
sites outside of the cave, 0 m is the cave entrance, and negative values are sites inside the
cave). At each site ten tiles were deployed, five with grazer exclusion cages and five without
grazer exclusion cages (= open). Grazer exclusion cages consisted of sections of corrugated
pipe (150 mm diameter) cut longitudinally to form a trough and covered with 1 mm mesh
(Figure 3.1). Tiles were placed at their respective sites on 14 January and removed five days
later when they were frozen for transportation to the laboratory.
Figure 3.1. A grazer exclusion (left), and open treatment (right) in the pastoral stream.
Chapter 3. Factors limiting macroinvertebrate communities within cave streams: manipulations of algae and
CPOM
58
In the laboratory, tiles were scrubbed with a toothbrush and filtered onto pre-ashed glass
microfibre filters (diameter 47 mm, nominal pore size 1 µm), dried for a minimum of 72 h at
50°C, weighed and ashed at 500°C for 3 h and re-weighed to calculate ash free dry mass
(AFDM). Initial algal masses were assumed from single randomly removed control tiles
taken from each set of six that had been placed together for initial colonisation and had
visually similar algal densities.
Leaf pack manipulations
All leaf packs were made from onion bags containing either 5 g of dried willow leaves (Salix
sp.) or 5 g of uncut flagging tape. Three leaf packs and three artificial leaf packs were placed
at +128 m, +32 m, +8 m, +4 m, 0 m, -2 m, -4 m, -8 m, -16 m, -32 m, -128 m, and -256 m, in
the forested and pastoral streams. Packs were left in the streams for 41 days. Between 1 and 2
March 2010 all packs were removed and frozen. In the laboratory leaf packs were washed on
a 250 µm mesh sieve, and invertebrates were removed and identified using a 40x Wild M3
dissecting microscope. Identifications were made using the keys and guides of Winterbourn
(1973) and Winterbourn et al. (2000). Identification was carried out to the lowest taxonomic
level possible, except for Chironomidae, which were not separated below tribe. Remaining
material was placed in pre-ashed weigh boats and dried for a minimum of 72 h, weighed and
ashed for 3 h at 500°C, before re-weighing, to calculate AFDM.
Invertebrates were assigned to functional feeding groups using Winterbourn (2000), Quinn
and Hickey (1990), and personal communications with Emeritus Professor Mike
Winterbourn.
Algal and leaf pack manipulations were performed in and upstream of both pasture (Murchies
Stream) and forest (Whites Stream) caves in order to compare land-use effects.
Unfortunately, in the forested system, a bacterial bloom, generated in an upstream swamp,
smothered the streambed, algal tiles and leaf packs, leading to a near complete loss of
invertebrates; only three aquatic individuals were found and there was an absence of spiders
in riparian vegetation. Interestingly, at the end of my field season a flushing flow removed
the bloom, and aquatic invertebrates and riparian spiders reappeared. However, results
obtained from the forest stream were not able to be compared with those from the pasture
stream, and are not considered further.

Chapter 3. Factors limiting macroinvertebrate communities within cave streams: manipulations of algae and
CPOM
59
Statistical analysis
In order to test for differences in algal abundance in the presence and absence of grazing
invertebrates, both inside and outside the caves, I used two way analysis of variance
(ANOVA). Factors were transformed, ln(x + 1), to meet assumptions of normality and
homogeneity of variances (Quinn and Keough 2002).
To assess differences in the percentages of functional feeding groups between leaf packs,
artificial packs, and 2009 survey data I used Generalised Linear Models (GLMs). GLMs were
used because distance from entrance was a continuous variable. The response percentage of
each functional feeding group was arcsine square-root transformed, to meet assumptions of
normality and homogeneity of variances (Quinn and Keough 2002).
Non-metric multidimensional scaling (NMDS) ordinations were used to investigate
macroinvertebrate community composition in leaf packs and artificial packs inside and
outside the cave. Site 0 m was classified as outside the cave because of the presence of light.
Macroinvertebrate abundance data were log (x + 1) transformed to down weight the
contribution of rare species. The NMDS ordination, used the Bray-Curtis distance measure,
so that distance between sites reflected degree of similarity in taxonomic composition
(Jongman et al. 1995, Quinn and Keough 2002).
One-way analysis of similarity (ANOSIM) was performed on a dissimilarity matrix using the
Bray-Curtis distance measure to test whether there were significant differences between leaf
and artificial packs inside and outside the cave. Calculations were made in Primer 6.1.12
(Clarke and Warwick 2001). The significance score indicates variability, a score of 0
indicates no difference between groups, 1 indicates complete difference, and a negative value
indicates very high variability (Quinn and Keough 2002). A P-value was calculated for each
interaction between the four factors.
Similarity percentages (SIMPER) were calculated for all interactions between leaf and
artificial packs inside and outside the cave. SIMPER indicates which species are responsible
for observed patterns in the non-metric multidimensional scaling plot (NMDS) by calculating
average Bray-Curtis dissimilarity between all pairs of inter-group samples (Clarke 1993).
Analyses were again performed in Primer 6.1.12 (Clarke and Warwick 2001).
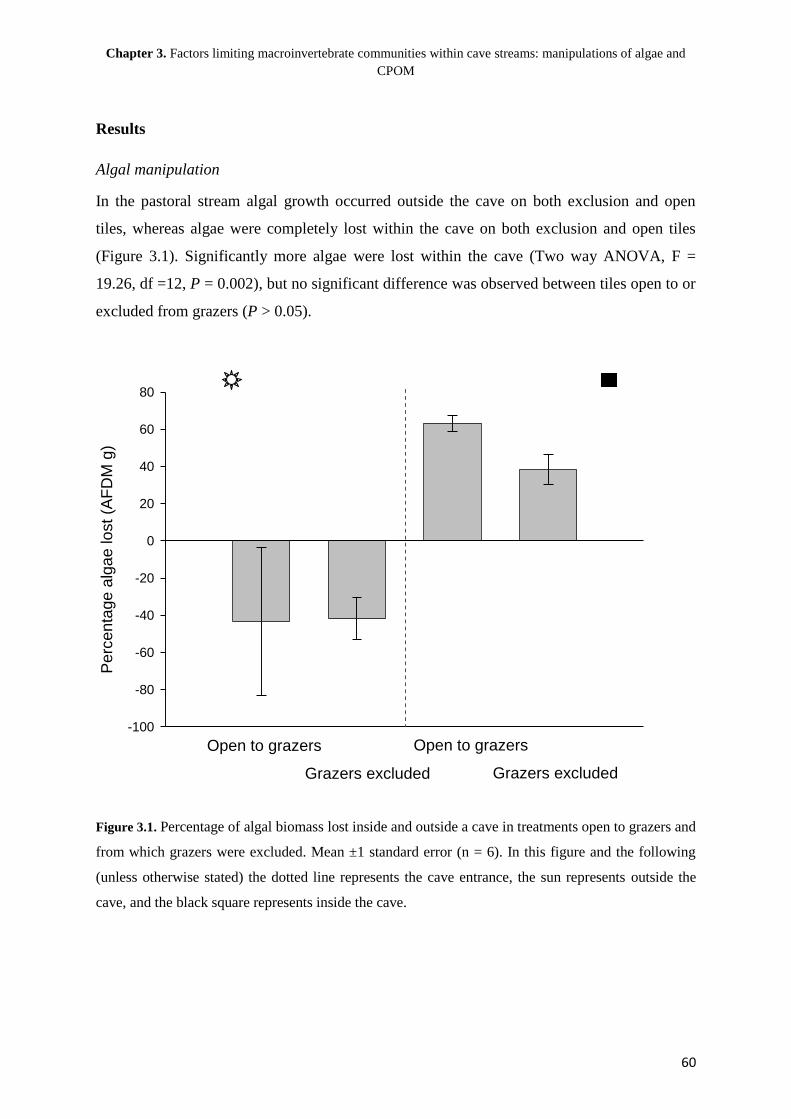
Chapter 3. Factors limiting macroinvertebrate communities within cave streams: manipulations of algae and
CPOM
60
Results
Algal manipulation
In the pastoral stream algal growth occurred outside the cave on both exclusion and open
tiles, whereas algae were completely lost within the cave on both exclusion and open tiles
(Figure 3.1). Significantly more algae were lost within the cave (Two way ANOVA, F =
19.26, df =12, P = 0.002), but no significant difference was observed between tiles open to or
excluded from grazers (P > 0.05).
Pe
rce
nta
ge
alg
ae
lo
st
(AF
DM
g)
-100
-80
-60
-40
-20
0
20
40
60
80
Open to grazers Open to grazers
Grazers excluded Grazers excluded
Figure 3.1. Percentage of algal biomass lost inside and outside a cave in treatments open to grazers and
from which grazers were excluded. Mean ±1 standard error (n = 6). In this figure and the following
(unless otherwise stated) the dotted line represents the cave entrance, the sun represents outside the
cave, and the black square represents inside the cave.
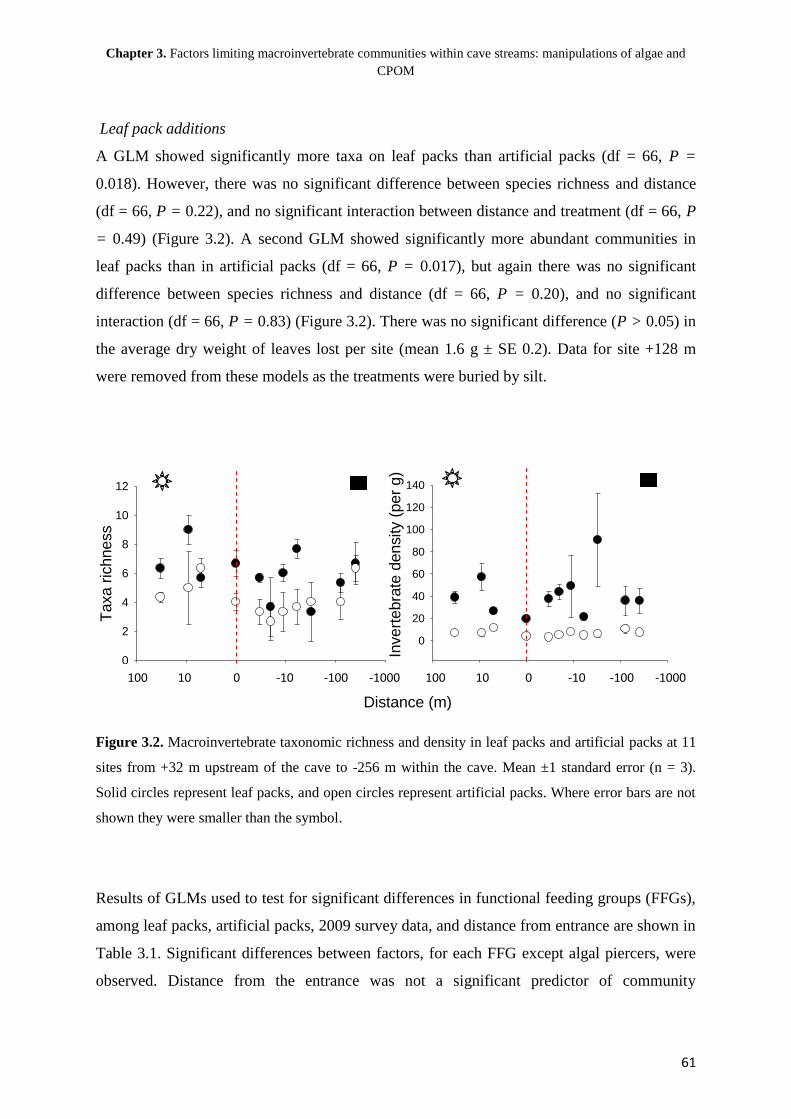
Chapter 3. Factors limiting macroinvertebrate communities within cave streams: manipulations of algae and
CPOM
61
Leaf pack additions
A GLM showed significantly more taxa on leaf packs than artificial packs (df = 66, P =
0.018). However, there was no significant difference between species richness and distance
(df = 66, P = 0.22), and no significant interaction between distance and treatment (df = 66, P
= 0.49) (Figure 3.2). A second GLM showed significantly more abundant communities in
leaf packs than in artificial packs (df = 66, P = 0.017), but again there was no significant
difference between species richness and distance (df = 66, P = 0.20), and no significant
interaction (df = 66, P = 0.83) (Figure 3.2). There was no significant difference (P > 0.05) in
the average dry weight of leaves lost per site (mean 1.6 g ± SE 0.2). Data for site +128 m
were removed from these models as the treatments were buried by silt.
Distance (m)
-3-2-1012
Taxa r
ichness
0
2
4
6
8
10
12
-3-2-1012
Invert
ebra
te d
ensity (
per
g)
0
20
40
60
80
100
120
140
Figure 3.2. Macroinvertebrate taxonomic richness and density in leaf packs and artificial packs at 11
sites from +32 m upstream of the cave to -256 m within the cave. Mean ±1 standard error (n = 3).
Solid circles represent leaf packs, and open circles represent artificial packs. Where error bars are not
shown they were smaller than the symbol.
Results of GLMs used to test for significant differences in functional feeding groups (FFGs),
among leaf packs, artificial packs, 2009 survey data, and distance from entrance are shown in
Table 3.1. Significant differences between factors, for each FFG except algal piercers, were
observed. Distance from the entrance was not a significant predictor of community
100 10 0 -10 -100 -1000 100 10 0 -10 -100 -1000
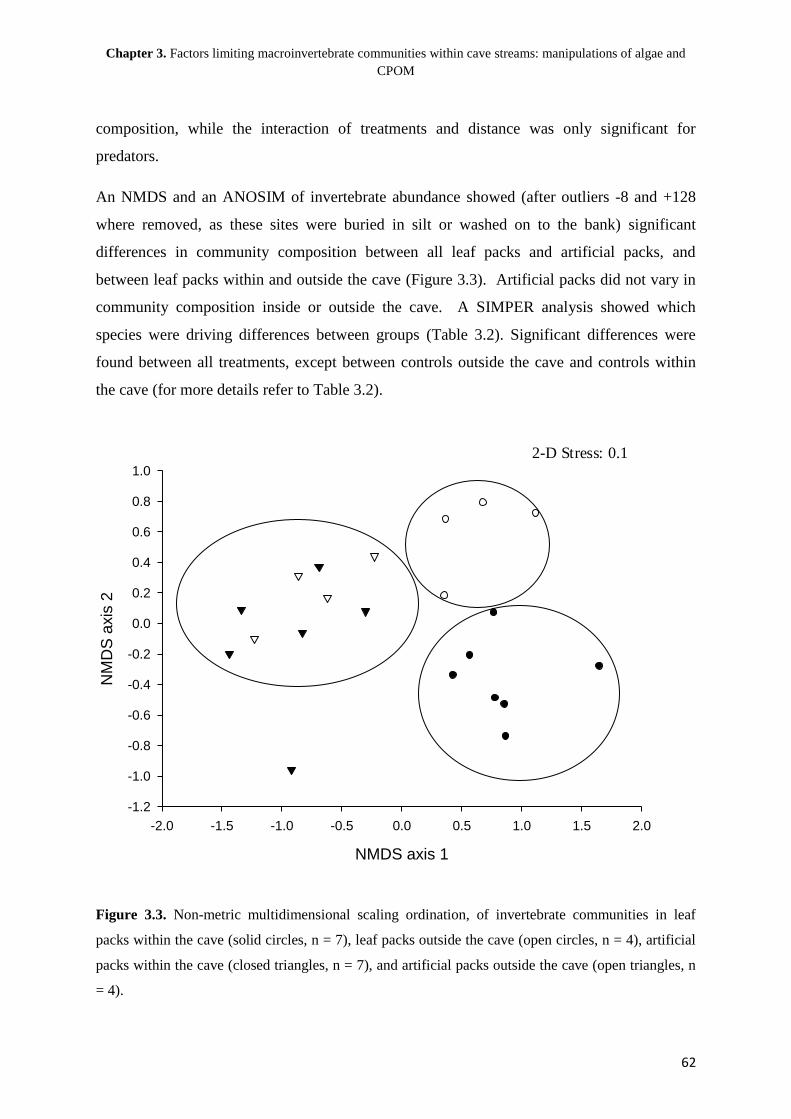
Chapter 3. Factors limiting macroinvertebrate communities within cave streams: manipulations of algae and
CPOM
62
composition, while the interaction of treatments and distance was only significant for
predators.
An NMDS and an ANOSIM of invertebrate abundance showed (after outliers -8 and +128
where removed, as these sites were buried in silt or washed on to the bank) significant
differences in community composition between all leaf packs and artificial packs, and
between leaf packs within and outside the cave (Figure 3.3). Artificial packs did not vary in
community composition inside or outside the cave. A SIMPER analysis showed which
species were driving differences between groups (Table 3.2). Significant differences were
found between all treatments, except between controls outside the cave and controls within
the cave (for more details refer to Table 3.2).
NMDS axis 1
-2.0 -1.5 -1.0 -0.5 0.0 0.5 1.0 1.5 2.0
NM
DS
axis
2
-1.2
-1.0
-0.8
-0.6
-0.4
-0.2
0.0
0.2
0.4
0.6
0.8
1.0
2-D Stress: 0.1
Figure 3.3. Non-metric multidimensional scaling ordination, of invertebrate communities in leaf
packs within the cave (solid circles, n = 7), leaf packs outside the cave (open circles, n = 4), artificial
packs within the cave (closed triangles, n = 7), and artificial packs outside the cave (open triangles, n
= 4).
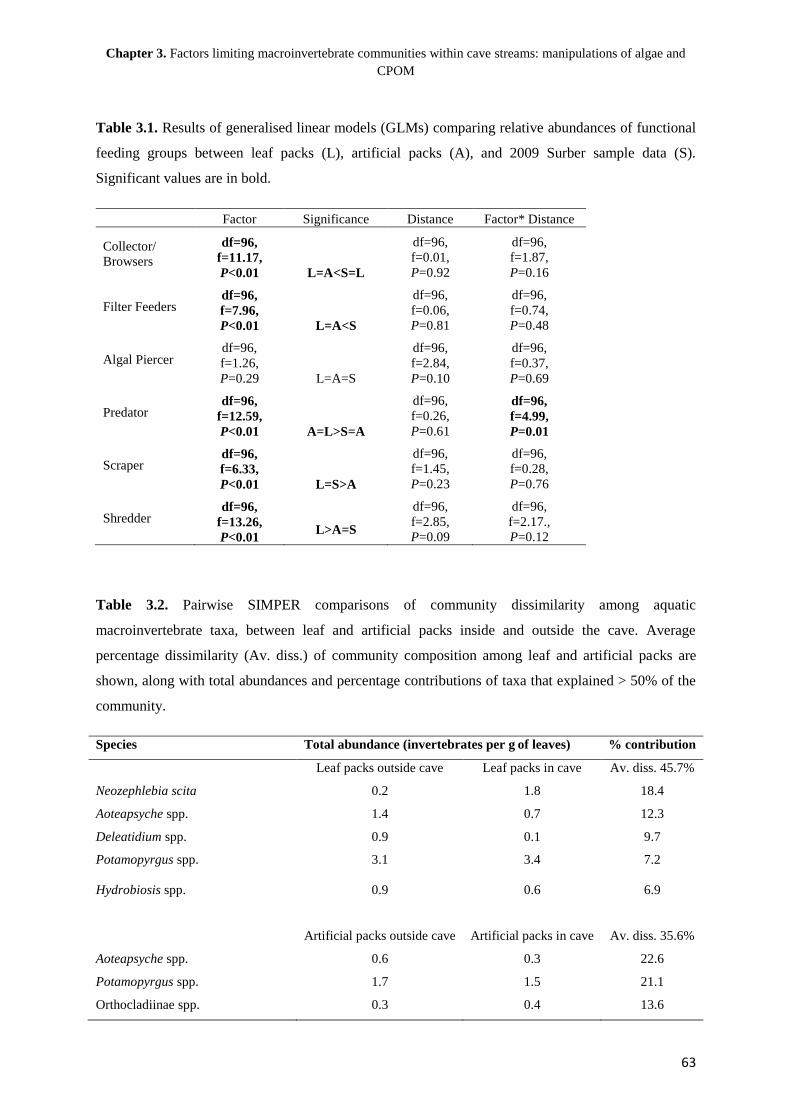
Chapter 3. Factors limiting macroinvertebrate communities within cave streams: manipulations of algae and
CPOM
63
Table 3.1. Results of generalised linear models (GLMs) comparing relative abundances of functional
feeding groups between leaf packs (L), artificial packs (A), and 2009 Surber sample data (S).
Significant values are in bold.
Factor Significance Distance Factor* Distance
Collector/
Browsers
df=96,
f=11.17,
P<0.01 L=A<S=L
df=96,
f=0.01,
P=0.92
df=96,
f=1.87,
P=0.16
Filter Feeders df=96,
f=7.96,
P<0.01 L=A<S
df=96,
f=0.06,
P=0.81
df=96,
f=0.74,
P=0.48
Algal Piercer df=96,
f=1.26,
P=0.29 L=A=S
df=96,
f=2.84,
P=0.10
df=96,
f=0.37,
P=0.69
Predator df=96,
f=12.59,
P<0.01 A=L>S=A
df=96,
f=0.26,
P=0.61
df=96,
f=4.99,
P=0.01
Scraper df=96,
f=6.33,
P<0.01 L=S>A
df=96,
f=1.45,
P=0.23
df=96,
f=0.28,
P=0.76
Shredder df=96,
f=13.26,
P<0.01 L>A=S
df=96,
f=2.85,
P=0.09
df=96,
f=2.17.,
P=0.12
Table 3.2. Pairwise SIMPER comparisons of community dissimilarity among aquatic
macroinvertebrate taxa, between leaf and artificial packs inside and outside the cave. Average
percentage dissimilarity (Av. diss.) of community composition among leaf and artificial packs are
shown, along with total abundances and percentage contributions of taxa that explained > 50% of the
community.
Species Total abundance (invertebrates per g of leaves) % contribution
Leaf packs outside cave Leaf packs in cave Av. diss. 45.7%
Neozephlebia scita 0.2 1.8 18.4
Aoteapsyche spp. 1.4 0.7 12.3
Deleatidium spp. 0.9 0.1 9.7
Potamopyrgus spp. 3.1 3.4 7.2
Hydrobiosis spp. 0.9 0.6 6.9
Artificial packs outside cave Artificial packs in cave Av. diss. 35.6%
Aoteapsyche spp. 0.6 0.3 22.6
Potamopyrgus spp. 1.7 1.5 21.1
Orthocladiinae spp. 0.3 0.4 13.6

Chapter 3. Factors limiting macroinvertebrate communities within cave streams: manipulations of algae and
CPOM
64
Discussion
Algae
The total amount of algae found inside and outside the cave differed significantly presumably
because of the loss of light, as found in other studies (Azad and Borchardt 1969, Issartel et al.
2005). The similarity between grazing and exclusion treatments indicated that grazing alone
did not explain reductions in algal biomass. Algal biomass at sites outside the cave, increased
for two possible reasons, 1) algae were not used by invertebrates as a resource, or 2) algal
biomass was not controlled by grazing pressure. However, algal biomass was also greatly
reduced within the cave, such that there was no difference between grazed and non-grazed
tiles. This was either a result of 1) algae dying due to lack of light, 2) algae being consumed
rapidly by invertebrates, or 3) a combination of the two processes. I had expected that algae
would be lost faster on open tiles within the cave, due to the lack of light. However, because I
was not able to sample tiles during the five day experiment it was not possible to assess rates
of change, and therefore my hypothesis was unable to be tested. An improvement to this
experiment would be to have greater replication and to remove algal tiles over time, allowing
the rate of change to be assessed more directly.
CPOM
Chapter two showed a decrease in invertebrate abundance and richness within the caves
(Figure 2.4). However, in the CPOM addition experiment there was no significant difference
between the density of invertebrates (per gram of leaves) inside and outside the cave. This
suggested that communities within the cave were resource limited, and the addition of
resources allowed aquatic invertebrate communities to persist within the cave environment.
Significant changes in community composition were observed between leaf and artificial
habitat packs; more taxa and greater densities of macroinvertebrates were found in leaf packs.
This finding suggested that leaves (and their associated biofilms) may represent a limiting
resource, and were inhabited for their nutritional value over and above their habitat value, as
found in previous studies (Boutin 1990, Hart and Robinson 1990, Richardson 1991). Total
grams of leaf lost per leaf pack did not differ significantly, inside and outside the cave. This
result was probably because of mechanical losses and leaching, the fact that shredder density
did not vary inside and outside the cave, or a combination of the two factors.

Chapter 3. Factors limiting macroinvertebrate communities within cave streams: manipulations of algae and
CPOM
65
Colonisation
Invertebrates potentially colonised leaf packs in two ways: 1) by drift, or 2) by active
movement on the stream bed. The majority of stream invertebrates are separated in space and
time from their resources, i.e. decoupled (Hart and Finelli 1999). Therefore, it is unlikely that
individuals were being attracted to the leaf packs by an environmental cue. The constant
density of individuals in the drift, inside and outside the cave, meant constant densities of
individuals were drifting, at any given site (Figure 2.5). It is therefore more likely that
colonisation of both leaf packs and artificial packs was influenced by the density of
individuals in the drift rather than their numbers on the bottom. However, the causes of
invertebrate drift may differ inside and outside the cave (Death 1989), possibly due to
competition outside and resource limitation inside (Peckarsky 1983). Nevertheless, caves
would appear prima facie to be resource limited, relative to surface systems.
Invertebrate community composition on leaf packs varied slightly between surface and cave
sites suggesting an individual’s behavioural and physical adaptations may have been related
to its survival. The difference between communities on leaf packs inside and outside the cave
was driven primarily by Neozephlebia, which was 941% more abundant within the cave. This
was presumably because Neozephlebia was more abundant within caves within the 2009
survey (Table 2.1), and the addition of a food resource further increased the density of
Neozephlebia within the cave. This may have been due to a superior foraging technique
allowing Neozephlebia to locate leaf packs and persist in the cave environment, or simply a
decline in cave intolerant populations, and thus a reduction in competition.
Functional feeding groups
Comparison of functional feeding groups in leaf packs and artificial packs, and with the 2009
benthos data enabled the relative importance of resources and/or habitat to be assessed with
respect to the benthos. Collector browsers were significantly under-represented on artificial
packs potentially due to low food availability in this un-conditioned habitat. Filter feeding
taxa (primarily Aoteapsyche) were dominant on the benthos potentially due to the
unsuitability of leaf and control packs as habitat, for net spinning, possibly because of an
absence of more-or-less laminar flow (Holomuzki et al. 2010).
Oxyethira was the only algal piercer found during my study and was mainly found outside
the cave, presumably because filamentous algae on which it feeds (Quinn and Hickey 1990)

Chapter 3. Factors limiting macroinvertebrate communities within cave streams: manipulations of algae and
CPOM
66
were only present outside the cave. Drift would have carried these organisms into the cave,
but because of their inability to feed on detritus or epilithic biofilms they were rarely found
within the pastoral cave. The lowest percentage of scrapers was found on artificial packs
probably due to a lack of suitable food.
Predators were dominant on leaf packs possibly because CPOM provides a food and habitat
resource, a higher prey density, or leaf packs comprise a habitat with resident predators and
others that visit to forage (Andren 1992, Prous et al. 2004). The survey data, comprising
animals from multiple habitats, had the lowest percentage of predators, and intermediate
numbers were found on artificial packs where prey was less abundant than on leaves.
Predators (primarily Hydrobiosis spp. and Tanypodinae) were significantly more abundant at
sites deep within the cave, potentially because of increased foraging on introduced substrata
within a food limited system.
Shredders were found in significantly higher percentages on leaf packs as they feed directly
on the leaves (Winterbourn 2000). The inclusion of benthic data suggests that the pastoral
stream was especially CPOM limited, with respect to shredders. This was not surprising as
pastoral streams generally have low CPOM inputs (Townsend et al. 2004). However,
shredders (primarily Austroperla) made up a low level of total density.
Further research
To quantify the extent to which caves were resource limited I would need to make the
assumption, untested within my experiments, that if the main food resource outside the cave
was transferred inside the cave, community density would increase. An improvement to this
experiment would be to net off each section, inside and outside the cave, removing
interference from drifting individuals, from upstream sources, and incorporate a temporal
scale. Treatments would have identical units so as to be directly comparable. If a negative
gradient (high and relatively even densities of individuals outside the cave but declining
within the cave to minima at the most distant sites) was observed, it would suggest that leaf
packs were randomly colonised by drift. However, if the opposite was observed it would
suggest that caves are indeed CPOM limited. Finally, if similar densities were observed at all
sites it would suggest that the whole system is limited, or not limited, by CPOM. It is likely
that other resources and factors, not just biotic ones (Rowe and Richardson 2001), are

Chapter 3. Factors limiting macroinvertebrate communities within cave streams: manipulations of algae and
CPOM
67
influencing cave communities and further experiments are needed to identify these and then
quantify them and their interactions.
Conclusion
In conclusion, the positive response of invertebrate communities to the addition of a food
resource within a cave suggested that caves were primarily limited with respect to food
resources. The addition of algae to a pastoral system, resulted in algal densities decreasing at
a faster rate within caves, but I was unable to assess whether this was because of the
influence of grazing invertebrates, or a lack of light. The addition of leaves, to the leaf-
depauperate pastoral system, resulted in changes in community composition, primarily an
increase in numbers of shredders. Finally, the addition of leaves showed they were a superior
resource to inorganic controls, suggesting that the pastoral cave and surface system was food
limited, not habitat limited.

Chapter 3. Factors limiting macroinvertebrate communities within cave streams: manipulations of algae and
CPOM
68
References:
Andren, H. 1992. Corvid density and nest predation in relation to forest fragmentation: a
landscape perspective. Ecology 73:794-804.
Azad, H. S., and J. A. Borchardt. 1969. A method for predicting the effects of light intensity
on algal growth and phosphorus assimilation. Journal of the Water Pollution Control
Federation 41:392-404
Boulton, A. J., and P. I. Boon. 1991. A review of methodology used to measure leaf litter
decomposition in lotic environments: time to turn over an old leaf? Australian Journal
of Marine & Freshwater Research 42:1-43.
Boutin, S. 1990. Food supplementation experiments with terrestrial vertebrates: patterns,
problems, and the future. Canadian Journal of Zoology 68:203-220.
Burton, T. M., and G. E. Likens. 1973. The effect of strip cutting on stream temperatures in
the Hubbard Brook Experimental Forest, New Hampshire. BioScience 23:433-435.
Clarke, K. R., and R. M. Warwick. 2001. Changes in marine communities: an approach to
statistical analysis and interpretation, 2nd edn. PRIMER-E, Plymouth.
Collier, K. J., and J. M. Quinn. 2003. Land-use influences macroinvertebrate community
response following a pulse disturbance. Freshwater Biology 48:1462-1481.
Culver, D. C. 1982. Cave life: evolution and ecology. Harvard University Press, Cambridge,
Massachusettes, USA.
Cummins, K. W. 1974. Structure and function of stream ecosystems. BioScience 24:631-641.
Death, R. G. 1989. The effect of a cave on benthic invertebrate communities in a South Island
stream. New Zealand Natural Sciences 16:67-78.
Dobson, M. 1991. An assessment of mesh bags and plastic leaf traps as tools for studying
macroinvertebrate assemblages in natural leaf packs. Hydrobiologia 222:19-28.
Dobson, M., and A. G. Hildrew. 1992. A test of resource limitation among shredding
detritivores in low order streams in southern England. Journal of Animal Ecology
61:69-77.
Fisher, S. G., and G. E. Likens. 1973. Energy flow in Bear Brook, New Hampshire: an
integrative approach to stream ecosystem metabolism. Ecological Monographs
43:421-439.

Chapter 3. Factors limiting macroinvertebrate communities within cave streams: manipulations of algae and
CPOM
69
Hanchet, S. M. 1990. Effect of land use on the distribution and abundance of native fish in
tributaries of the Waikato River in the Hakarimata Range, North Island, New Zealand.
New Zealand Journal of Marine & Freshwater Research 24:159-171.
Harding, J. S., E. F. Benfield, P. V. Bolstad, G. S. Helfman, and E. B. D. Jones III. 1998.
Stream biodiversity: the ghost of land use past. Proceedings of the National Academy
of Sciences of the United States of America 95:14843-14847.
Harding, J. S., R. G. Young, J. W. Hayes, K. A. Shearer, and J. D. Stark. 1999. Changes in
agricultural intensity and river health along a river continuum. Freshwater Biology
42:345-357.
Hart, D. D., and C. M. Finelli. 1999. Physical-biological coupling in streams: the pervasive
effects of flow on benthic organisms. Annual Review of Ecology and Systematics
30:363-395.
Hart, D. D., and C. T. Robinson. 1990. Resource limitation in a stream community:
phosphorus enrichment effects on periphyton and grazers. Ecology 71:1494-1502.
Hicks, B. J. 1997. Food webs in forest and pasture streams in the Waikato region, New
Zealand: a study based on analyses of stable isotopes of carbon and nitrogen, and fish
gut contents. New Zealand Journal of Marine and Freshwater Research 31:651-664.
Holomuzki, J. R., J. W. Feminella, and M. E. Power. 2010. Biotic interactions in freshwater
benthic habitats. Journal of the North American Benthological Society 29:220-244.
Huxel, G. R., and K. McCann. 1998. Food web stability: the influence of trophic flows across
habitats. American Naturalist 152:460-469.
Issartel, J., D. Renault, Y. Voituron, A. Bouchereau, P. Vernon, and F. Hervant. 2005.
Metabolic responses to cold in subterranean crustaceans. Journal of Experimental
Biology 208:2923-2929.
Jongman, R. H. G., J. C. Jager, C. W. N. Looman, C. J. F. ter Braak, O. F. R. van Tongeren,
P. A. Burrough, J. A. F. Oudhof, A. Barendregt, and T. J. v. d. Nes. 1995. Data
Analysis in Community and Landscape Ecology: eds Jongman, R. H. G.; Ter Braak,
C. J. F.; Van Tongeren, O. F. R: Cambridge University Press, Cambridge.
Lenat, D. R., and J. K. Crawford. 1994. Effects of land use on water quality and aquatic biota
of three North Carolina Piedmont streams. Hydrobiologia 294:185-199.
McDowell, R. W., S. T. Larned, and D. J. Houlbroke. 2009. Nitrogen and phosphorus in New
Zealand streams and rivers: control and impact of eutrophication and the influence of

Chapter 3. Factors limiting macroinvertebrate communities within cave streams: manipulations of algae and
CPOM
70
land management. New Zealand Journal of Marine and Freshwater Research 43:985-
995.
Niyogi, D. K., M. Koren, C. J. Arbuckle, and C. R. Townsend. 2007. Stream communities
along a catchment land-use gradient: subsidy-stress responses to pastoral
development. Environmental Management 39:213-225.
Peckarsky, B. 1983. Biotic interactions or abiotic limitations? A model of lotic community
structure. Fontaine, T. and Bartell, S. eds: Dynamics of lotic ecosystems: Ann Arbor
Science Publishers, Michigan, USA, pp 303-323
Poff, N. L., J. D. Allan, M. B. Bain, J. R. Karr, K. L. Prestegaard, B. D. Richter, R. E. Sparks,
and J. C. Stromberg. 1997. The natural flow regime. BioScience 47:769-784.
Prous, X., R. Lopes Ferreira, and R. Parentoni Martins. 2004. Ecotone delimitation: epigean-
hypogean transition in cave ecosystems. Austral Ecology 29:374-382.
Quinn, G. P., and M. J. Keough. 2002. Experimental design and data analysis for biologists.
Cambridge University Press, Cambridge
Quinn, J. M. 2000. Effects of pastoral development. In: Collier.K.J. and Winterbourn,M.J.
eds. New Zealand stream invertebrates: ecology and implications for management.
New Zealand Liminological Society, Christchurch:208-229.
Quinn, J. M., and A. B. Cooper. 1997. Land-water interactions at Whatawhata, New Zealand:
introduction and synthesis. New Zealand Journal of Marine and Freshwater Research
31:569-577.
Quinn, J. M., and C. W. Hickey. 1990. Characterisation and classification of benthic
invertebrate communities in 88 New Zealand rivers in relation to environmental
factors. New Zealand Journal of Marine & Freshwater Research 24:387-409.
Quinn, J. M., G. L. Steele, C. W. Hickey, and M. L. Vickers. 1994. Upper thermal tolerances
of twelve New Zealand stream invertebrate species. New Zealand Journal of Marine
and Freshwater Research 28:391-397.
Richardson, J. S. 1991. Seasonal food limitation of detritivores in a montane stream: an
experimental test. Ecology 72:873-887.
Richardson, J. S. 1992a. Coarse particulate detritus dynamics in small, montane streams of
southwestern British Columbia. Canadian Journal of Fisheries and Aquatic Sciences
49:337-346.
Richardson, J. S. 1992b. Food, microhabitat, or both? Macroinvertebrate use of leaf
accumulations in a montane stream. Freshwater Biology 27:169-176.

Chapter 3. Factors limiting macroinvertebrate communities within cave streams: manipulations of algae and
CPOM
71
Rowe, L., and J. S. Richardson. 2001. Community responses to experimental food depletion:
resource tracking by stream invertebrates. Oecologia 129:473-480.
Rutherford, J. C., S. Blackett, C. Blackett, L. Saito, and R. J. Davies-Colley. 1997. Predicting
the effects of shade on water temperature in small streams. New Zealand Journal of
Marine and Freshwater Research 31:707-721.
Scarsbrook, M. R., J. M. Quinn, J. Halliday, and R. Morse. 2001. Factors controlling litter
input dynamics in streams draining pasture, pine, and native forest catchments. New
Zealand Journal of Marine and Freshwater Research 35:751 - 762.
Simon, K. S., and E. F. Benfield. 2001. Leaf and wood breakdown in cave streams. Journal of
the North American Benthological Society 20:550-563.
Simon, K. S., E. F. Benfield, and S. A. Macko. 2003. Food web structure and the role of
epilithic biofilms in cave streams. Ecology 84:2395-2406.
Sponseller, R. A., E. F. Benfield, and H. M. Valett. 2001. Relationships between land use,
spatial scale and stream macroinvertebrate communities. Freshwater Biology
46:1409-1424.
Suberkropp, K., and E. Chauvet. 1995. Regulation of leaf breakdown by fungi in streams:
influences of water chemistry. Ecology 76:1433-1445.
Suberkropp, K., and M. J. Klug. 1980. The maceration of deciduous leaf litter by aquatic
hyphomycetes. Canadian Journal of Botany 58:1025-1031.
Townsend, C. R., B. J. Downes, K. Peacock, and C. J. Arbuckle. 2004. Scale and the
detection of land-use effects on morphology, vegetation and macroinvertebrate
communities of grassland streams. Freshwater Biology 49:448-462.
Townsend, C. R., M. R. Scarsbrook, and S. Dolédec. 1997. The intermediate disturbance
hypothesis, refugia, and biodiversity in streams. Limnology and Oceanography
42:938-949.
Vannote, R. L., and B. W. Sweeney. 1980. Geographic analysis of thermal equilibria: a
conceptual model for evaluating the effect of natural and modified thermal regimes on
aquatic insect communities. American Naturalist 115:667-695.
Wallace, J. B., S. L. Eggert, J. L. Meyer, and J. R. Webster. 1997. Multiple trophic levels of a
forest stream linked to terrestrial litter inputs. Science 277:102-104.
Wallace, J. B., S. L. Eggert, J. L. Meyer, and J. R. Webster. 1999. Effects of resource
limitation on a detrital-based ecosystem. Ecological Monographs 69:409-442.

Chapter 3. Factors limiting macroinvertebrate communities within cave streams: manipulations of algae and
CPOM
72
Wallace, J. B., J. R. Webster, and T. F. Cuffney. 1982. Stream detritus dynamics: regulation
by invertebrate consumers. Oecologia 53:197-200.
Ward, J. V., and J. A. Stanford. 1982. Thermal responses in the evolutionary ecology of
aquatic insects. Annual Review of Entomology 27:97-117.
Waters, T. F. 1995. Sediment in streams: source, biological effects, and control. American
Fisheries Society, Bethesda, Maryland, United States of America.
Whiles, M. R., and J. B. Wallace. 1995. Macroinvertebrate production in a headwater stream
during recovery from anthropogenic disturbance and hydrologic extremes. Canadian
Journal of Fisheries and Aquatic Sciences 52:2402-2422.
Williams, P. W. 1992. Karst in New Zealand. in: Landforms of New Zealand; Soons, M.J.
and Selby, J.M. eds; Longman Paul, New Zealand.
Williamson, R. B., R. K. Smith, and J. M. Quinn. 1992. Effects of riparian grazing and
channelisation on streams in Southland, New Zealand. 1. Channel form and stability.
New Zealand Journal of Marine & Freshwater Research 26:241-258.
Winterbourn, M. J. 1973. A guide to the freshwater Mollusca of New Zealand. Tuatara
20:141-159.
Winterbourn, M. J. 2000. Feeding ecology. Collier.K.J.; Winterbourn,M.J. eds. New Zealand
stream invertebrates: ecology and implications for management. New Zealand
Liminological Society, Christchurch:100-124.
Winterbourn, M. J., and A. Fegley. 1989. Effects of nutrient enrichment and grazing on
periphyton assemblages in some spring-fed, South Island streams. New Zealand
Natural Sciences 16:57-65.
Winterbourn, M. J., K. L. D. Gregson, and C. H. Dolphin. 2000. Guide to the aquatic insects
of New Zealand. Bulletin of the Entomological Society of New Zealand:13:102pp.
Wood, P. J., J. Gunn, and S. D. Rundle. 2008. Response of benthic cave invertebrates to
organic pollution events. Aquatic Conservation: Marine and Freshwater Ecosystems
18:909-922.
Young, R. G., C. D. Matthaei, and C. R. Townsend. 2008. Organic matter breakdown and
ecosystem metabolism: functional indicators for assessing river ecosystem health.
Journal of the North American Benthological Society 27:605-625.

73
Arachnocampa luminosa consuming a mayfly, 200 m within Hollow Hill cave
Chapter 4. Comparing energy pathways between cave and surface environments using stable isotopes
74
Chapter 4
Comparing energy pathways between cave and surface environments using
stable isotopes
Abstract
Cave stream invertebrate communities have been characterised as resource limited with a
dependence upon surface-derived energy resources, primarily FPOM and CPOM. This
dependence upon surface derived energy, detritus, as well as the potential for cave aquatic
communities to subsidise subterranean terrestrial communities was assessed by investigating
a longitudinal gradient in a cave stream, using stable isotopes of carbon and nitrogen. Cave
aquatic communities were found to be dependent on surface derived materials, with an
isotopic signature similar to that of C3 plants. Seston, benthic FPOM, and epilithon (i.e.
bacterial, fungal, and diatom communities) were the most important basal resources within
the cave, compared with seston, benthic FPOM, and filamentous algae outside of the cave. As
found in a previous study CPOM did not appear to be readily incorporated into the food-web.
Furthermore, in the absence of an alternative carbon source aquatic derived energy would
seem to support subterranean terrestrial predators, such as glow-worms, harvestmen, and
spiders.

Chapter 4. Comparing energy pathways between cave and surface environments using stable isotopes
75
Introduction
Surface - cave stream subsidies
Cave stream macroinvertebrate communities have been shown to use surface derived
resources, primarily because of the absence of photosynthetic fixation of carbon within caves
(Culver 1982, Death 1989, Simon et al. 2003). In other systems, variations in photic levels
have been used to account for differences in basal resource production, i.e. between forested
and pastoral streams (Hicks 1997, Quinn and Cooper 1997, Young and Huryn 1999,
Scarsbrook et al. 2001, Quinn and Stroud 2002, Collier and Quinn 2003, Death et al. 2003).
However, differences between cave and surface systems are even more pronounced, with
surface streams containing a variety of resources compared to cave streams (Simon et al.
2003). Surface streams can be abundant in detritus, fine and coarse particulate organic matter
(FPOM and CPOM, respectively) (Quinn 2000). These can be directly consumed as well as
fuelling heterotrophic production by bacteria (Hall et al. 2000), and autotrophs, such as algae
(McCutchan and Lewis 2002), which positively influence detrital levels. Within caves the
autochthonous component is absent, detritus biomass depends on upstream supplies, and
riparian inputs are minimal (Simon et al. 2003).
Studies have shown the importance of allochthonous coarse particulate organic matter
(CPOM) to forested streams (France 1995, Quinn and Cooper 1997, Wallace et al. 1999,
Scarsbrook et al. 2001, Collier and Quinn 2003, England and Rosemond 2004). However, in
caves evidence suggests that basal resources with smaller individual biomass, such as
imported algae and bacteria are more important to community functioning (Simon et al.
2003). Within caves these resources appear to be important even when large amounts of
CPOM are present (Simon et al. 2003). CPOM may be directly consumed, broken down into
FPOM, or made available through microbial films (Cummins 1974), but the direct use of
CPOM may not be as high as previously assumed (Simon et al. 2003). Aquatic
macroinvertebrates, feeding upon the afore mentioned basal resources, are important prey for
predators, both aquatic (Winterbourn 2000) and terrestrial (Burdon and Harding 2008). This
“leakiness” across stream boundaries provides important resources for aquatic and terrestrial
communities (Wallace et al. 1997, Power 2001, Baxter et al. 2005). Specifically, consumer
aquatic invertebrates are important resources for invertebrate predators, such as hydrobiosid
Chapter 4. Comparing energy pathways between cave and surface environments using stable isotopes
76
caddisflies (Winterbourn 2000), fish (Winterbourn 1978, Shave et al. 1994), and spiders and
glow-worms (Pugsley 1984, Broadley and Stringer 2001).
Stable isotopes and food-webs
To construct food-webs in ecological systems a variety of techniques have been used to
assign trophic position and food resource preference. Traditionally, feeding activities were
inferred through feeding behaviours, morphology, observational experiments, and gut
analysis (Winterbourn 2000). However, recently researchers have used stable isotope ratios,
primarily Carbon (C) and Nitrogen (N) to infer energy flows and trophic position. Within
stream systems stable isotopes were first used by Rounick et al. (1982), to assess the relative
importance of autochthonous and allochthonous production. Subsequently, stable isotopic
ratios have been routinely used to assess food-web structure (Peterson and Fry 1987, Hicks
1997, Pohlman et al. 1997, Bosley and Wainright 1999, Matsuoka et al. 2001, McCutchan
and Lewis 2002, Post 2002, Simon et al. 2003, England and Rosemond 2004, Graening 2005,
Stenroth et al. 2006, Kolasinski et al. 2008, McHugh et al. 2010).
Stable isotopes are powerful tools for untangling complicated food-webs, providing a time
integrated average of an individual’s or population’s diet (Post 2002). They allow the
tracking of energy, or mass flow, through ecological communities. This is possible because
the sampled individual’s isotopic ratio will reflect that of its food, prey, allowing an
assessment of materials consumed. An individual’s trophic level is assessed through
variations in the isotopic signature of carbon (δ13
C) and nitrogen (δ15
N). These assessments
are made possible due to the predictable degree of change in δ13
C and δ15
N values between
trophic levels. Energy is passed through trophic levels, such that δ13
C is enriched by about
1‰ and δ15
N by between 3 - 4‰, relative to their source (Post 2002), although values
between 2 - 5‰ have been used to indicate a trophic level (Simon et al. 2003). A recent
study by McHugh et al. (2010) used a change of 3.4‰ to denote a differences between a
trophic level. However, Kilham et al. (2009) have shown a trophic step of a much lower
value, as low as 1.0 - 1.7‰, in tropical streams suggesting trophic transfer of nitrogen is not
straight forward. Thus, isotopic ratios reflect the assimilation of energy through all pathways
leading to an organism (Hicks 1997, Post 2002, Fry 2006). A study by Thompson et al.
(2007) suggested that above the herbivore trophic level food-webs were better characterised
as a tangled web of omnivores, making traditional assessments of trophic position near

Chapter 4. Comparing energy pathways between cave and surface environments using stable isotopes
77
impossible and highlighting the importance of trophic omnivory (feeding across multiple
trophic levels). Furthermore, where multiple carbon sources occur, and their δ13
C values
overlap, it may be impossible to assess the relative importance of materials (Winterbourn
2000).
Studies within cave streams have revealed aquatic communities are primarily dependent upon
surface derived organic carbon, with the exception of some geothermal systems (Sarbu et al.
1996, Engel 2007, Porter et al. 2009, Engel et al. in press). Typical cave aquatic food-webs
contain three trophic levels; a detrital resource base, a second trophic level of detritivores,
and a top level of predators, primarily fish; although predatory invertebrates are a potential
third trophic level making fish a potential fourth trophic level (Graening and Brown 2003,
Simon et al. 2003, Graening 2005). These detritus based systems are generally bottom-up
controlled and despite being labelled as energy limited (Culver 1985), can support the
formation of diverse food-webs (Polis et al. 1997). Simon et al. (2003) used tracers to assess
uptakes of dissolved organic carbon (DOC), and found it was immobilised in biofilms and
thus available to primary consumers. By the end of the experiment top predators, fish, were
labelled with the tracer. Thus, the flow of surface derived carbon was traced through all
levels of the cave aquatic community.
Aquatic to terrestrial subsidies
The effect of terrestrial subsidies on streams has been the subject of much research, e.g. in
relation to Allen’s paradox (Allen 1951, Waters 1988, Berg and Hellenthal 1992, Huryn
1996, Penczak et al. 1996, Collier et al. 2004, Wright-Stow et al. 2006). However, more
recently aquatic subsidies to terrestrial environments have come under increasing scrutiny
(Nakano and Murakami 2001, Malmqvist 2002, Baxter et al. 2005, Nowlin et al. 2008,
Schneider et al. 2010, Wesner 2010). Aquatic insect biomass has been positively correlated
with riparian spider density and biomass; particularly with respect to web building spiders,
such as tetragnathids, araneids, and stiphidiids (Burdon and Harding 2008). These spiders as
well as Opiliones (harvestmen) (known cannibals and predators of spiders (Sergeeva 1999))
are all found within caves. The commercially important species Arachnocampa luminosa
(Diptera: Keroplatidae), or glow-worms feed upon aquatic insects and fall prey to arachnid
predators (Pugsley 1984). Therefore, cave aquatic communities, dependent on surface
derived subsidies, may supply a necessary subsidy to subterranean terrestrial communities.

Chapter 4. Comparing energy pathways between cave and surface environments using stable isotopes
78
The primary aim of this chapter was to assess the functioning and energy flow of cave aquatic
food-webs. Firstly, the relative importance of differing basal resources to aquatic
communities inside and outside of the cave was assessed. Secondly, interactions within
aquatic invertebrate communities and between aquatic and terrestrial communities were
assessed.
Methods
The study was carried out in a single stream-cave system; Murchies Stream. Initially, a
second stream was included in the study however, a bacterial bloom in the headwaters
markedly changed the system and severely depleted benthic communities (see Chapter 3 for
greater details).
Samples for stable isotope analyses were collected on 23 February 2010, at four sites along
the surface-cave stream continuum (+24 m, 0 m, -32 m, and -256 m from the cave entrance).
Before entering the cave Murchies stream flows through a pastoral landscape, primarily
vegetated by C3 plants with a mean δ13
C value of approximately -28‰ (Fry 2006).
However, it is likely that C4 plants, with a mean δ13
C of approximately -13‰ (Fry 2006),
were also present.
Aquatic invertebrate samples were collected by sampling a wide range of habits in each reach
using a kick net. Animals were sorted in the field, and kept cool until they could be frozen.
Benthic FPOM was collected from the top 10 mm of the streambed using a Turkey baster.
Seston was collected using a plankton net, 60 µm mesh, placed in the water column. The
seston sample from -32 m was lost in transit, but as seston did not change between the other
three sites it was assumed to be similar at this site. Epilithon was collected by brushing 3-5
rocks with a nylon brush and washing the scrapings into a vial. Filamentous algae were
collected with forceps from the stream bed.
Terrestrial invertebrates were handpicked. Three replicate samples of each component of the
food web were taken from random locations at each site; whenever possible, > 10 individuals
per sample were taken to represent taxa. Samples were frozen within a few hours of
collection and returned to the laboratory. In the laboratory, samples were thawed and aquatic
macroinvertebrates identified to family in most cases, although several were classified to

Chapter 4. Comparing energy pathways between cave and surface environments using stable isotopes
79
genus under a 40x dissecting microscope. Identifications were made using keys and guides by
Winterbourn (1973) and Winterbourn et al. (2000). Spiders were classed to family using
Paquin et al. (2010). Invertebrate digestive tracts were removed, and Potamopyrgus were
manually de-shelled, and their radulae removed. Deleatidium and Neozephlebia samples were
combined and homogenised because of the scarcity of individuals, as were collector browser
stoneflies (predominantly Zelandoperla) and cased caddis (primarily Hudsonema).
In the laboratory, basal resources were rinsed with deionised water, excluding seston and
benthic FPOM, and any contaminants, such as invertebrates, were removed. All materials
were placed in eppendorf vials and dried at 45°C for a minimum of five days. Invertebrate
isotope samples generally contained more than one individual, enabling the range of likely
isotopic signatures to be captured. Samples were ground with a glass rod or a mortar and
pestle, and returned to the drying oven. All basal resource samples were acidified with 30%
HCl, to remove inorganic carbon, which may have been present in the form of limestone
(Simon et al. 2003). Acid is not thought to significantly alter carbon and nitrogen values
(Bosley and Wainright 1999, Kolasinski et al. 2008). Lipids were not removed from samples
as they can affect nitrogen values (Post et al. 2007). Furthermore normalization equations
were not deemed necessary as consumers and end members δ13
C values were < 10 – 12‰
(Post et al. 2007). Samples were weighted, placed in tin capsules (8 x 5 mm, OEA
Laboratories Ltd, Callington, Cornwall, UK) and sent to the Cornell Isotope Laboratory
(COIL: www.cosbil.com) for analysis. Analyses were preformed on a Thermo Delta V
isotope ratio mass spectrometer (IRMS) interfaced to a NC2500 elemental analyser. The
overall standard deviation for the internal MINK standard (animal) was 0.17‰ for δ15
N and
0.13‰ for δ13
C. A chemical Methionine standard, obtained from amplitudes of 250 mV and
13000 mV, produced an error associated with linearity of 0.24‰ for 15
N and 0.13‰ for δ 13
C.
Delta values were calculated using the formula: δX (‰) = ((Rsample ⁄Rstandard) -1) x 1000
To infer feeding a shift in δ13
C of ~1‰ was used, while a shift in δ15
N of ~3.4‰ was used, in
accordance with McHugh et al. (2010). Mixing models were not deemed necessary because
of the similarity of δ13
C values, suggesting limited variation in carbon sources.
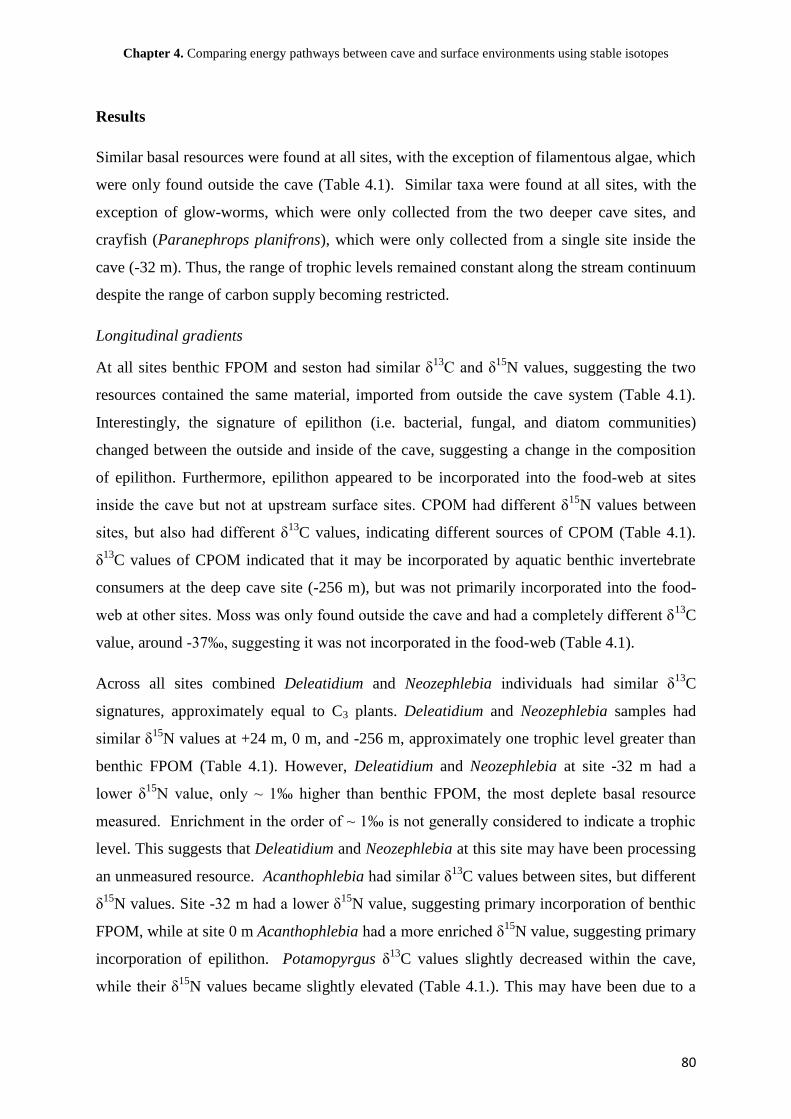
Chapter 4. Comparing energy pathways between cave and surface environments using stable isotopes
80
Results
Similar basal resources were found at all sites, with the exception of filamentous algae, which
were only found outside the cave (Table 4.1). Similar taxa were found at all sites, with the
exception of glow-worms, which were only collected from the two deeper cave sites, and
crayfish (Paranephrops planifrons), which were only collected from a single site inside the
cave (-32 m). Thus, the range of trophic levels remained constant along the stream continuum
despite the range of carbon supply becoming restricted.
Longitudinal gradients
At all sites benthic FPOM and seston had similar δ13
C and δ15
N values, suggesting the two
resources contained the same material, imported from outside the cave system (Table 4.1).
Interestingly, the signature of epilithon (i.e. bacterial, fungal, and diatom communities)
changed between the outside and inside of the cave, suggesting a change in the composition
of epilithon. Furthermore, epilithon appeared to be incorporated into the food-web at sites
inside the cave but not at upstream surface sites. CPOM had different δ15
N values between
sites, but also had different δ13
C values, indicating different sources of CPOM (Table 4.1).
δ13
C values of CPOM indicated that it may be incorporated by aquatic benthic invertebrate
consumers at the deep cave site (-256 m), but was not primarily incorporated into the food-
web at other sites. Moss was only found outside the cave and had a completely different δ13
C
value, around -37‰, suggesting it was not incorporated in the food-web (Table 4.1).
Across all sites combined Deleatidium and Neozephlebia individuals had similar δ13
C
signatures, approximately equal to C3 plants. Deleatidium and Neozephlebia samples had
similar δ15
N values at +24 m, 0 m, and -256 m, approximately one trophic level greater than
benthic FPOM (Table 4.1). However, Deleatidium and Neozephlebia at site -32 m had a
lower δ15
N value, only ~ 1‰ higher than benthic FPOM, the most deplete basal resource
measured. Enrichment in the order of ~ 1‰ is not generally considered to indicate a trophic
level. This suggests that Deleatidium and Neozephlebia at this site may have been processing
an unmeasured resource. Acanthophlebia had similar δ13
C values between sites, but different
δ15
N values. Site -32 m had a lower δ15
N value, suggesting primary incorporation of benthic
FPOM, while at site 0 m Acanthophlebia had a more enriched δ15
N value, suggesting primary
incorporation of epilithon. Potamopyrgus δ13
C values slightly decreased within the cave,
while their δ15
N values became slightly elevated (Table 4.1.). This may have been due to a

Chapter 4. Comparing energy pathways between cave and surface environments using stable isotopes
81
switch in food resources, from filamentous algae, in the surface stream, to epilithon (i.e.
bacterial, fungal, and diatom communities), within the cave. Collector-browser stoneflies had
similar δ 13
C values at site -32 m and -256 m, enriched δ15
N values at the entrance, relative to
sites -256 m and -32 m, and were unmeasured, as none were collected, at +24 m. Stoneflies
δ15
N value at site -32 m and -256 m suggested the consumption of benthic FPOM. While at 0
m stoneflies appeared to primarily incorporate epilithon, although it is possible that some
benthic FPOM was incorporated to their diet. The δ15
N signature of the predatory caddis
Hydrobiosidae was not markedly higher than any measured invertebrate prey, presumably
because of trophic omnivory (feeding across multiple trophic levels, i.e. basal resources and
consumers) (Hicks 1997, Winterbourn 2000), or the presence of an unmeasured resource.
Opiliones (Harvestmen) had similar δ13
C and δ15
N values at -32 m and -256 m, suggesting
primary incorporation of aquatic derived energy, such as Aoteapsyche, Hydrobiosidae,
mayflies, and stoneflies (Table 4.1). Glow-worms may have been consumed by Opiliones at
-256 m, but did not appear to be at -32 m, even though Opiliones were present. Lower δ13
C
and δ15
N values at site 0 m were observed in Opiliones, and potentially result from their
consumption of an unmeasured terrestrial source, as the δ13
C value of Opiliones at this site
was lower than any measured aquatic source.
Tetragnathids had similar δ13
C values across sites (Table 4.1). Tetragnathids were not
collected from site -32 m. A lower δ15
N value, relative to 0 m and -128 m, was observed at
site +24 m, and was equated to the lower δ15
N value of mayflies at this site, primary prey of
tetragnathids (Burdon and Harding 2008).
Araneidae had similar δ13
C values at sites +24 m and -32 m (Table 4.1). However, a larger
δ15
N range was observed at site -32 m. This suggested that spiders at this site were
incorporating energy from mayflies and caddisflies, while outside the cave they only
appeared to incorporate energy from mayflies.

Chapter 4. Comparing energy pathways between cave and surface environments using stable isotopes
82
Table 4.1. Basal resource and invertebrate carbon and nitrogen ratios, at four sites along the stream
continuum. Distances are in relation to the cave entrance. Values in brackets are standard error bars.
Some sites do not have error bars because of the scarcity of individuals.
* Deleatidium spp. and Neozephlebia spp. were combined and homogenised because of the scarcity of individuals

Chapter 4. Comparing energy pathways between cave and surface environments using stable isotopes
83
Stiphidiidae had similar δ13
C but different δ15
N values at sites +24 m, -32 m, and -256 m,
however variation in δ13
C and δ15
N values occurred at 0 m, relative to the other sites (Table
4.1). The δ15
N value of Stiphidiidae at 0 m ranged from ~3 to ~8.5‰ δ15
N, and may have
been due to an unmeasured terrestrial prey resource. At +24 m stiphidiids appeared to
assimilate energy from Aoteapsyche, Hydrobiosidae, and mayflies; although Stiphidiidae
could also have incorporated energy from tetragnathids and araneids. At site -32 m
Aoteapsyche, mayflies, and stoneflies may have been incorporated into stiphidiid diets.
However, at -256 m slightly lower δ15
N values were observed, relative to +24 m and -32 m,
suggesting incorporation of Aoteapsyche, Hydrobiosidae, mayflies, stoneflies, and possibly
glow-worms to stiphidiid diets.
Glow-worms were only found within the cave. They had similar δ13
C values throughout, but
showed variation in δ15
N values. Glow-worms at -32 m were ~2‰ higher in δ15
N than glow-
worms at -256 m. Glow-worms at -32 m potentially incorporated energy from Aoteapsyche,
mayflies, and stoneflies. While at -256 m the most likely potential prey, stoneflies, were only
~1‰ δ15
N lower, which is not traditionally enough to infer energy transfer. This suggests the
possibility of unmeasured food resources at the deep cave site. Glow-worms obtained at
-256 m were predominantly early instar, and potentially had been unable to utilise aquatic
derived food resources, because of their size, or a decline in aquatic invertebrate abundance.
Surface stream food-web
At this site (+24 m) aquatic invertebrate communities appeared primarily reliant upon the
basal resources; filamentous algae, seston, and benthic FPOM (Figure 4.1). Both seston and
benthic FPOM potentially contained filamentous algae. Epilithon and moss did not appear to
be incorporated by the sampled invertebrates, because of their outlying carbon signatures.
Combined Deleatidium and Neozephlebia were assumed to primarily incorporate benthic
FPOM, Aoteapsyche primarily incorporated seston, and Potamopyrgus primarily incorporated
filamentous algae (Winterbourn 2000). Archichauliodes diversus (toebiters) and hydrobiosids
appeared to primarily incorporate energy from Deleatidium and Neozephlebia, although they
could have incorporated filamentous algae (Winterbourn 2000). Terrestrial predators,
tetragnathids, araneids, and an unknown spider also appeared to predate on mayflies. The
predatory aquatic flatworm (Platyhelminthes) may have preyed upon all aquatic
invertebrates. The top troglophile predator, Stiphidiidae, appeared to predate araneids,
tetragnathids, and the aquatic invertebrates Aoteapsyche, Hydrobiosidae, Deleatidium and

Chapter 4. Comparing energy pathways between cave and surface environments using stable isotopes
84
Neozephlebia.
del13
C (ppt)
-40 -35 -30 -25 -20
del1
5 N
(ppt)
0
2
4
6
8
10
Potamopyrgus
Coloburiscus
Moss
Epilithon
Aoteapsyche
Combined
Del. & Neo.
FPOM
Seston
Hydrobiosis
StiphidiidaeFlatworm
Tetragnathid
Unknown spider
Araneida
Musid
Filamentous algae
Archichauliodes diversus
Figure 4.1. Biplot of mean δ13
C and δ15
N values between different components of the food-web at the
upstream site (+24 m) (Error bars are ± 1 standard error). Sites with no error bars did not have enough
material for more than one sample. Most aquatic samples contained more than one individual. FPOM
is benthic FPOM. Closed circles represent basal resources, open circles represent aquatic
invertebrates, and closed triangles represent non-aquatic organisms.
Cave entrance
At this site (0 m) aquatic invertebrate communities appeared primarily reliant upon the basal
resources; benthic FPOM, seston, and epilithon (Figure 4.2). Deleatidium and Neozephlebia
seemed to primarily graze benthic FPOM, while Aoteapsyche potentially filtered both
epilithon and FPOM (Winterbourn 2000). Collector browser stoneflies, cased caddis
(primarily Hudsonema), and gastropods (Potamopyrgus) appeared to switch from feeding on
filamentous algae at the surface stream site to epilithon within the cave. Although
Hudsonema is an omnivore and may have also been feeding on Aoteapsyche, Deleatidium
and Neozephlebia (Winterbourn 2000). The top predators were tetragnathids (appearing to

Chapter 4. Comparing energy pathways between cave and surface environments using stable isotopes
85
prey on Aoteapsyche, Deleatidium and Neozephlebia) and stiphidiids (appearing to prey on
Aoteapsyche, all mayfly taxa, and Opiliones). Opiliones were potentially feeding upon an
unmeasured prey, possibly of terrestrial origin.
del13
C (ppt)
-40 -35 -30 -25 -20
del1
5 N
(ppt)
0
2
4
6
8
10
Adult caddis
CPOM
Potamopyrgus
Epilithon
Aoteapsyche
Stonefly
Combined
Del. & Neo.
FPOM
Seston
Acanthophlebia
Stiphidiidae
Opiliones
Tetragnathid
Case caddis
Unknown spider
Figure 4.2. Biplot of mean δ13
C and δ15
N values between different components of the food-web at the
entrance site (0 m) (Error bars are ± 1 standard error). Sites with no error bars did not have enough
material for more than one sample. Most aquatic samples contained more than one individual. FPOM
is benthic FPOM. Closed circles represent basal resources, open circles represent aquatic
invertebrates, and closed triangles represent non-aquatic organisms.
Cave food-web
Within the cave (-32 m) the majority of aquatic invertebrates appeared reliant upon benthic
FPOM and seston (Figure 4.3). However, Potamopyrgus appeared to primarily feed on
epilithon and benthic FPOM. Crayfish were potentially predating Potamopyrgus and other
aquatic invertebrates, as well as grazing basal resources. There was little variation in the δ15
N

Chapter 4. Comparing energy pathways between cave and surface environments using stable isotopes
86
value of terrestrial predators, suggesting exclusive predation on aquatic invertebrates,
excluding Potamopyrgus and crayfish.
del13
C (ppt)
-40 -35 -30 -25 -20
de
l15
N (
pp
t)
0
2
4
6
8
10
Crayfish
CPOM
Potamopyrgus
Epilithon
Aoteapsyche
Stonefly
Combined Del. & Neo.FPOM
Acanthophlebia
Orbweb
Stiphidiidae
Opiliones
Glow-worm
Figure 4.3. Biplot of mean δ 13
C and δ 15
N values between different components of the food-web at
the cave site (-32 m) (Error bars are ± 1 standard error). Sites with no error bars did not have enough
material for more than one sample. Most aquatic samples contained more than one individual. FPOM
is benthic FPOM. Closed circles represent basal resources, open circles represent aquatic
invertebrates, and closed triangles represent non-aquatic organisms.
Cave food-web
Further within the cave (site -256 m) the majority of aquatic invertebrate consumers remained
primarily dependent on seston and benthic FPOM, except for Potamopyrgus, which appeared
to primarily feed on epilithon (Figure 4.4). Terrestrial spiders and Opiliones appeared to rely
primarily upon aquatic prey, but may have preyed on glow-worms. Surprisingly, glow-worms
had a lower δ15
N value than most aquatic prey (except stoneflies), suggesting that they may
have switched to an unmeasured source, possibly a small dipteran (e.g. chironomid adults).
Chapter 4. Comparing energy pathways between cave and surface environments using stable isotopes
87
del13
C (ppt)
-40 -35 -30 -25 -20
del1
5 N
(ppt)
0
2
4
6
8
10
Potamopyrgus
FPOM
Seston
CPOM
Epilithon
Aoteapsyche
Stonefly
Combined Del. & Neo.
Stiphidiidae
Opiliones
Glow-worm
Tetragnathid
Hydrobiosis
Figure 4.4. Biplot of mean δ13
C and δ15
N values between different components of the food-web at the
cave site (-256 m) (Error bars are ± 1 standard error). Sites with no error bars did not have enough
material for more than one sample. Most aquatic samples contained more than one individual. FPOM
is benthic FPOM. Closed circles represent basal resources, open circles represent aquatic
invertebrates, and closed triangles represent non-aquatic organisms.
Discussion
There was minimal change in invertebrate δ13
C values between the surface stream
community and inside the cave, suggesting that this cave aquatic community was dependent
on surface imported material. The overall carbon signature of the cave community was
similar to that produced by photosynthetic fixation of atmospheric carbon by C3 plants; a
mean δ13
C value of approximately -28‰ (Winterbourn 2000, Fry 2006). Seston, benthic
FPOM, and epilithon appeared to be the most important basal resources supporting the cave
invertebrate community. Seston and benthic FPOM had similar δ13
C and δ15
N values within
and across sites, presumably because benthic FPOM was predominantly composed of surface

Chapter 4. Comparing energy pathways between cave and surface environments using stable isotopes
88
derived seston. Epilithon did not appear to be incorporated into the food-web outside the
cave, probably because of an abundance of filamentous algae. The isotopic signal of epilithon
changed between cave and surface sites, presumably because of a lack of photosynthetic
producers within caves. However, within the cave epilithon became an important primary
resource, congruent with the scarcity of autotrophs.
The changing importance of epilithon, as a basal resource, was reflected in the gastropod,
Potamopyrgus, which appeared to shift from grazing filamentous algae, on the surface, to
grazing epilithon, within the cave (Rounick et al. 1982, Hicks 1997). Potamopyrgus within
the cave showed unusually elevated δ15
N values, although these were still within the bounds
of one trophic level (~3.4‰) of epilithon. These unusually high values are potentially
explained by a high efficiency of food to tissue conversion (Ricciardi and Whoriskey 2004).
Also, Potamopyrgus excreta is known to contain high ammonium levels, and in systems
where they are the dominant consumer of basal resources (average density of 6724 m2 and
1198 m2 outside and inside the cave, respectively, in this study) their excretion accounted for
the majority of ammonium present (Hall et al. 2003). Thus, a high biofilm δ15
N signature
relative to other basal resources was observed, as well as an increased δ15
N signature for
Potamopyrgus. Potamopyrgus were also potentially consuming conspecific faecal pellets,
resulting in a net δ15
N enrichment of the Potamopyrgus population (Kilham et al. 2009).
CPOM did not appear to be directly incorporated into the food-web at any of the sites, except
possibly -256 m. However, CPOM may play an important role in the formation of FPOM or
as substrate for the growth of epilithon.
My results suggested that some aquatic taxa (e.g. Acanthophlebia) varied their primary food
source between sites within the cave, potentially because of the relative abundance of
resources. Terrestrial taxa also displayed a longitudinal shift in prey taxa. Surface dwelling
spiders appeared to incorporate both mayflies and caddisflies, while inside the cave some
spiders primarily preyed on mayflies, while others primarily preyed on δ 15
N enriched
Aoteapsyche. This may have been a response to prey availability.
Hydrobiosid larvae found within the cave were predominantly late instars, and consequently
expected to have a higher δ15
N value, because they are recognised as predatory invertebrates
(Winterbourn 2000). However, I observed a lower δ15
N value, relative to their hypothesised
prey, which was possibly indicative of these hydrobiosids directly incorporating basal
resources into their diet (Winterbourn 2000). This trophic omnivory, which has been seen in

Chapter 4. Comparing energy pathways between cave and surface environments using stable isotopes
89
other studies (Hicks 1997), may potentially occur because of a decrease in prey abundance.
Crayfish are known to be omnivores and I observed a high δ15
N value in crayfish, suggesting
that in this cave they predate/scavenge macroinvertebrates as well as basal resources (Hicks
1997, Stenroth et al. 2006). Eels were also observed at all sites in this study and seen to
predate crayfish and are known crayfish predators (Shave et al. 1994).
Spiders and Glow-worms within the cave appeared to feed upon aquatic invertebrates
(Pugsley 1984, Malmqvist 2002, Burdon and Harding 2008). Therefore, imported surface
energy subsidises the cave aquatic community, which in turn fuels the cave terrestrial
invertebrate communities. It is highly probable that the terrestrial cave community has higher
diversity and is extended further into caves via energy derived from cave streams. There was
also evidence suggesting predation, as well as cannibalism, occurred between troglophiles, as
noted by Pugsley (1984). However, the magnitude and effect of this are not known, and need
to be further investigated for a greater understanding to be achieved.
In conclusion, both aquatic and terrestrial cave communities were supported by surface
derived organic materials. Seston, benthic FPOM, and epilithon appeared to be the most
important basal resources inside the cave, compared to seston, benthic FPOM, and
filamentous algae outside the cave. Outside of the cave the, presumably, autotrophic epilithon
was not incorporated into the food web, but within the cave the non-autotrophic epilithon (i.e.
bacteria and fungi) became important. As found in a previous study by Simon et al. (2003)
CPOM did not appear to be directly incorporated into the food-web. Secondly, imported
aquatic energy was ultimately found to support terrestrial predators within the cave, such as
glow-worms and spiders, presumably via predation of aquatic winged adults. Finally, aquatic
and non-aquatic cave communities, including the iconic glow-worm populations, dependence
upon surface processes intricately links their health to that of the surface system, tightly
linking them to land-use changes.

Chapter 4. Comparing energy pathways between cave and surface environments using stable isotopes
90
References:
Allen, K. R. 1951. The Horokiwi stream: a study of a trout population. New Zealand Marine
Department Fisheries Bulletin 10:1-238.
Baxter, C. V., K. D. Fausch, and W. C. Saunders. 2005. Tangled webs: reciprocal flows of
invertebrate prey link streams and riparian zones. Freshwater Biology 50:201-220.
Berg, M. B., and R. A. Hellenthal. 1992. The role of Chironomidae in energy flow of a lotic
ecosystem. Netherlands Journal of Aquatic Ecology 26:471-476.
Bosley, K. L., and S. C. Wainright. 1999. Effects of preservatives and acidification on the
stable isotope ratios (15
N:14
N, 13
C:12
C) of two species of marine animals. Canadian
Journal of Fisheries and Aquatic Sciences 56:2181-2185.
Broadley, R. A., and I. A. N. Stringer. 2001. Prey attraction by larvae of the New Zealand
glowworm, Arachnocampa luminosa (Diptera: Mycetophilidae). Invertebrate Biology
120:170-177.
Burdon, F. J., and J. S. Harding. 2008. The linkage between riparian predators and aquatic
insects across a stream-resource spectrum. Freshwater Biology 53:330-346.
Collier, K. J., and J. M. Quinn. 2003. Land-use influences macroinvertebrate community
response following a pulse disturbance. Freshwater Biology 48:1462-1481.
Collier, K. J., A. E. Wright-Stow, and B. J. Smith. 2004. Trophic basis of production for a
mayfly in a North Island, New Zealand, forest stream: contributions of benthic versus
hyporheic habitats and implications for restoration. New Zealand Journal of Marine
and Freshwater Research 38:301-314.
Culver, D. C. 1982. Cave life: evolution and ecology. Harvard University Press, Cambridge,
Massachusettes, USA.
Culver, D. C. 1985. Trophic relationships in aquatic cave environments. Stygologia 1:43-53.
Cummins, K. W. 1974. Structure and function of stream ecosystems. BioScience 24:631-641.
Death, R. G. 1989. The effect of a cave on benthic invertebrate communities in a South Island
stream. New Zealand Natural Sciences 16:67-78.
Death, R. G., B. Baillie, and P. Fransen. 2003. Effect of Pinus radiata logging on stream
invertebrate communities in Hawke's Bay, New Zealand. New Zealand Journal of
Marine and Freshwater Research 37:507-520.
Engel, A. S. 2007. Observations on the biodiversity of sulfidic karst habitats. Journal of Cave
and Karst Studies 69:187-206.

Chapter 4. Comparing energy pathways between cave and surface environments using stable isotopes
91
Engel, A. S., D. B. Meisinger, M. L. Porter, R. A. Payn, M. Schmid, L. A. Stern, K. H.
Schleifer, and N. M. Lee. in press. Linking phylogenetic and functional diversity to
nutrient spiralling in microbial mats from Lower Kane Cave (USA). ISME Journal
4:98-110.
England, L. E., and A. D. Rosemond. 2004. Small reductions in forest cover weaken
terrestrial-aquatic linkages in headwater streams. Freshwater Biology 49:721-734.
France, R. L. 1995. Macroinvertebrate standing crop in littoral regions of allochthonous
detritus accumulation: implications for forest management. Biological Conservation
71:35-39.
Fry, B. 2006. Stable isotope ecology. Springer Books: New York, U.S.A.
Graening, G. O. 2005. Trophic structure of Ozark cave streams containing endangered
species. Oceanological and Hydrobiological Studies 34:3-17.
Graening, G. O., and A. V. Brown. 2003. Ecosystem dynamics and pollution effects in an
Ozark cave stream. Journal of the American Water Resources Association 39:1497-
1507.
Hall, J., R. O., J. L. Tank, and M. F. Dybdahl. 2003. Exotic snails dominate nitrogen and
carbon cycling in a highly productive stream. Frontiers in Ecology and the
Environment 1:407-411.
Hall, J., R. O., J. B. Wallace, and S. L. Eggert. 2000. Organic matter flow in stream food
webs with reduced detrital resource base. Ecology 81:3445-3463.
Hicks, B. J. 1997. Food webs in forest and pasture streams in the Waikato region, New
Zealand: a study based on analyses of stable isotopes of carbon and nitrogen, and fish
gut contents. New Zealand Journal of Marine and Freshwater Research 31:651-664.
Huryn, A. D. 1996. An appraisal of the Allen paradox in a New Zealand trout stream.
Limnology and Oceanography 41:243-252.
Kilham, S. S., M. Hunte-Brown, P. Verberg, C. M. Pringle, M. R. Whiles, K. R. Lips, and E.
Zandona. 2009. Challenges for interpreting stable isotope fractionation of carbon and
nitrogen in tropical aquatic ecosystems. Verhandlungen des Internationalen Verein
Limnologie 30:749–753.
Kolasinski, J., K. Rogers, and P. Frouin. 2008. Effects of acidification on carbon and nitrogen
stable isotopes of benthic macrofauna from a tropical coral reef. Rapid
Communications in Mass Spectrometry 22:2955-2960.

Chapter 4. Comparing energy pathways between cave and surface environments using stable isotopes
92
Malmqvist, B. 2002. Aquatic invertebrates in riverine landscapes. Freshwater Biology
47:679-694.
Matsuoka, J., A. Kano, T. Oba, T. Watanabe, S. Sakai, and K. Seto. 2001. Seasonal variation
of stable isotopic compositions recorded in a laminated tufa, SW Japan. Earth and
Planetary Science Letters 192:31-44.
McCutchan, J., J. H., and J. Lewis, W. M. 2002. Relative importance of carbon sources for
macroinvertebrates in a Rocky Mountain stream. Limnology and Oceanography
47:742-752.
McHugh, P., A. McIntosh, and P. Jellyman. 2010. Dual influences of ecosystem size and
disturbance on food chain length in streams. Ecology Letters 13:881-890.
Nakano, S., and M. Murakami. 2001. Reciprocal subsidies: dynamic interdependence
between terrestrial and aquatic food webs. Proceedings of the National Academy of
Sciences of the United States of America 98:166-170.
Nowlin, W. H., M. J. Vanni, and L. H. Yang. 2008. Comparing resource pulses in aquatic and
terrestrial ecosystems. Ecology 89:647-659.
Paquin, P., C. Vink, and N. Duperre. 2010. Spiders of New Zealand: annotated family key
and species list. Manaaki Whenua Press, Lincoln, New Zealand, i-vii+1-118.
Penczak, T., M. Grzybkowska, and W. Galicka. 1996. Fish-benthos production relationships
in an alluvial river: Allen Paradox. Polskie Archiwum Hydrobiologii 43:257-271.
Peterson, B. J., and B. Fry. 1987. Stable isotopes in ecosystem studies. Annual Review of
Ecology and Systematics 18:293-320.
Pohlman, J. W., T. M. Iliffe, and L. A. Cifuentes. 1997. A stable isotope study of organic
cycling and the ecology of an Anchialine cave ecosystem. Marine Ecology Progress
Series 155:17-27.
Polis, G. A., W. B. Anderson, and R. D. Holt. 1997. Toward an integration of landscape and
food web ecology: the dynamics of spatially subsidized food webs. Annual Review of
Ecology and Systematics 28:289-316.
Porter, M. L., A. S. Engel, T. C. Kane, and B. K. Kinkle. 2009. Productivity-diversity
relationships from chemolithoautotrophically based sulfidic Karst systems.
International Journal of Speleology 38:27-40.
Post, D. M. 2002. Using stable isotopes to estimate trophic position: models, methods, and
assumptions. Ecology 83:703-718.

Chapter 4. Comparing energy pathways between cave and surface environments using stable isotopes
93
Post, D. M., C. A. Layman, D. A. Arrington, G. Takimoto, J. Quattrochi, and C. G. Montana.
2007. Getting to the fat of the matter: models, methods and assumptions for dealing
with lipids in stable isotope analyses. Oecologia 152:179-189.
Power, M. E. 2001. Prey exchange between a stream and its forested watershed elevates
predator densities in both habitats. Proceedings of the National Academy of Sciences
of the United States of America 98:14-15.
Pugsley, C. 1984. Ecology of the New Zealand glowworm, Arachnocampa luminosa
(Diptera: Keroplatidae), in the Glowworm Cave, Waitomo. Journal of the Royal
Society of New Zealand 14:387- 407.
Quinn, J. M. 2000. Effects of pastoral development. In: Collier.K.J. and Winterbourn,M.J.
eds. New Zealand stream invertebrates: ecology and implications for management.
New Zealand Liminological Society, Christchurch:208-229.
Quinn, J. M., and A. B. Cooper. 1997. Land-water interactions at Whatawhata, New Zealand:
introduction and synthesis. New Zealand Journal of Marine and Freshwater Research
31:569-577.
Quinn, J. M., and M. J. Stroud. 2002. Water quality and sediment and nutrient export from
New Zealand hill-land catchments of contrasting land use. New Zealand Journal of
Marine and Freshwater Research 36:409-429.
Ricciardi, A., and F. G. Whoriskey. 2004. Exotic species replacement: shifting dominance of
dreissenid mussels in the Soulanges Canal, upper St. Lawrence River, Canada.
Journal of the North American Benthological Society 23:507-514.
Rounick, J. S., M. J. Winterbourn, and G. L. Lyon. 1982. Differential utilisation of
allochthonous and autochthonous inputs by aquatic invertebrates in some New
Zealand streams: a stable carbon isotope study. Oikos 39:191-198.
Sarbu, S. M., T. C. Kane, and B. K. Kinkle. 1996. A chemoautotrophically based cave
ecosystem. Science 272:1953-1954.
Scarsbrook, M. R., J. M. Quinn, J. Halliday, and R. Morse. 2001. Factors controlling litter
input dynamics in streams draining pasture, pine, and native forest catchments. New
Zealand Journal of Marine and Freshwater Research 35:751 - 762.
Schneider, K., A. D. Kay, and W. F. Fagan. 2010. Adaptation to a limiting environment: the
phosphorus content of terrestrial cave arthropods. Ecological Research 25:565-577.
Sergeeva, T. K. 1999. Opiliones guild: structure and trophic relations. Zoologicheskii Zhurnal
78:1177-1178.
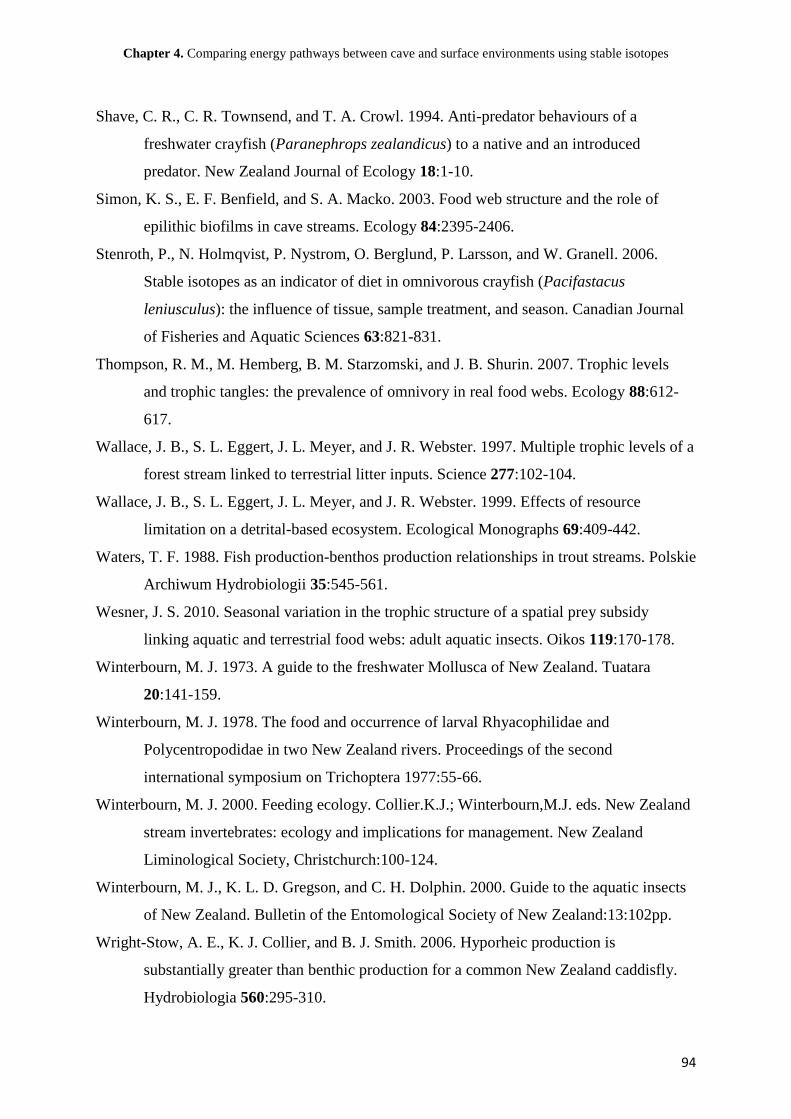
Chapter 4. Comparing energy pathways between cave and surface environments using stable isotopes
94
Shave, C. R., C. R. Townsend, and T. A. Crowl. 1994. Anti-predator behaviours of a
freshwater crayfish (Paranephrops zealandicus) to a native and an introduced
predator. New Zealand Journal of Ecology 18:1-10.
Simon, K. S., E. F. Benfield, and S. A. Macko. 2003. Food web structure and the role of
epilithic biofilms in cave streams. Ecology 84:2395-2406.
Stenroth, P., N. Holmqvist, P. Nystrom, O. Berglund, P. Larsson, and W. Granell. 2006.
Stable isotopes as an indicator of diet in omnivorous crayfish (Pacifastacus
leniusculus): the influence of tissue, sample treatment, and season. Canadian Journal
of Fisheries and Aquatic Sciences 63:821-831.
Thompson, R. M., M. Hemberg, B. M. Starzomski, and J. B. Shurin. 2007. Trophic levels
and trophic tangles: the prevalence of omnivory in real food webs. Ecology 88:612-
617.
Wallace, J. B., S. L. Eggert, J. L. Meyer, and J. R. Webster. 1997. Multiple trophic levels of a
forest stream linked to terrestrial litter inputs. Science 277:102-104.
Wallace, J. B., S. L. Eggert, J. L. Meyer, and J. R. Webster. 1999. Effects of resource
limitation on a detrital-based ecosystem. Ecological Monographs 69:409-442.
Waters, T. F. 1988. Fish production-benthos production relationships in trout streams. Polskie
Archiwum Hydrobiologii 35:545-561.
Wesner, J. S. 2010. Seasonal variation in the trophic structure of a spatial prey subsidy
linking aquatic and terrestrial food webs: adult aquatic insects. Oikos 119:170-178.
Winterbourn, M. J. 1973. A guide to the freshwater Mollusca of New Zealand. Tuatara
20:141-159.
Winterbourn, M. J. 1978. The food and occurrence of larval Rhyacophilidae and
Polycentropodidae in two New Zealand rivers. Proceedings of the second
international symposium on Trichoptera 1977:55-66.
Winterbourn, M. J. 2000. Feeding ecology. Collier.K.J.; Winterbourn,M.J. eds. New Zealand
stream invertebrates: ecology and implications for management. New Zealand
Liminological Society, Christchurch:100-124.
Winterbourn, M. J., K. L. D. Gregson, and C. H. Dolphin. 2000. Guide to the aquatic insects
of New Zealand. Bulletin of the Entomological Society of New Zealand:13:102pp.
Wright-Stow, A. E., K. J. Collier, and B. J. Smith. 2006. Hyporheic production is
substantially greater than benthic production for a common New Zealand caddisfly.
Hydrobiologia 560:295-310.

Chapter 4. Comparing energy pathways between cave and surface environments using stable isotopes
95
Young, R. G., and A. D. Huryn. 1999. Effects of land use on stream metabolism and organic
matter turnover. Ecological Applications 9:1359-1376.
96
Exiting Murchies cave
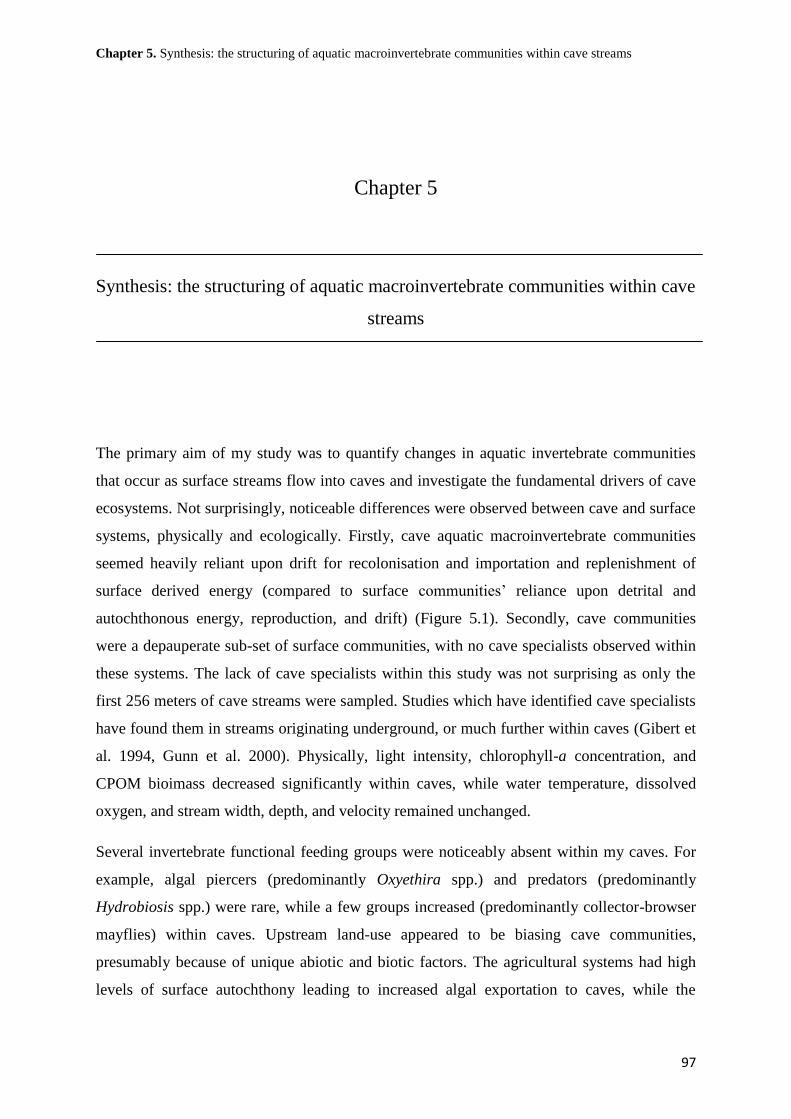
Chapter 5. Synthesis: the structuring of aquatic macroinvertebrate communities within cave streams
97
Chapter 5
Synthesis: the structuring of aquatic macroinvertebrate communities within cave
streams
The primary aim of my study was to quantify changes in aquatic invertebrate communities
that occur as surface streams flow into caves and investigate the fundamental drivers of cave
ecosystems. Not surprisingly, noticeable differences were observed between cave and surface
systems, physically and ecologically. Firstly, cave aquatic macroinvertebrate communities
seemed heavily reliant upon drift for recolonisation and importation and replenishment of
surface derived energy (compared to surface communities’ reliance upon detrital and
autochthonous energy, reproduction, and drift) (Figure 5.1). Secondly, cave communities
were a depauperate sub-set of surface communities, with no cave specialists observed within
these systems. The lack of cave specialists within this study was not surprising as only the
first 256 meters of cave streams were sampled. Studies which have identified cave specialists
have found them in streams originating underground, or much further within caves (Gibert et
al. 1994, Gunn et al. 2000). Physically, light intensity, chlorophyll-a concentration, and
CPOM bioimass decreased significantly within caves, while water temperature, dissolved
oxygen, and stream width, depth, and velocity remained unchanged.
Several invertebrate functional feeding groups were noticeably absent within my caves. For
example, algal piercers (predominantly Oxyethira spp.) and predators (predominantly
Hydrobiosis spp.) were rare, while a few groups increased (predominantly collector-browser
mayflies) within caves. Upstream land-use appeared to be biasing cave communities,
presumably because of unique abiotic and biotic factors. The agricultural systems had high
levels of surface autochthony leading to increased algal exportation to caves, while the
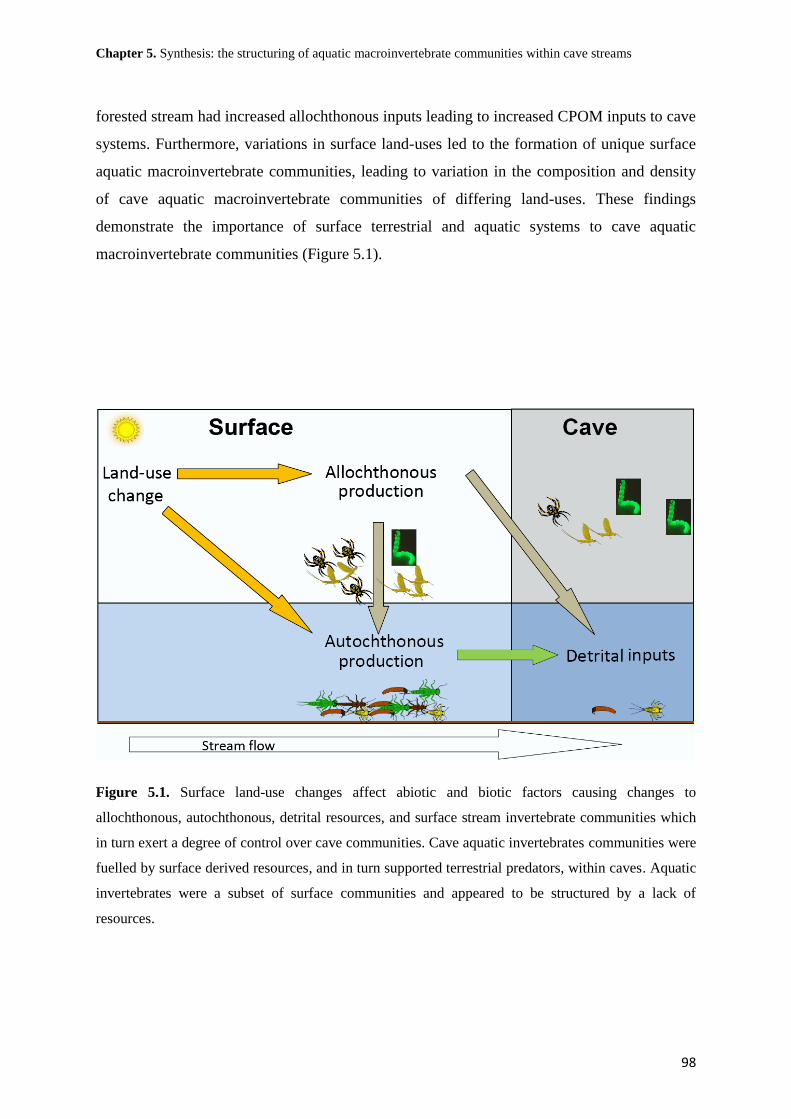
Chapter 5. Synthesis: the structuring of aquatic macroinvertebrate communities within cave streams
98
forested stream had increased allochthonous inputs leading to increased CPOM inputs to cave
systems. Furthermore, variations in surface land-uses led to the formation of unique surface
aquatic macroinvertebrate communities, leading to variation in the composition and density
of cave aquatic macroinvertebrate communities of differing land-uses. These findings
demonstrate the importance of surface terrestrial and aquatic systems to cave aquatic
macroinvertebrate communities (Figure 5.1).
Figure 5.1. Surface land-use changes affect abiotic and biotic factors causing changes to
allochthonous, autochthonous, detrital resources, and surface stream invertebrate communities which
in turn exert a degree of control over cave communities. Cave aquatic invertebrates communities were
fuelled by surface derived resources, and in turn supported terrestrial predators, within caves. Aquatic
invertebrates were a subset of surface communities and appeared to be structured by a lack of
resources.

Chapter 5. Synthesis: the structuring of aquatic macroinvertebrate communities within cave streams
99
Resource availability structures communities
As expected benthic taxa diversity and density decreased within the caves relative to surface
sites. Presumably this was because of increasing environmental harshness, primarily the loss
of solar energy, leaving cave communities dependent upon imported surface derived
resources.
The majority of taxa densities within cave communities appeared to be explained by the
density of surface communities and drift rates. However, a few taxa were present upstream of
the caves but absent from within the caves, suggesting that an organism’s physical and
behavioural adaptations, as well as resource/environmental gradients were important for
within cave survival. Surprisingly, mayfly and Austrosimulium densities increased within
caves. Presumably this was because of the relative increase in resource availability, or a
decrease in predators. Several taxa were noticeably absent, or very rare within caves,
including the algal piercer Oxyethira, presumably because of a lack of filamentous algae on
which it feeds (Quinn and Hickey 1990). Elmidae also appeared to find the cave
environment unsuitable, and had low benthic density but increased drift density relative to
surface sites. Chironomids too were rarely present within the caves. Most of those outside the
cave were tube-dwelling species and unlikely to drift, and it appears that few adults were
attracted into the caves to lay eggs. Predatory invertebrates (primarily Hydrobiosis spp.) were
presumably not found within the caves because of the decrease in total prey density, or
increasingly harsh abiotic conditions (e.g. a preponderance of bedrock lacking refuges for
predators) making predation difficult (Peckarsky 1983). Death (1989) obtained similar
results, except that mayflies were less abundant in the cave he studied.
Macroinvertebrate drift densities remained constant across the ecotone (environmental
gradient), by virtue of increased drift propensity (drift density / benthic density) (Figure 5.2a).
Presumably individuals within caves increased their drift in response to resource limitations
(Death 1988) (Figure 5.2b). Furthermore, reproduction within cave aquatic communities has
not been recorded, leaving subterranean aquatic communities reliant on surface derived
individuals for recruitment (Figure 5.2b). Drift outside caves may be due to a range of factors
(stochastic or otherwise), including possible responses to increased competition or predation,
in accordance with Peckarsky’s (1983) harsh benign model (Figure 1.1), or perhaps a relative
lack of resources (Figure 5.2). Harsh environmental conditions within caves, presumably

Chapter 5. Synthesis: the structuring of aquatic macroinvertebrate communities within cave streams
100
lead to cave macroinvertebrate communities having a higher turnover rate than surface
communities, i.e. an individual was likely to stay on the benthos for a shorter time within a
cave because of limited resources, whereas outside of the cave an individual may settle
sooner and remain longer (Death 1988) (Figure 5.2b).
Environmental gradients provide useful contexts for addressing key questions in ecological
theory (Agrawal et al. 2007). They provide the opportunity for natural experiments where
the strength of biotic interactions and other components of community assembly can be
investigated along abiotic gradients. Within my study system caves were assumed to be
harsh environments, relative to the surface community, primarily because of the lack of light;
leading to a lack of photosynthetic production and lower temperatures, resulting in
dependence upon imported surface derived resources. This in-turn suggests, in accordance
with Peckarsky (1983) and Grieg (2008, unpublished data), that abiotic interactions will
structure cave communities, leading to noticeably different densities of predators, as was seen
in my study.
The increase in mayfly density within caves combined with their increased drift rates
suggested that drift, as opposed to early emergence, was their preferred method of leaving an
unsatisfactory environment. Within an unsuitable habitat some orders, such as mayflies, can
speed up development, to a winged adult, thus leaving an unsuitable environment, while other
orders, such as caddis, cannot (Dahl and Peckarsky 2003). Within other harsh systems lower
densities of predators have been observed, indicating sub-optimal habitat and foraging
conditions, or a lack of colonisation ability (Grieg 2008). Evidence from my thesis suggests
the harsh-benign theory is relevant between surface and cave systems, which appear prima
facie to be structured by abitoic factors, primarily resource limitation.
Source-sink dynamics
Source-sink interactions occur when individuals from highly productive source habitats move
into less productive sink habitats, where mortality is greater than reproduction (Pulliam 1988,
Pulliam and Danielson 1991, Leibold et al. 2004, Holyoak et al. 2005). Source-sink
dynamics in caves appear driven by drift, active or passive, and were almost certainly
occurring, as cave communities were a sub-set of surface communities. It was unknown
whether reproduction occurred within caves; however, a lack of reproduction within caves
would lead to further depletion of cave communities (Figure 5.2).

Chapter 5. Synthesis: the structuring of aquatic macroinvertebrate communities within cave streams
101
Figure 5.2. Conceptual diagrams (A and B) showing the processes involved in invertebrate
community structure across cave stream gradients; resources, drift, and reproduction. Diagram A
represents observed results. Diagram B shows the hypothetical increase in drift distances within
caves. Drift distances potentially increased within caves because of a lack of available resources. The
mayfly within the diagram represents aquatic macroinvertebrates, while the grey region represents the
cave.
Cave stream aquatic community food-webs were compiled from stable isotope and benthic
density data, literature, and field observations (Figure 5.3). Isotopic analyses suggested the
main difference between surface and cave communities was a switch from dependence on
filamentous algae to epilithon (i.e. bacterial, fungal, and diatom communities). Increased
consumption of epilithon growing upon organic matter within caves may have lead to
increased relative availability of FPOM as frass.
My study showed the cave entrance community to be structured differently from the surface
or cave sites. Within the isotope and benthic survey the entrance had lower aquatic
invertebrate taxa richness and density. Predatory invertebrates were absent from the food-web
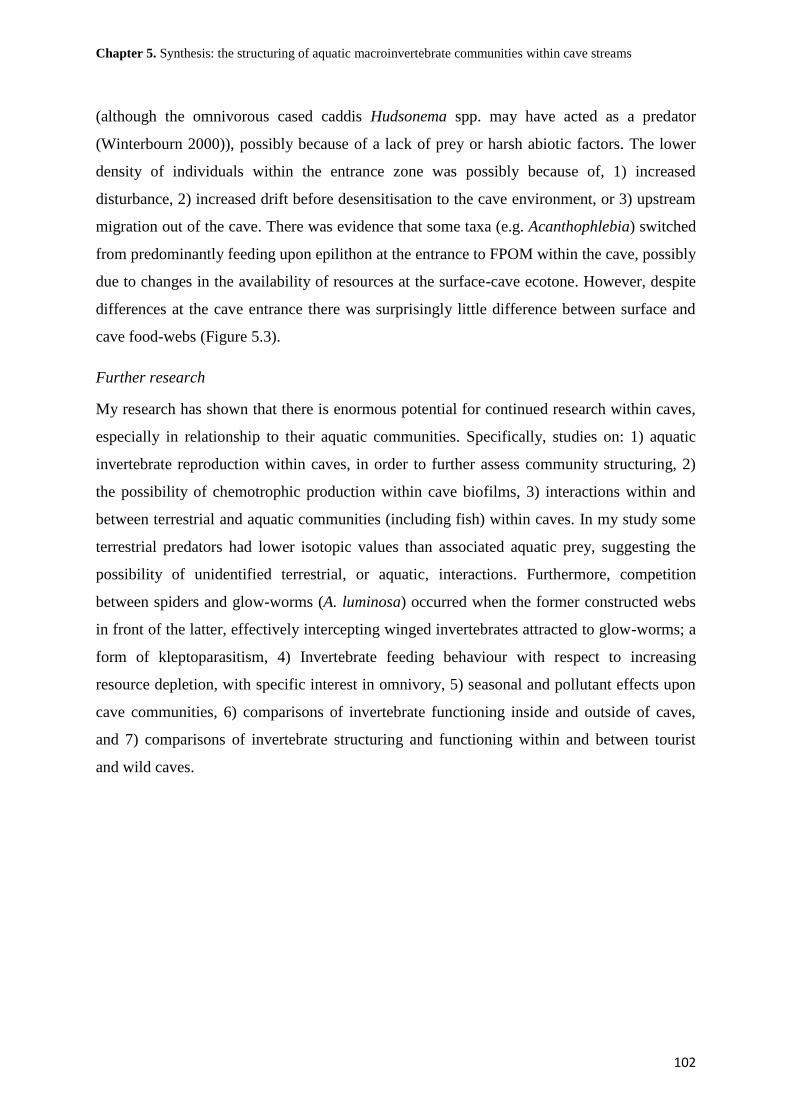
Chapter 5. Synthesis: the structuring of aquatic macroinvertebrate communities within cave streams
102
(although the omnivorous cased caddis Hudsonema spp. may have acted as a predator
(Winterbourn 2000)), possibly because of a lack of prey or harsh abiotic factors. The lower
density of individuals within the entrance zone was possibly because of, 1) increased
disturbance, 2) increased drift before desensitisation to the cave environment, or 3) upstream
migration out of the cave. There was evidence that some taxa (e.g. Acanthophlebia) switched
from predominantly feeding upon epilithon at the entrance to FPOM within the cave, possibly
due to changes in the availability of resources at the surface-cave ecotone. However, despite
differences at the cave entrance there was surprisingly little difference between surface and
cave food-webs (Figure 5.3).
Further research
My research has shown that there is enormous potential for continued research within caves,
especially in relationship to their aquatic communities. Specifically, studies on: 1) aquatic
invertebrate reproduction within caves, in order to further assess community structuring, 2)
the possibility of chemotrophic production within cave biofilms, 3) interactions within and
between terrestrial and aquatic communities (including fish) within caves. In my study some
terrestrial predators had lower isotopic values than associated aquatic prey, suggesting the
possibility of unidentified terrestrial, or aquatic, interactions. Furthermore, competition
between spiders and glow-worms (A. luminosa) occurred when the former constructed webs
in front of the latter, effectively intercepting winged invertebrates attracted to glow-worms; a
form of kleptoparasitism, 4) Invertebrate feeding behaviour with respect to increasing
resource depletion, with specific interest in omnivory, 5) seasonal and pollutant effects upon
cave communities, 6) comparisons of invertebrate functioning inside and outside of caves,
and 7) comparisons of invertebrate structuring and functioning within and between tourist
and wild caves.
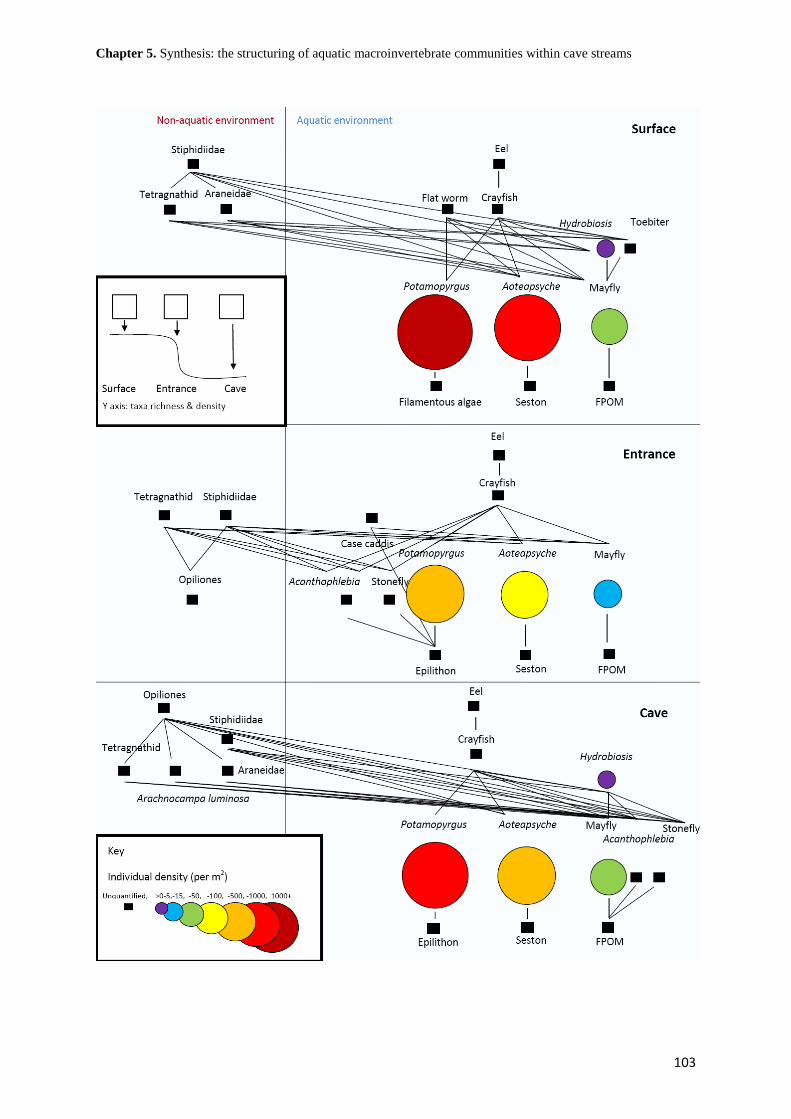
Chapter 5. Synthesis: the structuring of aquatic macroinvertebrate communities within cave streams
103
Chapter 5. Synthesis: the structuring of aquatic macroinvertebrate communities within cave streams
104
Figure 5.3. Aquatic community food-webs constructed from stable isotope and benthic density data,
literature, and field observations. Food-webs were compiled for the surface, entrance, and cave zone.
The cave food-web was a combination of sites -32 m and -256 m from the isotope survey. While the
entrance and surface food-webs were sites 0 m and +24 m respectively, from the isotope survey.
Benthic densities for the surface web were an average of sites +32 m and +8 m; while the entrance
web was from site 0 m, and the cave web was an average of sites -32 m, -128 m, and -256 m.
Densities were only measured for aquatic macroinvertebrates and subsequently all other groups are
labelled as unquantified. Macroinvertebrates labelled as unquantified were recorded in the isotope
survey but not within the 2009 survey. FPOM was benthic derived FPOM. Mayflies were
predominantly Deleatidium and Neozephlebia spp., stoneflies were predominantly Zelandoperla spp.,
and cased caddis were predominantly Hudsonema spp.
Management implications of my research
Light displays by the New Zealand Glow-worm, Arachnocampa luminosa (Diptera:
Keroplatidae), within caves have led to an array of tourism operations. There is little
understanding as to the effect these operations have on aquatic benthic invertebrate
communities. However, the continued supply of winged aquatic insects, an important food
resource, is necessary for the maintenance of healthy glow-worm populations (Pugsley 1984).
To conserve and manage cave invertebrate communities, particularly with response to
tourism development, a better understanding of the ecology of aquatic communities fuelling
glow-worm populations is needed.
Traditionally, interactions between the environment and socio-economic behaviours of
humans are outside the pure view of population and community ecology and rarely
considered (Sagarin 2007). However, socio-economic behaviours of humans often lead to the
strongest relative forces structuring ecological systems and must be considered in the
functioning of ecosystems (Darwin et al. 1996, Sagarin 2007), i.e. active management
processes.
We are now living in a world economy the destiny of which we all share. Prosperity and
economic growth are occurring on a scale never conceived by earlier generations,
unfortunately, so are threats to ecological systems (Andersson and Eriksson 2010).
Awareness of the clash between economic and ecological systems is becoming increasingly
recognised, locally as well as globally, leading to pressures on companies and governments to
Chapter 5. Synthesis: the structuring of aquatic macroinvertebrate communities within cave streams
105
limit resource exploitation (Darwin et al. 1996, Scoones 1999, Robert et al. 2002, Ayres
2004, Andersson and Eriksson 2010). Factors affecting ecosystems include, but are not
limited to, land-use alterations, climate change, species invasions, and overexploitation of
resources (Vitousek et al. 1997, Foley et al. 2005, MEA 2005), especially in aquatic
ecosystems (Konikow 2002, Angeler 2007, Smol and Douglas 2007). These factors singly, or
combined, are impacting individuals and the functioning of populations, communities,
ecosystems, and the biosphere (Vitousek et al. 1997).
As previously mentioned, it would appear that aquatic invertebrates within cave streams are
primarily resource limited, and what resources are available are generally surface derived.
Therefore, the continued management of cave aquatic populations has to begin above the
cave entrance (Graening 2005, Wood et al. 2008). This equates firstly to effective surface
land-use management, e.g. riparian, waste, water abduction, sedimentation, and visitor
management (to name a few), and secondly to the management of these factors within caves
(Table 5.1) (Gunn et al. 2000, Sala et al. 2000). As a short term management strategy it
would be possible to add food resources to cave streams to boost aquatic juveniles and
therefore aquatic adults, which are glow-worm prey. But a heavy reliance upon surface
communities for colonists would render this as an inappropriate long term solution, if the
surface system was being degraded. Management needs to look beyond short term (Robert et
al. 2002), and it is unknown what result the addition of a food resource to a cave community
would produce long term. It is possible, as the results indicate, that an increase in aquatic
invertebrates, and therefore glow-worm prey, would be observed, potentially leading to an
increase in glow-worm abundance. However, this deserves greater study before significant
levels of resources are added to cave streams.
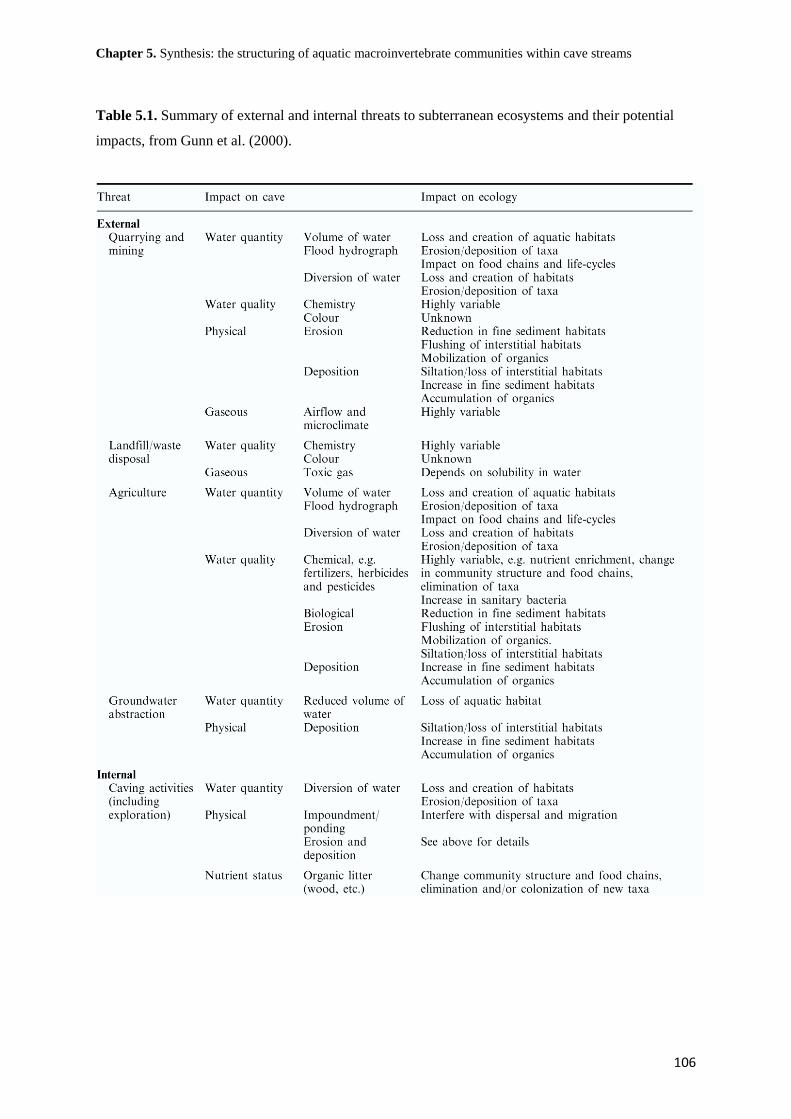
Chapter 5. Synthesis: the structuring of aquatic macroinvertebrate communities within cave streams
106
Table 5.1. Summary of external and internal threats to subterranean ecosystems and their potential
impacts, from Gunn et al. (2000).

Chapter 5. Synthesis: the structuring of aquatic macroinvertebrate communities within cave streams
107
With such large effects and unprecedented levels of change predicted (e.g. Sala et al. 2000),
managers must look further and more carefully into the future, in an effort to preserve
ecosystems for generations to come (Christensen et al. 1996, Vitousek et al. 1997, Sala et al.
2000, Andersson and Eriksson 2010). Cave environments are some of the oldest, unchanged,
and most beautiful systems on earth; however, they are often ignored because they are rarely
seen and difficult to work in. This ignorance or “out of sight out of mind attitude” is no
longer acceptable (Wood et al. 2002).
Deforestation and the increase of intensive farming in New Zealand (in 2002, 71% of New
Zealand’s original forest, or ~14,000,000 ha, had been lost (Ewers et al. 2006)), has lead to
increased pollution and runoff causing significant changes to surface aquatic communities
(Harding et al. 1999, Quinn 2000, Muller et al. 2006, Ramesh et al. 2009, White et al. 2010).
So far overseas aquatic cave communities have varied in response to pollution events from
complete degradation (Shi et al. 2009) to relative resistantance (Gunn et al. 2000, Wood et al.
2008), and in a few cases may even have benefitted (Wood et al. 2008). There are no
published studies on the effect of surface pollution to New Zealand aquatic cave
communities. However, if pollution to cave streams continues a tipping point may be
reached. Beyond this point cave aquatic communities may be unrecognisable, resulting in the
potential loss or decrease in cave terrestrial populations, including glow-worms. Restoration
of these systems is likely to be costly, time consuming, dangerous, and would only return
them to an alternative stable state, as complete restoration would be near impossible.
Therefore a sustainable prevention method is better than a complete restoration process.
However, if a cave system is already degraded the surface aquatic system must be restored
(potentially by the restoration of the surface terrestrial system), as this system supplies the
energy and aquatic colonists present within cave aquatic communities.
Caves (unlike forests and grasslands) form on a geological time scale, and any degradation of
their physical environment is unlikely to be repaired within our lifetime. Therefore, before
decisions are made they need to be carefully and thoroughly investigated. Finally, cavers are
constantly pushing boundaries and exploring areas of caves never before seen by humans
(Gunn et al. 2000), and as such there is little known of their associated biotic communities. It
is important that science doesn’t wait until these pristine systems have been degraded before
it begins to assess life in these beautiful but harsh environments.
Chapter 5. Synthesis: the structuring of aquatic macroinvertebrate communities within cave streams
108
References:
Agrawal, A. A., D. D. Ackerly, F. Adler, A. E. Arnold, C. Ceres, D. F. Doak, E. Post, P. J.
Hudson, J. Maron, K. A. Mooney, M. Power, D. Schemske, J. Stachowicz, S. Strauss,
M. G. Turner, and E. Werner. 2007. Filling key gaps in population and community
ecology. Frontiers in Ecology and the Environment 5:145-152.
Andersson, J. O., and R. Eriksson. 2010. Elements of ecological economics. Routledge.
Taylor & Francis Group, London.
Angeler, D. G. 2007. Resurrection ecology and global climate change research in freshwater
ecosystems. Journal of the North American Benthological Society 26:12-22.
Ayres, R. U. 2004. On the life cycle metaphor: where ecology and economics diverge.
Ecological Economics 48:425-438.
Christensen, N. L., A. M. Bartuska, J. H. Brown, S. Carpenter, C. D'Antonio, R. Francis, J. F.
Franklin, J. A. MacMahon, R. F. Noss, D. J. Parsons, C. H. Peterson, M. G. Turner,
and R. G. Woodmansee. 1996. The report of the ecological society of America
committee on the scientific basis for ecosystem management. Ecological Applications
6:665-691.
Dahl, J., and B. L. Peckarsky. 2003. Developmental responses to predation risk in
morphologically defended mayflies. Oecologia 137:188-194.
Darwin, R., M. Tsigas, J. Lewandrowski, and A. Raneses. 1996. Land use and cover in
ecological economics. Ecological Economics 17:157-181.
Death, R. G. 1988. Drift distance, periodicity and frequency of benthic invertebrates in a cave
stream. Verhandlungen der Internationalen Vereinigung für Theoretische und
Angewandte Limnologie 23:1446-1450.
Death, R. G. 1989. The effect of a cave on benthic invertebrate communities in a South Island
stream. New Zealand Natural Sciences 16:67-78.
Ewers, R. M., A. D. Kliskey, S. Walker, D. Rutledge, J. S. Harding, and R. K. Didham. 2006.
Past and future trajectories of forest loss in New Zealand. Biological Conservation
133:312-325.
Foley, J. A., R. DeFries, G. P. Asner, C. Barford, G. Bonan, S. R. Carpenter, F. S. Chapin, M.
T. Coe, G. C. Daily, H. K. Gibbs, J. H. Helkowski, T. Holloway, E. A. Howard, C. J.
Kucharik, C. Monfreda, J. A. Patz, I. C. Prentice, N. Ramankutty, and P. K. Snyder.
2005. Global consequences of land use. Science 309:570-574.

Chapter 5. Synthesis: the structuring of aquatic macroinvertebrate communities within cave streams
109
Gibert, J., D. L. Danielopol, and J. A. Stanford. 1994. Groundwater Ecology, Academic
Press, United States of America.
Graening, G. O. 2005. Trophic structure of Ozark cave streams containing endangered
species. Oceanological and Hydrobiological Studies 34:3-17.
Grieg, H. 2008. Community assembly and food web interactions across pond permanence
gradients. PhD thesis, University of Canterbury, Christchurch.
Gunn, J., P. Hardwick, and P. J. Wood. 2000. The invertebrate community of the Peak-
Speedwell cave system, Derbyshire, England - pressures and considerations for
conservation management. Aquatic Conservation: Marine and Freshwater Ecosystems
10:353-369.
Harding, J. S., R. G. Young, J. W. Hayes, K. A. Shearer, and J. D. Stark. 1999. Changes in
agricultural intensity and river health along a river continuum. Freshwater Biology
42:345-357.
Holyoak, M., M. A. Leibold, and R. D. Holt. 2005. Metacommunities: spatial dynamics and
ecological communities. University of Chicago Press, Chicago, Illinois, USA.
Konikow, L. F. 2002. Ground-water depletion and overexploitation: a global problem.
Geological Society of America Abstracts with Programs 34, 229.
Leibold, M. A., M. Holyoak, N. Mouquet, P. Amarasekare, J. M. Chase, M. F. Hoopes, R. D.
Holt, J. B. Shurin, R. Law, D. Tilman, M. Loreau, and A. Gonzalez. 2004. The
metacommunity concept: a framework for multi-scale community ecology. Ecology
Letters 7:601-613.
MEA. 2005. Millennium ecosystem assessment, ecosystems and human well-being:
biodiversity synthesis. World Resources Institute, Washington DC, USA.
Muller, K., R. Stenger, and A. Rahman. 2006. Herbicide loss in surface runoff from a
pastoral hillslope in the Pukemanga catchment (New Zealand): role of pre-event soil
water content. Agriculture, Ecosystems and Environment 112:381-390.
Peckarsky, B. 1983. Biotic interactions or abiotic limitations? A model of lotic community
structure. Fontaine, T. and Bartell, S. eds: Dynamics of lotic ecosystems: Ann Arbor
Science Publishers, Michigan, USA, pp 303-323
Pugsley, C. 1984. Ecology of the New Zealand glowworm, Arachnocampa luminosa
(Diptera: Keroplatidae), in the Glowworm Cave, Waitomo. Journal of the Royal
Society of New Zealand 14:387- 407.

Chapter 5. Synthesis: the structuring of aquatic macroinvertebrate communities within cave streams
110
Pulliam, H. R. 1988. Sources, sinks and population regulation. American Naturalist 132:652-
661.
Pulliam, H. R., and B. J. Danielson. 1991. Sources, sinks, and habitat selection: a landscape
perspective on population dynamics. American Naturalist 137:60-66.
Quinn, J. M. 2000. Effects of pastoral development. In: Collier.K.J. and Winterbourn,M.J.
eds. New Zealand stream invertebrates: ecology and implications for management.
New Zealand Liminological Society, Christchurch:208-229.
Quinn, J. M., and C. W. Hickey. 1990. Characterisation and classification of benthic
invertebrate communities in 88 New Zealand rivers in relation to environmental
factors. New Zealand Journal of Marine & Freshwater Research 24:387-409.
Ramesh, B., C. Ross, and S. Colombo. 2009. Estimating values of environmental impacts of
dairy farming in New Zealand. New Zealand Journal of Agricultural Research
52:377-389.
Robert, K. H., B. Schmidt-Bleek, J. Aloisi De Larderel, G. Basile, J. L. Jansen, R. Kuehr, P.
Price Thomas, M. Suzuki, P. Hawken, and M. Wackernagel. 2002. Strategic
sustainable development - selection, design and synergies of applied tools. Journal of
Cleaner Production 10:197-214.
Sagarin, R. 2007. Write back: in support of observational studies. Frontiers in Ecology and
the Environment 5:294.
Sala, O. E., F. S. Chapin III, J. J. Armesto, E. Berlow, J. Bloomfield, R. Dirzo, E. Huber-
Sanwald, L. F. Huenneke, R. B. Jackson, A. Kinzig, R. Leemans, D. M. Lodge, H. A.
Mooney, M. Oesterheld, N. L. Poff, M. T. Sykes, B. H. Walker, M. Walker, and D. H.
Wall. 2000. Global biodiversity scenarios for the year 2100. Science 287:1770-1774.
Scoones, I. 1999. New ecology and the social sciences: what prospects for a fruitful
engagement? Annual Review of Anthropology 28:479-507.
Shi, Z. T., X. Y. Liu, Y. Liu, Y. Huang, and H. Y. Peng. 2009. Catastrophic groundwater
pollution in a karst environment: a study of phosphorus sludge waste liquid pollution
at the Penshuidong Cave in Yunnan, China. Environmental Earth Sciences 59:757-
763.
Smol, J. P., and M. S. V. Douglas. 2007. Crossing the final ecological threshold in high
Arctic ponds. Proceedings of the National Academy of Sciences of the United States
of America 104:12395-12397.
Chapter 5. Synthesis: the structuring of aquatic macroinvertebrate communities within cave streams
111
Vitousek, P. M., H. A. Mooney, J. Lubchenco, and J. M. Melillo. 1997. Human domination
of earth's ecosystems. Science 277:494-499.
White, T. A., V. O. Snow, and W. M. King. 2010. Intensification of New Zealand beef
farming systems. Agricultural Systems 103:21-35.
Winterbourn, M. J. 2000. Feeding ecology. Collier.K.J.; Winterbourn,M.J. eds. New Zealand
stream invertebrates: ecology and implications for management. New Zealand
Liminological Society, Christchurch:100-124.
Wood, P. J., J. Gunn, and J. Perkins. 2002. The impact of pollution on aquatic invertebrates
within a subterranean ecosystem - out of sight out of mind. Archiv für Hydrobiologie
155:223-237.
Wood, P. J., J. Gunn, and S. D. Rundle. 2008. Response of benthic cave invertebrates to
organic pollution events. Aquatic Conservation: Marine and Freshwater Ecosystems
18:909-922.
Playing in the mud