![Heat flow and fluid flow regime in the western Nankai ... · HEAT FLOW AND FLUID FLOW REGIME IN THE WESTERN NANKAI ACCRETIONARY PRISM [12]. Bottom simulating reflectors (BSRs) pro-duced](https://static.fdocuments.net/doc/165x107/5e4eddfa12886155d5594a32/heat-flow-and-fluid-flow-regime-in-the-western-nankai-heat-flow-and-fluid-flow.jpg)
The structure and fault activity of the Makran accretionary prism
17
The structure and fault activity of the Makran accretionary prism Gemma Smith, 1 Lisa McNeill, 1 Timothy J. Henstock, 1 and Jon Bull 1 Received 14 March 2012; revised 31 May 2012; accepted 31 May 2012; published 20 July 2012. [1] The Makran Subduction Zone has the highest incoming sediment thickness (up to 7.5 km) of any subduction zone. These sediments have formed a wide accretionary prism (400 km). Seismicity in the Makran is generally low; however the margin experienced an M w 8.1 earthquake in 1945 which generated a significant regional tsunami. Seismic reflection data and swath bathymetry data from offshore Pakistan are used to analyze the structure and fault activity of the outer accretionary prism. The outer prism has a simple structure of seaward verging imbricate thrust faults, many continuous for over 100 km along strike. Fault activity is analyzed using basin stratigraphy and fault geometry, revealing a frontal continuously active zone, a central intermittently active zone, and a landward inactive zone. Over 75% of the faults in the seaward 70 km of the prism show evidence for recent activity. The décollement occurs within the lower sediment section, but steps onto the top-basement surface in regions of elevated basement topography. Fault spacing (6 km) and taper (4.5 ) are comparable to other margins such as S. Hikurangi, Cascadia and Nankai, suggesting that high sediment input is not leading to an unusual prism structure. The décollement is unreflective, which is unexpected considering other prism characteristics predicting a weak surface, and may suggest a potentially stronger décollement than previously predicted. This study provides a significant advance in our understanding of the structure of an end-member convergent margin and demonstrates that systematic analyses of accretionary prism structure can help to elucidate subduction zone dynamics with ultimate relevance to seismogenic potential. Citation: Smith, G., L. McNeill, T. J. Henstock, and J. Bull (2012), The structure and fault activity of the Makran accretionary prism, J. Geophys. Res., 117, B07407, doi:10.1029/2012JB009312. 1. Introduction [2] The Makran Subduction Zone is generated by the subduction of the Arabian Plate beneath the Eurasian plate at 4 cm/yr offshore Pakistan and Iran (Figure 1). The accre- tionary prism is the largest accretionary complex in the world [Gutscher and Westbrook, 2009] and is thus an end-member globally, with an exceptionally high incoming sediment thickness (up to 7.5 km) and a low taper of 4 [Davis et al., 1983; Kopp et al., 2000]. As well as high sediment input, the Makran is characterized by generally low seismicity, how- ever it did experience a M w 8.1 earthquake in 1945 [Byrne et al., 1992]. The aim of this study is to interpret the mor- phology and structure of the outer Makran accretionary prism along a 400 km (along-strike) section offshore Pakistan, including an analysis of fault activity. This interpretation will allow the mechanical properties of the outer prism to be investigated, structural comparisons with other margins to be made, and will contribute to the understanding of its seismogenic potential. This manuscript is the first study of the Makran to systematically assess prism structure from seismic reflection data over such a large area. We evaluate the Makran Subduction Zone in the context of other global subduction zones (e.g., Southern Lesser Antilles, Hikurangi (New Zealand), parts of Cascadia and Sumatra/Sunda), including those with relatively high (>1 km) sediment input and/or large accretionary prisms. These accretionary prisms are also located at plate boundaries with slow to moderate convergence rates (3–5 cm/yr), similar to the Makran [DeMets et al., 1990]. [3] Fault activity within fold-thrust belts has been sug- gested to concentrate in the toe region, with activity reducing significantly landward of the deformation front. This sug- gestion has been supported by analogue [e.g., Davis et al., 1983; von Huene and Scholl, 1991; Gutscher et al., 1996] and numerical modeling [e.g., Willett et al., 1993; Fuller et al., 2006]. Other studies suggest that the distribution of deformation may be more complex, with a wider zone of activity and reactivation of landward thrusts [Hardy et al., 1998; Lohrmann et al., 2003]. Significant out-of-sequence thrusts, often associated with major structural and morpho- logical boundaries, have been identified in margins such as Nankai, Japan and Sunda, Indonesia [Park et al., 2002; Kopp and Kukowski, 2003]. The Makran Subduction Zone, with 1 Ocean and Earth Science, National Oceanography Centre Southampton, University of Southampton, Southampton, UK. Corresponding author: G. Smith, Ocean and Earth Science, National Oceanography Centre Southampton, University of Southampton, Southampton SO14 3ZH, UK. ([email protected]) ©2012. American Geophysical Union. All Rights Reserved. 0148-0227/12/2012JB009312 JOURNAL OF GEOPHYSICAL RESEARCH, VOL. 117, B07407, doi:10.1029/2012JB009312, 2012 B07407 1 of 17
-
Upload
gemma-smith -
Category
Documents
-
view
215 -
download
3
Transcript of The structure and fault activity of the Makran accretionary prism

The structure and fault activity of the Makran accretionary prism
Gemma Smith,1 Lisa McNeill,1 Timothy J. Henstock,1 and Jon Bull1
Received 14 March 2012; revised 31 May 2012; accepted 31 May 2012; published 20 July 2012.
[1] The Makran Subduction Zone has the highest incoming sediment thickness (up to7.5 km) of any subduction zone. These sediments have formed a wide accretionary prism(�400 km). Seismicity in the Makran is generally low; however the margin experiencedan Mw 8.1 earthquake in 1945 which generated a significant regional tsunami. Seismicreflection data and swath bathymetry data from offshore Pakistan are used to analyze thestructure and fault activity of the outer accretionary prism. The outer prism has a simplestructure of seaward verging imbricate thrust faults, many continuous for over 100 km alongstrike. Fault activity is analyzed using basin stratigraphy and fault geometry, revealing afrontal continuously active zone, a central intermittently active zone, and a landwardinactive zone. Over 75% of the faults in the seaward�70 km of the prism show evidence forrecent activity. The décollement occurs within the lower sediment section, but steps ontothe top-basement surface in regions of elevated basement topography. Fault spacing (6 km)and taper (4.5�) are comparable to other margins such as S. Hikurangi, Cascadia andNankai, suggesting that high sediment input is not leading to an unusual prism structure.The décollement is unreflective, which is unexpected considering other prism characteristicspredicting a weak surface, and may suggest a potentially stronger décollement thanpreviously predicted. This study provides a significant advance in our understanding of thestructure of an end-member convergent margin and demonstrates that systematic analysesof accretionary prism structure can help to elucidate subduction zone dynamics withultimate relevance to seismogenic potential.
Citation: Smith, G., L. McNeill, T. J. Henstock, and J. Bull (2012), The structure and fault activity of the Makran accretionaryprism, J. Geophys. Res., 117, B07407, doi:10.1029/2012JB009312.
1. Introduction
[2] The Makran Subduction Zone is generated by thesubduction of the Arabian Plate beneath the Eurasian plate at�4 cm/yr offshore Pakistan and Iran (Figure 1). The accre-tionary prism is the largest accretionary complex in the world[Gutscher and Westbrook, 2009] and is thus an end-memberglobally, with an exceptionally high incoming sedimentthickness (up to 7.5 km) and a low taper of�4� [Davis et al.,1983; Kopp et al., 2000]. As well as high sediment input, theMakran is characterized by generally low seismicity, how-ever it did experience a Mw 8.1 earthquake in 1945 [Byrneet al., 1992]. The aim of this study is to interpret the mor-phology and structure of the outer Makran accretionary prismalong a 400 km (along-strike) section offshore Pakistan,including an analysis of fault activity. This interpretation willallow the mechanical properties of the outer prism to beinvestigated, structural comparisons with other margins to
be made, and will contribute to the understanding of itsseismogenic potential. This manuscript is the first study ofthe Makran to systematically assess prism structure fromseismic reflection data over such a large area. We evaluatethe Makran Subduction Zone in the context of other globalsubduction zones (e.g., Southern Lesser Antilles, Hikurangi(New Zealand), parts of Cascadia and Sumatra/Sunda),including those with relatively high (>1 km) sediment inputand/or large accretionary prisms. These accretionary prismsare also located at plate boundaries with slow to moderateconvergence rates (�3–5 cm/yr), similar to the Makran[DeMets et al., 1990].[3] Fault activity within fold-thrust belts has been sug-
gested to concentrate in the toe region, with activity reducingsignificantly landward of the deformation front. This sug-gestion has been supported by analogue [e.g., Davis et al.,1983; von Huene and Scholl, 1991; Gutscher et al., 1996]and numerical modeling [e.g., Willett et al., 1993; Fulleret al., 2006]. Other studies suggest that the distribution ofdeformation may be more complex, with a wider zone ofactivity and reactivation of landward thrusts [Hardy et al.,1998; Lohrmann et al., 2003]. Significant out-of-sequencethrusts, often associated with major structural and morpho-logical boundaries, have been identified in margins such asNankai, Japan and Sunda, Indonesia [Park et al., 2002; Koppand Kukowski, 2003]. The Makran Subduction Zone, with
1Ocean and Earth Science, National Oceanography Centre Southampton,University of Southampton, Southampton, UK.
Corresponding author: G. Smith, Ocean and Earth Science, NationalOceanography Centre Southampton, University of Southampton,Southampton SO14 3ZH, UK. ([email protected])
©2012. American Geophysical Union. All Rights Reserved.0148-0227/12/2012JB009312
JOURNAL OF GEOPHYSICAL RESEARCH, VOL. 117, B07407, doi:10.1029/2012JB009312, 2012
B07407 1 of 17

its high sediment input and wide accretionary zone, providesan ideal region in which to examine prism structure and straindistribution.[4] For submarine prisms, pore fluid pressure is an
important controlling factor on thrust mechanics and thestrength of prism materials [Moore and Vrolijk, 1992; Safferand Bekins, 2006]. Fluids are sourced both from the sub-ducting oceanic crust and the incoming sediment section, andfrom digenetic dehydration reactions with increasing tem-perature [Moore and Saffer, 2001]. As the subducting sectionis subjected to horizontal compression and vertical compac-tion, pore fluids attempt to migrate upwards. The presence ofa thick sediment section with low vertical permeability mayimpede this fluid release, producing pore fluid pressures ofup to lithostatic at the plate boundary [e.g., Moore andVrolijk, 1992]. Overpressured pore fluid can influencedécollement properties, leading to decreased effective basalstrength which in turn, according to Coulomb wedge theory,will produce a prism of low taper [Davis et al., 1983;Le Pichon et al., 1993]. Elevated pore pressures have beeninferred from seismic velocities at several subduction zonesincluding Barbados and Nankai [e.g., Bangs et al., 1990;Tobin and Saffer, 2009]. Fluid may migrate along thedécollement horizon, vertically through the accreted sedi-ment, or along thrust faults depending on the relative
permeability of these pathways [e.g., Moore and Vrolijk,1992; Le Pichon et al., 1993]. The high sediment inputexperienced by the Makran suggests a potentially high fluidinput, which may affect the mechanical properties of theprism.[5] Historically, aseismic behavior was suggested to occur
in the Makran, Hikurangi, Southern Barbados, and Cascadiasubduction zones due to the presence of large accretionaryprisms at these margins and relatively low background seis-micity [Byrne et al., 1988]. Subsequent to this suggestion,evidence of prehistoric earthquakes in the Cascadia regionsuggested that this margin, rather than being aseismic, pro-duces large earthquakes. The occurrence of the 1945 Makranearthquake, �30 km landward of the trench, has proveddifficult to reconcile with other features of the Makran. Thelow taper, high sediment input and wide accretionary prismof the Makran would, according to traditional models [Byrneet al., 1988; Hyndman et al., 1997] suggest that the outerprism is largely aseismic. Prior to the Sumatra 2004 andTohoku Oki 2011 events, seaward rupture was consideredunlikely, however both these events show evidence for rup-ture farther trenchward than anticipated, and in the case of theSumatra 2004 event, though the outer prism [e.g., Henstocket al., 2006; Dean et al., 2010; Gulick et al., 2011; Ideet al., 2011].
Figure 1. Location map of the Makran Subduction Zone. Inset shows the regional tectonics, with theMakran located where the Arabian Plate subducts beneath the Eurasian Plate. Main map shows focalmechanisms from the Global CMT Catalog (1976–present) colored by depth. Black dots indicate earth-quakes (>Mb 3.3) from ANSS catalog from 1963 to 2011. In addition the 1945 and 1947 earthquakes areindicated by stars - locations from Byrne et al. [1992] and Heidarzadeh et al. [2008]. Thick dashed linesindicate major tectonic boundaries. Fine gray lines indicate the 2D seismic lines used in this study. Higherseismicity is visible in the Ornach-Nal strike slip system than the Makran Subduction Zone.
SMITH ET AL.: THE MAKRAN ACCRETIONARY PRISM STRUCTURE B07407B07407
2 of 17

1.1. Geological Setting
[6] The offshore Makran accretionary prism is located inwater depths of 750–3000 m. There is no bathymetric trenchseaward of the deformation front (�3000 m depth) due to thehigh sediment input (Figure 2). The age of the lithosphere inthe Arabian Sea has been debated due to the lack of identi-fiable seafloor magnetic anomalies in the region between theMurray Ridge and the Makran subduction zone [White,1979]. This absence has led to the suggestion that the oce-anic crust in this region was formed either in the Cretaceous‘quiet zone’, supported by heat flow measurements takenfrom shallow cores in the Gulf of Oman [Hutchison et al.,1981], or late Jurassic-early Cretaceous [Whitmarsh, 1979],or Paleocene-Eocene [Mountain and Prell, 1990; Edwardset al., 2000], both suggested from plate reconstructions.[7] The Makran is bound to the west by the right-lateral
Minab Fault and to the east by a triple junction consisting ofthe left-lateral Ornach-Nal fault system and the transtensionalMurray Ridge (Figure 1). These strike-slip systems separatethe Makran from regions of continental collision (Zagrosand Himalayan). The Baluchistan Volcanic Arc, includingthe Bazman and Taftan Volcanoes in Iran, is located 400–600 km from the trench [Grando and McClay, 2007].Onshore, two topographic depressions, the Jaz Murian andthe Hamun-i-Mashkel, located between the accretionaryprism and the Baluchistan volcanoes are interpreted as fore-arc basins [Jacob and Quittmeyer, 1979]. These basins areseparated by the N-S trending strike-slip Sistan Suture Zone(Figure 1) [Tirrul et al., 1983] which has been suggested tosegment the subduction zone into discrete eastern and west-ern zones, based on contrasting levels of seismicity (higherin the east) [Rani et al., 2011]. This study is focused on theeastern offshore Makran subduction zone (east of the SistanSuture), and on the outer �70 km of the accretionary prism.[8] Mud volcanoes are common onshore, where they
appear to be associated with E-W-trending fault zones[Ahmed, 1969] and sourced from the Upper Miocene Parkinimudstones [Schlüter et al., 2002]. Mud volcanoes and gasseeps have also been identified within the offshore prism
[von Rad et al., 2000; Kukowski et al., 2001;Wiedicke et al.,2001; Ding et al., 2010].
1.2. Previous Studies
[9] The offshore Makran currently has limited coverageof published seismic reflection data. Early seismic reflectionsurveys identified the imbricate structure of the accretionaryprism [White, 1982;Minshull and White, 1989]. Further data,including seismic reflection and refraction, magnetic, grav-ity, heat flow and swath bathymetry data sets (offshore bothPakistan and Iran) allowed the thick sediment section andvelocity structure to be resolved in more detail but withlimited along-strike coverage [Kopp et al., 2000; Kukowskiet al., 2001; Grando and McClay, 2007; Ding et al., 2010].Published core coverage is sparse, however analyses of13 long piston cores from the trench and prism basins foundhigh sedimentation rates (>2 mm/yr) dominated by inter-bedded hemipelagite and turbidites [Bourget et al., 2010;Mouchot et al., 2010; Bourget et al., 2011].
1.3. Seismicity
[10] The Makran is seismically relatively quiet comparedto other margins such as Chile and Nankai, and more similarto quiescent margins such as Cascadia. However, the regionhas experienced occasional significant historical earthquakes.The largest recent earthquake in the Makran occurred in 1945(Figure 1), recently relocated to 24.5�N 63.00�E [Heidarzadehet al., 2008], placing it only 30 km landward of the defor-mation front. This was a Mw 8.1 earthquake with a possibleshallow-dip thrust source (focal mechanism derived frombody waveform inversions of P and SH waves and dis-location modeling of coastal uplift, [Byrne et al., 1992]),interpreted as an interplate event at a depth of approximately25–30 km. This event generated a tsunami which killed 4000people locally, with wave heights up to 10 m [Heidarzadehet al., 2008]. A laterally extensive marine shelly bed in anintertidal lagoon in Oman has been interpreted as the 1945tsunami deposit due to its shallow stratigraphic depth,although actual dating of the layer was unsuccessful [Donatoet al., 2009]. The highest runup is reported to have affected
Figure 2. Structure map of the Makran accretionary prism. Imbricate thrust faults picked from MCS dataand correlated with the aid of bathymetry data. Bathymetry data in east modified from Bourget et al. [2010].Submarine canyon-channel systems in blue. Water depth seaward of the deformation front �3500 m.Location of Figures S2 and S3 indicated.
SMITH ET AL.: THE MAKRAN ACCRETIONARY PRISM STRUCTURE B07407B07407
3 of 17

the coast of Pakistan three hours after the earthquake. Thistime lag, in conjunction with the timing of undersea cablebreaks, has been interpreted as evidence for widespreaddelayed slope failure triggered by the earthquake [Byrneet al., 1992]. A further probable thrust earthquake in 1947(Mw 7.3) is interpreted as an aftershock to the 1945 event,located 80 km to the northeast [Byrne et al., 1992]. Smallerthrust earthquakes in the eastern Makran appear to also beN-S compressional events, potentially on the plate boundary[Byrne et al., 1992]. The two thrust events illustrated inFigure 1 occurred in 1991 and 1992 with Mw of 5.6 and 5.8respectively, both at a depth of �15 km.[11] Deeper (>60 km), normal faulting events occur further
landward likely within the subducting plate. A swarm ofstrike-slip events occurred further landward from 1978 to1980 in the region of the Sistan Suture Zone [Byrne et al.,1992]. These events produced right-lateral strike-slip focalmechanisms, indicating that activity is still occurring along
the suture zone. This suggests continued relative motionbetween the onshore Eastern andWestern Makran, consistentwith a level of segmentation in the onshore Eurasian plate.Higher levels of background seismicity are recorded in theMurray Ridge and onshore strike-slip systems east and westof the Makran Subduction Zone, than in the subduction zoneitself.
2. Data and Analysis
[12] The multichannel seismic (MCS) reflection data setfor this project consists of 6200 km of 2D data collected byWesternGeco® in 1998–1999 (Figure 1). These data wereacquired using a 2250 cubic inch air gun array (4 strings)towed at a depth of 6.5 m, and recorded using a 5100 mstreamer at 8 m depth with a shot spacing of 12.5 m. TheMCS data are 102 fold, have been stacked and Kirchoffmigrated and have undergone both pre- and post-stack
Figure 3. Seismic line 116 from the west of the study area (location in Figure 2) (a) without interpretationand (b) with interpretation. Simple imbricate structure visible, with an average fault spacing of �6 km.Increased sediment blanketing can be seen toward the north. Incoming sediment thickness of 7.0 km. Thetwo major sedimentary units (A and B) are labeled. Width of view �70 km. Vertical exaggeration �2.3 atseafloor. Location in Figure 2.
SMITH ET AL.: THE MAKRAN ACCRETIONARY PRISM STRUCTURE B07407B07407
4 of 17
deconvolution. The record length of these data is 10 s TWT.The data set includes 19 strike lines and 34 dip lines with aline spacing of 12 km. Additional constraints on the incom-ing section in the west were gained through integration of theCam-30 MCS Line [Minshull and White, 1989]. Swathbathymetry data covering an area roughly 75 km by 150 kmof the western study area (Figure 2) were collected on Leg 2of Meteor Cruise 74 in 2007 using a Simrad EM120 12 kHzhull-mounted multibeam system, at a speed of between 2.5–12 kts, and subsequently gridded at 50 m [Ding et al., 2010]and made available to this project. Additional bathymetricinformation for the central and eastern areas has beenacquired from published multibeam bathymetry data images[Bourget et al., 2010].[13] MCS data have been interpreted using IESX
(Schlumberger GeoFrame®). Horizons were picked using acombination of auto and manual picking, and faults manuallypicked and where possible correlated between lines. Thestacking velocities associated with this data set are notused in this study; however published stacking velocity datafrom the Cam-30 line and coincident refraction lines can
be incorporated allowing localized depth conversion andregional depth estimates. Kopp et al. [2000] recorded OBHdata and reported sediment velocities of between 1.8 km/s atthe seabed to 4.4 km/s just above the basement on the oceanicplate in the western study area. They note a probable weakvelocity contrast between the basal sediments and the top ofthe oceanic basement landward of the deformation front.Interval velocities from stacking velocities of the Cam-30reflection line suggest high sediment velocities, of up to4.5 km/s, in the deepest accreted sediment, and up to 4 km/sin the incoming section [Minshull and White, 1989].
3. Results
[14] We describe outer accretionary prism fault structureand activity, décollement position and properties, prism taperanalysis and stratigraphy of the incoming section.
3.1. Accretionary Prism Structure
[15] Seafloor morphology is dominated by E-W trendingridges separated by narrow sedimentary (piggyback) basins
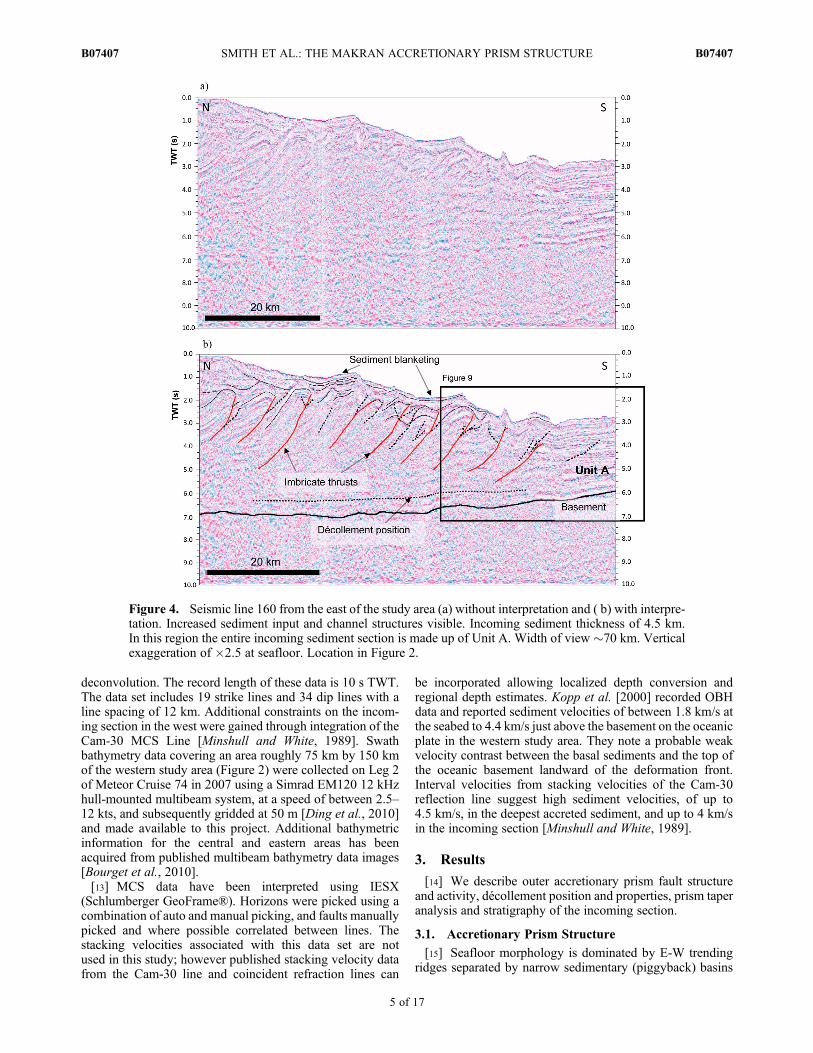
Figure 4. Seismic line 160 from the east of the study area (a) without interpretation and ( b) with interpre-tation. Increased sediment input and channel structures visible. Incoming sediment thickness of 4.5 km.In this region the entire incoming sediment section is made up of Unit A. Width of view �70 km. Verticalexaggeration of �2.5 at seafloor. Location in Figure 2.
SMITH ET AL.: THE MAKRAN ACCRETIONARY PRISM STRUCTURE B07407B07407
5 of 17

and cut by canyon-channel systems (Figure 2). The frontalridge (formed by the frontal thrust) is a significant bathy-metric feature, with a vertical relief of up to 1000 m and localgradients of over 30�. The frontal and subsequent ridges areanticlinal fault propagation folds which express the imbricatethrust structure of the accreted sediments, and can be used toaid along-strike fault correlation. Where a bathymetric ridgeis not evident, correlation is more difficult, but can still beachieved using surrounding features, e.g., fault position rel-ative to the hanging wall ridges of adjacent faults, similaritiesin fault structure and extrapolation of fault trend. The currentcorrelations are conservative; therefore the length of somefaults, particularly for those further landward, is likelyunderestimated (due to increased slope sediment cover anddisruption by submarine canyons). Increased slope sedimentblankets the accreted sediment and reduces the bathymetricexpression of the ridges, thus making their bathymetric traceharder to follow. The frontal thrust can be confidently fol-lowed continuously for 250 km (Figure 2). The deformationfront is intersected by the Murray Ridge and Little MurrayRidge (north of and parallel to the Murray Ridge but withminimal bathymetric expression) [White, 1983] (Figure 2).[16] Three reflection seismic lines (Figures 3, 4, and 6) are
presented to represent the structure of the accretionary prism,accompanied by two additional seismic lines presented isFigures S2 and S3 in the auxiliary material.1 The imbricatethrusts are exclusively seaward vergent (landward dipping)with occasional secondary backthrusts (Figure 3). The faultpropagation anticlines of the thrusts often contain smallbending-moment normal faults in the hinge zone, drivingcollapse of the ridge slopes. The thrust faults dip at 20–30�and the majority strike E-W (080–090�). In the easternmostMakran there is a slight rotation in fault strike to the NE,following the trend of the deformation front as the MurrayRidge impinges. In the west and central regions of the studyarea a simple imbricate fault structure dominates, whereasfault structures become more complex in the east, with more
antithetic backthrusts and secondary faults (Figure 4). Faultspacing fluctuates along the margin, varying from 2.2 km–18.6 km (Figure 5), however median fault spacing remainsfairly consistent at �6 km, indicating that fault spacingincreases are balanced by corresponding decreases. In thecentral region (overlying the obliquely subducting LittleMurray Ridge) the second thrust steps inward relative to thefrontal thrust (spacing >18 km) and the distance betweenthe 2nd and 3rd thrusts is significantly reduced (2.2 km)(Figure 6). By the 3rd and 4th thrusts in this area, spacing hasreturned to the average value of �6 km. The Little MurrayRidge at this location is approximately 30 km wide (mea-sured perpendicular to the margin) where it intersects thedeformation front. There is no evidence of the proposedstrike-slip Sonne Fault crosscutting the forearc, however theobliquity of this lower plate feature may preclude its clearimaging [Kukowski et al., 2000]. Though the subductingbasement ridges produce topography on the downgoing platethere does not appear to be any large scale segmentation(breaks in structure along strike, significant changes instructural style etc.) of the upper plate imbricate thrusts inresponse to subducting topographic features. This may bedue to the smoothing effect of the thick sediment sectionoverlying these basement ridges.
3.2. Sediment Input and Stratigraphy of the IncomingSediment Section
[17] The accretionary prism is cut by submarine canyon-channel systems transporting sediment to the trench (fromthe Pakistan coast). Trench-parallel channel systems are alsovisible in the bathymetry data in the eastern trench regionflowing from east to west; seaward extensions of signifi-cant fluvial systems such as the Hab and Bela sourced inthe Himalayan collision zone. Stratigraphy of the incomingoceanic Arabian Plate has been interpreted from the MCSdata; however a shortage of local borehole data preventsdetailed lithological interpretation [Clift et al., 2002]. Thethickest input section (7.5 km) is in the west of the studyarea. In the central region, the elevated basement of theLittle Murray Ridge [White, 1983] locally reduces sediment
1Auxiliary materials are available in the HTML. doi:10.1029/2012JB009312.
Figure 5. Plot of average (red) and median (blue) fault spacing for each line, with range of values indi-cated by black error bars. The range of values increase over the Little Murray Ridge. Average fault spacingalong the margin is 6 km (gray dashed line).
SMITH ET AL.: THE MAKRAN ACCRETIONARY PRISM STRUCTURE B07407B07407
6 of 17

thickness (to as little as <1 km) and in the east the topographyof the Murray Ridge flank reduces sediment thickness toapproximately 5 km (Figure 7). TheMurray Ridge may act asa barrier to northward sediment transport and its evolutionexerts a significant control on the stratigraphy of the inputsection.[18] The top basement surface has been picked as the
first high amplitude, positive polarity reflector at the base ofthe sediment pile, and by the transition into chaotic reflec-tions. The sediment input section can be divided into twounits separated by a widespread N-dipping unconformity(Figure 8). The lower unit (Unit A) dips to the north, onlap-ping the basement, and can be correlated along the length ofthe deformation front. Reflectors are sub-parallel, closelyspaced and laterally continuous. Reflector amplitude is vari-able with several high amplitude horizons visible, as well assome transparent sections. Channel-levee structures andnormal faults are also visible in this unit, particularly in theeast (Figure 9). Unit A has a fairly constant thickness of�4 km (assuming a velocity of 2.5 km/s from Fruehn et al.[1997], with localized thinning over the Little Murray
Ridge. The upper unit (Unit B) contains laterally continuoushorizontal reflectors and does not show any evidence fornormal faulting. It forms a wedge-shaped, horizontallybedded unit, thinning to the south and east and thickeningto the north and west, with a maximum thickness of 3.5 km(velocity model from Fruehn et al. [1997]), and is absent inthe easternmost lines. The regional unconformity separatingthe two units may either be due to subduction-related flexure,uplift of the Murray Ridge, or a combination of the two. Thegeometry of the upper unit, determined from contoured iso-pachs, trends SW-NW and parallel to the Murray Ridge,supporting a Murray Ridge related origin [White, 1983].[19] Previous studies have also identified two units in
the incoming section. The lower unit in the west of our studyarea has been interpreted as a turbidite unit derived fromHimalayan uplift, with alternating hemipelagic and turbiditelayers deposited in a proto-Indus fan [Fruehn et al., 1997;Schlüter et al., 2002]. The upper unit has been previouslydescribed as a mixed suite of turbidites and hemipelagicsderived both from the east and the onshore Makran to thenorth [Schlüter et al., 2002] with deposition occurring from
Figure 6. Seismic line 136 (over Little Murray Ridge (a) without interpretation and (b) with interpretation.Width of view is�70 km. Sediment thickness of 2.5 km. Imbricate faults showmore variable spacing and soleout onto the top-basement surface. 100% of the incoming section is accreted. Vertical exaggeration�2.3 atseafloor. Location in Figure 2.
SMITH ET AL.: THE MAKRAN ACCRETIONARY PRISM STRUCTURE B07407B07407
7 of 17

the late Miocene to present. The occurrence of moderntrench-parallel channels in the eastern Makran shows thatthere is clearly a component of sediment transport from theeast, not solely from the onshore Makran to the north. Thereis also evidence for small channels flowing northward intothe abyssal plain from the northern flank of the Murray Ridge(Figure 2).
3.3. Gas Hydrate Distribution
[20] A BSR (bottom simulating reflector) is visible acrossmuch of the prism indicating the presence of widespread gashydrate (Figure 3a). In the west and central regions of thestudy area the BSR is fairly ubiquitous; however in the eastits distribution is greatly reduced. The BSR occurs at anaverage depth (TWT) of 500 ms (�500 m based on thevelocity model of Minshull and White [1989]), consistent
with the interpretations of Grevemeyer et al. [2000] from thewest of the study area. The BSR does not appear to be dis-rupted where it crosses imbricate thrusts, as suggested byMinshull and White [1989], however further analysis of BSRproperties and its relationship to faults and fluid flow isongoing.
3.4. Décollement Position and Properties
[21] The décollement beneath the outer prism is in generalnot reflective, however, its location can be inferred from thegeometry and downward projection of thrust faults (i.e.,where they sole out), the identification of the undeformedsubducting sediment, and from the thickness of the accretedhanging wall sediment section. The resulting picks are theresult of extensive interpretation correlating between alldip and strike lines generating a consistent and correlated
Figure 8. Zoom of the incoming section from Line 136. Three units can be identified: oceanic basement,and two sedimentary units (A and B). Width of view 17 km. Vertical exaggeration �2.3 at seafloor. Loca-tion in Figure 6b.
Figure 7. Grid of the depth to top-basement surface in time. The basement is dominated by NE/SW trend-ing ridges: The Murray Ridge and Little Murray Ridge. The deepest basement occurs in the west at 3 s(�7.5 km) beneath the seabed.
SMITH ET AL.: THE MAKRAN ACCRETIONARY PRISM STRUCTURE B07407B07407
8 of 17

interpretation. From our careful analysis of the entire dataset, although we specifically looked for such reflectors, wehave not identified a local negative-polarity high-amplitudereflector which seems a more likely candidate for the décol-lement surface than other surrounding horizons. There is alevel of uncertainty associated with locating the décollementsurface within the sediment, as the boundary betweenaccreted and underthrust sediment is, in most cases, not avisible sharp boundary. It is also possible that the décolle-ment itself may not be a discrete horizon, rather a zone ofsheared sediment. Estimating and integrating uncertaintiesfrom these methods, the interpreted décollement positionscan be expected to have an error of +/�0.5 sTWT (�600–700 m). The position of the décollement surface can be
estimated to 25–40 km landward of the deformation front,beyond which the thick, deformed sediment section pre-cludes the identification of deeper structure and stratigraphy.The proportion of accreted versus underthrust sediment canbe established by extrapolating the likely décollement posi-tion into the incoming section and analyzing its variationalong strike.[22] The position of the developing décollement within
the input section shows significant variations along strike(Figure 10). In the western survey area (Figure 3), thedécollement surface dips north, parallel to the basementreflector, accreting 70–80% of the incoming section (�4.3 km).In this area the décollement surface is located within thelower sedimentary unit (Unit A), while all of Unit B is
Figure 10. Décollement-basement isopach generated by gridding basement and décollement horizonsand calculating thickness. Red indicates zero thickness between the two horizons, i.e., no underthrustsediment. Green/blue colors indicate underthrust sediment thickness in TWT. Maximum thickness ofunderthrust sediment is 3–4 km in the westernmost area (assuming a sediment velocity of 4 km/s fromKopp et al. [2000]). Locations of Figures 3, 4, 6, S2, and S3 shown.
Figure 9. Buried channel structures in Unit A in the east of the study area (Line 160). Incising channelsare also visible affecting the uppermost sediments. The entire incoming section is composed of Unit A inthis region. Width of view 37 km. Vertical exaggeration �2.3 at seafloor. Location in Figure 4.
SMITH ET AL.: THE MAKRAN ACCRETIONARY PRISM STRUCTURE B07407B07407
9 of 17

accreted. This agrees with previous studies [Fruehn et al.,1997; Kopp et al., 2000; Grando and McClay, 2007], all ofwhich interpreted a décollement within the lower sedimen-tary unit, and from the mass balance calculations of Plattet al. [1985]. To the east of the Little Murray Ridge(Figure 4) the décollement is again located within the Unit Aand approximately 70–80% (�3–4 km) of the section isaccreted. Thus, away from topographic basement anomalies,the décollement consistently occurs �0.5–2 sTWT (�1.5–3 km) above basement, within the lower sedimentary unit.[23] In the central study area, the incoming section is
affected by the discontinuous basement highs of the LittleMurray Ridge. This basement topography clearly influencesthe position of the décollement and the proportion of accretedsediment. Over the basement highs the décollement lies at thesediment-basement interface (Figure 6). The décollementdoes not appear to structurally step down along strike; ratherit abuts and then follows the top-basement surface. In thelandward prism it is possible that the décollement stepsoff the top basement surface and back into the sedimentsection, though this is difficult to interpret due to imaginglimitations of this deeper section. In this region (�150 kmalong strike section of the margin) 100% of the incoming
section (1–3.5 km) is currently being accreted at the defor-mation front (Figure 10).
3.5. Prism Taper Analysis
[24] Surface slope values can be combined with the sub-ducting plate dip to establish prism taper, and then used toelucidate information about the basal and internal frictionalproperties of the prism [Davis et al., 1983]. A low tapersuggests low basal friction relative to internal strength[Dahlen, 1990].[25] Slope and basement dip values were measured (using
local depth conversions from velocity data for the latter) fromthe deformation front to 35 km into the prism (Table 1). Thetop-basement pick at the deformation front is clearly visibleso has minimal error associated with it, however the land-ward picks are more difficult and so introduce an error of�2.5%. There is additional uncertainty associated with theaverage velocities used for depth conversion which introducean error of �10%. The frontal 35 km is the maximum prismwidth covered by all of the lines allowing a comparisonbetween consistent portions of the prism on each line. Forcompleteness, taper along the lines which covered largerwidths of prism (up to 70 km) was also calculated and gives asimilar but slightly lower average taper of 3.7�, compared to4.5� for the frontal region. Basal dip beneath the outerMakran prism is shallow; with an average value of 3.2�(Table 1). Our basement dips in the western region of 1.3�–2.7� agree with results from refraction data of White andLoudon [1982]. Slope values are consistently low alongstrike, with a range of 0.7�–3�, and average of 2�. Excludingregions of anomalous oceanic basement topography, theaverage taper is 4.5�. This taper value is slightly higher thanprevious estimates of �3.6� [Davis et al., 1983], though thisvalue was cited from White and Ross [1979], which focusedon the western (Iranian) part of the accretionary prism. Ourtaper value however is similar to the �5� calculated from theslope values of Kukowski et al. [2001] and basement dipvalues of Kopp et al. [2000] Higher (>5�) taper values arefound in the central study area where the Little Murray Ridgeis locally subducting (Lines 142 and 144 have both thehighest slope and basal dip values), and to a lesser extentin the east where the Murray Ridge flank increases basementdip. The taper values for these lines are therefore elevateddue to basement topography.
3.6. Fault Activity Analysis
[26] Piggyback basins in the hanging wall of a thrust faultcontain sediment which onlaps the deformed, accretedhanging wall sediments of each fault. These basins containgrowth packages, the geometry of which is related to faultactivity. The sediments within the Makran piggyback basinsconsist of turbidites and debrites from the failure of adja-cent ridges, sediment transported by canyon channel systemsand hemipelagic sedimentation [Bourget et al., 2010]. Thesebasins are generally 1–7 km in width (across strike), and canextend for over 50 km along strike. Many piggyback basinscontain >2 sTWT (�2 km) of sediment.[27] Unconformities present in the piggyback basins are
the result of changes in the balance between sedimentationand tectonic activity, and may indicate changes in faultactivity, changing fault position/geometry, or the initiationof a new thrust. Examples from the Kumano transect of the
Table 1. Slope and Basement Dip Values Calculated for theFrontal 35 km of Prism for Each 2D Seismic Linea
LineSlope(deg)
Basement Dip(deg)
Taper(deg)
98 2.2 3.5 5.7100 0.9 3.8 4.7102 1.0 2.2 3.2104 1.0 1.8 2.8106 0.7 1.8 2.5108 2.4 2.3 4.7110 2.1 2.6 4.8112 1.7 1.6 3.3114 1.9 2.0 3.9116 1.7 2.4 4.2118 1.4 2.7 4.0120 2.0 2.3 4.3122 1.7 2.8 4.5124 1.5 3.2 4.8126 2.1 3.4 5.4128 2.0 5.6 7.7130 2.6 5.0 7.7132 2.8 3.6 6.4134 1.8 5.5 7.3136 2.6 4.0 6.6138 2.7 3.9 6.6140 2.6 2.8 5.4142 3.0 7.3 10.2144 2.8 6.6 9.4146 2.1 6.0 8.1148 1.6 2.2 3.8150 2.6 2.7 5.3152 1.5 1.3 2.7154 1.8 1.7 3.6156 1.8 1.4 3.3158 2.4 1.6 4.0160 2.3 2.7 5.0162 3.0 3.7 6.7164 2.0 3.5 5.6Average 2.0 3.2 5.2Average excluding LMR values 4.5
aItalic values are excluded from regional average due to proximity to LittleMurray Ridge (LMR) and resulting anomalously high (>5�) basement dips.Line numbers increase from west to east.
SMITH ET AL.: THE MAKRAN ACCRETIONARY PRISM STRUCTURE B07407B07407
10 of 17

Nankai Subduction Zone illustrate that slope failure depositsmay also create onlapping relationships and reflector ter-minations within piggyback basin sediments [Strasser et al.,2011], generating complex stratigraphy. Fanning, wedgeshaped growth packages of sediment are likely to indicateperiodic or continuous syn-sedimentary activity on the under-lying thrust fault which progressively tilts the piggybackbasin landward (Figure 11). Conversely horizontal recentsediments indicate minimal current fault activity. These
classifications may be complicated by interactions betweenactivity on adjacent faults, for example displacement onthe frontal thrust may increase the dip of sediments in thepiggyback basin of the second thrust. Piggyback basins havebeen identified on dip lines and the stratigraphy interpretedand correlated along strike (where possible) to classify faultsinto currently active versus inactive and continuously versusintermittently active during the depositional history of thebasins.[28] Applying these methodologies, over 75% of faults
(from the deformation front to �70 km landward) showevidence for recent activity (e.g., Figure 12), including someover 50 km from the deformation front. Inactive faults (noevidence for recent activity) are almost exclusively locatedtoward the north of the study area (e.g., Figure 13). Clearvariations in fault activity distribution are also observedalong strike (Figure 14). In the easternmost Makran prismfault activity is limited to within 30 km of the deformationfront (generally up to the �4th thrust), and on the eastern-most line only the frontal thrust shows evidence for recentactivity. This contrasts with the western study area where upto 9 sequential prism faults appear to be currently active.These results show that in the west and central parts of thestudy area, accretionary prism strain is currently being dis-tributed over a �50 km zone of the outer prism, rather thanon a single, or small number of thrusts as in the east.[29] The faults are also classified into whether they have
experienced continuous or intermittent activity. The seaward,younger thrusts (within 30 km of the deformation front/ the3rd–4th thrust) tend to demonstrate more continuous activitythan the older, landward thrusts, where some appear to havehad a period of quiescence (represented by undeformed,parallel strata) between active periods (Figure 14). Thisacross strike variation in activity suggests that a giventhrust fault is likely to be continuously active until �30 kmfrom the deformation front, where periods of quiescence are
Figure 11. Schematic diagrams of active and inactive faultsshowing interaction between overlying sediment and under-lying structure.
Figure 12. Example of an active fault. Piggyback basin shows sequential packages of fanning sedimentindicating continuous activity. Location in Figure 3.
SMITH ET AL.: THE MAKRAN ACCRETIONARY PRISM STRUCTURE B07407B07407
11 of 17

interspersed with renewed activity. In cases where there is avariation in activity along short sections of a thrust, the mostcommon behavior has been plotted. Variations in activityalong strike of individual faults are generally related to loweractivity at the lateral tips of the fault, where displacementmay be reduced, while increased displacement/activity occursin the center of the fault.[30] There appears to be a correlation between fault length
and level of activity (Figure 14). This is likely due to acombination of factors. The length over which a fault can becorrelated increases with the bathymetric expression of thefault, due to increased recent activity and associated anticli-nal growth. Faults of shorter length tend to have small or
absent bathymetric expressions, related to their lack of recentactivity and/or smaller displacements, and are thereforemore difficult to correlate along strike creating the poten-tially artificial correlation between reduced fault length andinactivity.
4. Discussion
4.1. Prism Structure and Influence of the IncomingOceanic Plate Section
[31] From these analyses of the Makran margin, the outerprism appears to be relatively structurally homogeneousacross and along strike at a regional scale (with the exception
Figure 13. Example of an inactive fault. Thrust is buried beneath layers of undeformed sediment.Location in Figure 3.
Figure 14. Plot of fault activity along/across the accretionary prism. Red faults show evidence for recentactivity, black faults do not. Dashed faults show intermittent activity and those with solid lines appear toexperience more continuous activity. The prism is divided into three zones based on this analysis: 1) Con-tinuously active since initiation (orange), 2) Active with periods of quiescence (purple), and 3) Inactive(green).
SMITH ET AL.: THE MAKRAN ACCRETIONARY PRISM STRUCTURE B07407B07407
12 of 17

of local changes over the Little Murray Ridge). The struc-tures seen across the margin are simple, with a consistentimbricate structure, which may be partly a function ofthe normal convergence [Kukowski et al., 2001]. There isno evidence for large scale segmentation of the upperplate, changes in fault vergence, or major out-of-sequencethrusts and, with the exception of the region overlyingthe Little Murray Ridge, fault spacing and taper are veryconsistent along the margin. The extensive frontal thrust(length ≥250 km) further illustrates the continuity of theprism structures. Comparisons between accretionary marginsbyMcAdoo et al. [2004] highlight the unusual simplicity andalong-strike continuity of the Makran structure when com-pared to other margins such as Cascadia and Nankai. There ishowever a gradual change in prism characteristics toward theeastern extent of the subduction zone: with increasing prox-imity to the Murray Ridge and the Eurasian/Arabian/ Indiantriple junction, the deformation front begins to rotate to thenorth and strain becomes more focused in the outermostprism. The subduction of the Little Murray Ridge also causeslocal changes in fault spacing and reduces the incomingsediment thickness to less than 1 km.[32] To investigate how the thick accreted sediment section
of the Makran affects two of its structural parameters (taperand fault spacing), the results from this study have beencompared with those from other margins with significantaccretionary prisms: Lesser Antilles, North and SouthHikurangi, Cascadia and Nankai (Table 2). What is evidentfrom this comparison is that, despite its high sediment input,the taper and fault spacing of the Makran are comparable tothese other margins, suggesting that the high incoming sed-iment thickness of the Makran is not generating unusualstructural behavior in the offshore prism and is not the maincontrol on structural development. The Makran, with anaccreted sediment thickness of �6 km, has similar faultspacing to N Cascadia (Washington) where the accretedsection is only 2–3 km. However, there does appear to be apotential lower cut-off of <1 km accreted sediment, belowwhich the fault spacing drops to low values (3–4 km) such asin Nankai (Muroto) and possibly North Hikurangi (Table 2).An alternative interpretation for fault spacing in the Makranis proposed by Ding et al. [2010], who suggest that the pri-mary fault spacing is 12 km, and that faults which formwithin this across-strike span are secondary, out-of-sequence
thrust faults. We find no categorical evidence from our dataset for such regular out-of-sequence thrusting, or any cleardistinction between ‘primary’ and ‘secondary’ thrusts, how-ever uncertainties in the exact sequence of faulting should benoted as a possible source of error in the fault spacing mea-surements as a function of their spacing at initiation.[33] The average prism taper of the Makran, without the
effects of the Little Murray Ridge is 4.5�. This classes it as alow taper margin among global subduction zones, compara-ble to Southern-Central Lesser Antilles, Southern Hikurangiand Cascadia-Washington [Lallemand et al., 1994]. Accord-ing to Coulomb tapered wedge theory, the low taper of theMakran is likely to indicate either a weak basal surface, orhigh internal strength [Davis et al., 1983]. However, ana-logue models have suggested that accretionary prisms whichexperience very high sediment input may have mechanicaldifferences to classic Coulomb wedges and may be preventedfrom reaching the critical taper their basal friction wouldpredict, forming sub-critical wedges [Storti and McClay,1995]. Therefore the Makran may represent an example ofa sub-critical wedge which is actively deforming in responseto high levels of frontal accretion. This mechanism has alsobeen suggested for the Southern Hikurangi margin, whichexperiences a similarly low taper (4�) and high rates of frontalaccretion [Barnes et al., 2010].
4.2. Fault Activity Analysis
[34] Fault activity analysis indicates that much of the outerMakran accretionary prism is currently deforming, withstrain distributed over a �50 km wide region of the prism,and up to 9 imbricate thrusts. Our analysis suggests that agiven thrust in this environment will be continuously activeuntil approximately 30 km from the deformation front (3rd–4th thrust), when it will begin to experience periods of inac-tivity, and then will likely become fully inactive �50–60 kmfrom the deformation front. It is not possible here to establishthe activity of the onshore portion of the prism, though it hasbeen suggested that active folding and faulting also occurs inthis region [Farhoudi and Karig, 1977; Platt et al., 1988].Our analysis divides the outer prism into three zones acrossstrike, a seaward continuously active zone, a central inter-mittently active zone and a landward predominantly inactivezone (Figure 14). Detailed studies of fault activity in activeaccretionary prisms are relatively rare; however published
Table 2. Comparison of Structural Parameters Calculated for the Makran From This Study, With Published Data From Selected OtherMarginsa
Max Accreted SedimentThickness at Trench
(km)
Taper Values (�)
Average Fault Spacing(km)
SurfaceSlope(a)
BasementDip(b)
Taper(a + b)
Makran (this study) 6 2 (avg.) 1.5–2.5 (avg.) 3.5–4.5 6Southern-Central Lesser Antilles (13.5�N)
[Bangs et al., 1990]5 2 1 3 8
Hikurangi (South-Central) [Barnes et al., 2010] 2–4 1 3.0 4 5–6North Cascadia (Washington) [Adam et al., 2004] 2 2 1.8 3.8 6Hikurangi (North) [Barker et al., 2009] 0–1 3 8 11 �3 (frontal 3 thrusts)Nankai (Muroto) [Gulick et al., 2004] 0.7 1.5 1.6 3.1 4 [Ikari and Saffer, 2011]
aWhere fault spacing is ambiguous, spacing between thrust anticlines has been used.
SMITH ET AL.: THE MAKRAN ACCRETIONARY PRISM STRUCTURE B07407B07407
13 of 17

analysis of the Nankai Muroto 3D volume indicates thatthe majority of prism thrusts retain some level of activityseaward of the out-of-sequence thrust (�35 km from thedeformation front), with increased recent relief on the frontal5–6 thrusts [Gulick et al., 2004]. As a further example, in theonshore imbricate fault system of Taiwan, GPS data indicatethat maximum deformation is concentrated in a frontal zone�15 km wide, but that moderate deformation continuesacross the prism [Chang et al., 2003].[35] The thick input section of the Makran, the majority
of which is accreted, and the moderate convergence rate(�4 cm/yr) imply that frontal accretion rates will be high.This may require enhanced deformation across a widerregion of the prism relative to other margins. Diffuse faultactivity may also be a result of low basal friction: analoguemodels [Koyi et al., 2000] suggest that fold-thrust belts whichform over a low basal friction décollement are more proneto sustained activity over a broad region than those whichform over a high basal friction surface. It is also importantto consider the scale of the Makran subduction zone. At�400 km wide, it is the widest accretionary prism on earth,and therefore may be expected to have a wider active prismtoe than narrower prisms if the active prism occupies a cer-tain fraction of its total width. The division of the accretion-ary prism into three discrete zones of activity is similar towhat is produced by analogue models [e.g., Hardy et al.,1998; Lohrmann et al., 2003]. The intermittent activity ofthe central zone thrusts may be in response to changes inaccretion or sedimentation rate, for example an increase inthe rate of frontal accretion may trigger increased deforma-tion as the prism deforms to reach/maintain its critical taper[Lohrmann et al., 2003]. The reduction in fault activity in theeast of the study area may be due to increased sedimentblanketing (as observed from our MCS data), which has beensuggested by analogue models to inhibit fault reactivationthrough increasing the normal stress on the fault [Storti andMcClay, 1995; Hardy et al., 1998; Bigi et al., 2010]. Theproximity of the Murray Ridge triple junction and onshorestrike-slip systems may also act to reduce fault activity inthe east.
4.3. Response of the Décollement to SubductingBasement Topography
[36] The position of the décollement affects many aspectsof subduction zone dynamics [Moore, 1989; von Huene andScholl, 1991; Saffer and Bekins, 2006]. The proportion ofsediment subducted is important for global sediment budgetswhile the stratigraphic position of the décollement will affectits shear strength, and hence its development and seismo-genic behavior. For the majority of the E. Makran Subduc-tion Zone, the décollement is located within the sedimentsection, with along-strike variations in the thickness ofunderthrust sediment as shown in Figure 10. In the centralsection where the Little Murray Ridge intersects with thedeformation front, the décollement forms at the basement-sediment interface, accreting the entire (albeit thinner) sedi-ment section. As a result, 100% of the incoming sedimentis accreted in this region. The same phenomenon has beenobserved on the Central Hikurangi margin where the décol-lement position changes from within the sediment to thebasement-sediment interface where a seamount is beingsubducted [Barnes et al., 2010; Bell et al., 2010].
4.4. Implications for Décollement Properties and PrismMechanics
[37] The Makran can be characterized as a fluid and sedi-ment rich margin, supported by its low prism taper (4.5�),high sediment input (up to 7 km), and evidence for fluids.The identification of a BSR, fluid seeps, bubble plumes andregions of high backscatter in side scan sonar data (likelyseafloor carbonate crusts at cold seep sites) across the prismsuggest that although dewatering must be significant due tocompaction in the input section and accretion in the outer-most prism, significant fluid and fluid flux persist throughoutthe prism [Spiess et al., 2007; Ding et al., 2010]. These fluidsalso form mud volcanoes both offshore and onshore, sug-gesting a degree of overpressure [Schlüter et al., 2002].Velocity-porosity conversions along the Cam-30 Profile[Fruehn et al., 1997] showed no significant evidence foroverpressure in the incoming section, but increased porosityand slight inferred overpressure at depth landward of thedeformation front. Similar conclusions were reached byFowler et al. [1985] who noted from sonobuoy data that ahigh degree of tectonic consolidation occurs at the prism toe,where the incoming section is initially deformed. The nor-mally compacted nature of the incoming sediment section[Fruehn et al., 1997] may be due to the presence of perme-able layers in the sediment which facilitate vertical fluid lossand compaction, enhanced by the presence of widespreadnormal faults. It is important to note that overpressure mea-surements from velocity models are for the bulk sedimentvolume, and will therefore not resolve localized overpressurevariations at a discrete horizon (e.g., the décollement).[38] The potential effects of a thick sediment section,
such as in the Makran Subduction Zone, on pore pressuresare debated. On the one hand, thicker sediment is likely tosuggest a higher sedimentation rate, which could increasepore pressures if sedimentation rates prevent sufficientfluid expulsion, alongside reduced vertical permeabilitydue to increased drainage length [Saffer and Bekins, 2006].Conversely high sedimentation may indicate a higher pro-portion of coarser sediment, with likely increases in overallpermeability (although not necessarily vertically) and hencereduced pore pressure. It is likely that reduced verticalpermeability and insufficient fluid expulsion dominates, asmargins with thick incoming sections (e.g., Southern LesserAntilles, South Hikurangi) tend to be characterized by lowtaper angles indicative of high basal fluid pressures [Dahlenet al., 1984].[39] Low taper, fluid-rich subduction zone forearcs are
often inferred to have weak basal surfaces, commonly observedas high-amplitude, negative polarity décollement reflectorsin seismic data suggesting reduced bulk density, increasedporosity and likely increased pore fluid pressure [e.g.,Mooreet al., 1995; Zhao et al., 2000; Bangs et al., 2004]. Prism faultgeometry analysis of Kukowski et al. [2001] suggest thatthe décollement in the Makran is >3 times weaker than theoverlying prism sediments, however they also note that theslight observed overpressure [Fruehn et al., 1997] may onlyaccount for �30% of the inferred décollement weakness,with the remainder a function of lithology or fracturing. Theobserved overpressure may also be distributed through thelower sediment section, rather than being concentrated at aparticular interface (such as the décollement).
SMITH ET AL.: THE MAKRAN ACCRETIONARY PRISM STRUCTURE B07407B07407
14 of 17

[40] The décollement in the E Makran appears to be unre-flective in seismic reflection data across the study area, whichis unexpected considering other prism characteristics whichmay suggest a weak décollement. Kopp et al. [2000] pointout a high amplitude horizon deep in the input section in thewest of the study area on one seismic profile but this is alocalized feature and there is no clear indication that thisrepresents the pre-décollement horizon. High amplitude,negative polarity reflectors may either be indicative of adiscrete décollement horizon with specific properties, orbe due to an impedance contrast between the accreted andunderthrust sediment, and ordinarily these two cannot bedistinguished. On the Muroto Nankai transect fluid over-pressure and associated reduction in effective stress in theunderthrust section were observed from drilling and directsampling up to 20 km landward of the trench, in a regionof high décollement reflectivity in seismic data [Tobin andSaffer, 2009].[41] The high sediment velocities at the base of the Makran
sedimentary section [Fruehn et al., 1997; Kopp et al., 2000]may imply that there is an insufficient velocity contrastbetween the accreted and underthrust sediment to form acoherent reflector. The Makran has the thickest accretedsediment section of any accretionary margin, and it is there-fore difficult to compare with other localities in this respect,however, seismic reflection data from the Southern LesserAntilles accretionary prism (where the incoming section is�4 km thick) also show little velocity contrast betweenaccreted and underthrust sediment, though the reflectivity ofthe décollement here is unclear [Bangs et al., 1990]. How-ever, data from the Sumatran margin show similarly high(>4 km/s) velocities to the Makran in the lower sedimentsection, and do resolve a high amplitude, negative polaritybasal surface [Dean et al., 2010].[42] The Makran therefore represents an intriguing con-
tradiction between evidence for overpressure, and a weakbasal surface, with an unreflective décollement. Theseobservations might be explained by a weak décollementwhich is either fluid rich, but not producing a reflector in theMCS data, or not fluid rich, but weak due to other sedimentproperties which also do not produce a significant impedancecontrast. However, these explanations do not truly providean adequate explanation of the seismic properties observedwhen compared with other margins and data sets. Theseresults may instead be explained by a sub-critical taperwhich therefore may not reflect basal strength, and distrib-uted overpressure through the thick accreted sediment sec-tion, rather than at a discrete horizon. In this scenario thedécollement in the Makran may be stronger than expected.
4.5. Implications for Seismogenic Potential
[43] The high velocities (<4.4 km/s) observed in thedeepest sediments of the Makran accretionary prism mayindicate that the sediments at décollement level are suffi-ciently consolidated to support seismic rupture. These sedi-ment velocities are comparable to those seen at depth in thesouthern December 2004 Sumatra rupture area [Dean et al.,2010] where shallow/seaward rupture beneath the prism hasbeen suggested. As discussed above, the basal surface itselfmay also be stronger than expected, therefore increasing thepotential for seismogenic rupture beneath the outer forearc,with implications for tsunamigenesis. Our MCS data show
that the structures seen in this portion of the Makran are fairlyhomogenous along strike and show little evidence for largescale segmentation (although the basement topography of thesubducting Little Murray Ridge may affect the outermostprism). Integrating all evidence, it therefore seems reasonableto suggest that the low level of seismicity currently seen inthe Makran could be a reflection of a long recurrence intervalof plate interface earthquakes, and short historical record,rather than simply due to aseismic subduction, and that theremay be a significant seismogenic potential. The occurrenceof the 1945 and 1947 earthquakes, and reports of previoushistorical events [Byrne et al., 1992] emphasizes this point.This discussion illustrates how an increased knowledge ofthe Makran though a systematic, spatially extensive investi-gation of prism structure, can help to elucidate informationregarding seismogenic potential.
5. Conclusions
[44] 1. The structure of the Eastern Makran SubductionZone, with the exception of the region immediately overlyingthe Little Murray Ridge and other local variations, is con-sistent at a regional scale, with a relatively simple seawardverging, evenly spaced imbricate thrust structure. Despiteits high sediment input, the taper and fault spacing of theMakran are comparable to margins with significantly thinnerincoming and accreted sediment sections. The high accretedsediment thickness does not appear to affect fault spacing,suggesting that there may be an upper limit on fault spacingin imbricate thrust systems.[45] 2. Fault activity is distributed across up to 9 imbricate
thrusts (over a 50 km region) in the outer prism. The outerprism can be divided into three zones according to faultactivity: frontal continuous activity, central intermittentactivity and landward inactivity. These zones narrow to theeast with increasing proximity to the Murray Ridge and triplejunction, with only a single active thrust on the easternmostsurvey lines. These results suggest that deformation inaccretionary prisms may be more widely distributed thanpreviously suggested, especially at low taper/high sedimentinput margins.[46] 3. The average taper of the Makran accretionary prism
is low (�4.5�). This taper is likely to be a reflection of lowbasal strength and overpressured deep sediments; howeverthe Makran may also have developed as a sub-critical wedge,where the prism is actively deforming but unable to reach itscritical taper due to high rates of frontal accretion and sedi-ment input.[47] 4. The décollement is located within the lower sedi-
mentary unit (Unit A) except in the vicinity of the LittleMurray Ridge where it steps onto the top-basement horizon,accreting 100% of the incoming sediment section. Thedécollement is neither high amplitude nor negative polarity,which is surprising as reflective décollements have beenobserved in the seaward parts of several other accretionarymargins, particularly those with low taper and high sedimentinput, where they have been inferred to represent a weak,overpressured basal surface. Other evidence from theMakran(porosity –depth trends, mud volcanoes, low taper etc.) alsosupports a degree of overpressure and potentially weak basalsurface; however these observations may also be explainedin the context of a stronger décollement. If the Makran
SMITH ET AL.: THE MAKRAN ACCRETIONARY PRISM STRUCTURE B07407B07407
15 of 17

décollement is stronger than expected, then this may go someway to explaining the presence of historical seismicity in theoffshore prism, and have important implications for seismo-genic potential.[48] 5. This study is the first of its kind on the Makran
margin to examine accretionary prism deformation over alarge along-strike (�400 km) section and represents one ofonly a small number of systematic studies of active prismstructure over a large proportion of a single subductionmargin. Our results indicate how prism structure responds tosubducting basement features and sediment input, describesdistribution of deformation, and may be important for theassessment of seismogenic potential.
[49] Acknowledgments. The authors would like to thankWesternGeco for providing the seismic reflection data. We would also liketo thank the crew and scientists of Meteor Cruise 74 (Leg 2) for the collec-tion of the bathymetry data and allowing access to the data, and TimMinshull for helpful discussion. We thank Oliver Ralph for a useful prelim-inary analysis of the data. We thank the Associate Editor, and reviewers SeanGulick and Nini Kukowski for their helpful comments on the manuscript.
ReferencesAdam, J., D. Klaeschen, N. Kukowski, and E. Flueh (2004), Upwarddelamination of Cascadia Basin sediment infill with landward frontalaccretion thrusting caused by rapid glacial age material flux, Tectonics,23, TC3009, doi:10.1029/2002TC001475.
Ahmed, S. S. (1969), Tertiary geology of part of south Makran, Baluchistan,west Pakistan, AAPG Bull., 53(7), 1480–1499.
Bangs, N. L. B., G. K. Westbrook, J. W. Ladd, and P. Buhl (1990), Seismicvelocities from the Barbados Ridge Complex: Indicators of high porefluid pressures in an accretionary complex, J. Geophys. Res., 95(B6),8767–8782, doi:10.1029/JB095iB06p08767.
Bangs, N. L., T. H. Shipley, S. P. S. Gulick, G. F. Moore, S. Kuromoto, andY. Nakamura (2004), Evolution of the Nankai Trough décollement fromthe trench into the seismogenic zone: Inferences from three-dimensionalseismic reflection imaging, Geology, 32(4), 273–276, doi:10.1130/G20211.2.
Barker, D. H. N., R. Sutherland, S. Henrys, and S. Bannister (2009), Geom-etry of the Hikurangi subduction thrust and upper plate, North Island,New Zealand, Geochem. Geophys. Geosyst., 10, Q02007, doi:10.1029/2008GC002153.
Barnes, P. M., G. Lamarche, J. Bialas, S. Henrys, I. Pecher, G. L. Netzeband,J. Greinert, J. J. Mountjoy, K. Pedley, and G. Crutchley (2010), Tectonicand geological framework for gas hydrates and cold seeps on theHikurangi subduction margin, New Zealand, Mar. Geol., 272(1–4),26–48, doi:10.1016/j.margeo.2009.03.012.
Bell, R., R. Sutherland, D. H. N. Barker, S. Henrys, S. Bannister,L. Wallace, and J. Beavan (2010), Seismic reflection character of theHikurangi subduction interface, New Zealand, in the region of repeatedGisborne slow slip events, Geophys. J. Int., 180(1), 34–48, doi:10.1111/j.1365-246X.2009.04401.x.
Bigi, S., L. Di Paolo, L. Vadacca, and G. Gambardella (2010), Load andunload as interference factors on cyclical behavior and kinematics ofCoulomb wedges: Insights from sandbox experiments, J. Struct. Geol.,32(1), 28–44, doi:10.1016/j.jsg.2009.06.018.
Bourget, J., S. Zaragosi, S. Ellouz-Zimmermann, E. Ducassou, M. A. Prins,T. Garlan, V. Lanfumey, J. L. Schneider, P. Rouillard, and J. Giraudeau(2010), Highstand vs. lowstand turbidite system growth in the Makranactive margin: Imprints of high-frequency external controls on sedimentdelivery mechanisms to deep water systems, Mar. Geol., 274(1–4),187–208, doi:10.1016/j.margeo.2010.04.005.
Bourget, J., S. Zaragosi, N. Ellouz-Zimmermann, N. Mouchot, T. Garlan,J. L. Schneider, V. Lanfumey, and S. Lallemant (2011), Turbidite systemarchitecture and sedimentary processes along topographically complexslopes: The Makran convergent margin, Sedimentology, 58(2), 376–406,doi:10.1111/j.1365-3091.2010.01168.x.
Byrne, D. E., D. M. Davis, and L. R. Sykes (1988), Loci and maximum sizeof thrust earthquakes and the mechanics of the shallow region of subduc-tion zones, Tectonics, 7(4), 833–857, doi:10.1029/TC007i004p00833.
Byrne, D. E., L. R. Sykes, and D. M. Davis (1992), Great thrust earthquakesand aseismic slip along the plate boundary of the Makran SubductionZone, J. Geophys. Res., 97(B1), 449–478, doi:10.1029/91JB02165.
Chang, C. P., T. Y. Chang, J. Angelier, H. Kao, J. C. Lee, and S. B. Yu(2003), Strain and stress field in Taiwan oblique convergent system:
Constraints from GPS observation and tectonic data, Earth Planet. Sci.Lett., 214(1–2), 115–127, doi:10.1016/S0012-821X(03)00360-1.
Clift, P., C. Gaedicke, R. Edwards, J. I. Lee, P. Hildebrand, S. Amjad, R. S.White, and H. U. Schluter (2002), The stratigraphic evolution of the IndusFan and the history of sedimentation in the Arabian Sea, Mar. Geophys.Res., 23(3), 223–245, doi:10.1023/A:1023627123093.
Dahlen, F. A. (1990), Critical taper model of fold-and-thrust beltsand accretionary wedges, Annu. Rev. Earth Planet. Sci., 18, 55–99,doi:10.1146/annurev.ea.18.050190.000415.
Dahlen, F. A., J. Suppe, and D. Davis (1984), Mechanics of fold-and-thrustbelts and accretionary wedges: Cohesive Coulomb theory, J. Geophys.Res., 89(B12), 10,087–10,101, doi:10.1029/JB089iB12p10087.
Davis, D., J. Suppe, and F. A. Dahlen (1983), Mechanics of fold-and-thrustbelts and accretionary wedges, J. Geophys. Res., 88(B2), 1153–1172,doi:10.1029/JB088iB02p01153.
Dean, S. M., L. C. McNeill, T. J. Henstock, J. M. Bull, S. P. S. Gulick, J. A.Austin, N. L. B. Bangs, Y. S. Djajadihardja, and H. Permana (2010),Contrasting décollement and prism properties over the Sumatra2004–2005 earthquake rupture boundary, Science, 329(5988), 207–210,doi:10.1126/science.1189373.
DeMets, C., R. G. Gordon, D. F. Argus, and S. Stein (1990), Current platemotions, Geophys. J. Int., 101(2), 425–478, doi:10.1111/j.1365-246X.1990.tb06579.x.
Ding, F., V. Spiess, N. Fekete, B. Murton, M. Brüning, and G. Bohrmann(2010), Interaction between accretionary thrust faulting and slope sedi-mentation at the frontal Makran accretionary prism and its implicationsfor hydrocarbon fluid seepage, J. Geophys. Res., 115, B08106,doi:10.1029/2008JB006246.
Donato, S. V., E. G. Reinhardt, J. I. Boyce, J. E. Pilarczyk, and B. P. Jupp(2009), Particle-size distribution of inferred tsunami deposits in SurLagoon, Sultanate of Oman, Mar. Geol., 257(1–4), 54–64, doi:10.1016/j.margeo.2008.10.012.
Edwards, R. A., T. A. Minshull, and R. S. White (2000), Extension acrossthe Indian-Arabian plate boundary: The Murray Ridge, Geophys. J. Int.,142(2), 461–477, doi:10.1046/j.1365-246x.2000.00163.x.
Farhoudi, G., and D. E. Karig (1977), Makran of Iran and Pakistan asan active arc system, Geology, 5(11), 664–668, doi:10.1130/0091-7613(1977)5<664:MOIAPA>2.0.CO;2.
Fowler, S. R., R. S. White, and K. E. Louden (1985), Sediment dewateringin the Makran accretionary prism, Earth Planet. Sci. Lett., 75(4),427–438, doi:10.1016/0012-821X(85)90186-4.
Fruehn, J., R. S. White, and T. A. Minshull (1997), Internal deformationand compaction of the Makran accretionary wedge, Terra Nova, 9(3),101–104, doi:10.1046/j.1365-3121.1997.d01-13.x.
Fuller, C. W., S. D. Willett, and M. T. Brandon (2006), Formation of fore-arc basins and their influence on subduction zone earthquakes, Geology,34(2), 65–68, doi:10.1130/G21828.1.
Grando, G., and K. McClay (2007), Morphotectonics domains and struc-tural styles in the Makran accretionary prism, offshore Iran, Sediment.Geol., 196(1–4), 157–179, doi:10.1016/j.sedgeo.2006.05.030.
Grevemeyer, I., A. Rosenberger, and H. Villinger (2000), Natural gashydrates on the continental slope off Pakistan: Constraints from seismictechniques, Geophys. J. Int., 140(2), 295–310, doi:10.1046/j.1365-246x.2000.00009.x.
Gulick, S. P. S., N. L. B. Bangs, T. H. Shipley, Y. Nakamura, G. Moore,and S. Kuramoto (2004), Three-dimensional architecture of the Nankaiaccretionary prism’s imbricate thrust zone off Cape Muroto, Japan: Prismreconstruction via en echelon thrust propagation, J. Geophys. Res., 109,B02105, doi:10.1029/2003JB002654.
Gulick, S. P. S., J. A. Austin, L. C. McNeill, N. L. B. Bangs, K. M. Martin,T. J. Henstock, J. M. Bull, S. Dean, Y. S. Djajadihardja, and H. Permana(2011), Updip rupture of the 2004 Sumatra earthquake extended by thickindurated sediments, Nat. Geosci., 4, 453–456.
Gutscher, M. A., and G. K. Westbrook (2009), Great earthquakes in slow-subduction, low-taper margins, in Subduction Zone Geodynamics, editedby S. Lallemand and F. Funiciello, pp. 119–133, Springer, Berlin,doi:10.1007/978-3-540-87974-9_7.
Gutscher, M. A., N. Kukowski, J. Malavieille, and S. Lallemand (1996),Cyclical behavior of thrust wedges: Insights from high basal frictionsandbox experiments, Geology, 24(2), 135–138, doi:10.1130/0091-7613(1996)024<0135:CBOTWI>2.3.CO;2.
Hardy, S., C. Duncan, J. Masek, and D. Brown (1998), Minimum work,fault activity and the growth of critical wedges in fold and thrust belts,Basin Res., 10(3), 365–373, doi:10.1046/j.1365-2117.1998.00073.x.
Heidarzadeh, M., M. D. Pirooz, N. H. Zaker, A. C. Yalciner, M. Mokhtari,and A. Esmaeily (2008), Historical tsunami in the Makran SubductionZone off the southern coasts of Iran and Pakistan and results of numericalmodeling, Ocean Eng., 35(8–9), 774–786, doi:10.1016/j.oceaneng.2008.01.017.
SMITH ET AL.: THE MAKRAN ACCRETIONARY PRISM STRUCTURE B07407B07407
16 of 17

Henstock, T. J., L. C. McNeill, and D. R. Tappin (2006), Seafloor morphol-ogy of the Sumatran subduction zone: Surface rupture during megathrustearthquakes?, Geology, 34(6), 485–488, doi:10.1130/22426.1.
Hutchison, I., K. E. Louden, R. S. White, and R. P. Vonherzen (1981),Heat-flow and age of the Gulf of Oman, Earth Planet. Sci. Lett., 56,252–262, doi:10.1016/0012-821X(81)90132-1.
Hyndman, R. D., M. Yamano, and D. A. Oleskevich (1997), Theseismogenic zone of subduction thrust faults, Isl. Arc, 6(3), 244–260,doi:10.1111/j.1440-1738.1997.tb00175.x.
Ide, S., A. Baltay, and G. C. Beroza (2011), Shallow dynamic overshootand energetic deep rupture in the 2011 Mw 9.0 Tohoku-Oki earthquake,Science, 332(6036), 1426–1429, doi:10.1126/science.1207020.
Ikari, M. J., and D. M. Saffer (2011), Comparison of frictional strengthand velocity dependence between fault zones in the Nankai accretionarycomplex, Geochem. Geophys. Geosyst., 12, Q0AD11, doi:10.1029/2010GC003442.
Jacob, K. H., and R. C. Quittmeyer (1979), The Makran region ofPakistan and Iran: Trench-arc system with active plate subduction, inGeodynamics of Pakistan, pp. 305–317, Geol. Surv. of Pakistan, Quetta.
Kopp, H., and N. Kukowski (2003), Backstop geometry and accretionarymechanics of the Sunda margin, Tectonics, 22(6), 1072, doi:10.1029/2002TC001420.
Kopp, C., J. Fruehn, E. R. Flueh, C. Reichert, N. Kukowski, J. Bialas,and D. Klaeschen (2000), Structure of the Makran subduction zonefrom wide-angle and reflection seismic data, Tectonophysics, 329(1–4),171–191, doi:10.1016/S0040-1951(00)00195-5.
Koyi, H. A., K. Hessami, and A. Teixell (2000), Epicenter distributionand magnitude of earthquakes in fold-thrust belts: Insights fromSandbox Models, Geophys. Res. Lett., 27(2), 273–276, doi:10.1029/1999GL010833.
Kukowski, N., T. Schillhorn, E. R. Flueh, and K. Huhn (2000), Newlyidentified strike-slip plate boundary in the northeastern ArabianSea, Geology, 28(4), 355–358, doi:10.1130/0091-7613(2000)28<355:NISPBI>2.0.CO;2.
Kukowski, N., T. Schillhorn, K. Huhn, U. von Rad, S. Husen, and E. R.Flueh (2001), Morphotectonics and mechanics of the central Makranaccretionary wedge off Pakistan, Mar. Geol., 173(1–4), 1–19,doi:10.1016/S0025-3227(00)00167-5.
Lallemand, S. E., P. Schnurle, and J. Malavieille (1994), Coulomb theoryapplied to accretionary and nonaccretionary wedges: Possible causesfor tectonic erosion and or frontal accretion, J. Geophys. Res., 99(B6),12,033–12,055, doi:10.1029/94JB00124.
Le Pichon, X., P. Henry, and S. Lallemant (1993), Accretion and erosion insubduction zones: The role of fluids, Annu. Rev. Earth Planet. Sci., 21,307–331, doi:10.1146/annurev.ea.21.050193.001515.
Lohrmann, J., N. Kukowski, J. Adam, and O. Oncken (2003), The impact ofanalogue material properties on the geometry, kinematics, and dynamicsof convergent sand wedges, J. Struct. Geol., 25(10), 1691–1711,doi:10.1016/S0191-8141(03)00005-1.
McAdoo, B. G., M. K. Capone, and J. Minder (2004), Seafloor geo-morphology of convergent margins: Implications for Cascadia seismichazard, Tectonics, 23, TC6008, doi:10.1029/2003TC001570.
Minshull, T., and R. White (1989), Sediment compaction and fluidmigration in the Makran accretionary prism, J. Geophys. Res., 94(B6),7387–7402, doi:10.1029/JB094iB06p07387.
Moore, J. C. (1989), Tectonics and hydrogeology of accretionary prisms:Role of the decollement zone, J. Struct. Geol., 11(1–2), 95–106,doi:10.1016/0191-8141(89)90037-0.
Moore, J. C., and D. Saffer (2001), Updip limit of the seismogeniczone beneath the accretionary prism of southwest Japan: An effect ofdiagenetic to low-grade metamorphic processes and increasing effec-tive stress, Geology, 29(2), 183–186, doi:10.1130/0091-7613(2001)029<0183:ULOTSZ>2.0.CO;2.
Moore, J. C., and P. Vrolijk (1992), Fluids in accretionary prisms, Rev.Geophys., 30(2), 113–135, doi:10.1029/92RG00201.
Moore, J. C., G. F. Moore, G. R. Cochrane, and H. J. Tobin (1995),Negative-polarity seismic reflectors along faults of the Oregon Accre-tionary Prism: Indicators of overpressuring, J. Geophys. Res., 100(B7),12,895–12,906, doi:10.1029/94JB02049.
Mouchot, N., L. Loncke, G. Mahieux, J. Bourget, S. Lallemant, N. Ellouz-Zimmermann, and P. Leturmy (2010), Recent sedimentary processesalong the Makran trench (Makran active margin, off Pakistan), Mar.Geol., 271(1–2), 17–31, doi:10.1016/j.margeo.2010.01.006.
Mountain, G. S., and W. L. Prell (1990), A multiphase plate tectonic historyof the southeast continental margin of Oman, in Geology and Tectonics ofthe Oman Region, Geol. Soc. Spec. Publ., 49, 725–743.
Park, J. O., T. Tsuru, S. Kodaira, P. R. Cummins, and Y. Kaneda (2002),Splay fault branching along the Nankai subduction zone, Science,297(5584), 1157–1160, doi:10.1126/science.1074111.
Platt, J. P., J. K. Leggett, J. Young, H. Raza, and S. Alam (1985), Large-scale sediment underplating in the Makran accretionary prism, southwestPakistan, Geology, 13(7), 507–511, doi:10.1130/0091-7613(1985)13<507:LSUITM>2.0.CO;2.
Platt, J. P., J. K. Leggett, and S. Alam (1988), Slip vectors and faultmechanics in the Makran accretionary wedge, southwest Pakistan,J. Geophys. Res., 93(B7), 7955–7973, doi:10.1029/JB093iB07p07955.
Rani, V. S., K. Srivastava, D. Srinagesh, and V. P. Dimri (2011), Spatialand temporal variations of b-value and fractal analysis for the Makranregion, Mar. Geod., 34(1), 77–82, doi:10.1080/01490419.2011.547804.
Saffer, D. M., and B. A. Bekins (2006), An evaluation of factors influencingpore pressure in accretionary complexes: Implications for taper angle andwedge mechanics, J. Geophys. Res., 111, B04101, doi:10.1029/2005JB003990.
Schlüter, H. U., A. Prexl, C. Gaedicke, H. Roeser, C. Reichert, H. Meyer,and C. von Daniels (2002), The Makran accretionary wedge: Sedimentthicknesses and ages and the origin of mud volcanoes, Mar. Geol.,185(3–4), 219–232, doi:10.1016/S0025-3227(02)00192-5.
Spiess, V., L. Baumann, M. Bruning, and G. Collins (2007), Cold seepsof the Makran subduction zone (continental margin of Pakistan), CruiseNo. 74, Leg 2, Meteor Rep., 10-3, Univ. Bremen, Bremen, Germany.
Storti, F., and K. McClay (1995), Influence of syntectonic sedimentation onthrust wedges in analog models,Geology, 23(11), 999–1002, doi:10.1130/0091-7613(1995)023<0999:IOSSOT>2.3.CO;2.
Strasser, M., G. F. Moore, G. Kimura, A. J. Kopf, M. B. Underwood,J. Guo, and E. J. Screaton (2011), Slumping and mass transport depo-sition in the Nankai fore arc: Evidence from IODP drilling and 3-Dreflection seismic data, Geochem. Geophys. Geosyst., 12, Q0AD13,doi:10.1029/2010GC003431.
Tirrul, R., I. R. Bell, R. J. Griffis, and V. E. Camp (1983), The Sistan suturezone of eastern Iran, Geol. Soc. Am. Bull., 94(1), 134–150, doi:10.1130/0016-7606(1983)94<134:TSSZOE>2.0.CO;2.
Tobin, H. J., and D. M. Saffer (2009), Elevated fluid pressure and extrememechanical weakness of a plate boundary thrust, Nankai Trough subduc-tion zone, Geology, 37(8), 679–682, doi:10.1130/G25752A.1.
von Huene, R., and D. W. Scholl (1991), Observations at convergentmargins concerning sediment subduction, subduction erosion, and thegrowth of continental crust, Rev. Geophys., 29(3), 279–316, doi:10.1029/91RG00969.
von Rad, U., et al. (2000), Gas and fluid venting at the Makran accretionarywedge off Pakistan, Geo Mar. Lett., 20(1), 10–19, doi:10.1007/s003670000033.
White, R. S. (1979), Deformation of the Makran continental margin, inGeodynamics of Pakistan, pp. 295–304, Geol. Surv. of Pakistan, Quetta.
White, R. S. (1982), Deformation of the Makran accretionary sedimentprism in the Gulf of Oman (north-west Indian Ocean), Geol. Soc. LondonSpec. Publ., 10, 357–372, doi:10.1144/GSL.SP.1982.010.01.24.
White, R. S. (1983), The Little Murray Ridge, in Seismic Expression ofStructural Styles, Stud. in Geol., vol. 15, pp. 1.3.10–1.3.23, edited byA. W. Bally, Am. Assoc. of Pet. Geol., Tulsa, Okla.
White, R. S., and K. E. Loudon (1982), The Makran continental margin:Structure of a thickly sedimented convergent plate boundary, in Studiesin Continental Margin Geology, AAPG Mem., 34, 499–518.
White, R. S., and D. A. Ross (1979), Tectonics of the westernGulf of Oman, J. Geophys. Res., 84(B7), 3479–3489, doi:10.1029/JB084iB07p03479.
Whitmarsh, R. B. (1979), Owen Basin off the southeast margin of Arabiaand the evolution of the Owen fracture zone, Geophys. J. R. Astron.Soc., 58(2), 441–470, doi:10.1111/j.1365-246X.1979.tb01034.x.
Wiedicke, M., S. Neben, and V. Spiess (2001), Mud volcanoes at the frontof the Makran accretionary complex, Pakistan, Mar. Geol., 172(1–2),57–73, doi:10.1016/S0025-3227(00)00127-4.
Willett, S., C. Beaumont, and P. Fullsack (1993), Mechanical model forthe tectonics of doubly vergent compressional orogens, Geology, 21(4),371–374, doi:10.1130/0091-7613(1993)021<0371:MMFTTO>2.3.CO;2.
Zhao, Z. Y., G. F. Moore, N. L. B. Bangs, and T. H. Shipley (2000), Spatialvariations of the decollement/protodecollement zone and their implica-tions: A 3-D seismic inversion study of the northern Barbados accretionaryprism, Isl. Arc, 9(2), 219–236, doi:10.1046/j.1440-1738.2000.00274.x.
SMITH ET AL.: THE MAKRAN ACCRETIONARY PRISM STRUCTURE B07407B07407
17 of 17