The Structural Design of Tall and Special Buildings (Wiley)
13
Comparison of nonlinear behavior of steel moment frames accompanied with RC shear walls or steel bracings Hamed Esmaeili 1 * ,† , Ali Kheyroddin 1 , Mohammad Ali Ka 1 and Hamed Nikbakht 2 1 Faculty of Civil Engineering, Semnan University, Semnan, Iran 2 Department of Civil Engineering, Sharif University of Technology, Tehran, Iran SUMMARY In this paper, the seismic behavior of dual structural systems in forms of steel moment-resisting frames accom- panied with reinforced concrete shear walls and steel moment-resisting frames accompanied with concentrically bra ced fra mes , hav e bee n stu di ed. The non lin ear beh avi or of the men ti one d str uct ura l sys tem s has bee n eva lua ted as, in earthquakes, structures usually enter into an inelastic behavior stage and, hence, the applied energy to the structures will be dissipated. As a result, some parameters such as ductility factor of structure (m), over-strength factor ( R s ) and response modi cation factor ( R) for the mentioned structures have been under assessment. To achi eve these objec tive s, 30-st ory build ings contain ing such structur al syst ems were used to perfor m the pushover analyses having different load patterns. Analytical results show that the steel moment-resisting frames accompanied with reinforced concrete shear walls system has higher ductility and response modi cation factor than the other one, and so, it is observed to achieve suita ble seismic performanc e; using the rst system can have more advantages than the second one. Copyright © 2011 John Wiley & Sons, Ltd. Received 2 August 2011; Accepted 3 November 2011 KEYWORDS: dual syste m; stee l mome nt-r esis ting fra me; shea r wall ; stee l brac ing; rei nfor ced conc rete; seis mic beha vior 1. INTRODUCTION As extensive areas in Iran, especially the populated cities, are located on the critical seismic zones and they have high vulnerab ility to destruction, the study of seismic behavior of structural systems is of great importance. Today, reinforced concrete (RC) shear walls or steel bracings are used widespread as a main load-carrying system in tall buildings, for different reasons such as increase of energy dissipation and its ability to resist lateral displacements of tall buildings that have moment-resisting frames. Therefore, the recognition of the seismic behavior of the dual structural systems and guring out their advantages can be helpful to structural engineers in selecting a proper system for structures that are being designed. Studying the behavior of building structures as subjected to severe earthquake ground motions reveals that this type of structures can exhibit enough strength, due to the nonlinear behavior of materials and p ossibil ity of suf ci ent def ormati ons of the str uc tures. The se struc tures abs orb the app li ed ene rgy and will dissipate it via tolerating great displacements in nonlinear seismic behavior. Nonlinear time history analysis of a detailed analytical model is perhaps the best option for the estimation of deformation demands. However, because of many uncertaint ies associ ated with the site-specic excitation as well as uncertainties in the parameters of analytical models, in many cases, the effort associated with detailed modeling and analysis may not be justi ed and feasible (Hajirasoul iha and Doostan, 2010). In current years, nonlinear static analyses have earned a great deal of research attention within the earthquake engineering community. Their main purpose is to demonstrate the nonlinear capacity of a structure when subjected to horizontal loading with a reduced computational attempt with respect *Correspondence to: Hamed Esmaeili, Faculty of Civil Engineering, Semnan University, Semnan, Iran. † E-mail: H_Esmaeili@su n.semnan.ac.ir THE STRUCTURAL DESIGN OF TALL AND SPECIAL BUILDINGS Struct. Design Tall Spec. Build. (2011) Published online in Wiley Online Library (wileyonlinelibrary.com). DOI: 10.1002/tal.751 Copyright © 2011 John Wiley & Sons, Ltd.
-
Upload
hamed-nikbakht -
Category
Documents
-
view
227 -
download
0
Transcript of The Structural Design of Tall and Special Buildings (Wiley)
8102019 The Structural Design of Tall and Special Buildings (Wiley)
httpslidepdfcomreaderfullthe-structural-design-of-tall-and-special-buildings-wiley 113
Comparison of nonlinear behavior of steel moment framesaccompanied with RC shear walls or steel bracings
Hamed Esmaeili1dagger Ali Kheyroddin1 Mohammad Ali Ka 10472971 and Hamed Nikbakht 2
1Faculty of Civil Engineering Semnan University Semnan Iran2 Department of Civil Engineering Sharif University of Technology Tehran Iran
SUMMARY
In this paper the seismic behavior of dual structural systems in forms of steel moment-resisting frames accom-panied with reinforced concrete shear walls and steel moment-resisting frames accompanied with concentricallybraced frames have been studied The nonlinear behavior of the mentioned structural systems has been evaluatedas in earthquakes structures usually enter into an inelastic behavior stage and hence the applied energy to thestructures will be dissipated As a result some parameters such as ductility factor of structure (m) over-strength
factor ( Rs) and response modi1047297cation factor ( R) for the mentioned structures have been under assessment Toachieve these objectives 30-story buildings containing such structural systems were used to perform thepushover analyses having different load patterns Analytical results show that the steel moment-resisting framesaccompanied with reinforced concrete shear walls system has higher ductility and response modi1047297cation factor than the other one and so it is observed to achieve suitable seismic performance using the 1047297rst system can havemore advantages than the second one Copyright copy 2011 John Wiley amp Sons Ltd
Received 2 August 2011 Accepted 3 November 2011
KEYWORDS dual system steel moment-resisting frame shear wall steel bracing reinforced concrete seismic behavior
1 INTRODUCTION
As extensive areas in Iran especially the populated cities are located on the critical seismic zones and
they have high vulnerability to destruction the study of seismic behavior of structural systems is of great
importance Today reinforced concrete (RC) shear walls or steel bracings are used widespread as a main
load-carrying system in tall buildings for different reasons such as increase of energy dissipation and its
ability to resist lateral displacements of tall buildings that have moment-resisting frames Therefore the
recognition of the seismic behavior of the dual structural systems and 1047297guring out their advantages can
be helpful to structural engineers in selecting a proper system for structures that are being designed
Studying the behavior of building structures as subjected to severe earthquake ground motions
reveals that this type of structures can exhibit enough strength due to the nonlinear behavior of materials
and possibility of suf 1047297cient deformations of the structures These structures absorb the applied energy and
will dissipate it via tolerating great displacements in nonlinear seismic behavior
Nonlinear time history analysis of a detailed analytical model is perhaps the best option for theestimation of deformation demands However because of many uncertainties associated with the
site-speci1047297c excitation as well as uncertainties in the parameters of analytical models in many cases
the effort associated with detailed modeling and analysis may not be justi1047297ed and feasible (Hajirasouliha
and Doostan 2010)
In current years nonlinear static analyses have earned a great deal of research attention within the
earthquake engineering community Their main purpose is to demonstrate the nonlinear capacity of
a structure when subjected to horizontal loading with a reduced computational attempt with respect
Correspondence to Hamed Esmaeili Faculty of Civil Engineering Semnan University Semnan IrandaggerE-mail H_Esmaeilisunsemnanacir
THE STRUCTURAL DESIGN OF TALL AND SPECIAL BUILDINGSStruct Design Tall Spec Build (2011)Published online in Wiley Online Library (wileyonlinelibrarycom) DOI 101002tal751
Copyright copy 2011 John Wiley amp Sons Ltd
8102019 The Structural Design of Tall and Special Buildings (Wiley)
httpslidepdfcomreaderfullthe-structural-design-of-tall-and-special-buildings-wiley 213
to nonlinear dynamic analyses Pushover methods are particularly shown for assessing existing structures
(frequently not originally designed with seismic criteria in mind) when the employment of linear elastic
methods typical in new design situations tends to be unsuitable For these goals many codes and guidelines
(eg Eurocode 8 2005 ATC-40 1996 FEMA-356 2000) propose the use of nonlinear static methodolo-
gies to evaluate structural behavior under seismic movement (Ferracuti et al 2009) To assess the seismic
performance of the structures three various nonlinear static analyses are used each of which contains a
constant load pattern These approaches are pushover analyses with load patterns proportionate to uniform and reverse triangular displacements of structures and modal pushover analysis (MPA)
2 REVIEW OF THE LATEST RESEARCHES
In general numerous studies in forms of analytical and experimental works have been implemented on
the mentioned structural systems Most important results of which are as follows
A series of experimental programs including two-story specimens was developed to recognize the
cyclic behavior of the composite structural systems This study shows that the lateral shear force tolerate
via compressive strut of wall and shear studs (Tong 2001)
Tong et al (2005) presented an experimental study on the cyclic behavior of a composite structural
system consisting of partially restrained steel frames with RC in1047297
ll walls The one-bay two-story test specimen was built at one-third scale The study shows that this system has the potential to offer
strength appropriate for resisting the forces from earthquakes and stiffness adequate for controlling
drift for low-rise to moderate-rise buildings located in earthquake-prone regions
As a basis of many studies structural frames with in1047297ll panels are typically providing an ef 1047297cient
method for bracing buildings (Jung and Aref 2005) The presence of in1047297lls can also have a signi1047297cant
effect on the energy dissipation capacity (Decanini et al 2002)
In common practice steel bracing system is used to increase the lateral load resistance of steel struc-
tures Steel moment-resisting frame structures possess high strength and signi1047297cant ductility thus are
effective structural forms for earthquake-resistant designs However the load-carrying ef 1047297ciency of
such designs is limited when an earthquake induces large story drift because of the lower structural
stiffness of the steel frames (Hsu et al 2011)
Over-strength ductility and response modi1047297cation factors of buckling-restrained braced frames
were evaluated by Asgarian and Shokrgozar (2009) To do so buildings with various stories and
different bracing con1047297gurations including diagonal split X and chevron (V and inverted V) bracings
were considered In this article seismic response modi1047297cation factor for each of bracing systems has
been determined separately and tentative values of 835 and 12 has been suggested for ultimate limit
state and allowable stress design methods respectively
The over-strength ductility and response modi1047297cation factors of special concentric braced frames
and ordinary concentric braced frames were evaluated by performing pushover analysis of model
structures with various stories and span lengths (Kim and Choi 2005) The results were compared with
those from nonlinear incremental dynamic analyses The results of incremental dynamic analysis
generally matched well with those obtained from pushover analysis
A signi1047297cant aspect in the design of steel braced RC frames is the level of interaction between the
strength capacities of the RC frame and the bracing system Maheri and Ghaffarzadeh (2008)
conducted an experimental and numerical investigation to evaluate the level of capacity interactionbetween the two systems It was found that the capacity interaction is primarily due to the connections
over-strength and also the number of braced bays and the number of frame stories recognized
3 SEISMIC BEHAVIOR OF STRUCTURES
31 The ductility of structures
As a general rule it is possible to replace the ideal bilinear elasto-plastic diagrams with the base
shear ndashdisplacement curves of structures (Figure 1) The ductility factor in single degree-of-freedom
H ESMAEILI ET AL
Copyright copy 2011 John Wiley amp Sons Ltd Struct Design Tall Spec Build (2011)
DOI 101002tal
8102019 The Structural Design of Tall and Special Buildings (Wiley)
httpslidepdfcomreaderfullthe-structural-design-of-tall-and-special-buildings-wiley 313
(SDOF) systems is a proportion of maximum lateral displacement to the yielding lateral displacement
of structures
m frac14Δmax
Δy
(1)
In fact the ductility factor explains to what extent the structure enters when in nonlinear state There is
no accurate de1047297nition for the ductility factor of multiple degrees-of-freedom structures In some provi-sions yielding is assumed to have been simultaneous although not precise (Wakabayashi 1986) Mean-
while the relation between the base shear and displacement is not an elasticndashperfectly plastic equation
With consideration to Figure 1 an idealization in de1047297nition of the ductility factor is accepted
32 Response modi 1047297cation factor
Seismic codes consider a reduction in design loads taking advantage of the fact that the structures
possess signi1047297cant reserve strength (over-strength) and capacity to dissipate energy (ductility) The
over-strength and the ductility are incorporated in structural design through a force reduction or a
response modi1047297cation factor This factor represents ratio of maximum seismic force on a structure
during speci1047297ed ground motion if it was to remain elastic to the design seismic force Thus actual
seismic forces are reduced by the factor lsquo Rrsquo to obtain design forces The basic 1047298aw in code procedures
is that they use linear methods but rely on nonlinear behavior (Kim and Choi 2005)As it is shown in Figure 1 usually real nonlinear behavior is idealized by a bilinear elasto ndashperfectly
plastic relation The yield force of structure is shown by V y and the yield displacement is Δy In this
1047297gure V e or V max correspond to the elastic response strength of the structure The maximum base shear
in an elasto perfectly behavior is V y (Uang 1991) The ratio of maximum base shear considering elastic
behavior V e to maximum base shear in elasto perfectly behavior Vy is called force reduction factor
Rm frac14V e
V y(2)
The over-strength factor is de1047297ned as the ratio of maximum base shear in actual behavior V y to the 1047297rst
signi1047297cant yield strength in structure V s
RS frac14
V y
V s (3)
To design for allowable stress method the design codes decrease design loads from V s to V w This
decrease is done by allowable stress factor which is de1047297ned as (Asgarian and Shokrgozar 2009)
Figure 1 General structure response (Uang 1991)
COMPARISON OF NONLINEAR BEHAVIOR OF STEEL MOMENT FRAMES
Copyright copy 2011 John Wiley amp Sons Ltd Struct Design Tall Spec Build (2011)
DOI 101002tal
8102019 The Structural Design of Tall and Special Buildings (Wiley)
httpslidepdfcomreaderfullthe-structural-design-of-tall-and-special-buildings-wiley 413
Y frac14V S
V W(4)
The response modi1047297cation factor therefore accounts for the ductility and over-strength of the structure
and for the difference in the level of stresses considered in its design It is generally expressed in the
following form taking into accounts the aforementioned conceptions (Asgarian and Shokrgozar 2009)
R frac14V e
V Wfrac14
V e
V y
V y
V S
V S
V Wfrac14 Rm RS Y (5)
33 The relation between the force reduction factor the ductility factor and the period of structure
The force reduction factor ( Rm) is related to many parameters of which many are correlated to character-
istics of the structural system and some of them are independent from the structure and are related to the
other parameters such as respected loading (the time history of earthquake) Rm will be correlated to a set
of factors especially the ductility factor of structure and its performance characteristics in the nonlinear
state if we consider a speci1047297c earthquake for a particular place Therefore the 1047297rst step in determining
force reduction factor is specifying the relation between it and the capacity of the ductility of structure
Multiple factors are known that af 1047298uence on the relation between Rm and m such as materials period of
system damping PΔ effects the loadndashdeformation model in the hysteresis loops and type of the soil
that exists in the site If we consider this assumption that the ductility in the structures with short period is
the same as those that have longer periods then smaller Rm is obtained Also New Mark and Hall (1982)
suggested the following equations for calculation of the force reduction factor of structures
Rm frac14 1 T lt 0125 s(6)
Rm frac14 ffiffiffiffiffiffiffiffiffiffiffiffiffiffi 2m 1
p 0
125 s lt
T lt
0
5 s (7)
Rm frac14 m 05 s lt T (8)
34 The conversion coef 1047297cient of linear to nonlinear displacement (C d)
It rsquos clear that the structural damages are normally originated from excessive deformations of the
structure Therefore with regard to the effective parameters on seismic design of a structure the
discussion about assessment and accurate prediction of displacement and monitoring of them are the
most important aims in seismic design of a structure The C d coef 1047297cient can be calculated as follows
C d frac14Δmax
ΔS
frac14Δmax
Δy
Δy
Δs
frac14 m Rs (9)
4 DESIGN OF THE STRUCTURAL MODELS IN THIS STUDY
In this study two structural models are used for specifying the trend of this research de1047297nes
as follows
H ESMAEILI ET AL
Copyright copy 2011 John Wiley amp Sons Ltd Struct Design Tall Spec Build (2011)
DOI 101002tal
8102019 The Structural Design of Tall and Special Buildings (Wiley)
httpslidepdfcomreaderfullthe-structural-design-of-tall-and-special-buildings-wiley 513
(1) Model A A 30-story building in the form of special steel moment-resisting frame accompanied
with special RC shear wall
(2) Model B A 30-story building in the form of special steel moment-resisting frame accompanied
with concentrically steel braced frames (X-braces)
The height of the all stories is 35 m Both of them have a residential application Therefore a 1047298oor
dead load an equivalent partition load and a live load for each story of values 200 kgm 2 650 kgm 2
and 150 kgm 2 (1961 Nm 2 6374 Nm 2 and 1471 Nm 2) respectively are applied Also the structural
system of the 1047298oor is composite of RC slabs and steel secondary beams The steel material used in the
sections of the structural members is of ST37 type with yielding strength of 2400 kgcm 2
(235 359 600 Nm 2) and ultimate strength of 3700 kgcm 2 (362 846 050 Nm 2) The compressive
strength of concrete material f primec used in the shear walls is 300 kgcm 2 (29419 950 Nm 2) American
Institute of Steel Construction Speci1047297cation (AISC 2005) and American Concrete Institute Requirements
(ACI Committee 318 2008) were used to design steel members and shear wall respectively Also in
order to calculate earthquake load the spectrum dynamic method was used The equation suggested by
Kheyroddin (2006) was used to determine the thickness and the number of required shear walls
rmin frac14
hw
l w
2
835thorn 205 hw
l w
(10)
In which rmin is the minimum wall-area-to-story-area ratio hW is the total wall height and l W is the wall
length (average shear wall lengths present in building plan)
The plans of the structures the direction of the girders and secondary beams and the location of
shear walls and bracings are shown in Figures 2 and 3 In the design process of these structures it
has been tried that moment frame members tolerate 25 of earthquake forces in addition to bearing
gravity load The thicknesses of the shear walls for each story are shown in Table 1 and the sizes
of the steel braces for each story are shown in Table 2 With regard to the design of the structures
box-shaped and I-shaped sections are obtained for section area of columns and beams respectively
5 NONLINEAR ANALYSIS
51 Existing pushover analysis methods
During a pushover analysis a frame structure is subjected to gravitational loads and horizontal loads
applied at each story with the latter being incremented up to failure Ideally the distribution of horizon-
tal loads should approximate the inertia forces that are generated in the structure during an earthquake
Conventional pushover procedures adopt an invariant load pattern during the analysis and according to
a number of codes and guidelines at least two different force distributions must be considered uniform
and proportional to the 1047297rst modal shape The invariant load pattern is one of the most signi1047297cant
limitations of traditional methods because the actual inertia force distribution changes continuously
during seismic events as a result of higher mode contribution and structural degradation which modi1047297es
the stiffness of individual structural elements and consequently of the structure as a whole
A procedure that proposed by Chopra and Goel (2003) is MPA whereby a series of independent
pushover analyses are carried out considering different horizontal load patterns for each modal shapeAccording to the authors it is suf 1047297cient to consider the 1047297rst two or three modal shapes Results in terms
of capacity curves for various modal shapes are transformed in capacity curves for equivalent SDOFs
one for each mode Seismic demands are separately evaluated for each SDOF and 1047297nally combined by
the square-root-of-the-sum-of-the-squares method A common drawback of this method is the mode
superposition of results obtained from nonlinear pushover analyses carried out separately for various
modes The method neglects the interaction amongst the modes with modal superposition being
performed just as in elastic modal analysis Accordingly capacity curves typically overestimate base
shear values (Hernandez-Montes et al 2004)
On the basis of an analytical work that is conducted by Mortezaei et al (2009) it is shown that non-
linear static procedures based on invariant load vectors using elastic modal properties cannot capture
COMPARISON OF NONLINEAR BEHAVIOR OF STEEL MOMENT FRAMES
Copyright copy 2011 John Wiley amp Sons Ltd Struct Design Tall Spec Build (2011)
DOI 101002tal
8102019 The Structural Design of Tall and Special Buildings (Wiley)
httpslidepdfcomreaderfullthe-structural-design-of-tall-and-special-buildings-wiley 613
Figure 2 The structural plan of the model A
Figure 3 The structural plan of the model B
Table 1 The thickness of the shear walls in the Model A
Story 1ndash2 3ndash6 7ndash9 10ndash12 13ndash15 16ndash18 19ndash21 22ndash24 25ndash27 28ndash30
Thickness (mm) 650 600 500 500 450 400 350 300 250 200
Table 2 The sizes of the steel braces in the Model B
Story 1ndash2 3ndash6 7ndash9 10ndash12 13ndash15 16ndash21 22ndash24 25ndash27 28ndash30
Sizes of braces 2UNP300 2UNP280 2UNP260 2UNP240 2UNP220 2UNP200 2UNP180 2UNP160 2UNP140
H ESMAEILI ET AL
Copyright copy 2011 John Wiley amp Sons Ltd Struct Design Tall Spec Build (2011)
DOI 101002tal
8102019 The Structural Design of Tall and Special Buildings (Wiley)
httpslidepdfcomreaderfullthe-structural-design-of-tall-and-special-buildings-wiley 713
the changes to the dynamic modes resulting from inelastic action The variation of inertial forces must
be considered in static procedures that attempt to reproduce inelastic dynamic response
52 Nonlinear modeling of the structures
In order to assess the seismic behavior of selected buildings we have conducted a series of nonlinear
static analysis The designed structures have been used by importing into PERFORM-3D (Computers and
Structures Inc 2006a) software to create a nonlinear model After a preliminary design of the struc-tures the nonlinear model of the following elements forcendashdeformation relationship and deformation
capacities in PERFORM-3D has been developed There are a number of different ways to model inelastic
beams and columns in PERFORM At one extreme are 1047297nite element models using 1047297ber sections At the
other extreme are chord rotation models that consider the member as a whole and essentially requires
one to specify only the relationship between end moment and end rotation In between these extremes
are a number of other models In this study the chord rotation model for beams and columns has been
selected The basic model is shown in Figure 4 This is a symmetrical beam with equal and opposite
end moments and no loads along the beam length To use this model one has to specify the nonlinear
relationship between the end moment and end rotation An advantage of this model is that FEMA-356
gives speci1047297c properties including end rotation capacities (Mohammadjafari and Jalali 2009)
Figure 5 shows a PERFORM frame compound component for the chord rotation model The key parts of
this model are the FEMA beam components These are 1047297nite length components with nonlinear proper-ties The model has two of these components for cases where the strengths are different at the two ends of
element PERFORM allows user to specify different strength for two components and also different lengths
to consider cases where the in1047298ection point is not at mid-span (Mohammadjafari and Jalali 2009)
For modeling the braces the Simplr Bar element is used and parameters in Tab 5ndash6 of FEMA-356 are
implemented to model this element in the software An example of the FndashD relationship of Simplr Bar
element is shown in Figure 6
To make the RC shear wall sections de1047297ning the linear and nonlinear characteristics of its materials
(concrete and steel bar) are necessary
As it is shown in Figure 7 the stressndashstrain curve of concrete is selected in the form of trilinear with
strain hardening and its tension strength is ignored The modulus of elasticity E C is assumed to be
Figure 4 Chord rotation model
Figure 5 Basic components for chord rotation FEMA Federal Emergency Management Agency
Figure 6 Modeling of the behavior of bracing in PERFORM
COMPARISON OF NONLINEAR BEHAVIOR OF STEEL MOMENT FRAMES
Copyright copy 2011 John Wiley amp Sons Ltd Struct Design Tall Spec Build (2011)
DOI 101002tal
8102019 The Structural Design of Tall and Special Buildings (Wiley)
httpslidepdfcomreaderfullthe-structural-design-of-tall-and-special-buildings-wiley 813
261 540 kgcm 2 (2561010 Nm 2) The strain of ultimate strength of concrete eL is taken 0003
(Kheyroddin 2008) and the strain of crushing limit of concrete eCU is taken 0005 As it is seen in
Figure 7 the strain of yielding strength of concrete eY is taken 0002 then the ratio of initial modulus
of elasticity to secondary modulus of elasticity is speci1047297ed to 0402
The stressndashstrain relationship of steel bar is supposed to be bilinear (elasticndashperfectly plastic) The
modulus of elasticity E S is taken 2 100 000 kgcm 2 (2061011Nm 2) and the ultimate strain eSU
is taken 005 (Kheyroddin 2008) Also its yielding strength F Y is 4000 kgcm 2 (392 266 000 Nm 2)
53 Nonlinear analysis of the models
In this study three nonlinear static analysis approaches are used for each model which are described in
the following So six pushover analyses have been performed The center of mass at the roof level is
selected as a control point of the displacement of structure in all analysis Thus the relative lateral
displacement (drift) of the roof is used as a reference relative to lateral displacement for plotting the
capacity curves of the structures and for interpretation of the results obtained from these analyses
During application of these analyses two approaches have been used to regulate the drift of structure
The 1047297rst criterion is the limitation of reference drift and inter-story drift for the structure which is 2 on
the basis of Tab C1-3 of FEMA-356 and Standard No2800 (2007) (Table 3) Consequently the analysis
will be stopped when these drifts exceed from the mentioned limit The second criterion for 1047297nishing the
analysis is when the deformation capacity of each element is reached
531 Uniform nonlinear static procedure
To perform a static pushover analysis you must specify the distribution of horizontal loads over the
structure height The current version of PERFORM-3D (Computers and Structures Inc 2006b) allows
1047297xed distributions only (ie you cannot consider lsquoadaptiversquo load distributions that depend on the
de1047298ected shape) As will be explained later you can specify load distributions using nodal load
patterns or you can specify loads on the basis of the structure mass and a de1047298ected shape
One of the most dif 1047297cult issues for pushover analysis is choosing the pushover load distribution
During an actual earthquake the effective loads on a structure change continuously in magnitude
distribution and direction The distribution of story shears over the height of a building can thus change
substantially with time especially for taller buildings where higher modes of vibration can have
signi1047297cant effects In a static pushover analysis the distribution and direction of the loads are 1047297xed
and only the magnitude varies Hence the distribution of story shears stays constant To account for
Figure 7 Nonlinear properties of concrete
Table 3 The structural properties of model A and model B in linear design stage
Type of model T 1 (s) R V (kN) ∆ x (mm) ∆ y (mm) Max drift X Max drift Y
Model A 284 11 11 576 200 1931 00027 00026Model B 3066 9 10 791 2296 2126 0003 00028
T 1 is the natural period of the structure R is the response modi1047297cation factor of the structureV is the base shear of the structure∆ x and ∆ y are the displacements at roof level of the structure in the X and Y directions respectivelyMax drift X and max drift Y are the maximum drifts of the structure in the X and Y directions respectively
H ESMAEILI ET AL
Copyright copy 2011 John Wiley amp Sons Ltd Struct Design Tall Spec Build (2011)
DOI 101002tal
8102019 The Structural Design of Tall and Special Buildings (Wiley)
httpslidepdfcomreaderfullthe-structural-design-of-tall-and-special-buildings-wiley 913
different story shear distributions to consider a number of different pushover load distributions is
necessary One option in FEMA-356 is to use uniform and triangular distributions over the building
height Note that a uniform distribution usually corresponds to a uniform acceleration over the building
height so that the load at any 1047298oor level is proportional to the mass at the 1047298oor
In fact to access this load pattern in the software a procedure is performed for loading on the basis
of uniform displacement pattern over the building height Then in loading step the software calculates
the necessary force proportioned to the created displacement
532 Triangular nonlinear static procedure
The difference between this procedure and the previous one is in their load pattern in this procedure
the inverted triangular pro1047297le is used for displacement-based load pattern of story masses based on
FEMA-356 Therefore the imposed displacement and hence the acceleration will not be uniform over
the building height
533 Modal pushover analysis
Load distributions can be based on the structure mode shapes For a low-rise structure that is
dominated by its 1047297rst mode response a load distribution based on the 1047297rst mode may be reasonable
Also considering the higher modes is important for a structure with signi1047297cant higher mode responses
(medium-rise and high-rise buildings)
In this study the three 1047297rst mode shapes in the X -direction of structural plan (see Figures 2 and 3)
are selected to perform of modal pushover analyses
The capacity curves of models A and B which are acquired from the aforementioned pushover
procedures are converted to the ideal bilinear diagrams which are shown in Figures 8 and 9 respectively
Also the values of V S V Y V U ΔY and ΔU which are obtained from the analyses and the value of V W
Figure 8 The ideal bilinear diagrams of the pushover analyses for model A UNSP uniform nonlinear
static procedure TNSP triangular nonlinear static procedure MPA modal pushover analysis
Figure 9 The ideal bilinear diagrams of the pushover analyses for model B UNSP uniform nonlinear
static procedure TNSP triangular nonlinear static procedure MPA modal pushover analysis
COMPARISON OF NONLINEAR BEHAVIOR OF STEEL MOMENT FRAMES
Copyright copy 2011 John Wiley amp Sons Ltd Struct Design Tall Spec Build (2011)
DOI 101002tal
8102019 The Structural Design of Tall and Special Buildings (Wiley)
httpslidepdfcomreaderfullthe-structural-design-of-tall-and-special-buildings-wiley 1013
which is speci1047297ed in preliminary design stage are represented in Table 4 Therefore seismic parameters
have been calculated by using the equations which are de1047297ned in Section 3 as indicated in Table 5 Also
the averages of the aforementioned values are determined that are shown in following tables At the end
the mean of capacity curves of models A and B are shown in Figure 10
As it observed from analytical results the parameters obtained from MPA such as ductility factor
(m) force reduction factor ( Rm) and response modi1047297cation factor ( R) for the mentioned structures will
be larger than the same parameters gained from other pushover approaches This behavior can revealthe importance and hence the effect of higher mode shapes of the structure in tall buildings
Considering the capacity curves in Figure 10 it is clear that the energy dissipation of the structural
system in model A is greater than that of model B Also the mean value of response modi 1047297cation
factor ( R) for model A is bigger than the same parameter of model B Therefore structures with shear
walls have better seismic behavior rather than structures with steel X-bracings
To evaluate combined behavior and interaction of RC shear wall with steel moment-resisting frame
and comparison of that with concentrically braced frame system the percent of shear absorption of
Table 4 The structural properties of models A and B in nonlinear analysis stage
Type of model Type of analysis V W (kN) V S (kN) V Y (kN) V U (kN) ∆Y ∆U
Model A UNSP 11 576 27 125 44 047 47 628 000463 001768TNSP 18 080 31 294 35 551 000468 001678MPA 30 784 49 737 52 660 000430 001757Mean 25 329 41 692 45 283 000454 001734
Model B UNSP 10 791 26 301 37 719 38 416 000486 001759TNSP 19 443 26 291 29 734 000513 001800MPA 27 939 40 417 42 585 000426 001540Mean 24 564 35 385 36 915 000475 001700
UNSP uniform nonlinear static procedure TNSP triangular nonlinear static procedure MPA modal pushover analysis
Table 5 The seismic parameters of models A and B
Type of model Type of analysis m Rm RS Y R C d
Model A UNSP 382 162 234 1453 620TNSP 358 173 156 968 620MPA 408 162 266 1758 660Mean 382 165 219 1378 629
Model B UNSP 362 143 244 1265 519TNSP 350 144 180 910 505MPA 361 145 259 1352 522Mean 358 144 228 1174 515
UNSP uniform nonlinear static procedure TNSP triangular nonlinear static procedure MPA modal pushover analysis
Figure 10 The mean of capacity curves of the Model A and Model B
H ESMAEILI ET AL
Copyright copy 2011 John Wiley amp Sons Ltd Struct Design Tall Spec Build (2011)
DOI 101002tal
8102019 The Structural Design of Tall and Special Buildings (Wiley)
httpslidepdfcomreaderfullthe-structural-design-of-tall-and-special-buildings-wiley 1113
these models has been studied in this paper The meaning of the percent of shear absorption is the ratio
of shear quantity that is endured by the columns of frame or brace in each story to the total shear
absorbed in that story Figures 11 and 12 indicate the quantity of shear absorbed by moment-resisting
frames and RC shear walls in model A and quantity of shear absorbed by moment-resisting frames
with steel bracing in model B in terms of the average of various analytical methods applied in this
study in levels of yield and ultimate strength of structure
As it is observed in these 1047297gures in system with shear wall major part of transferring lateral force inthe middle and lower stories is tolerated by RC shear wall and contribution of shear absorbed by
Figure 11 The interaction curves of the Model A and Model B for mean state of different analysis
methods in level of yield strength of structure
Figure 12 The interaction curves of the Model A and Model B for mean state of different analysis
methods in level of ultimate strength of structure
COMPARISON OF NONLINEAR BEHAVIOR OF STEEL MOMENT FRAMES
Copyright copy 2011 John Wiley amp Sons Ltd Struct Design Tall Spec Build (2011)
DOI 101002tal
8102019 The Structural Design of Tall and Special Buildings (Wiley)
httpslidepdfcomreaderfullthe-structural-design-of-tall-and-special-buildings-wiley 1213
moment-resisting frames gradually has increased in higher stories In addition in both levels of yield
and ultimate strength negative shear has been created in the last story indicating that shear wall relies
to the steel moment-resisting frame but in braced systems a main part of this process in lower stories
is carried by steel bracings and in the middle and higher stories contribution of shear absorbed by
moment-resisting frames has increased considerably as levels of yield and ultimate strength of the
structure has generated negative shear in the top two and 1047297ve stories This issue has demonstrated high
lateral stiffness for structures with shear wall system than that with braced system
6 CONCLUSIONS
Some of the key results obtained from the present analytical work are as follows
bull In the studied structures the capacity curves have larger values of lateral strength in the uniform
nonlinear static procedure than that in the triangular nonlinear static procedure However the peak
value is in the MPA The difference can show the effect of load pattern and importance of considering
the higher mode shapes in pushover analysis
bull The mean value of m and Rm factors for special steel moment-resisting frame accompanied with
special RC shear wall system (model A) is 382 whereas the value of mentioned factors is 358 for
special steel moment-resisting frame accompanied with concentrically steel braced frames (X-braces)system (model B)
bull The mean value of the over-strength factor RS for model A and model B are 165 and 144
respectively
bull The mean value of the response modi1047297cation factor R for model A and model B in allowable stress
design method are evaluated as 1378 and 1174 respectively
bull The mean value of the increasing coef 1047297cient of linear to nonlinear displacement C d for model A
and model B are evaluated as 629 and 515 respectively
bull The ductility and response modi1047297cation factors are larger for model A than model B Therefore it
seems that the use of special steel moment-resisting frame accompanied with special RC shear wall
system is more effective than the use of special steel moment-resisting frame accompanied with
concentrically steel braced frames (X-brace) system
bull
In regard to the results it seems that the C d factor for the mentioned structural systems is less thanthe values that are in Standard No 2800 (2007) The C d factor is suggested as 07 times of the
response modi1047297cation factor R in this code
REFERENCES
ACI Committee 318 2008 Building Code Requirements for Structural Concrete (ACI 318-08) and Commentary American
Concrete Institute Farmington Hills Michigan
AISC 2005 Speci 1047297cation for Structural Steel Buildings American Institute of Steel Construction Chicago
Applied Technology Council (ATC-40) 1996 Seismic Evaluation and Retro 1047297t of Concrete Buildings ATC Redwood City USA
Asgarian B Shokrgozar HR 2009 BRBF response modi1047297cation factor Journal of Constructional Steel Research 65 290ndash298
BHRC (Building and Housing Research Center) 2007 Iranian Code of Practice for Seismic Resistant Design of Buildings
Standard No 2800 ndash 07 BHRC Tehran
Chopra AK Goel RK 2003 A modal pushover analysis procedure for estimating seismic demands for buildings Earthquake
Engineering and Structural Dynamics 31
561ndash
582Comiteacute Europeen de Normalization 2005 Eurocode 8 mdash Design of Structures for Earthquake Resistance Part 3 Assessment
and Retro 1047297tting of Buildings EN 1998-3 CEN Brussels Belgium
Computers and Structures Inc 2006a Perform Components and Elements for PERFORM-3D and PERFORM-COLLAPSE CSI
Berkeley CA
Computers and Structures Inc 2006b PERFORM-3D nonlinear analysis and performance assessment for 3D structures
components and elements version4 CSI Berkeley CA
Decanini LD Liberatore L Mollaioli F 2002 Response of bare and in1047297lled RC frames under the effect of horizontal and vertical
seismic excitation In 12th European Conference on Earthquake Engineering
Federal Emergency Management Agency (FEMA) 2000 Prestandard and Commentary for the Seismic Rehabilitation of Buildings
Report No FEMA 356 Washington USA
Ferracuti B Pinho R Savoia M Francia R 2009 Veri1047297cation of displacement-based adaptive pushover through multi-ground
motion incremental dynamic analyses Engineering Structures 31 1789ndash1799
H ESMAEILI ET AL
Copyright copy 2011 John Wiley amp Sons Ltd Struct Design Tall Spec Build (2011)
DOI 101002tal
8102019 The Structural Design of Tall and Special Buildings (Wiley)
httpslidepdfcomreaderfullthe-structural-design-of-tall-and-special-buildings-wiley 1313
Hajirasouliha I Doostan A 2010 A simpli1047297ed model for seismic response prediction of concentrically braced frames Advances
in Engineering Software 41 497ndash505
Hernandez-Montes E Kwon OS Aschheim MA 2004 An energy-based formulation for 1047297rst- and multiple-mode nonlinear
static (pushover) analyses Journal of Earthquake Engineering 8(1) 69ndash88
Hsu HL Juang JL Chou CH 2011 Experimental evaluation on the seismic performance of steel knee braced frame structures
with energy dissipation mechanism Steel and Composite Structures 11(1) 77ndash91
Jung WY Aref AJ 2005 Analytical and numerical studies of polymer matrix composite sandwich in1047297ll panels Journal of
Composite Structures 68 359ndash370
Kheyroddin A 2006 Analyses and Design of Shear Walls Semnan University Press Iran
Kheyroddin A 2008 Investigation of nonlinear behavior of RC frames strengthened with steel bracing International Journal of
Engineering Sciences Iran University of Science and Technology 2(19) 25ndash35
Kim J Choi H 2005 Response modi1047297cation factors of chevron-braced frames Engineering Structures 27 285ndash300
Maheri MR Ghaffarzadeh H 2008 Connection overstrength in steel-braced RC frames Engineering Structures 30 1938ndash1948
Mohammadjafari A Jalali A 2009 Assessment of performance based parameters in near fault tall buildings Journal of Applied
Sciences 9(22) 4044ndash4049
Mortezaei A Ronagh HR Kheyroddin A Ghodrati Amiri G 2009 Effectiveness of modi1047297ed pushover analysis procedure for
the estimation of seismic demands of buildings subjected to near-fault earthquakes having forward directivity Structural
Design of Tall and Special Buildings DOI 101002tal553
New Mark NM Hall WJ 1982 Earthquake Spectra and Design Engineering Monograph Earthquake Engineering Research
Institute Berkeley CA
Tong X 2001 Seismic behavior of composite steel frame-reinforced concrete in1047297ll wall structural system PhD Thesis Department
of Civil Engineering University of Minnesota
Tong X Hajjar JF Schultz AE Shield CK 2005 Cyclic behavior of steel frame structures with composite reinforced concretein1047297ll walls and partially-restrained connections Journal of Constructional Steel Research 61 531ndash552
Uang C 1991 Establishing R (or Rw) and C d factors for building seismic provisions Jornal of Structural Engineering ASCE
117(1) 19ndash28
Wakabayashi M 1986 Design of Earthquake-resistant Buildings Mc Graw-Hill New York
COMPARISON OF NONLINEAR BEHAVIOR OF STEEL MOMENT FRAMES
Copyright copy 2011 John Wiley amp Sons Ltd Struct Design Tall Spec Build (2011)
DOI 101002tal
8102019 The Structural Design of Tall and Special Buildings (Wiley)
httpslidepdfcomreaderfullthe-structural-design-of-tall-and-special-buildings-wiley 213
to nonlinear dynamic analyses Pushover methods are particularly shown for assessing existing structures
(frequently not originally designed with seismic criteria in mind) when the employment of linear elastic
methods typical in new design situations tends to be unsuitable For these goals many codes and guidelines
(eg Eurocode 8 2005 ATC-40 1996 FEMA-356 2000) propose the use of nonlinear static methodolo-
gies to evaluate structural behavior under seismic movement (Ferracuti et al 2009) To assess the seismic
performance of the structures three various nonlinear static analyses are used each of which contains a
constant load pattern These approaches are pushover analyses with load patterns proportionate to uniform and reverse triangular displacements of structures and modal pushover analysis (MPA)
2 REVIEW OF THE LATEST RESEARCHES
In general numerous studies in forms of analytical and experimental works have been implemented on
the mentioned structural systems Most important results of which are as follows
A series of experimental programs including two-story specimens was developed to recognize the
cyclic behavior of the composite structural systems This study shows that the lateral shear force tolerate
via compressive strut of wall and shear studs (Tong 2001)
Tong et al (2005) presented an experimental study on the cyclic behavior of a composite structural
system consisting of partially restrained steel frames with RC in1047297
ll walls The one-bay two-story test specimen was built at one-third scale The study shows that this system has the potential to offer
strength appropriate for resisting the forces from earthquakes and stiffness adequate for controlling
drift for low-rise to moderate-rise buildings located in earthquake-prone regions
As a basis of many studies structural frames with in1047297ll panels are typically providing an ef 1047297cient
method for bracing buildings (Jung and Aref 2005) The presence of in1047297lls can also have a signi1047297cant
effect on the energy dissipation capacity (Decanini et al 2002)
In common practice steel bracing system is used to increase the lateral load resistance of steel struc-
tures Steel moment-resisting frame structures possess high strength and signi1047297cant ductility thus are
effective structural forms for earthquake-resistant designs However the load-carrying ef 1047297ciency of
such designs is limited when an earthquake induces large story drift because of the lower structural
stiffness of the steel frames (Hsu et al 2011)
Over-strength ductility and response modi1047297cation factors of buckling-restrained braced frames
were evaluated by Asgarian and Shokrgozar (2009) To do so buildings with various stories and
different bracing con1047297gurations including diagonal split X and chevron (V and inverted V) bracings
were considered In this article seismic response modi1047297cation factor for each of bracing systems has
been determined separately and tentative values of 835 and 12 has been suggested for ultimate limit
state and allowable stress design methods respectively
The over-strength ductility and response modi1047297cation factors of special concentric braced frames
and ordinary concentric braced frames were evaluated by performing pushover analysis of model
structures with various stories and span lengths (Kim and Choi 2005) The results were compared with
those from nonlinear incremental dynamic analyses The results of incremental dynamic analysis
generally matched well with those obtained from pushover analysis
A signi1047297cant aspect in the design of steel braced RC frames is the level of interaction between the
strength capacities of the RC frame and the bracing system Maheri and Ghaffarzadeh (2008)
conducted an experimental and numerical investigation to evaluate the level of capacity interactionbetween the two systems It was found that the capacity interaction is primarily due to the connections
over-strength and also the number of braced bays and the number of frame stories recognized
3 SEISMIC BEHAVIOR OF STRUCTURES
31 The ductility of structures
As a general rule it is possible to replace the ideal bilinear elasto-plastic diagrams with the base
shear ndashdisplacement curves of structures (Figure 1) The ductility factor in single degree-of-freedom
H ESMAEILI ET AL
Copyright copy 2011 John Wiley amp Sons Ltd Struct Design Tall Spec Build (2011)
DOI 101002tal
8102019 The Structural Design of Tall and Special Buildings (Wiley)
httpslidepdfcomreaderfullthe-structural-design-of-tall-and-special-buildings-wiley 313
(SDOF) systems is a proportion of maximum lateral displacement to the yielding lateral displacement
of structures
m frac14Δmax
Δy
(1)
In fact the ductility factor explains to what extent the structure enters when in nonlinear state There is
no accurate de1047297nition for the ductility factor of multiple degrees-of-freedom structures In some provi-sions yielding is assumed to have been simultaneous although not precise (Wakabayashi 1986) Mean-
while the relation between the base shear and displacement is not an elasticndashperfectly plastic equation
With consideration to Figure 1 an idealization in de1047297nition of the ductility factor is accepted
32 Response modi 1047297cation factor
Seismic codes consider a reduction in design loads taking advantage of the fact that the structures
possess signi1047297cant reserve strength (over-strength) and capacity to dissipate energy (ductility) The
over-strength and the ductility are incorporated in structural design through a force reduction or a
response modi1047297cation factor This factor represents ratio of maximum seismic force on a structure
during speci1047297ed ground motion if it was to remain elastic to the design seismic force Thus actual
seismic forces are reduced by the factor lsquo Rrsquo to obtain design forces The basic 1047298aw in code procedures
is that they use linear methods but rely on nonlinear behavior (Kim and Choi 2005)As it is shown in Figure 1 usually real nonlinear behavior is idealized by a bilinear elasto ndashperfectly
plastic relation The yield force of structure is shown by V y and the yield displacement is Δy In this
1047297gure V e or V max correspond to the elastic response strength of the structure The maximum base shear
in an elasto perfectly behavior is V y (Uang 1991) The ratio of maximum base shear considering elastic
behavior V e to maximum base shear in elasto perfectly behavior Vy is called force reduction factor
Rm frac14V e
V y(2)
The over-strength factor is de1047297ned as the ratio of maximum base shear in actual behavior V y to the 1047297rst
signi1047297cant yield strength in structure V s
RS frac14
V y
V s (3)
To design for allowable stress method the design codes decrease design loads from V s to V w This
decrease is done by allowable stress factor which is de1047297ned as (Asgarian and Shokrgozar 2009)
Figure 1 General structure response (Uang 1991)
COMPARISON OF NONLINEAR BEHAVIOR OF STEEL MOMENT FRAMES
Copyright copy 2011 John Wiley amp Sons Ltd Struct Design Tall Spec Build (2011)
DOI 101002tal
8102019 The Structural Design of Tall and Special Buildings (Wiley)
httpslidepdfcomreaderfullthe-structural-design-of-tall-and-special-buildings-wiley 413
Y frac14V S
V W(4)
The response modi1047297cation factor therefore accounts for the ductility and over-strength of the structure
and for the difference in the level of stresses considered in its design It is generally expressed in the
following form taking into accounts the aforementioned conceptions (Asgarian and Shokrgozar 2009)
R frac14V e
V Wfrac14
V e
V y
V y
V S
V S
V Wfrac14 Rm RS Y (5)
33 The relation between the force reduction factor the ductility factor and the period of structure
The force reduction factor ( Rm) is related to many parameters of which many are correlated to character-
istics of the structural system and some of them are independent from the structure and are related to the
other parameters such as respected loading (the time history of earthquake) Rm will be correlated to a set
of factors especially the ductility factor of structure and its performance characteristics in the nonlinear
state if we consider a speci1047297c earthquake for a particular place Therefore the 1047297rst step in determining
force reduction factor is specifying the relation between it and the capacity of the ductility of structure
Multiple factors are known that af 1047298uence on the relation between Rm and m such as materials period of
system damping PΔ effects the loadndashdeformation model in the hysteresis loops and type of the soil
that exists in the site If we consider this assumption that the ductility in the structures with short period is
the same as those that have longer periods then smaller Rm is obtained Also New Mark and Hall (1982)
suggested the following equations for calculation of the force reduction factor of structures
Rm frac14 1 T lt 0125 s(6)
Rm frac14 ffiffiffiffiffiffiffiffiffiffiffiffiffiffi 2m 1
p 0
125 s lt
T lt
0
5 s (7)
Rm frac14 m 05 s lt T (8)
34 The conversion coef 1047297cient of linear to nonlinear displacement (C d)
It rsquos clear that the structural damages are normally originated from excessive deformations of the
structure Therefore with regard to the effective parameters on seismic design of a structure the
discussion about assessment and accurate prediction of displacement and monitoring of them are the
most important aims in seismic design of a structure The C d coef 1047297cient can be calculated as follows
C d frac14Δmax
ΔS
frac14Δmax
Δy
Δy
Δs
frac14 m Rs (9)
4 DESIGN OF THE STRUCTURAL MODELS IN THIS STUDY
In this study two structural models are used for specifying the trend of this research de1047297nes
as follows
H ESMAEILI ET AL
Copyright copy 2011 John Wiley amp Sons Ltd Struct Design Tall Spec Build (2011)
DOI 101002tal
8102019 The Structural Design of Tall and Special Buildings (Wiley)
httpslidepdfcomreaderfullthe-structural-design-of-tall-and-special-buildings-wiley 513
(1) Model A A 30-story building in the form of special steel moment-resisting frame accompanied
with special RC shear wall
(2) Model B A 30-story building in the form of special steel moment-resisting frame accompanied
with concentrically steel braced frames (X-braces)
The height of the all stories is 35 m Both of them have a residential application Therefore a 1047298oor
dead load an equivalent partition load and a live load for each story of values 200 kgm 2 650 kgm 2
and 150 kgm 2 (1961 Nm 2 6374 Nm 2 and 1471 Nm 2) respectively are applied Also the structural
system of the 1047298oor is composite of RC slabs and steel secondary beams The steel material used in the
sections of the structural members is of ST37 type with yielding strength of 2400 kgcm 2
(235 359 600 Nm 2) and ultimate strength of 3700 kgcm 2 (362 846 050 Nm 2) The compressive
strength of concrete material f primec used in the shear walls is 300 kgcm 2 (29419 950 Nm 2) American
Institute of Steel Construction Speci1047297cation (AISC 2005) and American Concrete Institute Requirements
(ACI Committee 318 2008) were used to design steel members and shear wall respectively Also in
order to calculate earthquake load the spectrum dynamic method was used The equation suggested by
Kheyroddin (2006) was used to determine the thickness and the number of required shear walls
rmin frac14
hw
l w
2
835thorn 205 hw
l w
(10)
In which rmin is the minimum wall-area-to-story-area ratio hW is the total wall height and l W is the wall
length (average shear wall lengths present in building plan)
The plans of the structures the direction of the girders and secondary beams and the location of
shear walls and bracings are shown in Figures 2 and 3 In the design process of these structures it
has been tried that moment frame members tolerate 25 of earthquake forces in addition to bearing
gravity load The thicknesses of the shear walls for each story are shown in Table 1 and the sizes
of the steel braces for each story are shown in Table 2 With regard to the design of the structures
box-shaped and I-shaped sections are obtained for section area of columns and beams respectively
5 NONLINEAR ANALYSIS
51 Existing pushover analysis methods
During a pushover analysis a frame structure is subjected to gravitational loads and horizontal loads
applied at each story with the latter being incremented up to failure Ideally the distribution of horizon-
tal loads should approximate the inertia forces that are generated in the structure during an earthquake
Conventional pushover procedures adopt an invariant load pattern during the analysis and according to
a number of codes and guidelines at least two different force distributions must be considered uniform
and proportional to the 1047297rst modal shape The invariant load pattern is one of the most signi1047297cant
limitations of traditional methods because the actual inertia force distribution changes continuously
during seismic events as a result of higher mode contribution and structural degradation which modi1047297es
the stiffness of individual structural elements and consequently of the structure as a whole
A procedure that proposed by Chopra and Goel (2003) is MPA whereby a series of independent
pushover analyses are carried out considering different horizontal load patterns for each modal shapeAccording to the authors it is suf 1047297cient to consider the 1047297rst two or three modal shapes Results in terms
of capacity curves for various modal shapes are transformed in capacity curves for equivalent SDOFs
one for each mode Seismic demands are separately evaluated for each SDOF and 1047297nally combined by
the square-root-of-the-sum-of-the-squares method A common drawback of this method is the mode
superposition of results obtained from nonlinear pushover analyses carried out separately for various
modes The method neglects the interaction amongst the modes with modal superposition being
performed just as in elastic modal analysis Accordingly capacity curves typically overestimate base
shear values (Hernandez-Montes et al 2004)
On the basis of an analytical work that is conducted by Mortezaei et al (2009) it is shown that non-
linear static procedures based on invariant load vectors using elastic modal properties cannot capture
COMPARISON OF NONLINEAR BEHAVIOR OF STEEL MOMENT FRAMES
Copyright copy 2011 John Wiley amp Sons Ltd Struct Design Tall Spec Build (2011)
DOI 101002tal
8102019 The Structural Design of Tall and Special Buildings (Wiley)
httpslidepdfcomreaderfullthe-structural-design-of-tall-and-special-buildings-wiley 613
Figure 2 The structural plan of the model A
Figure 3 The structural plan of the model B
Table 1 The thickness of the shear walls in the Model A
Story 1ndash2 3ndash6 7ndash9 10ndash12 13ndash15 16ndash18 19ndash21 22ndash24 25ndash27 28ndash30
Thickness (mm) 650 600 500 500 450 400 350 300 250 200
Table 2 The sizes of the steel braces in the Model B
Story 1ndash2 3ndash6 7ndash9 10ndash12 13ndash15 16ndash21 22ndash24 25ndash27 28ndash30
Sizes of braces 2UNP300 2UNP280 2UNP260 2UNP240 2UNP220 2UNP200 2UNP180 2UNP160 2UNP140
H ESMAEILI ET AL
Copyright copy 2011 John Wiley amp Sons Ltd Struct Design Tall Spec Build (2011)
DOI 101002tal
8102019 The Structural Design of Tall and Special Buildings (Wiley)
httpslidepdfcomreaderfullthe-structural-design-of-tall-and-special-buildings-wiley 713
the changes to the dynamic modes resulting from inelastic action The variation of inertial forces must
be considered in static procedures that attempt to reproduce inelastic dynamic response
52 Nonlinear modeling of the structures
In order to assess the seismic behavior of selected buildings we have conducted a series of nonlinear
static analysis The designed structures have been used by importing into PERFORM-3D (Computers and
Structures Inc 2006a) software to create a nonlinear model After a preliminary design of the struc-tures the nonlinear model of the following elements forcendashdeformation relationship and deformation
capacities in PERFORM-3D has been developed There are a number of different ways to model inelastic
beams and columns in PERFORM At one extreme are 1047297nite element models using 1047297ber sections At the
other extreme are chord rotation models that consider the member as a whole and essentially requires
one to specify only the relationship between end moment and end rotation In between these extremes
are a number of other models In this study the chord rotation model for beams and columns has been
selected The basic model is shown in Figure 4 This is a symmetrical beam with equal and opposite
end moments and no loads along the beam length To use this model one has to specify the nonlinear
relationship between the end moment and end rotation An advantage of this model is that FEMA-356
gives speci1047297c properties including end rotation capacities (Mohammadjafari and Jalali 2009)
Figure 5 shows a PERFORM frame compound component for the chord rotation model The key parts of
this model are the FEMA beam components These are 1047297nite length components with nonlinear proper-ties The model has two of these components for cases where the strengths are different at the two ends of
element PERFORM allows user to specify different strength for two components and also different lengths
to consider cases where the in1047298ection point is not at mid-span (Mohammadjafari and Jalali 2009)
For modeling the braces the Simplr Bar element is used and parameters in Tab 5ndash6 of FEMA-356 are
implemented to model this element in the software An example of the FndashD relationship of Simplr Bar
element is shown in Figure 6
To make the RC shear wall sections de1047297ning the linear and nonlinear characteristics of its materials
(concrete and steel bar) are necessary
As it is shown in Figure 7 the stressndashstrain curve of concrete is selected in the form of trilinear with
strain hardening and its tension strength is ignored The modulus of elasticity E C is assumed to be
Figure 4 Chord rotation model
Figure 5 Basic components for chord rotation FEMA Federal Emergency Management Agency
Figure 6 Modeling of the behavior of bracing in PERFORM
COMPARISON OF NONLINEAR BEHAVIOR OF STEEL MOMENT FRAMES
Copyright copy 2011 John Wiley amp Sons Ltd Struct Design Tall Spec Build (2011)
DOI 101002tal
8102019 The Structural Design of Tall and Special Buildings (Wiley)
httpslidepdfcomreaderfullthe-structural-design-of-tall-and-special-buildings-wiley 813
261 540 kgcm 2 (2561010 Nm 2) The strain of ultimate strength of concrete eL is taken 0003
(Kheyroddin 2008) and the strain of crushing limit of concrete eCU is taken 0005 As it is seen in
Figure 7 the strain of yielding strength of concrete eY is taken 0002 then the ratio of initial modulus
of elasticity to secondary modulus of elasticity is speci1047297ed to 0402
The stressndashstrain relationship of steel bar is supposed to be bilinear (elasticndashperfectly plastic) The
modulus of elasticity E S is taken 2 100 000 kgcm 2 (2061011Nm 2) and the ultimate strain eSU
is taken 005 (Kheyroddin 2008) Also its yielding strength F Y is 4000 kgcm 2 (392 266 000 Nm 2)
53 Nonlinear analysis of the models
In this study three nonlinear static analysis approaches are used for each model which are described in
the following So six pushover analyses have been performed The center of mass at the roof level is
selected as a control point of the displacement of structure in all analysis Thus the relative lateral
displacement (drift) of the roof is used as a reference relative to lateral displacement for plotting the
capacity curves of the structures and for interpretation of the results obtained from these analyses
During application of these analyses two approaches have been used to regulate the drift of structure
The 1047297rst criterion is the limitation of reference drift and inter-story drift for the structure which is 2 on
the basis of Tab C1-3 of FEMA-356 and Standard No2800 (2007) (Table 3) Consequently the analysis
will be stopped when these drifts exceed from the mentioned limit The second criterion for 1047297nishing the
analysis is when the deformation capacity of each element is reached
531 Uniform nonlinear static procedure
To perform a static pushover analysis you must specify the distribution of horizontal loads over the
structure height The current version of PERFORM-3D (Computers and Structures Inc 2006b) allows
1047297xed distributions only (ie you cannot consider lsquoadaptiversquo load distributions that depend on the
de1047298ected shape) As will be explained later you can specify load distributions using nodal load
patterns or you can specify loads on the basis of the structure mass and a de1047298ected shape
One of the most dif 1047297cult issues for pushover analysis is choosing the pushover load distribution
During an actual earthquake the effective loads on a structure change continuously in magnitude
distribution and direction The distribution of story shears over the height of a building can thus change
substantially with time especially for taller buildings where higher modes of vibration can have
signi1047297cant effects In a static pushover analysis the distribution and direction of the loads are 1047297xed
and only the magnitude varies Hence the distribution of story shears stays constant To account for
Figure 7 Nonlinear properties of concrete
Table 3 The structural properties of model A and model B in linear design stage
Type of model T 1 (s) R V (kN) ∆ x (mm) ∆ y (mm) Max drift X Max drift Y
Model A 284 11 11 576 200 1931 00027 00026Model B 3066 9 10 791 2296 2126 0003 00028
T 1 is the natural period of the structure R is the response modi1047297cation factor of the structureV is the base shear of the structure∆ x and ∆ y are the displacements at roof level of the structure in the X and Y directions respectivelyMax drift X and max drift Y are the maximum drifts of the structure in the X and Y directions respectively
H ESMAEILI ET AL
Copyright copy 2011 John Wiley amp Sons Ltd Struct Design Tall Spec Build (2011)
DOI 101002tal
8102019 The Structural Design of Tall and Special Buildings (Wiley)
httpslidepdfcomreaderfullthe-structural-design-of-tall-and-special-buildings-wiley 913
different story shear distributions to consider a number of different pushover load distributions is
necessary One option in FEMA-356 is to use uniform and triangular distributions over the building
height Note that a uniform distribution usually corresponds to a uniform acceleration over the building
height so that the load at any 1047298oor level is proportional to the mass at the 1047298oor
In fact to access this load pattern in the software a procedure is performed for loading on the basis
of uniform displacement pattern over the building height Then in loading step the software calculates
the necessary force proportioned to the created displacement
532 Triangular nonlinear static procedure
The difference between this procedure and the previous one is in their load pattern in this procedure
the inverted triangular pro1047297le is used for displacement-based load pattern of story masses based on
FEMA-356 Therefore the imposed displacement and hence the acceleration will not be uniform over
the building height
533 Modal pushover analysis
Load distributions can be based on the structure mode shapes For a low-rise structure that is
dominated by its 1047297rst mode response a load distribution based on the 1047297rst mode may be reasonable
Also considering the higher modes is important for a structure with signi1047297cant higher mode responses
(medium-rise and high-rise buildings)
In this study the three 1047297rst mode shapes in the X -direction of structural plan (see Figures 2 and 3)
are selected to perform of modal pushover analyses
The capacity curves of models A and B which are acquired from the aforementioned pushover
procedures are converted to the ideal bilinear diagrams which are shown in Figures 8 and 9 respectively
Also the values of V S V Y V U ΔY and ΔU which are obtained from the analyses and the value of V W
Figure 8 The ideal bilinear diagrams of the pushover analyses for model A UNSP uniform nonlinear
static procedure TNSP triangular nonlinear static procedure MPA modal pushover analysis
Figure 9 The ideal bilinear diagrams of the pushover analyses for model B UNSP uniform nonlinear
static procedure TNSP triangular nonlinear static procedure MPA modal pushover analysis
COMPARISON OF NONLINEAR BEHAVIOR OF STEEL MOMENT FRAMES
Copyright copy 2011 John Wiley amp Sons Ltd Struct Design Tall Spec Build (2011)
DOI 101002tal
8102019 The Structural Design of Tall and Special Buildings (Wiley)
httpslidepdfcomreaderfullthe-structural-design-of-tall-and-special-buildings-wiley 1013
which is speci1047297ed in preliminary design stage are represented in Table 4 Therefore seismic parameters
have been calculated by using the equations which are de1047297ned in Section 3 as indicated in Table 5 Also
the averages of the aforementioned values are determined that are shown in following tables At the end
the mean of capacity curves of models A and B are shown in Figure 10
As it observed from analytical results the parameters obtained from MPA such as ductility factor
(m) force reduction factor ( Rm) and response modi1047297cation factor ( R) for the mentioned structures will
be larger than the same parameters gained from other pushover approaches This behavior can revealthe importance and hence the effect of higher mode shapes of the structure in tall buildings
Considering the capacity curves in Figure 10 it is clear that the energy dissipation of the structural
system in model A is greater than that of model B Also the mean value of response modi 1047297cation
factor ( R) for model A is bigger than the same parameter of model B Therefore structures with shear
walls have better seismic behavior rather than structures with steel X-bracings
To evaluate combined behavior and interaction of RC shear wall with steel moment-resisting frame
and comparison of that with concentrically braced frame system the percent of shear absorption of
Table 4 The structural properties of models A and B in nonlinear analysis stage
Type of model Type of analysis V W (kN) V S (kN) V Y (kN) V U (kN) ∆Y ∆U
Model A UNSP 11 576 27 125 44 047 47 628 000463 001768TNSP 18 080 31 294 35 551 000468 001678MPA 30 784 49 737 52 660 000430 001757Mean 25 329 41 692 45 283 000454 001734
Model B UNSP 10 791 26 301 37 719 38 416 000486 001759TNSP 19 443 26 291 29 734 000513 001800MPA 27 939 40 417 42 585 000426 001540Mean 24 564 35 385 36 915 000475 001700
UNSP uniform nonlinear static procedure TNSP triangular nonlinear static procedure MPA modal pushover analysis
Table 5 The seismic parameters of models A and B
Type of model Type of analysis m Rm RS Y R C d
Model A UNSP 382 162 234 1453 620TNSP 358 173 156 968 620MPA 408 162 266 1758 660Mean 382 165 219 1378 629
Model B UNSP 362 143 244 1265 519TNSP 350 144 180 910 505MPA 361 145 259 1352 522Mean 358 144 228 1174 515
UNSP uniform nonlinear static procedure TNSP triangular nonlinear static procedure MPA modal pushover analysis
Figure 10 The mean of capacity curves of the Model A and Model B
H ESMAEILI ET AL
Copyright copy 2011 John Wiley amp Sons Ltd Struct Design Tall Spec Build (2011)
DOI 101002tal
8102019 The Structural Design of Tall and Special Buildings (Wiley)
httpslidepdfcomreaderfullthe-structural-design-of-tall-and-special-buildings-wiley 1113
these models has been studied in this paper The meaning of the percent of shear absorption is the ratio
of shear quantity that is endured by the columns of frame or brace in each story to the total shear
absorbed in that story Figures 11 and 12 indicate the quantity of shear absorbed by moment-resisting
frames and RC shear walls in model A and quantity of shear absorbed by moment-resisting frames
with steel bracing in model B in terms of the average of various analytical methods applied in this
study in levels of yield and ultimate strength of structure
As it is observed in these 1047297gures in system with shear wall major part of transferring lateral force inthe middle and lower stories is tolerated by RC shear wall and contribution of shear absorbed by
Figure 11 The interaction curves of the Model A and Model B for mean state of different analysis
methods in level of yield strength of structure
Figure 12 The interaction curves of the Model A and Model B for mean state of different analysis
methods in level of ultimate strength of structure
COMPARISON OF NONLINEAR BEHAVIOR OF STEEL MOMENT FRAMES
Copyright copy 2011 John Wiley amp Sons Ltd Struct Design Tall Spec Build (2011)
DOI 101002tal
8102019 The Structural Design of Tall and Special Buildings (Wiley)
httpslidepdfcomreaderfullthe-structural-design-of-tall-and-special-buildings-wiley 1213
moment-resisting frames gradually has increased in higher stories In addition in both levels of yield
and ultimate strength negative shear has been created in the last story indicating that shear wall relies
to the steel moment-resisting frame but in braced systems a main part of this process in lower stories
is carried by steel bracings and in the middle and higher stories contribution of shear absorbed by
moment-resisting frames has increased considerably as levels of yield and ultimate strength of the
structure has generated negative shear in the top two and 1047297ve stories This issue has demonstrated high
lateral stiffness for structures with shear wall system than that with braced system
6 CONCLUSIONS
Some of the key results obtained from the present analytical work are as follows
bull In the studied structures the capacity curves have larger values of lateral strength in the uniform
nonlinear static procedure than that in the triangular nonlinear static procedure However the peak
value is in the MPA The difference can show the effect of load pattern and importance of considering
the higher mode shapes in pushover analysis
bull The mean value of m and Rm factors for special steel moment-resisting frame accompanied with
special RC shear wall system (model A) is 382 whereas the value of mentioned factors is 358 for
special steel moment-resisting frame accompanied with concentrically steel braced frames (X-braces)system (model B)
bull The mean value of the over-strength factor RS for model A and model B are 165 and 144
respectively
bull The mean value of the response modi1047297cation factor R for model A and model B in allowable stress
design method are evaluated as 1378 and 1174 respectively
bull The mean value of the increasing coef 1047297cient of linear to nonlinear displacement C d for model A
and model B are evaluated as 629 and 515 respectively
bull The ductility and response modi1047297cation factors are larger for model A than model B Therefore it
seems that the use of special steel moment-resisting frame accompanied with special RC shear wall
system is more effective than the use of special steel moment-resisting frame accompanied with
concentrically steel braced frames (X-brace) system
bull
In regard to the results it seems that the C d factor for the mentioned structural systems is less thanthe values that are in Standard No 2800 (2007) The C d factor is suggested as 07 times of the
response modi1047297cation factor R in this code
REFERENCES
ACI Committee 318 2008 Building Code Requirements for Structural Concrete (ACI 318-08) and Commentary American
Concrete Institute Farmington Hills Michigan
AISC 2005 Speci 1047297cation for Structural Steel Buildings American Institute of Steel Construction Chicago
Applied Technology Council (ATC-40) 1996 Seismic Evaluation and Retro 1047297t of Concrete Buildings ATC Redwood City USA
Asgarian B Shokrgozar HR 2009 BRBF response modi1047297cation factor Journal of Constructional Steel Research 65 290ndash298
BHRC (Building and Housing Research Center) 2007 Iranian Code of Practice for Seismic Resistant Design of Buildings
Standard No 2800 ndash 07 BHRC Tehran
Chopra AK Goel RK 2003 A modal pushover analysis procedure for estimating seismic demands for buildings Earthquake
Engineering and Structural Dynamics 31
561ndash
582Comiteacute Europeen de Normalization 2005 Eurocode 8 mdash Design of Structures for Earthquake Resistance Part 3 Assessment
and Retro 1047297tting of Buildings EN 1998-3 CEN Brussels Belgium
Computers and Structures Inc 2006a Perform Components and Elements for PERFORM-3D and PERFORM-COLLAPSE CSI
Berkeley CA
Computers and Structures Inc 2006b PERFORM-3D nonlinear analysis and performance assessment for 3D structures
components and elements version4 CSI Berkeley CA
Decanini LD Liberatore L Mollaioli F 2002 Response of bare and in1047297lled RC frames under the effect of horizontal and vertical
seismic excitation In 12th European Conference on Earthquake Engineering
Federal Emergency Management Agency (FEMA) 2000 Prestandard and Commentary for the Seismic Rehabilitation of Buildings
Report No FEMA 356 Washington USA
Ferracuti B Pinho R Savoia M Francia R 2009 Veri1047297cation of displacement-based adaptive pushover through multi-ground
motion incremental dynamic analyses Engineering Structures 31 1789ndash1799
H ESMAEILI ET AL
Copyright copy 2011 John Wiley amp Sons Ltd Struct Design Tall Spec Build (2011)
DOI 101002tal
8102019 The Structural Design of Tall and Special Buildings (Wiley)
httpslidepdfcomreaderfullthe-structural-design-of-tall-and-special-buildings-wiley 1313
Hajirasouliha I Doostan A 2010 A simpli1047297ed model for seismic response prediction of concentrically braced frames Advances
in Engineering Software 41 497ndash505
Hernandez-Montes E Kwon OS Aschheim MA 2004 An energy-based formulation for 1047297rst- and multiple-mode nonlinear
static (pushover) analyses Journal of Earthquake Engineering 8(1) 69ndash88
Hsu HL Juang JL Chou CH 2011 Experimental evaluation on the seismic performance of steel knee braced frame structures
with energy dissipation mechanism Steel and Composite Structures 11(1) 77ndash91
Jung WY Aref AJ 2005 Analytical and numerical studies of polymer matrix composite sandwich in1047297ll panels Journal of
Composite Structures 68 359ndash370
Kheyroddin A 2006 Analyses and Design of Shear Walls Semnan University Press Iran
Kheyroddin A 2008 Investigation of nonlinear behavior of RC frames strengthened with steel bracing International Journal of
Engineering Sciences Iran University of Science and Technology 2(19) 25ndash35
Kim J Choi H 2005 Response modi1047297cation factors of chevron-braced frames Engineering Structures 27 285ndash300
Maheri MR Ghaffarzadeh H 2008 Connection overstrength in steel-braced RC frames Engineering Structures 30 1938ndash1948
Mohammadjafari A Jalali A 2009 Assessment of performance based parameters in near fault tall buildings Journal of Applied
Sciences 9(22) 4044ndash4049
Mortezaei A Ronagh HR Kheyroddin A Ghodrati Amiri G 2009 Effectiveness of modi1047297ed pushover analysis procedure for
the estimation of seismic demands of buildings subjected to near-fault earthquakes having forward directivity Structural
Design of Tall and Special Buildings DOI 101002tal553
New Mark NM Hall WJ 1982 Earthquake Spectra and Design Engineering Monograph Earthquake Engineering Research
Institute Berkeley CA
Tong X 2001 Seismic behavior of composite steel frame-reinforced concrete in1047297ll wall structural system PhD Thesis Department
of Civil Engineering University of Minnesota
Tong X Hajjar JF Schultz AE Shield CK 2005 Cyclic behavior of steel frame structures with composite reinforced concretein1047297ll walls and partially-restrained connections Journal of Constructional Steel Research 61 531ndash552
Uang C 1991 Establishing R (or Rw) and C d factors for building seismic provisions Jornal of Structural Engineering ASCE
117(1) 19ndash28
Wakabayashi M 1986 Design of Earthquake-resistant Buildings Mc Graw-Hill New York
COMPARISON OF NONLINEAR BEHAVIOR OF STEEL MOMENT FRAMES
Copyright copy 2011 John Wiley amp Sons Ltd Struct Design Tall Spec Build (2011)
DOI 101002tal
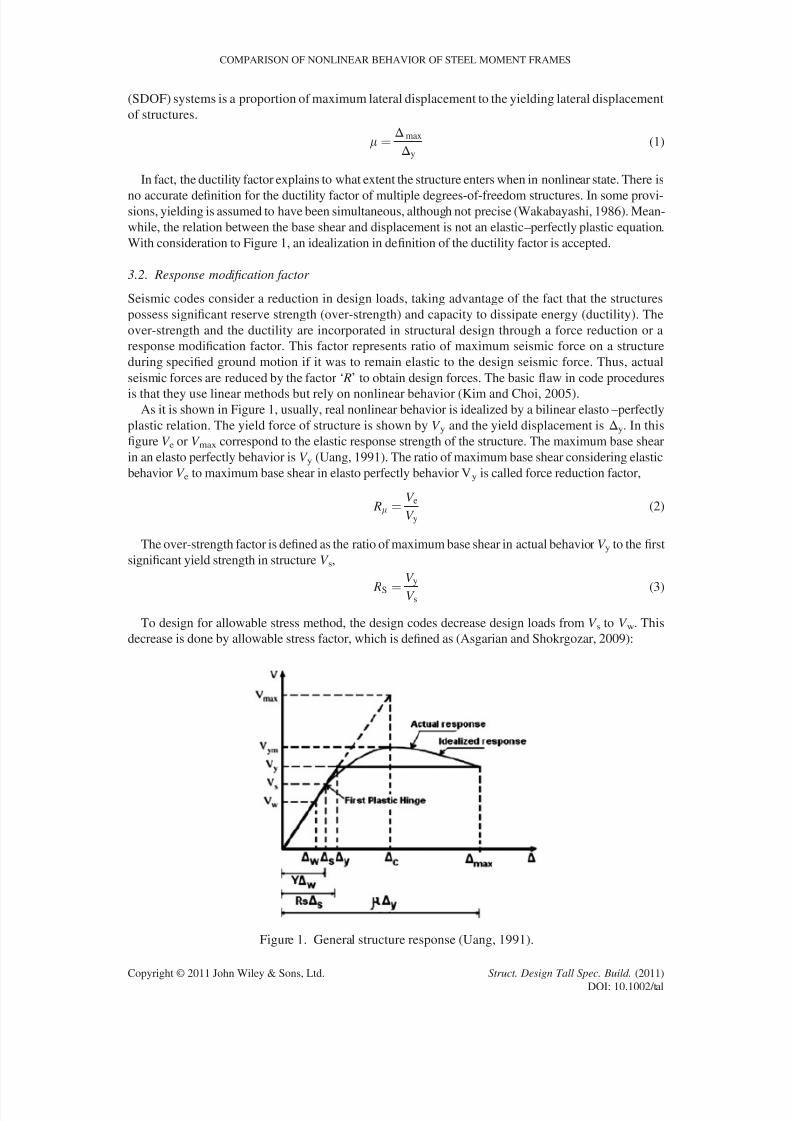
8102019 The Structural Design of Tall and Special Buildings (Wiley)
httpslidepdfcomreaderfullthe-structural-design-of-tall-and-special-buildings-wiley 313
(SDOF) systems is a proportion of maximum lateral displacement to the yielding lateral displacement
of structures
m frac14Δmax
Δy
(1)
In fact the ductility factor explains to what extent the structure enters when in nonlinear state There is
no accurate de1047297nition for the ductility factor of multiple degrees-of-freedom structures In some provi-sions yielding is assumed to have been simultaneous although not precise (Wakabayashi 1986) Mean-
while the relation between the base shear and displacement is not an elasticndashperfectly plastic equation
With consideration to Figure 1 an idealization in de1047297nition of the ductility factor is accepted
32 Response modi 1047297cation factor
Seismic codes consider a reduction in design loads taking advantage of the fact that the structures
possess signi1047297cant reserve strength (over-strength) and capacity to dissipate energy (ductility) The
over-strength and the ductility are incorporated in structural design through a force reduction or a
response modi1047297cation factor This factor represents ratio of maximum seismic force on a structure
during speci1047297ed ground motion if it was to remain elastic to the design seismic force Thus actual
seismic forces are reduced by the factor lsquo Rrsquo to obtain design forces The basic 1047298aw in code procedures
is that they use linear methods but rely on nonlinear behavior (Kim and Choi 2005)As it is shown in Figure 1 usually real nonlinear behavior is idealized by a bilinear elasto ndashperfectly
plastic relation The yield force of structure is shown by V y and the yield displacement is Δy In this
1047297gure V e or V max correspond to the elastic response strength of the structure The maximum base shear
in an elasto perfectly behavior is V y (Uang 1991) The ratio of maximum base shear considering elastic
behavior V e to maximum base shear in elasto perfectly behavior Vy is called force reduction factor
Rm frac14V e
V y(2)
The over-strength factor is de1047297ned as the ratio of maximum base shear in actual behavior V y to the 1047297rst
signi1047297cant yield strength in structure V s
RS frac14
V y
V s (3)
To design for allowable stress method the design codes decrease design loads from V s to V w This
decrease is done by allowable stress factor which is de1047297ned as (Asgarian and Shokrgozar 2009)
Figure 1 General structure response (Uang 1991)
COMPARISON OF NONLINEAR BEHAVIOR OF STEEL MOMENT FRAMES
Copyright copy 2011 John Wiley amp Sons Ltd Struct Design Tall Spec Build (2011)
DOI 101002tal
8102019 The Structural Design of Tall and Special Buildings (Wiley)
httpslidepdfcomreaderfullthe-structural-design-of-tall-and-special-buildings-wiley 413
Y frac14V S
V W(4)
The response modi1047297cation factor therefore accounts for the ductility and over-strength of the structure
and for the difference in the level of stresses considered in its design It is generally expressed in the
following form taking into accounts the aforementioned conceptions (Asgarian and Shokrgozar 2009)
R frac14V e
V Wfrac14
V e
V y
V y
V S
V S
V Wfrac14 Rm RS Y (5)
33 The relation between the force reduction factor the ductility factor and the period of structure
The force reduction factor ( Rm) is related to many parameters of which many are correlated to character-
istics of the structural system and some of them are independent from the structure and are related to the
other parameters such as respected loading (the time history of earthquake) Rm will be correlated to a set
of factors especially the ductility factor of structure and its performance characteristics in the nonlinear
state if we consider a speci1047297c earthquake for a particular place Therefore the 1047297rst step in determining
force reduction factor is specifying the relation between it and the capacity of the ductility of structure
Multiple factors are known that af 1047298uence on the relation between Rm and m such as materials period of
system damping PΔ effects the loadndashdeformation model in the hysteresis loops and type of the soil
that exists in the site If we consider this assumption that the ductility in the structures with short period is
the same as those that have longer periods then smaller Rm is obtained Also New Mark and Hall (1982)
suggested the following equations for calculation of the force reduction factor of structures
Rm frac14 1 T lt 0125 s(6)
Rm frac14 ffiffiffiffiffiffiffiffiffiffiffiffiffiffi 2m 1
p 0
125 s lt
T lt
0
5 s (7)
Rm frac14 m 05 s lt T (8)
34 The conversion coef 1047297cient of linear to nonlinear displacement (C d)
It rsquos clear that the structural damages are normally originated from excessive deformations of the
structure Therefore with regard to the effective parameters on seismic design of a structure the
discussion about assessment and accurate prediction of displacement and monitoring of them are the
most important aims in seismic design of a structure The C d coef 1047297cient can be calculated as follows
C d frac14Δmax
ΔS
frac14Δmax
Δy
Δy
Δs
frac14 m Rs (9)
4 DESIGN OF THE STRUCTURAL MODELS IN THIS STUDY
In this study two structural models are used for specifying the trend of this research de1047297nes
as follows
H ESMAEILI ET AL
Copyright copy 2011 John Wiley amp Sons Ltd Struct Design Tall Spec Build (2011)
DOI 101002tal
8102019 The Structural Design of Tall and Special Buildings (Wiley)
httpslidepdfcomreaderfullthe-structural-design-of-tall-and-special-buildings-wiley 513
(1) Model A A 30-story building in the form of special steel moment-resisting frame accompanied
with special RC shear wall
(2) Model B A 30-story building in the form of special steel moment-resisting frame accompanied
with concentrically steel braced frames (X-braces)
The height of the all stories is 35 m Both of them have a residential application Therefore a 1047298oor
dead load an equivalent partition load and a live load for each story of values 200 kgm 2 650 kgm 2
and 150 kgm 2 (1961 Nm 2 6374 Nm 2 and 1471 Nm 2) respectively are applied Also the structural
system of the 1047298oor is composite of RC slabs and steel secondary beams The steel material used in the
sections of the structural members is of ST37 type with yielding strength of 2400 kgcm 2
(235 359 600 Nm 2) and ultimate strength of 3700 kgcm 2 (362 846 050 Nm 2) The compressive
strength of concrete material f primec used in the shear walls is 300 kgcm 2 (29419 950 Nm 2) American
Institute of Steel Construction Speci1047297cation (AISC 2005) and American Concrete Institute Requirements
(ACI Committee 318 2008) were used to design steel members and shear wall respectively Also in
order to calculate earthquake load the spectrum dynamic method was used The equation suggested by
Kheyroddin (2006) was used to determine the thickness and the number of required shear walls
rmin frac14
hw
l w
2
835thorn 205 hw
l w
(10)
In which rmin is the minimum wall-area-to-story-area ratio hW is the total wall height and l W is the wall
length (average shear wall lengths present in building plan)
The plans of the structures the direction of the girders and secondary beams and the location of
shear walls and bracings are shown in Figures 2 and 3 In the design process of these structures it
has been tried that moment frame members tolerate 25 of earthquake forces in addition to bearing
gravity load The thicknesses of the shear walls for each story are shown in Table 1 and the sizes
of the steel braces for each story are shown in Table 2 With regard to the design of the structures
box-shaped and I-shaped sections are obtained for section area of columns and beams respectively
5 NONLINEAR ANALYSIS
51 Existing pushover analysis methods
During a pushover analysis a frame structure is subjected to gravitational loads and horizontal loads
applied at each story with the latter being incremented up to failure Ideally the distribution of horizon-
tal loads should approximate the inertia forces that are generated in the structure during an earthquake
Conventional pushover procedures adopt an invariant load pattern during the analysis and according to
a number of codes and guidelines at least two different force distributions must be considered uniform
and proportional to the 1047297rst modal shape The invariant load pattern is one of the most signi1047297cant
limitations of traditional methods because the actual inertia force distribution changes continuously
during seismic events as a result of higher mode contribution and structural degradation which modi1047297es
the stiffness of individual structural elements and consequently of the structure as a whole
A procedure that proposed by Chopra and Goel (2003) is MPA whereby a series of independent
pushover analyses are carried out considering different horizontal load patterns for each modal shapeAccording to the authors it is suf 1047297cient to consider the 1047297rst two or three modal shapes Results in terms
of capacity curves for various modal shapes are transformed in capacity curves for equivalent SDOFs
one for each mode Seismic demands are separately evaluated for each SDOF and 1047297nally combined by
the square-root-of-the-sum-of-the-squares method A common drawback of this method is the mode
superposition of results obtained from nonlinear pushover analyses carried out separately for various
modes The method neglects the interaction amongst the modes with modal superposition being
performed just as in elastic modal analysis Accordingly capacity curves typically overestimate base
shear values (Hernandez-Montes et al 2004)
On the basis of an analytical work that is conducted by Mortezaei et al (2009) it is shown that non-
linear static procedures based on invariant load vectors using elastic modal properties cannot capture
COMPARISON OF NONLINEAR BEHAVIOR OF STEEL MOMENT FRAMES
Copyright copy 2011 John Wiley amp Sons Ltd Struct Design Tall Spec Build (2011)
DOI 101002tal
8102019 The Structural Design of Tall and Special Buildings (Wiley)
httpslidepdfcomreaderfullthe-structural-design-of-tall-and-special-buildings-wiley 613
Figure 2 The structural plan of the model A
Figure 3 The structural plan of the model B
Table 1 The thickness of the shear walls in the Model A
Story 1ndash2 3ndash6 7ndash9 10ndash12 13ndash15 16ndash18 19ndash21 22ndash24 25ndash27 28ndash30
Thickness (mm) 650 600 500 500 450 400 350 300 250 200
Table 2 The sizes of the steel braces in the Model B
Story 1ndash2 3ndash6 7ndash9 10ndash12 13ndash15 16ndash21 22ndash24 25ndash27 28ndash30
Sizes of braces 2UNP300 2UNP280 2UNP260 2UNP240 2UNP220 2UNP200 2UNP180 2UNP160 2UNP140
H ESMAEILI ET AL
Copyright copy 2011 John Wiley amp Sons Ltd Struct Design Tall Spec Build (2011)
DOI 101002tal
8102019 The Structural Design of Tall and Special Buildings (Wiley)
httpslidepdfcomreaderfullthe-structural-design-of-tall-and-special-buildings-wiley 713
the changes to the dynamic modes resulting from inelastic action The variation of inertial forces must
be considered in static procedures that attempt to reproduce inelastic dynamic response
52 Nonlinear modeling of the structures
In order to assess the seismic behavior of selected buildings we have conducted a series of nonlinear
static analysis The designed structures have been used by importing into PERFORM-3D (Computers and
Structures Inc 2006a) software to create a nonlinear model After a preliminary design of the struc-tures the nonlinear model of the following elements forcendashdeformation relationship and deformation
capacities in PERFORM-3D has been developed There are a number of different ways to model inelastic
beams and columns in PERFORM At one extreme are 1047297nite element models using 1047297ber sections At the
other extreme are chord rotation models that consider the member as a whole and essentially requires
one to specify only the relationship between end moment and end rotation In between these extremes
are a number of other models In this study the chord rotation model for beams and columns has been
selected The basic model is shown in Figure 4 This is a symmetrical beam with equal and opposite
end moments and no loads along the beam length To use this model one has to specify the nonlinear
relationship between the end moment and end rotation An advantage of this model is that FEMA-356
gives speci1047297c properties including end rotation capacities (Mohammadjafari and Jalali 2009)
Figure 5 shows a PERFORM frame compound component for the chord rotation model The key parts of
this model are the FEMA beam components These are 1047297nite length components with nonlinear proper-ties The model has two of these components for cases where the strengths are different at the two ends of
element PERFORM allows user to specify different strength for two components and also different lengths
to consider cases where the in1047298ection point is not at mid-span (Mohammadjafari and Jalali 2009)
For modeling the braces the Simplr Bar element is used and parameters in Tab 5ndash6 of FEMA-356 are
implemented to model this element in the software An example of the FndashD relationship of Simplr Bar
element is shown in Figure 6
To make the RC shear wall sections de1047297ning the linear and nonlinear characteristics of its materials
(concrete and steel bar) are necessary
As it is shown in Figure 7 the stressndashstrain curve of concrete is selected in the form of trilinear with
strain hardening and its tension strength is ignored The modulus of elasticity E C is assumed to be
Figure 4 Chord rotation model
Figure 5 Basic components for chord rotation FEMA Federal Emergency Management Agency
Figure 6 Modeling of the behavior of bracing in PERFORM
COMPARISON OF NONLINEAR BEHAVIOR OF STEEL MOMENT FRAMES
Copyright copy 2011 John Wiley amp Sons Ltd Struct Design Tall Spec Build (2011)
DOI 101002tal
8102019 The Structural Design of Tall and Special Buildings (Wiley)
httpslidepdfcomreaderfullthe-structural-design-of-tall-and-special-buildings-wiley 813
261 540 kgcm 2 (2561010 Nm 2) The strain of ultimate strength of concrete eL is taken 0003
(Kheyroddin 2008) and the strain of crushing limit of concrete eCU is taken 0005 As it is seen in
Figure 7 the strain of yielding strength of concrete eY is taken 0002 then the ratio of initial modulus
of elasticity to secondary modulus of elasticity is speci1047297ed to 0402
The stressndashstrain relationship of steel bar is supposed to be bilinear (elasticndashperfectly plastic) The
modulus of elasticity E S is taken 2 100 000 kgcm 2 (2061011Nm 2) and the ultimate strain eSU
is taken 005 (Kheyroddin 2008) Also its yielding strength F Y is 4000 kgcm 2 (392 266 000 Nm 2)
53 Nonlinear analysis of the models
In this study three nonlinear static analysis approaches are used for each model which are described in
the following So six pushover analyses have been performed The center of mass at the roof level is
selected as a control point of the displacement of structure in all analysis Thus the relative lateral
displacement (drift) of the roof is used as a reference relative to lateral displacement for plotting the
capacity curves of the structures and for interpretation of the results obtained from these analyses
During application of these analyses two approaches have been used to regulate the drift of structure
The 1047297rst criterion is the limitation of reference drift and inter-story drift for the structure which is 2 on
the basis of Tab C1-3 of FEMA-356 and Standard No2800 (2007) (Table 3) Consequently the analysis
will be stopped when these drifts exceed from the mentioned limit The second criterion for 1047297nishing the
analysis is when the deformation capacity of each element is reached
531 Uniform nonlinear static procedure
To perform a static pushover analysis you must specify the distribution of horizontal loads over the
structure height The current version of PERFORM-3D (Computers and Structures Inc 2006b) allows
1047297xed distributions only (ie you cannot consider lsquoadaptiversquo load distributions that depend on the
de1047298ected shape) As will be explained later you can specify load distributions using nodal load
patterns or you can specify loads on the basis of the structure mass and a de1047298ected shape
One of the most dif 1047297cult issues for pushover analysis is choosing the pushover load distribution
During an actual earthquake the effective loads on a structure change continuously in magnitude
distribution and direction The distribution of story shears over the height of a building can thus change
substantially with time especially for taller buildings where higher modes of vibration can have
signi1047297cant effects In a static pushover analysis the distribution and direction of the loads are 1047297xed
and only the magnitude varies Hence the distribution of story shears stays constant To account for
Figure 7 Nonlinear properties of concrete
Table 3 The structural properties of model A and model B in linear design stage
Type of model T 1 (s) R V (kN) ∆ x (mm) ∆ y (mm) Max drift X Max drift Y
Model A 284 11 11 576 200 1931 00027 00026Model B 3066 9 10 791 2296 2126 0003 00028
T 1 is the natural period of the structure R is the response modi1047297cation factor of the structureV is the base shear of the structure∆ x and ∆ y are the displacements at roof level of the structure in the X and Y directions respectivelyMax drift X and max drift Y are the maximum drifts of the structure in the X and Y directions respectively
H ESMAEILI ET AL
Copyright copy 2011 John Wiley amp Sons Ltd Struct Design Tall Spec Build (2011)
DOI 101002tal
8102019 The Structural Design of Tall and Special Buildings (Wiley)
httpslidepdfcomreaderfullthe-structural-design-of-tall-and-special-buildings-wiley 913
different story shear distributions to consider a number of different pushover load distributions is
necessary One option in FEMA-356 is to use uniform and triangular distributions over the building
height Note that a uniform distribution usually corresponds to a uniform acceleration over the building
height so that the load at any 1047298oor level is proportional to the mass at the 1047298oor
In fact to access this load pattern in the software a procedure is performed for loading on the basis
of uniform displacement pattern over the building height Then in loading step the software calculates
the necessary force proportioned to the created displacement
532 Triangular nonlinear static procedure
The difference between this procedure and the previous one is in their load pattern in this procedure
the inverted triangular pro1047297le is used for displacement-based load pattern of story masses based on
FEMA-356 Therefore the imposed displacement and hence the acceleration will not be uniform over
the building height
533 Modal pushover analysis
Load distributions can be based on the structure mode shapes For a low-rise structure that is
dominated by its 1047297rst mode response a load distribution based on the 1047297rst mode may be reasonable
Also considering the higher modes is important for a structure with signi1047297cant higher mode responses
(medium-rise and high-rise buildings)
In this study the three 1047297rst mode shapes in the X -direction of structural plan (see Figures 2 and 3)
are selected to perform of modal pushover analyses
The capacity curves of models A and B which are acquired from the aforementioned pushover
procedures are converted to the ideal bilinear diagrams which are shown in Figures 8 and 9 respectively
Also the values of V S V Y V U ΔY and ΔU which are obtained from the analyses and the value of V W
Figure 8 The ideal bilinear diagrams of the pushover analyses for model A UNSP uniform nonlinear
static procedure TNSP triangular nonlinear static procedure MPA modal pushover analysis
Figure 9 The ideal bilinear diagrams of the pushover analyses for model B UNSP uniform nonlinear
static procedure TNSP triangular nonlinear static procedure MPA modal pushover analysis
COMPARISON OF NONLINEAR BEHAVIOR OF STEEL MOMENT FRAMES
Copyright copy 2011 John Wiley amp Sons Ltd Struct Design Tall Spec Build (2011)
DOI 101002tal
8102019 The Structural Design of Tall and Special Buildings (Wiley)
httpslidepdfcomreaderfullthe-structural-design-of-tall-and-special-buildings-wiley 1013
which is speci1047297ed in preliminary design stage are represented in Table 4 Therefore seismic parameters
have been calculated by using the equations which are de1047297ned in Section 3 as indicated in Table 5 Also
the averages of the aforementioned values are determined that are shown in following tables At the end
the mean of capacity curves of models A and B are shown in Figure 10
As it observed from analytical results the parameters obtained from MPA such as ductility factor
(m) force reduction factor ( Rm) and response modi1047297cation factor ( R) for the mentioned structures will
be larger than the same parameters gained from other pushover approaches This behavior can revealthe importance and hence the effect of higher mode shapes of the structure in tall buildings
Considering the capacity curves in Figure 10 it is clear that the energy dissipation of the structural
system in model A is greater than that of model B Also the mean value of response modi 1047297cation
factor ( R) for model A is bigger than the same parameter of model B Therefore structures with shear
walls have better seismic behavior rather than structures with steel X-bracings
To evaluate combined behavior and interaction of RC shear wall with steel moment-resisting frame
and comparison of that with concentrically braced frame system the percent of shear absorption of
Table 4 The structural properties of models A and B in nonlinear analysis stage
Type of model Type of analysis V W (kN) V S (kN) V Y (kN) V U (kN) ∆Y ∆U
Model A UNSP 11 576 27 125 44 047 47 628 000463 001768TNSP 18 080 31 294 35 551 000468 001678MPA 30 784 49 737 52 660 000430 001757Mean 25 329 41 692 45 283 000454 001734
Model B UNSP 10 791 26 301 37 719 38 416 000486 001759TNSP 19 443 26 291 29 734 000513 001800MPA 27 939 40 417 42 585 000426 001540Mean 24 564 35 385 36 915 000475 001700
UNSP uniform nonlinear static procedure TNSP triangular nonlinear static procedure MPA modal pushover analysis
Table 5 The seismic parameters of models A and B
Type of model Type of analysis m Rm RS Y R C d
Model A UNSP 382 162 234 1453 620TNSP 358 173 156 968 620MPA 408 162 266 1758 660Mean 382 165 219 1378 629
Model B UNSP 362 143 244 1265 519TNSP 350 144 180 910 505MPA 361 145 259 1352 522Mean 358 144 228 1174 515
UNSP uniform nonlinear static procedure TNSP triangular nonlinear static procedure MPA modal pushover analysis
Figure 10 The mean of capacity curves of the Model A and Model B
H ESMAEILI ET AL
Copyright copy 2011 John Wiley amp Sons Ltd Struct Design Tall Spec Build (2011)
DOI 101002tal
8102019 The Structural Design of Tall and Special Buildings (Wiley)
httpslidepdfcomreaderfullthe-structural-design-of-tall-and-special-buildings-wiley 1113
these models has been studied in this paper The meaning of the percent of shear absorption is the ratio
of shear quantity that is endured by the columns of frame or brace in each story to the total shear
absorbed in that story Figures 11 and 12 indicate the quantity of shear absorbed by moment-resisting
frames and RC shear walls in model A and quantity of shear absorbed by moment-resisting frames
with steel bracing in model B in terms of the average of various analytical methods applied in this
study in levels of yield and ultimate strength of structure
As it is observed in these 1047297gures in system with shear wall major part of transferring lateral force inthe middle and lower stories is tolerated by RC shear wall and contribution of shear absorbed by
Figure 11 The interaction curves of the Model A and Model B for mean state of different analysis
methods in level of yield strength of structure
Figure 12 The interaction curves of the Model A and Model B for mean state of different analysis
methods in level of ultimate strength of structure
COMPARISON OF NONLINEAR BEHAVIOR OF STEEL MOMENT FRAMES
Copyright copy 2011 John Wiley amp Sons Ltd Struct Design Tall Spec Build (2011)
DOI 101002tal
8102019 The Structural Design of Tall and Special Buildings (Wiley)
httpslidepdfcomreaderfullthe-structural-design-of-tall-and-special-buildings-wiley 1213
moment-resisting frames gradually has increased in higher stories In addition in both levels of yield
and ultimate strength negative shear has been created in the last story indicating that shear wall relies
to the steel moment-resisting frame but in braced systems a main part of this process in lower stories
is carried by steel bracings and in the middle and higher stories contribution of shear absorbed by
moment-resisting frames has increased considerably as levels of yield and ultimate strength of the
structure has generated negative shear in the top two and 1047297ve stories This issue has demonstrated high
lateral stiffness for structures with shear wall system than that with braced system
6 CONCLUSIONS
Some of the key results obtained from the present analytical work are as follows
bull In the studied structures the capacity curves have larger values of lateral strength in the uniform
nonlinear static procedure than that in the triangular nonlinear static procedure However the peak
value is in the MPA The difference can show the effect of load pattern and importance of considering
the higher mode shapes in pushover analysis
bull The mean value of m and Rm factors for special steel moment-resisting frame accompanied with
special RC shear wall system (model A) is 382 whereas the value of mentioned factors is 358 for
special steel moment-resisting frame accompanied with concentrically steel braced frames (X-braces)system (model B)
bull The mean value of the over-strength factor RS for model A and model B are 165 and 144
respectively
bull The mean value of the response modi1047297cation factor R for model A and model B in allowable stress
design method are evaluated as 1378 and 1174 respectively
bull The mean value of the increasing coef 1047297cient of linear to nonlinear displacement C d for model A
and model B are evaluated as 629 and 515 respectively
bull The ductility and response modi1047297cation factors are larger for model A than model B Therefore it
seems that the use of special steel moment-resisting frame accompanied with special RC shear wall
system is more effective than the use of special steel moment-resisting frame accompanied with
concentrically steel braced frames (X-brace) system
bull
In regard to the results it seems that the C d factor for the mentioned structural systems is less thanthe values that are in Standard No 2800 (2007) The C d factor is suggested as 07 times of the
response modi1047297cation factor R in this code
REFERENCES
ACI Committee 318 2008 Building Code Requirements for Structural Concrete (ACI 318-08) and Commentary American
Concrete Institute Farmington Hills Michigan
AISC 2005 Speci 1047297cation for Structural Steel Buildings American Institute of Steel Construction Chicago
Applied Technology Council (ATC-40) 1996 Seismic Evaluation and Retro 1047297t of Concrete Buildings ATC Redwood City USA
Asgarian B Shokrgozar HR 2009 BRBF response modi1047297cation factor Journal of Constructional Steel Research 65 290ndash298
BHRC (Building and Housing Research Center) 2007 Iranian Code of Practice for Seismic Resistant Design of Buildings
Standard No 2800 ndash 07 BHRC Tehran
Chopra AK Goel RK 2003 A modal pushover analysis procedure for estimating seismic demands for buildings Earthquake
Engineering and Structural Dynamics 31
561ndash
582Comiteacute Europeen de Normalization 2005 Eurocode 8 mdash Design of Structures for Earthquake Resistance Part 3 Assessment
and Retro 1047297tting of Buildings EN 1998-3 CEN Brussels Belgium
Computers and Structures Inc 2006a Perform Components and Elements for PERFORM-3D and PERFORM-COLLAPSE CSI
Berkeley CA
Computers and Structures Inc 2006b PERFORM-3D nonlinear analysis and performance assessment for 3D structures
components and elements version4 CSI Berkeley CA
Decanini LD Liberatore L Mollaioli F 2002 Response of bare and in1047297lled RC frames under the effect of horizontal and vertical
seismic excitation In 12th European Conference on Earthquake Engineering
Federal Emergency Management Agency (FEMA) 2000 Prestandard and Commentary for the Seismic Rehabilitation of Buildings
Report No FEMA 356 Washington USA
Ferracuti B Pinho R Savoia M Francia R 2009 Veri1047297cation of displacement-based adaptive pushover through multi-ground
motion incremental dynamic analyses Engineering Structures 31 1789ndash1799
H ESMAEILI ET AL
Copyright copy 2011 John Wiley amp Sons Ltd Struct Design Tall Spec Build (2011)
DOI 101002tal
8102019 The Structural Design of Tall and Special Buildings (Wiley)
httpslidepdfcomreaderfullthe-structural-design-of-tall-and-special-buildings-wiley 1313
Hajirasouliha I Doostan A 2010 A simpli1047297ed model for seismic response prediction of concentrically braced frames Advances
in Engineering Software 41 497ndash505
Hernandez-Montes E Kwon OS Aschheim MA 2004 An energy-based formulation for 1047297rst- and multiple-mode nonlinear
static (pushover) analyses Journal of Earthquake Engineering 8(1) 69ndash88
Hsu HL Juang JL Chou CH 2011 Experimental evaluation on the seismic performance of steel knee braced frame structures
with energy dissipation mechanism Steel and Composite Structures 11(1) 77ndash91
Jung WY Aref AJ 2005 Analytical and numerical studies of polymer matrix composite sandwich in1047297ll panels Journal of
Composite Structures 68 359ndash370
Kheyroddin A 2006 Analyses and Design of Shear Walls Semnan University Press Iran
Kheyroddin A 2008 Investigation of nonlinear behavior of RC frames strengthened with steel bracing International Journal of
Engineering Sciences Iran University of Science and Technology 2(19) 25ndash35
Kim J Choi H 2005 Response modi1047297cation factors of chevron-braced frames Engineering Structures 27 285ndash300
Maheri MR Ghaffarzadeh H 2008 Connection overstrength in steel-braced RC frames Engineering Structures 30 1938ndash1948
Mohammadjafari A Jalali A 2009 Assessment of performance based parameters in near fault tall buildings Journal of Applied
Sciences 9(22) 4044ndash4049
Mortezaei A Ronagh HR Kheyroddin A Ghodrati Amiri G 2009 Effectiveness of modi1047297ed pushover analysis procedure for
the estimation of seismic demands of buildings subjected to near-fault earthquakes having forward directivity Structural
Design of Tall and Special Buildings DOI 101002tal553
New Mark NM Hall WJ 1982 Earthquake Spectra and Design Engineering Monograph Earthquake Engineering Research
Institute Berkeley CA
Tong X 2001 Seismic behavior of composite steel frame-reinforced concrete in1047297ll wall structural system PhD Thesis Department
of Civil Engineering University of Minnesota
Tong X Hajjar JF Schultz AE Shield CK 2005 Cyclic behavior of steel frame structures with composite reinforced concretein1047297ll walls and partially-restrained connections Journal of Constructional Steel Research 61 531ndash552
Uang C 1991 Establishing R (or Rw) and C d factors for building seismic provisions Jornal of Structural Engineering ASCE
117(1) 19ndash28
Wakabayashi M 1986 Design of Earthquake-resistant Buildings Mc Graw-Hill New York
COMPARISON OF NONLINEAR BEHAVIOR OF STEEL MOMENT FRAMES
Copyright copy 2011 John Wiley amp Sons Ltd Struct Design Tall Spec Build (2011)
DOI 101002tal
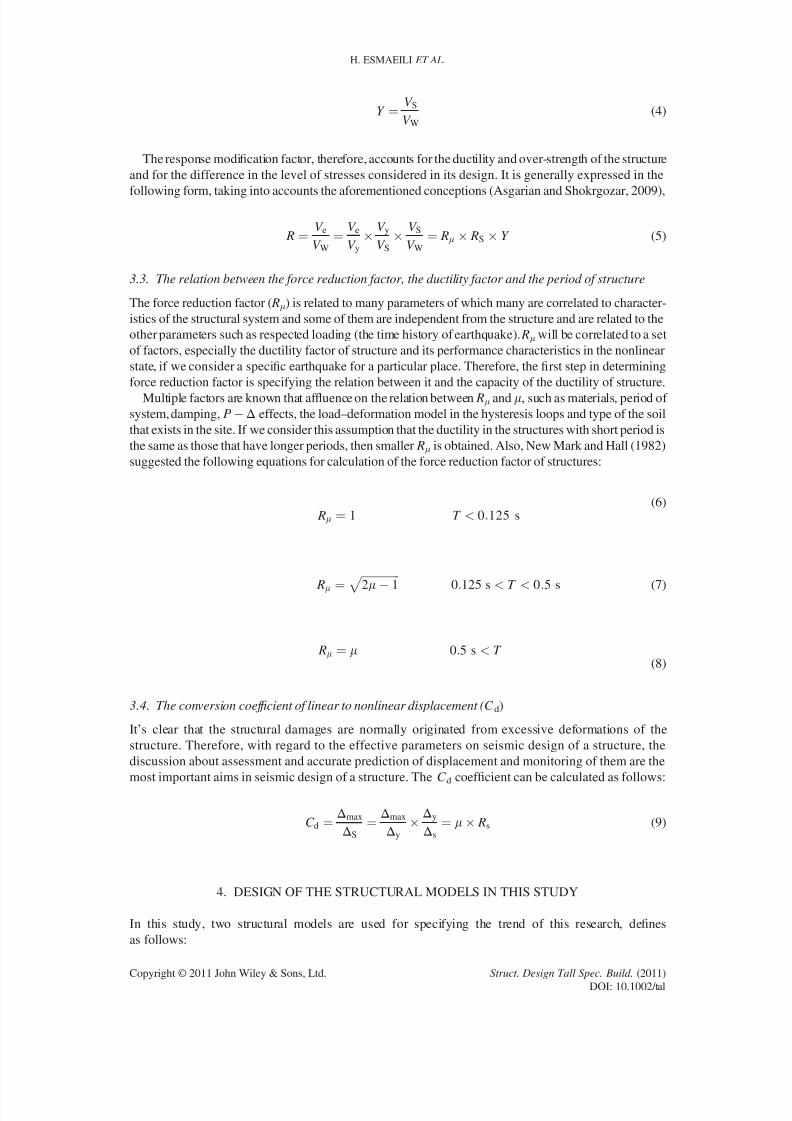
8102019 The Structural Design of Tall and Special Buildings (Wiley)
httpslidepdfcomreaderfullthe-structural-design-of-tall-and-special-buildings-wiley 513
(1) Model A A 30-story building in the form of special steel moment-resisting frame accompanied
with special RC shear wall
(2) Model B A 30-story building in the form of special steel moment-resisting frame accompanied
with concentrically steel braced frames (X-braces)
The height of the all stories is 35 m Both of them have a residential application Therefore a 1047298oor
dead load an equivalent partition load and a live load for each story of values 200 kgm 2 650 kgm 2
and 150 kgm 2 (1961 Nm 2 6374 Nm 2 and 1471 Nm 2) respectively are applied Also the structural
system of the 1047298oor is composite of RC slabs and steel secondary beams The steel material used in the
sections of the structural members is of ST37 type with yielding strength of 2400 kgcm 2
(235 359 600 Nm 2) and ultimate strength of 3700 kgcm 2 (362 846 050 Nm 2) The compressive
strength of concrete material f primec used in the shear walls is 300 kgcm 2 (29419 950 Nm 2) American
Institute of Steel Construction Speci1047297cation (AISC 2005) and American Concrete Institute Requirements
(ACI Committee 318 2008) were used to design steel members and shear wall respectively Also in
order to calculate earthquake load the spectrum dynamic method was used The equation suggested by
Kheyroddin (2006) was used to determine the thickness and the number of required shear walls
rmin frac14
hw
l w
2
835thorn 205 hw
l w
(10)
In which rmin is the minimum wall-area-to-story-area ratio hW is the total wall height and l W is the wall
length (average shear wall lengths present in building plan)
The plans of the structures the direction of the girders and secondary beams and the location of
shear walls and bracings are shown in Figures 2 and 3 In the design process of these structures it
has been tried that moment frame members tolerate 25 of earthquake forces in addition to bearing
gravity load The thicknesses of the shear walls for each story are shown in Table 1 and the sizes
of the steel braces for each story are shown in Table 2 With regard to the design of the structures
box-shaped and I-shaped sections are obtained for section area of columns and beams respectively
5 NONLINEAR ANALYSIS
51 Existing pushover analysis methods
During a pushover analysis a frame structure is subjected to gravitational loads and horizontal loads
applied at each story with the latter being incremented up to failure Ideally the distribution of horizon-
tal loads should approximate the inertia forces that are generated in the structure during an earthquake
Conventional pushover procedures adopt an invariant load pattern during the analysis and according to
a number of codes and guidelines at least two different force distributions must be considered uniform
and proportional to the 1047297rst modal shape The invariant load pattern is one of the most signi1047297cant
limitations of traditional methods because the actual inertia force distribution changes continuously
during seismic events as a result of higher mode contribution and structural degradation which modi1047297es
the stiffness of individual structural elements and consequently of the structure as a whole
A procedure that proposed by Chopra and Goel (2003) is MPA whereby a series of independent
pushover analyses are carried out considering different horizontal load patterns for each modal shapeAccording to the authors it is suf 1047297cient to consider the 1047297rst two or three modal shapes Results in terms
of capacity curves for various modal shapes are transformed in capacity curves for equivalent SDOFs
one for each mode Seismic demands are separately evaluated for each SDOF and 1047297nally combined by
the square-root-of-the-sum-of-the-squares method A common drawback of this method is the mode
superposition of results obtained from nonlinear pushover analyses carried out separately for various
modes The method neglects the interaction amongst the modes with modal superposition being
performed just as in elastic modal analysis Accordingly capacity curves typically overestimate base
shear values (Hernandez-Montes et al 2004)
On the basis of an analytical work that is conducted by Mortezaei et al (2009) it is shown that non-
linear static procedures based on invariant load vectors using elastic modal properties cannot capture
COMPARISON OF NONLINEAR BEHAVIOR OF STEEL MOMENT FRAMES
Copyright copy 2011 John Wiley amp Sons Ltd Struct Design Tall Spec Build (2011)
DOI 101002tal
8102019 The Structural Design of Tall and Special Buildings (Wiley)
httpslidepdfcomreaderfullthe-structural-design-of-tall-and-special-buildings-wiley 613
Figure 2 The structural plan of the model A
Figure 3 The structural plan of the model B
Table 1 The thickness of the shear walls in the Model A
Story 1ndash2 3ndash6 7ndash9 10ndash12 13ndash15 16ndash18 19ndash21 22ndash24 25ndash27 28ndash30
Thickness (mm) 650 600 500 500 450 400 350 300 250 200
Table 2 The sizes of the steel braces in the Model B
Story 1ndash2 3ndash6 7ndash9 10ndash12 13ndash15 16ndash21 22ndash24 25ndash27 28ndash30
Sizes of braces 2UNP300 2UNP280 2UNP260 2UNP240 2UNP220 2UNP200 2UNP180 2UNP160 2UNP140
H ESMAEILI ET AL
Copyright copy 2011 John Wiley amp Sons Ltd Struct Design Tall Spec Build (2011)
DOI 101002tal
8102019 The Structural Design of Tall and Special Buildings (Wiley)
httpslidepdfcomreaderfullthe-structural-design-of-tall-and-special-buildings-wiley 713
the changes to the dynamic modes resulting from inelastic action The variation of inertial forces must
be considered in static procedures that attempt to reproduce inelastic dynamic response
52 Nonlinear modeling of the structures
In order to assess the seismic behavior of selected buildings we have conducted a series of nonlinear
static analysis The designed structures have been used by importing into PERFORM-3D (Computers and
Structures Inc 2006a) software to create a nonlinear model After a preliminary design of the struc-tures the nonlinear model of the following elements forcendashdeformation relationship and deformation
capacities in PERFORM-3D has been developed There are a number of different ways to model inelastic
beams and columns in PERFORM At one extreme are 1047297nite element models using 1047297ber sections At the
other extreme are chord rotation models that consider the member as a whole and essentially requires
one to specify only the relationship between end moment and end rotation In between these extremes
are a number of other models In this study the chord rotation model for beams and columns has been
selected The basic model is shown in Figure 4 This is a symmetrical beam with equal and opposite
end moments and no loads along the beam length To use this model one has to specify the nonlinear
relationship between the end moment and end rotation An advantage of this model is that FEMA-356
gives speci1047297c properties including end rotation capacities (Mohammadjafari and Jalali 2009)
Figure 5 shows a PERFORM frame compound component for the chord rotation model The key parts of
this model are the FEMA beam components These are 1047297nite length components with nonlinear proper-ties The model has two of these components for cases where the strengths are different at the two ends of
element PERFORM allows user to specify different strength for two components and also different lengths
to consider cases where the in1047298ection point is not at mid-span (Mohammadjafari and Jalali 2009)
For modeling the braces the Simplr Bar element is used and parameters in Tab 5ndash6 of FEMA-356 are
implemented to model this element in the software An example of the FndashD relationship of Simplr Bar
element is shown in Figure 6
To make the RC shear wall sections de1047297ning the linear and nonlinear characteristics of its materials
(concrete and steel bar) are necessary
As it is shown in Figure 7 the stressndashstrain curve of concrete is selected in the form of trilinear with
strain hardening and its tension strength is ignored The modulus of elasticity E C is assumed to be
Figure 4 Chord rotation model
Figure 5 Basic components for chord rotation FEMA Federal Emergency Management Agency
Figure 6 Modeling of the behavior of bracing in PERFORM
COMPARISON OF NONLINEAR BEHAVIOR OF STEEL MOMENT FRAMES
Copyright copy 2011 John Wiley amp Sons Ltd Struct Design Tall Spec Build (2011)
DOI 101002tal
8102019 The Structural Design of Tall and Special Buildings (Wiley)
httpslidepdfcomreaderfullthe-structural-design-of-tall-and-special-buildings-wiley 813
261 540 kgcm 2 (2561010 Nm 2) The strain of ultimate strength of concrete eL is taken 0003
(Kheyroddin 2008) and the strain of crushing limit of concrete eCU is taken 0005 As it is seen in
Figure 7 the strain of yielding strength of concrete eY is taken 0002 then the ratio of initial modulus
of elasticity to secondary modulus of elasticity is speci1047297ed to 0402
The stressndashstrain relationship of steel bar is supposed to be bilinear (elasticndashperfectly plastic) The
modulus of elasticity E S is taken 2 100 000 kgcm 2 (2061011Nm 2) and the ultimate strain eSU
is taken 005 (Kheyroddin 2008) Also its yielding strength F Y is 4000 kgcm 2 (392 266 000 Nm 2)
53 Nonlinear analysis of the models
In this study three nonlinear static analysis approaches are used for each model which are described in
the following So six pushover analyses have been performed The center of mass at the roof level is
selected as a control point of the displacement of structure in all analysis Thus the relative lateral
displacement (drift) of the roof is used as a reference relative to lateral displacement for plotting the
capacity curves of the structures and for interpretation of the results obtained from these analyses
During application of these analyses two approaches have been used to regulate the drift of structure
The 1047297rst criterion is the limitation of reference drift and inter-story drift for the structure which is 2 on
the basis of Tab C1-3 of FEMA-356 and Standard No2800 (2007) (Table 3) Consequently the analysis
will be stopped when these drifts exceed from the mentioned limit The second criterion for 1047297nishing the
analysis is when the deformation capacity of each element is reached
531 Uniform nonlinear static procedure
To perform a static pushover analysis you must specify the distribution of horizontal loads over the
structure height The current version of PERFORM-3D (Computers and Structures Inc 2006b) allows
1047297xed distributions only (ie you cannot consider lsquoadaptiversquo load distributions that depend on the
de1047298ected shape) As will be explained later you can specify load distributions using nodal load
patterns or you can specify loads on the basis of the structure mass and a de1047298ected shape
One of the most dif 1047297cult issues for pushover analysis is choosing the pushover load distribution
During an actual earthquake the effective loads on a structure change continuously in magnitude
distribution and direction The distribution of story shears over the height of a building can thus change
substantially with time especially for taller buildings where higher modes of vibration can have
signi1047297cant effects In a static pushover analysis the distribution and direction of the loads are 1047297xed
and only the magnitude varies Hence the distribution of story shears stays constant To account for
Figure 7 Nonlinear properties of concrete
Table 3 The structural properties of model A and model B in linear design stage
Type of model T 1 (s) R V (kN) ∆ x (mm) ∆ y (mm) Max drift X Max drift Y
Model A 284 11 11 576 200 1931 00027 00026Model B 3066 9 10 791 2296 2126 0003 00028
T 1 is the natural period of the structure R is the response modi1047297cation factor of the structureV is the base shear of the structure∆ x and ∆ y are the displacements at roof level of the structure in the X and Y directions respectivelyMax drift X and max drift Y are the maximum drifts of the structure in the X and Y directions respectively
H ESMAEILI ET AL
Copyright copy 2011 John Wiley amp Sons Ltd Struct Design Tall Spec Build (2011)
DOI 101002tal
8102019 The Structural Design of Tall and Special Buildings (Wiley)
httpslidepdfcomreaderfullthe-structural-design-of-tall-and-special-buildings-wiley 913
different story shear distributions to consider a number of different pushover load distributions is
necessary One option in FEMA-356 is to use uniform and triangular distributions over the building
height Note that a uniform distribution usually corresponds to a uniform acceleration over the building
height so that the load at any 1047298oor level is proportional to the mass at the 1047298oor
In fact to access this load pattern in the software a procedure is performed for loading on the basis
of uniform displacement pattern over the building height Then in loading step the software calculates
the necessary force proportioned to the created displacement
532 Triangular nonlinear static procedure
The difference between this procedure and the previous one is in their load pattern in this procedure
the inverted triangular pro1047297le is used for displacement-based load pattern of story masses based on
FEMA-356 Therefore the imposed displacement and hence the acceleration will not be uniform over
the building height
533 Modal pushover analysis
Load distributions can be based on the structure mode shapes For a low-rise structure that is
dominated by its 1047297rst mode response a load distribution based on the 1047297rst mode may be reasonable
Also considering the higher modes is important for a structure with signi1047297cant higher mode responses
(medium-rise and high-rise buildings)
In this study the three 1047297rst mode shapes in the X -direction of structural plan (see Figures 2 and 3)
are selected to perform of modal pushover analyses
The capacity curves of models A and B which are acquired from the aforementioned pushover
procedures are converted to the ideal bilinear diagrams which are shown in Figures 8 and 9 respectively
Also the values of V S V Y V U ΔY and ΔU which are obtained from the analyses and the value of V W
Figure 8 The ideal bilinear diagrams of the pushover analyses for model A UNSP uniform nonlinear
static procedure TNSP triangular nonlinear static procedure MPA modal pushover analysis
Figure 9 The ideal bilinear diagrams of the pushover analyses for model B UNSP uniform nonlinear
static procedure TNSP triangular nonlinear static procedure MPA modal pushover analysis
COMPARISON OF NONLINEAR BEHAVIOR OF STEEL MOMENT FRAMES
Copyright copy 2011 John Wiley amp Sons Ltd Struct Design Tall Spec Build (2011)
DOI 101002tal
8102019 The Structural Design of Tall and Special Buildings (Wiley)
httpslidepdfcomreaderfullthe-structural-design-of-tall-and-special-buildings-wiley 1013
which is speci1047297ed in preliminary design stage are represented in Table 4 Therefore seismic parameters
have been calculated by using the equations which are de1047297ned in Section 3 as indicated in Table 5 Also
the averages of the aforementioned values are determined that are shown in following tables At the end
the mean of capacity curves of models A and B are shown in Figure 10
As it observed from analytical results the parameters obtained from MPA such as ductility factor
(m) force reduction factor ( Rm) and response modi1047297cation factor ( R) for the mentioned structures will
be larger than the same parameters gained from other pushover approaches This behavior can revealthe importance and hence the effect of higher mode shapes of the structure in tall buildings
Considering the capacity curves in Figure 10 it is clear that the energy dissipation of the structural
system in model A is greater than that of model B Also the mean value of response modi 1047297cation
factor ( R) for model A is bigger than the same parameter of model B Therefore structures with shear
walls have better seismic behavior rather than structures with steel X-bracings
To evaluate combined behavior and interaction of RC shear wall with steel moment-resisting frame
and comparison of that with concentrically braced frame system the percent of shear absorption of
Table 4 The structural properties of models A and B in nonlinear analysis stage
Type of model Type of analysis V W (kN) V S (kN) V Y (kN) V U (kN) ∆Y ∆U
Model A UNSP 11 576 27 125 44 047 47 628 000463 001768TNSP 18 080 31 294 35 551 000468 001678MPA 30 784 49 737 52 660 000430 001757Mean 25 329 41 692 45 283 000454 001734
Model B UNSP 10 791 26 301 37 719 38 416 000486 001759TNSP 19 443 26 291 29 734 000513 001800MPA 27 939 40 417 42 585 000426 001540Mean 24 564 35 385 36 915 000475 001700
UNSP uniform nonlinear static procedure TNSP triangular nonlinear static procedure MPA modal pushover analysis
Table 5 The seismic parameters of models A and B
Type of model Type of analysis m Rm RS Y R C d
Model A UNSP 382 162 234 1453 620TNSP 358 173 156 968 620MPA 408 162 266 1758 660Mean 382 165 219 1378 629
Model B UNSP 362 143 244 1265 519TNSP 350 144 180 910 505MPA 361 145 259 1352 522Mean 358 144 228 1174 515
UNSP uniform nonlinear static procedure TNSP triangular nonlinear static procedure MPA modal pushover analysis
Figure 10 The mean of capacity curves of the Model A and Model B
H ESMAEILI ET AL
Copyright copy 2011 John Wiley amp Sons Ltd Struct Design Tall Spec Build (2011)
DOI 101002tal
8102019 The Structural Design of Tall and Special Buildings (Wiley)
httpslidepdfcomreaderfullthe-structural-design-of-tall-and-special-buildings-wiley 1113
these models has been studied in this paper The meaning of the percent of shear absorption is the ratio
of shear quantity that is endured by the columns of frame or brace in each story to the total shear
absorbed in that story Figures 11 and 12 indicate the quantity of shear absorbed by moment-resisting
frames and RC shear walls in model A and quantity of shear absorbed by moment-resisting frames
with steel bracing in model B in terms of the average of various analytical methods applied in this
study in levels of yield and ultimate strength of structure
As it is observed in these 1047297gures in system with shear wall major part of transferring lateral force inthe middle and lower stories is tolerated by RC shear wall and contribution of shear absorbed by
Figure 11 The interaction curves of the Model A and Model B for mean state of different analysis
methods in level of yield strength of structure
Figure 12 The interaction curves of the Model A and Model B for mean state of different analysis
methods in level of ultimate strength of structure
COMPARISON OF NONLINEAR BEHAVIOR OF STEEL MOMENT FRAMES
Copyright copy 2011 John Wiley amp Sons Ltd Struct Design Tall Spec Build (2011)
DOI 101002tal
8102019 The Structural Design of Tall and Special Buildings (Wiley)
httpslidepdfcomreaderfullthe-structural-design-of-tall-and-special-buildings-wiley 1213
moment-resisting frames gradually has increased in higher stories In addition in both levels of yield
and ultimate strength negative shear has been created in the last story indicating that shear wall relies
to the steel moment-resisting frame but in braced systems a main part of this process in lower stories
is carried by steel bracings and in the middle and higher stories contribution of shear absorbed by
moment-resisting frames has increased considerably as levels of yield and ultimate strength of the
structure has generated negative shear in the top two and 1047297ve stories This issue has demonstrated high
lateral stiffness for structures with shear wall system than that with braced system
6 CONCLUSIONS
Some of the key results obtained from the present analytical work are as follows
bull In the studied structures the capacity curves have larger values of lateral strength in the uniform
nonlinear static procedure than that in the triangular nonlinear static procedure However the peak
value is in the MPA The difference can show the effect of load pattern and importance of considering
the higher mode shapes in pushover analysis
bull The mean value of m and Rm factors for special steel moment-resisting frame accompanied with
special RC shear wall system (model A) is 382 whereas the value of mentioned factors is 358 for
special steel moment-resisting frame accompanied with concentrically steel braced frames (X-braces)system (model B)
bull The mean value of the over-strength factor RS for model A and model B are 165 and 144
respectively
bull The mean value of the response modi1047297cation factor R for model A and model B in allowable stress
design method are evaluated as 1378 and 1174 respectively
bull The mean value of the increasing coef 1047297cient of linear to nonlinear displacement C d for model A
and model B are evaluated as 629 and 515 respectively
bull The ductility and response modi1047297cation factors are larger for model A than model B Therefore it
seems that the use of special steel moment-resisting frame accompanied with special RC shear wall
system is more effective than the use of special steel moment-resisting frame accompanied with
concentrically steel braced frames (X-brace) system
bull
In regard to the results it seems that the C d factor for the mentioned structural systems is less thanthe values that are in Standard No 2800 (2007) The C d factor is suggested as 07 times of the
response modi1047297cation factor R in this code
REFERENCES
ACI Committee 318 2008 Building Code Requirements for Structural Concrete (ACI 318-08) and Commentary American
Concrete Institute Farmington Hills Michigan
AISC 2005 Speci 1047297cation for Structural Steel Buildings American Institute of Steel Construction Chicago
Applied Technology Council (ATC-40) 1996 Seismic Evaluation and Retro 1047297t of Concrete Buildings ATC Redwood City USA
Asgarian B Shokrgozar HR 2009 BRBF response modi1047297cation factor Journal of Constructional Steel Research 65 290ndash298
BHRC (Building and Housing Research Center) 2007 Iranian Code of Practice for Seismic Resistant Design of Buildings
Standard No 2800 ndash 07 BHRC Tehran
Chopra AK Goel RK 2003 A modal pushover analysis procedure for estimating seismic demands for buildings Earthquake
Engineering and Structural Dynamics 31
561ndash
582Comiteacute Europeen de Normalization 2005 Eurocode 8 mdash Design of Structures for Earthquake Resistance Part 3 Assessment
and Retro 1047297tting of Buildings EN 1998-3 CEN Brussels Belgium
Computers and Structures Inc 2006a Perform Components and Elements for PERFORM-3D and PERFORM-COLLAPSE CSI
Berkeley CA
Computers and Structures Inc 2006b PERFORM-3D nonlinear analysis and performance assessment for 3D structures
components and elements version4 CSI Berkeley CA
Decanini LD Liberatore L Mollaioli F 2002 Response of bare and in1047297lled RC frames under the effect of horizontal and vertical
seismic excitation In 12th European Conference on Earthquake Engineering
Federal Emergency Management Agency (FEMA) 2000 Prestandard and Commentary for the Seismic Rehabilitation of Buildings
Report No FEMA 356 Washington USA
Ferracuti B Pinho R Savoia M Francia R 2009 Veri1047297cation of displacement-based adaptive pushover through multi-ground
motion incremental dynamic analyses Engineering Structures 31 1789ndash1799
H ESMAEILI ET AL
Copyright copy 2011 John Wiley amp Sons Ltd Struct Design Tall Spec Build (2011)
DOI 101002tal
8102019 The Structural Design of Tall and Special Buildings (Wiley)
httpslidepdfcomreaderfullthe-structural-design-of-tall-and-special-buildings-wiley 1313
Hajirasouliha I Doostan A 2010 A simpli1047297ed model for seismic response prediction of concentrically braced frames Advances
in Engineering Software 41 497ndash505
Hernandez-Montes E Kwon OS Aschheim MA 2004 An energy-based formulation for 1047297rst- and multiple-mode nonlinear
static (pushover) analyses Journal of Earthquake Engineering 8(1) 69ndash88
Hsu HL Juang JL Chou CH 2011 Experimental evaluation on the seismic performance of steel knee braced frame structures
with energy dissipation mechanism Steel and Composite Structures 11(1) 77ndash91
Jung WY Aref AJ 2005 Analytical and numerical studies of polymer matrix composite sandwich in1047297ll panels Journal of
Composite Structures 68 359ndash370
Kheyroddin A 2006 Analyses and Design of Shear Walls Semnan University Press Iran
Kheyroddin A 2008 Investigation of nonlinear behavior of RC frames strengthened with steel bracing International Journal of
Engineering Sciences Iran University of Science and Technology 2(19) 25ndash35
Kim J Choi H 2005 Response modi1047297cation factors of chevron-braced frames Engineering Structures 27 285ndash300
Maheri MR Ghaffarzadeh H 2008 Connection overstrength in steel-braced RC frames Engineering Structures 30 1938ndash1948
Mohammadjafari A Jalali A 2009 Assessment of performance based parameters in near fault tall buildings Journal of Applied
Sciences 9(22) 4044ndash4049
Mortezaei A Ronagh HR Kheyroddin A Ghodrati Amiri G 2009 Effectiveness of modi1047297ed pushover analysis procedure for
the estimation of seismic demands of buildings subjected to near-fault earthquakes having forward directivity Structural
Design of Tall and Special Buildings DOI 101002tal553
New Mark NM Hall WJ 1982 Earthquake Spectra and Design Engineering Monograph Earthquake Engineering Research
Institute Berkeley CA
Tong X 2001 Seismic behavior of composite steel frame-reinforced concrete in1047297ll wall structural system PhD Thesis Department
of Civil Engineering University of Minnesota
Tong X Hajjar JF Schultz AE Shield CK 2005 Cyclic behavior of steel frame structures with composite reinforced concretein1047297ll walls and partially-restrained connections Journal of Constructional Steel Research 61 531ndash552
Uang C 1991 Establishing R (or Rw) and C d factors for building seismic provisions Jornal of Structural Engineering ASCE
117(1) 19ndash28
Wakabayashi M 1986 Design of Earthquake-resistant Buildings Mc Graw-Hill New York
COMPARISON OF NONLINEAR BEHAVIOR OF STEEL MOMENT FRAMES
Copyright copy 2011 John Wiley amp Sons Ltd Struct Design Tall Spec Build (2011)
DOI 101002tal
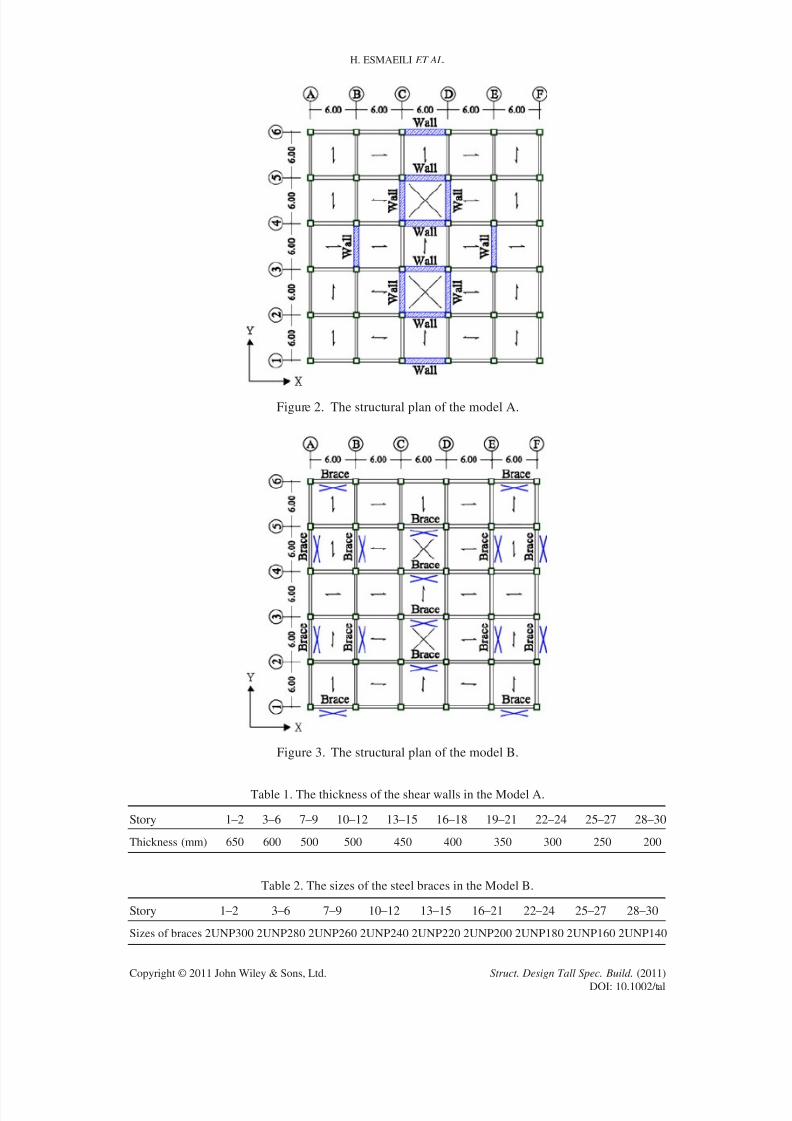
8102019 The Structural Design of Tall and Special Buildings (Wiley)
httpslidepdfcomreaderfullthe-structural-design-of-tall-and-special-buildings-wiley 713
the changes to the dynamic modes resulting from inelastic action The variation of inertial forces must
be considered in static procedures that attempt to reproduce inelastic dynamic response
52 Nonlinear modeling of the structures
In order to assess the seismic behavior of selected buildings we have conducted a series of nonlinear
static analysis The designed structures have been used by importing into PERFORM-3D (Computers and
Structures Inc 2006a) software to create a nonlinear model After a preliminary design of the struc-tures the nonlinear model of the following elements forcendashdeformation relationship and deformation
capacities in PERFORM-3D has been developed There are a number of different ways to model inelastic
beams and columns in PERFORM At one extreme are 1047297nite element models using 1047297ber sections At the
other extreme are chord rotation models that consider the member as a whole and essentially requires
one to specify only the relationship between end moment and end rotation In between these extremes
are a number of other models In this study the chord rotation model for beams and columns has been
selected The basic model is shown in Figure 4 This is a symmetrical beam with equal and opposite
end moments and no loads along the beam length To use this model one has to specify the nonlinear
relationship between the end moment and end rotation An advantage of this model is that FEMA-356
gives speci1047297c properties including end rotation capacities (Mohammadjafari and Jalali 2009)
Figure 5 shows a PERFORM frame compound component for the chord rotation model The key parts of
this model are the FEMA beam components These are 1047297nite length components with nonlinear proper-ties The model has two of these components for cases where the strengths are different at the two ends of
element PERFORM allows user to specify different strength for two components and also different lengths
to consider cases where the in1047298ection point is not at mid-span (Mohammadjafari and Jalali 2009)
For modeling the braces the Simplr Bar element is used and parameters in Tab 5ndash6 of FEMA-356 are
implemented to model this element in the software An example of the FndashD relationship of Simplr Bar
element is shown in Figure 6
To make the RC shear wall sections de1047297ning the linear and nonlinear characteristics of its materials
(concrete and steel bar) are necessary
As it is shown in Figure 7 the stressndashstrain curve of concrete is selected in the form of trilinear with
strain hardening and its tension strength is ignored The modulus of elasticity E C is assumed to be
Figure 4 Chord rotation model
Figure 5 Basic components for chord rotation FEMA Federal Emergency Management Agency
Figure 6 Modeling of the behavior of bracing in PERFORM
COMPARISON OF NONLINEAR BEHAVIOR OF STEEL MOMENT FRAMES
Copyright copy 2011 John Wiley amp Sons Ltd Struct Design Tall Spec Build (2011)
DOI 101002tal
8102019 The Structural Design of Tall and Special Buildings (Wiley)
httpslidepdfcomreaderfullthe-structural-design-of-tall-and-special-buildings-wiley 813
261 540 kgcm 2 (2561010 Nm 2) The strain of ultimate strength of concrete eL is taken 0003
(Kheyroddin 2008) and the strain of crushing limit of concrete eCU is taken 0005 As it is seen in
Figure 7 the strain of yielding strength of concrete eY is taken 0002 then the ratio of initial modulus
of elasticity to secondary modulus of elasticity is speci1047297ed to 0402
The stressndashstrain relationship of steel bar is supposed to be bilinear (elasticndashperfectly plastic) The
modulus of elasticity E S is taken 2 100 000 kgcm 2 (2061011Nm 2) and the ultimate strain eSU
is taken 005 (Kheyroddin 2008) Also its yielding strength F Y is 4000 kgcm 2 (392 266 000 Nm 2)
53 Nonlinear analysis of the models
In this study three nonlinear static analysis approaches are used for each model which are described in
the following So six pushover analyses have been performed The center of mass at the roof level is
selected as a control point of the displacement of structure in all analysis Thus the relative lateral
displacement (drift) of the roof is used as a reference relative to lateral displacement for plotting the
capacity curves of the structures and for interpretation of the results obtained from these analyses
During application of these analyses two approaches have been used to regulate the drift of structure
The 1047297rst criterion is the limitation of reference drift and inter-story drift for the structure which is 2 on
the basis of Tab C1-3 of FEMA-356 and Standard No2800 (2007) (Table 3) Consequently the analysis
will be stopped when these drifts exceed from the mentioned limit The second criterion for 1047297nishing the
analysis is when the deformation capacity of each element is reached
531 Uniform nonlinear static procedure
To perform a static pushover analysis you must specify the distribution of horizontal loads over the
structure height The current version of PERFORM-3D (Computers and Structures Inc 2006b) allows
1047297xed distributions only (ie you cannot consider lsquoadaptiversquo load distributions that depend on the
de1047298ected shape) As will be explained later you can specify load distributions using nodal load
patterns or you can specify loads on the basis of the structure mass and a de1047298ected shape
One of the most dif 1047297cult issues for pushover analysis is choosing the pushover load distribution
During an actual earthquake the effective loads on a structure change continuously in magnitude
distribution and direction The distribution of story shears over the height of a building can thus change
substantially with time especially for taller buildings where higher modes of vibration can have
signi1047297cant effects In a static pushover analysis the distribution and direction of the loads are 1047297xed
and only the magnitude varies Hence the distribution of story shears stays constant To account for
Figure 7 Nonlinear properties of concrete
Table 3 The structural properties of model A and model B in linear design stage
Type of model T 1 (s) R V (kN) ∆ x (mm) ∆ y (mm) Max drift X Max drift Y
Model A 284 11 11 576 200 1931 00027 00026Model B 3066 9 10 791 2296 2126 0003 00028
T 1 is the natural period of the structure R is the response modi1047297cation factor of the structureV is the base shear of the structure∆ x and ∆ y are the displacements at roof level of the structure in the X and Y directions respectivelyMax drift X and max drift Y are the maximum drifts of the structure in the X and Y directions respectively
H ESMAEILI ET AL
Copyright copy 2011 John Wiley amp Sons Ltd Struct Design Tall Spec Build (2011)
DOI 101002tal
8102019 The Structural Design of Tall and Special Buildings (Wiley)
httpslidepdfcomreaderfullthe-structural-design-of-tall-and-special-buildings-wiley 913
different story shear distributions to consider a number of different pushover load distributions is
necessary One option in FEMA-356 is to use uniform and triangular distributions over the building
height Note that a uniform distribution usually corresponds to a uniform acceleration over the building
height so that the load at any 1047298oor level is proportional to the mass at the 1047298oor
In fact to access this load pattern in the software a procedure is performed for loading on the basis
of uniform displacement pattern over the building height Then in loading step the software calculates
the necessary force proportioned to the created displacement
532 Triangular nonlinear static procedure
The difference between this procedure and the previous one is in their load pattern in this procedure
the inverted triangular pro1047297le is used for displacement-based load pattern of story masses based on
FEMA-356 Therefore the imposed displacement and hence the acceleration will not be uniform over
the building height
533 Modal pushover analysis
Load distributions can be based on the structure mode shapes For a low-rise structure that is
dominated by its 1047297rst mode response a load distribution based on the 1047297rst mode may be reasonable
Also considering the higher modes is important for a structure with signi1047297cant higher mode responses
(medium-rise and high-rise buildings)
In this study the three 1047297rst mode shapes in the X -direction of structural plan (see Figures 2 and 3)
are selected to perform of modal pushover analyses
The capacity curves of models A and B which are acquired from the aforementioned pushover
procedures are converted to the ideal bilinear diagrams which are shown in Figures 8 and 9 respectively
Also the values of V S V Y V U ΔY and ΔU which are obtained from the analyses and the value of V W
Figure 8 The ideal bilinear diagrams of the pushover analyses for model A UNSP uniform nonlinear
static procedure TNSP triangular nonlinear static procedure MPA modal pushover analysis
Figure 9 The ideal bilinear diagrams of the pushover analyses for model B UNSP uniform nonlinear
static procedure TNSP triangular nonlinear static procedure MPA modal pushover analysis
COMPARISON OF NONLINEAR BEHAVIOR OF STEEL MOMENT FRAMES
Copyright copy 2011 John Wiley amp Sons Ltd Struct Design Tall Spec Build (2011)
DOI 101002tal
8102019 The Structural Design of Tall and Special Buildings (Wiley)
httpslidepdfcomreaderfullthe-structural-design-of-tall-and-special-buildings-wiley 1013
which is speci1047297ed in preliminary design stage are represented in Table 4 Therefore seismic parameters
have been calculated by using the equations which are de1047297ned in Section 3 as indicated in Table 5 Also
the averages of the aforementioned values are determined that are shown in following tables At the end
the mean of capacity curves of models A and B are shown in Figure 10
As it observed from analytical results the parameters obtained from MPA such as ductility factor
(m) force reduction factor ( Rm) and response modi1047297cation factor ( R) for the mentioned structures will
be larger than the same parameters gained from other pushover approaches This behavior can revealthe importance and hence the effect of higher mode shapes of the structure in tall buildings
Considering the capacity curves in Figure 10 it is clear that the energy dissipation of the structural
system in model A is greater than that of model B Also the mean value of response modi 1047297cation
factor ( R) for model A is bigger than the same parameter of model B Therefore structures with shear
walls have better seismic behavior rather than structures with steel X-bracings
To evaluate combined behavior and interaction of RC shear wall with steel moment-resisting frame
and comparison of that with concentrically braced frame system the percent of shear absorption of
Table 4 The structural properties of models A and B in nonlinear analysis stage
Type of model Type of analysis V W (kN) V S (kN) V Y (kN) V U (kN) ∆Y ∆U
Model A UNSP 11 576 27 125 44 047 47 628 000463 001768TNSP 18 080 31 294 35 551 000468 001678MPA 30 784 49 737 52 660 000430 001757Mean 25 329 41 692 45 283 000454 001734
Model B UNSP 10 791 26 301 37 719 38 416 000486 001759TNSP 19 443 26 291 29 734 000513 001800MPA 27 939 40 417 42 585 000426 001540Mean 24 564 35 385 36 915 000475 001700
UNSP uniform nonlinear static procedure TNSP triangular nonlinear static procedure MPA modal pushover analysis
Table 5 The seismic parameters of models A and B
Type of model Type of analysis m Rm RS Y R C d
Model A UNSP 382 162 234 1453 620TNSP 358 173 156 968 620MPA 408 162 266 1758 660Mean 382 165 219 1378 629
Model B UNSP 362 143 244 1265 519TNSP 350 144 180 910 505MPA 361 145 259 1352 522Mean 358 144 228 1174 515
UNSP uniform nonlinear static procedure TNSP triangular nonlinear static procedure MPA modal pushover analysis
Figure 10 The mean of capacity curves of the Model A and Model B
H ESMAEILI ET AL
Copyright copy 2011 John Wiley amp Sons Ltd Struct Design Tall Spec Build (2011)
DOI 101002tal
8102019 The Structural Design of Tall and Special Buildings (Wiley)
httpslidepdfcomreaderfullthe-structural-design-of-tall-and-special-buildings-wiley 1113
these models has been studied in this paper The meaning of the percent of shear absorption is the ratio
of shear quantity that is endured by the columns of frame or brace in each story to the total shear
absorbed in that story Figures 11 and 12 indicate the quantity of shear absorbed by moment-resisting
frames and RC shear walls in model A and quantity of shear absorbed by moment-resisting frames
with steel bracing in model B in terms of the average of various analytical methods applied in this
study in levels of yield and ultimate strength of structure
As it is observed in these 1047297gures in system with shear wall major part of transferring lateral force inthe middle and lower stories is tolerated by RC shear wall and contribution of shear absorbed by
Figure 11 The interaction curves of the Model A and Model B for mean state of different analysis
methods in level of yield strength of structure
Figure 12 The interaction curves of the Model A and Model B for mean state of different analysis
methods in level of ultimate strength of structure
COMPARISON OF NONLINEAR BEHAVIOR OF STEEL MOMENT FRAMES
Copyright copy 2011 John Wiley amp Sons Ltd Struct Design Tall Spec Build (2011)
DOI 101002tal
8102019 The Structural Design of Tall and Special Buildings (Wiley)
httpslidepdfcomreaderfullthe-structural-design-of-tall-and-special-buildings-wiley 1213
moment-resisting frames gradually has increased in higher stories In addition in both levels of yield
and ultimate strength negative shear has been created in the last story indicating that shear wall relies
to the steel moment-resisting frame but in braced systems a main part of this process in lower stories
is carried by steel bracings and in the middle and higher stories contribution of shear absorbed by
moment-resisting frames has increased considerably as levels of yield and ultimate strength of the
structure has generated negative shear in the top two and 1047297ve stories This issue has demonstrated high
lateral stiffness for structures with shear wall system than that with braced system
6 CONCLUSIONS
Some of the key results obtained from the present analytical work are as follows
bull In the studied structures the capacity curves have larger values of lateral strength in the uniform
nonlinear static procedure than that in the triangular nonlinear static procedure However the peak
value is in the MPA The difference can show the effect of load pattern and importance of considering
the higher mode shapes in pushover analysis
bull The mean value of m and Rm factors for special steel moment-resisting frame accompanied with
special RC shear wall system (model A) is 382 whereas the value of mentioned factors is 358 for
special steel moment-resisting frame accompanied with concentrically steel braced frames (X-braces)system (model B)
bull The mean value of the over-strength factor RS for model A and model B are 165 and 144
respectively
bull The mean value of the response modi1047297cation factor R for model A and model B in allowable stress
design method are evaluated as 1378 and 1174 respectively
bull The mean value of the increasing coef 1047297cient of linear to nonlinear displacement C d for model A
and model B are evaluated as 629 and 515 respectively
bull The ductility and response modi1047297cation factors are larger for model A than model B Therefore it
seems that the use of special steel moment-resisting frame accompanied with special RC shear wall
system is more effective than the use of special steel moment-resisting frame accompanied with
concentrically steel braced frames (X-brace) system
bull
In regard to the results it seems that the C d factor for the mentioned structural systems is less thanthe values that are in Standard No 2800 (2007) The C d factor is suggested as 07 times of the
response modi1047297cation factor R in this code
REFERENCES
ACI Committee 318 2008 Building Code Requirements for Structural Concrete (ACI 318-08) and Commentary American
Concrete Institute Farmington Hills Michigan
AISC 2005 Speci 1047297cation for Structural Steel Buildings American Institute of Steel Construction Chicago
Applied Technology Council (ATC-40) 1996 Seismic Evaluation and Retro 1047297t of Concrete Buildings ATC Redwood City USA
Asgarian B Shokrgozar HR 2009 BRBF response modi1047297cation factor Journal of Constructional Steel Research 65 290ndash298
BHRC (Building and Housing Research Center) 2007 Iranian Code of Practice for Seismic Resistant Design of Buildings
Standard No 2800 ndash 07 BHRC Tehran
Chopra AK Goel RK 2003 A modal pushover analysis procedure for estimating seismic demands for buildings Earthquake
Engineering and Structural Dynamics 31
561ndash
582Comiteacute Europeen de Normalization 2005 Eurocode 8 mdash Design of Structures for Earthquake Resistance Part 3 Assessment
and Retro 1047297tting of Buildings EN 1998-3 CEN Brussels Belgium
Computers and Structures Inc 2006a Perform Components and Elements for PERFORM-3D and PERFORM-COLLAPSE CSI
Berkeley CA
Computers and Structures Inc 2006b PERFORM-3D nonlinear analysis and performance assessment for 3D structures
components and elements version4 CSI Berkeley CA
Decanini LD Liberatore L Mollaioli F 2002 Response of bare and in1047297lled RC frames under the effect of horizontal and vertical
seismic excitation In 12th European Conference on Earthquake Engineering
Federal Emergency Management Agency (FEMA) 2000 Prestandard and Commentary for the Seismic Rehabilitation of Buildings
Report No FEMA 356 Washington USA
Ferracuti B Pinho R Savoia M Francia R 2009 Veri1047297cation of displacement-based adaptive pushover through multi-ground
motion incremental dynamic analyses Engineering Structures 31 1789ndash1799
H ESMAEILI ET AL
Copyright copy 2011 John Wiley amp Sons Ltd Struct Design Tall Spec Build (2011)
DOI 101002tal
8102019 The Structural Design of Tall and Special Buildings (Wiley)
httpslidepdfcomreaderfullthe-structural-design-of-tall-and-special-buildings-wiley 1313
Hajirasouliha I Doostan A 2010 A simpli1047297ed model for seismic response prediction of concentrically braced frames Advances
in Engineering Software 41 497ndash505
Hernandez-Montes E Kwon OS Aschheim MA 2004 An energy-based formulation for 1047297rst- and multiple-mode nonlinear
static (pushover) analyses Journal of Earthquake Engineering 8(1) 69ndash88
Hsu HL Juang JL Chou CH 2011 Experimental evaluation on the seismic performance of steel knee braced frame structures
with energy dissipation mechanism Steel and Composite Structures 11(1) 77ndash91
Jung WY Aref AJ 2005 Analytical and numerical studies of polymer matrix composite sandwich in1047297ll panels Journal of
Composite Structures 68 359ndash370
Kheyroddin A 2006 Analyses and Design of Shear Walls Semnan University Press Iran
Kheyroddin A 2008 Investigation of nonlinear behavior of RC frames strengthened with steel bracing International Journal of
Engineering Sciences Iran University of Science and Technology 2(19) 25ndash35
Kim J Choi H 2005 Response modi1047297cation factors of chevron-braced frames Engineering Structures 27 285ndash300
Maheri MR Ghaffarzadeh H 2008 Connection overstrength in steel-braced RC frames Engineering Structures 30 1938ndash1948
Mohammadjafari A Jalali A 2009 Assessment of performance based parameters in near fault tall buildings Journal of Applied
Sciences 9(22) 4044ndash4049
Mortezaei A Ronagh HR Kheyroddin A Ghodrati Amiri G 2009 Effectiveness of modi1047297ed pushover analysis procedure for
the estimation of seismic demands of buildings subjected to near-fault earthquakes having forward directivity Structural
Design of Tall and Special Buildings DOI 101002tal553
New Mark NM Hall WJ 1982 Earthquake Spectra and Design Engineering Monograph Earthquake Engineering Research
Institute Berkeley CA
Tong X 2001 Seismic behavior of composite steel frame-reinforced concrete in1047297ll wall structural system PhD Thesis Department
of Civil Engineering University of Minnesota
Tong X Hajjar JF Schultz AE Shield CK 2005 Cyclic behavior of steel frame structures with composite reinforced concretein1047297ll walls and partially-restrained connections Journal of Constructional Steel Research 61 531ndash552
Uang C 1991 Establishing R (or Rw) and C d factors for building seismic provisions Jornal of Structural Engineering ASCE
117(1) 19ndash28
Wakabayashi M 1986 Design of Earthquake-resistant Buildings Mc Graw-Hill New York
COMPARISON OF NONLINEAR BEHAVIOR OF STEEL MOMENT FRAMES
Copyright copy 2011 John Wiley amp Sons Ltd Struct Design Tall Spec Build (2011)
DOI 101002tal
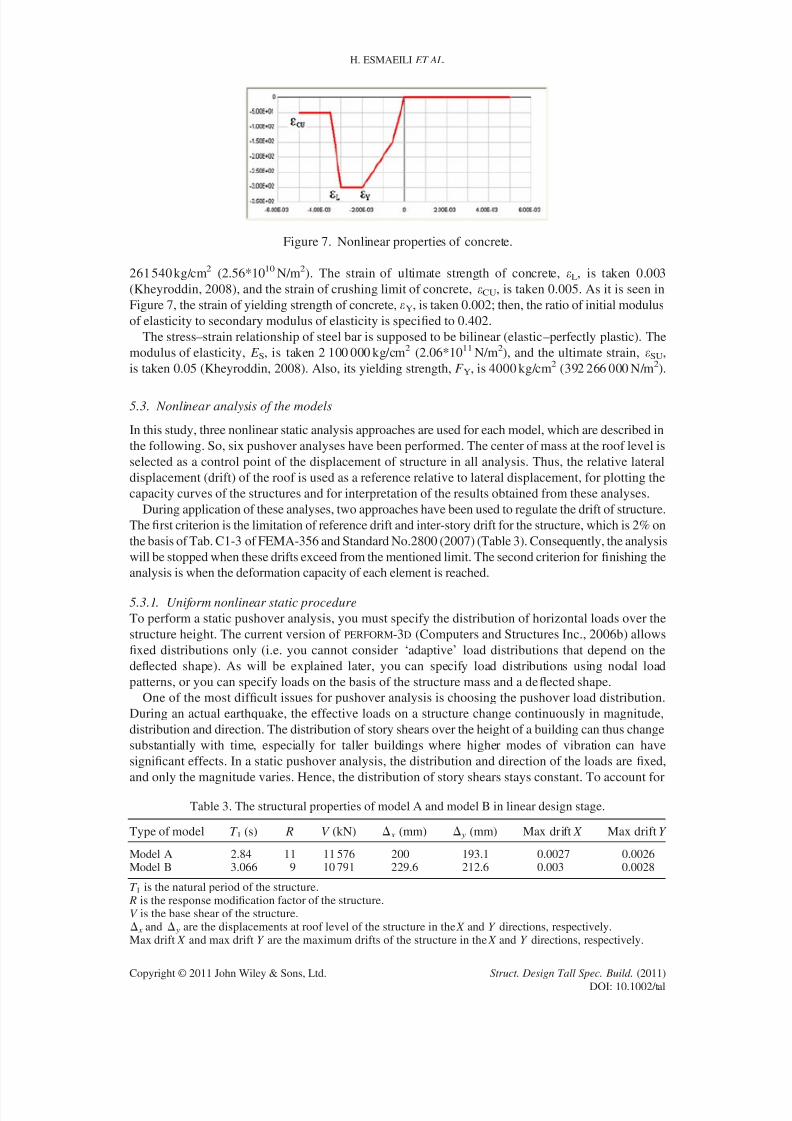
8102019 The Structural Design of Tall and Special Buildings (Wiley)
httpslidepdfcomreaderfullthe-structural-design-of-tall-and-special-buildings-wiley 1113
these models has been studied in this paper The meaning of the percent of shear absorption is the ratio
of shear quantity that is endured by the columns of frame or brace in each story to the total shear
absorbed in that story Figures 11 and 12 indicate the quantity of shear absorbed by moment-resisting
frames and RC shear walls in model A and quantity of shear absorbed by moment-resisting frames
with steel bracing in model B in terms of the average of various analytical methods applied in this
study in levels of yield and ultimate strength of structure
As it is observed in these 1047297gures in system with shear wall major part of transferring lateral force inthe middle and lower stories is tolerated by RC shear wall and contribution of shear absorbed by
Figure 11 The interaction curves of the Model A and Model B for mean state of different analysis
methods in level of yield strength of structure
Figure 12 The interaction curves of the Model A and Model B for mean state of different analysis
methods in level of ultimate strength of structure
COMPARISON OF NONLINEAR BEHAVIOR OF STEEL MOMENT FRAMES
Copyright copy 2011 John Wiley amp Sons Ltd Struct Design Tall Spec Build (2011)
DOI 101002tal
8102019 The Structural Design of Tall and Special Buildings (Wiley)
httpslidepdfcomreaderfullthe-structural-design-of-tall-and-special-buildings-wiley 1213
moment-resisting frames gradually has increased in higher stories In addition in both levels of yield
and ultimate strength negative shear has been created in the last story indicating that shear wall relies
to the steel moment-resisting frame but in braced systems a main part of this process in lower stories
is carried by steel bracings and in the middle and higher stories contribution of shear absorbed by
moment-resisting frames has increased considerably as levels of yield and ultimate strength of the
structure has generated negative shear in the top two and 1047297ve stories This issue has demonstrated high
lateral stiffness for structures with shear wall system than that with braced system
6 CONCLUSIONS
Some of the key results obtained from the present analytical work are as follows
bull In the studied structures the capacity curves have larger values of lateral strength in the uniform
nonlinear static procedure than that in the triangular nonlinear static procedure However the peak
value is in the MPA The difference can show the effect of load pattern and importance of considering
the higher mode shapes in pushover analysis
bull The mean value of m and Rm factors for special steel moment-resisting frame accompanied with
special RC shear wall system (model A) is 382 whereas the value of mentioned factors is 358 for
special steel moment-resisting frame accompanied with concentrically steel braced frames (X-braces)system (model B)
bull The mean value of the over-strength factor RS for model A and model B are 165 and 144
respectively
bull The mean value of the response modi1047297cation factor R for model A and model B in allowable stress
design method are evaluated as 1378 and 1174 respectively
bull The mean value of the increasing coef 1047297cient of linear to nonlinear displacement C d for model A
and model B are evaluated as 629 and 515 respectively
bull The ductility and response modi1047297cation factors are larger for model A than model B Therefore it
seems that the use of special steel moment-resisting frame accompanied with special RC shear wall
system is more effective than the use of special steel moment-resisting frame accompanied with
concentrically steel braced frames (X-brace) system
bull
In regard to the results it seems that the C d factor for the mentioned structural systems is less thanthe values that are in Standard No 2800 (2007) The C d factor is suggested as 07 times of the
response modi1047297cation factor R in this code
REFERENCES
ACI Committee 318 2008 Building Code Requirements for Structural Concrete (ACI 318-08) and Commentary American
Concrete Institute Farmington Hills Michigan
AISC 2005 Speci 1047297cation for Structural Steel Buildings American Institute of Steel Construction Chicago
Applied Technology Council (ATC-40) 1996 Seismic Evaluation and Retro 1047297t of Concrete Buildings ATC Redwood City USA
Asgarian B Shokrgozar HR 2009 BRBF response modi1047297cation factor Journal of Constructional Steel Research 65 290ndash298
BHRC (Building and Housing Research Center) 2007 Iranian Code of Practice for Seismic Resistant Design of Buildings
Standard No 2800 ndash 07 BHRC Tehran
Chopra AK Goel RK 2003 A modal pushover analysis procedure for estimating seismic demands for buildings Earthquake
Engineering and Structural Dynamics 31
561ndash
582Comiteacute Europeen de Normalization 2005 Eurocode 8 mdash Design of Structures for Earthquake Resistance Part 3 Assessment
and Retro 1047297tting of Buildings EN 1998-3 CEN Brussels Belgium
Computers and Structures Inc 2006a Perform Components and Elements for PERFORM-3D and PERFORM-COLLAPSE CSI
Berkeley CA
Computers and Structures Inc 2006b PERFORM-3D nonlinear analysis and performance assessment for 3D structures
components and elements version4 CSI Berkeley CA
Decanini LD Liberatore L Mollaioli F 2002 Response of bare and in1047297lled RC frames under the effect of horizontal and vertical
seismic excitation In 12th European Conference on Earthquake Engineering
Federal Emergency Management Agency (FEMA) 2000 Prestandard and Commentary for the Seismic Rehabilitation of Buildings
Report No FEMA 356 Washington USA
Ferracuti B Pinho R Savoia M Francia R 2009 Veri1047297cation of displacement-based adaptive pushover through multi-ground
motion incremental dynamic analyses Engineering Structures 31 1789ndash1799
H ESMAEILI ET AL
Copyright copy 2011 John Wiley amp Sons Ltd Struct Design Tall Spec Build (2011)
DOI 101002tal
8102019 The Structural Design of Tall and Special Buildings (Wiley)
httpslidepdfcomreaderfullthe-structural-design-of-tall-and-special-buildings-wiley 1313
Hajirasouliha I Doostan A 2010 A simpli1047297ed model for seismic response prediction of concentrically braced frames Advances
in Engineering Software 41 497ndash505
Hernandez-Montes E Kwon OS Aschheim MA 2004 An energy-based formulation for 1047297rst- and multiple-mode nonlinear
static (pushover) analyses Journal of Earthquake Engineering 8(1) 69ndash88
Hsu HL Juang JL Chou CH 2011 Experimental evaluation on the seismic performance of steel knee braced frame structures
with energy dissipation mechanism Steel and Composite Structures 11(1) 77ndash91
Jung WY Aref AJ 2005 Analytical and numerical studies of polymer matrix composite sandwich in1047297ll panels Journal of
Composite Structures 68 359ndash370
Kheyroddin A 2006 Analyses and Design of Shear Walls Semnan University Press Iran
Kheyroddin A 2008 Investigation of nonlinear behavior of RC frames strengthened with steel bracing International Journal of
Engineering Sciences Iran University of Science and Technology 2(19) 25ndash35
Kim J Choi H 2005 Response modi1047297cation factors of chevron-braced frames Engineering Structures 27 285ndash300
Maheri MR Ghaffarzadeh H 2008 Connection overstrength in steel-braced RC frames Engineering Structures 30 1938ndash1948
Mohammadjafari A Jalali A 2009 Assessment of performance based parameters in near fault tall buildings Journal of Applied
Sciences 9(22) 4044ndash4049
Mortezaei A Ronagh HR Kheyroddin A Ghodrati Amiri G 2009 Effectiveness of modi1047297ed pushover analysis procedure for
the estimation of seismic demands of buildings subjected to near-fault earthquakes having forward directivity Structural
Design of Tall and Special Buildings DOI 101002tal553
New Mark NM Hall WJ 1982 Earthquake Spectra and Design Engineering Monograph Earthquake Engineering Research
Institute Berkeley CA
Tong X 2001 Seismic behavior of composite steel frame-reinforced concrete in1047297ll wall structural system PhD Thesis Department
of Civil Engineering University of Minnesota
Tong X Hajjar JF Schultz AE Shield CK 2005 Cyclic behavior of steel frame structures with composite reinforced concretein1047297ll walls and partially-restrained connections Journal of Constructional Steel Research 61 531ndash552
Uang C 1991 Establishing R (or Rw) and C d factors for building seismic provisions Jornal of Structural Engineering ASCE
117(1) 19ndash28
Wakabayashi M 1986 Design of Earthquake-resistant Buildings Mc Graw-Hill New York
COMPARISON OF NONLINEAR BEHAVIOR OF STEEL MOMENT FRAMES
Copyright copy 2011 John Wiley amp Sons Ltd Struct Design Tall Spec Build (2011)
DOI 101002tal
8102019 The Structural Design of Tall and Special Buildings (Wiley)
httpslidepdfcomreaderfullthe-structural-design-of-tall-and-special-buildings-wiley 1313
Hajirasouliha I Doostan A 2010 A simpli1047297ed model for seismic response prediction of concentrically braced frames Advances
in Engineering Software 41 497ndash505
Hernandez-Montes E Kwon OS Aschheim MA 2004 An energy-based formulation for 1047297rst- and multiple-mode nonlinear
static (pushover) analyses Journal of Earthquake Engineering 8(1) 69ndash88
Hsu HL Juang JL Chou CH 2011 Experimental evaluation on the seismic performance of steel knee braced frame structures
with energy dissipation mechanism Steel and Composite Structures 11(1) 77ndash91
Jung WY Aref AJ 2005 Analytical and numerical studies of polymer matrix composite sandwich in1047297ll panels Journal of
Composite Structures 68 359ndash370
Kheyroddin A 2006 Analyses and Design of Shear Walls Semnan University Press Iran
Kheyroddin A 2008 Investigation of nonlinear behavior of RC frames strengthened with steel bracing International Journal of
Engineering Sciences Iran University of Science and Technology 2(19) 25ndash35
Kim J Choi H 2005 Response modi1047297cation factors of chevron-braced frames Engineering Structures 27 285ndash300
Maheri MR Ghaffarzadeh H 2008 Connection overstrength in steel-braced RC frames Engineering Structures 30 1938ndash1948
Mohammadjafari A Jalali A 2009 Assessment of performance based parameters in near fault tall buildings Journal of Applied
Sciences 9(22) 4044ndash4049
Mortezaei A Ronagh HR Kheyroddin A Ghodrati Amiri G 2009 Effectiveness of modi1047297ed pushover analysis procedure for
the estimation of seismic demands of buildings subjected to near-fault earthquakes having forward directivity Structural
Design of Tall and Special Buildings DOI 101002tal553
New Mark NM Hall WJ 1982 Earthquake Spectra and Design Engineering Monograph Earthquake Engineering Research
Institute Berkeley CA
Tong X 2001 Seismic behavior of composite steel frame-reinforced concrete in1047297ll wall structural system PhD Thesis Department
of Civil Engineering University of Minnesota
Tong X Hajjar JF Schultz AE Shield CK 2005 Cyclic behavior of steel frame structures with composite reinforced concretein1047297ll walls and partially-restrained connections Journal of Constructional Steel Research 61 531ndash552
Uang C 1991 Establishing R (or Rw) and C d factors for building seismic provisions Jornal of Structural Engineering ASCE
117(1) 19ndash28
Wakabayashi M 1986 Design of Earthquake-resistant Buildings Mc Graw-Hill New York
COMPARISON OF NONLINEAR BEHAVIOR OF STEEL MOMENT FRAMES
Copyright copy 2011 John Wiley amp Sons Ltd Struct Design Tall Spec Build (2011)
DOI 101002tal