The Strategic Marketing Institute Rapid Opportunity Assessment
57
1 Dry Beans, Sugar and Potatoes William A. Knudson and H. Christopher Peterson The Hale Group, Technical Advisors March 2005 The Strategic Marketing Institute Rapid Opportunity Assessment
Transcript of The Strategic Marketing Institute Rapid Opportunity Assessment

1
Dry Beans, Sugar and Potatoes
William A. Knudson and H. Christopher Peterson
The Hale Group, Technical Advisors
March 2005
The Strategic Marketing InstituteRapid Opportunity Assessment

2
TABLE OF CONTENTS
Page No.
How to Use this Rapid Opportunity Assessment……………………………… 3
Executive Summary………………………………………………………….… 6
Introduction…………………………………………………………………….. 9
Economic and Demographic Forces Affecting the Agri-Food System…….… 10
The Demand Drivers Affecting the Agri-Food System…………………….... 16
Dry Beans…………………………………………………………………….. 27
Sugar………………………………………………………………………….. 35
Potatoes……………………………………………………………………….. 43
Conclusion…………………………………………………………………….. 52
References…………………………………………………………………...… 54

3
How to Use this Rapid Opportunity Assessment
If you are reading this assessment, then there is a strong probability that you are
interested in understanding and seeking out high-value products and businesses. That is
to say, you are seeking differentiated or niche products and not commodities. Business
success and profitability with differentiated or niche products typically rely on three
success factors: (1) a unique idea for a product or service, or a unique process to
produce, deliver, or market a product or service, (2) the entrepreneurial skill and drive to
commercialize the idea, and (3) a sound business or product development plan to bring
the product to market.
This rapid opportunity assessment give insights into where potentially
successful and profitable unique product ideas may be found in today’s marketplace.
The assessment points the direction toward likely uniqueness in tow ways. First, critical
customer trends are highlighted: wellness, indulgence, convenience, value and ethnicity.
In addition, demographics are presented to support these trends. Any unique product idea
today must address the five trends or the key demographics in some significant way.
Second, product categories are then analyzed to determine which have greater or lesser
potential to capitalize on the trends and demographics. Profitable business and product
ideas will be those that are more unique, more likely to fit the trends, and more likely to
fit the product categories with the greatest potential.
What this assessment does not do is present profit or detailed sales estimates for
a particular product or business. At the specific product level, prices, costs, and market
volumes for these high value products are not necessarily known. If they are known, the
information is likely proprietary. Profit and sales estimates for unique products can only

4
arise from the additional work typically done in a business or product development plan.
Feasibility studies to determine profitability are often complex and rely on specific and
well defined product ideas. In addition, they analyze the set of current and likely
competitors for that product or service, a defensible competitive, strategy, estimates of
total capital required to be successful, and an assessment of the major risks involved in
the proposed venture. All of these factors must be done for the specific opportunity
under consideration. If this assessment provided information on specific products
claiming to be unique, such a claim would not likely be true because the idea would be
well known and the profit potential has probably already been taped by others.
If you are an agricultural producers or other business person elsewhere in the
agri-food system, you can use this assessment in one of two ways. First, if you have a
specific product in mind, you can use these analyses in this assessment to confirm or test
the potential of that idea in regard to (1) whether it goes with or against the five trends
and demographics driving consumer demand today, and (2) whether it fits in a product
category that has broad, selective, or limited potential. Ideas that go against trend or arise
from a more limited category are not necessarily ideas to avoid. These ideas need
considerably more care to define whether customers see the value in the product.
If you do not have a specific product idea but would like to create one, then the
second way to use this assessment is to learn about key market trends and product
categories. Product or business innovations that are on-trend or fall into the broader
opportunity categories are good places to spend time developing a unique product
attribute or unique method of production, marketing, or delivery. The process of idea
creation is not an easy one, but there are ways to take on this task. For example, you can

5
ask yourself what is missing from existing product or businesses in the market. You
could also visit with potential customers and ask what they like or dislike about current
market offerings. Your creativity is central to discovering the specific idea.
If you are a policy maker, economic developer, industry association executive or
faculty member interested in these markets, you can also use the assessment in your
work. You may be asked to support business efforts in developing or commercializing
new products or businesses. Policy changes, industry-wide strategies, product-based
research or infrastructure development are some of the many supporting activities that
may be critical to allowing agri-food firms to convert opportunities into profitable
businesses or products. This assessment suggests potential areas for judging where your
support might be most beneficial. Again, greater potential for success arises from
product ideas that go with the trends and fall into the broader opportunity categories. If
an idea that is seeking support falls outside the trends or in the narrower opportunity
categories, you should scrutinize that idea more heavily as opposed to just saying no to
the idea.
In summary, this rapid opportunity assessment identifies the potential for business
and product success across broad product and attribute categories, and thus the
assessment provides a basis for sound planning. The assessment has been thoroughly
researched based on relevant public and private information sources. This assessment
can help you start the business or product development process, but it is not an end in
itself.
6
EXECUTIVE SUMMARY
This rapid opportunity assessment will analyze various opportunities for three
field crops: dry beans, potatoes and sugar. While not large in terms of acreage these
crops remain important cash crops in the region. They also face challenges to that place
their future in jeopardy. This is particularly true for sugar, but is also true for dry beans
and potatoes as well. One issue facing these crops is the fact that they are used as inputs
in other processed food products. This reduces the control producers have in determining
prices and limits their ability to generate new products. In order to take full advantage of
market opportunities farmers and firms may need to work collaboratively. Farmers and
firms will have to work together to develop supply chains that allow them to develop
products consumers want.
One economic force and three demographic forces are critically affecting the agri-
food system. The economic force is the slow but steady growing affluence of U.S.
society. More and more U.S. households now have increasing amounts of discretionary
income. The three demographic forces are smaller households, an aging population, and
a more ethnically diverse population. While these demographic forces are distinct, they
often reinforce their impacts on the agri-food system. This is particularly true for smaller
households and the aging population.
These societal changes have led to the development of several drivers in food
demand. These demand drivers are as follows: an increased demand for wellness, an
increased interest in ethnic foods, indulgence as an attribute, and an increased demand for
convenience. Another attribute of food products, value, is not a new trend but remains
an important consideration for many consumers.

7
The intersection of product form and the demand drivers create a market. The
opportunities in these markets can be characterized as limited, selective and broad.
Limited opportunities mean that consumer trends are working against the product form;
limited opportunities mean that the consumer trends are neither positive nor negative;
broad opportunities mean that the consumer trends are receptive to new innovations with
respect to the product form. While it is possible to introduce successful products and
other innovations in markets that have limited potential, odds of success are not great.
Innovations that appeal to more than one driver have a greater chance of success.
The Demand Driver/Product Form matrices for dry beans, sugar and potatoes are
listed below. As can be seen from the matrices the opportunities vary considerably from
Demand Driver/Product Form Matrix (Dry Beans)Product Form Convenience Ethnicity Indulgence Value WellnessBagged Low Low Low Low HighCanned Low Low Low Low HighSoups Selective Selective Selective Low HighOther Food Products Selective Selective Selective Low High
Demand Driver/Product Form Matrix (Sugar)Product Form Convenience Ethnicity Indulgence Value WellnessWhite Granulated Low Low Low Low LowBrown/Powdered/Flavored Low Low Low Low LowSugralose Selective Selective Selective Low High
Demand Driver/Product Form Matrix (Potatoes)Product Form Convenience Ethnicity Indulgence Value WellnessFresh Low Low Low Low SelectiveProcessed Selective Selective Selective Selective SelectiveChips/Fries High High High Low Low
commodity to commodity. Consumer trends are working against sugar, furthermore,
U.S. sugar production is not cost competitive with other nations. Changes in
8
international trade rules place the industry in jeopardy. However, there are many
opportunities for sucralose, a non-caloric sweetener that is produced from sugar.
The opportunities in dry beans are broader. Dry beans are a healthy food, and
products can be developed to take advantage of this fact. Dry beans also provide
opportunities in developing products that appeal to different ethnic groups, as well as
consumers interested in convenience and indulgence.
Opportunities with respect to potatoes are not as limited as sugar, but are not as
broad as dry beans. Opportunities in the fresh potato market are limited. These are
commodity markets where price and grade standards dominate. As a general rule there
are selective opportunities in the processed and potato chip industries. Potatoes are a
naturally healthy crop that has traditionally been processed in an unhealthy way.

9
RAPID OPPORTUNITY ASSESSMENT: MINOR FIELD CROPS
Introduction
This rapid opportunity assessment will analyze various opportunities for three
field crops: dry beans, potatoes and sugar. While not large in terms of acreage these
crops remain important cash crops in the region. They also face challenges to that place
their future in jeopardy. This is particularly true for sugar.
This assessment will discuss the economic and demographic forces affecting the
agri-food system including the demand drivers affecting the agri-food system. Dry beans,
sugar and potatoes will be discussed in turn. This assessment will identify the relative
potential for products in different markets and how they interact with the major demand
drivers.
There is one major challenge facing farmers and firms in these crop sectors if they
are interested in capturing some of the opportunities outlined below. In order to take full
advantage of market opportunities farmers and firms may need to work collaboratively.
Farmers and firms will have to work together to develop supply chains that allow them to
develop products consumers want. Dry beans, potatoes and sugar are commodities and
often inputs into processed food products. However, a return per acre basis these crops
tend to have a high value relative to other field crops. Usually they must be altered in
some way to create consumer products. Whether by cooperatives, contracts, mergers,
strategic alliances or by other methods, group action will likely be needed to develop and
market consumer products that obtain higher prices.

10
Economic and Demographic Forces Affecting the Agri-Food System Introduction One economic force and three demographic forces are critically affecting the agri-
food system. The economic force is the slow but steady growing affluence of U.S.
society. More and more U.S. households now have increasing amounts of discretionary
income. The three demographic forces are smaller households, an aging population, and
a more ethnically diverse population. While these demographic forces are distinct, they
often reinforce their impacts on the agri-food system. This is particularly true for smaller
households and the aging population.
These societal changes have led to the development of several drivers in food
demand. These demand drivers are as follows: an increased demand for wellness, an
increased interest in ethnic foods, indulgence as an attribute, and an increased demand for
convenience. Another attribute of food products, value, is not a new trend but remains
an important consideration for many consumers. These trends will be discussed below in
further details
Each of the economic and demographic forces will be discussed in turn. Then the
relationship between the forces and the demand drives will be addressed. This will
include further analysis and definition of the demand drivers.
Increase in Income
Over time, most households in the U.S. have seen their incomes increase. This
has allowed them to increase their purchases. Table 1 shows the growth in incomes from
1970 to 2000. Of particular importance is the growth in the number of households that

11
earn more than $75,000 a year. It is at this level that many households begin to have
discretionary income to spend. The growth in the number of these households has been
referred to as the emergence of mass affluence (Nunes, Johnson and Breene, p. 96).
Table 1: Distribution of Income 1970-2000 (Percent of Households)
Year Under $5,000
$5,000 to
$9,999
$10,000 to
$14,999
$15,000 to
$24,999
$25,000 to
$34,999
$35,000 to
$49,999$50,000 to
$74,999$75,000 to
$99,999$100,000 and over
2000 2.9 6.1 7.0 13.4 12.5 15.5 18.9 10.4 13.41990 3.2 7.7 7.5 14.1 13.7 17.2 18.8 9.1 8.71980 3.1 8.9 8.2 15.5 14.0 18.9 18.7 7.5 5.21970 4.8 8.7 7.6 15.2 16.3 21.0 17.6 5.4 3.4
Source: U.S. Census Bureau
These figures have been adjusted for inflation using the Consumer Price Index (CPI) and
are in terms of 2000 dollars.
In 2000, those households that earned $75,000 or more per year made up 23.8
percent of all households. That figure was only 8.8 percent in 1970. The number of
households earning more than $100,000 a year increased by almost 400 percent from
1970 to 2000, and increased by 54 percent from 1990 to 2000. Conversely, households
earning less than $15,000 a year accounted for 21 percent of all households in 1970 and
16 percent of all households in 2000. This trend can also be seen in the increase in
median income. Median income was $33,746 in 1970 (in 2000 dollars), and was $42,148
in 2000; an increase of almost 25 percent (U.S. Census Bureau, Money Income in the
United States: 2000, p. 17). Clearly there has been a consistent increase in the level of
disposable income over the past thirty years. This allows more and more consumers to
purchase goods and services that have luxury attributes.

12
While it is true that affluence has been increasing over time, it is also true that
many households have modest incomes. There is still a large market available for firms
and products that focus on value.
Smaller Households
While household incomes have increased the size of households has declined
somewhat. This reinforces the trend for more discretionary income. Smaller households
mean there are fewer household members who have needs to be met, and more income
available for discretionary purchases.
The trend for smaller households has been consistent and will likely continue in
the future. Table two gives the average size of households in the U.S. from 1970 to 2000.
Table 2: Average Size of Household: 1970-2000Year Persons Per Household1970 3.141980 2.761990 2.63
2000* 2.59
* estimateSource: U.S. Census Bureau
Since 1970, the size of the average household has declined by more than 17.5 percent.
The average household size is projected to be 2.53 in 2010 (Day, p. 10). While the rate
of decline is slowing down, the trend for smaller families will continue.
Smaller households have impacted the agri-food system in a number of ways.
Smaller more affluent households have more discretionary income to spend in any way
they please. It may be the case that smaller households will place more emphasis on
convenience; it may be easier to justify time and effort spent on cooking for larger
families than for smaller families. Smaller families also imply that a higher percentage of

13
family members are working. This is reinforced by labor participation rates. Figure 3
shows the overall labor participation rates, those for men and those for women from 1970
to 2000.
Table 3: Labor Participation Rates Total and by Sex: 1970-2000Year Total Men Women1970 57.5 76.2 40.81980 59.2 72.0 47.71990 62.8 72.0 54.32000 64.8 71.9 57.5
Source: Bueau of Labor Statistics
Table 3 shows that the labor force participation rates for men have been steady since
1980. The increase in the total labor participation rate is completely due to women
entering the labor force. More people working means less time for other activities such
as cooking. Households are more likely to substitute eating away from home and easy to
make meals for traditional home cooked meals.
An Aging Population
Another demographic change affecting the U.S. agri-food system is the fact that
the U.S. population is aging. At the beginning of the 20th Century only 4.1 percent of the
population was aged 65 or older (Hobbs and Stoops, p. A-19). The trend towards an
older population is outlined in table 4.

14
Table 4: Percentage of the Population 65 Years and Older: 1970-2000Year Percentage of the Population 65 Years and Older1970 9.91980 11.31990 12.62000 12.4
2010* 13.22020* 16.5
* Estimate
Source: U.S. Census Bureau
While the percentage of the population aged 65 and older declined in relative terms from
1990 to 2000, it actually increased in total numbers. In 2000, there were 34,991,753
persons 65 or older (Hobbs and Stoops, p. A-17), an increase of 12 percent over 1990.
The increase in the level of immigration (which tends to be younger people), has
moderated the relative increase in age for the nation as a whole. Nonetheless the number
of older residents of the U.S. is increasing.
Furthermore, it is expected to increase in the future. A large population cohort
(the baby boomers) will soon be adding to the numbers of persons over 65. Table 4
shows the middle series estimate for the number of persons 65 and older in 2010 and
2020. It is estimated that the number of person 65 and older will account for 16.5 percent
of the population in 2020. If this is the case, one person in 6 in the U.S. will be in this
age group.
A potential market of 35 million people, and expected to increase is large. Older
residents have different nutritional issues than younger members of society. Wellness
will be an issue for some of these consumers. Convenience and packaging designed for
single serve meals will also be important for a large number of older consumers. Some

15
older consumers are on limited and fixed incomes. Consumers in this situation will be
value conscious.
Ethnic Diversity
The U.S. is becoming more ethnically diverse. Partially this is due to higher
birthrates among some ethnic groups, but to a great extent the increased diversity is due
to increased immigration from other countries. Two of the major areas of growth are in
the number of Asian and Hispanic residents. Of the 33.5 million foreign born persons
living in America 17.9 million are from Latin America (including the Caribbean) and 8.4
million are from Asia (including the Pacific Islands) (Larsen, p.1). Table 5 shows the
growth in the population of the Asian and Hispanic populations over time.
Table 5: Percentage of the U.S. Population of Asian or Hispanic Origin: 1970-2000Year Percent Asian Percent Hispanic1970 0.7 NA1980 1.5 6.41990 2.9 9.02000 4.4* 12.5
* actual figure for 2002Source: U.S. Census Bureau
The 1980 census was the first that included Hispanics (regardless of race), as a separate
group. In 2002, there were 12.5 million Asian and Pacific Islanders living in the U.S.
(Reeves and Bennett, p. 1), in 1990 that figure was 7.3 million (Hobbs and Stoops, p. A-
23). From 1990 to 2002, the number of Asians and Pacific Islanders living in the U.S.
increased by 5.2 million or 71.2 percent.
The increase in the Hispanics has been well documented. Hispanics either are or
soon will be the largest ethnic or racial group (after non-Hispanic whites) in the U.S. In
1980, there were 14.6 million people of Hispanic origin the U.S., that figure stood at 35.3

16
million in 2000 (Hobbs and Stoops, p. A-37); the number of Hispanics increased by
141.2 percent in 20 years. It is expected that there will be 43.7 million Hispanics in
2010, which is estimated to be 14.6 percent of the population. While this growth is spread
throughout the country, it is concentrated in the Southwest.
However, it is important to note that this level of aggregation does not tell the
whole story. The tastes and preferences of many Indians are different than those of many
Chinese. The same is true in the Hispanic community; the tastes and preferences of
Puerto Ricans and Cubans are going to be different than those of Mexicans and
Guatemalans. This creates a number of opportunities for firms interested in meeting the
needs of these groups of consumers.
The most obvious impact the increased diversity of U.S. society has on the agri-
food industry is in the market driver of ethnicity. This impact is felt to two ways; first the
immigrants will likely want authentic food from their native societies. This desire may
decline in second and succeeding generations. It may be the case that the desire for
convenience may drive the market for ethnic foods towards massed produced
homogenized products, similar to what has happened with much of Italian and Chinese
food, and perhaps what is currently happening with Mexican food. However, it should be
noted that many members of these groups have limited incomes. This is particularly true
of immigrants and those with a Hispanic background. Value will continue to be an
important attribute for many of these consumers.
The other ethnic trend is for increased consumption of foreign influenced foods
by other ethnic and racial groups. The desire to try something different and to diversify
their menu choices has also increased the demand for ethnic and ethnically influenced
17
foods. For example, many customers at Mexican and Thai restaurants are not Mexicans
and Thais respectively.
The Demand Drivers Affecting the Agri-Food System
There has been some discussion of the demand drivers affecting the food system
in the section on economics and demographics but these drivers have not been analyzed
in detail. The demand drivers of wellness, ethnicity, convenience, indulgence, and value
will be discussed in turn. Much of the information on these demand drivers was the
result of discussions between researchers at Michigan State University and the Hale
Group.
Wellness
There are several aspects to wellness. One aspect is the desire for food products
that do not cause harm as a result of pathogens and carcinogens. Examples are foods that
are free of e-coli, hepatitis A and other pathogens that cause food poisoning. BSE
remains a concern for some consumers. Pesticide residues remain a concern for some,
not for their impact on the environment as much as its safety in food products. The
growth in the organic market is driven more by the desire to consume safe foods as it is
by environmental concerns (Mintel, Organic Foods and Beverages, p. 11).
Obesity is a major health issue facing U.S. society. Table 6 shows the percentage
of Americans 18 and over who are overweight or obese.

18
Table 6: Percentage of Overweight and Obsese Adults 1994 - 2002Year Percent Overweight Percent Obese1994 35.4 14.41996 35.4 16.81998 36.3 18.32000 36.7 20.92002 37.0 22.1
Source: Mintel
In 2002, 59.1 percent of the population was either overweight or obese. It is anticipated
that the figures are even worse for 2004. This epidemic now includes children.
According to the Centers for Disease Control, 15.6 percent of people between the ages of
6 and 19 are overweight (Mintel, Sugar and Sweeteners, p.11). The number of
overweight and obese people has become a major health policy issue. Foods that address
this issue may find a market provided that taste is not sacrificed.
Another aspect of wellness is avoidance of foods that contribute to chronic
diseases and conditions such as hypertension, and heart disease. Many of these diseases
are a result of obesity. The interest in low carbohydrate foods are an example of this
consumer trend, as are foods and beverages that are promoted as being low in fat and
calories. It is likely that once trans fatty acids are added to food labels there will be a
movement away from foods that possess this characteristic.
The interest in foods that do not possess negative characteristics appears to be a
global phenomenon. The Mintel Group’s Global New Product Database (gnpd) tracks
new product introductions throughout the world. Table 7 shows the new product
introductions with what the gnpd refers to as “foods minus” claims; new food products
that claim to have little or none of a negative product attribute.

19
Table 7: "Foods Minus" Product Claims 2002-September 2004Product Claim 2002 2003 2004 TotalLow Fat 3,867 4,662 4,968 13,497Low Additives/Preservatives 3,611 4,706 4,070 12,387Low Sugar 2,221 2,539 3,149 7,909Low Calorie 1,234 1,732 2,037 5,003Low Cholesterol 969 1,271 1,489 3,729Low Carbohydrate 114 436 2,738 3,288Low Sodium 503 575 933 2,011
Source: Mintel Global New Products Database
Each year more and more of these products are introduced throughout the world. Every
category increased every year with the exemption of low additives/preservatives from
2003 to 2004; however figures for all of 2004 are not available and there will be some
low additive/preservative products introduced before the end of the year. Some products
such as low carbohydrate or and low sodium foods are increasing dramatically, but even
well established product lines such as low calorie foods are increasing.
An additional aspect of the demand for wellness is the creation of foods and
beverages that actually promote or improve wellness. Examples are the promotion of
foods that are high in vitamins and anti-oxidants. There is a growing trend toward foods
that promote themselves are actually burning fat. There are also a growing number of
food and beverage products that have pharmaceutical benefits. Food and beverage
products that are high in probiotics, prebiotics and Omega 3-fatty acids are examples.
The gnpd also tracks foods that have “food plus” positioning claims; food
products that have positive product attributes as opposed to the absence of negative
product attributes. Table 8 shows the number of new food product introductions that
claim to have such attributes.

20
Table 8: "Food Plus" Positioning Claims 2002-September 2004Product Claim 2002 2003 2004 TotalVitamin/Mineral Fortified 4,599 4,846 4,238 13,683All Natural 2,233 2,985 3,136 8,354Organic 2,661 2,681 2,016 7,358Vegetarian 1,774 1,982 1,912 5,668Added Calcium 1,315 1,231 989 3,535Added Fiber 690 677 545 1,912Diabetic 153 302 583 1,038
Source: Mintel Global New Products Database
As is the case for table 6, the figures for 2004 are not for the full year. There has been an
explosion of food items geared for people with diabetes. There has also been an increase
in the number of food items that claim to be all natural. However, the “food plus” market
does not seem to be as well developed as the “food minus” market. One implication of
this is that there may be more room for growth and new product development in the area
of “food plus” products.
There are a number of economic and demographic factors that have made
wellness a demand driver. An older and more sedentary population is more interested in
food and beverage items that either improve health or do not adversely affect health.
Chronic problems such as diabetes and osteoporosis are also driving the demand for
products that are low in sugar and carbohydrates as well as the demand for food and
beverages with added calcium. Some consumers now have the income to afford to pay
for products that impact health in a positive way.
Ethnicity
Ethnic products can be defined as those that have food and beverage traits that
appeal to specific ethnic groups. This driver has two sub-categories: foods with an

21
authentic appeal to the ethnic group itself; and foods marketed to the wider U.S.
population that has been influenced by ethnic tastes and ingredients.
Obviously, a major source of this demand driver is the growing ethnic diversity of
the U.S. This has impacted the demand for number of ethnic foods and markets. Food
retailing firms that are geared towards Asian products have become common. Restaurant
establishments that specialize in Indian, Thai, and Middle Eastern cuisines are also
becoming more common.
The influence of ethnic food will likely become more widespread. Americanized
versions of foreign foods have developed. This has happened with Italian food, and may
be happening with Mexican food. These foods will be a combination of foreign and
American tastes. Flavors typically thought of foreign, such as curry, might work their
way into foods traditionally thought of as American.
Another major factor influencing the ethnicity is increasing affluence. This has
allowed some members of society to travel widely and experience different cultures. It
has also allowed increased experimentation with foreign foods, particularly in a
restaurant setting. Most foreign restaurants depend on the patronage of other ethnic
groups to stay in business.
Ethnic foods appeal to some consumers’ sense of adventure. These consumers
are looking for new flavors, tastes and food experiences. In this respect, the ethnic food
driver is very similar to the indulgence driver.
Indulgence
Indulgence is a broad category that covers many product attributes and
characteristics. Products that appeal to indulgence are those designed to meet the

22
consumer’s deeply felt desires as opposed to their needs. However, these desires also
may include the consumer’s belief system and other very important aspects of the
consumer’s life. Indulgence in this sense does not necessarily mean unimportant or
frivolous, but rather food and beverage items need to possess characteristics above and
beyond the simple ability to maintain life or to provide minimum quality at a minimum
price.
As a result, indulgence can cover a wide range of products. One such
characteristic is luxury. Examples include beer from a microbrewery, expensive wines
and chocolates, gourmet coffees and cheeses. According to a survey 45 percent of the
respondents stated they enjoyed eating foreign foods (Mintel, Edible Fats and Oils, p.11).
Another aspect of indulgence is cooking as a hobby, cooking gourmet meals as a lifestyle
choice. According to one survey, 20 percent of respondents like to cook for fun and 49
percent “really enjoy” cooking (Mintel, Edible Fats and Oils, p.11). For some, cooking
and preparing food is a basis for social connectedness, an opportunity to interact with
others. Fine dining at a restaurant is another example of using luxury appealing to the
sense of indulgence. The experience of the food and atmosphere meeting the desire of
the consumer is the primary indulgence attribute. This includes the desire to experience
new foods, tastes and varieties.
Emotional connectedness is also an attribute of indulgence. Some foods appeal to
a consumer’s sense of nostalgia. The phrase “comfort food” points this out. Meat loaf
and homemade chocolate chip cookies are examples of foods that appeal to emotional
connectedness.

23
Another aspect of indulgence foods is its ability to reflect the values of
consumers. Examples of this are dairy and meat products from animals raised in a
manner perceived as being humane, such as free range chicken and milk from cows that
are not treated with hormones. Consumers who purchase organic foods or foods grown
in the area they live primarily because of their minimal effects on the environment are
another example. Increasing ethnicity is also reflected in the values of consumers. A
growing Muslim population will increase the demand for foods processed in a manner
that conforms to Muslim dietary laws.
The primary source of the growth of indulgence products is rising affluence,
although this demand driver also interacts somewhat with the wellness driver. A
consumer may buy fewer candy bars to keep the weight off but the candy bars he or she
buys are more expensive, and are of higher quality or more exciting taste and variety.
Affluent, less price conscious consumers will look for products that satisfy more than
their needs, they will look for products that enhance their lifestyle, their values and their
beliefs. Smaller households also allow consumers with few or no children to experiment
and seek out experiences.
A secondary source of the growth of indulgence is an aging population.
Households with the income and the time are better able to pursue hobbies and develop
new interests. This includes new experiences with food and beverages.
Convenience
Of all the demand drivers shaping the agri-food system convenience may be the
most important. Convenience can be defined as anything that makes life easier for the
consumer such as: prepared foods that can be consumed “on the run” or at home; hand

24
held foods that enable the consumer to do something else while eating such as driving;
partially prepared foods that reduce or eliminate preparation time e.g. instant oatmeal,
precut salads; foods in packaging that makes consumption easier such as microwavable
popcorn, Lunchables, and single serve yogurts; or bundling of products such as
hamburger helper, frozen dinners etc.
Several factors have led to the demand for convenience. Smaller families
increase the per person time and effort cost of cooking. It also makes packaging for
smaller households more important. More women in the workforce and daily commutes
also reduce the amount of time many households have for food preparation. The work
week of many households has increased also reducing the time available for preparing
meals.
For many households that earn $75,000 or more, time has become more valuable
than money. As a result, these households are willing to pay a price premium for foods
that are convenient. Additional packaging, ease of use etc. in exchange for a higher price
is considered a good trade-off for these consumers.
While time is one important aspect of convenience it is not the only one. Another
important aspect of convenience is ease of preparation. Pre-cut salads are an example.
Another example is the growth of foods that can be prepared in one dish, such as
premixed crock pot dishes. These meals are very easy to prepare but may actually take
several hours to cook. However, there is little oversight or thought involved in the actual
cooking of the meal.

25
Another consideration of convenience is the development of meal solutions.
Packaged or pre-prepared food items that provide an entire meal. Meal solutions not only
save time and effort, but also reduce time shopping and planning meals.
Value
The final demand driver is the best understood. Food and beverages that meet the
consumer’s needs at the lowest price fulfill the consumer’s preference for value. Price
coupled with a basic level of performance is the hallmark of value.
There are a number of examples that appeal to value. Private label brands that
sell at a price discount are an example, as are canned fruits and vegetables. Certain
restaurant chains that sell pre-made standardized products are another example.
While perhaps less exciting than the other demand drivers, value will continue to
be important with many consumers. The 76.2 percent of households that earn less than
$75,000 will likely remain price conscious for many, if not most products. This is
particularly true for those households that earn less than $50,000 which is still more than
50 percent of all households. Immigrants with limited incomes may also be value
oriented. In some respects this limits the ability to charge price premiums for ethnic
foods.
An aging population may also place more emphasis on value. Many retired
people have fixed incomes. Policy issues such as rising health care and the future
viability of Social Security may also affect the purchasing choices of older consumers,
and may place more value on consumers.

26
Implications for Firms in the Agri-Food System
The number of drivers has increased the opportunities for firms in the agri-food
system. Controlling costs will continue to be the most important aspect for firms
interested in providing products that offer value to consumers. To be successful
providing value, a firm will need to be the low cost producer.
Costs are less important in providing products that address the other drivers.
Increased ethnicity will increase the demand for authentic foreign foods and foods that
are influenced by foreign flavors and characteristics. This increases the range of products
that can be offered to consumers, and creates additional markets available to firms in the
agri-food industry. This transcends beyond the Mexican market and includes markets
such as the Indian and Middle Eastern market.
Convenience remains a very important demand driver. More affluent households
facing time constraints place a higher value on foods that are easy to prepare and can be
consumed on while doing something else. Smaller households increase the demand for
packaging that reflects servings for one or two individuals. This demand driver is well
understood, but opportunities remain.
Wellness is a driver that presents a great deal of potential for firms willing to meet
this driver. An aging and affluent society is becoming more interested in healthy foods,
both those foods that are free of “bads” such as fat and sodium and have more “goods”
such as antioxidants and vitamins and other attributes. This demand driver also has a
great deal of potential in the area of nutraceuticals and other functional foods. In many
ways, the wellness market is just developing as the science and consumer awareness
27
continues to grow. This is an area that may have a great deal of potential for firms and
new product introductions.
Of all the demand drivers, indulgence perhaps provides the most options for firms
in the agri-food sector. Indulgence covers many submarkets including luxury, social
interaction, and environmental and religious concerns to name a few. Also there are
many consumer segments that agri-food firms may wish to pursue. Insofar as indulgence
appeals to the most deeply held preferences and beliefs of these consumers the potential
to obtain price premiums may be the highest.
One way firms in the agri-food industry can capture higher profits is by
developing products and markets that address one or more of these drivers. Examples
include prepared ethnic foods that would appeal to ethnicity, convenience and perhaps
indulgence. Another would be prepared organic foods in single serve containers; this
would appeal to wellness and convenience while taking into account smaller household
size. Products that appeal to a number of drivers simultaneously have a great deal of
potential.
Dry Beans
Background
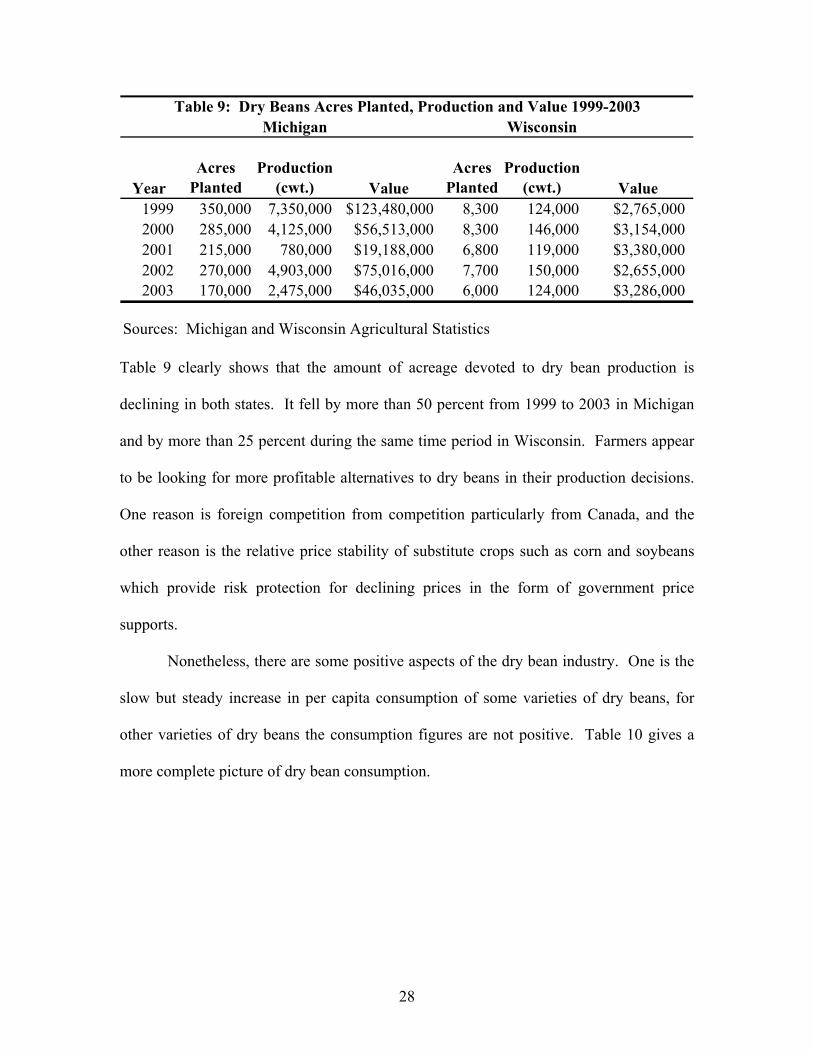
Dry beans are an important crop in Michigan. The state leads the country in the
production of black beans, cranberry beans, and small red beans; and is third in the nation
in total dry bean production (Michigan Agricultural Statistics, p.1). Wisconsin also
produces dry beans. Production and value of dry beans is outlined in table 9, Ohio is not
a major producer of black beans.
28
Table 9: Dry Beans Acres Planted, Production and Value 1999-2003Michigan Wisconsin
YearAcres
PlantedProduction
(cwt.) ValueAcres
PlantedProduction
(cwt.) Value1999 350,000 7,350,000 $123,480,000 8,300 124,000 $2,765,0002000 285,000 4,125,000 $56,513,000 8,300 146,000 $3,154,0002001 215,000 780,000 $19,188,000 6,800 119,000 $3,380,0002002 270,000 4,903,000 $75,016,000 7,700 150,000 $2,655,0002003 170,000 2,475,000 $46,035,000 6,000 124,000 $3,286,000
Sources: Michigan and Wisconsin Agricultural Statistics
Table 9 clearly shows that the amount of acreage devoted to dry bean production is
declining in both states. It fell by more than 50 percent from 1999 to 2003 in Michigan
and by more than 25 percent during the same time period in Wisconsin. Farmers appear
to be looking for more profitable alternatives to dry beans in their production decisions.
One reason is foreign competition from competition particularly from Canada, and the
other reason is the relative price stability of substitute crops such as corn and soybeans
which provide risk protection for declining prices in the form of government price
supports.
Nonetheless, there are some positive aspects of the dry bean industry. One is the
slow but steady increase in per capita consumption of some varieties of dry beans, for
other varieties of dry beans the consumption figures are not positive. Table 10 gives a
more complete picture of dry bean consumption.

29
Table 10: U.S. Per Capita Consumption of Dry Beans: Selected Varieties
Variety 2000 2001 2002 2003 2004Percent Change 2000-
2004Black 0.57 0.49 0.46 0.47 0.48 -15.8Cranberry 0.14 0.04 0.07 0.05 0.05 -64.3Small Red 0.13 0.12 0.09 0.16 0.17 30.8Dark Red Kidney 0.18 0.22 0.25 0.22 0.24 33.3Light Red Kidney 0.31 0.31 0.23 0.32 0.30 -3.2Navy 3.46 3.28 3.16 3.17 3.13 -9.5
Source: USDA
There has been a decline in per capita consumption of black, cranberry, and navy beans.
It should be noted that after a decline from 2000 to 2002, consumption of black beans
increased slightly from 2002 to 2004. While not large in percentage terms, the decline in
navy consumption may be most problematic as navy beans are a major bean variety.
Conversely, there has been an increase in small red and dark red kidney bean
consumption and light red kidney beans consumption remains virtually unchanged.
Dry beans are used in a number of food products. They are sold in bags, cans,
salsas, soups, refried beans, and other prepared food items. To a great extent, dry beans
are an input into other food products. This increases the options for producers and
processors interested in developing dry bean products. However, the opportunities in
some of these product forms are limited. Table 11 gives a more complete picture of the
opportunity matrix for dry bean products.
Table 11: Demand Driver/Product Form Matrix (Dry Beans)Product Form Convenience Ethnicity Indulgence Value WellnessBagged Low Low Low Low HighCanned Low Low Low Low HighSoups Selective Selective Selective Low HighOther Food Products Selective Selective Selective Low High
30
In many respects dry beans are a commodity, they are undifferentiated products in the
eyes of the consumers and therefore price is the primary concern. However, there are
some demand drivers that show some promise. This is particularly true for products that
appeal to the demand driver of wellness.
Convenience
Bagged beans are very inconvenient; they take a long time to cook and often have
to be combined with other ingredients to make a meal. The inconvenience factor is
compounded by the fact that with the passage of time cooking skills have declined.
Canned beans are somewhat more convenient, but the ability to appeal to this
demand driver through canned beans is also limited, these products are generally
considered to be commodities. Generally, these products also need some type of
additional preparation in order to be consumed. There is some increased interest in pre-
cooked heat and serve packaging. These products are commonly part of a combination of
other proteins, such as meat, and offer convenience, wellness and depending on the
recipe, ethnic attributes. Some leading food manufacturers are evaluating the use of
beans for this purpose.
There have been some product developments in soup that enhance convenience.
While traditional soup products do not require a great deal of preparation, they generally
need to be consumed with a spoon and bowl, this is not convenient from a “grab and go”
perspective. Many firms now offer microwavable soup products that do not need a bowl.
Campbell’s soup company launched a series of soup products called “Soup at Hand” in
2002 that does allow for a person to consume the soup as a consumer would consume a
drink (Mintel, Soup, p.13). However, there are still options available to bean soup

31
producers that are interested in combining convenience with other attributes such as
enhanced flavor, lower sodium, etc. Combining convenience with other demand drivers
such as indulgence or wellness does offer some potential.
The same holds true for other food products that utilize beans. Combining beans
with picante sauces, salsas, and ready to eat meals would add convenience for time
pressed consumers. Insofar as adding beans to these items could appeal to wellness and
other demand drivers, there are selective opportunities for other bean related items that
appeal to the demand driver of convenience.
Ethnicity
There are some opportunities for products that appeal to the demand driver of
ethnicity. The Hispanic market in general and the Mexican market in particular will
generate an increased demand for beans and bean based products. Table 12 shows the
percentage of those surveyed by ethnic group, who eat various products that feature
beans.
Table 12: Percentage of Those Surveyed Who Eat Selected Products that Feature Dry Beans
Product White Black Hispanic OverallRefried Beans 32 12 43 30Burritos 23 17 29 22Enchiladas 9 6 17 9
Source: Mintel
Refried beans are standard fare in much of Mexican cooking. Beans are also often used
in entrees such as burritos and enchiladas. However, in order to appeal to these
consumers authenticity is important, for example Hispanic consumers are less likely to
purchase taco dinner kits (Mintel, The Mexican Food Market, p. 68). The overall size of

32
the market is also increasing; in 2001, sales of Mexican food in traditional distribution
channels was $4.2 billion, an increase of 17 percent from 1996 (Mintel, The Mexican
Food Market, p.14). However, this figure does not include small Mexican food retailers
who likely account for a fair number of sales.
The fact that many Mexican food shoppers buy their products from small retailers
presents both an opportunity and a threat for dry bean farmers and processors interested
in this market. In order to gain access to this market, alternative supply and distribution
arrangements need to be considered. This would likely include working with Mexican
food manufacturers and distributors and involve finding a way to access Spanish
speaking experts in these markets.
As is the case with the demand driver of convenience, there are limited
opportunities of bagged beans appealing to the demand driver of ethnicity. Bagged beans
are a commodity, bilingual labeling may provide some opportunity, but price will remain
the most important aspect of the bagged bean market.
The same holds true for canned beans which are also generally considered
commodities. Bilingual labeling and the use of beans with flavorings that appeal to
ethnic consumers may have some potential.
Soups have somewhat more potential. Most soups are geared towards whites and
to a lesser extent Asian tastes. However, Hispanics also are soup eaters; in one survey
Hispanics consumed 4.1 cans of soup per week, and 3.7 packets of dried soup, more than
any other group (Mintel Soup, p.45). This appears to be an underserved market.
It has been noted that Hispanics tend to eat more bean products than other groups.
The interest in Hispanic and Latin foods also includes increased interest in Cuban,

33
Brazilian and Argentine foods. The cuisine in all of these countries is highly dependent
on beans. Good tasting products that appeal to authentic Hispanic tastes could find a
market. Products could include heat and eat entrees, salsas, sauces, etc.
Indulgence
Bagged and canned foods do not lend themselves to the demand driver of
indulgence. If anything, they are the antithesis of indulgence products. Organic bean
products may be a way to appeal to indulgence; however, even in this case consumers are
likely to look for the lowest cost bean product.
Soups have somewhat more potential. Many soups are geared toward the demand
driver of value, and do not have gourmet attributes. Bean soup products could be
developed that do have high quality and are low in sodium and other negative attributes.
One potential for new products exist in gourmet quality refrigerated soups. These soups
combine indulgence and convenience. They could be sold in supermarkets, gourmet
stores or marketed to food service establishments.
In many respects, the same holds true for other bean food products. Baked beans
etc., could be developed that have gourmet attributes that have been ignored by larger
food manufacturers.
Value
Overall, the opportunities of appealing to the demand driver of value are limited.
Low cost bean products and distribution channels are well established. This is true for
soups and other bean products as well as bagged and canned beans.

34
Wellness
Developing bean based products that appeal to the demand driver of wellness
show the most promise. Beans are a very healthy food being high in poretin and fiber
compared to other pulse or grain coprs typically used for direct human consumption.
Furthermore, they are the only food that is in two places in the USDA food group system;
they are included in the vegetable group as well as the meat and beans group (DGAC,
p.10). The USDA food guide suggests 3 cups of dry beans per week (DGAC, p.10). This
is far above current U.S. consumption of these products. Dry beans are also a good
source of folate and potassium (DGAC, p.26). It may be the case that the health benefits
of consuming beans are not completely understood by consumers; if so, this presents a
marketing opportunity for bean producers and processors.
However, to take full advantage of the opportunities wellness presents new
products that utilize beans need to be developed. In bagged beans, packaging that
emphasizes the health benefits of beans could be used to increase consumers’ knowledge
of these benefits.
Labeling could also be used with canned bean products. Also, the health
attributes of canned beans could be enhanced through reduced sodium products, low fat
refried beans, and other similar “food minus” products.
Soups that use beans also show a great deal of potential of appealing to the
demand driver of wellness. Again, low sodium soups may be a potential market. Many
soups do not emphasize taste or appeal to ethnic groups. Soups that are healthy and also
good tasting or targeted to specific groups could be profitably developed. Furthermore,
soups that appeal to both indulgence and wellness could command a price premium. In

35
order to take full advantage of this opportunity, farmers or processors may have to
develop their own products or work closely with soup manufacturers to develop products
that use more beans.
The situation of other food products that feature beans is similar to that of soup.
Food products that use beans can appeal to wellness, especially if they combine the
health benefits of consuming beans with other “food minus” attributes. Beans could be
added to a number of products, especially Mexican food products such as salsas, Mexican
sauces and heat and eat entrees. In order to take advantage of this opportunity producers
and processors may have to work with manufacturers to increase the utilization of beans.
In the case of Mexican markets obtaining access to the distribution channels that service
small retailers may also be necessary.
Summary
The dry bean industry faces some difficulties. Foreign competition and the ability
to substitute corn and soybeans for dry beans have led to a reduction in dry bean acreage
in both Michigan and Wisconsin. Furthermore, the opportunities for product
developments in bagged and canned beans are generally limited. Often beans are inputs
into other food products such as soups, sauces and entrees.
Products that appeal to the demand drivers of wellness and ethnicity show the
most promise. The increasing size of the Hispanic market in general and the Mexican
market in particular means that the demand for dry beans has the potential to increase, the
fact that Mexican foods are becoming part of the mainstream also enhances this potential.
In order to take full advantage of appealing to the Mexican market however, it may be

36
necessary to develop relationships and distribution channels that serve the small scale
Mexican retailer.
Beans are a very healthy food, and are the only type of food that is found in two
different USDA food groups, vegetables and meat and beans. The health benefits of
eating beans have not been fully exploited by the industry. Per capita consumption is far
below the government’s recommendation. Producers and processors could work with
manufacturers, distributors and others to develop new products and markets for food
items that use beans. Products that appeal to wellness as well as other demand drivers
such as ethnicity and indulgence show the most promise.
Sugar
Background
Sugar is a very profitable crop for producers who are fortunate enough to have
access to production allotments. A combination of support prices and import quotas
support the price of sugar. Sugar production in Michigan and Ohio is shown in table 13.
Wisconsin does not produce sugarbeets. Michigan ranks fourth in the nation in the
production of sugarbeets; Ohio is a much smaller producer of sugarbeets.
Table 13: Acres Planted, Production and Value of Sugarbeets 1999-2003Michigan Ohio
YearAcres
PlantedProduction
(tons)Value of
ProductionAcres
PlantedProduction
(tons)Value of
Production1999 194,000 3,534,000 $115,915,000 1,800 33,000 $1,079,0002000 189,000 3,403,000 $106,514,000 1,200 17,000 $525,0002001 180,000 3,220,000 $112,056,000 800 12,000 $426,0002002 179,000 3,204,000 $122,393,000 1,900 37,000 $1,439,0002003 179,000 3,400,000 $124,800,000 2,000 46,000 $1,656,000
Sources: Michigan Agricultural Statistics, Ohio Agricultural Statistics, USDA

37
Despite calls for the reduction in the consumption of sugar and products that
contain sugar, per capita consumption of sugar remains high, but is declining. Table 14
shows the per capita consumption of refined sugar and total caloric sweeteners. One
reason for this decline may be the increased interest in low carb diets. According to a
survey, 7 percent of adult respondents were on a low carb diet and an additional 33
percent were “carb aware” meaning that they were likely controlling their intake of
carbohydrates (Mintel, Sugar and Sweeteners, p.6). Furthermore, according to one study,
24 percent of consumers were trying to eat less sugar up from only 10 percent in 1999
(Mintel, Sugar Confectionery, p. 16). Another possible reason for the decline in sugar
consumption is the growth in the number of diabetics.
Table 14: Per Capita Consumption of Refined Sugar and Total Sweetners 1999-2003
YearPer Capita Refined
Sugar (lbs.)Per Capita Total Sweetners (lbs.)
1999 66.3 151.32000 66.5 148.92001 64.5 147.12002 63.2 146.22003 60.9 141.5
Source: Haley and Suarez
In 2003, the typical American consumed almost 61 pounds of sugar per year and more
than 141 pounds of sweeteners. According to a survey, the typical American household
consumes 2.7 pounds of sugar a month (Mintel, Sugar and Sweetener p.8); this implies
that the majority of sugar consumed comes from manufactured products such as candy,
chocolate, ice cream, etc. The average household consumes 3.3 packets of sugar
substitute per day (Mintel, Sugar and Sweetener, p.8).

38
Americans now consume as much High Fructose Corn Syrup (HFCS) as refined
sugar (Haley and Suarez, p.79), mostly in the form of soft drinks and candy products.
One implication of this is that there will continue to be widespread support in the
agriculture community for the sugar program. In its current form, the sugar program
supports the price of corn as well as the price of sugar. However, the sugar program may
come under attack for violation of World Trade Organization (WTO) rules. If parts of
the sugar program are deemed to be in violation of the WTO, the domestic industry may
cease to exist.
The steady decline in sugar consumption, and the fact that there are substitutes for
sugar, especially for manufactured products such as candy and soft drinks, limits the
overall market opportunities for these products. The opportunity matrix for sugar is
shown in table 15. This rapid opportunity assessment will focus primarily on the product
forms of white, brown/powdered/flavored, and sucralose. Another factor adversely
affecting the industry is the economies of scale necessary to enter the industry. Large
scale plants are generally required to process sugar in a cost effective manner. This
creates a barrier to entry for small firm or entrepreneurs interested in the market.
Table 15: Demand Driver/Product Form Matrix (Sugar)Product Form Convenience Ethnicity Indulgence Value WellnessWhite Granulated Low Low Low Low LowBrown/Powdered/Flavored Low Low Low Low LowSucralose Selective Selective Selective Low High
Sugar is consumed in a number of ways. Household use includes powdered and
brown sugar for cooking baking and refined white sugar used for cooking and baking as
well as a general sweetener. Sugar is also an input in cookies, candies, breakfast cereals,
etc., sold at the retail level. In this form, sugar is an ingredient in manufactured food

39
products. Sugar in the form of sucralose is increasingly being used as a substitute for
traditional sugar. Sucralose is a non-caloric form of sugar that is quickly replacing other
sugar substitutes.
Table 15 shows the retail sales of granulated, brown/powdered/flavored and
sucralose in 2002 and April 2003 to April 2004. Supermarkets dominate the retail sales
of sugar products with a market share of 98.1 percent from April 2003 through April
2004, not including Wal-Mart. However, it is estimated that Wal-Mart accounts for 11.9
percent of total retail sales (Mintel, Sugar and Sweeteners, p.35).
Table 16: Sales of Selected Sugar Products 2002 and 2004
Product Form2002 Sales (millions)
2004 Sales (millions)
Dollar Change (millions)
Percent Change
White Granulated $915 $871 ($44) -4.8%Brown, Powdered, Flavored $176 $173 ($3) -1.7%Sucralose $58 $137 $79 136.2%
Source: Mintel
These figures do not include sales from Wal-Mart, or sales to food manufacturers. The
decline in sugar sales has been going on since at least 1999; in 1999, total retail sales of
white granulated sugar were $976 million. From 1999 to 2004 sales have declined by
$105 million, or 10.8 percent (Mintel, Sugar and Sweeteners, p.17).
The decline in sales is expected to continue in the future. It is estimated that sales
of white granulated sugar will decline to $796 million in 2008 (Mintel, Sugar and
Sweetener, p.58). Sales of brown, flavored and powdered sugar are expected to be flat
between 2004 and 2008 (Mintel, Sugar and Sweetener, p. 61). Sucralose sales are

40
expected to continue increasing to $289 million in 2008, an increase of 92.7 percent from
2004 (Mintel, Sugar and Sweetener, p.62).
The overall decline in sugar consumption limits the opportunities for traditional
sugar products. However, the interest in sugar substitutes broadens the opportunities for
sucralose. Despite the decline in consumption, sugar is commonly found in households;
more than 90 percent of the households surveyed used sugar (Mintel, Sugar and
Sweetener, p.8). It should also be noted that 41 percent of those surveyed also consume
sugar substitutes and artificial sweeteners (Mintel, Sugar and Sweetener, p.38).
The decline in sugar consumption appears to be occurring in the manufactured
food industry as well. Sales of most sugar confectionery products are flat or declining,
the primary exceptions being sugarless gum and diet candy, neither of which uses sugar
(Mintel, Sugar Confectionery, p.7). However, this trend likely increases the demand for
sucralose. Overall, the market for sugar confections is expected to increase with the rate
of inflation (Mintel, Sugar Confections, p.11).
One threat facing the industry is the potential for taxation for products that use
sugar. California, Washington and Vermont have each proposed a 1 percent sales tax on
“junk” food and soft drinks (Mintel, Sugar Confectionery, p.16). If passed, this would
have the effect of raising the price of these products and reducing their consumption.
Sugar is primarily a commodity. In the eyes of most consumers, there is little, if
any, difference between brands. As a result, private label and store brands have the
largest market share (Mintel, Sugar and Sweetener, p.7). The fastest growing brand
name in this industry is Splenda, which is sucralose (Mintel, Sugar and Sweetener, p.23).
One positive aspect of the sugar industry is that Splenda is taking market share from

41
artificial sweeteners and does not appear to be affecting sugar products (Mintel, Sugar
and Sweeteners, p.53).
These factors help explain the relative lack of new product introductions in the
sugar industry. Table 17 shows the number of new sugar and sweetener product
introductions from 2000 through 2003 in North America. Sugar is a mature product and
Table 17: Total Sugar and Sweetener Introductions North America 2000-2003Year Number of Introductions2000 312001 312002 222003 76
Total 160
Source: Mintel
is often seen as a commodity, compared to many industries, number of new products is
very low. Furthermore, it should be noted that the products included in table 17 include
more than sugar and sucralose products, such as other sweeteners.
Convenience
There has not been a great deal of innovation in the area of convenience. C&H
has introduced a 4 lb. box that is shaped and pours like a cardboard milk carton (Mintel,
Sugar and Sweetener, p. 31). Smaller package sizes could be introduced that more
closely match customer consumption patterns. Only 11 percent of households use 6 or
more pounds of sugar a month and 61 percent use less than 2 pounds a month (Mintel,
Sugar and Sweetener, p.40). The may be somewhat more potential to introduce products
that appeal to convenience with sucralose due to the fact that sucralose is a relatively new
product and the market is still developing.

42
All things considered, there are limited opportunities for developing sugar
products that appeal to the demand driver of convenience, and selective opportunities for
sucralose products that appeal to this demand driver.
Ethnicity
Sugar is used by all households regardless of their ethnicity but the level of
consumption varies widely. Only 5 percent of Asian households use 6 or more pounds of
sugar a month but 22 percent of black households and 16 percent of Hispanic households
use this amount (Mintel, Sugar and Sweetener, p.41). Asian households also use less
sugar substitutes (Mintel, Sugar and Sweetener, p.43). Given the rates of diabetes in the
Black and Hispanic communities, it may be possible to expand the demand for sucralose.
Overall the ability to develop sugar products that appeal to the demand driver of
ethnicity is limited, but there are selective opportunities for sucralose products that appeal
to this demand driver.
Indulgence
As home baking skills decline, the demand for sugar purchased at the retail level
will also decline. One way to address this issue is by offering promotions, recipes, etc.
that make cooking easier. Some people see home made sweets as a means of connecting
with family and offering a true experience; sugar based products can be used to promote
social and family connectedness. Another way to appeal to this demand driver is to offer
flavored sugar products e.g. sugar and cinnamon, chocolate flavored sugar, etc. This
could be used to combine indulgence with convenience.
Another potential market that appeals to indulgence is the candy market. Some
older products are being introduced that appeal to nostalgia for older consumers but are

43
new products for children who are not familiar with the products (e.g. Pez, Pixie Sticks)
(Mintel, Sugar Confectionery, p.8).
However, sugar remains a commodity in the minds of most consumers and as a
result the ability to develop products that appeal to the demand driver of indulgence is
limited.
Value
The potential to develop sugar products that appeal to the demand driver of value
is extremely limited. Sugar prices are supported by government policy in the form of
support prices and import quotas. As a result, sugar products are not competitive in
world markets and face competition from competitive products such as HFCS.
Wellness
Sugar is not considered a healthy food to eat. One diet plan endorsed by the
government recommends 2 teaspoons of added sugar per day (DGAC, p.11). The interest
in low carb diets, the increase in obesity, and type 2 diabetes all adversely affect the sugar
industry. As a result, the ability for sugar products that appeal to the demand driver of
wellness is limited. One way to address this issue is to offer blended sugar products,
sugar products that combined with sugar substitutes. This would reduce the calories
while perhaps maintaining the desirable characteristics of sugar.
Another way to address the issue of wellness is through the production of organic
sugar. Branded organic sugar is currently being sold in Canada at the supermarket level
(Mintel, Sugar and Sweetener, p.71).
However, all these trends are positive for the increase utilization of sucralose.
Furthermore, since sucralose is processed from sugar it is a natural product in the minds

44
of many consumers. Also, sucralose does not have any of the negative health concerns
that some artificial sweeteners have. Consumers interested in a natural alternative to
traditional sugar substitutes will likely turn to sucralose. As a result ability to develop
new sucralose products that appeal to the demand driver of wellness is broad.
Summary
Overall, the opportunities for new products and other innovations in the sugar
industry are extremely limited. Sugar is a mature industry that is protected by
government policy. This may explain the low number of new product innovations in this
industry. The future of the industry is in doubt given the potential WTO action that could
be undertaken by countries that are low cost producers of sugar.
Consumers are also turning away from sugar. The interest in wellness, the
decline in cooking skills and food manufacturers’ use of HFCS is reducing the demand
for sugar. Conversely, the demand for sucralose will continue to increase. Consumers
are interested in a non-caloric natural sweetener and sucralose delivers these attributes.
Sucralose products can address the demand driver of wellness and can be used with
wellness to develop products that address the other demand drivers as well. However, it
should be noted that sucralose is primarily a food manufacturing input. Most of the
access to food manufacturers have been developed and served by existing firms, limiting
opportunities for new entrepreneurs.
Given the nature of the sugar industry, the economies of scale involved in
processing the maturity of the industry etc., producers and processors interested in
developing new products and markets may have to develop alliances or other contractual
arrangements to gain access and expertise needed to successfully enter the market.

45
Potatoes
Background
Potatoes are the leading vegetable in terms of farm cash receipts in the U.S. In
2003, on farm potato sales were estimated to be $2.57 billion (Lucier, Plummer and
Jerardo, p.27). Globally, potatoes are also a very important crop and are grown
throughout the world (Salazar and Busch, p.2). Potatoes are widely consumed in a
number of different forms: fresh, frozen, chips, and various boxed forms to name a few.
Potato products are also commonly purchased as part of a restaurant meal. Table 18
outlines per capita consumption of various types of potato products.
Table 18: Per Capita Use of Potatoes 2000-2004
Year Fresh FrozenChips and
Shoestrings Dehydrating Canning Total2000 47.3 57.9 16.0 15.9 1.7 138.82001 46.4 57.9 17.6 14.7 1.6 138.22002 44.6 55.1 16.4 14.8 1.4 132.32003 47.0 57.6 17.2 15.5 1.5 138.8
2004* 45.6 56.6 17.1 15.2 1.5 136.0
* 2004 is an estimateSource: Lucier, Plummer and Jerardo
During this time period potato, consumption has been very stable despite the interest in
low carbohydrate diets. Furthermore, there does not seem to be a major shift in the form
that potatoes are used. The average American consumes almost 4 ounces of potatoes per
day.
Potatoes are produced in each of the three states. Production of potatoes in
Michigan, Wisconsin and Ohio is given in table 19.

46
Table 19: Potato Production 1999-2003, Michigan, Ohio and WisconsinMichgian Ohio Wisconsin
Year Production (cwt.) Production (cwt.) Production (cwt.)1999 14,963,000 987,000 34,000,0002000 14,963,000 1,134,000 33,800,0002001 13,950,000 1,097,000 31,955,0002002 13,878,000 903,000 30,750,0002003 15,015,000 1,290,000 32,800,000
Source: National Agricultural Statistics Service
As table 19 shows, Wisconsin is a major potato producing area, Michigan is a medium
size producing area and Ohio is a small potato producing area. Potatoes grown in the
region are used for the table (fresh), frozen and chip market. Varieties are being
developed that are resistant to disease and meet the needs of consumers and processors.
This assessment will consider the opportunities in three industries, fresh,
processed (including dehydrated and frozen), and chips. The chip market is important
considering the varieties grown in the region. Table 20 gives the opportunity matrix for
potatoes linking the product forms with the demand drivers.
Table 20: Demand Driver/Product Form Matrix (Potatoes)Product Form Convenience Ethnicity Indulgence Value WellnessFresh Low Low Low Low SelectiveProcessed Selective Selective Selective Selective SelectiveChips/Fries High High High Low Low
Potatoes are also used as part of many pre-prepared meals. Many pre-prepared meals
offer some type of starch product: pasta, rice, or potatoes. This will be considered as
part of the processed potato market. Potatoes have traditionally been used as a side dish
to complement a meat entrée. As the matrix shows, overall there are selective
opportunities in the potato industry, especially in the processed and chips markets.

47
In 2003, retail sales of instant and other types of potato mixes were $341 million,
an increase of $32 million or 10.4 percent from 2001 (Mintel, Side Dishes, p.20). It is
forecasted that the market for packaged potato products will increase to $388 million by
2008, an increase of 14 percent from 2003. Sales of these products are anticipated to
keep up with inflation (Mintel, Side Dishes, p.89). In 2004, retail sales of frozen meals
were estimated to be $7.9 billion, an increase of 31 percent from 1999 (Mintel, Frozen
Meals, p.6). Retail sales of these products are expected to increase another 36 percent to
$10.7 billion by 2009 (Mintel, Frozen Meals p.60). In 2003, retail sales of potato chips
were $6.05 billion, an increase of $11 million or 0.2 percent from 2001 (Mintel, Salty
Snacks, p.19). Potato chips sales are forecasted to be $7.75 billion in 2008, an increase of
28 percent from 2003 (Mintel, Salty Snacks, p.89).
A major issue affecting the industry is the need to meet quality standards,
especially in terms of size, taste, and color (Salazar and Busch, p.3). As a result
contracting between processors and producers is common. While this allows for price
guarantees and a consistent quality of product, it makes innovation somewhat more
difficult. Furthermore, the amount of integration in the industry makes it very difficult for
an individual entrepreneur to act on his or her own. Access to markets and obtaining a
sufficient number of potatoes to fill a market niche is very challenging. As a result there
has been a move towards fewer farms, but larger in terms of acreage in the industry
(Salazar and Busch, p.9). One way for an individual producer to overcome these
obstacles is to use farmers markets or roadside markets to sell the potatoes directly to
consumers.

48
Related to the level of vertical integration is the size of the industries in the
market. For example, General Mills’ Betty Crocker Brands account for more than 50
percent of the packaged potato sales in 2002 (Mintel, Side Dishes, p.32). Frito-Lay
dominates the potato chip industry with a market share that approaches 60 percent
(Mintel, Salty Snacks, p.31).
Another way to overcome this obstacle is to focus intently on a market that large
firms no longer have a strong interest in. For example, Bush beans and Zatarain’s rice
products have been successful in mature industries that appeared to show limited
potential for growth (Mintel, Side Dishes, p.4).
Supermarkets are the dominant source of distribution for fresh and processed
potatoes; more than 99 percent of side dish sales are accounted for by supermarkets
(Mintel, Side Dishes, p.5). The chip market is far more diverse, convenience stores and
vending machines play a much larger role in the retail distribution of chips.
Convenience
Half of households use instant potato products (Mintel, Side Dishes, p.5). While
this figure is high, there still appears to be room for growth. The most popular form of
packaged potato products is mashed potatoes, followed by Au Gratin and scalloped
(Mintel, Side Dishes, p.63). There has been an increase in the number of microwavable
packaged potato products that are designed to address the demand driver of convenience
(Mintel, Side Dishes, p.20). Many frozen potato products can also be prepared in a
microwave. The decline in free time and the decline in cooking skills limit the
opportunities in the fresh market, although there have been developments in creating
microwaveable baked potatoes.

49
Frozen meals are also convenient products that also appeal to single person
households. However, the manufacturers of these products are likely to look at potatoes
as commodities. The provider of potatoes that meet quality standards at the lowest cost
will likely supply this industry.
Potato chips are one industry that has limited opportunities with respect to
convenience. Chips are a naturally convenient food that can be eaten just about
anywhere, and can be eaten with a person’s hands. Single serve packaging is also very
common. French fires are one of the most convenient forms of potato processing. There
are some new introductions in the frozen French fry market, with flavors, spices, and
seasonings being added to address the desire for indulgence, convenience and ethnicity.
Another product that is being developed is refrigerated mashed potatoes.
Insofar as eating fresh potatoes requires some type of cooking, fresh potatoes are
not considered a convenient food. Overall, there are selective opportunities in developing
processed products that appeal to convenience and limited opportunities for developing
chips and fresh potato products that appeal to this demand driver.
Ethnicity
Increasing ethnicity presents both opportunities and threats to the potato industry.
Asians are less likely than other ethnic groups to eat potatoes (Mintel, Side Dishes, p.8)
preferring rice as their primary source of starches.
Overall 50 percent of households surveyed use package potato products; this
includes 50 percent of white households, 56 percent of black households, 24 percent of
Asian households and 52 percent of Hispanic households (Mintel, Side Dishes, p.51).
One way to offer products that appeal to Hispanic consumers is to offer frozen or

50
packaged meals that appeal to these consumers. Generally speaking, these products
usually feature rice as the primary starch product. Potatoes could be used in these
products to increase the demand for potatoes. Offering products that have a taste profile
that appeal to Hispanics could expand the demand for these products. It may be difficult
to get Asian consumers to substitute potatoes for rice.
One way to appeal to Asian tastes is through the chip market, 88 percent of
households consume potato chips (Mintel, Salty Snacks, p.62). Developing flavors that
appeal to Asians (e.g. curry flavored chips), could help expand the market. Many chip
manufacturers are currently developing and introducing such products.
Overall, there are limited opportunities in developing fresh products that appeal to
ethnicity and selective opportunities for processed potato products and chips that appeal
to this demand driver.
Indulgence
There does appear to be some room for growth by developing products that
appeal to indulgence. There is a move towards using stronger more exotic flavors
(Mintel, Side Dishes, p.10). Additional herbs, spices, peppers etc. could be used to
appeal to indulgence. Both the processed and the chip industries could take advantage of
this opportunity. The chip market has not been as active as it could be in developing new
varieties of products.
There have been some chip manufacturers that have developed gourmet chips that
combine indulgence attributes with wellness attributes (Salazar and Busch, p.9).

51
There may also be some opportunities in heritage varieties of fresh potatoes that
appeal to indulgence. Alternative marketing arrangements such as roadside stands and
farmers’ markets could be used to sell specialty varieties of potatoes.
Overall, there are limited opportunities in introducing fresh products that appeal
to the demand driver of indulgence and selective opportunities in introducing processed
and potato chip products that appeal to this demand driver. On the other hand, french
fries appear to be an exception. Some fry manufacturers are developing products that
appeal to indulgence.
Value
Generally potatoes are a commodity; this is particularly true for the fresh market.
Consumers will buy the product at the lowest price as long as the basic quality and taste
standards are met.
There may be some potential in the area of frozen meals. Price is an important
factor for 79 percent of consumers who buy frozen meals (Mintel, Frozen Meals, p.49).
Again finding ways for individual potato producers or processors to take advantage of
this opportunity may be very difficult. Food manufacturers have a very strong position in
the frozen meal market.
Overall there are limited opportunities for chip producers and participants in the
fresh market to appeal to the demand driver of value. There may be selective
opportunities for processors that take advantage of economies of scale and target the right
market to appeal to the demand driver of value with respect to packaged and other
processed potato products.

52
Wellness
There are several ways to appeal to wellness. One way is to offer both fresh and
processed products that are organic. Another way is through the use of developing “food
minus” products. Potatoes are a naturally healthy product that has been traditionally
loaded down with salt and other additives that consumers are growing increasingly wary
of. Producing chips and processed products that are baked instead of fried, fried in
lowfat vegetable oil, or produced with less sodium are all ways of developing products
that could appeal to wellness. These products could be geared toward older consumers,
who tend to express a preference for these types of products, and are a growing market
(Mintel, Salty Snacks, p.71). Producing potato products, especially chips that are free of
trans fatty acids also provides opportunities.
One issue that had adversely affected the potato industry has been the interest in
low carbohydrate diets. Markers of frozen meals have been introduced a number of low
carb meals that have reduced or eliminated the use of potatoes (Mintel, Frozen Meals
p.6).
There are selective opportunity in the processed and potato chip industry of
appealing to the demand driver of wellness. The opportunities in the fresh market are
limited.
Summary
Potatoes are grown in Michigan, Ohio and Wisconsin. Potatoes for the fresh and
processed market are produced in the area with much of the acreage devoted to chip
varieties. Overall, there are selective opportunities in the industry.

53
Potatoes are a naturally health food that many consumers do not feel is healthy.
The use of “food minus” products could be used to develop products that appeal to the
demand driver of wellness. This is particularly true for chips and processed potato
products; it is less true for the fresh market.
Ethnicity presents both opportunities and threats. A growing Asian population
threatens the growth of potato markets; most Asian households rely on rice to provide
meet their need for starches. Hispanics do eat potatoes and products that appeal to them
could be successful, this is particularly true for processed and chip products. New tastes
and flavors could also be used to appeal to indulgence as well as ethnicity.
Of the demand drivers, developing products that appeal to convenience and value
show the least potential. Fresh potatoes are not a convenient food, and other potato
products have taken advantage of convenience. This is particularly true of potato chips
which are very convenient are not are not likely to see additional innovations that
enhance this product characteristic.
As is the case with dry beans and sugar, potatoes are a commodity that are often
used in other food products. This is especially true for potatoes that are used in prepared
food products and restaurants. Price is a major concern for firms that buy potatoes, as are
quality standards. Competing on price will be very difficult. The level of vertical
integration and contracting make it very difficult for an individual grower or processor to
act on his or her own. Alternative contractual arrangements or business relationships
may need to be developed in order to introduce new products or markets in the potato
industry.

54
Conclusion
Dry beans, sugar and potatoes are important field crops produced in Michigan,
Ohio and Wisconsin. Economic and demographic changes have created several
fundamental demand drivers. There are some products that show promise. These tend to
be high value products that appeal primarily to the demand drivers of ethnicity, and
wellness. There are some opportunities for products that appeal to the demand drivers of
indulgence.
A major issue facing producers, processors and entrepreneurs is the need to
develop alternative marketing arrangements. To take full advantage of some of these
opportunities, those involved in these industries will have to move away from a
traditional commodity based arrangements and move towards a more coordinated
product, based supply chain. Examples include forming cooperatives, entering into
strategic alliances and alternative contracts. It would be very difficult for an individual
dry bean, sugar or potato producer to develop a unique product, and supply the entire
market by him or herself. These types of arrangements are already common in the sugar
and potato sectors.
It should be noted that the sugar industry is under a great deal of stress.
Consumers and industrial purchasers of sugar are reducing their purchases. A change in
government support policies as result of a WTO challenge or other factor could
effectively mean the end of the industry in the U.S. Additional investments in the
industry could be risky. However, it should be noted that there are opportunities in the
sucralose industry. Consumers are interested in natural non-caloric sweeteners such as
sucralose.

55
References
About. Why You Should Avoid Trans Fatty Acids. University of Iowa Health
Center. http://diabetes.about.com/cs/newswirea/blntransfats903_p.htm.
Day, J.C. Population Projections of the United States by Age, Sex Race and
Hispanic Origin: 1995 to 2050, U.S. Bureau of the Census, Current Population Reports,
P25-1130, U.S. Government Printing Office, Washington, DC, 1996.
Dietary Guidelines Advisory Committee (DGAC). Dietary Guidelines of
Americans 2005. Washington, Department of Health and Human Services and United
States Department of Agriculture, 2005.
Haley, S. and N. Suarez. Sugar and Sweetener Situation and Outlook Report,
SSS-2004. Washington, Economic Research Service, U.S. Department of Agriculture,
2004.
Hobbs, F. and N. Stoops. U.S. Census Bureau, Census 2000 Special Reports,
Series CENSR-4, Demographic Trends in the 20th Century, U.S. Government Printing
Office, Washington, DC, 2001.
Larsen, L.J. The Foreign Born Population in the United States: 2003. Current
Population Reports, P20-551, U.S. Census Bureau, Washington, DC, 2004.
Lucier, G., C. Plummer and A. Jerardo. Vegetables and Melons: Situation and
Outlook Yearbook, VGS-2004. Washington, Economic Research Service, U.S.
Department of Agriculture, 2004.
Michigan Department of Agriculture. Michigan Agricultural Statistics 2003-
2004. Lansing, Michigan Department of Agriculture, 2004.
Mintel. Frozen Meals, Mintel, Chicago, 2004.

56
_____. The Mexican Food Market, Mintel, Chicago, 2002.
_____. Salty Snacks, Mintel, Chicago, 2004.
_____. Side Dishes, Mintel, Chicago, 2003.
_____. Soup. Mintel, Chicago, 2004.
_____. Sugar Confectionery, Mintel, Chicago, 2004.
_____. Sugar and Sweeteners. Mintel, Chicago, 2004.
National Agricultural Statistics Service. Crop Values: 2004 Summary.
Washington: U.S. Department of Agriculture, 2005.
Nunes, P.F., B .A. Johnson and R.T.S. Breene. Selling to the Moneyed Masses,
Harvard Business Review, Volume 82, No.7/8 (94-104).
Ohio Department of Agriculture. Ohio Agricultural Statistics (various years).
Reynoldsburg, Ohio Department of Agriculture.
Reeves, T. and C. Bennett. The Asian and Pacific Islander Population in the
United States: March 2002, Current Population Reports, P20-540, U.S. Census Bureau,
Washington, DC, 2003.
Salazar, M. and L. Busch. Standards and Strategies in the Michigan Potato
Industry, Research Report No. 576. East Lansing, Michigan Agricultural Experiment
Station, Michigan State University, 2001.
U.S. Census Bureau, Current Population Reports, P60-213, Money Income in the
United States: 2000, U.S. Government Printing Office, Washington, DC, 2001.
Wisconsin Department of Agriculture, Trade and Consumer Protection. 2004
Wisconsin Agricultural Statistics. Madison, Wisconsin Department of Agriculture, Trade
and Consumer Protection, 2004.

57


![Information technology : a strategic opportunity - [email protected] : Home](https://static.fdocuments.net/doc/165x107/613d2fd2736caf36b75a5866/information-technology-a-strategic-opportunity-emailprotected-home.jpg)