The Stirred Tank Reactor Polymer Electrolyte Membrane Fuel...
12
The Stirred Tank Reactor Polymer Electrolyte Membrane Fuel Cell Jay Benziger, E. Chia, E. Karnas, J. Moxley, C. Teuscher, and I. G. Kevrekidis Dept. of Chemical Engineering Princeton University, Princeton, NJ 08544 DOI 10.1002/aic.10158 Published online in Wiley InterScience (www.interscience.wiley.com). The design and operation of a differential polymer electrolyte membrane (PEM) fuel cell is described. The fuel cell design is based on coupled stirred tank reactors (STRs) coupled through a membrane; the gas phase in each reactor compartment is well mixed. The characteristic times for reactant flow, gas phase diffusion, and reaction were chosen so that the gas compositions at both the anode and cathode are uniform. The STR PEM fuel cell is one-dimensional; the only spatial gradients are transverse to the membrane. The cell is used to examine start-up, and dynamic responses to changes in load, temperature, and reactant flow rates. Multiple time scales in the system’s response are found to correspond to water absorption by the membrane, water transport through the membrane, and stress-related mechanical changes of the membrane. © 2004 American Institute of Chemical Engineers AIChE J, 50: 1889 –1900, 2004 Keywords: coupled stirred tank reactor, polymer electrolyte membrane fuel cell, diffusion Introduction Fuel cells are multiphase chemical reactors in which two sequential chemical reactions are coupled by transport of the intermediate products between catalysts. The reactants are fed on two sides of the reactor, separated by an ion-conducting barrier. A catalytic reaction occurs on one side of the barrier, producing an intermediate product that is transported across the barrier to a second catalyst, where it reacts with the second reactant to make the final product. A simplified version of the polymer electrolyte membrane (PEM) fuel cell is shown in Figure 1 (Blomen and Mugerwa, 1993; Bokris and Srinivasan, 1969; Costamagna and Srinivasan, 2001; EG&G Services, 2000). Hydrogen molecules are fed to the anode side of a cation-conducting polymer membrane in contact with a cata- lyst. The hydrogen molecules react on the anode catalyst, producing the intermediate products: protons and electrons. The protons are transported across the PEM and the electrons pass through an external circuit, where they encounter oxygen molecules on the cathode side of the membrane. The protons, electrons, and oxygen react on the cathode catalyst surface and produce water. A reaction engineering approach to analyze PEM fuel cells is introduced. We are seeking a prescriptive model of the PEM fuel cell, which describes the system response as a function of the parameters that the operator can control. The experimental approach is based on experience with heterogeneous catalytic reactors. Experimental results from simplified reactors are used to develop mathematical descriptions of the system variables as functions of the system operating parameters that fit the data over the relevant range of operating conditions (Froment and Bischoff, 1979). Model reactors, such as the one described herein, are not optimal for reactant conversion; rather, they are specifically designed to measure system parameters, including effective kinetic and transport properties (Folger, 1999; Fro- ment and Bischoff, 1979; Levenspiel, 1996). There are a number of excellent models of the transport processes and the detailed chemical reactions at the electro- catalyst surfaces in PEM fuel cells (Baschuk and Li, 2000; Bernardi, 1990; Bernardi and Verbrugge, 1992; Dutta et al., 2000; Natarajan and Van Nguyen, 2001; Springer et al., 1991, 2001; Thampan et al., 2000; Van Nguyen and Knobbe, 2003). These models have included molecular details of electron transfer reactions at electrode surfaces, transport of the reac- Correspondence concerning this article should be addressed to J. Benziger at [email protected]. © 2004 American Institute of Chemical Engineers AIChE Journal 1889 August 2004 Vol. 50, No. 8
Transcript of The Stirred Tank Reactor Polymer Electrolyte Membrane Fuel...
The Stirred Tank Reactor Polymer ElectrolyteMembrane Fuel Cell
Jay Benziger, E. Chia, E. Karnas, J. Moxley, C. Teuscher, and I. G. KevrekidisDept. of Chemical Engineering Princeton University, Princeton, NJ 08544
DOI 10.1002/aic.10158Published online in Wiley InterScience (www.interscience.wiley.com).
The design and operation of a differential polymer electrolyte membrane (PEM) fuelcell is described. The fuel cell design is based on coupled stirred tank reactors (STRs)coupled through a membrane; the gas phase in each reactor compartment is well mixed.The characteristic times for reactant flow, gas phase diffusion, and reaction were chosenso that the gas compositions at both the anode and cathode are uniform. The STR PEMfuel cell is one-dimensional; the only spatial gradients are transverse to the membrane.The cell is used to examine start-up, and dynamic responses to changes in load,temperature, and reactant flow rates. Multiple time scales in the system’s response arefound to correspond to water absorption by the membrane, water transport through themembrane, and stress-related mechanical changes of the membrane. © 2004 AmericanInstitute of Chemical Engineers AIChE J, 50: 1889–1900, 2004Keywords: coupled stirred tank reactor, polymer electrolyte membrane fuel cell, diffusion
Introduction
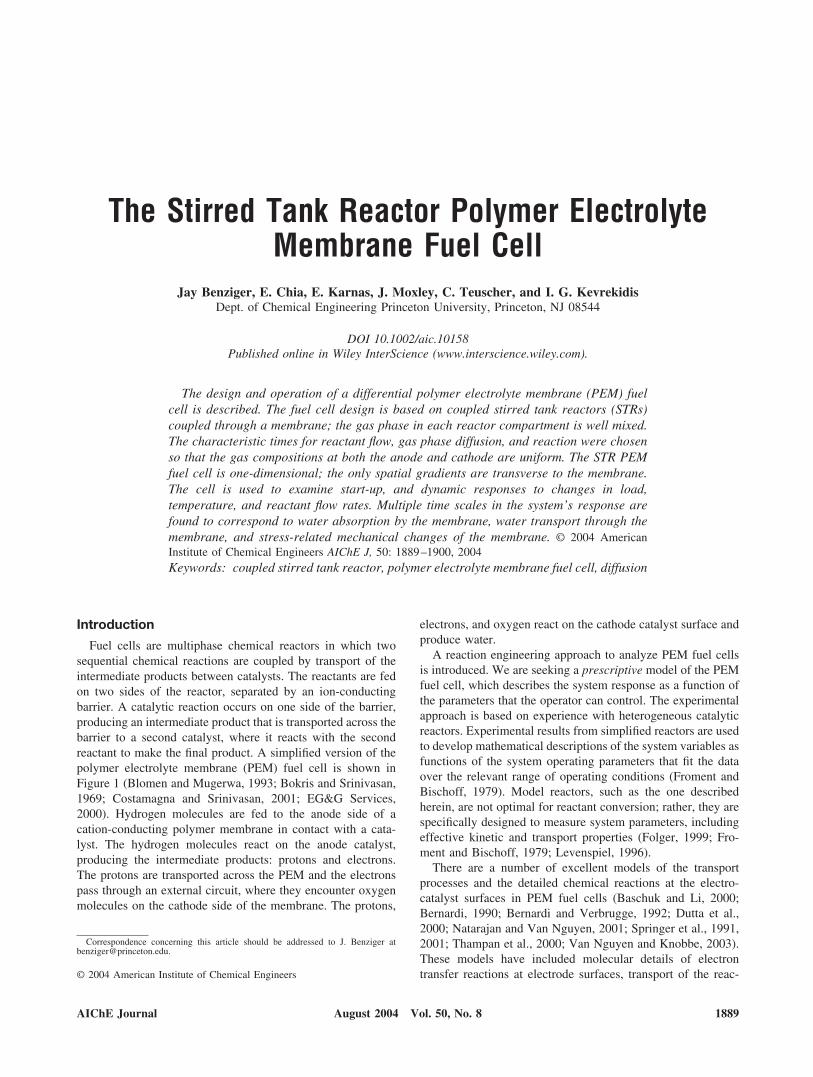
Fuel cells are multiphase chemical reactors in which twosequential chemical reactions are coupled by transport of theintermediate products between catalysts. The reactants are fedon two sides of the reactor, separated by an ion-conductingbarrier. A catalytic reaction occurs on one side of the barrier,producing an intermediate product that is transported across thebarrier to a second catalyst, where it reacts with the secondreactant to make the final product. A simplified version of thepolymer electrolyte membrane (PEM) fuel cell is shown inFigure 1 (Blomen and Mugerwa, 1993; Bokris and Srinivasan,1969; Costamagna and Srinivasan, 2001; EG&G Services,2000). Hydrogen molecules are fed to the anode side of acation-conducting polymer membrane in contact with a cata-lyst. The hydrogen molecules react on the anode catalyst,producing the intermediate products: protons and electrons.The protons are transported across the PEM and the electronspass through an external circuit, where they encounter oxygenmolecules on the cathode side of the membrane. The protons,
electrons, and oxygen react on the cathode catalyst surface andproduce water.
A reaction engineering approach to analyze PEM fuel cellsis introduced. We are seeking a prescriptive model of the PEMfuel cell, which describes the system response as a function ofthe parameters that the operator can control. The experimentalapproach is based on experience with heterogeneous catalyticreactors. Experimental results from simplified reactors are usedto develop mathematical descriptions of the system variables asfunctions of the system operating parameters that fit the dataover the relevant range of operating conditions (Froment andBischoff, 1979). Model reactors, such as the one describedherein, are not optimal for reactant conversion; rather, they arespecifically designed to measure system parameters, includingeffective kinetic and transport properties (Folger, 1999; Fro-ment and Bischoff, 1979; Levenspiel, 1996).
There are a number of excellent models of the transportprocesses and the detailed chemical reactions at the electro-catalyst surfaces in PEM fuel cells (Baschuk and Li, 2000;Bernardi, 1990; Bernardi and Verbrugge, 1992; Dutta et al.,2000; Natarajan and Van Nguyen, 2001; Springer et al., 1991,2001; Thampan et al., 2000; Van Nguyen and Knobbe, 2003).These models have included molecular details of electrontransfer reactions at electrode surfaces, transport of the reac-
Correspondence concerning this article should be addressed to J. Benziger [email protected].
© 2004 American Institute of Chemical Engineers
AIChE Journal 1889August 2004 Vol. 50, No. 8
tants and products through multiple layers associated with theelectrodes, and transport of water and protons through thepolymer electrolyte. Steady-state current/voltage responsecharacteristics of a PEM fuel cell have been successfully fit bythese models. However, these models are complex and theyhave not been validated with dynamic behavior of PEM fuelcells. Indeed, these models have emphasized steady-state per-formance.
We designed and constructed an “idealized” experimental
fuel cell to examine fuel cell dynamics. Herein we describe thestirred tank reactor (STR) PEM fuel cell and the rationalebehind its design. The STR PEM fuel cell is compared toexisting fuel cell test stations to illustrate its unique featuresand capabilities. A systems analysis is presented to identify thekey control parameters affecting the operation of PEM fuelcells. A reaction engineering model of a differential element ina PEM fuel cell is presented to show the essential informationrequired to predict dynamic behavior. Finally, we present re-sults of the startup of PEM fuel cells and their response tochanges in load, temperature, and reactant flow.
The Differential PEM ReactorThe STR PEM design
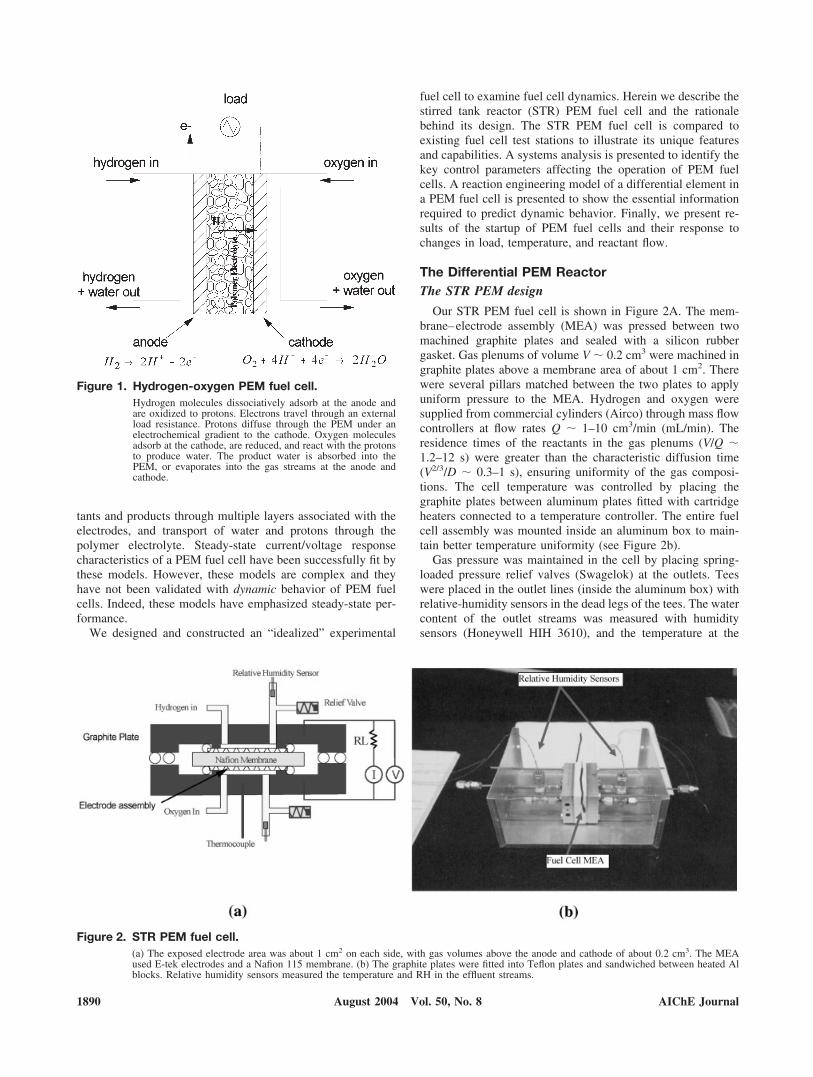
Our STR PEM fuel cell is shown in Figure 2A. The mem-brane–electrode assembly (MEA) was pressed between twomachined graphite plates and sealed with a silicon rubbergasket. Gas plenums of volume V � 0.2 cm3 were machined ingraphite plates above a membrane area of about 1 cm2. Therewere several pillars matched between the two plates to applyuniform pressure to the MEA. Hydrogen and oxygen weresupplied from commercial cylinders (Airco) through mass flowcontrollers at flow rates Q � 1–10 cm3/min (mL/min). Theresidence times of the reactants in the gas plenums (V/Q �1.2–12 s) were greater than the characteristic diffusion time(V2/3/D � 0.3–1 s), ensuring uniformity of the gas composi-tions. The cell temperature was controlled by placing thegraphite plates between aluminum plates fitted with cartridgeheaters connected to a temperature controller. The entire fuelcell assembly was mounted inside an aluminum box to main-tain better temperature uniformity (see Figure 2b).
Gas pressure was maintained in the cell by placing spring-loaded pressure relief valves (Swagelok) at the outlets. Teeswere placed in the outlet lines (inside the aluminum box) withrelative-humidity sensors in the dead legs of the tees. The watercontent of the outlet streams was measured with humiditysensors (Honeywell HIH 3610), and the temperature at the
Figure 1. Hydrogen-oxygen PEM fuel cell.Hydrogen molecules dissociatively adsorb at the anode andare oxidized to protons. Electrons travel through an externalload resistance. Protons diffuse through the PEM under anelectrochemical gradient to the cathode. Oxygen moleculesadsorb at the cathode, are reduced, and react with the protonsto produce water. The product water is absorbed into thePEM, or evaporates into the gas streams at the anode andcathode.
Figure 2. STR PEM fuel cell.(a) The exposed electrode area was about 1 cm2 on each side, with gas volumes above the anode and cathode of about 0.2 cm3. The MEAused E-tek electrodes and a Nafion 115 membrane. (b) The graphite plates were fitted into Teflon plates and sandwiched between heated Alblocks. Relative humidity sensors measured the temperature and RH in the effluent streams.
1890 AIChE JournalAugust 2004 Vol. 50, No. 8
humidity sensor was measured with a thermocouple in the gasline. The relative-humidity sensors had to be sufficiently heatedto avoid liquid condensation on the capacitive sensing element,but they also had to be kept below 85°C to protect the amplifiercircuit on the sensor chip.
Any suitable MEA can be tested in the STR PEM fuel cell.We report here results using an MEA consisting of a Nafion115 membrane pressed between 2 E-tek electrodes (these con-sist of a carbon cloth coated on one side with a Pt/C catalyst).The catalyst weight loading was 0.4 mg Pt/cm2. The electrodeswere brushed with solubilized Nafion solution to a loading ofabout 4 mg Nafion/cm2 before placing the membrane betweenthem (Raistrick, 1989). The assembly was hot pressed at 130°Cand 10 MPa. Copper foils were pressed against the graphiteplates and copper wires were attached to connect to the externalload resistor.
The current and voltage across the load resistor were mea-sured as the load resistance was varied. A 10-turn 0–20 �potentiometer was connected in series with a 10-turn 0–500 �potentiometer. The load resistance was varied from 0 to 20 �to obtain a polarization curve (IV). To examine the low-currentrange of the polarization curve the resistance had to be in-creased over the range of 0–500 �. The voltage across the loadresistor was read directly by a DAQ board. The current throughthe load resistor was passed through a 0.2-� sensing resistorand the differential voltage across the sensing resistor wasamplified by a factor of 100 with an Analog Devices AMP02Instrumentation Amplifier and read by the DAQ board. An IVcurve was typically collected and stored in about 100 s.
Comparison of the STR PEM and serpentine flow PEMtest stations
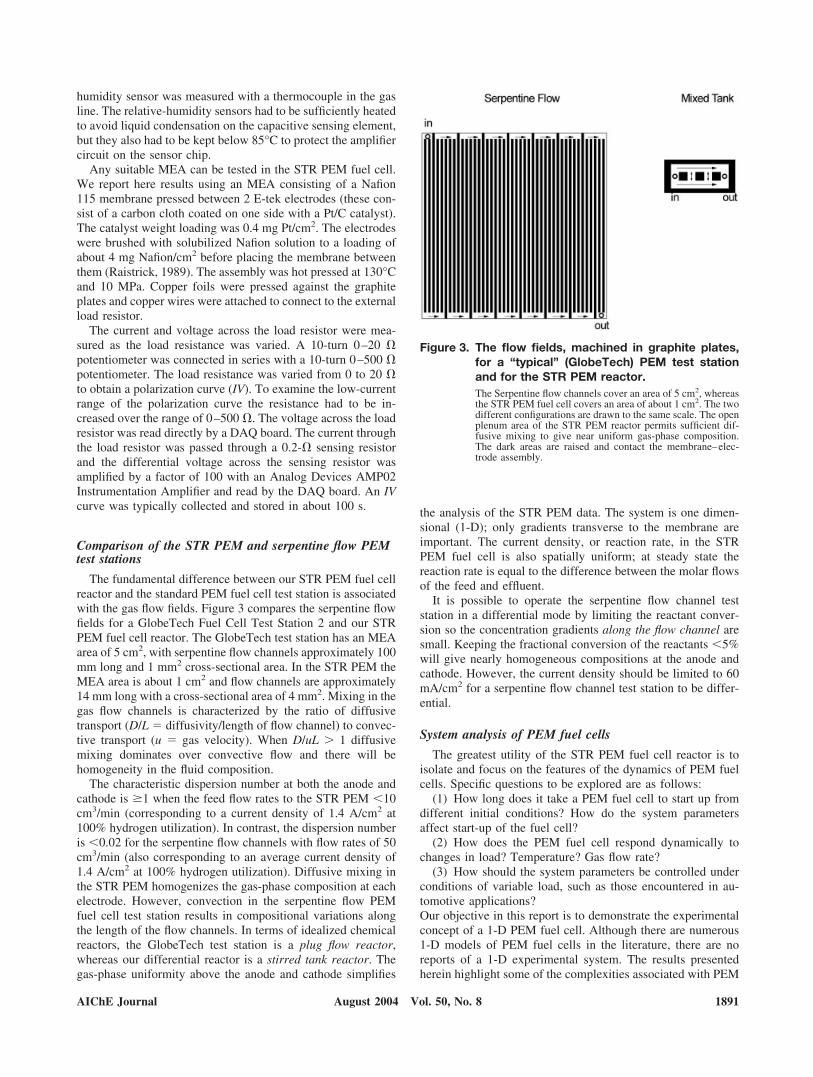
The fundamental difference between our STR PEM fuel cellreactor and the standard PEM fuel cell test station is associatedwith the gas flow fields. Figure 3 compares the serpentine flowfields for a GlobeTech Fuel Cell Test Station 2 and our STRPEM fuel cell reactor. The GlobeTech test station has an MEAarea of 5 cm2, with serpentine flow channels approximately 100mm long and 1 mm2 cross-sectional area. In the STR PEM theMEA area is about 1 cm2 and flow channels are approximately14 mm long with a cross-sectional area of 4 mm2. Mixing in thegas flow channels is characterized by the ratio of diffusivetransport (D/L � diffusivity/length of flow channel) to convec-tive transport (u � gas velocity). When D/uL � 1 diffusivemixing dominates over convective flow and there will behomogeneity in the fluid composition.
The characteristic dispersion number at both the anode andcathode is �1 when the feed flow rates to the STR PEM �10cm3/min (corresponding to a current density of 1.4 A/cm2 at100% hydrogen utilization). In contrast, the dispersion numberis �0.02 for the serpentine flow channels with flow rates of 50cm3/min (also corresponding to an average current density of1.4 A/cm2 at 100% hydrogen utilization). Diffusive mixing inthe STR PEM homogenizes the gas-phase composition at eachelectrode. However, convection in the serpentine flow PEMfuel cell test station results in compositional variations alongthe length of the flow channels. In terms of idealized chemicalreactors, the GlobeTech test station is a plug flow reactor,whereas our differential reactor is a stirred tank reactor. Thegas-phase uniformity above the anode and cathode simplifies
the analysis of the STR PEM data. The system is one dimen-sional (1-D); only gradients transverse to the membrane areimportant. The current density, or reaction rate, in the STRPEM fuel cell is also spatially uniform; at steady state thereaction rate is equal to the difference between the molar flowsof the feed and effluent.
It is possible to operate the serpentine flow channel teststation in a differential mode by limiting the reactant conver-sion so the concentration gradients along the flow channel aresmall. Keeping the fractional conversion of the reactants �5%will give nearly homogeneous compositions at the anode andcathode. However, the current density should be limited to 60mA/cm2 for a serpentine flow channel test station to be differ-ential.
System analysis of PEM fuel cells
The greatest utility of the STR PEM fuel cell reactor is toisolate and focus on the features of the dynamics of PEM fuelcells. Specific questions to be explored are as follows:
(1) How long does it take a PEM fuel cell to start up fromdifferent initial conditions? How do the system parametersaffect start-up of the fuel cell?
(2) How does the PEM fuel cell respond dynamically tochanges in load? Temperature? Gas flow rate?
(3) How should the system parameters be controlled underconditions of variable load, such as those encountered in au-tomotive applications?Our objective in this report is to demonstrate the experimentalconcept of a 1-D PEM fuel cell. Although there are numerous1-D models of PEM fuel cells in the literature, there are noreports of a 1-D experimental system. The results presentedherein highlight some of the complexities associated with PEM
Figure 3. The flow fields, machined in graphite plates,for a “typical” (GlobeTech) PEM test stationand for the STR PEM reactor.The Serpentine flow channels cover an area of 5 cm2, whereasthe STR PEM fuel cell covers an area of about 1 cm2. The twodifferent configurations are drawn to the same scale. The openplenum area of the STR PEM reactor permits sufficient dif-fusive mixing to give near uniform gas-phase composition.The dark areas are raised and contact the membrane–elec-trode assembly.
AIChE Journal 1891August 2004 Vol. 50, No. 8
fuel cell dynamics we have identified with our STR PEM fuelcell.
A real PEM fuel cell reactor is complex. Electrode reactionsand transport through the gas channels, diffusion through theelectrode layers, and transport across the membrane are allcoupled. Datta and coworkers described the structure of PEMfuel cells and the molecular details of the transport and reactionin the PEM fuel cell (Thampan et al., 2001). These modelsassume descriptions about transport processes and electrodekinetics and call for data about system variables that cannot bedirectly measured or easily controlled. We have followed anengineering approach and considered to what level of detail thesystem variables in the fuel cell can be described as functionsof the parameters under operator control. Our ultimate objec-tive is to develop a good reactor model that captures theessential physics without unnecessary detail.
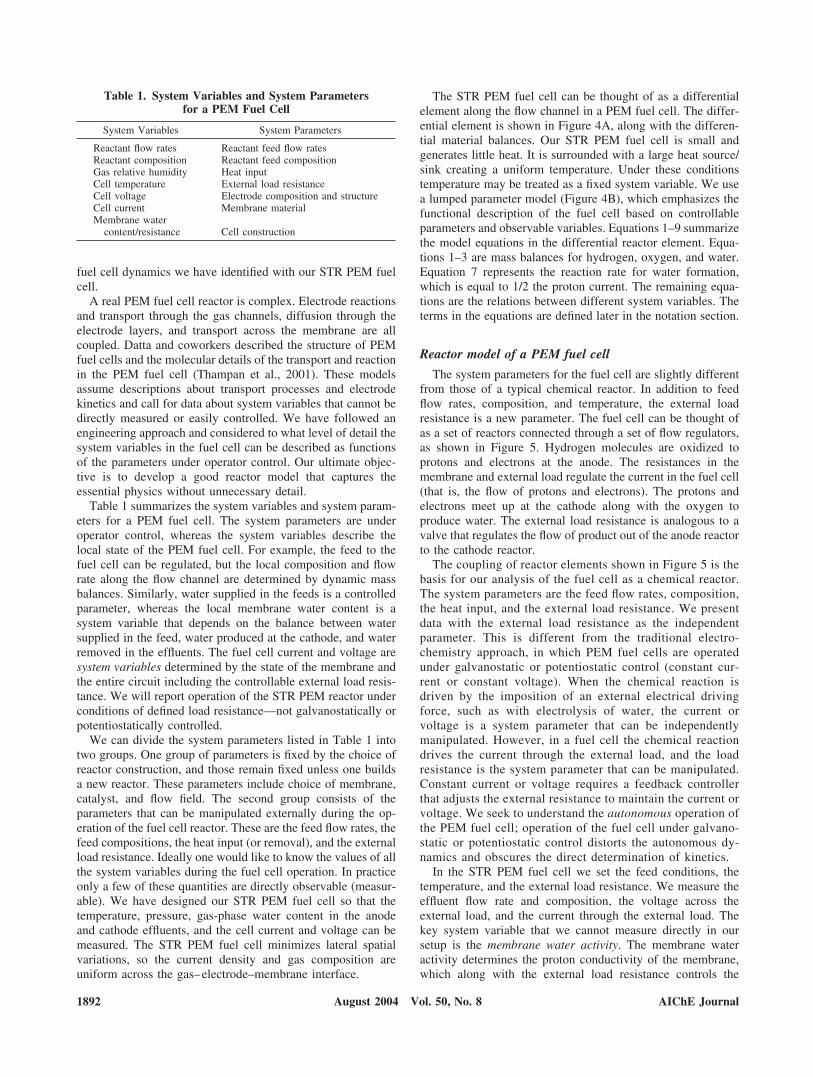
Table 1 summarizes the system variables and system param-eters for a PEM fuel cell. The system parameters are underoperator control, whereas the system variables describe thelocal state of the PEM fuel cell. For example, the feed to thefuel cell can be regulated, but the local composition and flowrate along the flow channel are determined by dynamic massbalances. Similarly, water supplied in the feeds is a controlledparameter, whereas the local membrane water content is asystem variable that depends on the balance between watersupplied in the feed, water produced at the cathode, and waterremoved in the effluents. The fuel cell current and voltage aresystem variables determined by the state of the membrane andthe entire circuit including the controllable external load resis-tance. We will report operation of the STR PEM reactor underconditions of defined load resistance—not galvanostatically orpotentiostatically controlled.
We can divide the system parameters listed in Table 1 intotwo groups. One group of parameters is fixed by the choice ofreactor construction, and those remain fixed unless one buildsa new reactor. These parameters include choice of membrane,catalyst, and flow field. The second group consists of theparameters that can be manipulated externally during the op-eration of the fuel cell reactor. These are the feed flow rates, thefeed compositions, the heat input (or removal), and the externalload resistance. Ideally one would like to know the values of allthe system variables during the fuel cell operation. In practiceonly a few of these quantities are directly observable (measur-able). We have designed our STR PEM fuel cell so that thetemperature, pressure, gas-phase water content in the anodeand cathode effluents, and the cell current and voltage can bemeasured. The STR PEM fuel cell minimizes lateral spatialvariations, so the current density and gas composition areuniform across the gas–electrode–membrane interface.
The STR PEM fuel cell can be thought of as a differentialelement along the flow channel in a PEM fuel cell. The differ-ential element is shown in Figure 4A, along with the differen-tial material balances. Our STR PEM fuel cell is small andgenerates little heat. It is surrounded with a large heat source/sink creating a uniform temperature. Under these conditionstemperature may be treated as a fixed system variable. We usea lumped parameter model (Figure 4B), which emphasizes thefunctional description of the fuel cell based on controllableparameters and observable variables. Equations 1–9 summarizethe model equations in the differential reactor element. Equa-tions 1–3 are mass balances for hydrogen, oxygen, and water.Equation 7 represents the reaction rate for water formation,which is equal to 1/2 the proton current. The remaining equa-tions are the relations between different system variables. Theterms in the equations are defined later in the notation section.
Reactor model of a PEM fuel cell
The system parameters for the fuel cell are slightly differentfrom those of a typical chemical reactor. In addition to feedflow rates, composition, and temperature, the external loadresistance is a new parameter. The fuel cell can be thought ofas a set of reactors connected through a set of flow regulators,as shown in Figure 5. Hydrogen molecules are oxidized toprotons and electrons at the anode. The resistances in themembrane and external load regulate the current in the fuel cell(that is, the flow of protons and electrons). The protons andelectrons meet up at the cathode along with the oxygen toproduce water. The external load resistance is analogous to avalve that regulates the flow of product out of the anode reactorto the cathode reactor.
The coupling of reactor elements shown in Figure 5 is thebasis for our analysis of the fuel cell as a chemical reactor.The system parameters are the feed flow rates, composition,the heat input, and the external load resistance. We presentdata with the external load resistance as the independentparameter. This is different from the traditional electro-chemistry approach, in which PEM fuel cells are operatedunder galvanostatic or potentiostatic control (constant cur-rent or constant voltage). When the chemical reaction isdriven by the imposition of an external electrical drivingforce, such as with electrolysis of water, the current orvoltage is a system parameter that can be independentlymanipulated. However, in a fuel cell the chemical reactiondrives the current through the external load, and the loadresistance is the system parameter that can be manipulated.Constant current or voltage requires a feedback controllerthat adjusts the external resistance to maintain the current orvoltage. We seek to understand the autonomous operation ofthe PEM fuel cell; operation of the fuel cell under galvano-static or potentiostatic control distorts the autonomous dy-namics and obscures the direct determination of kinetics.
In the STR PEM fuel cell we set the feed conditions, thetemperature, and the external load resistance. We measure theeffluent flow rate and composition, the voltage across theexternal load, and the current through the external load. Thekey system variable that we cannot measure directly in oursetup is the membrane water activity. The membrane wateractivity determines the proton conductivity of the membrane,which along with the external load resistance controls the
Table 1. System Variables and System Parametersfor a PEM Fuel Cell
System Variables System Parameters
Reactant flow rates Reactant feed flow ratesReactant composition Reactant feed compositionGas relative humidity Heat inputCell temperature External load resistanceCell voltage Electrode composition and structureCell current Membrane materialMembrane water
content/resistance Cell construction
1892 AIChE JournalAugust 2004 Vol. 50, No. 8
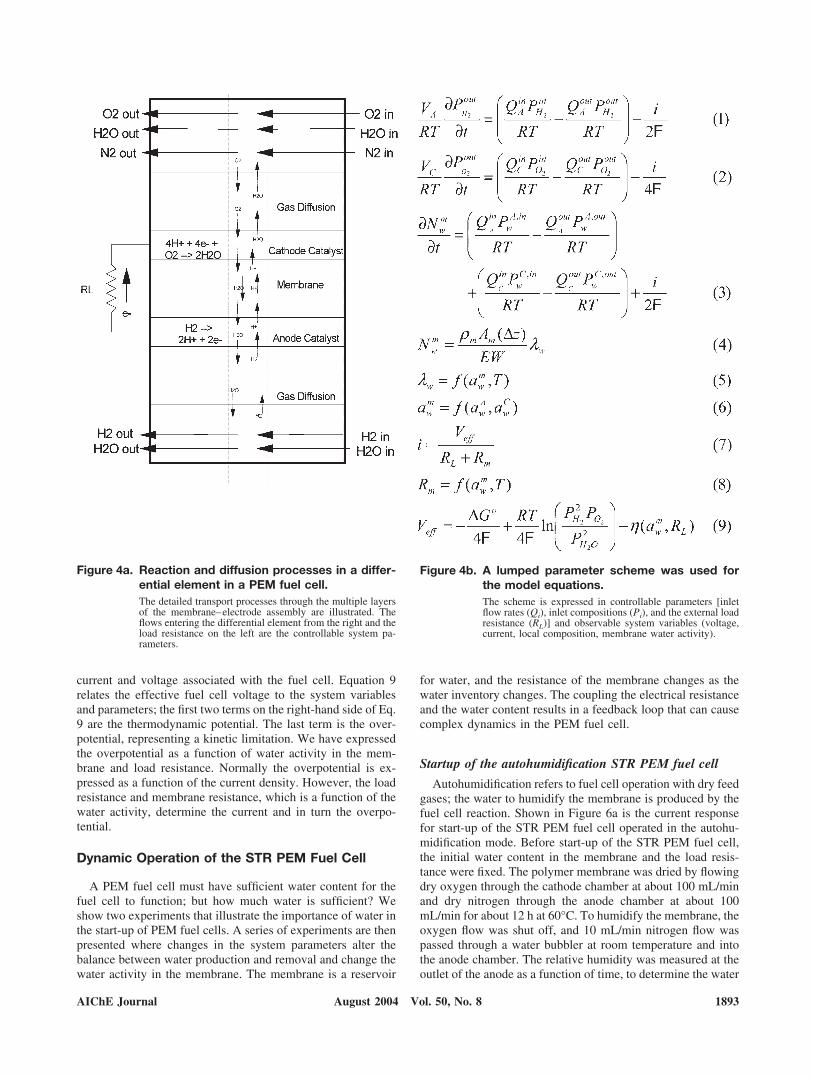
current and voltage associated with the fuel cell. Equation 9relates the effective fuel cell voltage to the system variablesand parameters; the first two terms on the right-hand side of Eq.9 are the thermodynamic potential. The last term is the over-potential, representing a kinetic limitation. We have expressedthe overpotential as a function of water activity in the mem-brane and load resistance. Normally the overpotential is ex-pressed as a function of the current density. However, the loadresistance and membrane resistance, which is a function of thewater activity, determine the current and in turn the overpo-tential.
Dynamic Operation of the STR PEM Fuel Cell
A PEM fuel cell must have sufficient water content for thefuel cell to function; but how much water is sufficient? Weshow two experiments that illustrate the importance of water inthe start-up of PEM fuel cells. A series of experiments are thenpresented where changes in the system parameters alter thebalance between water production and removal and change thewater activity in the membrane. The membrane is a reservoir
for water, and the resistance of the membrane changes as thewater inventory changes. The coupling the electrical resistanceand the water content results in a feedback loop that can causecomplex dynamics in the PEM fuel cell.
Startup of the autohumidification STR PEM fuel cell
Autohumidification refers to fuel cell operation with dry feedgases; the water to humidify the membrane is produced by thefuel cell reaction. Shown in Figure 6a is the current responsefor start-up of the STR PEM fuel cell operated in the autohu-midification mode. Before start-up of the STR PEM fuel cell,the initial water content in the membrane and the load resis-tance were fixed. The polymer membrane was dried by flowingdry oxygen through the cathode chamber at about 100 mL/minand dry nitrogen through the anode chamber at about 100mL/min for about 12 h at 60°C. To humidify the membrane, theoxygen flow was shut off, and 10 mL/min nitrogen flow waspassed through a water bubbler at room temperature and intothe anode chamber. The relative humidity was measured at theoutlet of the anode as a function of time, to determine the water
Figure 4a. Reaction and diffusion processes in a differ-ential element in a PEM fuel cell.The detailed transport processes through the multiple layersof the membrane–electrode assembly are illustrated. Theflows entering the differential element from the right and theload resistance on the left are the controllable system pa-rameters.
Figure 4b. A lumped parameter scheme was used forthe model equations.The scheme is expressed in controllable parameters [inletflow rates (Qi), inlet compositions (Pi), and the external loadresistance (RL)] and observable system variables (voltage,current, local composition, membrane water activity).
AIChE Journal 1893August 2004 Vol. 50, No. 8
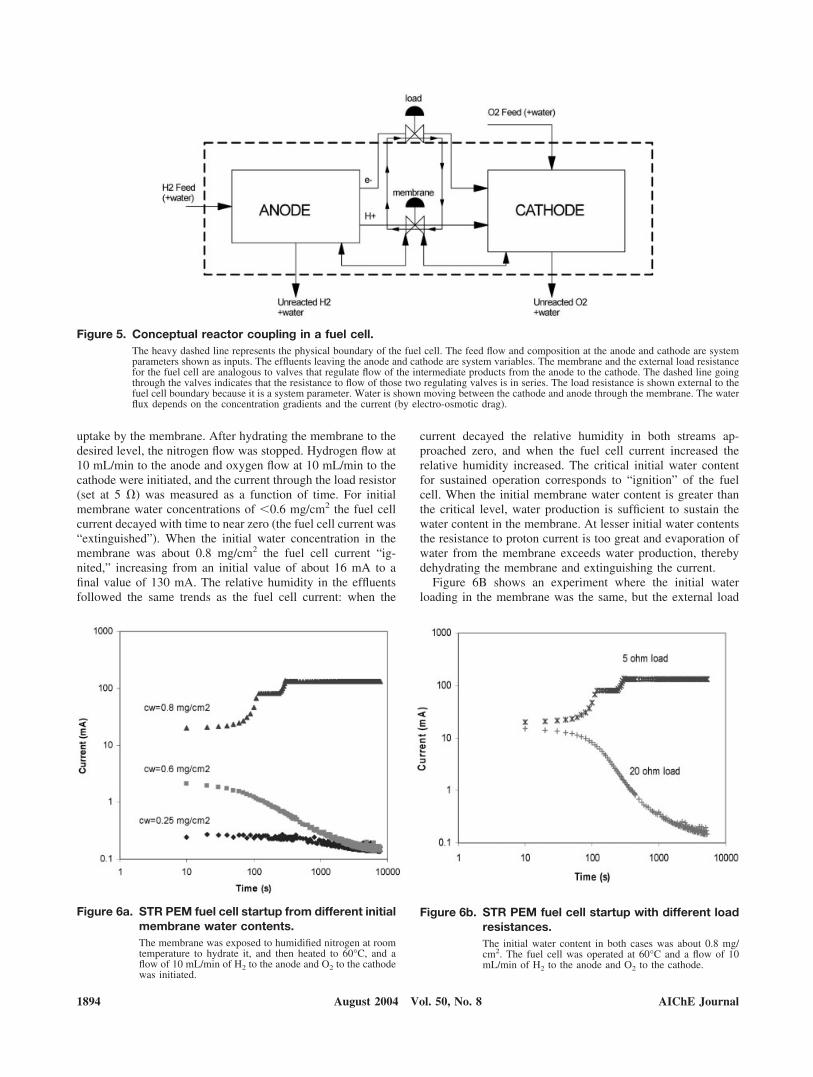
uptake by the membrane. After hydrating the membrane to thedesired level, the nitrogen flow was stopped. Hydrogen flow at10 mL/min to the anode and oxygen flow at 10 mL/min to thecathode were initiated, and the current through the load resistor(set at 5 �) was measured as a function of time. For initialmembrane water concentrations of �0.6 mg/cm2 the fuel cellcurrent decayed with time to near zero (the fuel cell current was“extinguished”). When the initial water concentration in themembrane was about 0.8 mg/cm2 the fuel cell current “ig-nited,” increasing from an initial value of about 16 mA to afinal value of 130 mA. The relative humidity in the effluentsfollowed the same trends as the fuel cell current: when the
current decayed the relative humidity in both streams ap-proached zero, and when the fuel cell current increased therelative humidity increased. The critical initial water contentfor sustained operation corresponds to “ignition” of the fuelcell. When the initial membrane water content is greater thanthe critical level, water production is sufficient to sustain thewater content in the membrane. At lesser initial water contentsthe resistance to proton current is too great and evaporation ofwater from the membrane exceeds water production, therebydehydrating the membrane and extinguishing the current.
Figure 6B shows an experiment where the initial waterloading in the membrane was the same, but the external load
Figure 5. Conceptual reactor coupling in a fuel cell.The heavy dashed line represents the physical boundary of the fuel cell. The feed flow and composition at the anode and cathode are systemparameters shown as inputs. The effluents leaving the anode and cathode are system variables. The membrane and the external load resistancefor the fuel cell are analogous to valves that regulate flow of the intermediate products from the anode to the cathode. The dashed line goingthrough the valves indicates that the resistance to flow of those two regulating valves is in series. The load resistance is shown external to thefuel cell boundary because it is a system parameter. Water is shown moving between the cathode and anode through the membrane. The waterflux depends on the concentration gradients and the current (by electro-osmotic drag).
Figure 6a. STR PEM fuel cell startup from different initialmembrane water contents.The membrane was exposed to humidified nitrogen at roomtemperature to hydrate it, and then heated to 60°C, and aflow of 10 mL/min of H2 to the anode and O2 to the cathodewas initiated.
Figure 6b. STR PEM fuel cell startup with different loadresistances.The initial water content in both cases was about 0.8 mg/cm2. The fuel cell was operated at 60°C and a flow of 10mL/min of H2 to the anode and O2 to the cathode.
1894 AIChE JournalAugust 2004 Vol. 50, No. 8

resistance was changed. The flow rates were still set to 10mL/min for both H2 and O2 and the fuel cell temperature was60°C. With an external load resistance of 5 � the fuel cellcurrent ignited, increasing from about 20 mA to a final value of150 mA. In contrast when the external load resistance was 20� the current was extinguished, starting at about 7 mA anddecaying. This result illustrates how the membrane and exter-nal load resistances act in series, and either one could limit theultimate steady-state current.
Critical humidification of reactant feed
Humidifying the reactant feed may also result in ignition ofthe fuel cell. Figure 7A shows an experiment where the STRPEM fuel cell was initialized as described above with a “dry”membrane (the membrane was dried by flowing dry gasespassing through the fuel cell at 60°C for 12 h). At time zero dryO2 was introduced to the fuel cell at 10 cm3/min, and 10cm3/min H2 feed was first passed through a bubbler. Thebubbler temperature was controlled with an external heatingtape connected to a Variac. Humidification of the anode feed“ignited” the fuel cell, as shown in Figure 7A. After ignition,the water produced further increases the water activity of thefuel cell effluents. The critical feed humidification for ignitionis demonstrated in Figure 7B. Increasing the humidifier tem-perature from 25 to 30°C resulted in ignition of the fuel cellcurrent. Further increase in the humidifier temperature to 35°Cresulted in more rapid humidification of the membrane andearlier ignition of the fuel cell, although the final steady-statecurrent was the same. The final steady-state current dependsprimarily on the water activity in the membrane, and onlyindirectly on the water content of the feed (as a threshold forignition).
Ignition in the STR PEM fuel cell results from a positivefeedback between water production and the reaction rate. Asseen in Eq. 3 water production will alter the inventory of waterin the membrane. The membrane resistance depends on themembrane water activity, as indicated by Eqs. 7 and 8. In-
creased membrane water activity decreases the membrane re-sistance, which according to Eq. 7 will increase the fuel cellcurrent. The increased current produces more water that willfurther increase the water activity in the membrane. The cur-rent increase is self-limiting. At high membrane water activityliquid water condenses in the catalyst layer. The transport ofoxygen to the catalyst/membrane interface through the waterfilm is reduced relative to oxygen transport through a gas layer.By inhibiting the supply of oxygen to the cathode, watercondensation limits the reaction rate (current). This corre-sponds to a shift in the rate-limiting step of the fuel cellreaction. When the water activity is low, proton transportacross the membrane is rate limiting; when the water activity isunity, reactant transport from the gas to the cathode catalystsurface becomes rate limiting.
The ignition phenomenon reported here shows a direct anal-ogy to thermal ignition for exothermic reactions in stirred tankreactors. With the autothermal reactor there is a critical initialtemperature for ignition. The reactor can also be ignited bypreheating the reactor feed (Folger, 1999; Froment andBischoff, 1979; Liljenroth, 1918; van Heerden, 1953).
Fuel cell response to changes in load
When used for automotive applications, fuel cells need torespond to changes in the load. Changing the load alters thewater production, changing the balance between water pro-duced and water removed, resulting in a change in the mem-brane water content. The effect of the load resistance on thewater activity can be seen in the polarization curves for theSTR PEM fuel cell shown in Figure 8A. The STR PEM fuelcell was operated in the autohumidification mode. The STRPEM fuel cell was equilibrated at 80°C for 12 h with a fixedload resistance (either 0.2 or 20 �). After equilibration thepolarization curve was obtained by sweeping the load resis-tance between 0.2 and 20 � in 100 s. The relative humidity inthe anode and cathode streams changed by �2% while obtain-ing these polarization curves; for all practical purposes these
Figure 7. Startup of the STR PEM fuel cell operated at 60°C with feeds of 10 mL/min O2 and 10 mL/min H2.(a) The membrane was initially dry. The hydrogen feed was humidified in a bubbler held at 30°C. The external load resistance was 7 �. (b)The membrane was initially dry. The hydrogen feed was humidified in a bubbler held at the temperatures shown in the figure. The externalresistance was 7 �.
AIChE Journal 1895August 2004 Vol. 50, No. 8

polarization curves are taken at “constant” membrane wateractivity.
Figure 8a illustrates that the “instantaneous” polarizationcurve does not represent a unique characterization of the PEMfuel cell. Operation with different load resistances for extendedperiods of time resulted in different membrane water activities.The membrane water activity is critical in defining the “instan-taneous” polarization curve. The striking feature about Figure8A is that the two polarization curves cross. Extended opera-tion with a low load resistance produced an MEA with “high”water content, whereas extended operation with a high loadresistance produces an MEA with “low” water content. TheMEA with the high water content shows a higher voltage at lowcurrents, indicating a lower activation polarization. At highcurrents the “high” water content of the MEA shows a lowervoltage, suggesting the water is limiting mass transport ofoxygen to the cathode. The “low” water content MEA hasgreater activation polarization, but a lower mass transport re-sistance.
The dynamic response of the STR PEM fuel cell to a changein resistive load shows an unusual multistep process. Figure 8bshows an immediate step response of the current to the changein load, followed by decay to plateau value. There was asubsequent jump in the fuel cell current after 1500 s. The timeconstant for the increase to the initial plateau was about 10 s.There was a delay of about 100 s in the change of the wateractivity at the anode relative to the change in current and thechange in water activity at the cathode. The jump in currentafter 1500 s occurred with no changes to any external param-eter and was completely unexpected. The cathode relativehumidity response tracks the current response; the anode rela-tive humidity response tracked the current but was delayed byabout 100 s.
The response times of a PEM fuel cell may be consideredsurprising. It does not fit with the common assumption thatPEM fuel cells have response times of milliseconds, whichmake them appropriate for use in automobiles. The data showat least four different time constants associated with the dy-namic response of the fuel cell to changes in load. The initialresponse that occurs almost instantaneously must correspond tothe change in current at constant membrane water content. Theother time constants must correspond to transport processes,and changes in the membrane properties that result fromchanges in membrane water content.
What physical processes can account for the PEM fuel cellresponses?
We can compare various time constants associated with thePEM fuel cell. Four of the key time constants are listed inTable 2. They include: the characteristic reaction time of thePEM fuel cell (�1), the time for gas phase transport across thediffusion layer to the membrane electrode interface (�2), thecharacteristic time for water to diffuse across the membranefrom the cathode to the anode (�3), and the characteristic timefor water produced to be absorbed by the membrane (�4).Approximate values for the physical parameters were used toobtain order-of-magnitude estimates of these time constants.The estimated time constants shown in Table 2 indicate that theresponse times of about 100 s are associated with water uptakeand transport through the membrane.
The 100-s time for water transport through the membrane isevident in the delay of the response of the water activity in theanode effluent compared to the increase in current. Waterabsorption by the membrane has a time constant of about10–100 s. Operating at a current density of 1 A/cm2 it wouldtake about 100 s to saturate a dry membrane with water(assuming no water evaporates into the gas effluents from the
Figure 8a. “Instantaneous” polarization curves for STRPEM fuel cell equilibrated with a fixed loadresistance at 80°C for 12 h.The IV curves were recorded by sweeping the load resis-tance from 0 to 20 � in a period of 100 s.
Figure 8b. Dynamic response of the STR PEM fuel cellfor switching the load resistance from 20 to 7� at 80°C.The flow rates were 5 mL/min H2 and 10 mL/min O2. Theresistance was switched at 175 s.
1896 AIChE JournalAugust 2004 Vol. 50, No. 8
fuel cell). Likewise when the load resistance is increased, thefinite evaporation rate results in a slow decay to steady state.The membrane acts as a reservoir for water as the external loadresistance, reactant flow rates, and temperature changes alterthe balance between water production and water removal. Thedynamic model presented in Figure 4 includes an essentialelement missing from most PEM fuel cell models in the liter-ature. Equation 3 is the mass balance of water in the membrane,and Eqs. 6–8 relate the change in the reaction rate (fuel cellcurrent) to the changes in the water content in the membrane.The dynamics of PEM fuel cell operation are critically depen-dent on the water balance in the membrane, which is evident inall our experimental results presented here.
The 1500-s time constant for the second jump in the currentshown in Figure 8B is still not well understood. We recentlymeasured the stress relaxation of Nafion. A Nafion 117 samplewas strained to 50%, beyond its yield point for plastic defor-mation, and the stress was measured as a function of time. Atroom temperature the stress took about 4000 s to relax to aconstant value. We believe the jump in the current after 1500 sis attributable to the relaxation of the stress in the membrane.Increased membrane water content results in the membraneswelling, which puts the membrane under stress. Relaxation of
the membrane stress appears to reduce the electrical resistanceof the membrane.
Response to temperature changes
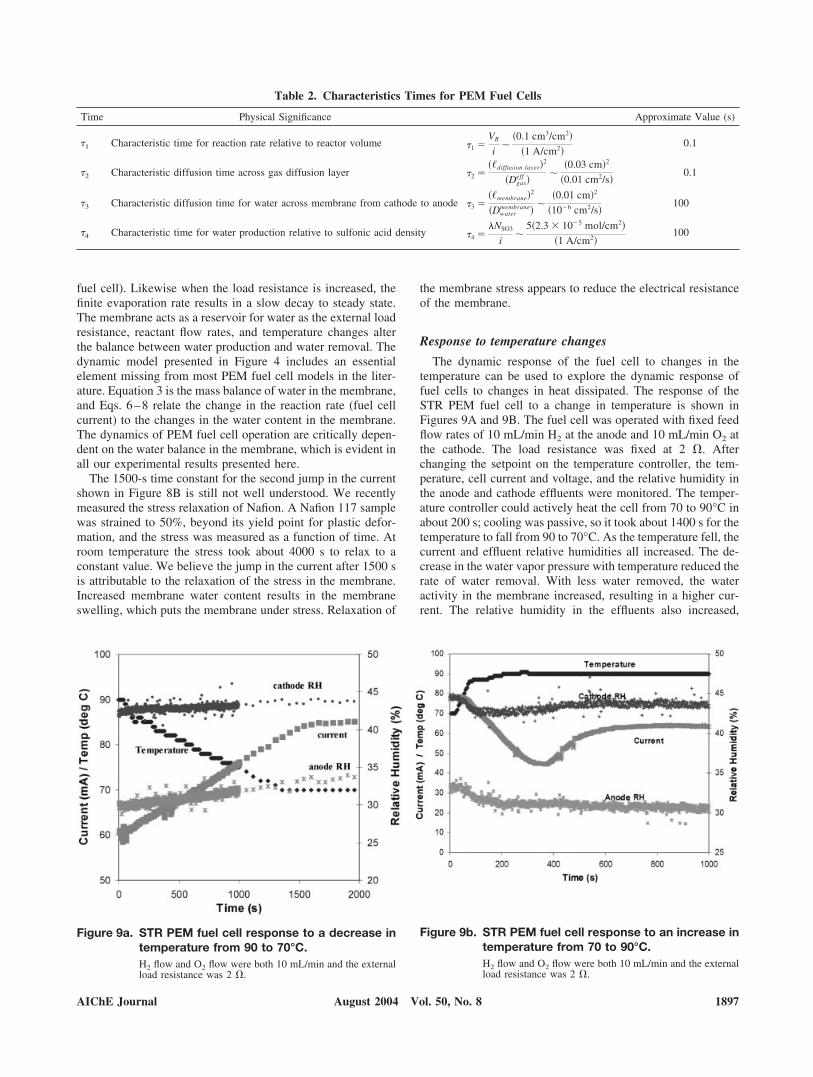
The dynamic response of the fuel cell to changes in thetemperature can be used to explore the dynamic response offuel cells to changes in heat dissipated. The response of theSTR PEM fuel cell to a change in temperature is shown inFigures 9A and 9B. The fuel cell was operated with fixed feedflow rates of 10 mL/min H2 at the anode and 10 mL/min O2 atthe cathode. The load resistance was fixed at 2 �. Afterchanging the setpoint on the temperature controller, the tem-perature, cell current and voltage, and the relative humidity inthe anode and cathode effluents were monitored. The temper-ature controller could actively heat the cell from 70 to 90°C inabout 200 s; cooling was passive, so it took about 1400 s for thetemperature to fall from 90 to 70°C. As the temperature fell, thecurrent and effluent relative humidities all increased. The de-crease in the water vapor pressure with temperature reduced therate of water removal. With less water removed, the wateractivity in the membrane increased, resulting in a higher cur-rent. The relative humidity in the effluents also increased,
Table 2. Characteristics Times for PEM Fuel Cells
Time Physical Significance Approximate Value (s)
�1 Characteristic time for reaction rate relative to reactor volume �1 �VR
i�
�0.1 cm3/cm2�
�1 A/cm2�0.1
�2 Characteristic diffusion time across gas diffusion layer �2 ���diffusion layer�
2
�Dgaseff �
��0.03 cm�2
�0.01 cm2/s�0.1
�3 Characteristic diffusion time for water across membrane from cathode to anode �3 ���membrane�
2
�Dwatermembrane�
��0.01 cm�2
�10�6 cm2/s�100
�4 Characteristic time for water production relative to sulfonic acid density �4 ��NSO3
i�
5�2.3 � 10�5 mol/cm2�
�1 A/cm2�100
Figure 9a. STR PEM fuel cell response to a decrease intemperature from 90 to 70°C.H2 flow and O2 flow were both 10 mL/min and the externalload resistance was 2 �.
Figure 9b. STR PEM fuel cell response to an increase intemperature from 70 to 90°C.H2 flow and O2 flow were both 10 mL/min and the externalload resistance was 2 �.
AIChE Journal 1897August 2004 Vol. 50, No. 8
because the vapor pressure of water is lower, so even for thesame partial pressure of water in the effluent streams therelative humidity is greater.
The response of the STR PEM fuel cell to an increase intemperature was surprising. The current and relative humidityin both effluent streams initially decreased. The current andcathode relative humidity went through minima before ap-proaching the steady state. This suggests that evaporation fromthe MEA is faster initially than the diffusion of water across themembrane. It took the current and relative humidity over 700 sto reach steady state, whereas the temperature was at steadystate after only 200 s. The long transition to steady stateresulted from equilibration between water in the membrane andwater at the membrane–electrode interfaces. The differences inthe relative humidity responses at the anode and cathode areindicative of the complex coupling between water transportinto and through the membrane and water production at thecathode.
Raising the temperature increased the water vapor pressure,which increases the water removal rate from the fuel cell. Atconstant water activity the membrane resistance has a weaktemperature dependency (Yang, 2003). Increasing the temper-ature from 80 to 140°C decreases the resistivity of Nafion by50%. The water vapor pressure increased by about 700% overthe same temperature span. With all else the same, the highertemperature will reduce the water content in the membrane andultimately reduce the current.
Response to changes in reactant flow rates
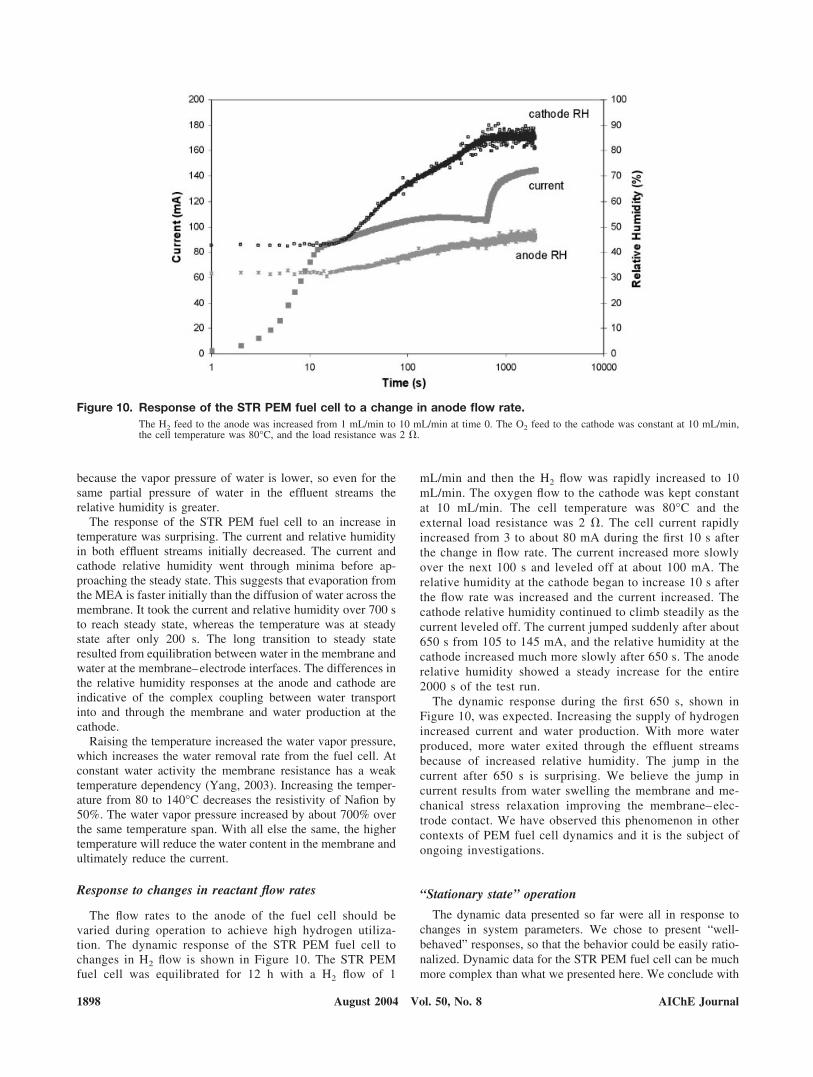
The flow rates to the anode of the fuel cell should bevaried during operation to achieve high hydrogen utiliza-tion. The dynamic response of the STR PEM fuel cell tochanges in H2 flow is shown in Figure 10. The STR PEMfuel cell was equilibrated for 12 h with a H2 flow of 1
mL/min and then the H2 flow was rapidly increased to 10mL/min. The oxygen flow to the cathode was kept constantat 10 mL/min. The cell temperature was 80°C and theexternal load resistance was 2 �. The cell current rapidlyincreased from 3 to about 80 mA during the first 10 s afterthe change in flow rate. The current increased more slowlyover the next 100 s and leveled off at about 100 mA. Therelative humidity at the cathode began to increase 10 s afterthe flow rate was increased and the current increased. Thecathode relative humidity continued to climb steadily as thecurrent leveled off. The current jumped suddenly after about650 s from 105 to 145 mA, and the relative humidity at thecathode increased much more slowly after 650 s. The anoderelative humidity showed a steady increase for the entire2000 s of the test run.
The dynamic response during the first 650 s, shown inFigure 10, was expected. Increasing the supply of hydrogenincreased current and water production. With more waterproduced, more water exited through the effluent streamsbecause of increased relative humidity. The jump in thecurrent after 650 s is surprising. We believe the jump incurrent results from water swelling the membrane and me-chanical stress relaxation improving the membrane– elec-trode contact. We have observed this phenomenon in othercontexts of PEM fuel cell dynamics and it is the subject ofongoing investigations.
“Stationary state” operation
The dynamic data presented so far were all in response tochanges in system parameters. We chose to present “well-behaved” responses, so that the behavior could be easily ratio-nalized. Dynamic data for the STR PEM fuel cell can be muchmore complex than what we presented here. We conclude with
Figure 10. Response of the STR PEM fuel cell to a change in anode flow rate.The H2 feed to the anode was increased from 1 mL/min to 10 mL/min at time 0. The O2 feed to the cathode was constant at 10 mL/min,the cell temperature was 80°C, and the load resistance was 2 �.
1898 AIChE JournalAugust 2004 Vol. 50, No. 8

an example that illustrates some of the complex dynamics ofthe STR PEM fuel cell that are still far from being understood.
Figure 11 shows the stationary-state response of the STRPEM fuel cell over a 24 h period. All the external controllableparameters were fixed. The feed flow rates were constant at 5mL/min of H2 to the anode and 10 mL/min O2 to the cathode.The fuel cell temperature was fixed at 80°C and the loadresistance was fixed at 20 �. The current, voltage, and relativehumidity in the effluent streams all displayed autonomousoscillations with a frequency of 10�4 Hz! The current oscilla-tions were large in amplitude, changing by a factor of 2between 75 and 170 mA. The current oscillations overshot andundershot the plateau values at the high and low states. Theeffluent relative humidity at both the anode and cathode oscil-lated in phase with the current.
We observed these autonomous oscillations under a varietyof conditions of temperature, flow rate, and load resistance. Webelieve the oscillations are caused by coupling between themechanical relaxation of the polymer membrane to changes inthe water content and the membrane electrode interfacial re-sistance. However, we are still a long way from understandingthe physics in sufficient detail to develop predictive dynamicmodels for these results. Complex dynamic behavior has beenanecdotally reported for fuel cell test stations, but seems tohave been ignored because of lack of models that predict anysuch behavior. The STR PEM fuel cell displays the oscillationsdistinctly, and we believe that, by uncoupling the temporaloscillations from spatial variations, we can clarify their originand control them. Data of this quality and relative simplicityshown here are essential to understand the complex dynamicsof PEM fuel cells.
Conclusions
Our purpose herein was to introduce the use of a differentialreactor to study fuel cell dynamics. The data presented hereshow that the PEM fuel cell responses are characterized bytime constants varying from less than a second to thousands ofseconds. The STR PEM fuel cell is a one-dimensional differ-ential reactor that is ideally suited to examine dynamics of thecoupling of reaction and transport processes in a polymer
membrane fuel cell. The STR PEM has even unveiled novelbehavior that suggests mechanical properties of the polymermembranes may play an important role in fuel cell dynamics.
The STR PEM fuel cell is not an optimal design of a fuel cellreactor, in the sense of obtaining the highest power output orhighest fuel efficiency. Its purpose is to provide a well-definedset of reactor conditions to facilitate the correlation of fuel celloperation with process parameters. We have stressed the im-portance of characterizing the system variables and relatingthem to changes in the system parameters. This approach isvital to the development of effective control systems for fuelcells.
The STR PEM fuel cell has exemplified how PEM fuelcells “ignite” and the critical role the water balance plays inthe dynamics of ignition. The water activity in the mem-brane must equilibrate with changes in the control parame-ters, feed flow rates, cell temperature, and load resistance.Changes in the control parameters alter the balance betweenwater production and water removal. PEM fuel cells typi-cally have at least two time constants associated with theirtransient responses. There is a very rapid response, timeconstant � 1 s, corresponding to the changes in externalload at constant membrane water activity. There are longerresponses, with time constants of about 100 s, correspondingto water transport in the membrane and equilibration of themembrane water activity. Finally we showed there are ad-ditional dynamic processes with time constants of about1000 –10,000 s, probably attributable to mechanical relax-ation processes that are not yet fully understood.
AcknowledgmentsThe authors thank the Air Force Office of Scientific Research (AFOSR,
Dynamics and Control Grant F 49620-03-1-0097) and the National ScienceFoundation (NSF Grant CTS-0354279, NSF ITR Grant CTS-025484, andNSF REU Grant DMR-0139107) for support of this research.
Notation
Am � area of membraneaw
i � water activity at anode (A), cathode (C), or membrane (m)EW � equivalent weight of membrane, mass/mole of SO3
Figure 11. Stationary-state response of STR PEM fuel cell over a 24 h period.The feed flow rates were 5 mL/min of H2 and 10 mL/min O2, the cell temperature was 80°C, and the load resistance was 20 �.
AIChE Journal 1899August 2004 Vol. 50, No. 8
F � Faraday’s constantG° � free energy of the fuel cell reaction
i � currentNw
m � water content in membrane, molesPi � partial pressure of species i, barQi � volumetric flow rateR � gas constant
Rm � effective resistance of the membrane electrode assemblyRL � external load resistance
T � fuel cell temperatureVeff � effective output voltage of fuel cell
Vi � gas volume at anode (A) and cathode (C)z � membrane thickness� � overpotential of fuel cell (a function of membrane water activity
and load resistance)�w � absorbed water concentration per sulfonic acid content, # water/#
SO3
Literature CitedBaschuk, J. J., and X. H. Li, “Modeling of Polymer Electrolyte Membrane
Fuel Cells with Variable Degrees of Water Flooding,” J. Power Sources,86, 181 (2000).
Bernardi, D. M., “Water-Balance Calculations for Solid-Polymer-Electro-lyte Fuel Cells,” J. Electrochem. Soc., 137, 3344 (1990).
Bernardi, D. M., and M. W. Verbrugge, “A Mathematical-Model of theSolid-Polymer-Electrolyte Fuel Cell,” J. Electrochem. Soc., 139, 2477(1992).
Blomen, L. J. M. J., and M. N. Mugerwa, eds., Fuel Cell Systems, Plenum,New York (1993).
Bokris, J. O. M., and S. Srinivasan, Fuel Cells: Their Electrochemistry,McGraw-Hill, New York (1969).
Costamagna, P., and S. Srinivasan, “Quantum Jumps in the PEMFCScience and Technology from the 1960s to the Year 2000. Part II.Engineering, Technology Development and Application Aspects,” J.Power Sources, 102, 253 (2001).
Dutta, S., S. Shimpalee, and J. W. Van Zee, “Three-Dimensional Numer-
ical Simulation of Straight Channel PEM Fuel Cells,” J. Appl. Electro-chem., 30, 135 (2000).
EG&G Services, Fuel Cell Handbook, US Department of Energy, Mor-gantown, WV (2000).
Folger, H. S., Elements of Chemical Reaction Engineering, Prentice Hall,Upper Saddle River, NJ (1999).
Froment, G. F., and K. B. Bischoff, Chemical Reactor Analysis andDesign, Wiley, New York (1979).
Levenspiel, O., The Chemical Reactor Omnibook, OSU Book Stores,Corvallis, OR (1996).
Liljenroth, F. G., “Starting and Stability Phenomena of Ammonia-Oxida-tion and Similar Reactions,” Chem. Metall. Eng., 19, 287 (1918)
Natarajan, D., and T. Van Nguyen, “A Two-Dimensional, Two-Phase,Multicomponent, Transient Model for the Cathode of a Proton ExchangeMembrane Fuel Cell Using Conventional Gas Distributors,” J. Electro-chem. Soc., 148, A1324 (2001).
Raistrick, I. D., “Electrode Assembly for Use in a Solid Polymer Electro-lyte Fuel Cell,” U.S. Patent No. 4 876 115 (1989).
Springer, T. E., T. Rockward, T. A. Zawodzinski, and S. Gottesfeld,“Model for Polymer Electrolyte Fuel Cell Operation on ReformateFeed—Effects of CO, H2 Dilution, and High Fuel Utilization,” J. Elec-trochem. Soc., 148, A11 (2001).
Springer, T. E., T. A. Zawodzinski, and S. Gottesfeld, “Polymer ElectrolyteFuel-Cell Model,” J. Electrochem. Soc., 138, 2334 (1991).
Thampan, T., S. Malhotra, H. Tang, and R. Datta, “Modeling of Conduc-tive Transport in Proton-Exchange Membranes for Fuel Cells,” J. Elec-trochem. Soc., 147, 3242 (2000).
Thampan, T., S. Malhotra, J. X. Zhang, and R. Datta, “PEM Fuel Cell asa Membrane Reactor,” Catalysis Today, 67, 15 (2001).
van Heerden, C., “Autothermic Processes: Properties and Reactor Design,”Ind. Eng. Chem., 45, 1242 (1953).
Van Nguyen, T., and M. W. Knobbe, “A Liquid Water ManagementStrategy for PEM Fuel Cell Stacks,” J. Power Sources, 114, 70 (2003).
Yang, C. R., “Performance of Nafion/Zirconium Phosphate CompositeMembranes in PEM Fuel Cells,” Department of Mechanical Engineer-ing, Princeton University, Princeton, NJ (2003).
Manuscript received Oct. 6, 2003, and revision received Nov. 13, 2003.
1900 AIChE JournalAugust 2004 Vol. 50, No. 8