Sewers Sewers Sewers Sewers Sewers Sewers Sewers Sewers Sewers

Michael R. Bloomberg, MayorCarter H. Strickland, Jr., Commissioner
THE STATE OF THE SEWERS 2013


Friends,
Our commitment is to ensure that our harbor water quality continues to improve for decades to come and our customers receive the best service at the lowest possible cost. Last year the New York City Department of Environmental Protection (DEP) released State of the Sewers: 2012, an in-depth look at the City’s sewer system.
This 2013 report showcases the innovative tools and methods that we use to operate and maintain our infrastructure and the ways in which we have continued to improve. For example, we have:
• Expanded remote sewer monitoring through the smart manhole program;
• Developed new residential grease outreach programs; and
• Launched the Service Line Protection Program.
Our dedicated employees work hard every day to ensure that the city’s 7,500 miles of sewers and 148,000 catch basins are functioning at their best. And the numbers speak for themselves. Not only is our harbor water cleaner than it has been in more than a hundred years, we also continue to improve our performance as measured by the key indicators that are important to New Yorkers, such as the numbers of sewer segments that experience recurring backups during dry and wet weather.
To get a better understanding of how we perform our critical mission, I encourage you to read this report alongside State of the Sewers 2012, The State of the Harbor: 2012, and Strategy 2011-2014.
Sincerely,
Carter H. Strickland, Jr.
Commissioner

2
INTRODUCTIONThe New York City Department of Environmental Protection (DEP) protects public health and the envi-ronment by supplying clean drinking water, collect-ing and treating wastewater, and reducing air, noise, and hazardous materials pollution. To achieve this mission, DEP operates and maintains 7,500 miles of sewers that convey an average of 1.3 billion gallons of wastewater per day to 14 in-city wastewater treat-ment plants.
In the last decade, DEP has embraced a data-driven, proactive approach to operate and maintain the sewer system. By using a range of digital tools and in-novative practices, DEP develops targeted programs to provide a high level of service to our customers while focusing on investments that will prioritize the use of limited resources.
Last year, DEP released the first State of the Sewers re-port to describe the innovative tools and strategies we use to operate the sewer system efficiently and effectively. Over the last year, DEP has implemented new programs and continued to improve the way we operate and maintain the sewer system. This year’s report will highlight these new programs and improvements.
The Sewer SystemApproximately 60% of New York City’s sewer system is combined, handling both sanitary waste from homes and businesses as well as stormwater. The other 40% of the sewer system is separated – sani-tary sewers carry sewage to the treatment plant, while storm sewers carry stormwater runoff in a sep-arate pipe directly to a local waterway.
In wet weather, wastewater treatment plants that receive combined flow can treat up to twice the designed dry weather flow. However, to eliminate flooding from roadways, the capacity of the city’s sewer system is greater than that of the plants. When the plants reach their capacity at twice dry weather flow, regulators release the excess flow from the sewers into the harbor as combined sewer overflow to protect against washing out the helpful bacteria in the wastewater treatment plants.
Sewers vary in size, however all sewers are designed to convey wastewater through the system at a speed
fast enough to minimize the deposition of debris and sediment in the pipes but slow enough to mini-mize scouring and erosion. As detailed in this report, DEP targets its programs and resources to ensure the system continues to operate as designed and to maintain the system in a state of good repair.
For a more comprehensive description of the opera-tion of the New York City sewer system, please see State of the Sewers: 2012.
In combined sewers, wastewater from service lines and stormwater from catch basins flow into sewer mains that run under the streets. These narrow branches connect to larger and larger sewers, which eventually converge deep underground into trunk sewers that serve entire neighborhoods. From trunk sewers, wastewater continues to flow by gravity to interceptor sewers and from there to wastewater treatment plants.
3
INNOVATIVE PROGRAMSDEP uses a data-driven, proactive approach to sewer operations and maintenance to serve our customers even better. This year, DEP expanded several suc-cessful programs and launched new initiatives to provide a high level of service to our customers.
Analysis and Cleaning In 2011, DEP created the Capacity, Management, Operations, and Maintenance section to employ the most up-to-date strategies in areas that would bene-fit most from proactive interventions such as closed curcuit televsion inspection, increased cleaning, and regular chemical degreasing. As a result, recurring confirmed sewer backups have decreased 39% from 1,336 to 812, which represent only 0.5% of all sewer segments citywide.
DEP combines sewer data with a geographic distri-bution of sewer backups to investigate areas that have a high frequency and density of confirmed sew-er backups. Analysts then map these data to better visualize and identify segments and neighborhoods with recurring backups. DEP investigates areas that have a high frequency and density of confirmed sewer backups to develop specialized remediation plans. In 2013, this unit determined that 62% of con-firmed sewer backups were caused by a buildup of grease, 18% by a debris blockage, 15% by temporary overtaxing of the system by heavy rainfall, and 3% by other factors, including breaks and other condi-tions warranting further investigation. Between July 2012 and June 2013, DEP cleaned 764 miles of sewer, an increase of 126% from cleaning levels during the same period in 2009.
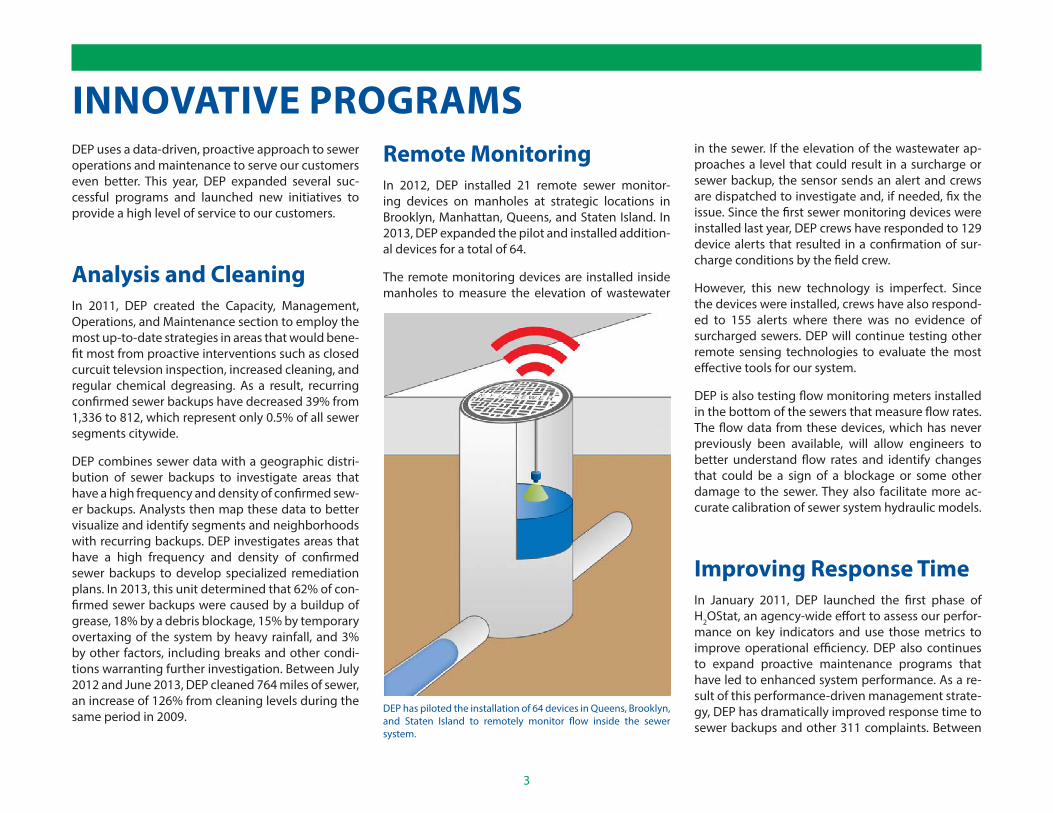
in the sewer. If the elevation of the wastewater ap-proaches a level that could result in a surcharge or sewer backup, the sensor sends an alert and crews are dispatched to investigate and, if needed, fix the issue. Since the first sewer monitoring devices were installed last year, DEP crews have responded to 129 device alerts that resulted in a confirmation of sur-charge conditions by the field crew.
However, this new technology is imperfect. Since the devices were installed, crews have also respond-ed to 155 alerts where there was no evidence of surcharged sewers. DEP will continue testing other remote sensing technologies to evaluate the most effective tools for our system.
DEP is also testing flow monitoring meters installed in the bottom of the sewers that measure flow rates. The flow data from these devices, which has never previously been available, will allow engineers to better understand flow rates and identify changes that could be a sign of a blockage or some other damage to the sewer. They also facilitate more ac-curate calibration of sewer system hydraulic models.
Improving Response TimeIn January 2011, DEP launched the first phase of H2OStat, an agency-wide effort to assess our perfor-mance on key indicators and use those metrics to improve operational efficiency. DEP also continues to expand proactive maintenance programs that have led to enhanced system performance. As a re-sult of this performance-driven management strate-gy, DEP has dramatically improved response time to sewer backups and other 311 complaints. Between
DEP has piloted the installation of 64 devices in Queens, Brooklyn, and Staten Island to remotely monitor flow inside the sewer system.
Remote MonitoringIn 2012, DEP installed 21 remote sewer monitor-ing devices on manholes at strategic locations in Brooklyn, Manhattan, Queens, and Staten Island. In 2013, DEP expanded the pilot and installed addition-al devices for a total of 64.
The remote monitoring devices are installed inside manholes to measure the elevation of wastewater
4
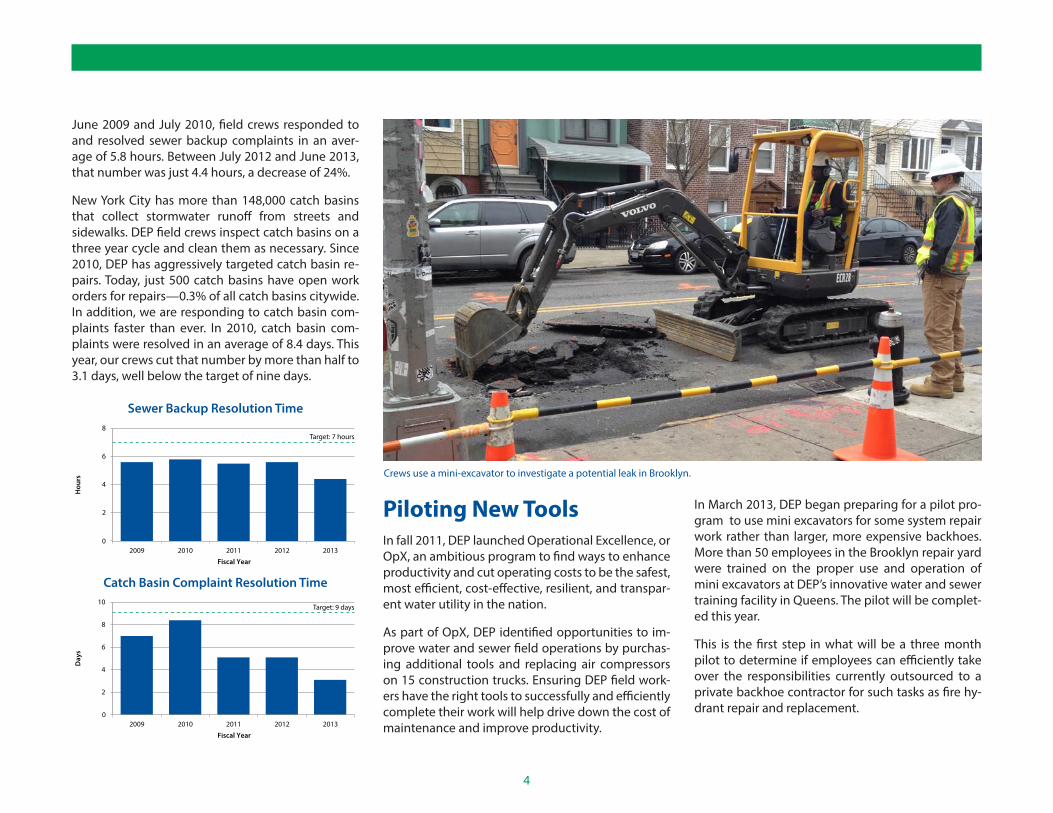
June 2009 and July 2010, field crews responded to and resolved sewer backup complaints in an aver-age of 5.8 hours. Between July 2012 and June 2013, that number was just 4.4 hours, a decrease of 24%.
New York City has more than 148,000 catch basins that collect stormwater runoff from streets and sidewalks. DEP field crews inspect catch basins on a three year cycle and clean them as necessary. Since 2010, DEP has aggressively targeted catch basin re-pairs. Today, just 500 catch basins have open work orders for repairs—0.3% of all catch basins citywide. In addition, we are responding to catch basin com-plaints faster than ever. In 2010, catch basin com-plaints were resolved in an average of 8.4 days. This year, our crews cut that number by more than half to 3.1 days, well below the target of nine days.
In March 2013, DEP began preparing for a pilot pro-gram to use mini excavators for some system repair work rather than larger, more expensive backhoes. More than 50 employees in the Brooklyn repair yard were trained on the proper use and operation of mini excavators at DEP’s innovative water and sewer training facility in Queens. The pilot will be complet-ed this year.
This is the first step in what will be a three month pilot to determine if employees can efficiently take over the responsibilities currently outsourced to a private backhoe contractor for such tasks as fire hy-drant repair and replacement.
Piloting New ToolsIn fall 2011, DEP launched Operational Excellence, or OpX, an ambitious program to find ways to enhance productivity and cut operating costs to be the safest, most efficient, cost-effective, resilient, and transpar-ent water utility in the nation.
As part of OpX, DEP identified opportunities to im-prove water and sewer field operations by purchas-ing additional tools and replacing air compressors on 15 construction trucks. Ensuring DEP field work-ers have the right tools to successfully and efficiently complete their work will help drive down the cost of maintenance and improve productivity.
Crews use a mini-excavator to investigate a potential leak in Brooklyn.
2009 2010 2011 2012 2013
Fiscal Year
0
2
4
6
8Target: 7 hours
Hou
rs
Sewer Backup Resolution Time
2009 2010 2011 2012 2013
Fiscal Year
0
Day
s
2
4
6
8
10Target: 9 days
Catch Basin Complaint Resolution Time

5
line break and between $10,000 and $15,000 to re-pair a sewer line break.
In January 2013, DEP announced a partnership with American Water Resources to offer a Service Line Protection Program to our customers. The Service Line Protection Program saves rate payers millions of dollars in repair charges each year that would have otherwise been paid out of pocket.
The program provides unlimited protection for cov-ered repairs and basic restoration of the affected property. It also provides for an unlimited number
of claims, 24/7 customer service, and quick response time by New York City licensed master plumbers who are pre-qualified to perform needed repairs. For the convenience of those who choose to participate, there are no claim forms to submit and no deduct-ibles, and the protection program fees are itemized and included on each participating customer’s regu-lar DEP water and sewer bill. In September 2013, enrollment in the Service Line Protection Program reached 100,000 customers.
Targeted Public OutreachFat, oil, and grease buildup caused approximately 60% of confirmed sewer backups in New York City last year. To confront this problem, DEP has launched a number of operational and outreach initiatives. Over the past year, DEP has improved coordination among units that handle grease public outreach, grease trap inspection, and sewer maintenance. For example, where field crews observe persistent or systematic grease buildup in a commercial area, they refer the location to DEP’s enforcement unit for targeted grease interceptor inspections.
DEP’s Economic Development Unit holds workshops to help restaurants and businesses comply with grease interceptor regulations. In addition, inspec-tors from the Department of Health and Mental Hygiene check for proper grease trap sizing during regular restaurant inspection.
In January 2013, DEP community outreach repre-sentatives began a year-long collaboration with the New York City Housing Authority at the Baruch Houses in Lower Manhattan. The program is pi-loting intensive educational outreach about the proper disposal of used cooking oil and the impact
Launching the Service Line Protection ProgramMost of the 311 complaints to which DEP responds are “unconfirmed” sewer backups or breaks on water service lines, which are issues that relates to private-ly-owned infrastructure. Property owners in New York City are responsible for maintaining their wa-ter and sewer service lines, which are buried under-ground and run from a building to the City-owned mains and sewers. On average, it costs property owners between $3,000 and $5,000 to repair a water
Homeowner’s Water Line
Homeowner’s Sewer Line
DEP Water And Sewer Mains
Sewer MainWater Main
Water Line
Sewer Line

6
of grease on New York City sewers. Residents of one building in the complex act as the control group and receive DEP’s standard educational materials, while residents of another building will participate in addi-tional meetings, workshops, and events focused on grease. The sewer service lines from both buildings were inspected and cleaned prior to the program, and crews will re-inspect the lines at the pilot’s con-clusion to measure the relative improvement as a result of the intensive curriculum.
DEP will explore additional opportunities to en-hance New Yorkers’ awareness of the damage grease
can do to sewers. This fall, DEP will kick off a com-munity-wide awareness campaign in the Briarwood neighborhood in Queens. Sewers in the neighbor-hood have recurring grease buildup that can lead to sewer backups. Outreach staff and volunteer groups will conduct door-to-door outreach across the neighborhood, handing out information about the neighborhood’s grease problem and metal can covers that can be used to store used cooking grease for later disposal.
DEP will also conduct targeted outreach to food service establishments about grease interceptor
installation and maintenance requirements. DEP’s educational staff will conduct classes in three schools to emphasize the importance of DEP’s mis-sion and problems caused by grease in sewers. The initial campaign will last one year and give DEP the opportunity to measure the impact of community-wide public awareness on levels of grease buildup in sewers. DEP hopes to apply the lessons learned in this pilot to future grease outreach campaigns citywide.
The disposal of sanitary wipes and other non-flush-able materials poses significant problems for the city’s wastewater infrastructure. Wipes can create blockages in sewers, cause remote sensing equip-ment to malfunction, and clog pumps and screens at wastewater treatment plants. Each year, DEP spends more than $18 million to remove wipes from the wastewater stream before they damage critical equipment at the plants. DEP is working with trade groups to develop guidelines for sanitary wipe man-ufacturers and to educate the public about the dan-gers of disposing wipes in city sewers.
Sewer ConstructionThe City invests extensively in capital sewer con-struction and reconstruction. Since 2002, the City has installed more than 300 miles of sewers, and be-tween July 2012 and June 2013 the City built 18.7 miles of sewers.
In August 2012, the City completed a $24 million reconstruction project in Forest Hills, Queens to al-leviate localized roadway flooding and reduce sewer backups in the area. The City installed 1,700 feet of sanitary sewer lines, more than 4,000 feet of storm sewer lines, and 55 catch basins
Residents of the New York City Housing Authority’s Baruch Houses toured DEP’s Manhattan Pumping Station in the East Village. There, they learned about the impacts that grease has on city sewers and wastewater infrastructure.
7
In October 2012, the City broke ground on a $69 million project to mitigate local flooding in the Springfield Gardens neighborhood in Queens. The ongoing project is the fourth phase of a $175 mil-lion comprehensive neighborhood upgrade for Springfield Gardens that will result in the addition of approximately nine miles of new storm sewer lines and eight miles of sanitary sewer lines.
In March 2013, the City extended sewer service to 136 homes in the Annandale area of Staten Island. As part of this $15.6 million project, the City installed 7,392 feet of sanitary sewers, 4,600 feet of storm sewers, and 68 catch basins. The new catch basins will divert stormwater directly to a nearby Bluebelt.
DEP has also constructed innovative solutions to drainage challenges. In neighborhoods with high groundwater tables, DEP is piloting reverse seep-age basins to collect groundwater and discharge it into storm sewers during non-rain events. In tar-geted combined sewer areas such as Gowanus and Laurelton, DEP began installing High Level Storm Sewers to divert some stormwater from combined sewers. High Level Storm Sewers collect street flow from catch basins, reducing stormwater flow into the combined sewer system. This can lead to fewer combined sewer overflows and sewer backups, less localized street flooding, and reduced flows to wastewater treatment plants.
Expanding the Bluebelt ProgramIn the 1990s, the City began constructing a series of stormwater management sites in Staten Island to manage stormwater from nearly one-third of the
borough’s land area. The Bluebelt program preserves and optimizes natural drainage corridors including streams, ponds, and lakes. Stormwater is directed to the wetlands where it is stored and naturally filtered. In addition, the Bluebelts provide important open spaces and diverse wildlife habitats.
Since the 1990s, DEP has completed 60 Bluebelts in neighborhoods throughout the South Shore. In 2010, the City completed a Draft Environmental Impact Study for the Mid-Island Bluebelt, which will include 27 sites and 137 miles of new storm sewers to manage stormwater from 1,700 acres of land. Next year, DEP will break ground on the first of those sites.
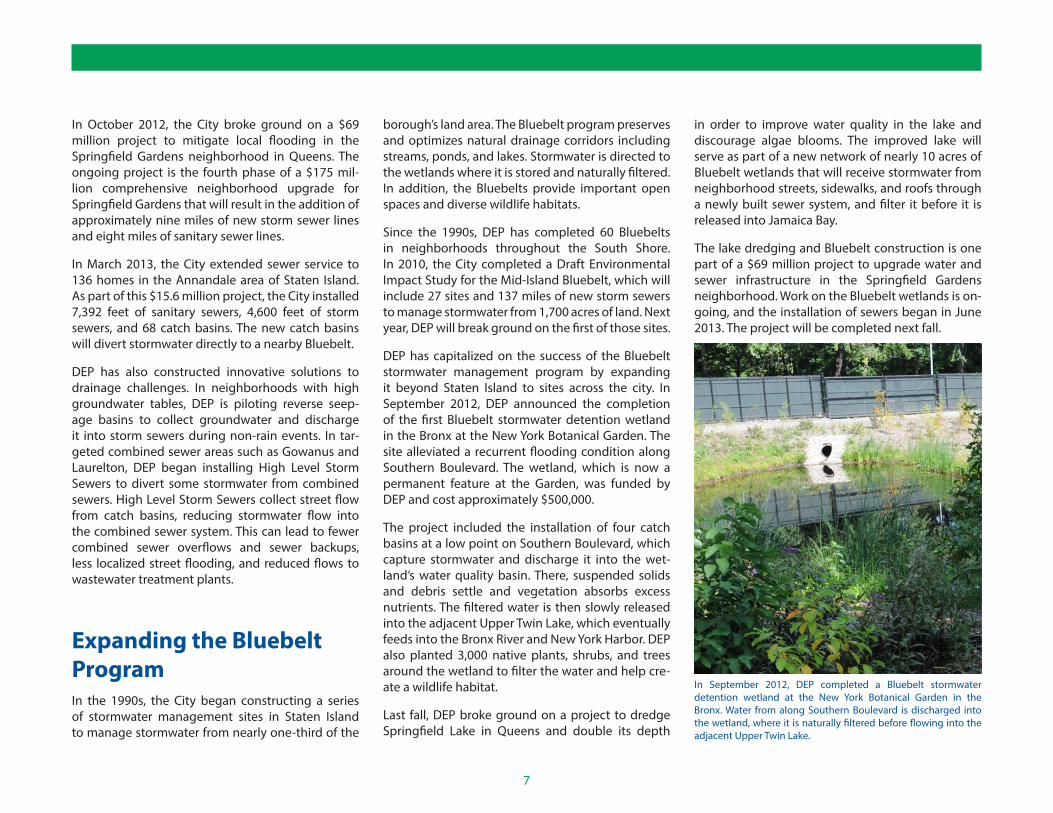
DEP has capitalized on the success of the Bluebelt stormwater management program by expanding it beyond Staten Island to sites across the city. In September 2012, DEP announced the completion of the first Bluebelt stormwater detention wetland in the Bronx at the New York Botanical Garden. The site alleviated a recurrent flooding condition along Southern Boulevard. The wetland, which is now a permanent feature at the Garden, was funded by DEP and cost approximately $500,000.
The project included the installation of four catch basins at a low point on Southern Boulevard, which capture stormwater and discharge it into the wet-land’s water quality basin. There, suspended solids and debris settle and vegetation absorbs excess nutrients. The filtered water is then slowly released into the adjacent Upper Twin Lake, which eventually feeds into the Bronx River and New York Harbor. DEP also planted 3,000 native plants, shrubs, and trees around the wetland to filter the water and help cre-ate a wildlife habitat.
Last fall, DEP broke ground on a project to dredge Springfield Lake in Queens and double its depth
In September 2012, DEP completed a Bluebelt stormwater detention wetland at the New York Botanical Garden in the Bronx. Water from along Southern Boulevard is discharged into the wetland, where it is naturally filtered before flowing into the adjacent Upper Twin Lake.
in order to improve water quality in the lake and discourage algae blooms. The improved lake will serve as part of a new network of nearly 10 acres of Bluebelt wetlands that will receive stormwater from neighborhood streets, sidewalks, and roofs through a newly built sewer system, and filter it before it is released into Jamaica Bay.
The lake dredging and Bluebelt construction is one part of a $69 million project to upgrade water and sewer infrastructure in the Springfield Gardens neighborhood. Work on the Bluebelt wetlands is on-going, and the installation of sewers began in June 2013. The project will be completed next fall.

8
On most days, sewers operate smoothly and with-out incident, collecting wastewater and conveying it to treatment plants. However, extreme events overwhelm the system’s capacity and operations. Extreme rain in August 2007 and 2011 overtaxed the system, while Hurricane Sandy filled parts of the system with seawater and blocked sewers with sand and debris. In addition, when unforeseen infrastruc-ture failures occur, it requires prompt emergency re-sponse and repair.
Hurricane SandyHurricane Sandy made landfall on October 29, 2012, and brought heavy winds and a 14-foot storm surge at Battery Park, four feet higher than the previous re-cord. Coastal areas of the city flooded, and the storm brought down 20,000 trees citywide. The storm af-fected treatment process at nine of the city’s 14 wastewater treatment plants and affected 42 of 96 wastewater pumping stations.
In the days leading up to the storm, DEP took mea-sures to prepare for its potential impacts. These in-cluded sandbagging critical infrastructure, fueling emergency generators, tying down loose equip-ment, and suspending construction activities. We scheduled additional staff, pre-positioned mobile pumping equipment, and made arrangements with contractors to provide as-needed services. Staff and field crews performed training drills on power-down, evacuation, and sheltering procedures in the event of flooding, and prepared additional com-munications capabilities. Crews also inspected and cleared catch basins in flood prone areas to ensure maximum drainage during the storm.
EMERGENCY RESPONSE
Within a few days following the storm, DEP inspect-ed approximately 1,000 catch basins and cleaned sand and other storm debris out of more than one third of those. Over the course of the following month, field crews inspected more than 6,100 catch basins and cleaned 3,600. Crews spent weeks clean-ing sand and debris out of sewers, flushing 37 miles of sewer citywide and inspecting 51 miles of sewer in the Rockaways alone. In total, DEP removed 450 cubic yards of debris from sewers.
Sewers helped drain flood waters after the storm surge receded; however, some low-lying areas were slow to drain due to the volume of floodwater, to-pography, and sand and debris that was carried by the storm. In the three weeks following the storm’s landfall, DEP received 925 sewer backup complaints from residents in evacuation zones A and B, the areas hardest hit by flooding. That number represents 6% of all sewer backup complaints received between July 2012 and June 2013.
Crews in Staten Island used vactor trucks to clear debris from catch basins and sewers.

9
On Staten Island, flooding affected many low-lying neighborhoods along the island’s southern and east-ern shores. The storm badly damaged homes and businesses and flooded wetlands in the New Creek and Oakwood Beach watersheds. The main channel of New Creek, locally known as Jefferson Creek, filled with debris and flooded Hylan Boulevard. Drainage of the system, normally dependent on tidal cycles and the free flow of water, was impeded by mounds of sediment and debris brought in by the storm. DEP crews and contractors conducted a major cleanup
effort of the creek and surrounding wetlands, re-moving nearly 1,000 cubic yards of debris.
Given their familiarity with managing water, natu-ral resources, and construction, DEP employees made valuable contributions to citywide recovery efforts. Crews from in-city and upstate pumped out Manhattan’s Battery Underpass, Bellevue Hospital, and Verizon’s downtown headquarters. Elsewhere, pumping crews assisted dewatering efforts at New York City Housing Authority, Department of Transportation, and Con Edison facilities.
Trained DEP crews helped with the Department of Parks and Recreation’s downed tree removal efforts, working non-stop for more than a month after the storm. DEP also contributed engineering and con-struction resources to NYC Rapid Repairs, a city part-nership with the Federal Emergency Management Agency that restored power and heat to homes in devastated areas.
Following Hurricane Sandy, DEP crews and contractors conducted a major cleanup effort of Jefferson Creek and the surrounding wetlands, removing nearly 1,000 cubic yards of debris.

10
crews inspected similar manholes surrounding the collapse. While crews identified no manholes in dan-ger of imminent failure, DEP elected to proactively
Bay Ridge Sewer CollapseIn June 2012, residents of 92nd Street between 3rd Avenue and Ridge Boulevard in Bay Ridge, Brooklyn, saw a street tree disappear into a hole at the side of the street. After immediate investigation, DEP deter-mined that the sinkhole was caused by the partial collapse of a manhole on a 11-foot sewer line run-ning 70 feet below the surface of the street.
Built in 1902, the sewer line was designed to carry between 15 and 28 million gallons of wastewater on a normal dry weather day.
DEP took quick steps to stabilize the site and pre-vent the sinkhole from growing larger. To continue providing adequate sewer service for area residents while repairs were conducted, DEP laid 3,000 feet of 24-inch high-density polyurethane pipe under the roadway to bypass the collapse.
After completing the bypass, crews excavated 70 feet down to the collapsed sewer to determine the extent of the damage. Crews installed two 10.5-foot diameter sections of fiberglass pipe inside the sewer line on either side of the break to reinforce the century-old brick structure while reconstruction continued.
Next, DEP reconstructed the affected manhole and sewer segment using precast concrete sections. Crews also installed a reinforced flat roof atop the sewer line to support the access manhole. Once the concrete work was set in place, crews backfilled the sinkhole and repaired the roadway.
In the end, DEP was able to quickly design a repair for the failed sewer, spending $12 million and high-lighting the need for flexible management of bud-get priorities in our capital program. After the repair,
In June 2012, DEP field crews responded to a sewer collapse on 92nd Street in Bay Ridge, Brooklyn. Upon investigation, crews determined that the sewer below, which was nearly 70 feet below ground, has collapsed. DEP then began a three month repair project to stabilize and repair the collapsed sewer without undermining the structural integrity of the surrounding buildings, which were constructed years after the sewer had been installed.
reinforce 22 manholes. Thanks to the hard work of DEP employees and contractors, the repair was com-pleted efficiently and effectively.

11
Crews excavated 70 feet below the surface to determine the extent of the damage to the sewer.
Construction workers prepped two 10.5 foot wide sections of fiberglass pipe that would be installed on either side of the break to reinforce the structure during the reconstruction.
Crews then lowered precast concrete manhole sections down into the excavation site to allow for future access into the sewer if needed.
DEP completed the repair by resurfacing the roadway over the sewer collapse.
To maintain local sewer service during construction, DEP installed 24 inch high-density polyurethane pipe to bypass the damaged portion of the sewer.
The manhole reaches 70 feet down from the surface of the street to the sewer.

12
PERFORMANCE METRICSDEP uses a variety of metrics to evaluate our operations across the agency, from frontline supervisors to senior management. This data-driven approach allows us to focus our resources, develop targeted programs, and provide the highest level of service to our customers. In this section, we collect five of the indicators presented in the various sections of this report, brake them down by borough, and described the contributing factors and trends that link them together. These charts and maps offer a snapshot into the agency’s sewer operations, maintenance, and repair, and should be considered within the broader context of the agency’s operations and as counterparts to PlaNYC, Strategy 2011-2014, the annual Mayor’s Management Report, and other publications. All annual performance metrics in this report correspond to fiscal years. For example, Fiscal Year 2013 began on July 1, 2012, and ended on June 30, 2013.
Sewer Backup Complaints When our field crews respond to a customer call about a potential sewer backup, they first open manholes around the area where the backup or blockage is reported. If the sewer segment has higher than expected wastewater levels, the crew will note this as a “con-firmed sewer backup” whether or not any backups occur. If a crew does not detect higher wastewater levels than expected, it is noted as an “unconfirmed sewer backup.”
Recurring Confirmed Backup Complaints
The sewer system is divided into 160,000 segments that run be-tween two adjacent manholes. In order to identify systemic issues, DEP tracks street segments with recurring confirmed sewer back-ups—multiple backups on the same segment in the same year—during both dry and wet weather. DEP tracks both metrics because sewer backups during dry weather are more indicative of problem-atic areas.
Sewer Cleaning Sewer cleaning includes miles of sewers cleaned as part of the in-spection and analysis programs, regular sewer maintenance pro-gram, and the Department of Design and Construction inspection and cleaning.
Sewer Backup Causes After visually inspecting affected sewer segments, crews identify and record the potential cause of a confirmed sewer backup. Grease refers to the buildup of fats, oils, and grease in a sewer. Debris refers to sand, silt, and roadbed aggregate that accumulate along the bot-tom of the sewer. Microbursts and other heavy rainstorms can tem-porarily overtax the sewer. The “other” category includes backups where conditions warranted further investigation.
The City of New YorkMayor Michael R. Bloomberg
UPDATE APril 2011
NEW YOrKSTRATEGY2011-2014
Mayor’s ManageMent report
Mayor’s M
anagement R
eport September 20
13 | City of N
ew York
City of New YorkMichael R. Bloomberg, Mayor
Caswell F. HollowayDeputy Mayor for Operations
Elizabeth Weinstein, DirectorMayor’s Office of Operations
september 2013City of new york

13
Recurring Confirmed Backup Segments
Sewer Backup Complaints Sewer Backup Causes
Recurring Confirmed Dry Weather Backup Segments
Sewer Cleaning
CITYWIDEDEP’s extensive and robust sewer inspection, anal-ysis, and cleaning program continues to net sig-nificant improvements across all key performance indicators citywide. Confirmed sewer backups in 2013 decreased by 14% compared to the previous year, and have dropped 38% from 2009 levels. This is even more impressive when one considers that DEP received 925 sewer backup complaints in Zones A and B in the three weeks following Hurricane Sandy.
Segments with recurring backups have also de-creased over a one- and five- year period, from 1,336 in 2009 to 812 in 2013, a 39% decrease. Similarly, sewer segments with recurring dry weather back-ups decreased by 19% since last year and 45% from 2009. Today, just 0.3% of sewer segments in the City have recurring dry weather backups.
In 2013, DEP cleaned 764 miles of sewer, a 126% in-crease from sewer cleaning levels in 2009, as a re-sult of new targeted programs. Following Hurricane Sandy, DEP crews spent weeks cleaning sand and debris out of sewers, flushing 37 miles of sewer citywide and inspecting 51 miles of sewer in the Rockaways alone.
Citywide, grease accounted for 62% of confirmed sewer backups in 2013, followed by debris (18%), and a temporary overtaxing of the sewer due to rain (15%). In 2013, DEP expanded grease awareness by hosting thirteen grease compliance workshops across the City and distributing door to door flyers to neighborhoods with historic grease issues.
Grease 62%
Debris 18%
Heavy Rain 15%
Other
5%
2009 2010 2011 2012 2013
Fiscal Year
Uncon�rmedCon�rmed
0
5,000
10,000
15,000
20,000
Sew
er B
acku
ps
2009 2010 2011 2012 2013
Fiscal Year
Mile
s
0
200
400
600
800
1,000
2009 2010 2011 2012 2013
Fiscal Year
Segm
ents
0
300
600
900
1,200
1,500
2009 2010 2011 2012 2013
Fiscal Year
Segm
ents
0
300
600
900
1,200
1,500

14
Recurring Confirmed Backup Segments
Recurring Confirmed Dry Weather Backup Segments
Sewer Cleaning
Sewer Backup Complaints Sewer Backup Causes
BRONXThe Bronx continues to perform well across all key performance indicators. Total sewer backup com-plaints have dropped 31% since 2009, and con-firmed sewer backups have declined by 72% over the same period. In the past year, total sewer backup complaints have remained level, but confirmed sew-er backups dropped by 22% compared to 2012.
Sewer segments with recurring backups are down to a five-year low of 25 segments in the Bronx—just 0.1% of all segments in the borough and a 73% de-crease from 2009. Similarly, sewer segments with recurring dry weather backups also continue to de-cline. In 2013, just 11 sewer segments had recurring dry weather backups, which represent 0.05% of all sewer segments in the Bronx and a 54% reduction from 2012 levels.
In 2013, fats, oils, and grease were the root cause of 49% of confirmed sewer backups in the Bronx. Debris and temporary overtaxing of the sewer due to rain were responsible for 24% and 25% of backups, respectively. In January 2013, DEP’s Economic Development Unit held grease compli-ance workshops with food service businesses in Bronx Community Board 10, which includes the communities of City Island, Co-op City, Country Club, Eastchester Bay, Edgewater Park, Ferry Point, Locust Point, Pelham Bay, Schuylerville, Silver Beach, Spencer Estates, Throggs Neck, Westchester Square, and Zerega.
In 2011, DEP developed and launched a targeted, proactive sewer maintenance and cleaning pro-gram. Because of this program, sewer cleaning in the Bronx has more than tripled from just 13 miles in 2009, to 49 miles in 2013.
2009 2010 2011 2012 2013
Fiscal Year
Mile
s
0
25
50
75
100
2009 2010 2011 2012 2013
Fiscal Year
0
Uncon�rmedCon�rmed
500
1,000
1,500
2,000
Sew
er B
acku
ps
Grease 49%
Debris 24%
Heavy Rain 25%
Other 2%
2009 2010 2011 2012 2013
Fiscal Year
Segm
ents
0
25
50
75
100
2009 2010 2011 2012 2013
Fiscal Year
Segm
ents
0
20
40
60
80
100

15
Recurring Confirmed Backup Segments
Sewer Backup Complaints Sewer Backup Causes
Recurring Confirmed Dry Weather Backup Segments
Sewer Cleaning
BROOKLYNBrooklyn continues to improve year-over-year across the key performance indicators. Confirmed sewer backups fell sharply, from 1,528 in 2012 to just 1,169 in 2013, a decrease of 23%. Over the past five years, confirmed sewer backups in Brooklyn have dropped by 53%.
Due to a targeted approach to resolving persistent backups, sewer segments with recurring backups decreased 55% from 2009 levels and dropped 27% compared to last year. Today, only 0.6% of sewer segments in Brooklyn have recurring backups. In dry weather, segments with recurring backups have de-creased 35% over the past year and have fallen 63% from 2009 levels.
DEP continues to proactively clean sewers in Brooklyn, increasing sewer cleaning from 130 miles in 2009 to 205 miles in 2013. Over the past year, DEP has increased sewer cleaning by 13% in Brooklyn, cleaning an additional 24 miles of sewer in the bor-ough than in 2012.
In 2013, 46% of confirmed sewer backups in Brooklyn were caused by a build-up of fats, oils, and grease in the sewers, followed by 26% as a result of debris in the sewer, and 24% as a result of a temporary over-taxing of the sewer due to rain. This past year, DEP partnered with the Metropolitan Council on Jewish Poverty to conduct residential grease workshops at the Abraham Residence in Sea Gate, Brooklyn to ed-ucate residents on proper grease disposal methods.
Grease 46%
Debris 26%
Heavy Rain
24%
Other4%
2009 2010 2011 2012 2013
Fiscal Year
Mile
s
0
50
100
150
200
250
2009 2010 2011 2012 2013
Fiscal Year
Uncon�rmedCon�rmed
0
1,000
2,000
3,000
4,000
5,000
6,000
Sew
er B
acku
ps
2009 2010 2011 2012 2013
Fiscal Year
Segm
ents
0
100
200
300
400
500
2009 2010 2011 2012 2013
Fiscal Year
Segm
ents
0
100
200
300
400
500
16
Recurring Confirmed Backup Segments
Recurring Confirmed Dry Weather Backup Segments
Sewer Cleaning
Sewer Backup Complaints Sewer Backup Causes
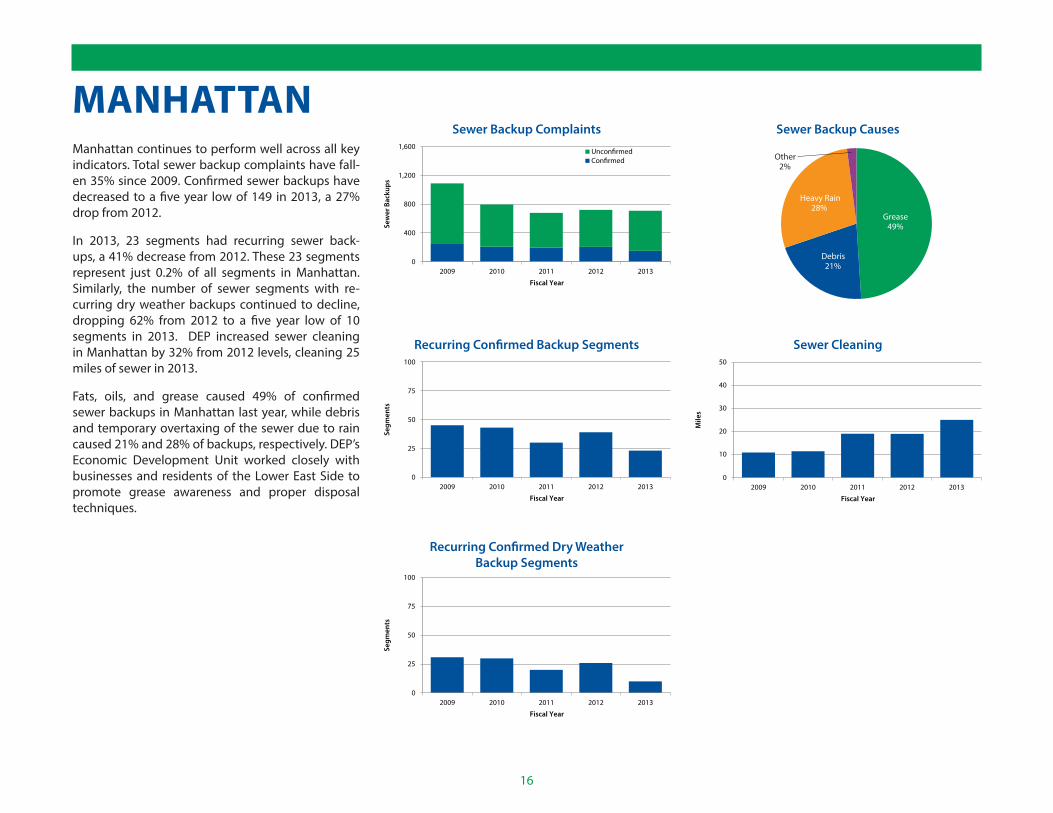
MANHATTANManhattan continues to perform well across all key indicators. Total sewer backup complaints have fall-en 35% since 2009. Confirmed sewer backups have decreased to a five year low of 149 in 2013, a 27% drop from 2012.
In 2013, 23 segments had recurring sewer back-ups, a 41% decrease from 2012. These 23 segments represent just 0.2% of all segments in Manhattan. Similarly, the number of sewer segments with re-curring dry weather backups continued to decline, dropping 62% from 2012 to a five year low of 10 segments in 2013. DEP increased sewer cleaning in Manhattan by 32% from 2012 levels, cleaning 25 miles of sewer in 2013.
Fats, oils, and grease caused 49% of confirmed sewer backups in Manhattan last year, while debris and temporary overtaxing of the sewer due to rain caused 21% and 28% of backups, respectively. DEP’s Economic Development Unit worked closely with businesses and residents of the Lower East Side to promote grease awareness and proper disposal techniques.
2009 2010 2011 2012 2013
Fiscal Year
Mile
s
0
10
20
30
40
50
2009 2010 2011 2012 2013
Fiscal Year
0
Uncon�rmedCon�rmed
400
800
1,200
1,600
Sew
er B
acku
ps
Grease 49%
Debris 21%
Heavy Rain
28%
Other2%
2009 2010 2011 2012 2013
Fiscal Year
Segm
ents
0
25
50
75
100
2009 2010 2011 2012 2013
Fiscal Year
Segm
ents
0
25
50
75
100

17
Recurring Confirmed Backup Segments
Sewer Backup Complaints Sewer Backup Causes
Recurring Confirmed Dry Weather Backup Segments
Sewer Cleaning
QUEENSDespite the unprecedented damage in Queens from Hurricane Sandy, particularly in the Rockaways, we continue to see a long-term improvement across several key indicators. Although confirmed sewer backups in Queens increased slightly from 2,020 in 2012 to 2,197 in 2013 (a 6% increase), over the past five years confirmed sewer backups have decreased by 26%. DEP continues to deploy innovative tech-nology and strategies to efficiently deploy resources to improve services across the borough. For exam-ple, field crews receive alerts from the remote sewer monitors (see page 3) to identify segments where there may be a sewer backup or blockage.
Sewer segments with recurring backups have de-creased 29% over the past five years, from 612 in 2009 to 436 in 2013. Similarly, segments with recur-ring dry weather backups have decreased 34% since 2009, from 425 to 282. Today, less than 0.5% of sewer segments in Queens have recurring dry weather backups.
Last year, DEP dramatically increased sewer cleaning in Queens. In 2012, DEP cleaned 228 miles of sewers in Queens, nearly double what we cleaned in 2009. In 2013 DEP increased sewer cleaning in Queens by an additional 59%, to a total of 363 miles. Sewer cleaning in Queens last year accounted for 48% of sewer cleaning citywide.
Fats, oils, and grease contributed to nearly three-quarters of the confirmed sewer backups in Queens last year, the highest percentage for any borough. To address this, DEP will launch a targeted grease outreach program to educate Queens residents on the proper grease disposal. In addition, DEP con-ducted targeted outreach with restaurant owners in Flushing and Long Island City last year.
2009 2010 2011 2012 2013
Fiscal Year
Mile
s
0
100
200
300
400
2009 2010 2011 2012 2013
Fiscal Year
0
Uncon�rmedCon�rmed
2,000
4,000
6,000
8,000
Sew
er B
acku
ps
Grease
74%
Debris
13%
HeavyRain
8%
Other 5%
2009 2010 2011 2012 2013
Fiscal Year
Segm
ents
0
200
400
600
800
2009 2010 2011 2012 2013
Fiscal Year
Segm
ents
0
200
400
600
800

18
Recurring Confirmed Backup Segments
Recurring Confirmed Dry Weather Backup Segments
Sewer Cleaning
Sewer Backup Complaints Sewer Backup Causes
2009 2010 2011 2012 2013
Fiscal Year
Mile
s
0
50
100
150
200
2009 2010 2011 2012 2013
Fiscal Year
0
Uncon�rmedCon�rmed
500
1,000
1,500
2,000
2,500
3,000
Sew
er B
acku
ps
STATEN ISLANDOver the past year, Staten Island has improved across all key indicators. In 2013, total sewer backup complaints have decreased 24% from 2012 levels, and confirmed sewer backups decreased 37% over the same period. After a spike last year, confirmed sewer backups fell in 2013 to 550, the lowest level in five years.
Similarly, after a spike last year, sewer segments with recurring backups are level over the five year period. In all weather, sewer segments with recurring back-ups decreased 36% year-over-year, with just 0.5% of segments in Staten Island experiencing recurring wet weather backups. Sewer segments with recur-ring backups in dry weather fell 26% from last year. Today, less than 0.3% of sewer segments have recur-ring dry weather backups.
Grease continues to be the main cause of confirmed sewer backups in Staten Island. Last year, 55% of con-firmed backups were caused by a buildup of grease in the sewer, followed by debris buildup at 24%, and a temporary overtaxing of the sewer during heavy rainfall at 18%. DEP conducted extensive outreach with business owners along Victory Boulevard to en-sure proper disposal of grease.
Grease 55% Debris 24%
Heavy Rain
18%
Other3%
2009 2010 2011 2012 2013
Fiscal Year
Segm
ents
0
50
100
150
200
2009 2010 2011 2012 2013
Fiscal Year
Segm
ents
0
50
100
150
200

19
Over the next decade, the City is planning to invest $2.4 billion in critical sewer infrastructure citywide to expand sewer capacity, build out sewers to parts of the City not connected to the system, and repair and replace sewers. This is possible because DEP has worked with federal and state regulators to reduce mandates from $15.6 billion spent in the ten years from 2002 to 2012 to $2.6 billion projected for 2013 to 2023.
On Staten Island’s South Shore, we will continue to expand the sanitary and storm sewer system. The City will invest $197 million in sewer system invest-ments in Southeast Queens between 2013 and 2023, including the continued construction of the area’s storm sewer network. In Gowanus, Brooklyn, we will construct new high-level storm sewers to supple-ment existing combined sewers and reduce the vol-ume of combined sewer overflow.
DEP will also continue to pilot new technologies, programs, and analytical tools to improve the op-eration and maintenance of the system. If cost-ef-fective, DEP will expand pilot projects into ongoing operations. DEP is institutionalizing innovation as a core value of the agency and support a culture of continuous improvement to be the safest, most effi-cient, cost-effective, resilient, and transparent water and wastewater utility in the nation.
The City will certainly face new challenges, includ-ing more intense rainstorms as a result of climate change and increased demands on our system by a growing population. To respond to these and other challenges, DEP will embrace a range of innovative solutions to better serve our customers, maintain our infrastructure, and improve water quality in New York Harbor.
NEXT STEPS
DEP will continue to build Bluebelts throughout the city, such as this one in Oakland Lake Park, Queens.

20
In 2005, the U.S. Environmental Protection Agency published the Guide for Evaluating Capacity, Management, Operation, and Maintenance Programs at Sanitary Sewer Collection Systems to identify crite-ria for the evaluation of sewer system operation.
In 2011, DEP created the Capacity, Management, Operation, and Maintenance (CMOM) section to employ up-to-date strategies in areas that would benefit most from proactive interventions. DEP’s Sewer Operations and Analysis Program combines sewer data with the geographic distribution of sewer backups to better visualize and and identify segments and neighborhoods with recurring prob-lems. Together, these programs have improved the operation and maintenance of the sewer system, as described in the State of the Sewers 2012 and 2013.
DEP’s CMOM program covers most of the CMOM ele-ments set forth in the Guide, and includes the com-ponents listed here. More detail about the programs on this list are described in State of the Sewers 2012 and 2013, The State of the Harbor 2012, and other re-ports released by DEP.
APPENDIXCollection System Description
See State of the Sewers 2012
Continuing Sewer Assessment Plan
See State of the Sewers 2012
Collection System Management
Organizational Structure
Training
Communication and Customer Service
Management Information Systems
SSO Notification Program
Legal Authority
Collection System Operation
Budgeting
Compliance
Water Quality Monitoring
Safety
Emergency Preparedness and Response
Modeling
Engineering
System Mapping and As-built drawings
Design
Capacity
Construction
Pump Stations
Operation
Collection System Operation
Inspection
Emergencies
Emergency Response and Monitoring
Record Keeping
Equipment and Collection System Maintenance
Maintenance Budgeting
Planned Maintenance
Maintenance Scheduling
Maintenance Right-of-Way
Sewer Cleaning
Cleaning Equipment
Chemical Cleaning and Root Removal
Parts Inventory
Equipment and Tools Management
Management Information Systems
Performance Indicators
Sewer System Capacity Evaluation
Internal TV Inspection
Survey and Rehabilitation (general)
Flow Monitoring
Rehabilitation
Manhole Repairs
Mainline Sewers


Michael R. Bloomberg, MayorCarter H. Strickland, Jr., Commissioner