The State of Latino Chicago - Latino studies · The State of Latino Chicago provides an overview of...
59
This Is Home Now e State of Latino Chicago Timothy Ready and Allert Brown-Gort
Transcript of The State of Latino Chicago - Latino studies · The State of Latino Chicago provides an overview of...
This Is Home Now
The State of Latino Chicago
Timothy Ready and Allert Brown-Gort


The State of Latino Chicago
This Is Home NowTimothy Ready and Allert Brown-Gort
© 2005 University of Notre Dame

Page The State of Latino Chicago
C
ii
Table of ContentsPreface��������������������������������������������������������������������������������������������������������������������������������������������������������� iii
Acknowledgements���������������������������������������������������������������������������������������������������������������������������������� iv
Project�Advisory�Committee��������������������������������������������������������������������������������������������������������������������v
About�the�Authors������������������������������������������������������������������������������������������������������������������������������������ vi
Executive�Summary����������������������������������������������������������������������������������������������������������������������������������� 1
Introduction������������������������������������������������������������������������������������������������������������������������������������������������ 4
Demographic�Overview��������������������������������������������������������������������������������������������������������������������������� 6
� Latino�Population�Growth�in�Metro�Chicago�������������������������������������������������������������������������� 7� Latino�Suburbanization���������������������������������������������������������������������������������������������������������������� 8� Segregated�Communities�or�Ethnic�Enclaves?���������������������������������������������������������������������� 15� National�Origins�������������������������������������������������������������������������������������������������������������������������� 16� US-�and�Foreign-Born�Latinos������������������������������������������������������������������������������������������������� 17
Issues�of�Citizenship�and�Immigration������������������������������������������������������������������������������������������������ 20
Family�and�Household���������������������������������������������������������������������������������������������������������������������������� 22
� Binational,�Bicultural,�and�Bilingual���������������������������������������������������������������������������������������� 22� Household�Size���������������������������������������������������������������������������������������������������������������������������� 23� Family�Structure�������������������������������������������������������������������������������������������������������������������������� 23� Income�and�Poverty�������������������������������������������������������������������������������������������������������������������� 24
Education��������������������������������������������������������������������������������������������������������������������������������������������������� 26
� Intergenerational�Learning�������������������������������������������������������������������������������������������������������� 26� The�Needs�of�Foreign-Born�Latinos`��������������������������������������������������������������������������������������� 27� Building�the�Capacity�of�Schools�and�Communities������������������������������������������������������������ 28
Health��������������������������������������������������������������������������������������������������������������������������������������������������������� 30
Latinos�and�the�Economy����������������������������������������������������������������������������������������������������������������������� 32
� Latino�Economic�Power������������������������������������������������������������������������������������������������������������� 32� Income�Trends����������������������������������������������������������������������������������������������������������������������������� 33� Different�Measures�of�Income�������������������������������������������������������������������������������������������������� 35� Housing����������������������������������������������������������������������������������������������������������������������������������������� 37� Labor�and�Workforce������������������������������������������������������������������������������������������������������������������ 38
Discussion�and�Policy�Directions��������������������������������������������������������������������������������������������������������� 44
References������������������������������������������������������������������������������������������������������������������������������������������������� 47

This Is Home NowPage
C
iii
PrefaceMetropolitan� Chicago� is� undergoing� a� profound� transformation� from� a� region� dominated��politically�and�demographically�by�European�Americans�to�one�in�which�no�single�racial�or�ethnic� group� will� be� the� majority�� Long� a� preeminent� center� of� manufacturing� and� trade,�Chicago�is�known�as�the�city�that�works. In�The State of Latino Chicago,�we�examine�the�status�of�the�region’s�fastest�growing�and,�arguably,�hardest�working�population��
In�this�first�edition�of�what�will�be�a�series�of�regular�reports�we�present�an�overview�of�the�contributions�of�Latinos� to� the� region’s�economic�vitality��We�examine�both� the�assets�and�contributions�that�Latinos�bring�to�economic�and�civic�life�and�the�problems�and�challenges�that�must�be�addressed�if�Latino�Chicagoans�are�to�realize�their�full�potential��
As� will� be� argued� in� these� pages,� the� future� prosperity� and� well-being� of� the� entire� region�depend�on�the�well-being�of�each�of�its�communities��Despite�the�recent�arrival�of�many,�the�Latino� presence� in� Chicago� is� well� established�� Latinos� are� here� to� stay;� they� now� are� the�largest�racial�or�ethnic�minority�group�in�the�region��From�this�we�draw�the�report’s�subtitle:��This Is Home Now.
The State of Latino Chicago�provides�an�overview�of�the�growth�and�distribution�of�the�Latino�population�throughout�the�region,�along�with� information�on�income,�employment,�educa-tion,� and� other� topics� essential� for� understanding� the� current� status� and� future� prospects��of�Chicago-area�Latinos��Subsequent� issues� in� this� series�will�provide�more�detailed�analy-ses�of� specific� topics—such�as�education,� access� to�health�care,� cultural� contributions,� and��employment��In�each�case,�our�goal�will�be�to�enhance�understanding�of�this�large�and�grow-ing�community�and�its�role�in�the�economic,�social,�and�cultural�life�of�Chicago,�now�and�in�the�future��
We�hope�that�this�and�future�reports�will�help�to�provide�an�empirical�foundation�for�public�policies� that� will� ensure� Latinos’� full� incorporation� into� the� economic� and� civic� life� of� the�region,�both�for�their�own�benefit�and�the�benefit�of�all�Chicagoans��The�Institute�for�Latino�Studies� is� committed� to� this� effort�� Our� primary� vehicle� for� participating� in� Chicago-area��research�and�discourse�is�our�Metropolitan�Chicago�Initiative,�located�in�Berwyn,�Illinois�
I�wish�to�thank�the�members�of�the�Project�Advisory�Committee�for�generously�contributing�their�wise�counsel�to�shape�the�themes�of�this�publication,�as�well�as�participants�in�the�policy�forum�that�coincides�with�the�release�of�this�report��Finally,�an�effort�like�this�could�not�have�been�produced�without�dedicated�staff,�who�once�again�demonstrated�their�commitment�in�the�research,�writing,�and�production�of�this�publication�
Gilberto�CárdenasAssistant�Provost,�University�of�Notre�Dame,�and�Director,�Institute�for�Latino�Studies

Page The State of Latino Chicago
C
iv
AcknowledgementsThe� Chicago� Community� Trust� generously� funded� the� research� for� this� paper,� with� the�MacNeal�Health�Foundation�providing�additional�support��
The�Institute� for�Latino�Studies�gratefully�acknowledges� the�members�of�our�distinguished�State of Latino Chicago�advisory�committee��Thanks�to�Metropolis�2020�and�to�Atakan�Guven�for�production�of�the�Chicago-area�maps�
We�thank�the�following�Institute�Fellows�and�staff�members�for�their�efforts�in�researching,�writing,� and� producing� this� report:� Victor� Ortiz,� Institute� Fellow;� Sylvia� Puente,� director,�Metropolitan�Chicago�Initiative;�Caroline�Domingo,�publications�manager,�and�Zoë�Samora,�publications� coordinator;� John� Koval,� Institute� Fellow;� Martha� Zurita,� Claudia� Hernández,�and�Heather�Minihan,�Metropolitan�Chicago� Initiative� staff;� and�Wei�Sun�and� Jen�Laware,�Institute�Research�Department�staff��We�also�wish�to�thank�Elizabeth�Station,�editorial�consul-tant,�and�Laurie�Glenn-Gista�of�Think,�Inc��All�photographs�are�by�Javier�Hernández,�a�student�at�the�University�of�Notre�Dame��
Finally,�we�wish�to�thank�the�Illinois�Hispanic�Chamber�of�Commerce�for�making�available��an�estimate�of�the�number�of�Latino�firms�in�the�region�prior�to�the�release�of�official�data�
University of Notre DameInstitute for Latino Studies
The main reason why I decided to come to the
United States was my two daughters. I want them
to have a better future and go to better schools.
–Mother�of�a�Morton�East�High�School�student,�Cicero
“”

This Is Home NowPage
C
v
The main reason why I decided to come to the
United States was my two daughters. I want them
to have a better future and go to better schools.
–Mother�of�a�Morton�East�High�School�student,�Cicero
“”
The State of Latino Chicago Project Advisory CommitteeJim LewisRoosevelt�University
Richard LongworthThe�Global�Chicago�Center�of�CCFR
Hubert MorganNortheastern�IL�Planning�Commission
Victor OrtizNortheastern�Illinois�University
Carmen PrietoWieboldt�Foundation
César RomeroConsulate�General�of�Mexico,�Chicago
Alejandro SilvaEvans�Food�Products,�Inc��
Peter SkoseyMetropolitan�Planning�Council
Wendy StackNortheastern�Illinois�University
Jerry StermerVoices�for�Illinois�Children
Sylvia SykesThe�Chicago�Community�Trust
Garth TaylorMetro�Chicago�Information�Center
Maria de los Angeles TorresDePaul�University
Arturo Venecia IIVenecia�Group
Stacia ZwislerThe�Giving�Trust
John AyersShriver�Center�on�Poverty�Law
Frank BealChicago�Metropolis�2020
Susan CahnIllinois�Facilities�Fund
Gloria CastilloChicago�United
Pamela H. ClarkeLeadership�for�Quality�Education
Jesus GarciaLittle�Village�Community�Development�Corporation
Maricela GarciaNational�Alliance�of�Latin�American�and�Caribbean�Communities
Mirna GarciaInstituto�del�Progreso�Latino
Bob GleesonNorthern�Illinois�University
Lawrence HansenJoyce�Foundation
Joshua HoytIllinois�Coalition�for�Immigrant�Refugee�Rights
Juanita IrizarryLatinos�United
Larry JosephUniversity�of�Chicago
John KovalDePaul�University

Page The State of Latino Chicago
C
vi
About the AuthorsTimothy� Ready� is� director� of� research� at� the� Institute� for�Latino� Studies�� Before� coming� to� Notre� Dame,� he� was��senior�program�officer�in�the�Division�of�Behavioral�and�Social�Sciences�and�Education�at�the�National�Research�Council�of�The�National�Academies��During�the�1990s,�he�directed�the�campaign�of� the�Association�of�American�Medical�Colleges�to�increase�racial�and�ethnic�diversity�in�US�medical�schools�and� created� a� national� network� of� community� partnerships�to� increase� the� number� of� students� both� interested� in,� and�academically�prepared�to�pursue,�careers� in� the�health�pro-fessions�� He� was� a� faculty� member� in� the� Department� of�Anthropology�at�the�Catholic�University�of�America�and�has�researched�and�written�on�Latino�health�and�education�issues�in�South�Texas,�Washington,�DC�and�Chicago��
��
A� citizen� of� both� the� United� States� and� Mexico,� Allert�Brown-Gort� is� the� associate� director� of� the� Institute� for�Latino�Studies�at�the�University�of�Notre�Dame��In�previous�positions�he�has�worked�at�the�University�of�Texas�at�Austin,�the�International�Relations�Department�of�the�Autonomous�Technological� Institute� of� Mexico� (ITAM)� in� Mexico� City,�and� at� Columbia� University�� In� these� capacities� he� has��addressed�Latino,�NAFTA,�and�Latin�American�issues��His�current�research�involves�a�national�qualitative�study�of�the�political� opinions� and� policy� priorities� of� the� Mexican� im-migrant� and� Mexican� American� communities�� In� 2000� he�served� on� a� transition� team� for� Immigration� and� Mexican�Communities� Abroad� for� the� incoming� administration� of�President�Vicente�Fox�
Timothy Ready
Allert Brown-Gort
Latinos recently became the largest ethnic minority or racial group
in metropolitan Chicago, numbering more than 1.6 million.

This Is Home NowPage
C
�
Executive SummaryAt�more�than�1�6�million,�or�20�percent�of�the�population,�Latinos�recently�emerged�as�the�largest�ethnic�or�racial�minority�group�in�metropolitan�Chicago��Latinos�have�deep�roots�in�the� area,� as� Chicago� has� been� home� to� a� sizeable� Latino� community� for� more� than� eighty�years��Metropolitan�Chicago’s�Latino�population�currently�is�the�third�largest�in�the�nation;�for�the�Mexican-origin�population�it�is�the�second�largest��Even�more�remarkably,�29�percent�of�Chicago-area�children�are�of�Latino�origin,�as�are�38�percent�of� the�students�enrolled� in�Chicago�Public�Schools�
Two-thirds� of� Chicago-area� Latinos� are� citizens�� While� recent� migration� has� contributed�greatly�to�the�growth�of�the�area’s�Latino�population�and�about�two-thirds�of�Latino�children�have�at�last�one�foreign-born�parent,�84�percent�of�the�area’s�Latino�children�were�born�in�the�United�States��With�or�without�documentation,�more� than�20,000�new�Latino� immigrants,�primarily�from�Mexico,�take�up�residence�in�metropolitan�Chicago�each�year��
Most�recent�Latino�population�growth�has�occurred�in�the�suburbs�and�is�dispersed�in�clusters�throughout�the�six-county�region��Suburban�Latinos�now�outnumber�those�living�in�the�city��Newly�emerging�and�rapidly�growing�suburban�enclave�communities,� like�those� in�the�city,�have�many�positive�features�but�also�can�lead�to�the�linguistic,�social,�and�economic�isolation�of�their�Latino�residents��Innovative�responses�are�required�from�schools,�local�government,�and�the�private�sector�to�fully�incorporate�new�residents�
Latinos’�economic�clout�in�metropolitan�Chicago�has�grown�in�tandem�with�the�population��Between�1990�and�2003�the�aggregate�household�income�for�Chicago-area�Latinos�increased�from�$5�8�billion�to�$20�billion��Nearly�one-third�of�Latino�households�has�incomes�of�$60,000�or�more;�one�in�five�households�have�incomes�of�$75,000�or�more��More�than�half�of�Latino�households�are�now�owner-occupied��Latinos�were�responsible�for�nearly�half�(46�percent)�of�the�increase�in�owner�occupied�homes�between�2000�and�2003��Between�1990�and�2003�the�region�would�have�suffered�a�net�loss�of�jobs�were�it�not�for�increases�attributable�to�Latinos��In�2002�there�were�40,000�Latino-owned�businesses�generating�over�$7�5�billion�in�revenues��
The�family�is�especially�important�for�the�economic�security�of�Chicago-area�Latinos��Latino�workers,� on� average,� have� much� lower� earnings� than� both� non-Latino� Whites� and� Blacks��However,�Latinos�are�much�less�likely�than�Blacks�to�be�poor�and�much�more�likely�to�own�a�home��Combining�the�earnings�of�two�or�more�working�family�members�who�live�in�a�house-hold�enables�all�to�enjoy�a�higher�standard�of�living�than�would�otherwise�be�possible��
While�Latinos’�progress�in�metropolitan�Chicago�has�been�impressive�in�many�ways,�it�has�also�been�fragmented�and�uneven��Latino�workers’�disproportionate�concentration�in�low-paying�jobs�along�with�discouraging�school�completion�rates�for�their�children�raise�questions�about�future�prospects�for�success��
Although�the�Latino�population�exhibits�many�of�the�classic�characteristics�of�metropolitan�Chicago’s�previous�immigrants,�the�structure�of�today’s�economy�makes�it�far�more�difficult�for�Latinos�to�advance��Today’s�immigrants�continue�to�arrive�hard-working,�young,�and�am-bitious,� but� the� knowledge-based� and� services-oriented� economy� of� the� early� twenty-first��century�generally�demands�a�level�of�technical�training�or�educational�credentials�that�many�do� not� possess�� Most� foreign-born� Latino� residents� of� metropolitan� Chicago� arrive� in� the�United�States�with�very� little� formal�education��Imaginative�policy�responses�are�needed�to�

Page The State of Latino Chicago
C
�
prevent�their�becoming�trapped�in�jobs�that�offer�few�possibilities�for�advancement��Given�this�reality,�access�to�non-formal�instructional�programs�to�learn�English�as�well�as�job�skills�and�GED�preparation�is�essential��
Chicago-area�Latino�families�are�uniquely�binational,�bilingual,�and�bicultural—a�major�asset�in�this�era�of�globalization��Both�English�and�Spanish�are�spoken�in�more�than�three-quarters�of�the�region’s�Latino�homes��However,�many�Latino�children�are�growing�up�in�households�where�no�adult�speaks�English�very�well��This�increases�the�responsibility�on�schools�to�develop�and�implement�effective�programs�of�instruction�for�students�with�limited�English�proficiency�and�to�overcome�linguistic�barriers�to�communication�with�parents��
The�average�level�of�educational�attainment�of�US-born�Latinos�is�much�higher�than�that�of�their�foreign-born�counterparts�but�still�very�low��Future�success�in�the�workplace�and�in�other�arenas�largely�depends�on�dramatically�improving�educational�outcomes��Many�Latino�chil-dren�are�among�those�with�the�greatest�needs,�but�they�tend�to�be�enrolled�in�schools�with�the�fewest�resources�� Illinois’� funding�disparity�between�school�districts� serving�affluent�versus�low-income�students�is�the�largest�in�the�nation��To�further�complicate�matters,�many�Latino�school�children,�most�of�them�citizens,�are�being�raised�by�parents�who�are�undocumented��Regardless�of�the�immigration�status�of�their�parents,�the�proper�education�and�development�of�these�children�will�greatly�influence�the�shared�destiny�of�the�entire�region��
More�resources�should�be�made�available�to�those�students�with�the�greatest�needs��But�to�make�a�difference,�the�resources�must�also�be�wisely�used�so�that�Latino�children,�in�coordina-tion�with� their� teachers,� families,� and�communities,�become�engaged� in� learning,�graduate�from�high�school,�and�go�on�to�college�and�other�postsecondary�educational�programs��
In�this�first�edition�of�what�will�be�a�series�of�regular�reports,�we�present�an�overview�of�the�contributions� of� Latinos� to� the� region’s� economic� vitality�� We� examine� not� only� the� assets��and� contributions� that� Latinos� bring� to� economic� and� civic� life� but� also� the� problems� and��

This Is Home NowPage
C
�
challenges� that� must� be� addressed� if� Latino� Chicagoans� are� to� realize� their� full� potential��Future�editions�in�this�series�will�provide�more�detailed�analyses�of�specific�topics—such�as�education,�access�to�health�care,�cultural�contributions,�and�employment��
Other�key�findings�of�this�report�include:
•� The�Latino�population�of� the�Chicago�area� is,�by� itself,�15th�among�all� the�metropolitan�areas�in�the�country��Latino�Chicago�is�approximately�the�same�size�as�metropolitan�San�Antonio�or�Indianapolis�
•� The�$20�billion�in�Latino�household�income�accounts�for�more�than�9�percent�of�the�region’s�total�and�is�approximately�equal�to�the�gross�domestic�product�of�Panama�or�Luxembourg�
•� During�the�five-year�period�between�1997�and�2002�the�number�of�Latino-owned�businesses�increased�44�percent,�while�the�dollar�value�of�their�sales�receipts�rose�56�percent�
•� High�concentrations�of�Latino�businesses�have�revived�declining�commercial�districts� in�some�neighborhoods�and�created�new�ones�in�others�
•� During�the�13-year�period�between�1990�and�2003�growth�in�the�number�of�Latino�workers�was�nearly�equal�to�the�total�number�of�new�jobs�created�in�the�region�
•� Between�2000�and�2003�the�total�number�of�jobs�in�the�six-county�metro�area�increased�by�an�additional�41,000��During�the�same�three-year�period�the�number�of�jobs�held�by�Latinos�increased�by�more�than�105,000�
•� Also�during�the�13-year�period�between�1990�and�2003�the�number�of�homes�owned�by�Latinos� increased� by� 126,000,� accounting� for� 34� percent� of� the� total� growth� in� owner-�occupied�homes�
•� Between�2000�and�2003�the�number�of�homes�owned�by�Latinos�increased�by�41,000,�while�accounting�for�46�percent�of�total�growth�in�owner-occupied�homes�
•� Only�53�percent�of�Latino� students�who�enter�high� school� in�ninth�grade�graduate� four�years�later�
•� Although�78�percent�of�US-born�Latinos�eventually�graduate�or�obtain�a�GED�by�their�late�20s,�less�than�half�as�many�US-born�Latinos�as�non-Latino�Whites�graduate�from�college�
The� future� of� metropolitan� Chicago� depends� on� the� successful� incorporation� of� Latino��children—and�their�mostly�foreign-born�parents—into�the�economic,�social,�and�political�life�of�the�region��Absent�deliberate�planning,�the�best-case�scenario�is�that�the�current�pattern�of�fragmented�and�uneven�progress�will�continue��However,�with�well-informed�policies�and�with�political�will�sufficient�to�match�the�formidable�challenges�that�lie�ahead,�Chicago�can�and�will�do�better��We�hope�that�this�report�will�serve�to�inform�discussion�about�the�incorporation�of�this�large�and�growing�community�into�the�economic,�social,�and�cultural�life�of�Chicago,�now�and�in�the�future��

Page The State of Latino Chicago
C
�
IntroductionHard�work,�devotion�to�family,�and�a�strong�sense�of�community�have�placed�Latinos�firmly�in�the�tradition�of�immigrant�groups�that�have�made�Chicago1�one�of�the�great�cities�of�the�world��Latinos’�already�considerable�contributions�to�the�economic,�civic�and�cultural�life�of�the�region�will�inevitably�increase�as�their�population�continues�to�grow��A�fundamental�ques-tion,� however,� is� whether� Latino� Chicagoans’� economic� progress� will� keep� pace� with� their�demographic�growth��The�fact�is�that�the�future�prosperity�of�the�entire�region�is�inextricably�linked�to�the�Latino�population’s�prospects�for�full�incorporation�into�the�economic�and�social�fabric�of�the�city��
Latinos2�recently�became�the�largest�ethnic�minority�or�racial�group�in�metropolitan�Chicago,�numbering�more� than�1�6�million��Were� it�not� for�Latino�population�growth,�metropolitan�Chicago�would�be�in�the�midst�of�a�long-term�population�decline��In�2004�one�of�every�five�(20�percent)�Chicago-area�residents�was�Latino�(ACS�2004)�compared�to�only�12�percent�in�1990�(Census�1990)��Indeed,�Chicago�has�already�become�a�major�Latino�metropolis—with�the�third�largest�Latino�population�in�the�United�States�and�the�second�largest�Mexican�com-munity�in�the�nation�(ACS�2003)��Even�more�remarkably,�29�percent�of�Chicago-area�children�are�of�Latino�origin��Among�students�enrolled� in�Chicago�Public�Schools� (District�299),�38�percent�are�Latino�(ISBE�2004c)��And�while�approximately�two-thirds�of�adult�Chicago-area�Latino�residents�are�immigrants,�the�vast�majority�(84�percent)�of�Latino�children�were�born�in�the�United�States��It�is�clear�that,�to�no�small�degree,�the�future�of�Chicago�is�Latino��
Although�the�growing�Latino�community�possesses�salient�assets,�it�also�faces�significant�chal-lenges��Both�facts�will�affect�the�manner�and�degree�to�which�Latinos�are�incorporated�into�the�economic�and�civic�life�of�metropolitan�Chicago��Latinos�are�workers,�consumers,�busi-ness�owners,�and�community�members�who�contribute�greatly�to�the�region�and�who�are�ex-periencing�growing� levels�of� success��Nevertheless,� their�disproportionate�concentration� in�low-paying�jobs,�along�with�discouraging�school�completion�rates,�raise�questions�about�their�future�levels�of�success��Their�progress�as�a�young�and�rapidly�growing�segment�of�the�metro-politan�population�(Zurita�2003)�and�the�many�challenges�that�must�be�addressed�loom�large�for�the�future�of�the�region��
In� twenty-first� century� America� urban� centers� that� continue� to� experience� a� steady� flow�of� immigrants�are�much�more� likely� than�others� to� thrive�economically� (Singer�2004)��The��challenge,�as�always,�is�finding�ways�to�incorporate�the�newcomers,�along�with�all�other�seg-ments�of�society,�in�a�manner�that�lets�them�contribute�as�fully�as�possible�to�the�city’s�eco-nomic,�civic,�and�cultural�life�and,�in�turn,�to�reap�the�benefits�from�it��
�1�Unless�otherwise�indicated,�‘Chicago’�in�this�report�refers�to�the�six-county�Chicago�metropolitan�area,�including�Cook,�DuPage,�Will,�McHenry,�Lake�and�Kane�counties�of�Illinois��
2�A�note�on�terminology�is�appropriate�here��Hispanics�or�Latinos�are�persons�who�identify�with�the�terms�‘Hispanic’�or�‘Latino’�or�with�specific�Hispanic�or�Latino�categories�listed�in�Census�questionnaires—‘Mexican,’�‘Mexican�American,’�‘Chicano,’�‘Puerto�Rican,’�or�‘Cuban’—as�well�as�those�who�indicate�that�they�are�‘other�Spanish,�Hispanic,�or�Latino�’�Origin�can�be�considered�as�the�heritage,�nationality�group,�lineage,�or�country�of�birth�of�the�person�or�the�person’s�parents�or�ancestors�before�their�arrival�in�the�United�States��People�who�identify�their�origin�as�Spanish,�Hispanic,�or�Latino�may�be�of�any�race�

This Is Home NowPage
C
�
In�this�report�we�highlight�information�relevant�to�understanding�the�area’s�Latino�population�in�relation�to�the�present�and�future�of�the�Chicago�region�as�a�whole��We�hope�that�the�infor-mation�presented�will�spur�discussion�and�debate�and,�ultimately,�inform�public�policies�that�will�promote�the�full�incorporation�of�Chicago-area�Latinos�into�the�life�of�the�city—not�only�for�their�own�sake�but�also�for�the�continued�prosperity�of�the�metropolitan�area��
This�report�is�based�on�various�sources��It�draws�on�research�conducted�by�the�University�of�Notre�Dame’s�Institute�for�Latino�Studies,�including�our�Chicago�Area�Survey�of�1500�Latino�households,�400�non-Hispanic�White�households�and�400�African�American�households,�as�well�as�on�other�work�done�by�Institute�faculty�and�Fellows,�including�reports�and�papers�by�John�Koval,�Rob�Paral,�Tim�Ready,�Sung�Chun,�Wei�Sun,�and�Martha�Zurita��The�report�also�draws�upon�information�collected�by�the�US�Census�Bureau,�the�Illinois�Department�of�Public�Health,�the�US�Department�of�Education,�the�Illinois�State�Board�of�Education,�and�others��
Between 1970
and 2004 Latinos
accounted for
96 percent of
the region’s
population
growth.
Page The State of Latino Chicago
C
�
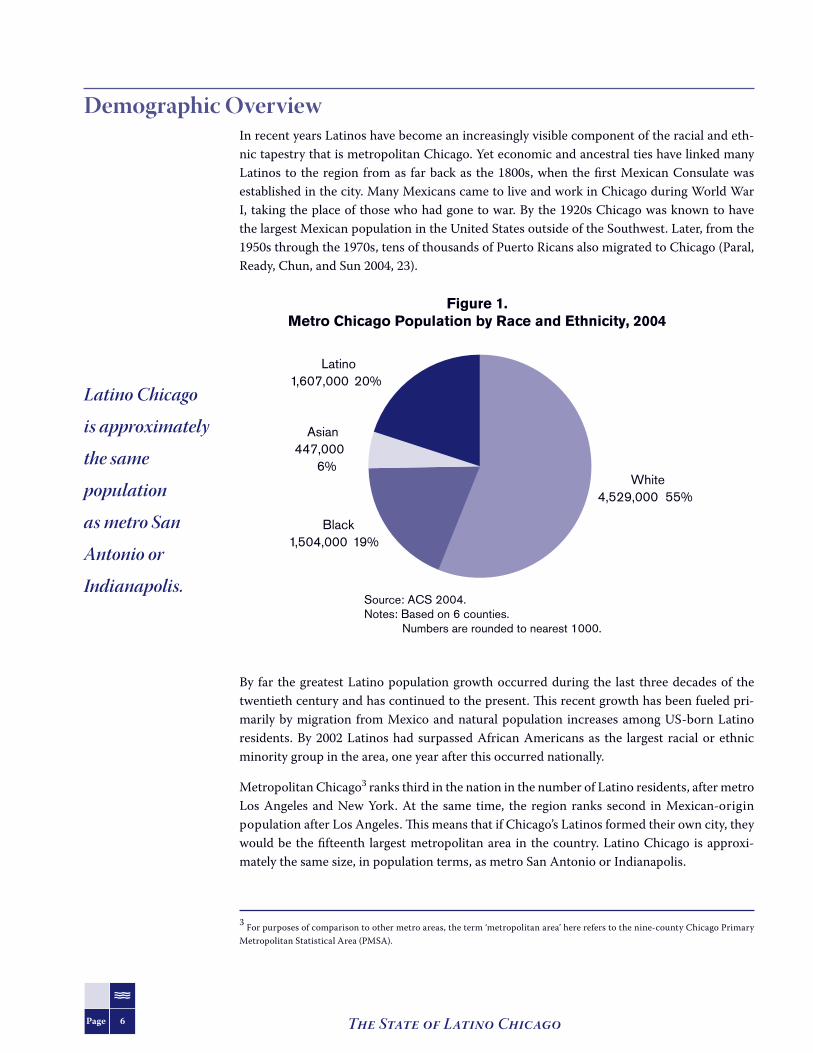
Demographic OverviewIn�recent�years�Latinos�have�become�an�increasingly�visible�component�of�the�racial�and�eth-nic�tapestry�that�is�metropolitan�Chicago��Yet�economic�and�ancestral�ties�have�linked�many�Latinos�to�the�region�from�as� far�back�as�the�1800s,�when�the�first�Mexican�Consulate�was�established�in�the�city��Many�Mexicans�came�to�live�and�work�in�Chicago�during�World�War�I,�taking�the�place�of�those�who�had�gone�to�war��By�the�1920s�Chicago�was�known�to�have�the�largest�Mexican�population�in�the�United�States�outside�of�the�Southwest��Later,�from�the�1950s�through�the�1970s,�tens�of�thousands�of�Puerto�Ricans�also�migrated�to�Chicago�(Paral,�Ready,�Chun,�and�Sun�2004,�23)��
Figure �
By�far� the�greatest�Latino�population�growth�occurred�during�the� last� three�decades�of� the�twentieth�century�and�has�continued�to�the�present��This�recent�growth�has�been�fueled�pri-marily�by�migration�from�Mexico�and�natural�population� increases�among�US-born�Latino�residents��By�2002�Latinos�had�surpassed�African�Americans�as� the� largest� racial�or�ethnic�minority�group�in�the�area,�one�year�after�this�occurred�nationally��
Metropolitan�Chicago3�ranks�third�in�the�nation�in�the�number�of�Latino�residents,�after�metro�Los�Angeles� and�New�York��At� the� same� time,� the� region� ranks� second� in�Mexican-origin�population�after�Los�Angeles��This�means�that�if�Chicago’s�Latinos�formed�their�own�city,�they�would�be�the�fifteenth� largest�metropolitan�area� in�the�country��Latino�Chicago� is�approxi-mately�the�same�size,�in�population�terms,�as�metro�San�Antonio�or�Indianapolis��
Source: ACS 2004. Notes: Based on 6 counties. Numbers are rounded to nearest 1000.
Figure 1.Metro Chicago Population by Race and Ethnicity, 2004
Black1,504,000 19%
Latino1,607,000 20%
Asian 447,000
6%White
4,529,000 55%
3�For�purposes�of�comparison�to�other�metro�areas,�the�term�‘metropolitan�area’�here�refers�to�the�nine-county�Chicago�Primary�Metropolitan�Statistical�Area�(PMSA)�
Latino Chicago
is approximately
the same
population
as metro San
Antonio or
Indianapolis.

This Is Home NowPage
C
�
Illinois�Latinos�are�disproportionately�concentrated�in�the�Chicago�metropolitan�area��Ninety-two�percent�of�the�state’s�1�7�million�Latino�residents�live�in�the�six-county�area,�compared�to�only�two-thirds�of�the�state’s�population�overall�
Latino Population Growth in Metro Chicago Between�1970�and�2004�the�Latino�population�of�metropolitan�Chicago�increased�from�slight-ly�less�than�325,000�to�more�than�1�6�million��During�this�34-year�period�growth�in�the�Latino�population�accounted� for�96�percent�of� the� region’s� total�population� increase��The�greatest�surge�took�place�in�the�decade�of�the�1990s�when�the�Latino�population�increased�by�nearly�570,000,�or�about�57,000�per�year��This�was�nearly�double�the�annual�rate�of�increase�that�oc-curred�during�the�1970s�and�1980s��Between�2000�and�2004�metropolitan�Chicago’s�Latino�population�increased�by�about�50,000�per�year��
During�the�34-year�period�between�1970�and�2004�the�proportion�of�the�total�population�of�the�area�that�is�non-Latino�White�decreased�from�more�than�75�percent�to�55�percent��Between�1990�and�2004�the�number�of�non-Latino�Whites�in�the�six-county�region�fell�by�more�than�a�quarter�of�a�million�from�4,758,000�to�4,529,000��During�the�same�period�the�Latino�popula-tion�increased�by�more�than�three-quarters�of�a�million�persons�
Figure 2.Latinos as a Percentage of Metro Chicago Residents,
1970–2004
5%8%
12%
17%20%
0%
5%
10%
15%
20%
25%
30%
35%
40%
1970 1980 1990 2000 2004
324,000
581,000
837,000
1,405,0001,607,000
Sources: 1970–2000 Census, ACS 2004. Notes: Based on 6 counties.Note: Numbers rounded to nearest 1000.

Page The State of Latino Chicago
C
�
The�rapid�growth�of�the�Latino�population�is�expected�to�continue��A�recent�projection�by�the�Northeastern�Illinois�Planning�Commission�(NIPC)4�indicates�that�by�2030�one-third�of�the�region’s�population�will�be�Latino��
Figure �
Latino Suburbanization For�many�years�the�region’s�Latinos�were�primarily�concentrated�in�the�city,�but�since�the�1980s�the�Latino�population�has�been�growing�faster�in�the�suburbs�than�in�the�city�(figure�4)��
In�1970�a�quarter�of�a�million�Latinos�lived�in�the�city�of�Chicago—7�5�percent�of�the�city’s�population��That�same�year�only�76,000�Latinos�were�spread�throughout�the�suburbs�of�the�six�counties,�and�they�accounted�for�only�2�percent�of�the�suburban�population��By�1990�the�Latino�population�in�the�city�of�Chicago�reached�546,000,�and�by�2000�it�had�grown�to�more�than�three-quarters�of�a�million��Representing�more�than�a�quarter�of�the�city’s�total�popula-tion,�Chicago�Latinos�have�come�to�exert�an�enormous�influence�on�the�social,�cultural,�and�economic�life�of�the�city��Yet�between�1990�and�2000�each�of�the�five�collar�counties�more�than�doubled�its�Latino�population�
Figure 3.Proportion of Metro Chicago Population Groups,
Actual and Projected, 1980–2030
8%12%
17%
23%28%
33%
71% 69%
62%58%
54%49%
20% 19% 19% 19% 18% 18%
0%
20%
40%
60%
80%
100%
1980 1990 2000 2010 2020 2030
Latinos Non-Latino White/Other Non-Latino Black
Source: Northern Illinois Planning Commission.Note: *White/Other includes Asians.
4�See�www�nipc�org/2030_forecast_endorsed_093003�htm�
The majority of
Chicago-area
Latinos now live
in the suburbs.

This Is Home NowPage
C
�
Source: 1970–2000 Census, ACS 2004.Notes: Based on 6 counties.Notes: Numbers rounded to nearest 1000.
Figure 4.Location of Residence of Latinos in Metro Chicago, 1970–2004
746,000(46%)
754,000(54%)
546,000(65%)
422,000(73%)
248,000(76%)
862,000(54%)
651,000(46%)291,000
(35%)159,000(27%)
76,000(24%)
0%
20%
40%
60%
80%
100%
1970 1980 1990 2000 2004
Chicago
Suburban
Figure 5.Metro Chicago Latino Population by Percentage and Number,1990, 2000, 2004
20%
7%
12%
6%
3%
8%
14%
4%
14%
26%
13%
17%
9%
8%
14%
24%
9%
20%
27%
16%
20%
12%
10%
18%
27%
11%
22%
0% 5% 10% 15% 20% 25% 30%
City of Chicago
Suburbs
6 County Metro Total
Will
McHenry
Lake
Kane
DuPage
Cook
1990
2000
2004
1,072,0001,162,000
694,000
81,000100,000
35,000
96,000127,000
44,000
119,00093,000
39,000
28,00020,000
6,000
71,00044,000
20,000
1,607,0001,405,000
837,000
862,000651,000291,000
746,000754,000546,000
Source: 1990 and 2000 Censuses, ACS 2004. Notes: Based on 6 counties. Notes: Numbers rounded to nearest 1000.

Page The State of Latino Chicago
C
�0
From�a�tiny�fraction�of�the�suburban�population�in�1970,�Latinos�have�rapidly�become�a�ma-jor�presence� in� the� suburbs�as�well�� In�1980�only�about�a�quarter�of�metropolitan�Chicago�Latinos�lived�in�the�suburbs��The�proportion�grew�to�more�than�one-third�in�1990�and�to�just�under�half�in�2000�(Paral,�Ready,�Chun,�and�Sun�2004)��By�2004�a�majority�(54�percent)�was�living�in�the�suburbs,�and�2003�and�2004�were�the�first�years� in�decades� in�which�the�city’s�Latino�population�did�not�grow��In�marked�contrast,�the�rapid�pace�of�growth�of�the�suburban�population�has�continued��It�is�as�a�result�of�the�continued�growth—now�concentrated�in�the�suburbs—that�Latinos�have�become�the�largest�racial�or�ethnic�group�in�the�region,�surpassing�African�Americans�in�2002�
As� illustrated� in� Figure� 5� and� in� the� maps� that� follow,� Latinos� are� widely� dispersed� across�the�six-county�suburban�region��Between�1990�and�2004�the�suburban�Latino�population�in-creased�by�more�than�570,000,�or�205�percent��Each�of�the�five�suburban�counties,�plus�the�suburban�portion�of�Cook,�experienced�triple-digit�increases�in�the�percentages�of�their�resi-dents�who�are�Latino��Increases�ranged�from�189�percent�in�Kane�County�to�367�percent�in�McHenry��Numerically,�each�county’s�increase�was�substantial�not�only�in�absolute�terms�but�also�relative�to�the�size�of�the�counties’�population�
A� major� factor� behind� the� disproportionate� population� growth� is� migration� directly� from�Latin�America—especially�Mexico��According�to�Census�2000,�immigrants�who�arrived�in�the�United�States�during�the�1990s�were�more�likely�to�take�up�residence�in�the�suburbs�than�in�the�city�(55�percent�as�opposed�to�45�percent�respectively)��More�than�68,000�suburban�residents�indicated�that�they�had�moved�to�suburban�Chicago�directly�from�Latin�America�during�the�latter�half�of�the�1990s��Also�contributing�to�the�suburban�growth�is�out-migration�from�the�city��During�the�latter�half�of�the�1990s,�55,000�Latinos�moved�from�Chicago�to�the�suburbs,�while�only�22,000�moved�from�the�suburbs�to�the�city�
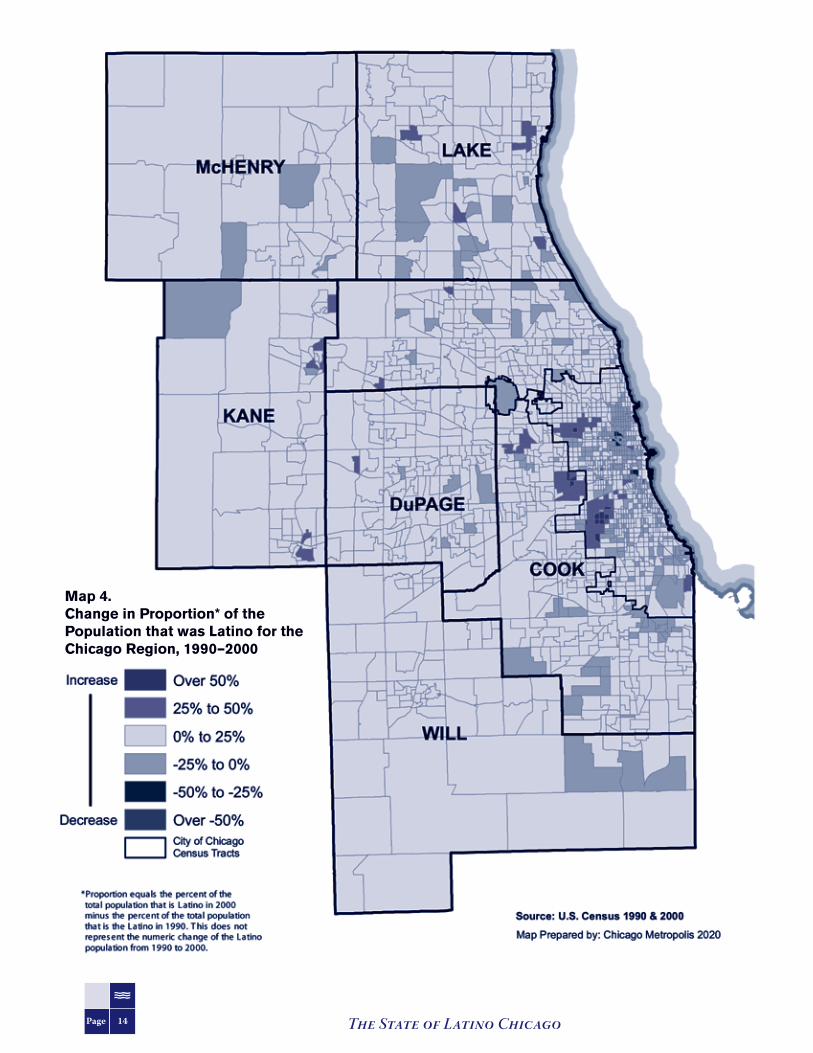
The�following�maps�illustrate�both�the�concentration�and�growth�of�Latinos�in�the�region��Map�1�details�the�concentration�of�the�Latino�community�in�the�city�of�Chicago,�where�Mexican�en-claves�have�replaced�distinct�European�ethnic�neighborhoods�in�the�northwest�and�southwest�bungalow�belts��Latinos�have�high�concentrations�in�many�areas�of�the�city�with�the�exception�of�the�Lakefront,�West�Side,�and�South�Side��There�are�now�12�Community�Areas�in�Chicago�with�a�population�that�is�at�least�50�percent�Latino��This�is�up�from�7�in�1990��In�addition,�the�‘Clark�Street�Corridor’�has�expanded�north�to�the�city�limits�and�south�along�Ashland�Avenue�to�Irving�Park�Road��
As�Map�2�indicates,�there�has�been�a�staggering�transformation�in�southwest�side�neighbor-hoods� such� as� Gage� Park� and� West� Lawn� and� northwest� neighborhoods� such� as� Belmont�Cragin�� Some� areas� have� lost� a� small� portion� of� their� Latino� population,� with� the� greatest�losses�in�West�Town�and�the�Near�West�Side�
Maps�3�and�4�indicate�that,�regionally,�there�are�Latino�settlements�in�each�of�the�surround-ing�counties�with�the�largest�concentrations�in�the�satellite�cities�of�Joliet,�Aurora,�Elgin,�and�Waukegan��Cicero�and�Berwyn�have�joined�these�areas�as�municipalities�to�be�counted�among�the�areas�with�the�largest�Latino�populations��Importantly,�the�metropolitan�Chicago�area�has�seen�the�emergence�of�three�majority�Latino�suburbs,�Stone�Park,5�Cicero,�and�Melrose�Park,�and�an�even�greater�number�of�Latino�ethnic�enclaves,�primarily�in�the�satellite�cities��
5�Stone�Park�has�been�majority�Latino�since�at�least�1980�

This Is Home NowPage
C
��
Map Prepared by: Chicago Metropolis 2020
Source: U.S. Census 2000
6
1
2
3
4
5
7 8
9
10
11
12
CMap 1
ity of Chicago Census Tracts with LatinoPopulation Proportions 15% or Greater:2000
City of Chicago Census Tracts
15% to 25%
25% to 50%
50% to 75%
Over 75%
Chicago Community Areas withLatino Populations Greater Than 50%
Chicago Community Areas with LatinoPopulations Equal to or Greater Than 50%
1. LOWER WEST SIDE (89%) 7. BELMONT CRAGIN (65%)
2. HERMOSA (84%) 8. LOGAN SQUARE (65%)
3. SOUTH LAWNDALE (83%) 9. AVONDALE (62%)
4. GAGE PARK (79%) 10. McKINLEY PARK (62%)
5. BRIGHTON PARK (77%) 11. WEST LAWN (52%)
6. EAST SIDE (68%) 12. NEW CITY (50%)
Map 1.City of Chicago Census Tracts with Latino Population Proportions 15% or Greater, 2000

Page The State of Latino Chicago
C
��
Map P repared by: C hicago Metropolis 2020
S ourc e: U.S . C ens us 1990 & 2000
*Proportion equals the percent of thetotal population that is Latino in 2000minus the percent of the total populationthat is the Latino in 1990. T his does notrepres ent the numeric change of the Latinopopulation from 1990 to 2000.
C
Map 2
hange in the P roportion* of theP opulation that is L atino for theC ity of C hic ago (19 90 to 2000)
C ity of C hicagoC ens us Tracts
Decreas e
Increas e
Over -50%
-50% to -25%
-25% to 0%
0% to 25%
25% to 50%
Over 50%
Map 2.Change in Proportion* of the Population that was Latino for the City of Chicago, 1990–2000

This Is Home NowPage
C
��
Map 3.Chicago Region Census Tracts with Latino Population Proportions 15% or Greater, 2000
Page The State of Latino Chicago
C
��
Map 4.Change in Proportion* of the Population that was Latino for the Chicago Region, 1990–2000

This Is Home NowPage
C
��
Segregated Communities or Ethnic Enclaves?Despite�the�substantial�shift� in�the�Latino�population�from�the�city� to�the�suburbs,�Latinos�continue�to�be�highly�clustered�in�enclave�communities��As�for�previous�generations�of�immi-grants�from�Europe,�ethnic�enclave�communities,�whether�in�the�city�or�the�suburbs,�surround�residents�with�the�comforting�familiarity�of�residents’�mother�tongue�or�ancestral� language�(Spanish),�ethnic�stores�and�restaurants,�and�neighbors�who�share�a�common�culture�and�simi-lar�experiences��Latino�enclaves�also�can�provide�a�relatively�safe�space�for�the�acculturation�of� recent�arrivals�and�can�act�as� incubators� for�business� start-ups�� Indeed,� these�neighbor-hoods�have�created�busy�commercial�strips�that�help�to�solidify�neighborhoods�by�providing�residents�with�access�to� jobs�as�well�as� to�needed�goods�and�that�contribute�significant�tax�revenues�for�the�region�
On�the�other�hand,�one�could�also�view�the�distribution�of�Latinos�across�the�region�as�highly�segregated,�and�there�is�evidence�that�the�segregation�is�not�entirely�voluntary��Recent�surveys�show�that�both�Latinos�and�African�Americans� frequently�experience�discrimination�when�seeking�rental�housing,�looking�to�buy�a�home,�or�seeking�mortgages�(Turner,�Ross,�Galster,�and�Yinger�2002)��Although�such�discriminatory�practices�may�be�only�one�of�many�factors�explaining�the�emergence�of�neighborhoods�that�are�highly�segregated�by�race,�ethnicity,�and�class� in� the� region,� there� is� evidence� that� living� in� predominantly� Latino� neighborhoods—which�also�are�likely�to�be�low�income—can�create�both�geographic�and�social�barriers�to�op-portunities,�including�better�jobs�and�schools�(Lukehart,�Luce,�and�Reece�2005)��
In� recent� years� long-standing� patterns� of� segregation� between� city� and� suburbs� have� been�replicated�within�the�suburbs�themselves��A�recent�study�found�that�although�the�degree�of�residential�segregation�of�Latinos�from�Whites�declined�marginally�in�the�city�between�1990�and�2000,�it�rose�substantially�in�the�suburbs�(Stuart�2002)��A�widely�used�indicator�of�segre-gation6�shows�that�between�1990�and�2000�Latino-White�residential�segregation�increased�in�the�suburbs,�and�Latino-White�segregation�of�school�children�increased�even�more�during�the�same�period,�both�in�the�city�and�in�the�suburbs��Children�in�highly�segregated�Latino�com-munities,�many�of�whom�are�among�those�with�the�greatest�needs,�are�often�clustered�into�un-der-resourced,�high-poverty�schools�that�too�often�have�not�met�the�expectations�of�residents�(Institute�for�Latino�Studies�2002,�2005)��
6�The�segregation�index�measures�the�extent�to�which�the�proportions�of�two�groups�of�people�in�a�particular�area�(e�g�,�Census�tract�or�school�district)�are�different�from�the�proportions�of�those�two�groups�in�the�metropolitan�area�(Stuart�2002,�8)��For�more�information�on�the�index�and�on�segregation�in�metropolitan�Chicago�see�www�civilrightsproject�harvard�edu/research/metro/Chicago%20Study4�pdf�
Latino enclaves
provide a safe
space for the
acculturation of
new arrivals and
act as incubators
for business start
ups. But living in
predominantly
Latino neighbor-
hoods—which
also are likely to
be low income—
can create both
geographic and
social barriers
to opportunities,
including better
jobs and schools.

Page The State of Latino Chicago
C
��
National Origins Nearly� four�out�of�every�five�Latino�residents�of�metropolitan�Chicago�are�of�Mexican�ori-gin,�compared�to�64�percent�nationally�(ACS�2004)��At�1,260,000�million,�the�Chicago�area’s�Mexican�population� is� the�second� largest� in�the�nation��Puerto�Ricans�make�up�the�second�largest�group�with�eight�percent�of�the�area’s�Latino�population��
Figure �
In�marked�contrast�to�the�rapid�rise�of�Mexicans�in�the�region,�the�area’s�Puerto�Rican�popula-tion�has�not�grown�in�recent�years��In�fact,�the�number�of�Chicago-area�Latinos�who�identified�themselves�as�Puerto�Rican�in�2004,�133,000,�is�9,000�fewer�than�in�1990�7�That�year�Puerto�Ricans�comprised�17�percent�of�Chicago-area�Latinos;�by�2004�their�share�of�the�six-county�Latino�population�had�fallen�to�only�8�percent��The�area’s�small�Cuban�population�of�about�20,000�has�seen�modest�growth�but�fell�from�2�percent�of�the�area’s�Latino�population�in�1990�to�1�percent�in�2004��
The�rate�of�growth�of�the�Chicago�area’s�South�and�Central�American�population�has�been�very� fast� in� recent� years� but� from� a� much� smaller� base� than� that� of� Mexicans� or� Puerto�Ricans��In�2004�the�numbers�of�South�and�Central�Americans�living�in�the�Chicago�area�were�71,000�and�50,000,�respectively��Persons�of�Guatemalan�origin�are�by�far�the�largest�Central�American�nationality�in�the�region�at�29,000,�followed�by�Salvadorans�at�11,000��The�largest�South�American�nationalities� in� the�region�are�Ecuadorians� (24,000),�Colombians� (21,000),�and�Peruvians�(12,000)�
Source: ACS 2004.Source: Census 2000.Notes: Based on 6 counties.Notes: All data are rounded to the nearest whole number.
Figure 6.Percentage of Metro Chicago Latino Population
by Place of Origin, 2004
Mexican79%
Puerto Rican8%
South American4%
Central American3%
Cuban1%
Other5%
7�In�recent�years�more�Latinos�have�chosen�not�to�identify�themselves�on�Census�surveys�as�being�of�any�particular�national�origin�because�of�marriages�between�persons�of�different�backgrounds�and�for�other�reasons�(Chun�2005)�

This Is Home NowPage
C
��
US- and Foreign-Born LatinosMore�than�half�(53�percent)�of�Chicago-area�Latinos�were�born�in�the�United�States�(Census�2000;�ACS�2003;�Paral,�Ready,�Chun,�and�Sun�2004)��However,�between�1990�and�2003�the�total�increase�in�the�foreign-born�Latino�population�exceeded�that�of�the�US-born�population�(393,000�to�355,000)��
Figure �
Migration� was� especially� heavy� during� the� 1990s� when,� on� average,� 32,000� foreign-born��residents�were�added�each�year��During�the�same�period�the�number�of�US-born�Latino�resi-dents�increased�by�about�27,000�per�year,�due�to�high�fertility�rates�and�very�low�death�rates�among�this�very�young�population—and�in�spite�of�significant�out-migration�to�other�parts�of�the�United�States�(Census�2000,�PHC-T-25)��However,�from�2000�to�2003�Latino�popula-tion�increase�among�the�US-born�has�slightly�outpaced�that�due�to�international�migration��Between�2000�and�2003�the�number�of�foreign�born�increased�by�24,500�per�year�while�US-born�Latino� residents� increased�by�28,200�per�year�� In� the� same�period,� the�annual� rate�of�increase�for�US-born�residents�rose�faster�than�during�the�1990s,�while�the�rate�of�increase�among�the�foreign-born�slowed�significantly���Thus,�a�fundamental�shift�may�be�occurring�in�the�factors�that�explain�the�growth�of�the�Latino�population�in�metropolitan�Chicago�
Even�during�years�like�the�most�recent�when�the�rate�of�growth�in�the�US-born�population�has�exceeded�that�of�the�foreign-born,�migration�can�still�be�understood�as�the�primary�engine�of�population�growth��This�is�because�nearly�two-thirds�(65�percent)�of�adult�Latinos�are�foreign-
Source: 2000 Census.Note: Based on 6 counties.
Figure 7.Percentage of US- and Foreign-Born Metro Chicago
Latinos, Children, Adults, and Total, 2000
53%
35%
84%
47%
65%
16%
0% 20% 40% 60% 80% 100%
Total
Adults
Children
US-Born Foreign-Born
Most foreign-born
Latinos completed
their schooling
before coming
to the United
States. To avoid
becoming stuck
in jobs that offer
few possibilities
for advancement,
learning English
and obtaining
skills for obtaining
higher paying jobs
are essential.

Page The State of Latino Chicago
C
��
born,�while�more�than�eight�in�ten�(84�percent)�Latino�children�were�born�in�the�United�States�(Census�2000;�Paral,�Ready,�Chun,�and�Sun�2004)��Thus,�even�though�the�great�majority�of�chil-dren�are�US-born,�at�least�two-thirds�of�all�Latino�children�in�Illinois�have�foreign-born�par-ents8�(CPS�2002–04)��A�majority�(52�percent)�of�foreign-born�residents�arrived�in�the�United�States�during�the�prime�child�bearing�years;�nearly�two-thirds�were�between�the�ages�of�16�and�26�when�they�arrived�(Institute�for�Latino�Studies�Chicago�Area�Survey)�
As�a�result,�nearly�six�in�ten�foreign-born�Latinos�are�concentrated�in�the�young�adult�years�between�18�and�40,�and�only�12�percent�are�under�the�age�of�18��This�compares�to�only�30�percent�of�the�US-born�between�18�and�40,�and�61�percent�under�the�age�of�18�(Census�2000)��The�median�age�of�foreign-born�Latinos�is�33,�compared�to�a�median�age�of�12�for�US-born�Latinos��In�contrast,�the�median�age�of�the�area’s�non-Latino�White�residents�is�37��These�de-mographic�facts�have�profound�implications�for�understanding�various�topics�of�importance�to�the�Latino�community�and�for�the�Chicago�area�overall��
The�most�obvious�is�that,�despite�the�fact�that�most�Latino�adults�are�immigrants,�and�many�are�recently�arrived,�the�vast�majority�of�Latino�children�are�US�citizens�by�birth,�and�met-ropolitan�Chicago�is�the�only�home�they�have�ever�known��Nearly�30�percent�of�all�children�under�five�years�of�age�are�Latino��While�Latino�adults�of�working�age�are�having�an�enormous�impact�on�the�economic�and�social�life�of�the�region,�the�future�impact�of�young�Latinos�will�be�greater�still��
Another�important�implication�has�to�do�with�the�clustering�of�adult�Latinos�in�their�20s,�with�far�fewer�above�45�years�of�age��As�will�be�discussed�in�greater�detail�below,�young�Latinos�are�work-
Figure 8.Age Distribution of Metro Chicago Latino Population, 2000
0
10,000
20,000
30,000
40,000
50,000
<1 105 15 20 25 30 35 40 45 50 55 60 65 70 75 80 85 90
Source: 2000 Census.
Age in Years
Note: Based on Chicago 9-county PMSA.
8�Sixty-five�percent�of�the�fathers�and�59�percent�of�the�mothers�of�all�Latino�children�in�Illinois�were�born�outside�of�the�United�States��Sixty�percent�of�the�fathers�and�54�percent�of�the�mothers�of�US-born�Latino�children�in�Illinois�were�born�outside�of�the�United�States�
Median ages
of foreign-born
Latinos, US-born
Latinos, and non-
Latino Whites
are 33, 12, and
37 respectively.

This Is Home NowPage
C
��
ing�very�hard�for�very�low�wages��Will�they�be�successful�in�accessing�better�paying�jobs�as�they�progress�through�the�middle�and�latter�stages�of�their�working�lives?�What�can�be�done�to�ensure�that�they�rise�through�the�occupational�hierarchy�and�become�more�prosperous�as�they�advance�through�their�careers�and�thereby�contribute�even�more�to�the�prosperity�of�the�region?�
Latino�workers�are�paying�taxes�and�contributing�to�social�security�but�make�few�demands�on�the�area’s�health�care�and�retirement�systems�because�of�their�youth��However,�their�needs�will�inevitably�increase�as�they�grow�older��Will�the�private�and�publicly�financed�health�and�pen-sion�systems�meet�the�needs�of�Latinos�as�they�age?
To� no� small� degree,� the� future� of� the� region� depends� upon� the� successful� incorporation��of�Latino�children—and�their�mostly�foreign-born�parents�who�care�for�them—into�the�eco-nomic,�social,�cultural,�and�political�life�of�the�region�
Figure 9.Age Distribution of Metro Chicago
US- and Foreign-Born Latino Populations, 2000
0
5,000
10,000
15,000
20,000
25,000
30,000
35,000
40,000
45,000
50,000
Foreign-BornUS-Born
<1 105 15 20 25 30 35 40 45 50 55 60 65 70 75 80 85 90Age in Years
Source: 2000 Census. Note: Based on Chicago 9-county PMSA.
Don’t hire a
second shift.
We’ll work
both shifts.
–��Latino�poultry�worker,�Fulton�Street�Market
“”

Page The State of Latino Chicago
C
�0
Issues of Immigration and CitizenshipAs� described� above,� immigrants,� a� steadily� growing� proportion� of� whom� have� come� from�Mexico,�have�driven�much�of�the�growth�of�the�Latino�population�in�metropolitan�Chicago�since�1980��The�percentage�of�Mexicans�among�all�Latin�American�immigrants�increased�from�76�percent�of�foreign-born�Latino�residents�of�metro�Chicago�who�arrived�in�the�United�States�before�1980�to�92�percent�of�those�who�arrived�after�2000�(ACS�2003)��
When�asked�why�they�had�come�to�Chicago,�approximately�two-thirds�of�male�respondents�and�one-third�of�female�respondents�to�the�Chicago�Area�Survey�indicated�work�as�the�prin-cipal�reason��About�half�of�both�men�and�women�also�indicated�that�the�presence�of�family�in�the�area�was�an�important�consideration��
It� is� important� to� point� out� that� despite� the� large� and� much� publicized� migration� of� Latin�Americans—especially�Mexicans—that�has�taken�place�in�recent�years,�Latinos�have�remained�only�slightly�more�than�one-half�of�all�new�arrivals�in�recent�years��In�fact,�Latino�immigrants�account�for�a�substantially�smaller�proportion�of�all�new�arrivals�in�recent�years�than�they�did�during�the�1980s��The�metropolitan�Chicago�area,�like�the�nation�as�a�whole,�has�become�home�to�a�growing�number�of�immigrants�from�all�regions�of�the�world��
Figure �0
Figure 10.Latino and Non-Latino Foreign-Born Metro Chicago
Residents by Year of Arrival in USA
102,000 (51%)
282,000 (51%)184,000
(58%)172,000 (40%)
98,000 (49%)
271,000 (49%)
133,000 (42%)
258,000 (60%)
0
100,000
200,000
300,000
400,000
500,000
600,000
700,000
Before 1980 1980–1990 1990–2000 2000–2003
Latino Non-LatinoSource: ACS 2003.Note: Based on 6 Counties.
More than
two-thirds of
Chicago-area
Latinos are
citizens.

This Is Home NowPage
C
��
Considering�the�large�number�of�recent�immigrants,� it� is�important�to�note�that�more�than�two-thirds�(67�percent)�of�Chicago-area�Latinos�are�citizens�(ACS�2003)��Among�adult�Latinos,�a�majority�of�whom�are� immigrants,�55�percent�are�citizens��This� includes�36�percent�who�are�citizens�by�birth�and�19�percent�who�are�naturalized�citizens—31�percent�of�foreign-born�Latinos�are�naturalized�
Compared�to�foreign-born�residents�of�the�Chicago�area�from�other�parts�of�the�world,�foreign-born� Latinos� are� less� likely� to� become� naturalized� citizens�� Only� 31� percent� of� the� Latino�foreign�born�are�citizens,�compared�to�54�percent�of�Asian-�and�58�percent�of�European-born�residents�of�the�area�who�are�citizens��Interestingly,�66�percent�of�foreign-born�Latinos�who�arrived�prior�to�1980�are�citizens�compared�to�only�21�percent�of�those�who�arrived�after�1980�(ACS�2003)��Two-thirds�of�the�Latino�foreign-born�arrived�after�1980��For�the�more�than�half�who�arrived�after�1990,�only�13�percent�are�citizens��
Thus,�Latinos�are�much�less�likely�than�the�Asian�or�European�foreign�born�to�naturalize,�even�when�the�year�of�arrival�is�statistically�controlled��Also,�naturalization�rates�vary�substantially�among�Latinos�from�different�countries��In�general,�naturalization�rates�are�higher�for�persons�born�in�South�America�and�the�Caribbean�(excluding�Puerto�Ricans,�who�are�citizens�by�birth),�lower�for�Central�Americans,�and�especially�low�for�persons�born�in�Mexico,�after�controlling�for�year�of�arrival��Lack�of�formal�documentation�very�likely�is�a�significant�contributing�factor�to�the�relatively�low�naturalization�rates��
Two� recent� reports� from� the� Pew� Hispanic� Center� discuss� legal� and� unauthorized� immigra-tion�trends��It�is�estimated�that�the�number�of�undocumented�immigrants�living�in�Illinois�from�all�parts�of�the�world�is�approximately�400,000�(Passel�2005a)—approximately�one-fourth�of�all��foreign-born�persons��Well�over�90�percent�of�foreign-born�residents�of�Illinois�live�in�metropoli-tan�Chicago,�where�about�half�of�all�immigrants�are�from�Latin�America��The�reports�estimate�that�well�over�half�of�recent�migrants�from�Mexico�lack�official�documentation�and�that�in�recent�years�unauthorized�immigrants�have�outnumbered�those�with�documentation�(Passel�2005b)��If�these�estimates�are�correct,�then�at�least�200,000�of�the�740,000�foreign-born�Latino�residents�of�metro�Chicago�are�undocumented��However,�any�estimate�of�the�size�of�the�undocumented�population�is�necessarily�inconclusive,�given�the�unofficial�nature�of�their�arrival�
With�or�without�documentation,�more�than�20,000�new�Latino�immigrants,�primarily�from�Mexico,� take� up� residence� in� metropolitan� Chicago� each� year�� As� will� be� described� below,�most�are�very�hard�working�but�earn�exceptionally�low�wages��Without�them�many�employ-ers�would�have�difficulty�keeping�their�businesses�profitable��Most�Latino�immigrants�in�the�area� have� enjoyed� some� degree� of� economic� success—even� those� without� documentation��However,�the�many�who�are�undocumented�lack�the�most�basic�rights�and�protections�accord-ed�to�legal�residents�and�are�forced�to�live�what�is�in�many�ways�an�‘underground’�existence��Accordingly,�they�are�subject�to�potential�exploitation�in�the�workplace�and�in�other�settings��They�are�also�raising�children�who�mostly�are�citizens—yet�many�of�those�children�grow�up�seeing�their�parents�working�long�hours�in�low�paying�jobs,�living�at�the�margins,�and�wonder-ing�what�lies�ahead�for�them�

Page The State of Latino Chicago
C
��
Family and HouseholdFor�Chicago-area�Latinos,�as�for�people�of�all�backgrounds,�the�family�is�the�cornerstone�of�social�life�and�culture��It�is�our�first�and�most�important�source�of�nurturing�and�support�and�the�primary�social�unit�from�which�each�of�us�learns�who�we�are�as�individuals�and�community�members��Latino�families�perform�these�essential�functions�in�ways�that�distinctively�define�Latino�culture�and�community�in�metropolitan�Chicago��While�much�could�be�written�about�the�Latino�family� in�Chicago,�here�we�highlight�a� few�characteristics� that�shed� light�on�the�economic�and�educational�status�of�Latino�families�and�households��
Binational, Bicultural, and Bilingual Perhaps� most� distinctive� of� Latino� households� is� their� binational,� bicultural,� and� bilingual�character��As�previously�discussed,�two-thirds�of�Latino�adults�migrated�to�the�United�States�from�another�country�(principally�Mexico),�while�84�percent�of�children�under�18�were�born�in�the�United�States��It�is�not�surprising,�then,�that�a�large�majority�(approximately�60�percent)�of�US-born�Latino�children�and�70�percent�of�all�Latino�children�have�one�or�both�parents�who�are�foreign-born�(CPS�data�for�Illinois�2002–2004)��As�a�result,�both�English�and�Spanish�are�spoken�in�76�percent�of�the�homes—these�are�truly�binational�families��In�only�14�percent�of�homes�is�English�the�only�language�spoken;�only�10�percent�of�Latino�homes�are�exclusively�Spanish�speaking��
Bilingualism,�of�course,�is�an�asset�that�makes�it�possible�to�overcome�barriers�of�language�and�culture�and�to�communicate�and�interact�with�people�of�different�backgrounds��It�is�also�an�invaluable�skill�in�the�workplace��To�take�full�advantage�of�this�skill,�however,�it�is�important�to�be�proficient�in�both�languages��In�the�context�of�Chicago,�as�in�the�rest�of�the�United�States,�full�mastery�of�English�is�extremely�important�for�school�success�and�access�to�better-paying�jobs��But�more�than�a�quarter�(27�percent)�of�Latino�children�grow�up�in�linguistically�isolated�households—households�in�which�there�are�no�members�who�speak�English�very�well�(Census�2000,�SF3�PCT�013;�Chicago�Fact�Finder)�9
Linguistically�isolated�households�not�only�make�it�more�difficult�for�children�to�learn�English�well�but�also�complicate�parents’�task�of�helping�their�children�to�access�the�wide�variety�of�information�in�English�needed�for�success�in�school�and�beyond��This,�in�turn,�increases�the�onus�of�responsibility�on�schools�to�develop�and�implement�effective�approaches�to�instruction�for�students�with�limited�English�proficiency�and�to�overcome�linguistic�barriers�that�could�impede�effective�communication�with�parents��Thirty-three�percent�of�all�Latino�children�in�metro�Chicago�between�the�ages�of�5�and�17�speak�English�less�than�“very�well”�(Census�2000,�SF3�PCT�62H)��
9�Respondents�to�Census�surveys�are�asked�if�they�speak�English�and�whether�they�speak�another�language�(e�g�,�Spanish)��Those�who�indicate�that�they�speak�another�language�are�asked�if�they�also�speak�English�“Very�well,”�“Fairly�well,”�“Not�very�well”�or�“Not�at�all,”�and�whether�they�speak�more�than�one�language��
Being bicultural
is one of the
biggest assets. I
would encourage
all Latinos to be
bilingual. It’s a
gift to be able to
draw from both
worlds.
–�Maria,�a�Pilsen�resident
“
”
This Is Home NowPage
C
��
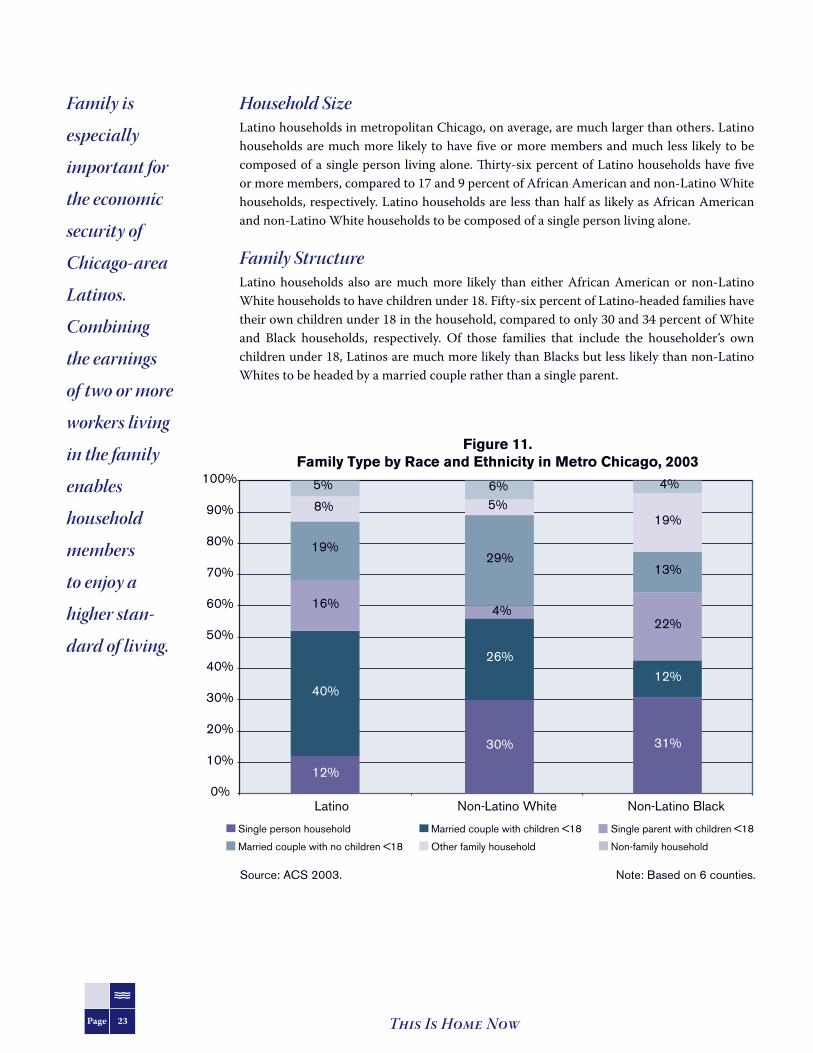
Household SizeLatino�households�in�metropolitan�Chicago,�on�average,�are�much�larger�than�others��Latino�households�are�much�more� likely�to�have�five�or�more�members�and�much�less� likely�to�be�composed�of�a�single�person�living�alone��Thirty-six�percent�of�Latino�households�have�five�or�more�members,�compared�to�17�and�9�percent�of�African�American�and�non-Latino�White�households,�respectively��Latino�households�are�less�than�half�as�likely�as�African�American�and�non-Latino�White�households�to�be�composed�of�a�single�person�living�alone��
Family StructureLatino� households� also� are� much� more� likely� than� either� African� American� or� non-Latino�White�households�to�have�children�under�18��Fifty-six�percent�of�Latino-headed�families�have�their�own�children�under�18�in�the�household,�compared�to�only�30�and�34�percent�of�White�and� Black� households,� respectively�� Of� those� families� that� include� the� householder’s� own�children�under�18,�Latinos�are�much�more�likely�than�Blacks�but�less�likely�than�non-Latino�Whites�to�be�headed�by�a�married�couple�rather�than�a�single�parent��
Figure ��
Figure 11.Family Type by Race and Ethnicity in Metro Chicago, 2003
12%
30%
40%
26%
4%
29%
8% 5%
16%
19%
5% 6%
0%
10%
20%
30%
40%
50%
60%
70%
80%
90%
100%
Latino Non-Latino White
Single person household Married couple with children <18 Single parent with children <18
Married couple with no children <18 Other family household Non-family household
Source: ACS 2003.
31%
12%
22%
13%
19%
4%
Non-Latino Black
Note: Based on 6 counties.
Family is
especially
important for
the economic
security of
Chicago-area
Latinos.
Combining
the earnings
of two or more
workers living
in the family
enables
household
members
to enjoy a
higher stan-
dard of living.

Page The State of Latino Chicago
C
��
Income and PovertyFamily�structure�is�an�extremely�powerful�correlate�of�economic�security�for�families�with�chil-dren��Those�families�that�are�headed�by�a�married�couple�are�far�less�likely�to�be�in�poverty�than�are�those�headed�by�a�single�parent�(ACS�2003,�P116)��Overall,�14�percent�of�Latino�families�were�in�poverty�in�2003�compared�to�21�percent�of�African�American�and�3�percent�of�non-Latino�White�families��The�poverty�rate�for�Latino�children�is�higher�than�for�Latino�families:�One�in�five�(20�percent)�of�Latino�children�was�poor�in�2003�
It�is�interesting�to�note�that�while�the�overall�poverty�rate�for�Latino�families�in�2003�was�one-third�lower�than�that�of�African�Americans,�when�the�rates�for�married�couple�families�were�compared,�Latinos�were�much�more�likely�than�Blacks�to�be�poor,�and�the�poverty�rate�of�African�American�married�couple�families�was�only�slightly�higher�than�that�of�non-Latino�Whites��
As�will�be�explained�in�greater�detail�below,�Latino�workers�have,�by�far,�the�lowest�wage�and�salary�earnings�of�any�group�in�metropolitan�Chicago��The�fact�is�that�the�high�rate�of�poverty�for�Latino�married�couple�families�is�primarily�attributable�to�the�low�wages�of�the�worker(s)�in�those�families��That�is,�the�working�poor�are�a�far�higher�proportion�of�Latinos�than�of�African�Americans�or�non-Latino�Whites��Latino�families�partially�compensate�for�their�low�salaries�and�wages�by�pooling�the�earnings�of�multiple�workers�within�households�
Nearly�a�quarter�(24�percent)�of�Latino�families�have�three�or�more�workers�contributing�to�the�support�of�their�households�compared�to�only�12�percent�of�African�American�and�15�percent�of�non-Latino�White�households��Besides�the�spouse�of�the�householder,�the�additional�work-ers�may�include�their�adolescent�and�adult�children,�a�relative�outside�of�the�nuclear�family,�or�a�non-relative��Indeed,�21�percent�of�Latino�workers�live�in�households�in�which�they�either�are�not�a�member�of�the�family�or�are�a�relative�but�not�a�member�of�the�nuclear�family�of�the�householder��This�compares�to�8�percent�of�non-Latino�workers�(CPS�2002–04)��
Differentiating�between�Latino�families�with�foreign-born�and�US-born�householders�shows�that�those�headed�by�foreign-born�persons�are�nearly�twice�as�likely�to�include�three�or�more�
Source: ACS 2003.Note: Based on 9-county Chicago PMSA.
Figure 12.Family Type for Metro Chicago Households
with Own Children under 18, by Ethnicity, 2003
Married Couple35%
61,000
Married Couple87%
491,000Married Couple
71%159,000
Single Parent65%
115,000
Single Parent13%
76,000Single Parent 29%64,000
0%
10%
20%
30%
40%
50%
60%
70%
80%
90%
100%
Latino Non-Latino White Non-Latino Black
Figure 14. Workers per Family Households by Race, Ethnicity, and Nativity, 2003
10%15%
6% 9% 5%
27%
38%
31%33%
30%
49%
35%
40%
43%
38%
0%
10%
20%
30%
40%
50%
60%
70%
80%
90%
100%
Non-LatinoWhite
Non-LatinoBlack
Latino US-Born Foreign-Born
No workers in family 1 worker in family 2 workers in family 3 or more workers in family
15%12%
24%15%
27%
Source: 2000 Census.Note: Based on PMSA.
Latinos

This Is Home NowPage
C
��
workers�as�those�headed�by�the�US�born�(27�percent�vs��15�percent)��This�is�understandable,�given�that�foreign-born�Latino�workers�tend�to�earn�less�than�their�US-born�counterparts��
The�importance�of�multiple�workers�for�the�economic�stability�of�Latino�families�is�apparent�when�examining�the�relationship�of�multiple�worker�households�to�median�household�income��In�metro�Chicago�the�median� income�for�all�households� in�2000�was�$52,200�compared�to�$44,300�for�Latino�households��Only�14�percent�of�Latino�households�with�one�worker�had�incomes�of�at�least�$50,000—enough�to�approximate�or�surpass�the�median�for�all�households��However,�45�percent�of�households�with�two�workers�had�income�of�at�least�$50,000�per�year,�as�did�74�percent�of�households�with�three�or�more�workers�(Census�2000,�Advanced�Query)�
Figure 13.Families in Poverty by Family Type, Race,
and Ethnicity in Metro Chicago, 2003
14% 12%
30%
21%
3%
40%
3% 2%
17%
0%
5%
10%
15%
20%
25%
30%
35%
40%
45%
All Families Married Couple Families with Children
Single-Parent Familieswith Children
Latino Non-Latino White
Source: ACS 2003. Note: Based on Chicago 9-county PMSA.
Non-Latino Black
Figure 14. Workers per Family Households by Race, Ethnicity, and Nativity, 2003
10%15%
6% 9% 5%
27%
38%
31%33%
30%
49%
35%
40%
43%
38%
0%
10%
20%
30%
40%
50%
60%
70%
80%
90%
100%
Non-LatinoWhite
Non-LatinoBlack
Latino US-Born Foreign-Born
No workers in family 1 worker in family 2 workers in family 3 or more workers in family
15%12%
24%15%
27%
Source: 2000 Census.Note: Based on PMSA.
Latinos

Page The State of Latino Chicago
C
��
EducationIntergenerational Learning The�Latino�family�has�a�powerful�influence�on�its�members,�and�familial�ties�and�loyalties�prob-ably�exert�an�influence�that�is�even�more�powerful�than�is�typically�observed�in�many�non-Latino�families��Pride�in�cultural�heritage�runs�deep�among�young�Latino�Chicagoans,�just�as�it�does�among�the�older�generation��However,�Chicago� is�very�different� from�Mexico�and�the�other�Latin�American�countries�that�most�of�the�parents�of�the�area’s�young�people�left�behind��
Some�aspects�of�Latin�American�cultures�and�their�behavioral�norms�and�expectations�that�were�well�suited�to�the�parental�generation�prior�to�migration�may�seem�less�suited�to�new�social�environments�encountered�in�Chicago��The�demands�caused�by�social�and�cultural�dis-placement�(that�to�some�extent�are�inevitably�associated�with�international�migration)�can�be�a�cause�of�stress�and�tension�for�individuals�and�families��It�is�reasonable�to�assume�that�the�old-er�generation’s�“funds�of�knowledge”�(Moll,�Tapia,�and�Whitmore�1993)—that�is,�the�cultural�and�linguistic�templates�learned�from�family�and�community�along�with�knowledge�acquired�in�school—may�require�some�modification�and�some�new�learning�to�meet�the�demands�of�life�in�Chicago��At�the�very�least,�learning�English�is�almost�essential�
In�addition,�the�level�of�formal�education�of�most�Latino�immigrant�adults�prior�to�migration�severely�restricts�their�access�to�better-paying�jobs�in�metro�Chicago��Their�limited�schooling�also�poses�a�challenge� for�parents�who�struggle� to�help� their�children�advance�their� formal�education��Nearly�a�quarter�of�all�Latino�young�adults� in�the�prime�parenting�age�of�25–34�completed�no�more�than�nine�years�of�schooling,�and�45�percent�did�not�complete�high�school��Among�the�foreign�born,�who�are�approximately�two-thirds�of�all�Latino�parents,�one-third�have�completed�no�more�than�ninth�grade�and�nearly�six�in�ten�did�not�complete�high�school��Only�26�percent�of�all�US-born�and�9�percent�of�foreign-born�Latinos�(ages�25–34)�have�com-
24%
1% 2%
33%
6%
21%
4%
16% 16%
25%
18%
27%
24%
27%
15%
21%
31%
10%
25%
14%
56%
24%
9%
26%
0%
10%
20%
30%
40%
50%
60%
All Latinos Non-Latino White Non-Latino Black Foreign-Born US-BornLatinos
< 9th Grade 9th–12th Grade, No Diploma HS Grad Some College College Grad
Source: 2000 Census. Note: Based on Chicago 9-county PMSA.
Figure 15. Educational Attainment, Ages 25–34 by Ethnicity
and for US-Born and Foreign-Born Chicago Metro Latinos, 2000
Latinos’ dis-
proportionate
concentration in
low-paying jobs
along with dis-
couraging school
completion rates
raise questions
about their future
levels of success
and, indeed,
the future of the
region.

This Is Home NowPage
C
��
pleted�college��These�levels�of�educational�attainment�are�far�lower�than�those�of�either�non-Latino�White�or�Black�residents�of�the�area��
But� does� this� matter,� besides� limiting� access� to� better-paying� jobs?� It� matters� because� low�parental�educational�attainment,�especially�in�combination�with�poverty�and�limited�English�proficiency,�are� strongly� related� to�how�well� children�do� in� school� from�the�earliest�grades�onward�(National�Research�Council�2000,�267–96;�Lloyd,�Tienda,�and�Zajacova�2002;�Miller�1995,�143–71)��Substantial�disparities�emerge�even�before�children�begin�first�grade�(National�Research�Council�2001,�59–127;�Lee�2002;�ISBE�2004c)�and�are�routinely�measured�by�the�third�grade�(ISBE�2004c)��These�disparities�generally�do�not�go�away�as�children�progress�through�the� educational� continuum;� on� the� contrary,� they� tend� to� grow� larger� (Lloyd,� Tienda,� and�Zajacova�2002)��Eliminating�disparities�in�school�readiness�during�early�childhood�has�been�a�major�policy�goal�for�many�years�10�If�progress�could�be�made�toward�the�achievement�of�this�goal,�it�is�likely�that�Latino�educational�outcomes�would�be�greatly�improved�(Lee�2002)��
The Needs of Foreign-Born LatinosAs�previously�noted,�the�educational�attainment�for�Chicago-area�Latinos�is�very�low�relative�to�that�of�both�non-Latino�Whites�and�Blacks��Indeed,�Latinos�consider�education�to�be�the�greatest�challenge� facing� their�community� (Institute� for�Latino�Studies�2002;�Pew�Hispanic�Center�2004)��However,�statistics�describing�the�educational�profile�of�Latinos�in�general�tend�to� mask� important� differences� between� two� distinct� segments� of� the� population� with� very�different�educational�profiles—those�persons�born�in�the�United�States�and�the�foreign-born��As�previously�discussed,� the�great�majority�of� foreign-born�residents,�who�on�average�have�exceptionally� low� levels� of� educational� attainment,� finished� their� formal� schooling� prior� to�
10�For�example,�see�Goals�2000,�US�Department�of�Education,�www�ncrel�org/sdrs/areas/issues/envrnmnt/stw/sw0goals�htm�
Figure 16.Percent of Illinois Third Grade Students Who Are Proficient in Reading
and Math, by Race, Ethnicity, and Low-Income Status, 2004
76%
56%
90%
77%
54%
39%
63%
46%
0%
10%
20%
30%
40%
50%
60%
70%
80%
90%
100%
Reading MathLatino Non-Latino
WhiteNon-LatinoBlack
Low-IncomeSource: Illinois School Report Card, State Summary, ISBE 2004.
Substantial
disparities in
school-related
skills emerge
even before
children begin
first grade.

Page The State of Latino Chicago
C
��
migrating�to�the�United�States�as�young�adults��And,�of�the�approximately�75,000�foreign-born�children�in�the�area,�many�arrived�in�the�United�States�at�a�very�young�age��
An�Institute�for�Latino�Studies�analysis�of�Latino�students�in�Chicago�shows�that�the�so-called�1�5�generation,�foreign-born�school�children�who�arrived�in�the�country�prior�to�age�eight,�are�about�as�likely�as�US-born�Latino�students�to�graduate�from�high�school�and�go�on�to�college��Those�who�were�age�nine�or�older�upon�arrival�are�much�less�likely�to�complete�high�school�(Ready�2005)�and�go�on�to�college��It�is�likely�that�many�more�of�these�students�will�need�to�enroll�in�educational�settings�especially�tailored�to�meet�their�needs�if�they�are�to�successfully�complete�their�schooling�through�high�school�graduation�and�beyond��Identifying�and�repli-cating�programs�and�schools�that�have�been�successful�in�educating�these�students�is�a�crucial�task��It�is�important�to�note�in�this�regard�that�for�undocumented�students�who�complete�high�school,�the�recent�passage�of�the�“Dream�Act”�by�the�Illinois�legislature—allowing�these�stu-dents�to�enroll�in�state�colleges�and�universities�and�to�pay�in-state�tuition—will�also�help�them�become�more�successful�and�productive�contributors�to�the�region’s�social�and�economic�life��
Only� 12� percent� of� Chicago’s� foreign-born� Latino� population� is� under� 18� years� of� age�� Most�foreign-born�residents�arrive�in�the�United�States�as�young�adults�or�in�their�late�teenage�years��They�come�to�the�Chicago�area�primarily�in�search�of�employment�(Institute�for�Latino�Studies�Chicago�Area�Survey)�and�most�completed� their� formal�schooling� in� their�country�of�origin��Thus,� the� primary� educational� challenges� facing� foreign-born� residents� of� the� area� who� are�adults�are�to�learn�English,�to�obtain�job-related�training,�and�to�improve�their�general�educa-tional�preparation�through�non-formal�means�such�as�GED�programs��As�described�later�in�this�report,�foreign-born�Latinos�have�been�remarkably�successful�overall�in�finding�work,�obtaining�adequate�housing,�and�in�making�a�living�despite�their�low�level�of�educational�attainment��Yet�to�avoid�becoming�stuck�in�jobs�that�that�offer�few�possibilities�for�advancement,�learning�English�and�obtaining�skills�that�are�important�for�obtaining�higher-paying�jobs�are�essential��
Building the Capacity of Schools and Communities to Better Serve Latino Students The�area’s�US-born�Latino� residents�are�an�exceptionally�young�population—more� than�60�percent�are�of�school�age�(ages�5–17)�or�younger��With�half�of�the�US-born�population�younger�than�12�years�of�age,� improving�educational�outcomes�depends�on�building� the�capacity�of�elementary�and�secondary�schools�to�serve�these�students�more�effectively�and�increasing�the�capacity�of�Latino�families�and�communities�themselves�to�improve�children’s�learning��Fewer�than�half�of�Chicago-area�Latino�children�have�a�parent�who�was�born�in�the�United�States,�and�this�has�consequences�for�their�educational�outcomes��Approximately�80�percent�of�Latino�children�in�metropolitan�Chicago�are�bilingual;�however,�about�30�percent�speak�English�less�than�very�well�(ACS�2003)��These�include�not�only�students�who�are�foreign�born�but�some�US-born�students�who�are�from�linguistically�isolated�households—those�in�which�there�is�no�one�14�years�of�age�or�older�who�speaks�English�very�well�(US�Census�definition)��
In�addition,�26�percent�of�the�350,000�Latino�children�of�school�age�(5–17)�are�living�in�pover-ty,�and�many�attend�schools�in�which�a�very�high�percentage�of�children�are�from�poor�families�(Institute�for�Latino�Studies�2005)��Such�schools�in�Illinois�are�more�likely�than�others�to�have�teachers�who�are�not�fully�certified�or�are�teaching�out�of�their�fields�of�expertise�(Education�
If I could learn
English, I could
do the same
jobs as the
Americans.
In this country
if one doesn’t
prepare oneself,
one will not
advance.”
–�José,�a�recent�immigrant
“
”

This Is Home NowPage
C
��
Trust�2004)��The�high-poverty�schools�in�which�many�Latino�students�tend�to�be�clustered�are�also�likely�to�receive�less�funding�for�instruction�than�are�schools�serving�students�from�more�affluent�backgrounds�(Institute�for�Latino�Studies�2005)��Indeed,�with�a�gap�of�$2,384�per�stu-dent�between�richer�and�poorer,�Illinois�has�the�largest�funding�disparity�in�the�nation�between�districts�serving�the�lowest�and�highest�percentages�of�students�in�poverty�(Education�Trust�2004)��Thus�many�Latino�children,�who�are�among�those�with�the�greatest�needs,�tend�to�be�enrolled�in�the�schools�with�the�fewest�resources��
It�is�no�wonder,�then,�that�an�ethnic�achievement�gap�that�is�already�apparent�when�children�enter�first�grade�tends�to�get�larger�as�students�progress�through�elementary�and�secondary�school� (ISBE� 2004c)�� Only� 53� percent� of� Illinois� Latino� students� who� enter� high� school� in�ninth�grade�graduate�four�years�later�(Education�Trust�2004)��Although�78�percent�of�US-born�Latinos�eventually�graduate�or�obtain�a�GED�by�their�late�20s,�less�than�half�as�many�US-born�Latinos�as�non-Latino�Whites�graduate�from�college��
Given�these�statistics,�a�program�of�applied�research�specifically�examining�the�educational�needs�of�Latino�students�and�families�and�how�best�to�meet�them�should�be�a�high�priority��The�research�campaign�should�begin�by�examining�topics�such�as:�
•� promising�strategies�already�being�implemented�in�Chicago;11
•� the� potential� benefits� of� developing� strategies� to� enable� more� Latino� students� to� attend�Catholic�schools�(Bryk,�Lee,�and�Holland�1993);�and�
•� strategies�to�more�effectively�engage�Latino�students�in�school�and�schools�in�Latino�com-munities�(National�Research�Council�2004;�Bryk�2002)�
11�See�smallschools�cps�k12�il�us/�
Source: The Education Trust 2004. Note: Based on State of Illinois.
Figure 17.Illinois Students Who Graduated from High School Four Years after Entering Ninth Grade, 1997–2001
94%
53%
84%
53%
74%
0%
10%
20%
30%
40%
50%
60%
70%
80%
90%
100%
Total Latino Non-LatinoWhite
Non-LatinoBlack
Asian

Page The State of Latino Chicago
C
�0
HealthBecause�Chicago-area�Latinos�are�a�very�young�population,�mortality� rates� tend� to�be� low��Although�Latinos�comprised�14�percent�of�the�total�population�of�Illinois�in�2001,�only�three�percent�of�all�persons�who�died�in�Illinois�that�year�were�Latino�(National�Center�for�Health�Statistics�2001)�12�Because�of�international�migration�and�population�growth,�it�is�difficult�to�measure�and�interpret�morbidity�and�mortality�statistics� in�this�community��However,�with�relatively�few�exceptions,�even�age-adjusted�morbidity�statistics�suggest�that�Illinois�Latinos�are�no�more�likely�to�suffer�from�most�diseases�than�are�others�13�
This�is�not�to�say�that�Latinos�do�not�face�major�issues�related�to�health�care��By�far�the�most�salient�issue�is�the�lack�of�health�insurance��Overall,�Latinos�are�much�less�likely�to�have�health�insurance� than� either� non-Latino� Whites� or� Blacks�� However,� there� are� major� differences��between�US-born�Latinos�and�the� foreign�born� in� the�rates�of� the�uninsured,�with�the� for-eign�born�three�to�four�times�more�likely�to�be�uninsured�than�their�US-born�counterparts,��depending�on�age��US-born�born�Latinos�are�less�likely�to�be�insured�than�non-Latino�Whites,�but�more�likely�to�have�insurance�than�Blacks��Nearly�half�(47�percent)�of�foreign-born�Latinos�have�no�health�insurance�compared�to�16�percent�of�the�US-born��
Amongst�all�Latinos,�those�of�working�age�(18–64)�are�the�least� likely�to�have�health�insur-ance,� except� when� foreign-born� Latinos� are� examined� separately�� Insurance� coverage� rates�are�higher�for�the�elderly�primarily�because�of�Medicare��Levels�of�coverage�under�Medicare�approach�100�percent�for�the�elderly�in�all�groups,�except�for�the�very�small�number�of�Latino�foreign-born�residents�in�that�age�bracket,�only�76�percent�of�whom�are�covered�by�Medicare��Similarly,�levels�of�coverage�are�higher�for�children�than�they�are�for�working-age�adults�for�all�but�the�foreign�born��This�is�because�of�the�State�of�Illinois’�Kid-Care�program�(de�la�Torre,�Garcia,� Nuñez� de� Ybarra,� and� Cortez� 2005)�� With� only� one-third� having� health� insurance,�foreign-born�Latino�children�are�the�least�likely�of�any�group�to�be�covered��Only�12�percent�are�covered�by�Illinois�Kid-Care,�compared�to�29�percent�of�US-born�Latino�children�and�45�percent�of�African�American�children��
12Accessed�on-line�at�www�cdc�gov/nchs/data/statab/mortfinal2001_workorig10�pdf�
13�To�review�mortality�statistics�for�Illinois�by�racial�and�ethnic�group,�see�http://webapp�cdc�gov/sasweb/ncipc/leadcaus�html�
Source: 2002–2004 Current Population Survey.Note: Based on State of Illinois.
Figure 18.Percent of the Illinois Popula-tion with No Health Insurance by Race, Ethnicity, Nativity, and Age, 2002–2004
21%
30%
21%
7%
16%
65%
16%
27%
13%
18%
47%
36%
2%0%0%
9%6%
10%
16%
47%
0%
10%
20%
30%
40%
50%
60%
70%
Latino Non-Latino BlackNon-Latino White US-Born Foreign-BornLatinos
Under 18 years 18–64 years 65 or more years Total
Are the area’s
public and
private health-
care systems
structured to
meet the needs
of Latinos as
they grow older?

This Is Home NowPage
C
��
Finally,�it�should�be�noted�that�government�health�surveys�routinely�ask�respondents�to�evalu-ate�whether�their�health�is�“excellent,”�“very�good,”�“good,”�“fair”�or�“poor�”�Latino�respondents�are�far�more�likely�than�others�in�Illinois�to�indicate�that�they�consider�their�health�to�be�only�fair�or�poor��Although�the�reasons�for�this�relatively�negative�self-assessment�of�health�are�not�entirely�clear,� lack�of� insurance�may�result� in�their�having�to�leave�untreated�various�health�problems�that�might�otherwise�be�alleviated�with�easier�access�to�care��
An�important�consequence�of�these�low�rates�of�enrollment�in�health�insurance�is�that�people�often�wait�until�they�are�very�sick�before�seeking�medical�help,�and�when�they�do,�it�is�in�an�emergency�room��This�means�that�medical�costs�for�municipalities�are�much�higher�than�they�need�be,�because�patients�often�arrive�requiring�more�help�in�the�place�where�medical�costs�are�the�highest�
Figure 19.Illinois Residents’ Self-Assessment of Health Status
by Race and Ethnicity, 2004
3% 3%5%9%
16%
25%
28%
36%
34%
37%
31%21%
23%14%15%
0%
10%
20%
30%
40%
50%
60%
70%
80%
90%
100%
Non-Latino White Non-Latino BlackLatinoPoor Fair Good Very Good Excellent
Source: Behavioral Risk Factor Surveillance System, Centers for Disease Control.

Page The State of Latino Chicago
C
��
Latinos and the EconomyLatino Economic Power Latinos’�economic�clout�in�metropolitan�Chicago�has�grown�in�tandem�with�the�population��Between�1990�and�2003,�the�aggregate�household�income�for�Chicago-area�Latinos�increased�from�$5�8�billion�to�$20�billion��Currently,�Latino�household�income�accounts�for�more�than�9� percent� of� the� region’s� total,� and� is� approximately� equal� to� the� gross� domestic� product��of�Panama,�Bolivia,�Honduras,�or�Luxemburg�(Central�Intelligence�Agency�2005)�
Following� are� a� few� salient� facts� about� the� growth� of� Latino� businesses,� employment,��and�housing:
Latino Business Growth•� In�2002�there�were�40,000�Latino-owned�businesses�in�the�state,�generating�over�$7�5�
billion�in�revenues��
•� During� the� five-year� period� between� 1997� and� 2002� the� number� of� Latino-owned��businesses�increased�44�percent�
•� During� the� same� five-year� period� the� dollar� value� of� sales� receipts� rose� 56� percent�(State�of�Illinois�Survey�of�Minority-Owned�Business�Enterprises,�1997,�and�Survey�of�Business�Owners,�2002;�data�include�firms�with�paid�employees�and�firms�with�no�paid�employees)��
•� High�concentrations�of�Latino�businesses�have�revived�declining�commercial�districts�in�some�neighborhoods�and�created�new�ones�in�others�
Employment•� During� the� 13-year� period� between� 1990� and� 2003� growth� in� the� number� of� Latino�
workers�was�nearly�equal�to�the�total�number�of�new�jobs�created�in�the�region��
•� Between�1990�and�2000�Latinos�accounted�for�76�percent�of�the�250,000�jobs�that�were�added�in�the�six�counties�of�metro�Chicago��
•� Between�2000�and�2003�the�total�number�of�jobs�in�the�six-county�metro�area�increased�by�an�additional�41,000��During�the�same�three-year�period�the�number�of�jobs�held�by�Latinos�increased�by�more�than�105,000�14�
•� Between�1990�and�2003,�the�region�would�have�suffered�a�net�loss�of�jobs�were�it�not�for�increases�attributable�to�Latinos��
Housing•� More�than�half�of�Latino�households�are�owner-occupied��
•� Between�1990�and�2003�the�number�of�homes�owned�by�Latinos�increased�by�126,000,��accounting�for�34�percent�of�the�total�growth�in�owner-occupied�homes�
•� Between�2000�and�2003�the�number�of�homes�owned�by�Latinos�increased�by�41,000�accounting�for�46�percent�of�total�growth�in�owner-occupied�homes�
14�1990�and�2000�Census�and�ACS�2003��No�data�are�available�on�Latino�employment�in�2003�for�Will�and�McHenry�counties��

This Is Home NowPage
C
��
Income TrendsBetween�1990�and�2000�income�increased�much�faster�in�metro�Chicago�than�it�did�nation-wide,�which�helped�to�make�Chicago�an�attractive�place�for�migrants�from�Mexico�and�other�Latin�American�countries��The�increased� income�benefited�Chicago-area�Latinos�as�well�as�every�other�racial�and�ethnic�group�in�the�region��
During� this� period,� for� example,� the� median� household� income� of� metro� Chicago� Latinos�jumped�from�$30,200�to�more�than�$44,300,15�an�increase�of�47�percent��Nearly�one-third�of�Latino�households�have�an�income�of�$60,000�or�more;�one�in�five�Latino�households�has�an�income� of� $75,000� or� higher�� Blacks� and� non-Latino� Whites� registered� major� gains� during�
Sources: 1990 Census STF, 2000 Census SF3, ACS 2003. Note: Based on Chicago 9-county PMSA.
Figure 20.Aggregate Household Income of Latinos
in the Metro Chicago Region, 1990, 2000, and 2003 (in Billion US$)
5.8
17.520.0
0.0
5.0
10.0
15.0
20.0
25.0
1990 2000 2003
15�Figures�in�2000�constant�dollars�
16�See�www�nd�edu/~chifacts�
The median household income of Latinos in metro Chicago
increased a remarkable 48 percent during the 1990s. Since
2000, however, Latinos’ income has stagnated.

Page The State of Latino Chicago
C
��
this�period�as�well�16�Other�measures�of�income�also�reg-istered� dramatic� gains� for� Chicago-area� residents� of� all�backgrounds�during�the�1990s��
Since� 2000,� however,� the� income� growth� has� stopped�for� Latinos� and� has� been� inconsistent� for� others� in� the�region��Depending�on�the�measure�used,�Latino�income�has�either�remained�relatively�unchanged�(e�g�,�per�cap-ita� income)� or� has� decreased� since� 2000�� For� example,�Latino� household� income� in� metro� Chicago� decreased�6�percent�between�2000�and�2003�17�Between�2000�and�2003�the�earnings�of�Latino�men�who�worked�full-time,�year�round,�decreased�6�percent,�although�Latinas’�earn-ings� increased� by� 3� percent�� The� earnings� of� African�American�men�and�women�increased�by�2�percent,�while�those�of�non-Latino�White�men�and�women�increased�by�8�percent�18�No�matter�which�measure�of�income�is�used,�the�income�gap�between�Latinos�and�non-Latino�Whites�increased�between�1990�and�2004��Whether�or�not� this��pattern� persists� will� have� profound� implications� for�Chicago-area�Latinos�and�for�the�region�as�a�whole�
Figure ��
Sources: ACS 2003, 2000 Census SF3. Notes: 1990 data are from Chicago Fact Finder, and are based on 6 counties.2000 and 2003 data are based on 9-county Chicago PMSA. Amounts are in 2003 constant dollars.
Figure 21.Median Household Income* by Race and Latino Origin, 1990–2003
1990$30,177
1990$23,591
1990$43,687
2000$44,336
2000$35,814
2000$64,006
2003$41,781
2003$32,792
2003$62,246
$0
$10,000
$20,000
$30,000
$40,000
$50,000
$60,000
$70,000
Latino BlackWhite
17�From�$44,336�to�$41,781�in�2003�constant�dollars�
18�Earnings�figures�are�in�2004�constant�dollars��

This Is Home NowPage
C
��
Different Measures of Income—Gaining Perspective One’s�assessment�of�the�economic�status�of�Chicago-area�Latinos�depends�upon�the�economic�indicator�that�one�uses��As�illustrated�in�the�graphs�below,�Latinos�are�the�most�disadvantaged�segment� of� population� in� terms� of� the� workers’� earnings� and� per� capita� income�� However,�when�one�uses�family,�and�especially�household,�income�as�the�primary�measures�of�economic�well-being,�Latinos�appear�to�be�somewhat�better�off���
The�median�earnings19�of�Latino�workers�are�substantially�lower�than�those�of�both�African�American�and�White�workers��On�average,�Latino�workers�in�metropolitan�Chicago�earned�only�$21,495�per�year�in�2003—which�is�less�than�60�percent�of�the�earnings�of�non-Latino�Whites�and�only�80�percent�of�those�of�African�American�workers��Similarly,�Latino�per�cap-ita�income20�was�only�$13,543—more�than�$2,000�lower�than�that�of�African�Americans�and�equal�to�only�39�percent�of�the�per�capita�income�of�non-Latino�Whites��
However,�unlike�earnings�and�per�capita�income,�Latinos’�median�family21�and�household22�incomes�are�substantially�greater�than�those�of�African�Americans��As�previously�noted,�this�is�primarily�because� the� larger�Latino� family�households�on�average�contain�more�workers�contributing�to�the�family�and�household�than�do�Whites�and�African�Americans��
����19�Median�earnings�are�the�earnings�of�all�male�and�female�workers�from�wages,�salaries,�and�net�self-employed�income�
20�Per�capita�income�is�the�average�obtained�by�dividing�the�aggregate�income�of�a�group�by�the�total�population�of�that�group�
21�‘Family�households’�here�means�households�with�two�or�more�persons�related�by�birth,�marriage,�or�adoption�
22�Median�household�income�is�the�median�income�of�one�or�more�persons�living�in�a�housing�unit�that�is�the�usual�place�of�resi-dence�for�that�(those)�person(s)�
Figure 22.Median Earnings, Median Family Income, and Median Household Income
by Race and Ethnicity in Metro Chicago, 2003
$21,495
$13,543
$41,617 $41,781
$26,456
$15,846
$38,460
$32,792$36,620
$34,497
$77,657
$62,246
0
10000
20000
30000
40000
50000
60000
70000
80000
90000
Earnings Per Capita Income Family Income Household IncomeLatino Non-Latino BlackNon-Latino White
Source: 2003 American Community Survey. Note: Based on Chicago 9-County PMSA.
“”
I’m not rich,
but I’ve
moved ahead
with my life.
–�Metal�worker,�western�suburbs

Page The State of Latino Chicago
C
��
Latino�families�are�much�less�likely�than�either�African�American�or�non-Latino�White�fami-lies�to�not�have�any�household�members�in�the�workforce��In�addition,�Latino-headed�house-holds—especially�those�headed�by�the�foreign�born—are�more�likely�than�others�to�include�three�or�more�members�who�work�23�
When�examining�the�distribution�of�Latinos,�Whites,�and�African�Americans�across�different�household�income�categories,� it� is�apparent�that�Latinos�are�fairly�evenly�distributed�across�low-,�medium-,�and�high-income�categories�compared�to�African�Americans�and�Whites��In�contrast,�there�is�a�large�concentration�of�African�Americans�in�the�lowest�income�categories�while�non-Latino�Whites�are�disproportionately�clustered�in�the�upper�income�bands�
Figure ��
One� implication� that� can� be� drawn� from� the� discussion� of� these� four� measures� of� income�is�that�the�family�is�especially�important�for�the�economic�security�of�Chicago-area�Latinos��Combining�the�earnings�of�two�or�more�workers�living�in�larger�families�and�households�en-ables�household�members�to�enjoy�a�higher�standard�of�living�than�would�otherwise�be�pos-sible��Despite�very�low�wages,�more�than�half�of�Chicago-area�Latinos�live�in�owner-occupied�homes,�and�Latinos�have�a�much�lower�poverty�rate�than�do�African�Americans,�whose�me-dian�earnings�and�per�capita�income�are�higher��
23�It�is�important�to�recall�that�approximately�two-thirds�of�Latino�adults�in�metro�Chicago�are�foreign-born��
Figure 23.Household Income Distribution by Race and Ethnicity in Metro Chicago, 2003
0%
5%
10%
15%
20%
25%
< $10,000
$10,000–$14,999
$15,000–$19,999
$20,000–$24,999
$25,000–$29,999
$30,000–$34,999
$35,000–$39,999
$40,000–$44,999
$45,000–$49,999
$50,000–$59,999
$60,000–$74,999
$75,000–$99,999
$100,000–$124,999
$125,000–$149,999
$150,000–$199,999
$200,000 or m
ore
Latino WhiteSource: ACS 2003.Note: Based on Chicago 9-county PMSA. Black

This Is Home NowPage
C
��
HousingLatinos�are�an�extremely� important�component�of� the�housing�market� in� the�metropolitan�area,� especially� in� the� suburbs�� In� 2003,� there� were� 203,000� Latino-owned� homes� in� the� 6�county�area,�an�increase�of�126,000�since�1990��Since�1990,�Latinos�have�been�responsible�for�34�percent�of�the�overall�growth�in�owner-occupied�homes�in�metro�Chicago��Between�2000�and�2003,�46�percent�of�the�growth�in�owner-occupied�homes�is�attributable�to�Latinos��
More�than�half�of�all�Latino�households�are�owner-occupied��Although�Latinos’�homeowner-ship�rate�still�lags�behind�that�of�the�population�at�large,�the�gap�is�narrowing��Latinos’�hom-eownership�rate�increased�by�14�percentage�points,�from�38�percent�in�1990�to�52�percent�in�2003��This�compares�to�only�a�6�percentage�point�increase�for�all�metro�Chicago�households��In�2003,�69�percent�of�all�homes�in�the�area�were�owner-occupied�
Between�1990�and�2000,�three-quarters�of�the�growth�in�Latino-owned�homes�occurred�in�the�suburbs;�since�2000,�all�of�it�has�been�suburban��After�many�years�of�steady�growth,�the�num-ber�of�Latino-owned�homes�in�the�city�of�Chicago�has�been�falling�since�2000��
Latinos�living�in�the�suburbs�are�more�likely�to�be�homeowners�than�city�residents��Sixty�per-cent�of�suburban�Latino�households�are�owner-occupied,�compared�to�43�percent�of�Latino�households�in�the�city�of�Chicago���
A� very� different� picture� emerges� when� examining� metropolitan� Chicago� rental� housing��Despite�the�massive�increase�in�the�Latino�population�that�occurred�between�1990�and�2003,�the�number�of�Latino-occupied�rental�homes�increased�by�only�62,000�during�this�13�year-period��Nearly�all�of�the�growth�in�Latino-occupied�rental�housing�was�in�the�suburbs��During�the�same�period,�the�number�of�rented�homes�occupied�by�non-Latinos�decreased��
Source: AHS 2003, McConnell and Ready 2005.Note: Based on Chicago 9-county PMSA.
Figure 24.Homeownership Rates in Metro Chicago, 2003
52%
79%
49% 50% 53%
0%
20%
40%
60%
80%
100%
Latino Non-LatinoWhite
Non-LatinoBlack
US-BornLatino
Foreign-BornLatino
Latinos have
accounted for
a major portion
of the growth in
homeownership
since 1990.

Page The State of Latino Chicago
C
��
Figure �� above
An�important�consequence�of�the�increase�in�Latino�owner-occupied�homes�is�that�it�is�be-coming�a�significant�factor�in�wealth�accumulation,�especially�with�the�major�increase�in�home�values�that�has�occurred�in�recent�years��According�to�estimates,�the�average�value�of�Latino-owned�homes�is�$150,000—between�the�average�value�of�$205,000�for�non-Latino�Whites�and�the�$107,000�average�value�of�African�American-owned�homes�
Labor and WorkforceAlthough�Latinos’�progress�in�metropolitan�Chicago�has�been�impressive�in�many�ways,�it�has�also�been�fragmented�and�uneven��For�example,�while�the�percentage�of�Latinos�making�over�$75,000�per�year�increased�significantly,�one�out�of�every�five�(20�3�percent)�Latinos�can�be�char-acterized�as�working�poor�(Chicago�Urban�League�2004)��Many�more�Latinos�are�working�full�time�through�the�full�year,�yet�wage�and�salary�earnings�make�it�difficult�to�support�a�family��
Position at the Low EndWhere� are� Latinos� working?� Of� the� 820� occupational� categories� listed� by� the� Illinois�Department�of�Employment�Services�and�the�US�Bureau�of�Labor�Statistics,24�Latino�workers�are�concentrated�in�fewer�than�75�occupations�clustered�in�five�industries:�
•� manufacturing,�with�women�concentrated�in�‘light�industry’;�•� food�services;•� construction;•� retail�trade;�and•� clerical�and�administrative�support�(principally�US-born�women)�
24�Standard�Occupational�Classification�System�(SOCS),�US�Bureau�of�Labor�Statistics�www�bls�gov/soc/home�htm�
Figure 25.Metro Chicago Latino Homeownership Rates, 1990–2003
33%
53%
39%42%
55%
47%43%
60%
52%
0%
10%
20%
30%
40%
50%
60%
70%
City Suburbs Metro
1990 2000 2003
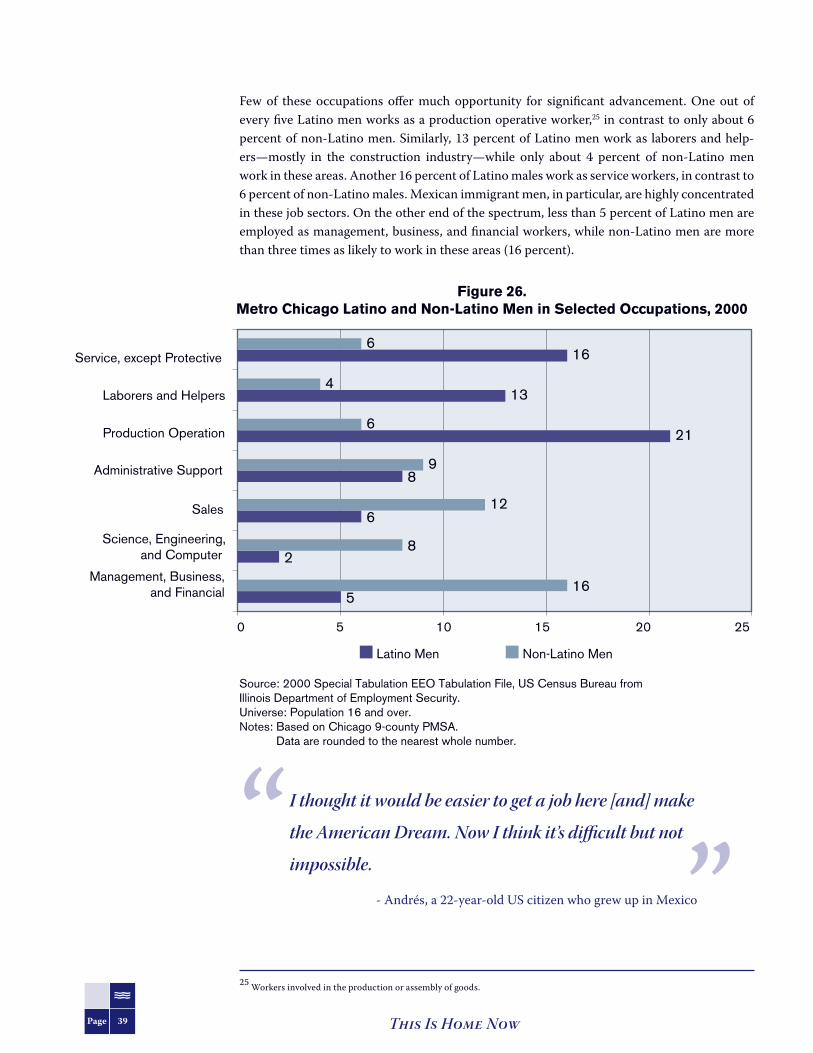
This Is Home NowPage
C
��
Few� of� these� occupations� offer� much� opportunity� for� significant� advancement�� One� out� of�every�five�Latino�men�works�as�a�production�operative�worker,25�in�contrast�to�only�about�6�percent�of�non-Latino�men��Similarly,�13�percent�of�Latino�men�work�as�laborers�and�help-ers—mostly� in� the� construction� industry—while� only� about� 4� percent� of� non-Latino� men�work�in�these�areas��Another�16�percent�of�Latino�males�work�as�service�workers,�in�contrast�to�6�percent�of�non-Latino�males��Mexican�immigrant�men,�in�particular,�are�highly�concentrated�in�these�job�sectors��On�the�other�end�of�the�spectrum,�less�than�5�percent�of�Latino�men�are�employed�as�management,�business,�and�financial�workers,�while�non-Latino�men�are�more�than�three�times�as�likely�to�work�in�these�areas�(16�percent)��
Figure �� above
25�Workers�involved�in�the�production�or�assembly�of�goods��
Figure 26.Metro Chicago Latino and Non-Latino Men in Selected Occupations, 2000
5
2
6
8
21
13
16
16
8
12
9
6
4
6
0 5 10 15 20 25
Latino Men Non-Latino Men
Management, Business, and Financial
Science, Engineering, and Computer
Sales
Administrative Support
Production Operation
Laborers and Helpers
Service, except Protective
Source: 2000 Special Tabulation EEO Tabulation File, US Census Bureau from Illinois Department of Employment Security.Universe: Population 16 and over.Notes: Based on Chicago 9-county PMSA.Notes: Data are rounded to the nearest whole number.
“ ”I thought it would be easier to get a job here [and] make
the American Dream. Now I think it’s difficult but not
impossible.
-�Andrés,�a�22-year-old�US�citizen�who�grew�up�in�Mexico

Page The State of Latino Chicago
C
�0
The�situation�is�no�better�for�Latinas��They�are�over-concentrated�in�the�production�operation�sector�(21�percent)�compared�to�only�3�percent�of�women�who�are�not�Latina��They�are�also�under-represented�among�management,�business,�and�financial�workers,�6�percent�compared�to�11�percent��However,�Latinas,�like�women�in�many�other�ethnic�groups,�are�greatly�concen-trated�in�administrative�support�worker�positions�(24�percent)�
Figure �� above
Short-Term and Long-Term ProspectsTo� understand� the� present� and� future� economic� prospects� of� Latino� workers� in� Chicago’s�economy,�we�must�first�understand�the�larger�economy�in�which�that�labor�force�is�embed-ded��One�important�consideration�is�that�Chicago’s�economy,�like�that�of�the�nation,�is�shifting�from�one�that�is�dominated�by�industry�and�manufacturing�to�one�dominated�by�information-�technology�and�service�industries�
In�the�early�and�mid-1950s�there�were�three�times�more�manufacturing�jobs�in�the�Chicago�metropolitan�areas�than�service�jobs��By�2001�the�situation�was�almost�entirely�reversed��There�were�nearly�two-and-a-half�times�as�many�service�jobs�as�there�were�manufacturing�jobs��This�economic�transformation�is�still�in�process�and�is�projected�to�soon�complete�the�reversal�of�the�service/manufacturing�ratios�found�in�the�1950s��
Source: 2000 Special Tabulation EEO Tabulation File, US Census Bureau from Illinois Department of Employment Security.Universe: Population 16 and over.Notes: Based on Chicago 9-county PMSA.Notes: Data are rounded to the nearest whole number.
Figure 27.Metro Chicago Latinas and Non-Latinas in Selected Occupations, 2000
6
1
12
24
21
3
16
11
3
12
29
3
1
13
0 5 10 15 20 25 30 35
Latinas Non-Latinas
Management, Business, and Financial
Science, Engineering, and Computer
Sales
Administrative Support
Production Operation
Laborers and Helpers
Service, except Protective
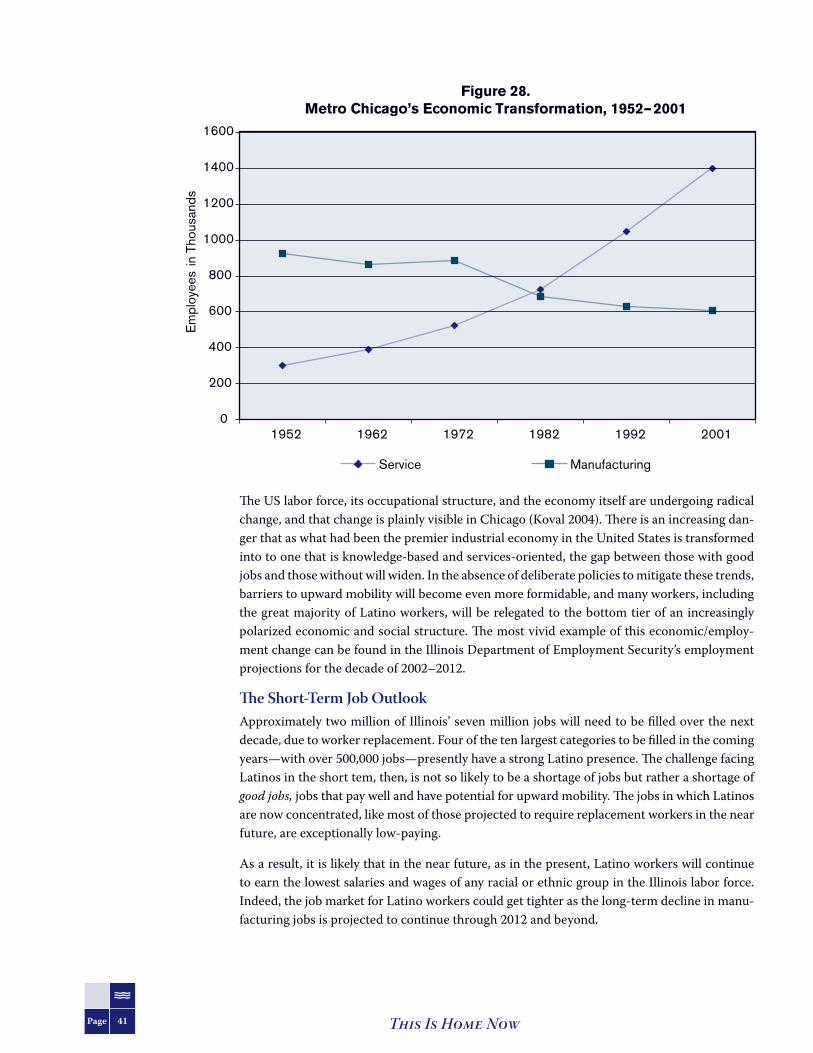
This Is Home NowPage
C
��
Figure �� above
The�US�labor�force,�its�occupational�structure,�and�the�economy�itself�are�undergoing�radical�change,�and�that�change�is�plainly�visible�in�Chicago�(Koval�2004)��There�is�an�increasing�dan-ger�that�as�what�had�been�the�premier�industrial�economy�in�the�United�States�is�transformed�into�to�one�that�is�knowledge-based�and�services-oriented,�the�gap�between�those�with�good�jobs�and�those�without�will�widen��In�the�absence�of�deliberate�policies�to�mitigate�these�trends,�barriers�to�upward�mobility�will�become�even�more�formidable,�and�many�workers,�including�the�great�majority�of�Latino�workers,�will�be�relegated�to�the�bottom�tier�of�an�increasingly�polarized�economic�and�social�structure��The�most�vivid�example�of�this�economic/employ-ment�change�can�be�found�in�the�Illinois�Department�of�Employment�Security’s�employment�projections�for�the�decade�of�2002–2012��
The Short-Term Job Outlook Approximately�two�million�of�Illinois’�seven�million�jobs�will�need�to�be�filled�over�the�next�decade,�due�to�worker�replacement��Four�of�the�ten�largest�categories�to�be�filled�in�the�coming�years—with�over�500,000�jobs—presently�have�a�strong�Latino�presence��The�challenge�facing�Latinos�in�the�short�tem,�then,�is�not�so�likely�to�be�a�shortage�of�jobs�but�rather�a�shortage�of�good jobs,�jobs�that�pay�well�and�have�potential�for�upward�mobility��The�jobs�in�which�Latinos�are�now�concentrated,�like�most�of�those�projected�to�require�replacement�workers�in�the�near�future,�are�exceptionally�low-paying��
As�a�result,�it�is�likely�that�in�the�near�future,�as�in�the�present,�Latino�workers�will�continue�to�earn�the�lowest�salaries�and�wages�of�any�racial�or�ethnic�group�in�the�Illinois�labor�force��Indeed,�the�job�market�for�Latino�workers�could�get�tighter�as�the�long-term�decline�in�manu-facturing�jobs�is�projected�to�continue�through�2012�and�beyond�
Figure 28.Metro Chicago’s Economic Transformation, 1952–2001
0
200
400
600
800
1000
1200
1400
1600
1952 1962 1972 1982 1992 2001
Em
ploy
ees
in T
hous
ands
Service Manufacturing

Page The State of Latino Chicago
C
��
There�is�a�clear�disconnect�between�the�‘growth’�jobs—new�jobs�that�are�projected�to�become�available—and� the� ‘replacement’� jobs��As� the� table�above� shows,� there� is� a� relative�balance�among�production,�managerial,�business,�sales,�and�food�service�in�the�large�job�replacement�occupations��On�the�other�hand,�the�table�below�illustrates�that�the�industries�in�which�the�most� job�growth� is�projected�are�mainly�service� industry� jobs—professional,� technical,�and�scientific—reflecting�the�economic�restructuring�that�is�the�hallmark�of�the�new�economy��
� ________________________________________________________________
State�of�Illinois�Occupational�Employment�Projections:�2002–2012Total:�Job�Replacement
� ________________________________________________________________
Sales�and�Related�Occupations�� 264,910Office�&�Administrative�Support�Occupations�� 257,380*Food�Prep�&�Serving�Occupations�� 223,310*Retail�Sales�Workers�� 173,240Transportation/Material�Moving�Occupations�� 148,680Education,�Training�&�Library�Occupations�� 147,220Management�Occupations�� 146,630*Production�Occupations�� 140,870*Food�&�Beverage�Serving�Workers�� 133,640Healthcare�Practitioners�&�Tech�Occupations�� 105,920
� ________________________________________________________________
*Jobs�with�high�Latino�concentrations
��������������������������������Source:��Illinois�Department�of�Employment�Security,�Economic��Information�and�Analysis�Division�
� ________________________________________________________________
State�of�Illinois�Industry�Employment�Projections:�2002–2012Ten�Largest�Growth�Industries
� ________________________________________________________________
Education�and�Health�Services�� 181,504Professional�and�Business�Services�� 151,801Health�Care�and�Social�Assistance�� 124,752Trade,�Transportation,�and�Utilities�� 100,191Administrative�and�Waste�Mgmt��Services�� 81,029Administrative�and�Support�Services�� 78,684Leisure�and�Hospitality�� 76,182Professional,�Scientific,�and�Tech�Services�� 66,034*Accommodation�and�Food�Services�� 59,845Educational�Services:�Private�and�Public�� 56,752
� ________________________________________________________________*Industy�with�high�Latino�concentrations
���������������������������������Source:��Illinois�Department�of�Employment�Security,�Economic��Information�and�Analysis�Division�
Figure 29.� ________________________________________________________________
State�of�Illinois�Occupational�Employment�Projections:�2002–2012Total:�Job�Replacement
� ________________________________________________________________
Sales�and�Related�Occupations�� 264,910Office�&�Administrative�Support�Occupations�� 257,380*Food�Prep�&�Serving�Occupations�� 223,310*Retail�Sales�Workers�� 173,240Transportation/Material�Moving�Occupations�� 148,680Education,�Training�&�Library�Occupations�� 147,220Management�Occupations�� 146,630*Production�Occupations�� 140,870*Food�&�Beverage�Serving�Workers�� 133,640Healthcare�Practitioners�&�Tech�Occupations�� 105,920
� ________________________________________________________________
*Jobs�with�high�Latino�concentrations
��������������������������������Source:��Illinois�Department�of�Employment�Security,�Economic��Information�and�Analysis�Division�
� ________________________________________________________________
State�of�Illinois�Industry�Employment�Projections:�2002–2012Ten�Largest�Growth�Industries
� ________________________________________________________________
Education�and�Health�Services�� 181,504Professional�and�Business�Services�� 151,801Health�Care�and�Social�Assistance�� 124,752Trade,�Transportation,�and�Utilities�� 100,191Administrative�and�Waste�Mgmt��Services�� 81,029Administrative�and�Support�Services�� 78,684Leisure�and�Hospitality�� 76,182Professional,�Scientific,�and�Tech�Services�� 66,034*Accommodation�and�Food�Services�� 59,845Educational�Services:�Private�and�Public�� 56,752
� ________________________________________________________________*Industry�with�high�Latino�concentrations
���������������������������������Source:��Illinois�Department�of�Employment�Security,�Economic��Information�and�Analysis�Division�

This Is Home NowPage
C
��
The Long-Term Job OutlookOver�the�long�term�Chicago-area�Latinos�face�two�challenges��First,�only�one�of�the�ten�larg-est� job� growth� industries� has� a� significant� Latino� worker� presence—Accommodations� and�Food�Service��Second,�the�remaining�nine�high-growth�industries�typically�require�technical�training�or�postsecondary�educational�credentials,�two�resources�typically�lacking�for�Latinos��Therefore,� large� numbers� of� Latinos� are� unlikely� to� be� able� to� enter� these� jobs� at� the� start�of�their�working�careers�or�even�to�access�them�by�learning�work�skills�on�the�job��With�the�shrinkage�of�the�manufacturing�sector�projected�to�continue,�access�to�good�jobs�will�increas-ingly�require�advanced�education�and�training��
In�the�years�ahead�the�personal�characteristics�of�hard�work,�adaptability,�and�opportunism�that�have�served�Latino�workers�well�in�obtaining�the�mainly�low-paying�jobs�they�currently�have�are�unlikely� to�be�as�effective� in�obtaining�good� jobs� in� the�new�economy��Without�a�concerted,�large-scale�effort�to�improve�opportunities�for�advanced�education�and�technical�training,� and� without� dramatically� better� outcomes� for� Latinos� in� this� regard,� the� growing�prosperity�that�Chicago-area�Latinos�enjoyed�during�the�1990s�will�not�be�easily�replicated�in�future�decades��Indeed,�income�trends�reported�above�for�the�years�since�2000�to�2003�suggest�that�it�has�not�been�replicated�during�the�current�decade��
Many of our young people
have a lot of potential, but
little education. It’s really
hard for these kids.
–�Joel,�a�Melrose�Park�resident��who�was�born�in�Mexico
“”

Page The State of Latino Chicago
C
��
Discussion and Policy DirectionsThe�Latino�population�of�metropolitan�Chicago�has�grown�tremendously�over�the�past�thirty�years�and�now�constitutes�20�percent�of�the�region’s�population��Most�of�this�growth�occurred�in�the�suburbs,�where�a�majority�of�Chicago-area�Latinos�now�live��Spurred�by�migration�and�natural�growth�in�an�exceptionally�young�population,�Latinos�are�now�the�largest�ethnic�or�ra-cial�minority�group�in�the�Chicago�area��More�than�six�in�ten�Latino�adults�are�immigrants,�but�84�percent�of�Latino�children�were�born�in�the�United�States��Overall,�two-thirds�of�Chicago-area�Latinos�are�citizens—55�percent�of�adults�and�nearly�90�percent�of�children�are�citizens��Were�it�not�for�growth�in�the�Latino�population�due�to�immigration�and�natural�population�increases,�metropolitan�Chicago�would�have�suffered�a�net�decrease�in�population��
In�recent�years�almost�all�of�the�increase�in�employment�and�much�of�the�increase�in�owner-occupied�homes�and�in�entrepreneurial�activity�has�been�attributable�to�Latinos��Latinos�have�registered� impressive�gains� in� income,�earnings,�and�homeownership,�especially�during�the�1990s��However,�since�2000�median�earnings�and�household�income�for�Latinos�have�declined�while�those�for�non-Latino�Whites�continued�to�increase��Latinos�have�become�stakeholders�in�metropolitan�Chicago,�and�now�Chicago�has�a�stake�in�ensuring�that�Latinos�succeed�in�be-coming�fully�incorporated�into�the�economic,�social,�and�political�life�of�the�region�in�the�years�ahead��This�process�can�be�facilitated�through�bold�and�imaginative�leadership�that�draws�on�the�strengths�of�this�community�while�recognizing�the�unique�challenges�it�faces�
The�Latino�community’s�strengths�are�an�asset�to�the�Chicago�region��Latinos�are�young,�hard�working,�and�tend�to�have�close-knit�families��They�are�entrepreneurial,�starting�many�small�businesses��To�a�great�extent,�they�represent�the�future�workforce:�One�in�five�Chicago�resi-dents�is�Latino,�and�children�account�for�a�much�greater�proportion—nearly�one�in�three—of�the�population�in�their�age�group��The�strength�of�Latino�families�helps�to�significantly�reduce�poverty�levels�in�the�population,�even�as�Latino�workers�occupy�the�lowest-wage�jobs��By�pool-ing�the�earnings�of�multiple�workers�within�families,�Latinos�achieve�a�higher�standard�of�liv-ing�than�would�otherwise�be�possible,�and�fewer�Latino�children�live�in�poverty��
But�Chicago-area�Latinos�also�face�serious�challenges��Besides�the�challenge�for�the�foreign�born�of�learning�English,�Latinos�on�average�have�less�formal�education�and�are�less�likely�to�have�health�insurance��Most�Latino�children�are�the�offspring�of�foreign-born�parents,�many�of�whom�have�limited�knowledge�of�English�and�little�formal�education��Many�foreign-born�parents�also�have�a�limited�understanding�of�how�local�institutions�work�and�few�social�ties�that� transcend� ethnic� boundaries� and� linguistic� barriers�� Together,� these� factors� can� make�it�difficult�for�parents�to�help�their�children�in�school�to�the�extent�that�they�would�like�and,�more�generally,�to�take�advantage�of�the�full�range�of�opportunities�for�advancement�that�the�Chicago�area�has�to�offer�
Immigrant�Latinos�exhibit�many�of�the�classic�characteristics�of�previous�immigrant�popula-tions�of�the�late�nineteenth�and�early�twentieth�centuries��Latino�immigrants�to�Chicago�typi-cally�arrive�as�young�adults��Their�work�ethic�compensates�for�limited�knowledge�of�English�and�limited�formal�education��However,�while�previous�generations�of�immigrants�could�get�ahead�with�little�more�than�hard�work�and�ambition,�this�formula�is�less�likely�to�produce�the�same�results�for�recent�Latino�immigrants�trying�to�make�their�way�in�the�current�knowledge-based�and�services-oriented�economy�of�the�area��To�get�ahead�in�this�economy�requires�a�higher�level�of�technical�skill�than�is�possible�to�acquire�through�on-the-job�training��Frequently�the�

This Is Home NowPage
C
��
training�opportunities,�like�the�jobs�themselves,�also�require�a�level�of�proficiency�in�English�that�few�immigrant�adults�could�easily�acquire�without�significant�assistance��
An�estimated�200,000�of�the�740,000�foreign-born�Latino�residents�of�metropolitan�Chicago�are�undocumented��An�unknown�number�of�the�children�of�undocumented�parents—prob-ably� in� the� tens�of� thousands—are�citizens�by�birth��The�undocumented� status�of� so�many�immigrants�represents�a�special�challenge�for�all��For�the�undocumented�themselves�their�lack�of�status�translates�into�severely�circumscribed�lives,� limiting�possibilities�for�advancement��This�condition�also�has�dire�consequences�for�their�children,�since�their�parents’�marginaliza-tion�often�hinders�involvement�in�their�schooling�and�can�affect�their�vision�of�the�possibilities�available�to�the�children�as�citizens�
Policy Directions Chicago’s� future� prosperity� depends� on� the� full� and� successful� incorporation� of� immigrant�Latinos�into�the�economic�and�social� life�of�the�region��For�this�to�occur�policies�should�be�designed�to�assist�Latinos�to�play�on�their�strengths�and�to�overcome�the�particular�challenges�facing�them�
Future�economic�policy�should�concentrate�on�business�creation,� including�technical�assis-tance�and�basic�financial�education,�to�help�ensure�the�long-term�success�of�entrepreneurial�activities��Also,�given�the�importance�of�homeownership�for�the�maintenance�and�creation�of�wealth,�policies�to�assist�even�more�families�to�acquire�homes�should�be�developed��
Another�issue�of�great�importance�to�the�future�of�Chicago�will�be�the�ability�of�Latinos�to�ad-vance�in�their�jobs�and�to�become�eligible�for�good�jobs��Policies�that�promote�adult�education�and�skills�acquisition�are�crucial�in�this�regard��The�educational�attainment�levels�of�Latino�im-migrants�are�exceptionally�low�relative�to�the�rest�of�the�Chicago-area�population��Most�com-pleted�their�formal�education�prior�arriving�in�the�United�States��Their�educational�needs�are�primarily�for�informal�instructional�programs�such�as�GED�preparation,�English�classes,�and�job�training�programs��While�these�services�are�currently�provided�by�many�fine�community-based�organizations�serving�Latinos,�the�need�for�such�programs�far�outstrips�the�supply��
Health�insurance�is�a�very�large�concern��US-born�Latinos�are�significantly�less�likely�to�be�in-sured�than�non-Latino�Blacks�or�Whites��Foreign-born�Latinos�are�much�less�likely�still�to�be�covered�by�a�health�insurance�plan,�and�least�likely�to�be�covered�are�the�approximately�70,000�foreign-born�Latino�children�in�metropolitan�Chicago��
Currently,�the�Latino�population�is�very�young�and�relatively�healthy��As�Latinos�grow�older,�their�lack�of�insurance�will�make�it�more�likely�that�treatable�medical�conditions�will�be�left�untreated�or�that�family�financial�insolvency�will�be�the�price�to�be�paid�when�medical�care�is�
We want the neighborhood to get better
for people. We’re committed to making
it better for our parents and our future.”
–�Victoria,�a�city�employee�who�lives�in�Pilsen
“ ”

Page The State of Latino Chicago
C
��
required��Latinos’�high�uninsurance�rate�will�also�increase�financial�strains�on�the�healthcare�system��Perhaps�most�importantly,�the�future�largely�depends�on�the�extent�to�which�Latino�children,�the�great�majority�of�whom�are�US-born�citizens,�develop�the�competencies,�skills,�and�sensibilities�needed�to�assume�positions�of�responsibility�and�leadership�in�their�commu-nities,�in�the�workforce�and�in�all�arenas�of�civic�life��The�future�not�only�of�Latinos�but�of�the�region�itself�depends�on�improving�young�people’s�access�to�opportunities�and�resources�and,�ultimately,�on�improved�achievement�in�schools��Thus,�a�high�priority�should�be�the�creation�of�a�program�of�applied�research�specifically�examining�the�educational�needs�of�Latino�stu-dents�and�families�and�how�best�to�meet�them��The�research�should�begin�by�examining�the�ef-fectiveness�for�Latinos�of�promising�strategies�already�being�implemented�in�Chicago,�as�well�as�strategies�to�more�effectively�engage�Latino�students�in�school�and�engage�schools�in�Latino�communities�� The� viability� of� strategies� to� enable� more� Latino� students� to� attend� Catholic�schools�should�also�be�examined��Finally,�increased�support�is�needed�to�assist�those�respon-sible� for� the� nurturing,� development,� and� education� of� the� next� generation� of� Chicagoans��United� in� this� goal,� the� public� sector,� along� with� churches,� community� organizations,� and�philanthropists,�should�redouble�their�efforts�to:�
•� help� parents� in� their� task� of� facilitating� the� healthy� growth� and� development� of� their��children�in�the�first�years;�
•� make�Head�Start�and�other�quality�pre-school�programs�more�widely�available;�
•� increase�the�capacity�of�elementary�schools,�in�collaboration�with�the�families�and�commu-nities�they�serve,�to�accelerate�Latino�children’s�learning�and�achievement—especially�for�English�language�learners�and�those�from�low�income�families;
•� enhance�the�ability�of�high�schools�to�provide�healthy,�engaging�environments�that�moti-vate�students�to�stay�in�school�through�graduation�and�beyond;�and
•� increase� the� enrollment� and� retention� of� Latino� students� in� colleges� and� in� other� post-secondary�educational�programs��
The� influence�of�Latinos�on� the�economic,�civic,�and�cultural� life�of�metropolitan�Chicago� is�already�enormous�and�will�become�much�larger�still�when�the�current�generation�of�children�begins�to�make�its�mark�in�the�next�few�years��Strong,�principled,�and�factually�informed�leader-ship�can�help�to�ensure�that�Chicago-area�Latinos�continue�to�prosper�and�contribute�fully�to�the�future�vitality�of�metropolitan�Chicago��We�hope�that�the�information�presented�in�this�report�spurs�dialogue�on�these�issues�and�will�help�efforts�directed�towards�a�better�future�for�all��

This Is Home NowPage
C
��
ReferencesACS�(American�Community�Survey)��2003,�2004� US�Census�Bureau��www�census�gov/acs/www��
AHS�(American�Housing�Survey)��2003� US�Census�Bureau��www�census�gov/hhes/www/housing/ahs/ahs�html�
Bryk,�Anthony�S��2002��Trust in Schools: A Core Resource for Improvement��New�York:��Russell�Sage�Foundation�
Bryk,�Anthony�S�,�Valerie�E��Lee,�and�Peter�B��Holland��1993��Catholic Schools and the Common Good.�Cambridge,�MA:�Harvard�University�Press�
Census��1990,�1997,�2000,�2002,�2003,�2004��US�Census�Bureau��www�census�gov�
______��Hispanic Population Passes 40 Million,�Census Bureau Reports,�http://www�census�gov/Press-Release/www/releases/archives/population/005164�html�
Central�Intelligence�Agency��2005��World Fact Book. www�cia�gov/cia/publications/factbook�
Chicago�Fact�Finder��www�nd�edu~chifacts��Census�Data�1990�and�2000��Institute�for�Latino�Studies,�University�of�Notre�Dame��
Chicago�Metropolis�2020��The 2002 Metropolis Index��www�chicagometropolis2020�org��
Chicago�Urban�League��1994��The Changing Economic Standing of Minorities and Women in the Chicago Metropolitan Area 1970–1990, Final Report.�Latino�Institute,�Northern�Illinois�University��
_____��2004��Working Poor Families in Chicago and the Chicago Metropolitan Area: A Statistical Profile Based on the 1990 and 2000 Censuses. Northern�Illinois�University��and�Roosevelt�University�
Chun,�Sung��2005��“Latino-Origin�Populations�Revisited:�Estimating�the�Latino�Origin�Group�Populations�at�the�National�Level�and�for�Selected�States,�Counties,�Cities,�and�Metro�Chicago�”�Institute�for�Latino�Studies�Research�Report�2005�1,�University�of�Notre�Dame��www�nd�edu/~latino/research/pubs/2005�1SungChun�pdf�
CPS�(Current�Population�Survey)��2002,�2003,�2004���www�census�gov/hhes/www/cpstc/cps_table_creator�html�
De�la�Torre,�Adela,�Lorena�Garcia,�Jessica�Nuñez�de�Ybarra,�and�Marisol�Cortez��2005��“Hispanic�Access�to�Health�Services:�Identifying�Best�Practices�for�Eligibility�to�Medicare�and�SCHIP�Programs�”�Institute�for�Latino�Studies,�University�of�Notre�Dame���www�nd�edu/~latino/research/pubs/Draft_Hispanicaccess_health�pdf�
Education�Trust��2004��Education Watch, Illinois: Key Education Facts and Figures��Washington,�DC:�The�Education�Trust��www2�edtrust�org/edtrust/summaries2004/Illinois�pdf�
Home Mortgage Disclosure Act. 2003��Federal�Financial�Institutions�Examination�Council��www�ffiec�gov/hmda/about�htm�

Page The State of Latino Chicago
C
��
Human�Relations�Foundation/Jane�Addams�Policy�Initiative��2003��Minding the Gap: An Assessment of Racial Disparity in Metropolitan Chicago. In�collaboration�with�the��Center�for�Urban�Research�and�Learning,�Loyola�University�Chicago,�November�
Illinois�Coalition�for�Immigrant�and�Refugee�Rights��2003–04��Illinois is Home: Statewide Survey of Immigrants and Refugees 2003–2004. www�icirr�org��
Institute�for�Latino�Studies��2002��Bordering the Mainstream: A Needs Assessment of Latinos in Berwyn and Cicero, Illinois. University�of�Notre�Dame�
______��2005��Measuring the Minority Achievement Gap.�University�of�Notre�Dame�
______��Forthcoming��Chicago�Area�Survey�reports�
ISBE�(Illinois�State�Board�of�Education)��2003–04� High School Dropout Rates by Grade, Level, Gender, and Racial/Ethnic Category.
______��2004a��Illinois Bilingual Education Programs: 2004 Evaluation Report����www�isbe�net/bilingual/pdfs/2004_bilingual_report�pdf�
______��2004b��Illinois State Board of Education Data Analysis and Progress Reporting.�
______��2004c��State Report Card��http://www�isbe�state�il�us�
______�2004d��Illinois Pre-Kindergarten Program for Children at Risk of Academic Failure. FY 2003 Evaluation Report. www�isbe�net/research/pdfs/prek_evaluation�pdf�
Koval,�John��2004��“In�Search�of�Economic�Parity:�The�Mexican�Labor�Force�in�Chicago�”�Institute�for�Latino�Studies�Research�Report�2004�1,�University�of�Notre�Dame���www�nd�edu/~latino/research/pubs/Koval�FINAL�pdf�
Lee,�Valerie�E��2002��Inequality at the Starting Gate: Social Background Differences in Achievement as Children Begin School��Washington,�DC:�Economic�Policy�Institute�
Lloyd,�Kim,�Marta�Tienda,�and�Anna�Zajacova��2002��“Trends�in�Educational�Achievement�of�Minority�Students�since�Brown�v��Board�of�Education�”�In�National�Research�Council,�Achieving High Educational Standards for All,�Timothy�Ready,�Christopher�Edley,�Jr�,�and�Catherine�E��Snow,�eds��Washington,�DC:�National�Academies�Press�
Lukehart,�John,�Tom�Luce,�and�Jason�Reece��2005��The Segregation of Opportunities: The Structure of Advantage and Disadvantage in the Chicago Region.�Chicago:�Leadership�Council�for�Metropolitan�Open�Communities�
McConnell,�Eileen�Diaz��2005��“No�Place�Like�Home:�The�State�of�Hispanic�Housing�in�Chicago,�Los�Angeles,�and�New�York�City,�2003�”�Research�Report,�Department�of�Sociology�and�Latina/Latino�Studies,�University�of�Illinois,�and�Institute�for�Latino�Studies,�University�of�Notre�Dame��
McConnell,�Eileen�Diaz,�and�Timothy�Ready��2005��The Roof Over Our Heads: Hispanic Housing in the United States.�Esperanza�USA�and�Institute�for�Latino�Studies,�University��of�Notre�Dame�

This Is Home NowPage
C
��
Mehta,�C�,�N��Theodore,�I��Mora,�and�J��Wade��2002��Chicago’s Undocumented Immigrants: An Analysis of Wages, Working Conditions and Economic Contributions��University�of�Illinois�at�Chicago,�Center�for�Urban�and�Economic�Development��
Miller,�L��Scott��1995��An American Imperative: Accelerating Minority Educational Achievement.�New�Haven:�Yale�University�Press�
Moll,�Luis,�J��Tapia,�and�K��F��Whitmore��1993��Living�Knowledge:�The�Social�Distribution�of�Cultural�Sources�for�Thinking��In�G��Soloman,�ed�,�Distributed Cognitions, 139–63.�Cambridge,�UK:�Cambridge�University�Press�
National�Research�Council��2000��From Neurons to Neighborhoods: The Science of Early Childhood Development��Jack�P��Shonkoff�and�Deborah�P��Phillips,�editors��Washington,�DC:�National�Research�Council�
______��2001��Eager to Learn: Educating Our Preschoolers.�Washington,�DC:�National�Academies�Press�
______�2004��Engaging Schools: Fostering High School Students’ Motivation to Learn��Washington,�DC:�National�Academies�Press�
Northeastern�Illinois�Planning�Commission��2004��Population, Household, and Employment Forecasts for Northeastern Illinois 2000 to 2030 (Executive Summary).��www�nipc�org/2030_forecast_endorsed_093003�htm�
Paral,�R�,�and�M��Norkewicz��2003��The Metro Chicago Immigration Fact Book. Institute�for�Metropolitan�Affairs��Roosevelt�University��
Paral,�Rob,�Timothy�Ready,�Sung�Chun,�and�Wei�Sun��2004��“Latino�Demographic�Growth�in�Metropolitan�Chicago�”�Institute�for�Latino�Studies�Research�Report�2004�2,�University�of�Notre�Dame��www�nd�edu/~latino/research/pubs/paral�pdf�
Passel,�Jeffrey�S��2005a��Estimates of the Size and Characteristics of the Undocumented Population.�Washington,�DC:�Pew�Hispanic�Center��www�pewhispanic�org�
______��2005b��Rise, Peak and Decline: Trends in US Immigration, 1992–2004.�Washington,�DC:�Pew�Hispanic�Center��www�prehispanic�org�
Pew�Hispanic�Center��2004��The�2004�National�Survey�of�Latinos:�Politics�and�Political�Participation��www�pewhispanic�org/reports/report�php?ReportID=33�
______��2005� Trends 2005: Hispanics, A People in Motion��www�pewhispanic�org��
Ready,�Timothy��2005��The Educational Pipeline of Chicago Area Latinos, 2000���www�nd�edu/~chifacts/chi_comm�html#pubs
Singer,�A��2004��The Rise of New Immigrant Gateways. Living�Cities�Census�Series,�February,�The�Brookings�Institution��www�brookings�edu/metro/publications/20040301_gateways�htm�
Sum�A�,�I��Khatiwada,�and�I��Tobar��2004��Lost in the Wilderness: The Deteriorating Labor Market for Teens and Young Adults in Illinois, 2000–2004��Prepared�for�the�Chicago�Alternative�Schools�Network,�Chicago,�Illinois��

Page The State of Latino Chicago
C
�0
Stuart,�G��2002��Integration or Resegregation: Metropolitan Chicago at the Turn of the New Century. Kennedy�School�of�Government,�Harvard�University�for�The�Civil�Rights�Project��at�Harvard�University���www�civilrightsproject�harvard�edu/research/metro/Chicago%20Study4�pdf�
Swanson,�C��2004��Who Graduates? Who Doesn’t? A Statistical Portrait of Public High School Graduation, Class of 2001. Education�Policy�Center,�The�Urban�Institute,��www�urban�org/url�cfm?ID=410934��
Swanson,�T�,�C��Casey,�R��Flack,�and�P��Dreier��2004��Pulling Apart: Economic Segregation among Suburbs and Central Cities in Major Metropolitan Areas.��Living�Cities�Census�Series,�October��The�Brookings�Institution�� �www�brookings�edu/metro/pubs/20041018_econsegregation�htm�
Turner,�Margery�Austin,�Stephen�L��Ross,�George�C��Galster,�and�John�Yinger��2002��Discrimination in Metropolitan Housing Markets: National Results from Phase I HDS 2000. Final Report.�Washington,�DC:�The�Urban�Institute���www�urban�org/UploadedPDF/410821_Phase1_Report�pdf�
Zurita,�Martha��2003��“Latino�Population�in�Illinois�and�Metropolitan�Chicago:�Young�and�Growing�Fast�”�Institute�for�Latino�Studies�Latino�Research�@�ND�Vol��1,�No��1,�University��of�Notre�Dame��http://www�nd�edu/~latino/research/pubs/LatinoResearch1�pdf�